research article lactation curve pattern and prediction of...
TRANSCRIPT
Research ArticleLactation Curve Pattern and Prediction of Milk ProductionPerformance in Crossbred Cows
Suresh Jingar,1,2 R. K. Mehla,1 Mahendra Singh,1 and A. K. Roy1
1 National Dairy Research Institute, Karnal 132 001, India2 KVK, Chittorgarh, Rajasthan 312001, India
Correspondence should be addressed to Mahendra Singh; [email protected]
Received 29 May 2014; Accepted 24 June 2014; Published 13 July 2014
Academic Editor: Masanori Tohno
Copyright © 2014 Suresh Jingar et al. This is an open access article distributed under the Creative Commons Attribution License,which permits unrestricted use, distribution, and reproduction in any medium, provided the original work is properly cited.
Data pertaining to 11728 test-day daily milk yields of normal and mastitis Karan Fries cows were collected from the institute herdand divided as mastitis and nonmastitis and parity-wise.The data of lactation curves of the normal andmastitis crossbred cows wasanalyzed using gamma type function. FTDMY in normal and mastitis cows showed an increasing trend from TD-1 to TD-4 anda gradual decrease (𝑃 < 0.01) thereafter until the end of lactation (TD-21) in different parities. The FTDMY was maximum (peakyield) in the fourth parity. Parity-wise lactation curve revealed a decrease in persistency, steeper decline in descending slope (c),and steeper increase in ascending slope (b) from 1st to 5th and above parity.The higher coefficient of determination (𝑅2) and lowerroot mean square error (RMSE) indicated goodness and accuracy of the model for the prediction of milk prediction performanceunder field conditions. Clinical mastitis resulted in a significantly higher loss of milk yield (𝑃 < 0.05). The FTDMY was maximum(𝑃 < 0.05) in the fourth parity in comparison to the rest of parity. It is demonstrated that gamma type function can give the best fitlactation curve in normal and mastitis infected crossbred cows.
1. Introduction
Lactation curve provides valuable information about thepattern of milk production during lactation. It also depictssummary of the pattern of milk yield determined by thebiological efficiency of the cow [1]. The cost of milk pro-duction depends to a large extent on the persistency oflactation, that is, the rate of decline in production after peakmilk yield. High persistency is associated with a slow rateof decline in milk production, whereas low persistency isassociated with a rapid rate of decline in milk yield. Ingeneral declining rate of milk production is about 7% permonth after the peak yield [2]. Estimates of heritabilitiesfor milk yield and persistency traits in HF cows have beenreported [3, 4]. The lactation curve models have been usedto predict the milk yield at any point of the lactation [5,6]. This property of the model can prove beneficial in caseof incomplete lactation records. Various models have beentried by different researchers to fit the lactation curve inindigenous as well as exotic cattle [7–10]. Further gettingthe test-day milk yield information from the field condi-tions is not easy and there is every chance of missing the
data due to certain inevitable circumstances. In such casemathematical models may prove beneficial for predictionof milk production performance using. In view of thisthe lactation curve was composed for the normal vis-a-vismastitis cows using gamma type function during differentparity to find out the accuracy ofmodel in predicting themilkyield with minimum error in normal and mastitis crossbredcows.
2. Materials and Methods
The data on 11728 fortnightly test-day milk yields (FTDMYs)of 733 Karan Fries cows for a period of 12 years (2000–2011)was collected from livestock farm of National Dairy ResearchInstitute, Karnal, India.The climate of the farm is subtropicalin nature with the lowest temperature reaching 2∘C duringwinter and the highest temperature up to 45∘C in the summermonths. The annual rainfall is about 760 to 960mm, out ofwhich most of the rainfall is received during the months ofJuly and August. The relative humidity ranges from 41% to85%. The amount of milk recorded in 24-hour duration on
Hindawi Publishing CorporationJournal of Veterinary MedicineVolume 2014, Article ID 814768, 6 pageshttp://dx.doi.org/10.1155/2014/814768

2 Journal of Veterinary Medicine
0
2
4
6
8
10
12
14
16
5 35 65 95 125 155 185 215 245 275 305
Test-
day
milk
yie
ld (k
g)
Days in milk
Normal predicted Normal actualMastitis predicted Mastitis actual
Figure 1: Comparison of the actual and predicted FTDMY ofnormal and mastitic Karan Fries cows in the first lactation.
any particular day is called the test-day (TD) milk yield andis expressed in kilograms. The fortnightly test-day intervalsof 15 days were considered starting from days 5, 20, 35, 50,65, 80, 95, 110, 125, 140, 155, 170, 185, 200, 215, 230, 245, 260,275, 290, and 305 of lactation. Twenty-one (21) fortnightlytest-day milk yield (FTDMY) records were considered perlactation (from the 6th to the 305th day of lactation). Thedata was grouped as mastitis (cows suffering from clinicalmastitis) and nonmastitis (normal cows). Statistical analysisof data was carried out using gamma type function [11] withthe following equation:
𝑌𝑡= 𝑎𝑡𝑏𝑒−𝑐𝑡, (1)
where 𝑌𝑡is the average daily yield in the 𝑡th fortnight, 𝑎 is
the initial milk yield after calving, 𝑏 is the ascending slopeparameter up to the peak yield, and 𝑐 is the descending slopeparameter.
The constants were derived by solving the above equationafter transformation on the log scale:
ln (𝑌𝑡) = ln (𝑎) + 𝑏 ln (𝑡) − 𝑐𝑡. (2)
The milk yield up to week “𝑡” is given by 𝑌𝑡=
𝑎∫0→1𝑡𝑏 exp(−𝑐𝑡)𝑑𝑡.
3. Results
The fortnightly test-day milk yield was less in TD-1 (9.78 ±0.29 kg/d) and increased (𝑃 < 0.01) gradually to attain peakin TD-3 and TD-4 (14.34 ± 0.38 and 14.48 ± 0.37 kg/d)in normal cows; however, in mastitis cows, the peak milkyield was attained in TD-3 (13.15 ± 0.37Kg/d) and wasmaintained only for this period (Figure 1). The cows ofboth of the groups exhibited a steady decline (𝑃 < 0.01)in milk yield with increase in fortnights of lactation. Ingeneral the fortnightly test-day milk yield increased till TD-3 and declined steadily with advancement of lactation. Inthe second parity the FTDMY showed an increasing trend
Test-
day
milk
yie
ld (k
g)
02468
101214161820
5 20 35 50 65 80 95 110
125
140
155
170
185
200
215
230
245
260
275
290
305
Days in milk
Normal predicted Normal actualMastitis predicted Mastitis actual
Figure 2: Comparison of the actual and predicted FTDMY ofnormal and mastitic Karan Fries cows in the second lactation.
Test-
day
milk
yie
ld (k
g)
02468
101214161820
5 20 35 50 65 80 95 110
125
140
155
170
185
200
215
230
245
260
275
290
305
Days in milkNormal predictedNormal actual
Mastitis predictedMastitis actual
Figure 3: Comparison of the actual and predicted FTDMY ofnormal and mastitic Karan Fries cows in the third lactation.
from TD-1 to TD-4 and decreased thereafter gradually inboth of the groups. A minimum FTDMY of 11.31± 0.39 kg/dand 9.18 ± 0.44 kg/d and a maximum FTDMY of 17.19 ±0.44 kg/d and 15.53 ± 0.46 kg/d were observed on TD-4 inboth of the groups (Figure 2).Theminimum FTDMY rangedfrom 11.25 ± 0.46 kg/d to 9.55 ± 0.47 kg/d in TD-21 and themaximum FTDMY of 19.08±0.53 kg/d and 16.44±0.47 kg/dwas observed in TD-4 in normal and mastitis KF cows.However an increase in FTDMY was observed from 14.36 kgand 12.34 kg in TD-1 to a peak yield of 20.50 ± 0.59 kg/d inTD-4 and 17.63 kg/d in TD-3 which subsequently declined(𝑃 < 0.05) to 10.50 ± 0.54 kg/d and 9.54 ± 0.54 kg/d in TD-21 in normal and mastitis KF cows (Figure 3). The FTDMYmilk yield in the 4th parity was maximum in comparison tothe first, second, and third parity in both normal andmastitiscows (Figure 4, Table 2). An increase in milk productionwas observed up to the 4th fortnight and milk productionsdecreased (𝑃 < 0.01) during the 5th parity in normal cows.In mastitis cows increase in milk yield was noticed duringthe first three fortnights and milk production decreasedsubsequently (𝑃 < 0.05) until the end of lactation (Figure 5).
Journal of Veterinary Medicine 3
Table 1: Parity-wise lactation curve parameters (gamma type function) for prediction of fortnightly test-day milk yield (kg) in Karan Friescrossbred cows.
Karan Fries cows
Parameters 1st parity 2nd parity 3rd parity 4th parity 5th and above parityNormalcows
Mastitiscows
Normalcows
Mastitiscows
Normalcows
Mastitiscows
Normalcows
Mastitiscows
Normalcows
Mastitiscows
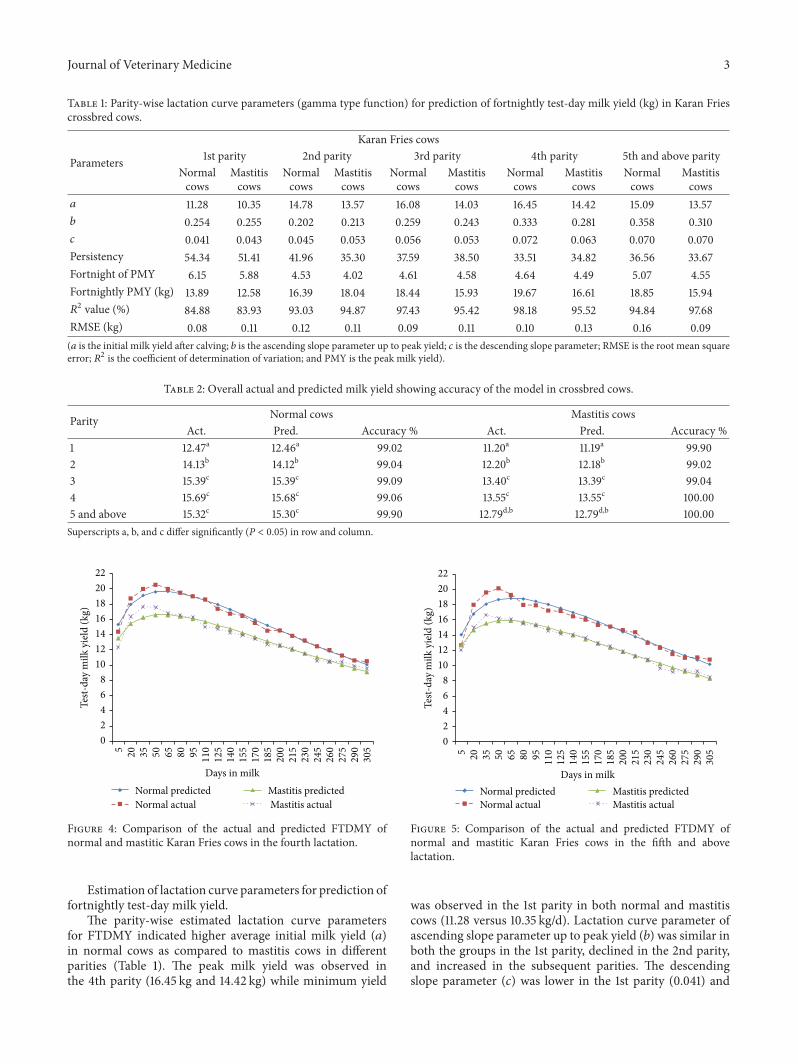
𝑎 11.28 10.35 14.78 13.57 16.08 14.03 16.45 14.42 15.09 13.57𝑏 0.254 0.255 0.202 0.213 0.259 0.243 0.333 0.281 0.358 0.310𝑐 0.041 0.043 0.045 0.053 0.056 0.053 0.072 0.063 0.070 0.070Persistency 54.34 51.41 41.96 35.30 37.59 38.50 33.51 34.82 36.56 33.67Fortnight of PMY 6.15 5.88 4.53 4.02 4.61 4.58 4.64 4.49 5.07 4.55Fortnightly PMY (kg) 13.89 12.58 16.39 18.04 18.44 15.93 19.67 16.61 18.85 15.94𝑅2 value (%) 84.88 83.93 93.03 94.87 97.43 95.42 98.18 95.52 94.84 97.68RMSE (kg) 0.08 0.11 0.12 0.11 0.09 0.11 0.10 0.13 0.16 0.09(𝑎 is the initial milk yield after calving; 𝑏 is the ascending slope parameter up to peak yield; 𝑐 is the descending slope parameter; RMSE is the root mean squareerror; 𝑅2 is the coefficient of determination of variation; and PMY is the peak milk yield).
Table 2: Overall actual and predicted milk yield showing accuracy of the model in crossbred cows.
Parity Normal cows Mastitis cowsAct. Pred. Accuracy % Act. Pred. Accuracy %
1 12.47a 12.46a 99.02 11.20a 11.19a 99.902 14.13b 14.12b 99.04 12.20b 12.18b 99.023 15.39c 15.39c 99.09 13.40c 13.39c 99.044 15.69c 15.68c 99.06 13.55c 13.55c 100.005 and above 15.32c 15.30c 99.90 12.79d,b 12.79d,b 100.00Superscripts a, b, and c differ significantly (P < 0.05) in row and column.
Test-
day
milk
yie
ld (k
g)
5 20 35 50 65 80 95 110
125
140
155
170
185
200
215
230
245
260
275
290
305
Days in milk
02468
10121416182022
Normal predictedNormal actual
Mastitis predicted Mastitis actual
Figure 4: Comparison of the actual and predicted FTDMY ofnormal and mastitic Karan Fries cows in the fourth lactation.
Estimation of lactation curve parameters for prediction offortnightly test-day milk yield.
The parity-wise estimated lactation curve parametersfor FTDMY indicated higher average initial milk yield (𝑎)in normal cows as compared to mastitis cows in differentparities (Table 1). The peak milk yield was observed inthe 4th parity (16.45 kg and 14.42 kg) while minimum yield
Test-
day
milk
yie
ld (k
g)
5 20 35 50 65 80 95 110
125
140
155
170
185
200
215
230
245
260
275
290
305
Days in milkNormal predictedNormal actual
Mastitis predictedMastitis actual
02468
10121416182022
Figure 5: Comparison of the actual and predicted FTDMY ofnormal and mastitic Karan Fries cows in the fifth and abovelactation.
was observed in the 1st parity in both normal and mastitiscows (11.28 versus 10.35 kg/d). Lactation curve parameter ofascending slope parameter up to peak yield (𝑏) was similar inboth the groups in the 1st parity, declined in the 2nd parity,and increased in the subsequent parities. The descendingslope parameter (𝑐) was lower in the 1st parity (0.041) and

4 Journal of Veterinary Medicine
higher in the 4th parity (0.072) in normal cows, but, inmastitis cows, it was minimum in the 1st parity (0.043) andmaximum in the 5th and above parity (0.070). Further higherpersistency of lactation was observed in the 1st parity (54.34and 51.40) which declined till the 5th and above parity in allof the cows. The fortnights of peak milk yield ranged fromaveragely 4.53 to 6.15 fortnights in normal cows and from4.49to 5.88 fortnights in mastitis cows.The cows in the first paritytookmore time (fortnight) to attain peak yield in comparisonto subsequent parity; however, peak milk yield increased(𝑃 < 0.05) with increase in number of parity in both ofthe groups. The peak yield was minimum in the 1st parity(13.89 kg/d and 12.58 kg/d) and maximum in the 4th parity(19.67 kg/d and 16.61 kg/d) in normal and mastitis cows. Thecoefficient of determination of variation (𝑅2) ranged from84.88% to 98.18% in normal cows and from 83.93% to 97.68%in mastitis cows during different parities. The RMSE valuewas minimum in the 3rd parity (0.09 kg) and maximum inthe 5th and above parity (0.16 kg) in normal cows; however,in mastitis cows RMSE was minimum in the 5th and aboveparity (0.09) and maximum in the 4th parity (0.13 kg).
4. Discussion
The pattern of change in the FTDMY observed in thisstudy was in agreement with the earlier reports in normalcattle and buffaloes [12–17]. However comparable literatureon fortnightly test-day milk yield (FTDMY) and fortnightlyaverage daily milk yield (FADMY) in mastitis crossbred KFcows is scanty. The peak milk yield attained during the 3rdand 4th fortnights in both of the groups corroborates withthe values reported earlier in cows [10, 18, 19]. The trendin FTDMY in both of the groups suggested that peak yieldduration is not affected by incidence of mastitis in spiteof significant decline in milk yield (𝑃 < 0.01). The lowerinitial milk yield (𝑎) in the first parity and an increasingtrend in subsequent parity have also been reported in normalKF cows [10] and Butana dairy cows [20]. Many researchfindings indicated an increase in initial milk yield value withincrease of parity order and the highest initial milk yieldreaches the 5th lactation in Friesian and Ayrshire crossbredand KF cows [21–25]; however, such trend was evidentup to the 4th parity in this study. The lower initial yield,peak milk yield, and greater persistency in the first paritythan the subsequent parity in KF cows as observed in thisstudy corroborate earlier reports [6, 26–31]. This is expectedbecause lactation curves of the first parity are characterizedby a less peak milk production and a greater persistency inruminants [11, 20, 24]. The decline in persistency of lactationwith increase in parity order is attributed to age factor asolder animals start their lactation at a higher level and hada rapid rate of decline in milk production due to regressionof alveolar cells with advancement in age. Further, first-calving animals have less body weight and maturation ofmammary tissue is still active, which counterbalances declinein milk production [32]. During the first lactation, animalencounters unfamiliar situations, including the atmosphereof the milking parlor, presence of dairy farmer, and the
milking procedures [24]. Thus variation in the initial milkyield in different parities could be due to addition of morenumber of alveolar cells (secretory cells) at each successivepregnancy which reach their maximumnumbers at about the5th calving and diminish gradually thereafter [33].
The value of ascending slope parameter up to peak yield(𝑏) in the present study was lower than reported earlier indifferent parity of Friesian and Ayrshire crossbred cows dueto difference in milk yield of cows, management practicesfollowed in a farm, and breed difference [33]. The similarpattern of increase in constant “𝑏”with advancement of parityin both of the groups was also reported in Butana dairycows [23], HF cows [34], and crossbred cows [35]. However,value of parameter “𝑏” was lower than the reported valuesin HF, KF, and Sahiwal cows [10, 21, 36] than the value ofparameter “𝑏” observed in our study. The higher descendingslope parameter (𝑐) observed in this study was in agreementwith the findings of previous reports [33, 35] in crossbredcows and was lower than reported values in Sahiwal cows[36] andHolstein cows [21].Themore flat shape of parameter“𝑐” in the first parity than the rest of the parities indicatedbetter utilization of feeds and less susceptibility of cows tometabolic and reproductive disorders [37]. The marginaldifferences in parameters “𝑎,” “𝑏,” and “𝑐” in mastitis cowsrather than the normal ones were due to disturbed milksecretion and apoptosis of mammary secretory cells that issolely responsible for the decline in milk yield after peaklactation [38, 39]. It has been found that turn of lactationcurve was unimportant on the level of persistency of lactationin Brown Swiss cows [40]. Further occurrence of atypicalshapes of lactation curve characterized by the absence ofthe lactation peak varied from 25 to 42% [41]. Previousreport also supports the fact that peak yield is lower inthe first parity and increases in subsequent parity [33]. Thelower initial and peak milk yield in the first parity andmore time to attain peak yield in the first parity than theremaining parities were in agreement with previous reportsin Norwegian mastitis cows [25, 33]. It has been found thatHolstein x Zebu cows require 71 days to reach peak yield,which was less than the predicted 6.15 fortnights observedin crossbred cows [42]. However, predicted fortnightly peakmilk yield was nonsignificantly different in both mastitisand normal cows (5.88 versus 6.15 kg/d). Further moderateto high heritability estimates for different lactation curveshape parameters suggest that these traits can be includedin selection schemes [43]. It has been reported that themilk secretory tissue requires more time for peak activityin primiparous cows than multiparous cows due to reducedudder size, less digestive capacity, and directs partitioning ofnutrients [24, 41]. The high persistency is associated with aslow rate of decline in milk yield after peak production, whilelow persistency is associated with a rapid rate of decline inmilk yield due to less feed intake [44]. Further persistentlactations are characterized by lower peak yield [37] andreduced metabolic stress in early lactation [45]. The highscore of goodness of fit (𝑅2 value) of gamma type functioncorroborates the earlier reports in cows [10, 19, 21, 22, 36].Thegamma function has been reported as the best model becauseof the small error variance and high determination coefficient
Journal of Veterinary Medicine 5
[4]. From gamma function, approximately one third (31.28%percent) of lactation curves were named atypical. Atypicalcurve percentages were found as follows: 44.19% downhill,45.08% concave, 7.32% LnA negative, and 3.39% C negative.Further first lactation goodness of fit in normal and mastitiscows indicated more fitness of the model in KF crossbredcows as evident from low RMSE value. The latter confirmsaccuracy of gamma function model to predict milk yield ofmastitis cows also [11, 46]. The similar value of 𝑅2 in normaland mastitis cows further indicated accuracy of model level[31].The similar RMSE values inmastitis and normalKF cowsduring different parities also support this fact.
5. Conclusion
The lactation curve parameters for fortnightly test-day milkyield exhibited similar trend in normal and mastitis infectedcows by attaining peak milk yield in the 3rd and 4th TDfollowed by a gradual decline in milk yield till the end oflactation. The steeper decline in descending slope (𝑐) andincrease in initial FTDMY due to steeper rise in ascendingslope from the 1st parity onwards could be used as amarker ofpersistency during different parities in cows. Further, higher𝑅2 and lower RMSE confirm the validity of gamma type
function in predicting the milk yields in cows suffering frommastitis.
Conflict of Interests
The authors declare that there is no conflict of interestsregarding the publication of this paper.
Acknowledgments
The authors are thankful to Director, N.D.R.I., Karnal, andThe Head, Dairy Cattle Breeding Division, NDRI, Karnal,for providing the necessary facilities for the study. The helprendered by the Livestock Record Unit in providing the datafor data analysis is greatly acknowledged.
References
[1] T. A. Scott, B. Yandell, L. Zepeda, R. D. Shaver, and R. T. R.Smith, “Use of Lactation curves for analysis of milk productiondata,” Journal of Dairy Science, vol. 79, no. 10, pp. 1885–1894,1996.
[2] D. Val-Arreola, E. Kebreab, J. Dijkstra, and J. France, “Study ofthe lactation curve in dairy cattle on farms in central Mexico,”Journal of Dairy Science, vol. 87, no. 11, pp. 3789–3799, 2004.
[3] A. Kaygısız, G. Bakır, and S. M. Yener, “Estimates of phenotypicand genetic parameters of lactation persistency in Holsteincows,” Journal of Veterinary and Animal Sciences, vol. 19, no. 4,pp. 259–263, 1995 (Turkish).
[4] H. Orhan and A. Kaygisiz, “Comparison of different lactationcurvemodels for Holstein cattle,”Hayvansal Uretim, vol. 43, no.1, pp. 94–99, 2002.
[5] L. Perochon, J. B. Coulon, and F. Lescourret, “Modellinglactation curves of dairy cows with emphasis on individualvariability,” Animal Science, vol. 63, no. 2, pp. 189–200, 1996.
[6] N. Macciotta, D. Vicario, and A. Cappio-Borlino, “Detection ofdifferent shapes of lactation curve for milk yield in dairy cattleby empirical mathematical models,” Journal of Dairy Science,vol. 88, no. 3, pp. 1178–1191, 2005.
[7] G. C. Gahlot, R. S. Gahlot, and L. K. Jairath, “Pattern of lactationcurve in Rathi cattle,” Indian Journal of Animal Science, vol. 58,no. 9, pp. 1112–1114, 1998.
[8] S. Cilek and I. Keskin, “Comparison of six different mathemat-ical models to the lactation curve of simmental cows reared inKazova state farm,” Journal of Animal and Veterinary Advances,vol. 7, no. 10, pp. 1316–1319, 2008.
[9] Z. Guo and H. H. Swalve, “Modelling of the lactation curve as asub-model in the evaluation of test day records,” in Proceedingsof Interbull Meeting, Prague, No. 11, Interbull Bulletin, Uppsala,Sweden, 1995.
[10] B. Rashia, Genetic evaluation of lactation curve in Karan Friescattle [Ph.D. thesis], NDRI Deemed University, Karnal, India,2010.
[11] P. D. P.Wood, “Factors affecting the shape of the lactation curvein cattle,” Journal of Animal Production, vol. 11, pp. 307–331, 1967.
[12] E. D. Ilatsia, T. K. Muasya, W. B. Muhuyi, and A. K. Khai,“Genetic and phenotypic parameters and annual trends formilkproduction and fertility traits of the Sahiwal cattle in semi aridKenya,” Tropical Animal Health and Production, vol. 39, no. 1,pp. 37–48, 2007.
[13] G. Bilal,M. S. Khan, I. R. Bajwa, andM. Shafiq, “Genetic controlof test-day milk yield in Sahiwal cattle,” Pakistan VeterinaryJournal, vol. 28, no. 1, pp. 21–24, 2008.
[14] T. Humberto, F. C. M. Mario, A. D. O. Joao, E. L. F. Lenira, L. F.L. Andre, and G. D. A. Lucia, “Test-day milk yield as a selectioncriterion for dairy buffaloes,” Genetics and Molecular Biololgy,vol. 31, no. 3, pp. 108–112, 2008.
[15] L. Kokate, Genetic evaluation of Karan fries sires based ontest-day milk yield records [M. S. Thesis], NDRI (DeemedUniversity), Karnal, India, 2009.
[16] D. Monalisa, R. S. Gandhi, T. V. Raja, A. Singh, and G. K.Sachdeva, “Influence of certain non-genetic factors on test daymilk records in Sahiwal cattle,” Indian Journal of Dairy Science,vol. 63, no. 6, pp. 504–506, 2010.
[17] R. J. Pereira, R. S. Verneque, P. S. Lopes et al., “Milk yieldpersistency in BrazilianGyr cattle based on a random regressionmodel,”Genetics andMolecular Research, vol. 11, no. 2, pp. 1599–1609, 2012.
[18] V. Vohra, Studies on genetic variability of lactation curve traitsfor Karan Fries cows [Ph.D. thesis], N.D.R.I. Deemed UniversityKarnal India, 2010.
[19] V.Dongre, R. V.Gandhi, andA. Singh, “Comparison of differentlactation curve models in Sahiwal cows,” Turkish Journal ofVeterinary and Animal Science, vol. 36, no. 6, pp. 723–726, 2012.
[20] K.D.A.Arik, Influence of some environmental factors, parity andcalving weight on the lactation curve of indigenous Butana cattle[M.S. thesis], University of Juba, Juba, South Sudan, 2003.
[21] M. Tekerli, Z. Akinci, I. Dogan, andA. Akcan, “Factors affectingthe shape of lactation curves of holstein cows from the BalikesirProvince of Turkey,” Journal of Dairy Science, vol. 83, no. 6, pp.1381–1386, 2000.
[22] O. Kocak and B. Ekiz, “Comparison of different lactation curvemodels in Holstein cows raised on a farm in the South-EasternAnatolia region,” Archiv Tierzucht, vol. 51, no. 4, pp. 329–337,2008.
6 Journal of Veterinary Medicine
[23] T. M. Badri, M. Atta, T. Mohamed, and K. A. Ibrahim, “Geneticand non-genetic factors affecting lactation curve components ofa Sudanese Butana dairy herd,” Research Opinions in Animal &Veterinary Sciences, vol. 1, no. 4, pp. 193–197, 2011.
[24] J. R. Gloria, J. A. G. Bergmann, C. R. Quirino et al., “Environ-mental and genetic effects on the lactation curves of four geneticgroups of crossbred Holstein-Zebu cows,” Brazilian Journal ofAnimal Science, vol. 41, no. 11, pp. 2309–2315, 2012.
[25] A. Fredrik, Q. Olav, R. Olav, and T. G. Yrjo, “Mastitis and theshape of the lactation curve in Norwegian dairy cows,” Journalof Dairy Research, vol. 78, pp. 23–31, 2011.
[26] T. L. Stanton, L. R. Jones, R. W. Everett, and S. D. Kachman,“Estimating milk, fat, and protein lactation curves with a testdaymodel,” Journal of Dairy Science, vol. 75, pp. 1691–1700, 1992.
[27] A. Cappio-Borlino, G. Pulina, and G. Rossi, “A non-linearmodification of Wood’s equation fitted to lactation curves ofSardinian dairy ewes,” Small Ruminant Research, vol. 18, pp. 75–79, 1992.
[28] B. Portolano, F. Spatafora, G. Bono et al., “Application of theWood model to lactation curves of Comisana sheep,” SmallRuminant Research, vol. 24, no. 1, pp. 7–13, 1997.
[29] N. Friggens, G. Emmans, and R. Veerkamp, “On the use ofsimple ratios between lactation curve coefficients to describeparity effects onmilk production,” Livestock Production Science,vol. 62, no. 1, pp. 1–13, 1999.
[30] A.Kominakis, E. Rogdakis, andK.Koutsotolis, “Genetic aspectsof persistency of milk yield in Boutsico dairy sheep,” Asian-Australasian Journal of Animal Science, vol. 15, pp. 315–320,2002.
[31] C. Dimauro, G. Catillo, N. Bacciu, and N. P. P. Macciotta, “Fitof different linear models to the lactation curve of Italian waterbuffalo,” Italian Journal of Animal Science, vol. 4, pp. 22–24,2005.
[32] G. Pulina, A. Nudda, N. P. P. Macciotta, G. Battacone, S.Fancellu, and C. Patta, “Non-nutritional strategies to improvelactation persistency in dairy ewes,” in Proceedings of the11th Annual Great Lakes Dairy Sheep Symposium, pp. 38–68,University of Wisconsin-Madison, Burlington, Vt, USA, 2005.
[33] A. A. Fadlemoula, I. A. Yousif, and A. M. Abu Nikhaila,“Lactation curve and persistency of crossbred dairy cows in theSudan,” Journal of Applied Science and Research, vol. 3, no. 10,pp. 1127–1133, 2007.
[34] B. K. Ahunu and J. D. Kabuga, “A study of the gamma functionfor describing Friesian lactation records in Ghana,” Bulletin ofAnimal Health and Production Africa, vol. 42, pp. 147–152, 1994.
[35] T. R. Batra, “Comparison of two mathematical models infitting lactation curves for pureline and crossline dairy cows,”Canadian Journal of Animal Science, vol. 66, pp. 405–414, 1986.
[36] D. Vilas, Modeling lactation curve for sire evaluation in sahiwalcattle [Ph.D. thesis], National Dairy Research Institute (DeemedUniversity), Karnal, India, 2012.
[37] J. C. M. Dekkers, J. H. Ten Haag, and A. Weersink, “Economicaspects of persistency of lactation in dairy cattle,” LivestockProduction Science, vol. 53, pp. 237–252, 1998.
[38] V. A. Capuco, D. L. Wood, R. L. Baldwin, K. R. Mcleod, and M.J. Paape, “Mammary cell number, proliferation, and apoptosisduring a bovine lactation: relation tomilk production and effectof ST,” Journal of Dairy Science, vol. 84, pp. 2177–2187, 2001.
[39] G. Catillo, N. P. P. Macciotta, A. Carretta, and A. Cappio-Borlino, “Effects of age and calving season on lactation curvesof milk production traits in Italian water buffaloes,” Journal ofDairy Science, vol. 85, no. 5, pp. 1298–1306, 2002.
[40] A. Kaygısız and H. A. Dergisi, “Comparison of lactation curvetraits in Simmental and Brown Swiss cattle raised on theAltindere State Farm,”Hayvancılık Arastirma Dergisi, vol. 7, no.1, pp. 25–30, 1997.
[41] A. Kaygısız, Y. Vanlı, I. Yılmaz, and H. Uretim, “A studyon lactation curve traits of brown cattle,” Journal of AnimalProduction, vol. 44, pp. 69–80, 2003.
[42] A. P. Cervantes, L. Fernandez, and C. P. Ponce, “Characteriza-tion of lactation curves in production and major componentsof milk in different breeds and crosses in Mexican tropicalconditions,” Review of Cuba Sal. Animal, vol. 28, no. 2, pp. 90–95, 2006.
[43] I. Yilmaz, E. Eyduran, A. Kaygisiz, and K. Javed, “Estimates ofgenetic parameters for lactation shape parameters with multi-variate statistical technique in Brown Swiss cattle,” InternationalJournal of Agriculture and Biology, vol. 13, pp. 174–178, 2011.
[44] J. Solkner and W. Fuchs, “A comparison of different measuresof persistency with special respect to variation of test-day milkyields,” Livestock Production Science, vol. 16, pp. 305–319, 1987.
[45] T. A. Ferris, I. L. Mao, and C. R. Anderson, “Selecting forlactation curve and milk yield in dairy cattle,” Journal of DairyScience, vol. 68, pp. 1438–1448, 1985.
[46] F. E. Madalena, M. L. Martinez, and A. F. Freitas, “Lactationcurves of Holstein-Friesian and Holstein-Friesian cross Gircows,” Animal Production, vol. 29, pp. 101–107, 1979.

Submit your manuscripts athttp://www.hindawi.com
Veterinary MedicineJournal of
Hindawi Publishing Corporationhttp://www.hindawi.com Volume 2014
Veterinary Medicine International
Hindawi Publishing Corporationhttp://www.hindawi.com Volume 2014
Hindawi Publishing Corporationhttp://www.hindawi.com Volume 2014
International Journal of
Microbiology
Hindawi Publishing Corporationhttp://www.hindawi.com Volume 2014
AnimalsJournal of
EcologyInternational Journal of
Hindawi Publishing Corporationhttp://www.hindawi.com Volume 2014
PsycheHindawi Publishing Corporationhttp://www.hindawi.com Volume 2014
Evolutionary BiologyInternational Journal of
Hindawi Publishing Corporationhttp://www.hindawi.com Volume 2014
Hindawi Publishing Corporationhttp://www.hindawi.com
Applied &EnvironmentalSoil Science
Volume 2014
Biotechnology Research International
Hindawi Publishing Corporationhttp://www.hindawi.com Volume 2014
Agronomy
Hindawi Publishing Corporationhttp://www.hindawi.com Volume 2014
International Journal of
Hindawi Publishing Corporationhttp://www.hindawi.com Volume 2014
Journal of Parasitology Research
Hindawi Publishing Corporation http://www.hindawi.com
International Journal of
Volume 2014
Zoology
GenomicsInternational Journal of
Hindawi Publishing Corporationhttp://www.hindawi.com Volume 2014
InsectsJournal of
Hindawi Publishing Corporationhttp://www.hindawi.com Volume 2014
The Scientific World JournalHindawi Publishing Corporation http://www.hindawi.com Volume 2014
Hindawi Publishing Corporationhttp://www.hindawi.com Volume 2014
VirusesJournal of
ScientificaHindawi Publishing Corporationhttp://www.hindawi.com Volume 2014
Cell BiologyInternational Journal of
Hindawi Publishing Corporationhttp://www.hindawi.com Volume 2014
Hindawi Publishing Corporationhttp://www.hindawi.com Volume 2014
Case Reports in Veterinary Medicine