lactation curve and milk flow - kasetsart...
TRANSCRIPT
Lactation Curve and Milk Flow
Antonio BORGHESEa*, Carlo BOSELLIb and Remo ROSATIb aGeneral Secretary International Buffalo Federation, Monterotondo- Rome, Italy bAnimal Prophylaxis Research Institute for Lazio and Toscana Regions, Rome, Italy *Corresponding email: [email protected], [email protected] ABSTRACT
The buffalo Mediterranean Italian breed was very much studied for lactation curve. Data on lactation curves after the first, the second and the third calving are reported. In all the 3 lactations we have similar curves, with the production peak on the 40th day, in the second and third lactations, while in the first lactation it is shown on the 50th day and with a longer duration. Lactation curves were different for the first and later parities with lactations of different duration also in Nili-Ravi buffaloes. Milk production and milk flow profiles are important parameters to be recorded and evaluated. In fact they give various advices on milking management. The milk flow curve is typical for each animal and must be recorded singly. Buffaloes are characterized by longer teat and teat canal, and particularly by stronger muscular resistance of teat wall, than in cow: it is necessary a high vacuum level for opening the teat canal and beginning milk ejection. A recent trial is reported, where the manual stimulation at different times provoked the increasing of released oxytocin and of the intra-mammary pressure and finally the increasing of cisternal teat largeness and the reduction of teat canal length. Buffalo is characterized by smaller cisternal fraction than in cattle. The cisternal milk fraction is immediately available while the alveolar fraction needs an oxytocin stimulation to release. In Mediterranean Italian buffaloes it has been observed a higher cisternal fraction of total milk than in Murrah breed. In buffalo management, the milking room and the milking machine are really a critical point and the characteristics of milking vacuum and milking pulsations are strictly connected with milk flow observations. Different curves obtained in recent trials during the milking with normal milking machine and with Automatic Milking System are reported and discussed. A recent study on Mediterranean Italian buffaloes from 104 different herds showed that 88.86% of milk is ejected in 4.24 min (main milking time), as 8.49% is ejected in 1.98 min (milk let-down) corresponding to the cisternal milk fraction. Only 2.65% is the milk ejected in the stripping phase. These results suggest toapply a premilking udder stimulation to reduce milk let-down time increasing the average milk flow and reducing total milking time. These results suggest to the detachment of milking cluster to reduce the blind phase with the following advantages: a) reducing the total milking time and consequently worker’s time, b) improving the farmer’s income and the milk quality thought the mastitis incidence decreasing. Keywords: cisternal fraction, lactation, milk flow curve
334
Buffalo Bulletin 2013 Vol.32 (Special Issue 1): 334-350
Accepted April 10, 2013; Online November 11, 2013.
1. LACTATION CURVE Milk production during whole lactation is a continuous physiological
function which describes the rate of milk secretion with advancement in lactation (Dongre et al., 2011).The lactation curve in dairy species can be seen as the graphical representation of milk yield during the time. There are many factors which affected the lactation curve in dairy species: breed, genetic basis, season and period of calving, age at calving, environmental factor and health status (especially on mammary gland). The typical shape of lactation curve has two characteristic parts: a rapid increase from calving to a peak period in early stage of lactation and a gradual decline from peak of yield to the end of lactation (Leon-Velarde et al., 1995).
The most important phase is the persistency of the lactation: persistency of milk production is the ability of animal to maintain milk production at high level after peak production, or usually refers to the rate of decline in daily yield after the peak of lactation (Togashi and Lin, 2004). Random regression model was applied for the analysis of test day record and to study the genetic persistency of the first lactation milk yield of Indian Murrah buffaloes (Geetha et al., 2006); these Authors found that heritability of test day milk yield varied from 0.33 to 0.58 in different test days. Chaudhry et al. (2000) calculated persistency of lactation in 2 390 lactation records of Nili-Ravi buffaloes, with 87% persistent buffaloes; environmental, season of calving, parity and lactation length had a significant effect on the trait. Persistency was 9% heritable with a repeatability of 13%. Correlation with lactation length was positive: buffaloes with greater lactation length were more persistent.
The Mediterranean Italian breed was very much studied for lactation curve. In Figure 1 the lactation curves after the first, the second and the third calving are reported. The average production was 2 160 kg in the first lactation, 2 348 in the second lactation and 2 356 in the third one. It clear that the buffalo potential production is observed in the second lactation (Coletta and Caso, 2008). In all the 3 lactations we have similar curves, with the production peak on the 40th day, in the second and third lactations, while in the first lactation it is shown on the 50th day and with a longer duration.
The effect of age and calving season on lactation curves in Mediterranean Italian buffaloes was demonstrated too by Catillo et al. (2002), as it is shown in Figure 2.
Lactation curves were different for the first and later parities with lactations of different duration also in Nili-Ravi buffaloes (Khan and Chaudry, 2000), who found a lactation length of about 289 days for an average milk yield of 1 984 kg as about 59% of the lactations had length shorter than the standard lactation of a 10 months. The same Authors found different lactation curves according the parities (Figure 3, Khan and Chaudhry, 2001). These Authors found 10% of atypical lactations, with the first calves having the highest frequency.
According Penchev et al. (2011), the highest peak yield belongs to the buffaloes with the highest calving age, by 0.719 kg higher as compared with the earliest calves (Figure 4). In the latest age at calving the relative decline from second to third months is twice faster as compared with the earliest class. From month 3 to 4 the drop is even better pronounced (16% vs. 5.6%) while after that point the differences are negligible until the end of lactation.
335
Buffalo Bulletin 2013 Vol.32 (Special Issue 1): 334-350
2. MILK EJECTION AND MILK FLOW CURVE. Milk production and milk flow profiles are important parameters to be
recorded and evaluated. In fact they give various advices on milking management (Thomas et al., 2005). The milk flow curve is typical for each animal and must be recorded singly. The portable milkmeter Lactocorder® (WMB AG – Balgach, web site) is the normally used instrument to relieve real time milk flow curves and their parameters, electrical conductivity of milk and it is used too to collect a sample for the qualitative analysis. Milk flow curves have been well studied in the cattle (Weis et al., 2004; Bruckmaier, 2005; Tancin et al., 2006), partially in sheep and goat (Dzidic et al., 2004; Bruckmaier et al., 1994; Boselli et al., 2009) and a relatively recent approach is the introduction of this method in buffalo (Boselli et al., 2004; Thomas et al., 2003; Bava et al., 2007; Di Palo et al., 2007; Borghese et al., 2007 a,b; Rasmussen et al., 2008; Boselli et al., 2005, 2008, 2010, 2011b,c) and in donkey (Boselli et al., 2011a). The graphic representation of milk flow curve can be showed by different phases:
- the first is the increasing phase (milk letdown time and incline time), represented by the time elapsed between the attachment of the milking clusters and the time until constant milk flow;
- the second is the plateau with a constant milk flow (peak of milk flow is generally in this phase);
- the third is the decreasing phase and represents the time from the plateau phase until the detachment of the milking cluster at stop of milk flow;
- an eventual fourth phase may be the stripping yield, preceded by blind phase. Graphical representation in milk ejection is visible through flow curves. They
are typical and characteristic for each dairy species: cattle, buffalo, goat and donkey (see Figure 5, 6, 7, 8). Specifically, milk flow curves and other parameters are influenced by anatomical (Thomas et al., 2004; Ambord et al., 2009), physiological (Thomas et al., 2005), environmental factors (Pazzona, 1989; Dogra et al., 2000, Thomas et al., 2005; Caria et al., 2011; Caria et al., 2012) and health status (Boselli et al., 2004). Buffaloes are characterized by longer teat and teat canal, and particularly by stronger muscular resistance of teat wall, than in cow: it is necessary an high vacuum level for opening the teat canal and beginning milk ejection (Thomas et al., 2004; Ambord et al., 2009), even if the teat canal becomes shorter by an adequate stimulation (Ambord et al., 2010).
In a recent trial, we verified that the manual stimulation at different times provoked the increasing of released oxytocin and of the intra-mammary pressure and finally the increasing of cisternal teat largeness and the reduction of teat canal length (Borghese, 2012). We can obtain similar results, applying oxytocin injection, as oxitocyn provokes immediately a progressive increasing of intra-mammary pressure and of cisternal teat largeness and a reduction of teat canal lenght (Figure 9-11).
In the Figure 12 a transversal section of the same teat is presented, where the great volume of cisternal teat, the increased teat diameter and the reduction of teat wall are very evident.
Species are characterized by smaller cisternal fraction than in cattle. The cisternal milk fraction is immediately available while the alveolar fraction needs an oxytocin stimulation to release. In Mediterranean Italian buffaloes it have been
336
Buffalo Bulletin 2013 Vol.32 (Special Issue 1): 334-350
observed a higher cisternal fraction of total milk than in Murrah breed (respectively 7.6%, as reported by Ambord et al., 2009, and 4.9%, as in Thomas et al., 2004, for different parity, number and stage of lactation).
In buffalo management, the milking room and the milking machine are really a critical point and the characteristics of milking vacuum and milking pulsations are strictly connected with milk flow observations (Pazzona, 1989; Dogra et al., 2000 Caria et al., 2011; Caria et al., 2012).Animal general health, with particular regard to mastitis, influences milk composition and milk flow parameters. In buffalo, Somatic Cell Count is a good indicator of subclinical mastitis (Pyorala, 2003; Thomas et al., 2004; Rosati et al., 2008). These differences characterize the milk flow curves in buffalo species and result in different relieved parameters as the total milking time and milk yield. Figures 13 to 23 give some examples of different milk flow curves. Figure 13 shows a normal milk flow curve, but from a farm where over-milking (about 3 minutes) was applied often. Visualisation of the long phase of over-milking must oblige the milkers to change the milking routine and to solve this problem, applying the automatic detachment.
Milking of the cisternal fraction is shown as the first curve in Figure 14 and known as a bimodal curve, which is not frequent in buffaloes, because of the small proportion of the cisternal fraction, that is normally the 6-7% of the total milk (cisternal+alveolar). Figure 15 is a curve from a buffalo with very low flow rate, a long plateau time, probably due to a tight and long teat canal, which is seen frequently in Italian buffalo herds. Most buffaloes need at minimum 8 minutes of milking time, but exceptions can be seen for buffaloes with a high peak flow rate and a short plateau time (Figure 16): in this case the maximum peak flow (about 3 kg/min) is similar to that one presented by dairy cattle, but the high over-milking is anyway a negative factor, for udder health and too for management economy. Therefore is a must to reduce over-milking and milking time: for this purpose could be convenient to introduce in the milking room a group of animals with similar milking time and anyway to apply the automatic detachment, to eliminate totally the over-milking.
Figure 17 shows a milk flow curve with a double profile, due to the partially milk emission disturbed or due to the repositioning of milking cluster. This problem can be avoided applying more attention by the milkers. Figure 18 is a milk flow curve of a buffalo not responding to manual stimulation during teat preparation until oxytocin was injected. This problem represents an economic loss, because of 6 minutes of wait and for the damage of the teat, extremely stimulated. The animals with oxytocin habit, anyway are a real problem for the livestock management, for the increasing cost and for more engagement during milking.
Figure 19, 20, 21, show different curves obtained during the milking with Automatic Milking System (AMS, Figure 24). The first is classified as failure (no attachment of cluster), the second as incomplete (partially attachment of cluster, only two quarters) and the third as complete one, perfectly attachment of cluster (Figure 21) (Boselli et al., 2011b). These data show that AMS could not be practised by all the buffalo dairy population, but AMS needs a very regular udder conformation with symmetric and perpendicular teats. In Figures 22 and 23, milk flow curves at quarter level are shown (Borghese, 2012). The fore quarters started
337
Buffalo Bulletin 2013 Vol.32 (Special Issue 1): 334-350
milk flow 30 after the rear ones because of the different anatomy. The rear quarters produce higher quantity of milk and show higher maximum flow and higher plateau.
In Mediterranean Italian breed, Borghese et al. (2007a) found a mean time from stimulation to milk let-down of 133±14 second (s), with no difference between morning and evening milking. Boselli et al. (2004) refer mean values of 105 s. versus 99.6 s. in the morning and in the evening respectively to reach the plateau phase. They calculated a peak flow of 1.32 kg/min in the morning versus 1.22 kg/min in the evening. Mean decline time of 110 s. in the morning versus 137 s. in the evening where calculated. Average flow rates were 0.86 kg/min in the morning and 0.77 kg/min in the evening.
In Murrah buffaloes, Thomas et al. (2004) found the time until milk let down of 69 s. versus 154 s. in two groups with a different concentrate feeding during milking. Time until a milk flow of 500 g was 195 versus 329 sec in the morning and 224 versus 383 s. in the evening, which highlights the importance of concentrate feeding during milking. In the same experiment peak milk flow was 1.18 and 1.13 kg/min in the morning versus 1.05 and 0.93 kg/min in the evening respectively for the groups. Dogra et al. (2000) found an average milk flow rate of 0.92 kg/min. Thomas et al. (2006) calculated mean flow rates of 0.49 kg/min, 0.18 kg/min and 0.10 kg/min among groups of dairy Murrah buffaloes submitted to different regimes of concentrate integration and manual pre-stimulation or not respectively.
Electrical conductivity can be measured simultaneously with the milk flow using the Lactocorder®. Conductivity is related to udder health, somatic cells count and mastitis onset. Boselli et al. (2005) found mean values of 4.11 mS/cm in milk of Mediterranean Italian buffalo. The correlated with somatic cell count was r = 0.37 (Pearson P<0.001) and indicates possibilities to use electrical conductivity in mastitis detection.
General udder health and particular teat pathologies may influence milk production in quantity, quality and milk ejection parameters. Other differences in the milking response are strictly connected with the quarters’ milk distribution (Weiss et al., 2004; Rodrigues Amaral and Corrêa Escrivão, 2005) as reported in other milking species (Bruckmaier et al., 1994).
The general health of animals and good livestock conditions are very important in milk production. Moreover, the milking machine is a very critical factor for the milk flow rates because of the characteristics of milking vacuum, milking pulsation and pulsation frequency, and other technical characteristics connected to the milking equipment (Pazzona, 1989; Dogra et al., 2000).
Caria et al. (2011) compared the effects of milking at low vacuum (36 kPa) and medium vacuum (42 kPa) on milk emission characteristics and milking system performances. The results showed that the low vacuum level did not influence both milk yield and milk ejection time.
While in another study Caria et al. (2012) verified the milkability at different vacuum levels (37, 40, 43, 46, 49 and 52 kPa): it is shown that the Mediterranean Italian buffalo is suitable to mechanical milking at different working vacuum levels. Milk yield was not influenced by the working vacuum level and resulted satisfactory also at lower levels; the vacuum levels of 37 and 40 kPa showed the best milkability
338
Buffalo Bulletin 2013 Vol.32 (Special Issue 1): 334-350
conditions, at which plateau phase was longer than decline phase and lag time was not affected by vacuum level. 3. INNOVATION IN BUFFALOES MILKING TECHNONOLOGIES
A recent study analysed the principal milk flow traits and milk yield recorded in Mediterranean Italian buffaloes from 104 different herds, raised in the Latium Region (Centre of Italy) during 2005-2010 (Boselli et al., 2011c). This study showed that 88.86% of milk is ejected in 4.24 min (main milking time), as 8.49% is ejected in 1.98 min (milk let-down) corresponding to the cisternal milk fraction as observed in a previous work (Ambord et al., 2009). Only 2.65% is the milk ejected in the stripping phase.
These results suggest applying a premilking udder stimulation to reduce milk let-down time increasing the average milk flow and reducing total milking time. These results suggest to the detachment of milking cluster to reduce the blind phase with the following advantages: a) reducing the total milking time and consequently worker’s time, b) improving the farmer’s income and the milk quality thought the mastitis incidence decreasing.
About the introduction of AMS in buffalo, the preliminary results of recent study showed that there is a considerable variation in milk ejection and consequently in milk flow curves for the buffalo milked in AMS with forced system, in comparison with the conventional one.
The differences are the following: better pre-stimulation allowing a positive endogenous releasing of oxytocin, with reduced milk letdown phases; independent milk ejection for each teat, with optimal milking of all the quarters, with the reduction of over-milking; better milking hygiene during dairy routines, limiting the incidence of mastitis and with low value of somatic cell count; negative effects, because of failed or incomplete milking (17% of total), that limit the potential capability and efficiency of AMS; frequent air flow, which could cause alteration of milk composition (Boselli et al., 2011b). REFERENCES Ambord, S., C. S. Thomas, A. Borghese, M. Mazzi, C. Boselli and R. M.
Bruckmaier. 2009. Teat anatomy, vacuum to open the teat canal, and fractionized milk composition in Italian buffaloes. Milchwissenschaft 64: 351-353.
Ambord, S., M.H. Stoffel and R.M. Bruckmaier. 2010. Teat anatomy affects requirements for udder preparation in Mediterranean buffaloes. J. Dairy Res. 77: 468-473.
Bava, L., A. Sandrucci, A. Tamburini and M. Zucali. 2007. Milk flow traits of buffalo cows in intensive farming system. Ital. J. Anim. Sci. 6, Suppl. 1: 500-502.
Borghese A., M. Mazzi, R. Rosati and C. Boselli. 2007 a. Milk flow pictures in Mediterranean Italian buffaloes through lactocorder instrument. Proc. International Symposium on advances in milking Cork, Ireland: 60-63.
339
Buffalo Bulletin 2013 Vol.32 (Special Issue 1): 334-350
Borghese A., M. Rasmussen and C.S. Thomas, 2007 b. Milking Management of dairy buffaloes. Proc. 8th World Buffalo Congress, Oct. 19-22, Caserta, Italy, Italian J. Anim. Sci. 6(2): 39-50.
Borghese A., 2012. Personal communication. Boselli C., R. Rosati, G. Giangolini, S. Arcuri, A. Fagiolo, S. Ballico and A.
Borghese. 2004. Milk flow measurements in buffalo herds. Proc. of the Seventh World Buffalo Congress Manila, Philippines, 20-23 Oct.: 244-246.
Boselli C., R. Rosati, A. Borghese, M.C. Campagna, S. Arcuri, G. Giangolini and A. Fagiolo. 2005. Reliefs on the electrical conductivity in the buffalo milk in Rome and Latina Farms. Proc. of III Congr. Naz. Allevamento del Bufalo Paestum (SA – Italy) Oct. 12-15: 48-49.
Boselli, C., M. Mazzi, C.S. Thomas and A. Borghese. 2008. Milkability of Buffalo (milk flow curves). In: “Milking Management of Dairy Buffaloes”. Bulletin of the International Dairy Federation no. 426/2008. Editors Rasmussen M., Thomas C.S. and Borghese A.: 37-41.
Boselli C., G. Giangolini, F. Filippetti, G. Giacinti and S. Amatiste. 2009. Milk flow traits during lactation in Saanen goats raised in Latium region. XVII Intenational Congress of Mediterranean Federation of Health and Production of Ruminant, Perugia – Italy. May 27-30: 268-269.
Boselli, C., M. Mazzi, A. Borghese, G.M. Terzano, G. Giangolini, F. Filippetti, S. Amatiste and R. Rosati. 2010. Milk flow curve and teat anatomy in Mediterranean Italian buffalo cows. Proc. IX World Buffalo Congress 25-28 April, Buenos Aires, Argentina, Revista Vet., 21, suppl. 1: 576-581.
Boselli, C., S. Amatiste, M. Mazzi, G. M. Terzano, G. Giangolini, F. Filippetti and R. Rosati, 2011 a. Variations in the production and qualitative characteristics of the milk of the Amiata donkey breed during a lactation. IDF International Dairy Symposium on Sheep, Goat and other non cow milk Athens, Greece, May 16-18, 2011
Boselli, C., M. Mazzi, A. Borghese, G.M. Terzano, A. Coletta, M. Diruppo, G. Giangolini, F. Filippetti, R. Rosati and S. Amatiste. 2011 b. Automatic milking system in Mediteranean Italian Buffalo cows: a field study on milk flow curve. VI Buffalo Symposium of Americas Havana, Cuba, 21-26 Nov.
Boselli, C., M. Mazzi, A. Borghese, G.M. Terzano, G. Giangolini, F. Filippetti, S. Amatiste and R. Rosati. 2011 c. Milk flow and milkability at herd level in Mediteranean Italian Buffalo in Latium Region. VI Buffalo Symposium of Americas Havana, Cuba, 21-26 Nov.
Bruckmaier, R.M., C. Ritter, D. Schams and J.W. Blum. 1994. Machine milking in dairy goats during lactation: udder anatomy. J. Dairy Research 63:191-200.
Bruckmaier, R.M. 2005. Normal and disturbed milk ejection in dairy cows. Domest. Anim. Endocrinol 29:268-273.
Catillo, G., N. P. P. Macciotta, A. Carretta and A. Cappio-Borlino. 2002. Effects of age and calving season on lactation curves of milk production traits in Italian water buffaloes. J. Dairy Sci. 2002, 85, n. 5: 1298-1306.
Caria, M., L. Murgia and A. Pazzona. 2011. Effects of the working vacuum level on mechanical milking of buffalo. J. Dairy Sci. 94 :1755–1761.
340
Buffalo Bulletin 2013 Vol.32 (Special Issue 1): 334-350
Caria, M., C. Boselli, L. Murgia, R. Rosati and A.Pazzona. 2012. Effect of vacuum level on milk flow traits in Mediterranean Italian buffalo cow. Ital. J. Anim. Sci. 11:e25.
Chaudhary, H. Z., M. S. Khan, G. Mohiuddin and M. I. Mustafa. 2000. Persistency of lactation in Nili-Ravi buffaloes. Intern. J. Agric. Biol. 2, n. 3: 207-209.
Coletta, A. and C. Caso, 2008. Milk recording. In: “Milking Management of Dairy Buffaloes”. Bulletin of the International Dairy Federation no. 426. Editors Rasmussen M., Thomas CS., Borghese A.: 101-104.
Di Palo, R., G. Campanile, B. Ariota, D. Vecchio, C. Grassi, D. Neri, E. Varricchio and M. Rendina. 2007. Milk flow traits in Mediterranean Italian Buffaloes. Ital.J.Anim.Sci. 6 (Suppl. 2): 1319-1322.
Dzidic, A., M. Kaps and R.M. Bruckmaier. 2004. Machine milking of Istrian dairy crossbreed ewes: udder morphology and milking characteristics. Small Rum. Res. 55: 183-189.
Dogra, P.K., O.S. Parmar and S.C.Gupta. 2000. Effect of vacuum and pulsation rate on some milking characteristics in Murrah buffaloes. Bubalus bubalis 4: 78-83.
Dongre, V.B., R.S. Gandhi, T.VL. Raja, Avtar Singh and B. Balasundaram. 2011. Performance of different first lactation economic traits in Sahiwal cattle: a review. International Journal of Agriculture: Research and Review 1 (2): 91-96.
Geetha, E., A.K. Chakravarty and K.V.Kumar. 2006. Genetic persistency of first lactation milk estimated using random regression model for Indian Murrah buffaloes. Asian-Australian J. Agric. Sci. 19, n. 12: 1696-1701.
Khan, M.S. and H.Z. Chaudhry. 2000. Lactations length and its behavior in Nili-Ravi buffaloes. Pakistan Vet. J., 20(2): 81-84.Khan M.S. and Chaudhry H.Z., 2001. Short and atypical lactations in Nili-Ravi buffaloes. Pakistan Vet. J. 21(3), 124-127
Leon- Velarde, C.U., I. McMillan, R.D. Gentry and J.W. Wilton. 1995. Models for estimating typical lactation curves in dairy cattle. Journal of Animal Breeding and Genetics 112: 333-340.
Pazzona, A., 1989. The effect of the weight of the clusters and shape of the teat cup liners on the milking characteristics of buffaloes. J. Agric. Eng. Res. 43: 175-181.
Penchev, P., M. Boichev, Y. Ilieva and T. Peeva. 2011. Effect of different factors on lactation curve in buffalo cows. Slovak J. Anim. Sci. 44, (3): 103-110.
Pyörälä, S., 2003. Indicators of inflammation in the diagnosis of mastitis. Veterinary research 2003;34(5):565-78.
Rasmussen, M.D., S. Thomas and A. Borghese, 2008. Milking Management of Dairy Buffaloes. Bulletin of the International Dairy Federation no. 426: 1-103.
Rodrigues Amaral, F. and S.Corrêa Escrivão, 2005. Aspectos relacionados à bùfala leiteira. Rev. Bras. Reprod. Anim. Belo Horizonte (29), vol. 2: 111-117.
Rosati, R., C.S. Thomas, O. Lai, L. Alfieri and T. Zottola. 2008. Udder health. In: Milking Management of Dairy Buffaloes”. Bulletin of the International
341
Buffalo Bulletin 2013 Vol.32 (Special Issue 1): 334-350
Dairy Federation no. 426. Editors Rasmussen M., Thomas S., Borghese A.: 43-54
Tancin, V., J. Macuhova, D. Schams and. R.M. Bruckmaier, 2006. The importance of increased levels of oxytocin induced by naloxone to milk removal in dairy cows. Vet. Med. Czech 51:340–345.
Thomas, C.S., K. Svennersten-Sjaunja, M.R. Bhosrekar and R.M. Bruckmaier. 2003. Mammary cisternal size, cisternal milk and milk ejection in Murrah buffaloes. J. of Dairy Res. 71: 162-168.
Thomas, C.S., 2004. Milking management of dairy buffaloes. Dott. Diss. Dep. Nutrition and Management, SLU. Acta Universitatis agriculturae Suecia Agraria vol. 455.
Thomas, C.S., J. Nordstrom, K. Svennersten-Sjaunja and H. Wiktorsson. 2005. Maintenance and milking behaviours of Murrah buffaloes during two feeding regimes. Appl. Anim. Behav. Sci. 91:261-276.
Thomas, C.S., R.M. Bruckmaier, K. Östensson and K. Svennerten-Sjaumja. 2006. Physiology of milk ejection in dairy buffaloes. III Simposio Bùfalos de las Americas: 62-65.
Togashi, K. and C. Y. Lin. 2004. Efficiency of different selection criteria for persistency and lactation milk yield. J. Dairy Sci.87: 1528-1535.
Weiss D., M. Weinfurtner and R.M. Bruckmaier. 2004. Teat Anatomy and its Relationship with Quarter and Udder Milk Flow Characteristics in Dairy Cows. J. Dairy Sci. 87: 3280-3289.
www.lactocorder.ch website
342
Buffalo Bulletin 2013 Vol.32 (Special Issue 1): 334-350
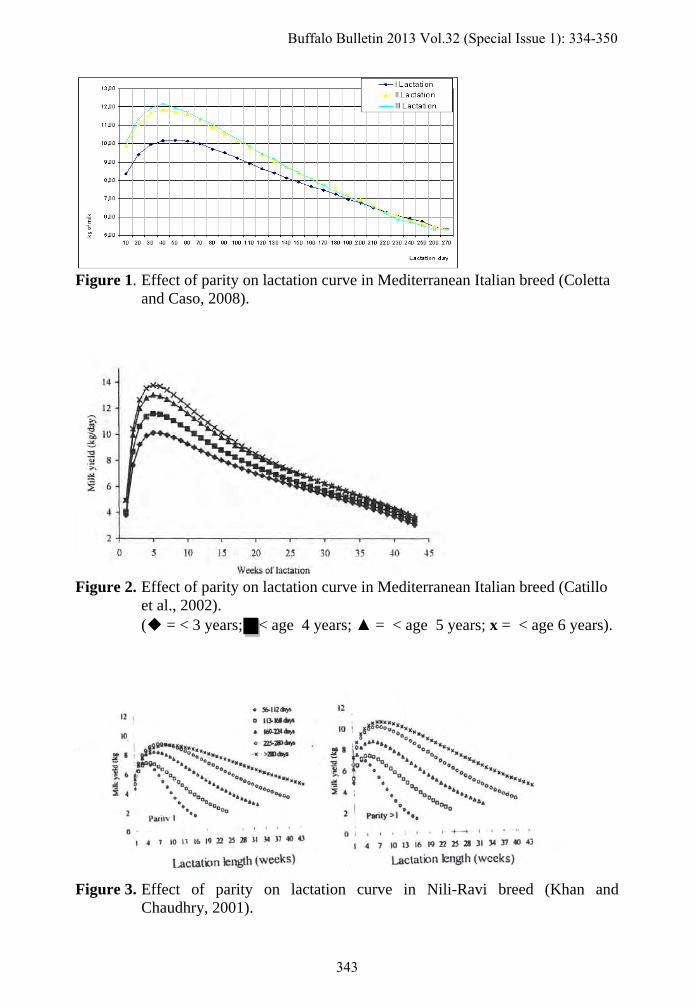
Figure 1. Effect of parity on lactation curve in Mediterranean Italian breed (Coletta
and Caso, 2008).
Figure 2. Effect of parity on lactation curve in Mediterranean Italian breed (Catillo
et al., 2002). (◆ = < 3 years; < age 4 years; ▲ = < age 5 years; x = < age 6 years).
Figure 3. Effect of parity on lactation curve in Nili-Ravi breed (Khan and
Chaudhry, 2001).
343
Buffalo Bulletin 2013 Vol.32 (Special Issue 1): 334-350
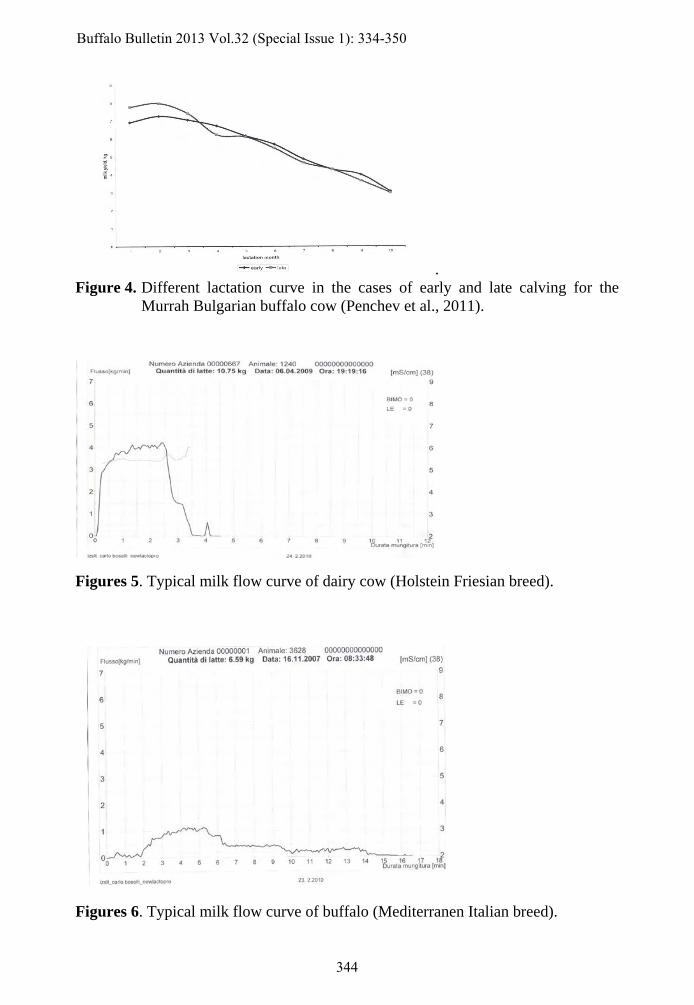
. Figure 4. Different lactation curve in the cases of early and late calving for the
Murrah Bulgarian buffalo cow (Penchev et al., 2011). Figures 5. Typical milk flow curve of dairy cow (Holstein Friesian breed). Figures 6. Typical milk flow curve of buffalo (Mediterranen Italian breed).
344
Buffalo Bulletin 2013 Vol.32 (Special Issue 1): 334-350
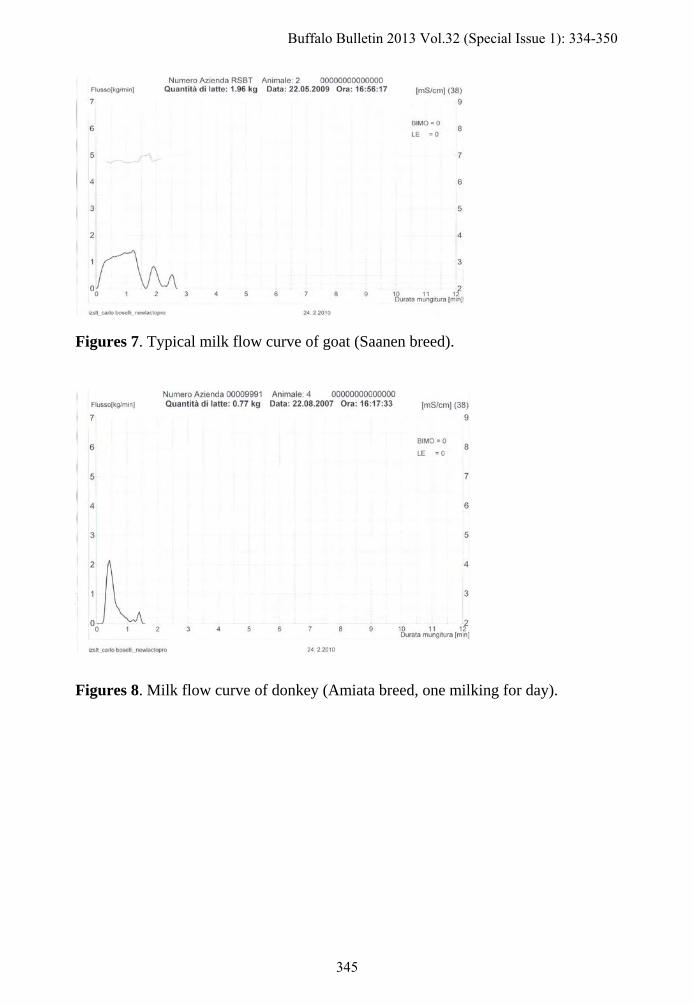
Figures 7. Typical milk flow curve of goat (Saanen breed). F Figures 8. Milk flow curve of donkey (Amiata breed, one milking for day).
345
Buffalo Bulletin 2013 Vol.32 (Special Issue 1): 334-350
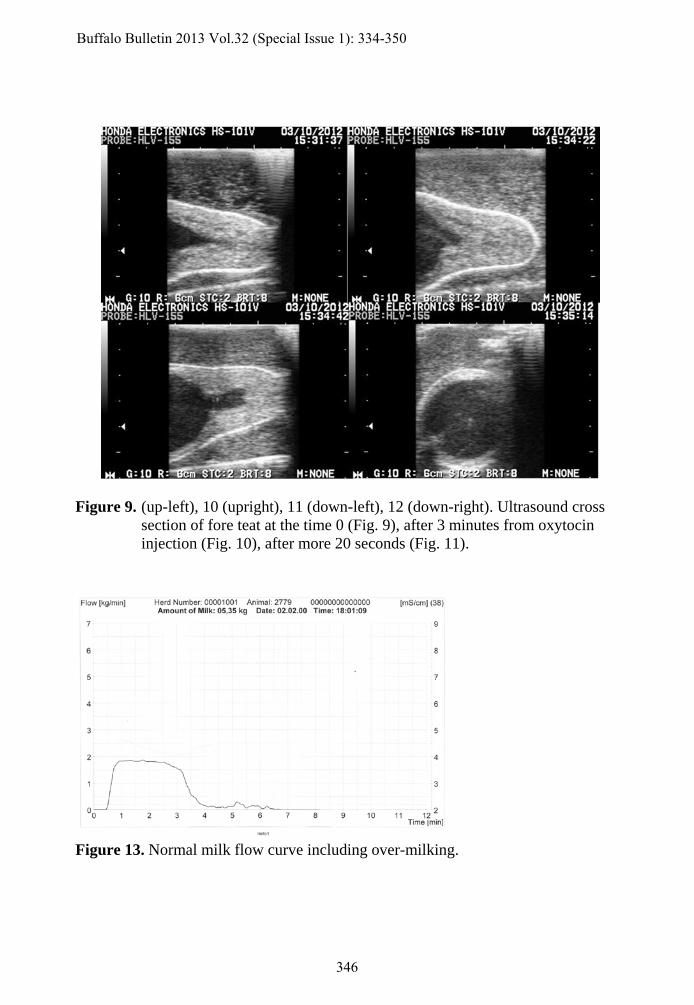
Figure 9. (up-left), 10 (upright), 11 (down-left), 12 (down-right). Ultrasound cross
section of fore teat at the time 0 (Fig. 9), after 3 minutes from oxytocin injection (Fig. 10), after more 20 seconds (Fig. 11).
Figure 13. Normal milk flow curve including over-milking.
346
Buffalo Bulletin 2013 Vol.32 (Special Issue 1): 334-350
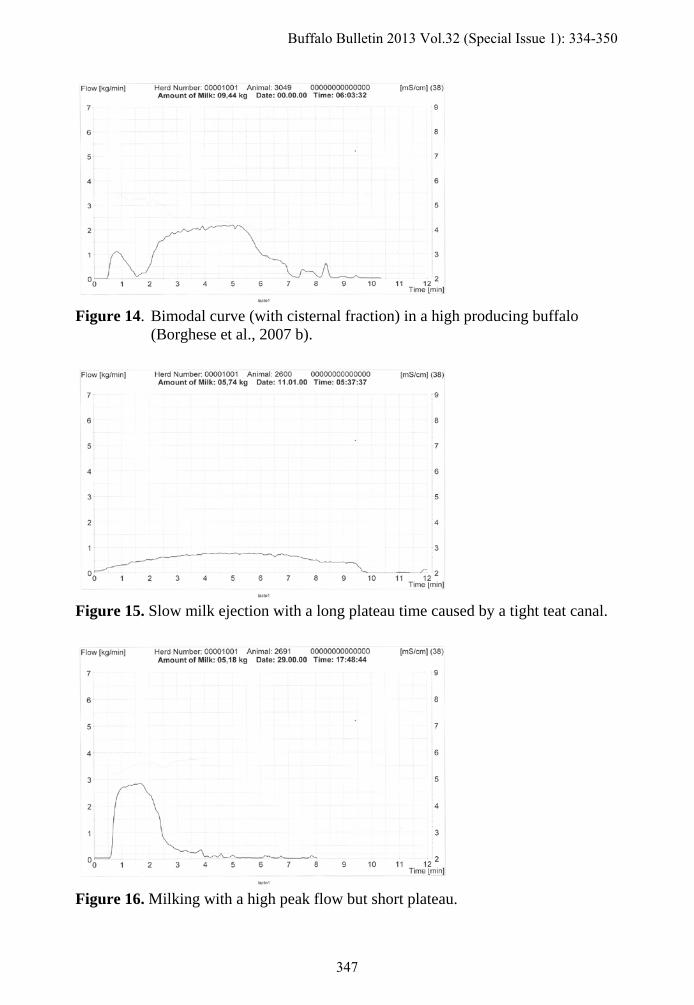
Figure 14. Bimodal curve (with cisternal fraction) in a high producing buffalo
(Borghese et al., 2007 b).
Figure 15. Slow milk ejection with a long plateau time caused by a tight teat canal.
Figure 16. Milking with a high peak flow but short plateau.
347
Buffalo Bulletin 2013 Vol.32 (Special Issue 1): 334-350
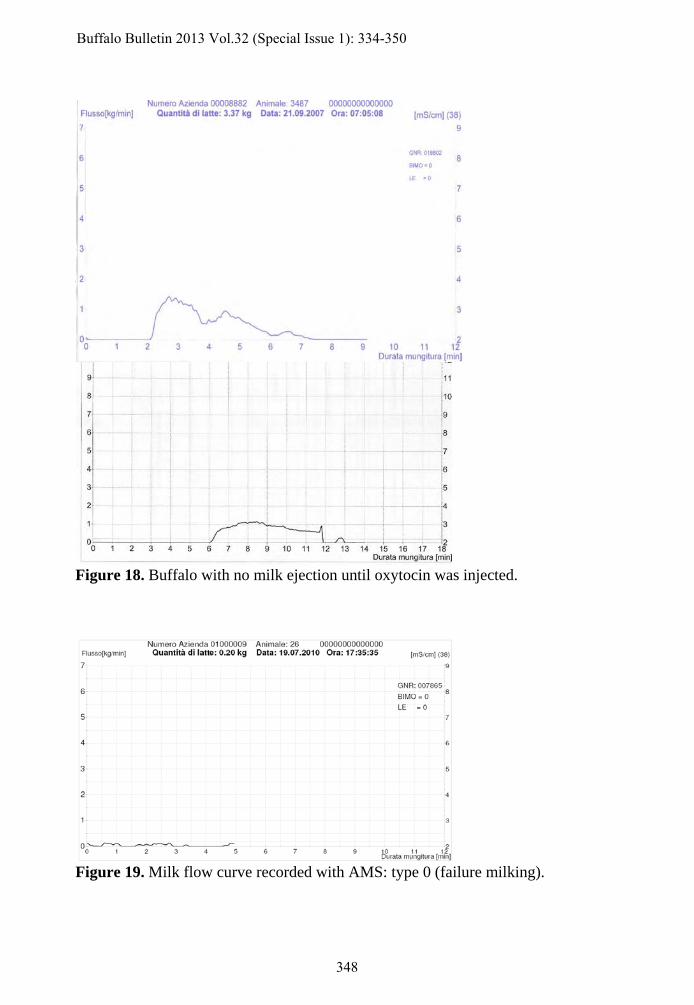
Figure 17. Milking with a double profile.
Figure 18. Buffalo with no milk ejection until oxytocin was injected.
Figure 19. Milk flow curve recorded with AMS: type 0 (failure milking).
348
Buffalo Bulletin 2013 Vol.32 (Special Issue 1): 334-350
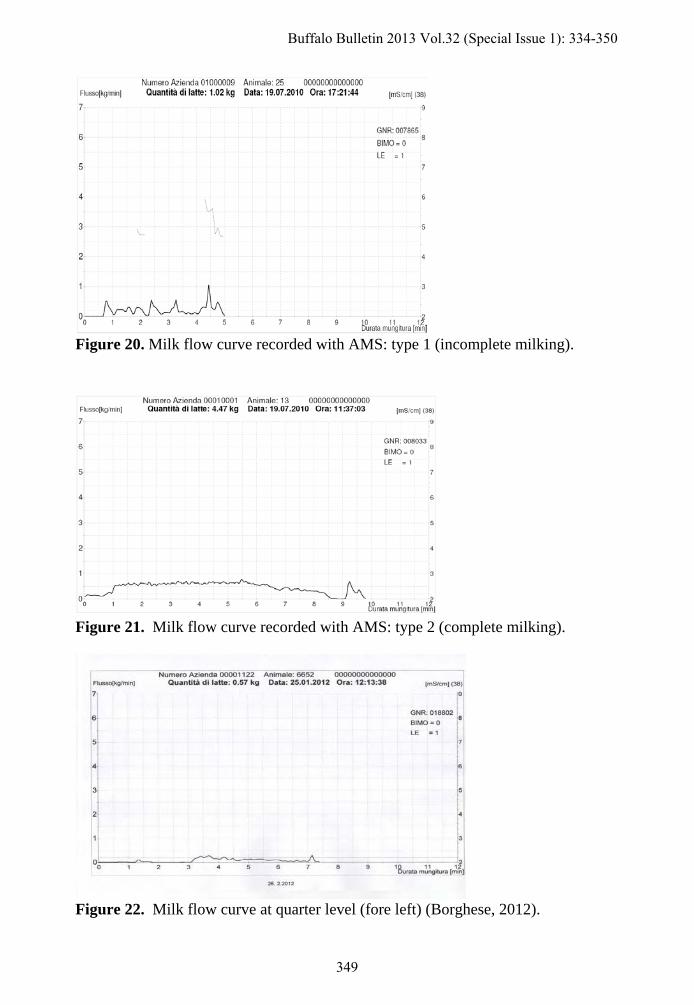
Figure 20. Milk flow curve recorded with AMS: type 1 (incomplete milking).
Figure 21. Milk flow curve recorded with AMS: type 2 (complete milking).
Figure 22. Milk flow curve at quarter level (fore left) (Borghese, 2012).
349
Buffalo Bulletin 2013 Vol.32 (Special Issue 1): 334-350
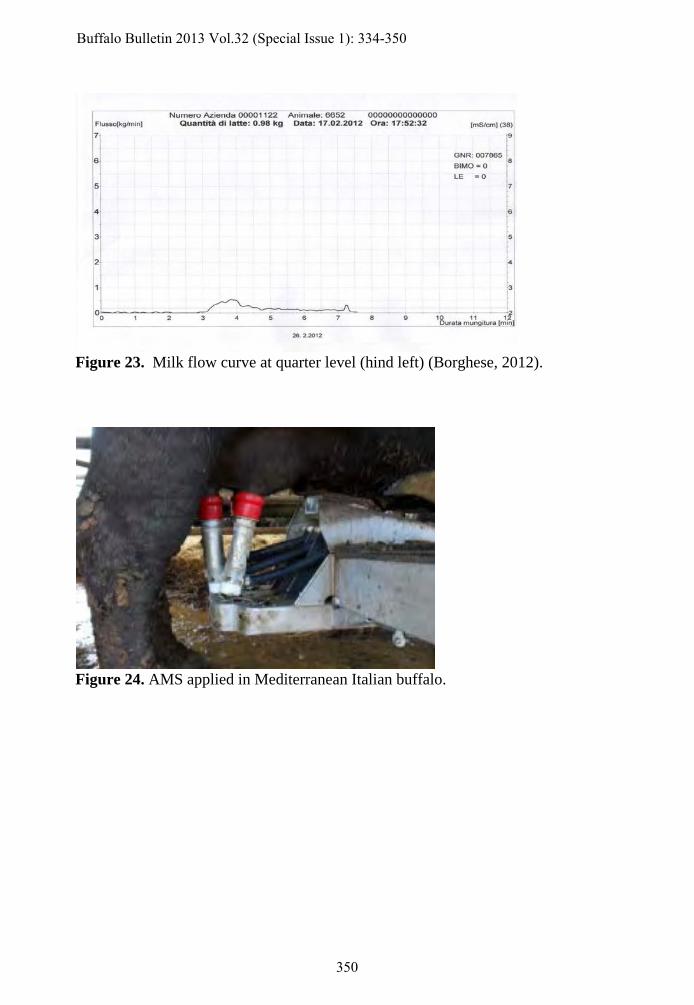
Figure 23. Milk flow curve at quarter level (hind left) (Borghese, 2012).
Figure 24. AMS applied in Mediterranean Italian buffalo.
350
Buffalo Bulletin 2013 Vol.32 (Special Issue 1): 334-350