remote sensing and geomorphometry for studying … · mountain topography is the result of highly...
TRANSCRIPT

www.elsevier.com/locate/geomorph
Geomorphology 55 (2003) 345–361
Remote sensing and geomorphometry for studying relief
production in high mountains
Michael P. Bishopa,*, John F. Shroder Jr.a, Jeffrey D. Colbyb
aDepartment of Geography and Geology, University of Nebraska at Omaha, Omaha, NE 68182, USAbDepartment of Geography, East Carolina University, Greenville, NC 27858, USA
Received 20 October 2001; received in revised form 28 May 2002; accepted 10 March 2003
Abstract
Mountain topography is the result of highly scale-dependent interactions involving climatic, tectonic, and surface processes.
No complete understanding of the geodynamics of mountain building and topographic evolution yet exists, although numerous
conceptual and physical models indicate that surficial erosion plays a significant role. Mapping and assessing landforms and
erosion in mountain environments is essential in order to understand landscape denudation and complex feedback mechanisms.
This requires the development and evaluation of new approaches in remote sensing and geomorphometry. The research herein
evaluates the problem of topographic normalization of satellite imagery and demonstrates the use of terrain analysis using a
digital elevation model (DEM) to evaluate the relief structure of the landscape in the western Himalaya. We specifically
evaluated the Cosine-correction and Minnaert-correction methods to reduce spectral variation in imagery caused by the
topography. Semivariogram analyses of the topography were used to examine the relationships between relief and surface
processes. Remote-sensing results indicate that the Minnaert-correction method can be used to reduce the ‘‘topographic effect’’
in satellite imagery for mapping, although extreme radiance values are the result of not accounting for the diffuse-skylight and
adjacent-terrain irradiance. Geomorphometry results indicate that river incision and glaciation can generate extreme relief,
although the greatest mesoscale relief is produced by glaciation at high altitudes. At intermediate altitudes, warm-based
glaciation was found to decrease relief. Our results indicate that glaciation can have a differential influence on the relief
structure of the landscape. Collectively, our results indicate that scale-dependent analysis of the topography is required to
address radiation transfer issues and the polygenetic nature of landscape denudation and relief production.
D 2003 Elsevier B.V. All rights reserved.
Keywords: Remote sensing; Geomorphometry; Relief production
1. Introduction
Globally significant interactions between climate,
surface processes, and tectonics have recently been
proposed to explain climate change and mountain buil-
ding (Molnar and England, 1990; Raymo and Ruddi-
0169-555X/03/$ - see front matter D 2003 Elsevier B.V. All rights reserv
doi:10.1016/S0169-555X(03)00149-1
* Corresponding author.
E-mail address: [email protected] (M.P. Bishop).
man, 1992; Avouac and Burov, 1996). This hypothesis
suggests that enhanced glaciation should result in
increased erosion, uplift and relief production. Numer-
ous studies have examined mountain topography to
understand the influence of surface processes on relief
production (e.g., Burbank et al., 1996; Brozovik et al.,
1997; Bishop and Shroder, 2000; Bishop et al., 2002;
Brocklehurst, 2002; Finlayson et al., 2002), although
the influence of glaciation on the relief structure of the
ed.

Fig. 1. SPOT 3 ortho-rectified NIR image of Nanga Parbat, in
Northern Pakistan. The Indus and Astor Rivers are located in the
NW and NE portions of the image respectively. The knife-edged
Nanga Parbat ridge is oriented in a NE–SW direction and is visible
in the lower part of the image.
M.P. Bishop et al. / Geomorphology 55 (2003) 345–361346
landscape is complex and not always accounted for in
conceptual models and numerical simulations.
Understanding the differential influence of glacia-
tion on relief production will require research to
address the issues of polygenetic topographic evolu-
tion, identifying and mapping the operational scale of
surface processes, identifying and mapping the opera-
tional scale at which landscape denudation affects the
macroscale tectonic influx of mass (Bishop and
Shroder, 2000; Bishop et al., 2002), and developing
and evaluating new parameterizations for erosion
modeling. Some of these issues can be investigated
using satellite imagery and digital elevation models
(DEMs), as valuable spatial and temporal information
can be extracted. Producing reliable geomorphologi-
cal information from satellite data, however, is diffi-
cult because numerous environmental factors such as
the atmosphere, topography, and land cover control
the irradiant and radiant flux. Other factors such as
solar and sensor geometry must also be taken into
consideration, such that the magnitude of the surface-
radiant flux varies in all directions (anisotropic reflec-
tance). Consequently, satellite imagery must be radio-
metrically calibrated to account for these factors so
that variations in image radiance are representative of
biophysical variations of the landscape. An opera-
tional solution to this problem has yet to materialize
(Bishop and Colby, 2002).
Analysis of the topography, however, is increas-
ingly being used to study surface processes and
erosion due to the availability of DEMs from remote
sensing. Geoscientists routinely examine the first-
order statistical nature of the topography to study relief
production. The nature of the problem, however,
requires that ‘‘issues of scale’’ be accounted for when
characterizing geomorphometric properties and con-
ducting spatial analysis (Shroder and Bishop, 1998;
Bishop and Shroder, 2000). Furthermore, an important
goal is to accurately characterize the organization of
the topography in relation to erosion and internal
forcings so that statistical metrics/indices or model
parameters can be calibrated with measured erosion
rates (Howard, 1996). Consequently, new spatial anal-
ysis procedures and models need to be developed and
evaluated (Small, 1999; Bishop and Shroder, 2000).
The purpose of this research was to examine
various issues associated with information extraction
from satellite imagery and DEMs. We evaluate radio-
metric calibration procedures and analysis of the top-
ography at Nanga Parbat, in northern Pakistan, to
better understand radiation–transfer processes and
relief production. Specifically, our objectives were to
(i) compare the Cosine- and Minnaert-correction
models for radiometric calibration of satellite imagery;
and (ii) examine the mesocale relief structure of the
landscape on the north side of Nanga Parbat.
2. Study area
The Nanga Parbat summit (8125 m) is part of a
knife-edged ridge that extends in a NE–SW direction
(Fig. 1). Structurally, the Nanga Parbat massif occurs
within transpressive shear zones that are spatially and
temporally linked with youthful granite plutonism.
M.P. Bishop et al. / Geomorphology 55 (2003) 345–361 347
The NW Raikot and SE Stak fault shear zones define a
crustal-scale, antiformal pop-up structure that resem-
bles an asymmetrically upward moving, cork-like plug
that began f 12–10 Ma (Schneider et al., 1999).
Shroder and Bishop (2000) noted that the initial
denudation cascade at Nanga Parbat probably began
f 11 Ma when the Indus River was captured from its
west-flowing position on Kohistan rocks overlying
Nanga Parbat gneisses and diverted abruptly south
across what is now the north and west sides of the
massif. This time is also approximately coincident with
possible structural disturbance of the drainage and the
onset of the first monsoonal precipitation in the region,
which suggest further causation for the capture. Sub-
sequently from the late Miocene to early–middle Pleis-
tocene, the accelerated erosion of the Nanga Parbat
region has left little record of the processes involved.
The development of glacial and fluvial drainages
that dominate the Nanga Parbat massif is the result of
complex geologic evolution reflecting a sequence of
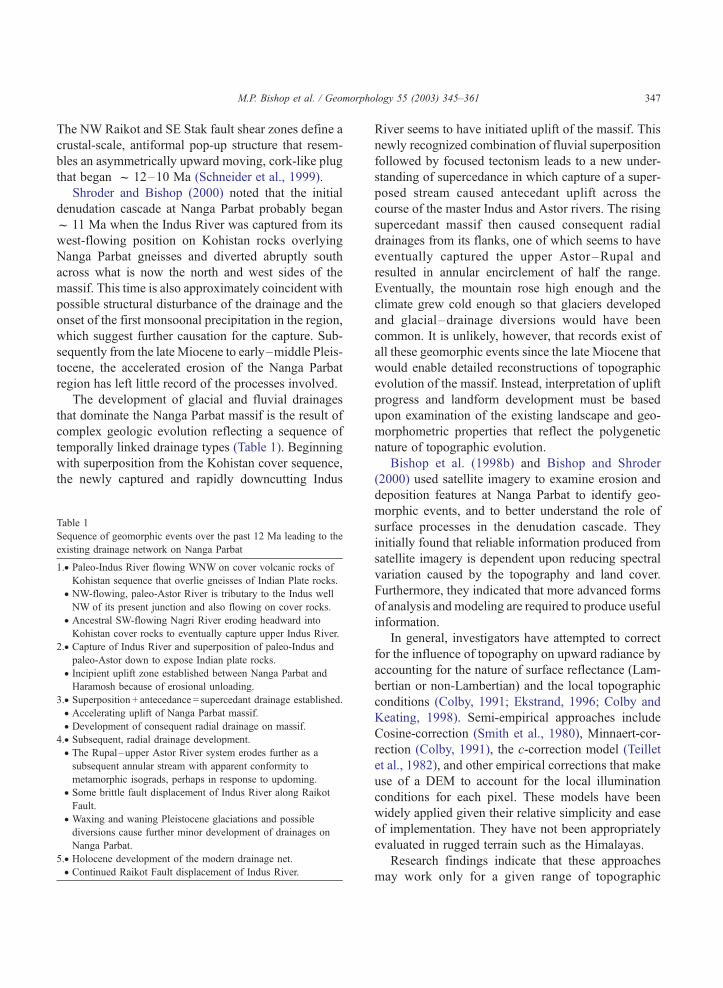
temporally linked drainage types (Table 1). Beginning
with superposition from the Kohistan cover sequence,
the newly captured and rapidly downcutting Indus
Table 1
Sequence of geomorphic events over the past 12 Ma leading to the
existing drainage network on Nanga Parbat
1.. Paleo-Indus River flowing WNW on cover volcanic rocks of
Kohistan sequence that overlie gneisses of Indian Plate rocks.
. NW-flowing, paleo-Astor River is tributary to the Indus well
NW of its present junction and also flowing on cover rocks.
. Ancestral SW-flowing Nagri River eroding headward into
Kohistan cover rocks to eventually capture upper Indus River.
2.. Capture of Indus River and superposition of paleo-Indus and
paleo-Astor down to expose Indian plate rocks.
. Incipient uplift zone established between Nanga Parbat and
Haramosh because of erosional unloading.
3.. Superposition + antecedance = supercedant drainage established.
. Accelerating uplift of Nanga Parbat massif.
. Development of consequent radial drainage on massif.
4.. Subsequent, radial drainage development.
. The Rupal–upper Astor River system erodes further as a
subsequent annular stream with apparent conformity to
metamorphic isograds, perhaps in response to updoming.
. Some brittle fault displacement of Indus River along Raikot
Fault.
. Waxing and waning Pleistocene glaciations and possible
diversions cause further minor development of drainages on
Nanga Parbat.
5.. Holocene development of the modern drainage net.
. Continued Raikot Fault displacement of Indus River.
River seems to have initiated uplift of the massif. This
newly recognized combination of fluvial superposition
followed by focused tectonism leads to a new under-
standing of supercedance in which capture of a super-
posed stream caused antecedant uplift across the
course of the master Indus and Astor rivers. The rising
supercedant massif then caused consequent radial
drainages from its flanks, one of which seems to have
eventually captured the upper Astor –Rupal and
resulted in annular encirclement of half the range.
Eventually, the mountain rose high enough and the
climate grew cold enough so that glaciers developed
and glacial–drainage diversions would have been
common. It is unlikely, however, that records exist of
all these geomorphic events since the late Miocene that
would enable detailed reconstructions of topographic
evolution of the massif. Instead, interpretation of uplift
progress and landform development must be based
upon examination of the existing landscape and geo-
morphometric properties that reflect the polygenetic
nature of topographic evolution.
Bishop et al. (1998b) and Bishop and Shroder
(2000) used satellite imagery to examine erosion and
deposition features at Nanga Parbat to identify geo-
morphic events, and to better understand the role of
surface processes in the denudation cascade. They
initially found that reliable information produced from
satellite imagery is dependent upon reducing spectral
variation caused by the topography and land cover.
Furthermore, they indicated that more advanced forms
of analysis and modeling are required to produce useful
information.
In general, investigators have attempted to correct
for the influence of topography on upward radiance by
accounting for the nature of surface reflectance (Lam-
bertian or non-Lambertian) and the local topographic
conditions (Colby, 1991; Ekstrand, 1996; Colby and
Keating, 1998). Semi-empirical approaches include
Cosine-correction (Smith et al., 1980), Minnaert-cor-
rection (Colby, 1991), the c-correction model (Teillet
et al., 1982), and other empirical corrections that make
use of a DEM to account for the local illumination
conditions for each pixel. These models have been
widely applied given their relative simplicity and ease
of implementation. They have not been appropriately
evaluated in rugged terrain such as the Himalayas.
Research findings indicate that these approaches
may work only for a given range of topographic

Fig. 2. SPOT 3 ortho-rectified NIR image depicting sample locations
for scatterplots and two-dimensional semivariogram analysis. Each
sample location represents a 100� 100 pixel area of relatively
homogeneous land cover.
Fig. 3. SPOT 3 ortho-rectified panchromatic image of the digital
elevation model subarea that was used for analysis of the
topography.
M.P. Bishop et al. / Geomorphology 55 (2003) 345–361348
conditions (Smith et al., 1980; Richter, 1997). The
Cosine- and Minnaert-correction procedures are fre-
quently used and Bishop et al. (1998a) found that the
Minneart-correction procedure has the potential to be
used to study the problem, provided that issues asso-
ciated with computation and topography are addressed.
Topographic analysis of the Nanga Parbat massif
has been conducted to characterize the hypsometry,
slope distributions, and first-order relief. Burbank et al.
(1996) concluded that landsliding was primarily re-
sponsible for the relief production in the western
Himalaya, while Brozovik et al. (1997) concluded that
glaciation limits the production of relief there. Subse-
quent analyses by Bishop and Shroder (2000) and
Bishop et al. (2002) indicated that glaciation has had
a significant influence on the landscape and that
glaciation plays a significant role in relief production
in the Nanga Parbat Himalaya.
3. Methodology
3.1. Digital elevation model
A SPOT 3 panchromatic stereo-pair was acquired
on 27 October 1996 and 28 October 1996. A DEMwas
generated by SPOT Data using the imagery and the

Fig. 4. Normalized SPOT 3 NIR image using the Cosine-correction
method. Extreme radiance values are found throughout the image.
M.P. Bishop et al. / Geomorphology 55 (2003) 345–361 349
stereo-autocorrelation method. Ground control points
were obtained from a 1:50,000 topographic map. This
approach requires the accurate identification of a pixel
in each stereo-pair image that represents the same
ground location. The stereo-autocorrelation method
requires adequate spectral variation to enable correla-
tion and registration of pixels. Sensor radiometric
resolution and highly reflective features such as snow
and ice can cause spectral saturation in images, and
cast shadows can also cause a significant reduction in
spectral variation thereby causing correlation failure.
Topographic map coverage was used to construct the
topography at the summit where spectral saturation did
occur. This area was extremely small and was not
included in our topographic analysis for assessing
relief. The ground control points were used to ensure
quality control. The resulting DEM exhibited a meas-
urement resolution of 20 m with a vertical accuracy of
F 8–12 m.
3.2. Image preprocessing
Satellite imagery in mountainous terrain must be
geometrically and radiometrically calibrated to account
for geometric error, sensor system effects, and relief
displacement (Chavez, 1996; Bishop et al., 1998a).
SPOT 3 multispectral data were ortho-rectified using
the DEM. SPOT Data produced an ortho-rectified
panchromatic image for the Nanga Parbat area using
map control [1:50,000 German topographic map by
Finsterwalder, 1936]. The multispectral imagery were
rectified using control points that could easily be iden-
tified in the multispectral imagery and ortho-rectified
panchromatic imagery. The total root mean squared
error was 5.0 m, based on the use of 20 control points.
The satellite imagery were radiometrically cali-
brated using SPOT’s calibration coefficients. Radio-
Table 2
Summary statistics for SPOT 3 NIR image and normalized NIR imagery
Image Min Max Me
SPOT 3 NIR 17.73 300.24 853
Cosine correction 19.70 2.48� 107 1
Minnaert correctiona 18.69 50879
Minnaert correctionb 17.95 26399
a Globally computed k.b Land-cover computed ks.
metric calibration was achieved using the following
equation:
LE ¼ DNE
aE; ð1Þ
where LE is the radiance in W m� 2 sr� 1 Am� 1, DN
represents the digital number (0–255), and aE repre-
sents SPOT’s absolute calibration coefficient. Atmos-
dian Mean S.D. Range
93 120.95 62.51 282.51
18.82 401.18 55958.03 2.48� 107
90.42 128.64 144.66 50860.31
78.22 123.19 86.62 26381.05

M.P. Bishop et al. / Geomorphology 55 (2003) 345–361350
pheric correction procedures were not applied to
correct for the additive path-radiance component,
given the high altitude of the study area.
3.3. Anisotropic-reflectance correction
The extreme relief and complex topography at
Nanga Parbat produces high and low, spatial–fre-
quency, spectral variation in satellite images. We eval-
uated the Cosine-correction method, which assumes
that surface reflectance is isotropic (reflectance is equal
in all directions). Research indicates that this assump-
tion is not valid in mountain terrain as the topography
and land cover cause anisotropic reflectance (magni-
tude of radiance varies with direction) (Smith et al.,
1980; Hugli and Frei, 1983). This procedure accounts
for the local topographic conditions that influence the
direct solar irradiance. It is based upon the use of the
cosine of the incidence angle (i), which is proportional
to the direct solar irradiance such that
cosi ¼ coshs cosbt þ sinhs sinbt cosð/t � /sÞ ð2Þ
where hs is the solar zenith angle, bt is the slope angle
of the terrain,/s is the solar azimuth angle, and/t is the
Fig. 5. Scatterplot of normalized (Cosine-correction method) NIR radiance
and produces extreme radiance values where steep slopes angles reduce t
slope aspect angle of the terrain. The Cosine-correction
method is computed as
LnE ¼ LE
cosið3Þ
where LEn represents normalized radiance resulting
from the correction procedure, and LE represents the
radiance values from Eq. (1). This method has been
found to be useful, given high solar elevation angles and
low slope angles (Smith et al., 1980; Ekstrand, 1996).
We also evaluated the Minnaert-correction proce-
dure using two different implementations. This pro-
cedure was implemented using the general backwards
radiance-correction procedure described by Colby
(1991):
LnE ¼ ðLEcoseÞ=ðcosk i coskeÞ ð4Þ
where e is the excitant angle (e = bt) and k is the
Minnaert constant that ranges from 0.0–1.0. The
coefficient is not a true constant, but attempts to
characterize the departure of reflectance from that of
a Lambertian surface (i.e., isotropic reflectance). A k
value of 1 indicates isotropic reflectance. A lower
coefficient represents departure from isotropic reflec-
and cos i for sample location 2 in Fig. 2. The method ‘‘overcorrects’’
he direct solar irradiance.

Fig. 6. Normalized SPOT 3 NIR image using the Minnaert-
correction method (globally computed k). Spectral variance visually
appears to be reduced, however, extreme radiance values are found
at the base of steep slopes.
M.P. Bishop et al. / Geomorphology 55 (2003) 345–361 351
tance and represents the degree of anistrophy. It is also
important to note that k is wavelength-dependent. The
Minnaert constant was calculated using least-squares
regression on the variables x and y, where x = log(cos i
cos e) and y = log(LEcos e). The slope of the regression
equation represents k.
One way to evaluate the Minnaert-correction pro-
cedure is to compute a global k value for an image.
This approach assumes that the anisotropic nature of
reflectance is homogeneous over the study area. This
assumption is known to be invalid as topographic and
land-cover variation will cause k to vary spatially, such
that a global value may not produce spatially consis-
tent normalization results. Numerous investigators,
however, have indicated that this approach can reduce
the ‘‘topographic effect’’ in satellite imagery.
It is reasonable to assume that land cover exhibits a
strong influence on anisotropic reflectance such that k
should be computed for land-cover classes. To test this,
an image segmentation approach was investigated.
The fundamental land-cover structure within the scene
was produced using NIR image thresholding and the
ISODATA clustering algorithm on a NIR/RED ratio
image. This resulted in a land-cover map (three clas-
ses) for Nanga Parbat.
Snow, vegetation, and nonvegetation features were
easily mapped as these land-cover classes are known to
exhibit different anisotropic-reflectance characteristics
(Hugli and Frei, 1983). The purpose of the classifica-
tion is not to accurately map these features, but to
segment the image into regions so that three k values
can be computed that characterize the influence of land
cover on anisotropic reflectance.
We tested these procedures on the near-infrared
image because the influence of topography on the
direct irradiance is evident (Fig. 1). We also performed
two-dimensional semivariogram analysis on several
100� 100 pixel subsections to compare the spectral
variance of original and normalized imagery (Fig. 2).
The locations for testing were selected on the basis of
homogeneous land cover. Effective topographic nor-
malization should result in decreased spectral variance
(lower semivariance values).
3.4. Topographic analysis
The 7 km of vertical relief of the Nanga Parbat
massif produces exceptionally strong orographic and
gravitative energy gradients that are responsible for
much geomorphic work by the different processes. We
differentiate five geomorphic-process zones on the
northern slopes of Nanga Parbat that reflect temporal
and spatial differences in lithology, structure, and
process: (i) a lowermost zone of fault scarps and river
incision; (ii) a zone of past glacial erosion and deposi-
tion; (iii) a lower zone of superimposed past and
modern-day warm-based ice; (iv) an upper zone of
superimposed past and modern-day, warm-based ice;
and (v) a high-altitude zone of glacier erosion (equili-
brium line altitude (ELA)/paleoELA-based), cold-
based ice.
We systematically sampled these zones on the north
side of Nanga Parbat (Fig. 3). We specifically limited
the extent of the DEM subarea in the east–west
direction so that statistical characterization along a
north–south profile might show variations related to

M.P. Bishop et al. / Geomorphology 55 (2003) 345–361352
surface processes and erosion with altitude. In order to
conduct one- and two-dimensional analyses of the
relief along this profile, each zone was of equal size
(f 10� 4 km).
Relief statistics were calculated for east–west
swaths across the DEM subarea over a 10-km distance.
This equates to calculating statistics for altitude for
every row of our DEM subarea, using every column of
that row. This analysis enables the production of an
aggregate north–south profile where we examine how
the relief varies as a function of surface processes.
Similarly, we examined the scale-dependent char-
acteristics of the topography in relation to surface
processes. We conducted one-dimensional semivario-
gram analysis of each row, where the average semi-
variance (S̄2) is computed as follows:
S̄2ðhÞ ¼ 1
2mXm
i¼1
ðzi � ziþhÞ2 ð5Þ
where z is the altitude from a single grid cell, h
represents the sampling lag distance, and m is the
number of sampled pairs per lag. This analysis resulted
in the production of a semivariogram for each row of
the DEM subarea. By selecting a particular lag dis-
tance, a north–south profile of the semivariance can be
examined.
Fig. 7. Scatterplot of normalized NIR radiance (Minnaert-correction metho
The method ‘‘overcorrects’’ and produces relatively high radiance values.
We recognize that this approach characterizes the
relief in an east–west direction, and that two-dimen-
sional analysis is required to accurately characterize
the topography. Results from summary statistics
clearly depicted erosion–process zones. Consequent-
ly, we conducted two-dimensional semivariogram
analysis for each zone, where every grid cell was
compared to every other grid cell within each zone.
Within an nx� ny grid there will be N point pairs,
where N =nx2(ny
2� 1)/2. The variance component
is Dz=(z1� z2)2,and the horizontal distance is Dx=
[(x1� x2)2+( y1� y2)
2]0.5. The variance was summed
over a binned horizontal distance interval (20 m) and
divided by the number of observations within each bin
to calculate the average semivariance (S̄2).
Our spatial analysis on the north side of Nanga
Parbat is not spatially constrained to the Raikot basin.
Basin analysis is a very popular approach that can be
used to assess relief characteristics. From a geophys-
ical perspective, however, we know that the influence
of denudational unloading on tectonic uplift at Nanga
Parbat is not spatially constrained at the basin scale
and that fluctuations in the influx of mass are depend-
ent upon denudational unloading at the regional
scale, which may be spatially constrained by the
Raikot and Stak faults (Zeitler et al., 2001a,b). There-
d and globally computed k) and cos i for sample location 3 in Fig. 2.

M.P. Bishop et al. / Geomorphology 55 (2003) 345–361 353
fore, scale-dependent relief characteristics may be
used to assess surface processes and provide a frame-
work for estimating erosion rates (Bishop and Shroder,
2000).
Fig. 8. Semivariograms from sample location 1 in Fig. 2 depicting
the spectral variance in the original NIR image (NIR), Minnaert-
corrected NIR image using a globally computed k (MC1k), and
Minnaert-corrected NIR image using land cover-computed k’s
(MC3k). A greater reduction in the ‘‘topographic effect’’ results
from using multiple k values.
4. Results
4.1. Anisotropic-reflectance correction
Statistical analysis of the original and normalized
imagery indicated that the correction methods did not
produce acceptable results for all pixels (Table 2).
Radiance values were frequently high and not repre-
sentative of the land-cover classes. This ‘‘overcorrec-
tion’’ (extreme radiance values) resulted in an increase
in spectral variance in the normalized imagery.
The Cosine-correction method did not effectively
normalize the SPOT NIR image (Fig. 4). Extreme
radiance values exist where steep slopes reduce the
magnitude of the direct irradiance, such that the
magnitude of cos i values do not accurately estimate
the magnitude of the irradiance at the surface. This is
demonstrated in Fig. 5, where we sampled a homoge-
neous land-cover class (snow) and plotted the relation-
ship between normalized radiance and cos i. The
nonlinear relationship is the result of steep slopes that
receive additional irradiance from the diffuse-skylight
and adjacent-terrain irradiance components.
Results from the Minnaert-correction method (glo-
bally computed k) yielded a Minnaert constant and r2
value of 0.5234 and 0.123, respectively. Statistical
analysis and visual interpretation indicated that the
influence of topography was reduced, although high
radiance values were found at the base of steep slopes
(Fig. 6). Similar to Cosine-correction results, we found
a nonlinear relationship between normalized radiance
values and cos i (Fig. 7). Semivariogram analysis
revealed that the local spectral variance was dramati-
cally reduced over snow-covered portions of the land-
scape (Fig. 8), even though the k value does not
uniquely characterize the influence of snow/firn and
topography on surface radiance (low r2). These results
indicate that a globally derived Minnaert constant does
not characterize the relationship between topography,
land cover and surface radiance in complex scenes
exhibiting multiple land-cover classes. It does, how-
ever, demonstrate the potential of the method if multi-
ple Minnaert constants can be computed with high r2
values.
Results from the Minnaert-correction method
(land-cover computed k’s) indicated that it is possible
to produce multiple k values that reasonably character-
ize the influence of land cover and topography on
reflectance (Table 3). The normalized image is visu-
ally similar to Fig. 6, however, this implementation
reduced spectral variance better than the other meth-
ods over the entire image (Table 2) and for homoge-
neous land-cover classes (Fig. 8). The decrease in
semivariance represents a decrease in spectral varia-
tion caused by the topography.

Table 3
Results of land-cover stratified regression analysis
Class k r2 n
Nonvegetation 0.4052 0.4081 1266086
Vegetation 0.4437 0.5182 418362
Snow/firn 0.4840 0.5757 958465
M.P. Bishop et al. / Geomorphology 55 (2003) 345–361354
4.2. Topographic relief
Swath profile analysis revealed the extreme relief
on the northern side of Nanga Parbat (Fig. 9). In
general, the altitude systematically increases towards
the south, although three distinct altitude trends can be
identified based upon the average rate of change in
altitude. These trends represent (i) the lower altitude
Raikot fault zone, which exhibits steep slopes and V-
shaped valleys transverse to the fault; (ii) intermediate
altitudes where past and modern, warm-based glacier
erosion and deposition has significantly altered the
landscape; and (iii) an upper region where cold-based
and protective glaciation dominates.
The relief profile provides additional insight into
the nature of surface processes that erode the land-
scape (Fig. 10). In the Raikot Fault zone (0–5 km
profile range), rapid river incision produced deep
gorges that exhibit strath terraces caused by rapid river
Fig. 9. Swath profile of the altitude on t
incision. The relief in this area systematically increases
to a maximum of f 2600 m at the southernmost
boundary of the fault zone. The maximum relief then
decreases, as the influence of past glaciation alters the
topography.
This rapid decrease in relief is associated with a
monsoon-driven glacial event that occurred approxi-
mately 65 K year� 1 (Phillips et al., 2000). At this time,
glaciation covered most of the landscape. Farther along
the profile at intermediate altitudes, the collective in-
fluence of glaciation accounts for the relatively low
maximum relief conditions (f 1800 m). Farther south
at higher altitudes, the maximum relief systematically
increases, indicating the erosive nature of temperate al-
pine glaciers. At a profile distance of f 17 and 24 km,
deep glacier valley erosion is associated with f 3.1
and 3.4 km of relief, respectively. The decrease in relief
portrayed in Fig. 10 at a profile distance of f 20–23
km is the result of the orientation of transects with
respect to the orientation of the knife-edge ridge (i.e.,
orientations of the transects and the ridge are nearly
equivalent, so that the relief decreases).
Examination of the variation in altitude along the
profile also characterizes the role of past and modern
glaciation on the landscape hypsometry (Fig. 11). An
increase in variability in altitude would be expected
he northern side of Nanga Parbat.

Fig. 10. Swath profile of the relief on the northern side of Nanga Parbat. The decrease in relief at f 20–23 km is the result of the sampling
design, such that the metric does not effectively characterize relief for comparison purposes.
M.P. Bishop et al. / Geomorphology 55 (2003) 345–361 355
where active river incision and recent uplift produce
steep slopes and extreme relief. As the current influ-
ence of these processes decrease to the south along the
Fig. 11. Swath profile of the variability of altitude on the northern side of N
result of the sampling design, such that the metric does not effectively ch
profile, and the landscape begins to record the influence
of past glaciations, we see a sharp decrease in varia-
bility. The start of this decline coincides exactly where
anga Parbat. The decrease in the variability at f 20–23 km is the
aracterize variability for comparison purposes.

Fig. 13. Semivariograms for different surface process zones on the northern side of Nanga Parbat. Each semivariogram was computed by
comparing the altitude of every pixel in a zone. Zone 1 is a lowermost zone of fault scarps and river incision. Zone 2 represents a zone of past
glacial erosion and deposition. Zone 3 is the lowermost zone of superimposed past and modern-day warm-based ice. Zone 4 is the uppermost
zone of superimposed past and modern-day warm-based ice. Zone 5 represents the high altitude zone of glacier erosion (ELA/paleoELA-based),
cold-based ice.
Fig. 12. Swath profile of the semivariance at two lag distances on the northern side of Nanga Parbat. The decrease in semivariance at f 23 km
is the result of the sampling design, such that the metric does not effectively characterize relief for comparison purposes.
M.P. Bishop et al. / Geomorphology 55 (2003) 345–361356

M.P. Bishop et al. / Geomorphology 55 (2003) 345–361 357
the Bezar Gali glacial erosion surface occurs. Further-
more, as modern glacial processes leave an imprint on
the topography, the variability along the profile
increases, such that a local variability maximum is
associated with the location of modern-day alpine
glaciers. These results initially suggest that glaciation
plays an important role in mesocale relief production.
It is problematic to make conclusions based upon
the use of first-order statistics that do not account for
the scale-dependent nature of relief. One-dimensional
semivariogram analysis revealed that at lag distances
Fig. 14. SPOT 3 false-color composite image draped over the digital elevat
at Nanga Parbat. The Raikot basin is in the center of the scene. Vertical exa
leveling of the topography by glaciation at intermediate altitudes.
V 1 km, the maximum relief on the landscape is
associated with active river incision in the Raikot
fault zone and at the highest altitudes where tectonic
uplift and multiple glaciations are responsible for
extreme relief (Fig. 12). At intermediate altitudes, a
systematic decrease inffiffiffiffiffiS2
pvalues (relief) is caused
by glacier erosion and redistribution of sediment. This
result suggests that as modern glaciation dominates
the landscape at intermediate altitudes, glacial pro-
cesses operating at this scale do not produce extreme
relief. We might expect this result as river incision
ion model. The 3-D perspective view is from the north looking south
ggeration is 2� to visually enhance mesoscale relief and display the

M.P. Bishop et al. / Geomorphology 55 (2003) 345–361358
operates at a very different scale compared to glaci-
ation on the north side of Nanga Parbat. Warm-based
glaciers are known to be an effective erosion agent;
therefore, if they are capable of producing extreme
relief, we must examine altitude differences at greater
distances that represent the operational scale of glacier
erosion.
Results of semivariogram analysis for lag distances
z 2.5 km indicated that glaciation can produce com-
parable, if not greater mesoscale relief than processes
of river incision and slope-failure (Fig. 12; 3.6-km lag
distance is most representative of extreme relief).
Periodic fluctuations inffiffiffiffiffiS2
pvalues at 3.6 km lag
distance reflect the overprinting of glacial events along
the profile caused by glaciation at intermediate and
high altitudes. The localized maximum peaks offfiffiffiffiffiS2
p
values at the profile distances of f 14 and 17 km (Fig.
12) are approximately associated with the ELA zones
of the Buldar and Raikot glaciers, respectively. The
maximum relief, at a profile distance of 24 km, is the
result of glacier erosion at lower altitudes closer to the
ELA zones on both sides of the main Nanga Parbat
ridge. If we take into consideration the depth of glacier
ice in the ELA zones, the relief is greater than what our
analysis of topography presents.
We compare these results to two-dimensional anal-
ysis before making conclusions. In the tectonically
active Raikot Fault zone, surface processes are actively
adjusting to tectonic forcing (Bishop et al., 2002),
producing a considerable amount of relief in zone 1
(Fig. 13). At intermediate altitudes (zones 2–4),ffiffiffiffiffiS2
p
values generally decrease at all lag distances. Zone 5
exhibits the greatestffiffiffiffiffiS2
pvalues at all lag distances.
These results suggest that the product of glaciation at
intermediate altitudes is one of decreasing relief and an
overall leveling of the landscape. This can be clearly
seen in the middle of Fig. 14.
5. Discussion
Geoscientists have predominantly used qualitative
methods to extract geomorphological information
from satellite imagery. Scientific visualization techni-
ques can be used to examine two- and three-dimen-
sional perspectives, thus providing important spatial
information about geomorphic features and events
(e.g., high-altitude erosion surfaces, glaciers, lacus-
trine deposits, catastrophic floods) and the topography.
Quantitative information about surficial materials and
landforms is difficult to obtain due to complex radia-
tion transfer processes involving the atmosphere and
topography.
Our radiometric calibration results indicate that it is
possible to significantly reduce the spectral variation in
imagery using the Minnaert-correction method, al-
though numerous issues remain. Our simplistic proce-
dure of image-segmentation to generate accurate k
values is problematic because it initially requires
land-cover information. Colby (1991) indicated that
locally computed k’s may have value in reducing the
‘‘topographic effect’’ by accounting for local land-
cover conditions.
Our results also indicate that the calibration prob-
lem is not limited to the computation of accurate k
values. Extreme radiance values are the result of
inadequate modeling of the irradiance as cos i does
not account for cast shadows and the diffuse-skylight
and adjacent-terrain irradiance. These radiation trans-
fer processes are highly scale-dependent and hemi-
spherical topographic analysis is required to account
for their varying influence over the landscape. Con-
sequently, this semi-empirical radiation transfer model
requires additional topographic parameters to account
for complex atmosphere–topography, radiation inter-
actions. The development of improved radiation–
transfer models will be valuable in remote sensing
and geomorphology studies, and will enable the
investigation of the spatial distribution of climate
forcing on surface processes (e.g., snowmelt, runoff,
ablation) and erosion.
Nanga Parbat has undergone extreme environmen-
tal change over a very short period of geological time
(Shroder and Bishop, 2000; Bishop et al., 2002).
Bishop et al. (2002) have shown that glacial, fluvial
and slope processes all play important roles at different
times, and that they can do so sequentially on the same
portion of the landscape. Investigators have attempted
to characterize the individual roles of river incision and
glaciation in relief production (Burbank et al., 1996;
Brozovik et al., 1997; Whipple and Tucker, 1999;
Brocklehurst, 2002; Finlayson et al., 2002). These
studies and others have provided us with a better
understanding of river incision, glaciation, and modern
process rates. The influence of glaciation on the un-
loading history of the massif, however, is still rela-

M.P. Bishop et al. / Geomorphology 55 (2003) 345–361 359
tively unknown. We know that the major valleys,
including the Indus, have undergone extensive and
periodic glaciation (Shroder et al., 1989). Similarly,
systematic and catastrophic geomorphic events are
also responsible for the denudational unloading.
Therefore, modern-day river or glacier incision rates
alone cannot be applied over millions of years to
characterize denudational unloading at Nanga Parbat.
The influence of glacial erosion on the relief struc-
ture of the landscape is an important question. Our
results for intermediate altitudes concur with Brozovik
et al. (1997), indicating that glaciation can limit relief
up to some altitude near the equilibrium line altitude
(ELA). Our results also indicate that glaciation can
produce greater mesoscale relief than river incision, as
glaciation in concert with uplift is primarily respon-
sible for relief production at high altitudes. Given the
temporal and spatial fluctuations of surface processes
in topographic evolution, it is difficult to precisely
determine the degree to which river incision and alpine
glaciation erode the landscape and produce relief.
At intermediate to higher altitude, deep valley gla-
cier erosion and headwall erosion can effectively
remove rock and sediment, while protective cold-based
ice on the highest peaks permits ridge and peak
formation. Consequently, in high mountain environ-
ments, glaciation directly and indirectly alters the relief
structure of the landscape differently with altitude.
These differences can be attributed to the degree of
temporal overprinting and spatial overlap of glacial
events, such that at intermediate altitudes, the degree of
spatial overlap is less than at high altitudes. More
research into providing a more detailed explanation
of this differential influence of glaciation on topogra-
phy is required.
A challenge will be to develop better approaches
that can be used to relate the properties of topography
to the magnitude of erosion (Howard, 1996; Small,
1999). Currently, there is no widely acceptable method
of such estimation, and scientists would like to use
DEMs to estimate erosion rates provided that geo-
morphometric properties can be calibrated with meas-
ured rates. Our results indicate that the topography
does contain information/patterns that reflect changes
in erosion processes with altitude. We speculate that
calibration will be difficult to achieve without charac-
terizing variations in the topography that represent the
spatial constraints for surface processes. More geo-
morphometry research that addresses the modeling and
analysis of the hierarchical organization of topography
may provide new insights.
To many, it may not appear that radiation transfer
and geomorphometry are related research topics for
understanding relief production. Both, however, are
important for studying surface processes and erosion.
For example, complex radiation transfer processes that
include atmosphere–topography interactions govern
the radiation budget. Radiative forcing directly and
indirectly affects glacial ablation, meltwater produc-
tion, the generation of fluvial and glacial landforms,
and ultimately denudation and relief production. If
erosion models are to accurately simulate topographic
evolution, glacier mass balance and glacial erosion
must be taken into consideration. Currently, the mul-
ti-scale topographic effects on glacier mass balance
are not always considered. Topographic, solar–radia-
tion, transfer models can be used to study radiative
forcing on surface processes. Similarly, solving the
anisotropic-reflectance correction problem will enable
object-oriented landform analysis, such that topo-
graphic information from DEMs can be integrated
with image information to examine the spatial and
contextual relationships between landforms. Such
multidisciplinary research involving remote sensing
science and geomorphology should provide new infor-
mation regarding surface processes, erosion, and relief
production.
6. Conclusions
Remote sensing and geomorphometry provide new
opportunities to study mountain environments and
relief production. Satellite imagery must be radiomet-
rically calibrated to account for atmospheric and topo-
graphic effects. Our results indicate that the ‘‘topo-
graphic effect’’ in satellite imagery can be reduced
using the Minnaert-correction method, although ex-
treme radiance values are the result of the model’s
inability to account for the diffuse-skylight and adja-
cent-terrain irradiance. Additional topographic analy-
sis and parameterizations that characterize complex
atmosphere– topography radiation interactions are
required. Such new parameterizations are needed to
improve information extraction from satellite imagery,
and in geomorphological studies to investigate micro-

M.P. Bishop et al. / Geomorphology 55 (2003) 345–361360
climate, surface runoff, and glacial processes which
influence erosion and relief production.
Our topographic analysis revealed that the relief
structure at Nanga Parbat is spatially variable and
correlated to geomorphic events and dominant surface
processes. River incision and glaciation are both re-
sponsible for relief production at Nanga Parbat, al-
though our results show that glaciation generates the
greatest mesoscale relief at high altitudes. At inter-
mediate altitudes, warm-based glaciation was found to
decrease relief. These results indicate that glaciation
can have a differential influence on the relief structure
of the landscape. More research is required to develop
and formalize a spatio-temporal theory on mountain
topographic organization so that geomorphometric
parameters can be used to estimate erosion rates. This
will require spatial and temporal information acquired
from satellite imagery and DEMs.
Acknowledgements
This work was funded by the University Commit-
tee on Research at the University of Nebraska at
Omaha and the National Science Foundation (grant
no. EAR 9418839 and EPS-9720643).
References
Avouac, J.P., Burov, E.B., 1996. Erosion as a driving mechanism of
intracontinental mountain growth. Journal of Geophysical Re-
search 101, 747–769.
Bishop, M.P., Colby, J.D., 2002. Anisotropic reflectance correction
of SPOT-3 HRV imagery. International Journal of Remote Sens-
ing 23 (10), 219–222.
Bishop, M.P., Shroder Jr., J.F., 2000. Remote sensing and geomor-
phometric assessment of topographic complexity and erosion
dynamics in the Nanga Parbat massif. In: Khan, M.A., Treloar,
P.J., Searle, M.P., Jan, M.Q. (Eds.), Tectonics of the Nanga
Parbat Syntaxis and the Western Himalaya, pp. 181–200.
Bishop, M.P., Shroder Jr., J.F., Hickman, B.L., Copland, L., 1998a.
Scale dependent analysis of satellite imagery for characteriza-
tion of glacier surfaces in the Karakoram Himalaya. Geomor-
phology 21, 217–232.
Bishop, M.P., Shroder Jr., J.F., Sloan, V.F., Copland, L., Colby, J.D.,
1998b. Remote sensing and GIS technology for studying litho-
spheric processes in a mountain environment. Geocarto Interna-
tional 13 (4), 75–87.
Bishop, M.P., Shroder Jr., J.F., Bonk, R., Olsenholler, J., 2002.
Geomorphic change in high mountains: a western Himalayan
perspective. Global and Planetary Change 32, 311–329.
Brocklehurst, S.H., 2002. Glacial erosion and relief production in
the Eastern Sierra Nevada, California. Geomorphology 42,
1–24.
Brozovik, N., Burbank, D.W., Meigs, A.J., 1997. Climatic limits on
landscape development in the northwestern Himalaya. Science
276, 571–574.
Burbank, D., Leland, J., Fielding, E., Anderson, R.S., Brozovik, N.,
Reid, M.R., Duncan, C., 1996. Bedrock incision, rock uplift and
threshold hillslopes in the northwestern Himalaya. Nature 379,
505–510.
Chavez Jr., P.S., 1996. Image-based atmospheric corrections—re-
visited and improved. Photogrammetric Engineering and Re-
mote Sensing 62 (9), 1025–1036.
Colby, J.D., 1991. Topographic normalization in rugged terrain.
Photogrammetric Engineering and Remote Sensing 57 (5),
531–537.
Colby, J.D., Keating, P.L., 1998. Land cover classification using
Landsat TM imagery in the tropical highlands: the influence of
anisotropic reflectance. International Journal of Remote Sensing
19 (8), 1459–1500.
Ekstrand, S., 1996. Landsat TM-based forest damage assessment:
correction for topographic effects. Photogrammetric Engineer-
ing and Remote Sensing 62 (2), 151–161.
Finlayson, D.R., Montgomery, D.R., Hallet, B., 2002. Spatial co-
incidence of rapid inferred erosion with young metamorphic
massifs in the Himalayas. Geology, 219–222.
Finsterwalder, R., 1936. Carte der Nanga Parbat gruppe (1:50,000).
Deutsche Himalaya Expedition 1934.
Howard, A., 1996. The ephemeral mountains. Science 379,
488–489.
Hugli, H., Frei, W., 1983. Understanding anistropic reflectance in
mountainous terrain. Photogrammetric Engineering and Remote
Sensing 49 (5), 671–683.
Molnar, P., England, P., 1990. Late Cenozoic uplift of mountain
ranges and global climate change: chicken or egg? Nature 346,
29–34.
Phillips, W.M., Sloan, V.F., Shroder Jr., J.F., Sharma, P., Clarke,
M.L., Rendell, H.M., 2000. Asynchronous glaciation at Nanga
Parbat, northwestern Himalaya Mountains, Pakistan. Geology
28, 431–434.
Raymo, M.E., Ruddiman, W.F., 1992. Tectonic forcing of the late
Cenozoic climate. Nature 359, 117–122.
Richter, R., 1997. Correction of atmosphere and topographic effects
for high spatial resolution satellite imagery. International Journal
of Remote Sensing 18 (5), 1099–1111.
Schneider, D.A., Edwards, M.A., Kidd, W.S.F., Khan, M.A., Seeber,
L., Zeitler, P.K., 1999. Tectonics of Nanga Parbat, western
Himalaya: synkinematic plutonism within the doubly vergent
shear zones of a crustal-scale pop-up structure. Geology 27,
999–1002.
Shroder Jr., J.F., Bishop, M.P., 1998. Mass movement in the Hima-
laya: new insights and research directions. Geomorphology 26,
13–35.
Shroder Jr., J.F., Bishop, M.P., 2000. Unroofing of the Nanga Parbat
Himalaya. In: Khan, M.A., Treloar, P.J., Searle, M.P., Jan, M.Q.
(Eds.), Tectonics of the Nanga Parbat Syntaxis and the Western
Himalaya, pp. 163–179.

M.P. Bishop et al. / Geomorphology 55 (2003) 345–361 361
Shroder Jr., J.F., Khan, M.A., Lawrence, R.D., Madin, I.P., Hig-
gins, S.E., 1989. Quaternary glacier chronology and neotec-
tonics in the Himalaya of northern Pakistan. In: Malinconico,
L.L., Lillie, R.J. (Eds.), Tectonics of the Western Himalayas.
Special Paper - Geological Society of America, vol. 232,
pp. 275–294.
Small, E., 1999. Does global cooling reduce relief? Nature 401,
31–33.
Smith, J.A., Lin, T.L., Ranson, K.J., 1980. The Lambertian assump-
tion and Landsat data. Photogrammetric Engineering and Re-
mote Sensing 46 (9), 1183–1189.
Teillet, P.M., Guindon, B., Goodenough, D.G., 1982. On the slope-
aspect correction of multi-spectral scanner data. Canadian Jour-
nal of Remote Sensing 8 (2), 733–741.
Whipple, K.X., Tucker, G.E., 1999. Dynamics of the stream-power
river incision model: implications for height limits of mountain
ranges, landscape response timescales, and research needs. Jour-
nal of Geophysical Research 104, 17661–17674.
Zeitler, P.K., Koons, P.O., Bishop, M.P., Chamberlain, C.P., Craw,
D., Edwards, M.A., Hamidullah, S., Jan, M.Q., Khan, M.A.,
Khattak, M.U.K., Kidd, W.S.F., Mackie, R.L., Meltzer, A.S.,
Park, S.K., Pecher, A., Poage, M.A., Sarker, G., Schneider,
D.A., Seeber, L., Shroder Jr., J.F., 2001a. Crustal reworking at
Nanga Parbat, Pakistan: metamorphic consequences of ther-
mal–mechanical coupling facilitated by erosion. Tectonics 20
(5), 712–728.
Zeitler, P.K., Meltzer, A.S., Koons, P.O., Craw, D., Hallet, B., Cham-
berlain, C.P., Kidd, W.S., Park, S.K., Seeber, L., Bishop, M.P.,
Shroder Jr., J.F., 2001b. Erosion, Himalayan geodynamics, and
the geomorphology of metamorphism. GSA Today 11, 4–8.