redbull - instagram report - socialbakers
TRANSCRIPT
Page 1/13
redbullInstagram Profile Report
Dec 21, 2013 - Jan 21, 2014

Page 2/13
redbull Followers Overview Dec 21, 2013 - Jan 21, 2014
Growth of Total Followers
Dec 21
Dec 22
Dec 23
Dec 24
Dec 25
Dec 26
Dec 27
Dec 28
Dec 29
Dec 30
Dec 31
Jan 01
Jan 02
Jan 03
Jan 04
Jan 05
Jan 06
Jan 07
Jan 08
Jan 09
Jan 10
Jan 11
Jan 12
Jan 13
Jan 14
Jan 15
Jan 16
Jan 17
Jan 18
Jan 19
Jan 20
Jan 21
0
500
1000
1500
2000
2500
3000
3500
4000
Total Followers
Dec 21
Dec 22
Dec 23
Dec 24
Dec 25
Dec 26
Dec 27
Dec 28
Dec 29
Dec 30
Dec 31
Jan 01
Jan 02
Jan 03
Jan 04
Jan 05
Jan 06
Jan 07
Jan 08
Jan 09
Jan 10
Jan 11
Jan 12
Jan 13
Jan 14
Jan 15
Jan 16
Jan 17
Jan 18
Jan 19
Jan 20
Jan 21
0
200000
400000
600000
800000
1000000
1200000
Followers Growth Overview
Total Followers Count
1 096 321Followers Change
+57 343Max. Followers Change
+3 583Friday Jan 03, 2014
Avg. Followers Change per Day
1 849,8

Page 3/13
redbull Following Overview Dec 21, 2013 - Jan 21, 2014
Growth of Total Following
Dec 21
Dec 22
Dec 23
Dec 24
Dec 25
Dec 26
Dec 27
Dec 28
Dec 29
Dec 30
Dec 31
Jan 01
Jan 02
Jan 03
Jan 04
Jan 05
Jan 06
Jan 07
Jan 08
Jan 09
Jan 10
Jan 11
Jan 12
Jan 13
Jan 14
Jan 15
Jan 16
Jan 17
Jan 18
Jan 19
Jan 20
Jan 21
-2
-1
0
1
2
3
4
5
6
Total Following
Dec 21
Dec 22
Dec 23
Dec 24
Dec 25
Dec 26
Dec 27
Dec 28
Dec 29
Dec 30
Dec 31
Jan 01
Jan 02
Jan 03
Jan 04
Jan 05
Jan 06
Jan 07
Jan 08
Jan 09
Jan 10
Jan 11
Jan 12
Jan 13
Jan 14
Jan 15
Jan 16
Jan 17
Jan 18
Jan 19
Jan 20
Jan 21
0100020003000400050006000700080009000
Following Growth Overview
Total Following Count
8 488Following Change
+30Max. Following Change
+5Friday Jan 10, 2014
Avg. Following Change per Day
1,0

Page 4/13
redbull Post Interactions Dec 21, 2013 - Jan 21, 2014
Number of Posts by Day
Dec 21
Dec 22
Dec 23
Dec 24
Dec 25
Dec 26
Dec 27
Dec 28
Dec 29
Dec 30
Dec 31
Jan 01
Jan 02
Jan 03
Jan 04
Jan 05
Jan 06
Jan 07
Jan 08
Jan 09
Jan 10
Jan 11
Jan 12
Jan 13
Jan 14
Jan 15
Jan 16
Jan 17
Jan 18
Jan 19
Jan 20
Jan 21
00.5
11.5
22.5
33.5
44.5Photo Video
Daily Interactions
Dec 21
Dec 22
Dec 23
Dec 24
Dec 25
Dec 26
Dec 27
Dec 28
Dec 29
Dec 30
Dec 31
Jan 01
Jan 02
Jan 03
Jan 04
Jan 05
Jan 06
Jan 07
Jan 08
Jan 09
Jan 10
Jan 11
Jan 12
Jan 13
Jan 14
Jan 15
Jan 16
Jan 17
Jan 18
Jan 19
Jan 20
Jan 21
0
50000
100000
150000
200000
250000Photo Video
Posts Overview
Total Posts
46Total Likes
2 017 576Total Comments
12 614Avg. number of Likes per Post
80 703,0Avg. number of Comments per
Post
504,6
Page 5/13
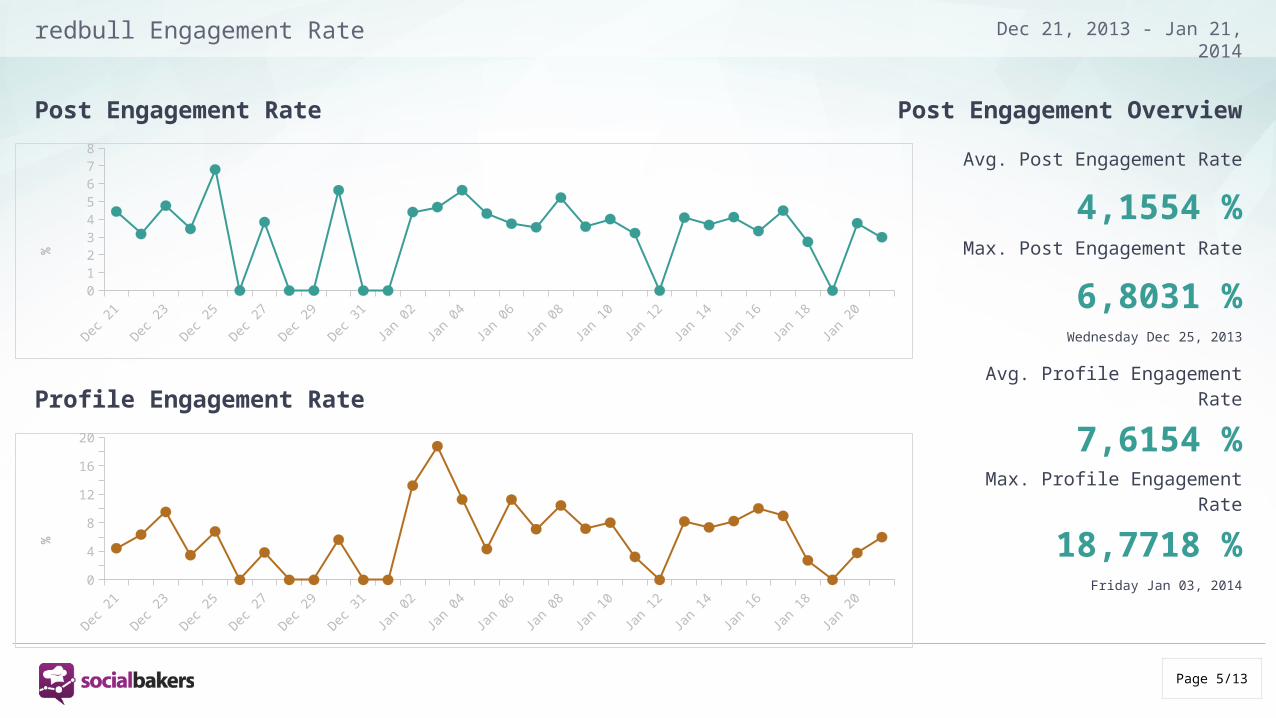
redbull Engagement Rate Dec 21, 2013 - Jan 21, 2014
Post Engagement Rate
Dec 21
Dec 22
Dec 23
Dec 24
Dec 25
Dec 26
Dec 27
Dec 28
Dec 29
Dec 30
Dec 31
Jan 01
Jan 02
Jan 03
Jan 04
Jan 05
Jan 06
Jan 07
Jan 08
Jan 09
Jan 10
Jan 11
Jan 12
Jan 13
Jan 14
Jan 15
Jan 16
Jan 17
Jan 18
Jan 19
Jan 20
Jan 21
0
1
2
3
4
5
6
7
8
%
Profile Engagement Rate
Dec 21
Dec 22
Dec 23
Dec 24
Dec 25
Dec 26
Dec 27
Dec 28
Dec 29
Dec 30
Dec 31
Jan 01
Jan 02
Jan 03
Jan 04
Jan 05
Jan 06
Jan 07
Jan 08
Jan 09
Jan 10
Jan 11
Jan 12
Jan 13
Jan 14
Jan 15
Jan 16
Jan 17
Jan 18
Jan 19
Jan 20
Jan 21
02468
101214161820
%
Post Engagement Overview
Avg. Post Engagement Rate
4,1554 %Max. Post Engagement Rate
6,8031 %Wednesday Dec 25, 2013
Avg. Profile Engagement Rate
7,6154 %Max. Profile Engagement Rate
18,7718 %Friday Jan 03, 2014
Page 6/13
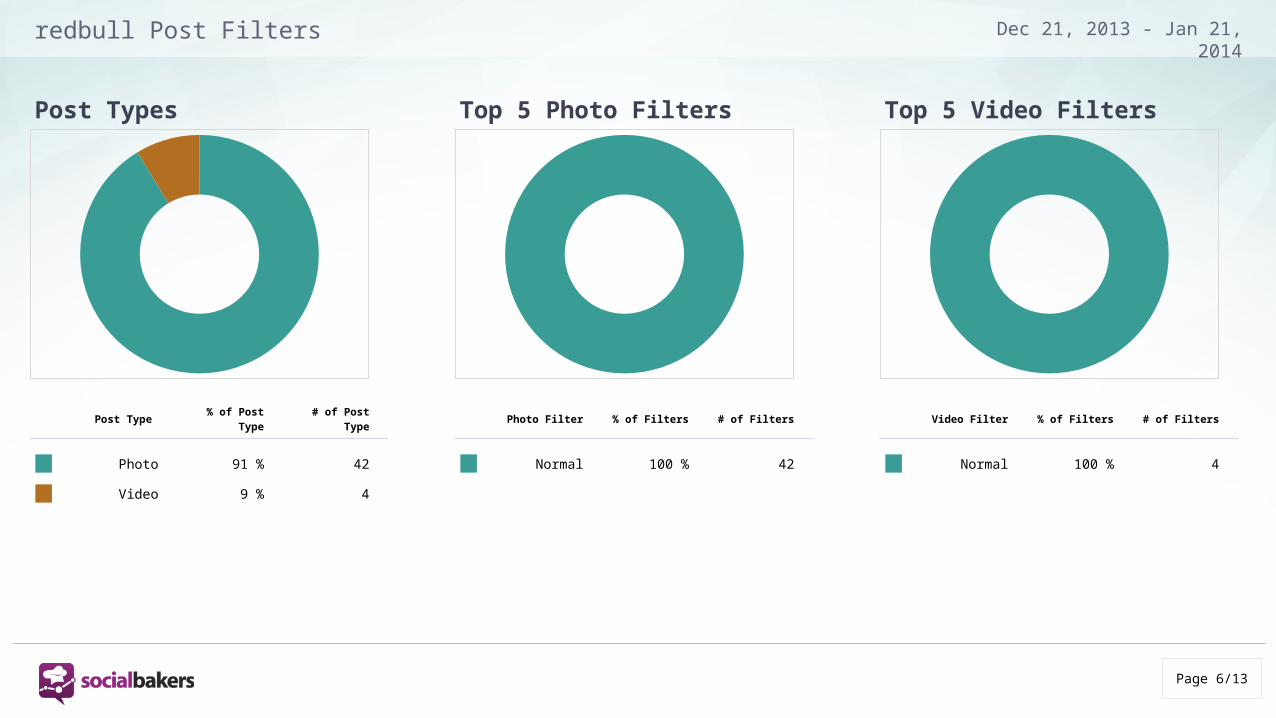
redbull Post Filters Dec 21, 2013 - Jan 21, 2014
Post Types
Post Type % of Post Type # of Post Type
Photo 91 % 42
Video 9 % 4
Top 5 Photo Filters
Photo Filter % of Filters # of Filters
Normal 100 % 42
Top 5 Video Filters
Video Filter % of Filters # of Filters
Normal 100 % 4

Page 7/13
redbull Post Filters Engagement Dec 21, 2013 - Jan 21, 2014
Most Engaging Post Types
Post Type % of Interactions # of Interactions
Photo 93 % 1 887 609
Video 7 % 142 581
Top 5 Most Engaging Photo Filters
Photo Filter % of Interactions # of Interactions
Normal 100 % 1 887 609
Top 5 Most Engaging Video Filters
Video Filter % of Interactions # of Interactions
Normal 100 % 142 581

Page 8/13
redbull Time of Interactions Dec 21, 2013 - Jan 21, 2014
Average Post Interactions by Day of the Week
Monday Tuesday Wednesday Thursday Friday Saturday Sunday0
5
10
15
20
25
%
Average Post Interactions by Hour
12am 1am 2am 3am 4am 5am 6am 7am 8am 9am10am
11am12pm
1pm2pm
3pm4pm
5pm6pm
7pm8pm
9pm10pm
11pm0
50000
100000
150000
200000
250000
300000
350000
Page 9/13
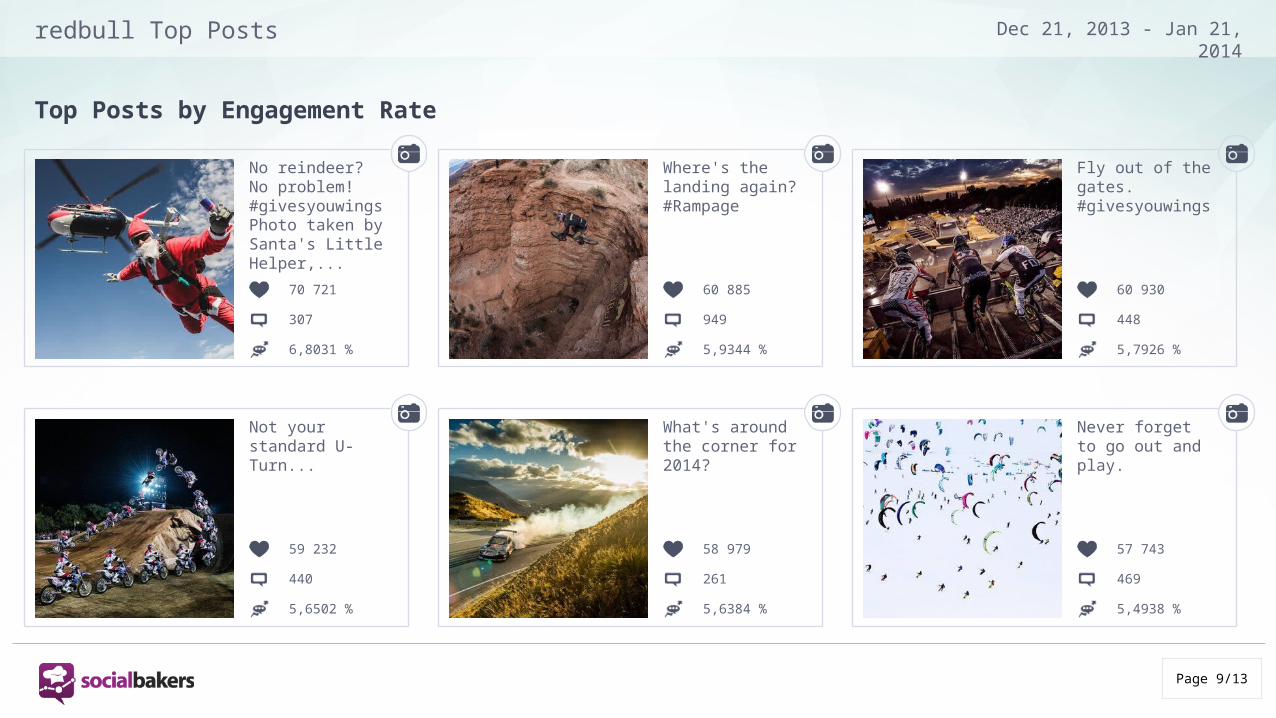
redbull Top Posts Dec 21, 2013 - Jan 21, 2014
Top Posts by Engagement Rate
No reindeer? No problem! #givesyouwings Photo taken by Santa's Little Helper,...
70 721
307
6,8031 %
Where's the landing again? #Rampage
60 885
949
5,9344 %
Fly out of the gates. #givesyouwings
60 930
448
5,7926 %
Not your standard U-Turn...
59 232
440
5,6502 %
What's around the corner for 2014?
58 979
261
5,6384 %
Never forget to go out and play.
57 743
469
5,4938 %
Page 10/13
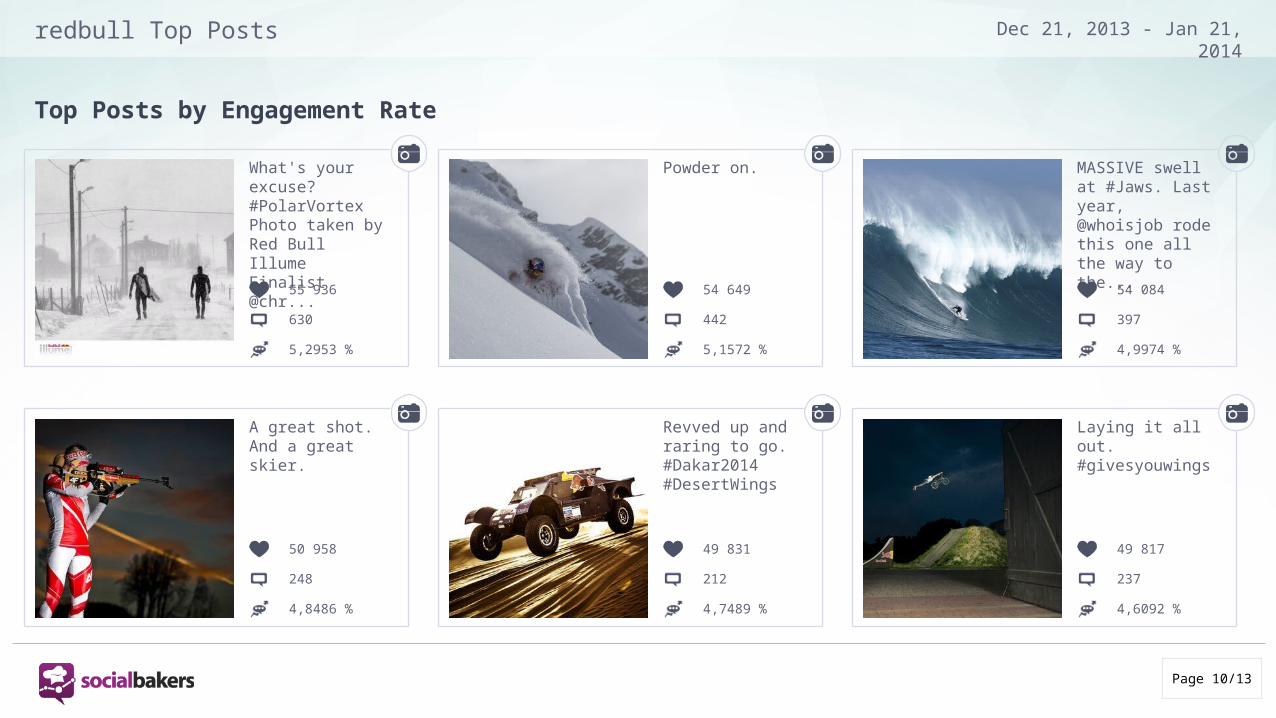
redbull Top Posts Dec 21, 2013 - Jan 21, 2014
Top Posts by Engagement Rate
What's your excuse? #PolarVortex Photo taken by Red Bull Illume Finalist @chr...
55 936
630
5,2953 %
Powder on.
54 649
442
5,1572 %
MASSIVE swell at #Jaws. Last year, @whoisjob rode this one all the way to the...
54 084
397
4,9974 %
A great shot. And a great skier.
50 958
248
4,8486 %
Revved up and raring to go. #Dakar2014 #DesertWings
49 831
212
4,7489 %
Laying it all out. #givesyouwings
49 817
237
4,6092 %

Page 11/13
redbull Top Posts Dec 21, 2013 - Jan 21, 2014
Top Posts by Engagement Rate
What's going on down there?!
49 568
306
4,6016 %
High rise. #bike
48 718
188
4,5241 %
Never forget your first ascent. #givesyouwings
47 065
430
4,4610 %
The view's much better upside down... #Rampage Check out all the action on NB...
45 978
195
4,4422 %
Is your head in the clouds? Lloyd Pennicuik navigates a cloudy day at the Gro...
46 409
113
4,4147 %
Grabbin' one last sunset session. #givesyouwings
45 777
209
4,3271 %
Page 12/13
redbull Metrics Explained Dec 21, 2013 - Jan 21, 2014
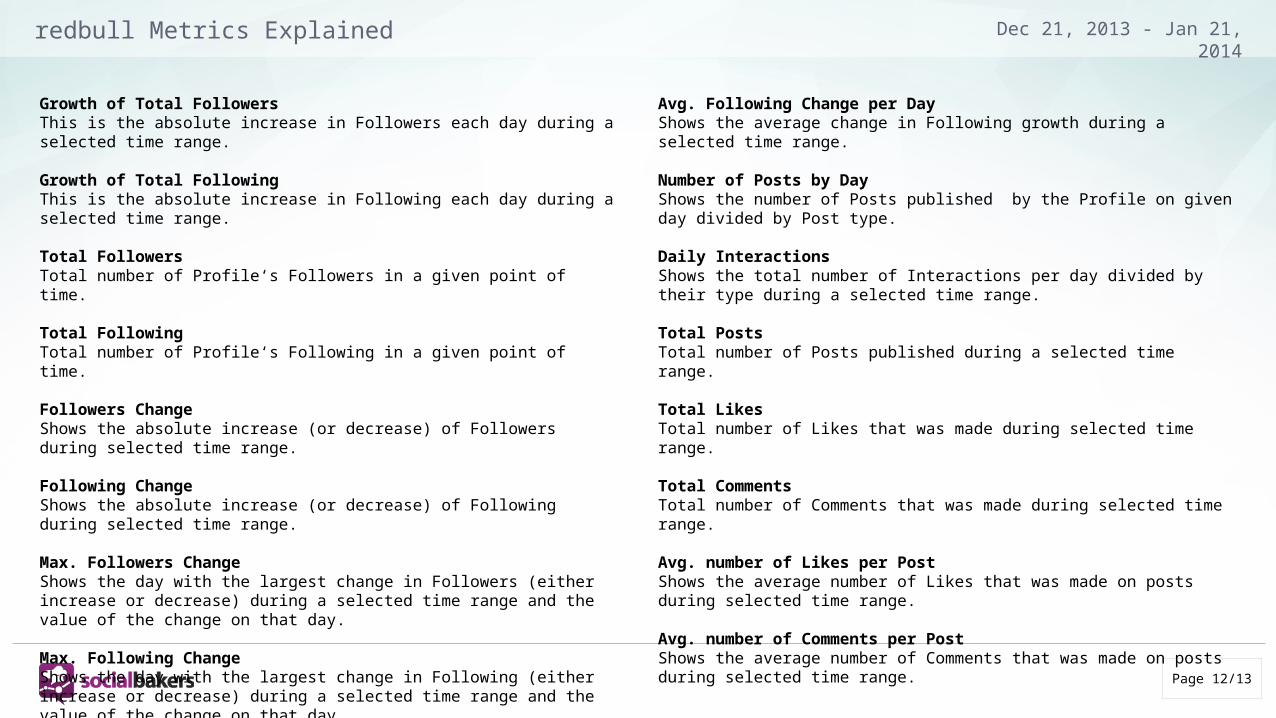
Growth of Total FollowersThis is the absolute increase in Followers each day during a selected time range. Growth of Total FollowingThis is the absolute increase in Following each day during a selected time range. Total FollowersTotal number of Profile‘s Followers in a given point of time. Total FollowingTotal number of Profile‘s Following in a given point of time. Followers ChangeShows the absolute increase (or decrease) of Followers during selected time range. Following ChangeShows the absolute increase (or decrease) of Following during selected time range. Max. Followers ChangeShows the day with the largest change in Followers (either increase or decrease) during a selected time range and the value of the change on that day. Max. Following ChangeShows the day with the largest change in Following (either increase or decrease) during a selected time range and the value of the change on that day. Avg. Followers Change per DayShows the average change in Followers growth during a selected time range.
Avg. Following Change per DayShows the average change in Following growth during a selected time range. Number of Posts by DayShows the number of Posts published by the Profile on given day divided by Post type. Daily InteractionsShows the total number of Interactions per day divided by their type during a selected time range. Total PostsTotal number of Posts published during a selected time range. Total LikesTotal number of Likes that was made during selected time range. Total CommentsTotal number of Comments that was made during selected time range. Avg. number of Likes per PostShows the average number of Likes that was made on posts during selected time range. Avg. number of Comments per PostShows the average number of Comments that was made on posts during selected time range.
Page 13/13
redbull Metrics Explained Dec 21, 2013 - Jan 21, 2014
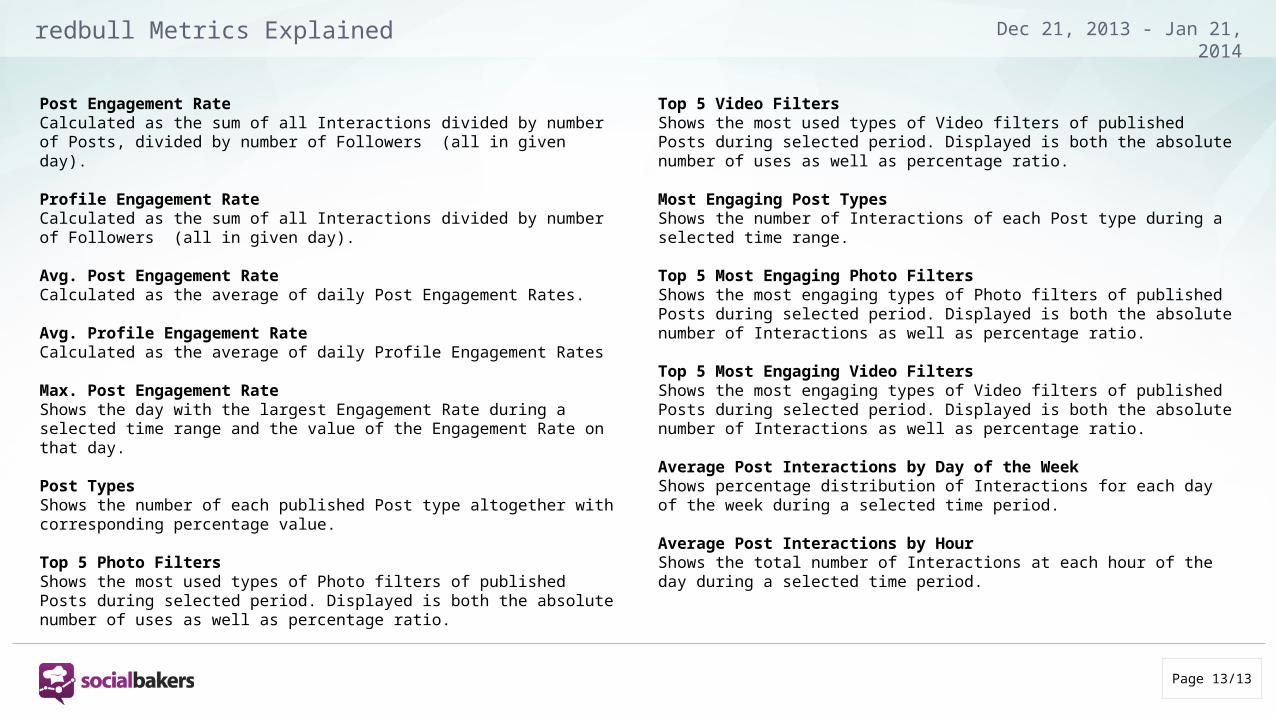
Post Engagement RateCalculated as the sum of all Interactions divided by number of Posts, divided by number of Followers (all in given day). Profile Engagement RateCalculated as the sum of all Interactions divided by number of Followers (all in given day). Avg. Post Engagement RateCalculated as the average of daily Post Engagement Rates. Avg. Profile Engagement RateCalculated as the average of daily Profile Engagement Rates Max. Post Engagement RateShows the day with the largest Engagement Rate during a selected time range and the value of the Engagement Rate on that day. Post TypesShows the number of each published Post type altogether with corresponding percentage value. Top 5 Photo FiltersShows the most used types of Photo filters of published Posts during selected period. Displayed is both the absolute number of uses as well as percentage ratio.
Top 5 Video FiltersShows the most used types of Video filters of published Posts during selected period. Displayed is both the absolute number of uses as well as percentage ratio. Most Engaging Post TypesShows the number of Interactions of each Post type during a selected time range. Top 5 Most Engaging Photo FiltersShows the most engaging types of Photo filters of published Posts during selected period. Displayed is both the absolute number of Interactions as well as percentage ratio. Top 5 Most Engaging Video FiltersShows the most engaging types of Video filters of published Posts during selected period. Displayed is both the absolute number of Interactions as well as percentage ratio. Average Post Interactions by Day of the WeekShows percentage distribution of Interactions for each day of the week during a selected time period. Average Post Interactions by HourShows the total number of Interactions at each hour of the day during a selected time period.