rebuild by design living breakwaters project benefit cost
TRANSCRIPT

[1]
Rebuild by Design Living Breakwaters Project
Benefit Cost Analysis
Prepared for: New York Governor’s Office of Storm Recovery
Action Plan Amendment 15
January 17, 2017

[2]
Living Breakwaters Benefit Cost Analysis
Table of Contents
Full Narrative Description
I. Executive Summary ................................................................................................................... 5
II. Introduction ............................................................................................................................. 10
III. Process for Preparing Benefit Cost Analysis (BCA) .................................................................. 11
IV. Proposed Funded Project ........................................................................................................ 12
V. Full Project Cost ....................................................................................................................... 13
VI. Current Situation and Problem to be Solved .......................................................................... 13
VII. Risks Facing Project Area Community ..................................................................................... 14
VIII. Benefits and Costs ................................................................................................................... 15
a. Lifecycle Costs ................................................................................................................... 14
b. Resiliency Values ............................................................................................................... 16
i. Reduction in Expected Property Damages .......................................................... 16
ii. Reduction in Displacement Costs ........................................................................ 24
iii. Reduction in Expected Casualties (Mortality and Injuries) .................................. 26
iv. Avoided Mental Health Treatment Costs ............................................................ 29
v. Avoided Lost Productivity Costs .......................................................................... 30
vi. Avoided Shoreline Erosion/Dune Reconstruction Costs ...................................... 30
vii. Avoided Road Closure/Travel Disruption Costs ................................................... 33
viii. Avoided Cost of Power Outages .......................................................................... 34
ix. Avoided Cost of Damaged Vehicles ..................................................................... 35
c. Environmental Value......................................................................................................... 36
i. Total Gross Ecosystem Annual Service Gains (+) ................................................. 36
ii. Total Ecosystem Annual Services Displaced (-) .................................................... 38
iii. Net Ecosystem Annual Service Gains (-) .............................................................. 38
d. Social Value ....................................................................................................................... 39
i. Education and Environmental Stewardship ........................................................ 40
ii. Recreation ............................................................................................................ 40
iii. Community Cohesion ........................................................................................... 42
iv. Workforce Development ..................................................................................... 42
e. Economic Revitalization .................................................................................................... 43

[3]
i. Economic Impacts ................................................................................................ 43
ii. Property Value Impacts (Market Value Appreciation apart from Resilience) ..... 45
IX. Project Risks ............................................................................................................................ 46
a. Description of Project Risks .............................................................................................. 46
b. Sensitivity Analysis ............................................................................................................ 47
X. Assessment of Implementation Challenges ............................................................................ 49
XI. Conclusion ............................................................................................................................... 49
XII. References ............................................................................................................................... 52
XIII. Appendices .............................................................................................................................. 56
a. Project Resource Statement (Annual Values) .................................................................. 56
b. Attachment A: Parameters and Assumptions Technical Memorandum: Living Breakwaters
& Tottenville Shoreline Protection Schematic Design: Standards & Assumptions For
Project Screening And 30% Design, v. 4 ........................................................................... 62
List of Tables
Table ES1: Living Breakwaters Project - Benefit Cost Analysis Summary ..................................................... 8
Table 1: Living Breakwaters Project – 30 Percent Design Scenario Opinion of Probable Cost................... 15
Table 2: Storm Events and Wave Impacts .................................................................................................. 19
Table 3: Residential Properties–Structure & Content Damages from Floods as a percentage of Property
Values .......................................................................................................................................................... 19
Table 4: Commercial Properties-Structure & Content Damages from Floods as a percentage of Property
Values .......................................................................................................................................................... 20
Table 5: Residential Property–Structure & Content Damages from Waves as a percentage of Property
Values .......................................................................................................................................................... 21
Table 6: Commercial Property–Structure & Content Damages from Waves as a percentage of Property
Values .......................................................................................................................................................... 21
Table 7: Mitigated Damages to Structures and Contents from Floods and Waves .................................... 23
Table 8: Rental Costs and Disruption Costs by Occupancy Type ................................................................ 25
Table 9: Duration of Displacement by Occupancy Type and Flood Depth ................................................. 25
Table 10: Mitigated Displacement Costs .................................................................................................... 25
Table 11: Parameters and Assumptions Applied in Mortality and Injury Estimates .................................. 26
Table 12: Data Applied to Estimate Population at Risk .............................................................................. 27
Table 13: Projected Population for TAZ 2206 ............................................................................................. 27
Table 14: Data Applied to Estimate Non-fatal injuries ............................................................................... 28
Table 15: Abbreviated Injury Scale ............................................................................................................. 28
Table 16: Relative Disutility Factors by Injury Severity Level, (for Use with 3% or 7% Discount Rates) .... 29
Table 17: Economic Impacts of Loss of Electric Power (per capita per day) .............................................. 34

[4]
Table 17b: Mitigated damages to vehicles ................................................................................................. 35
Table 18: Summary of Ecosystem Services Applied to the Living Breakwaters/Oyster Reef Project ........ 36
Table 19: Summary of 2016 annual ecosystem service values for the breakwater/oyster reef system .... 37
Table 20: Ecosystem Habitat Extended Value/Time Lag Modifiers ............................................................ 38
Table 21: Summary of Ecosystem Services Applied to the Displaced Subtidal Habitat: Subtidal small and
large grained bottom habitat ...................................................................................................................... 38
Table 22: Recreational Users Breakout ....................................................................................................... 41
Table 23: Staten Island Marinas .................................................................................................................. 41
Table 24: Benefit Cost Analysis Sensitivity Analysis .................................................................................... 47
Table 25: NPV and BCRs at Varying Discount Rates .................................................................................... 48
Table 26: Living Breakwaters Project - Benefit Cost Analysis Summary ..................................................... 50
List of Figures
Figure ES1: Living Breakwaters: Tottenville Pilot Rebuild By Design Project Illustration ............................. 6
Figure ES2: Living Breakwaters Project Benefits: Cumulative Present Values (2016-2066) ......................... 9
Figure 1: Historic long-term shoreline change ........................................................................................... 14
Figure 2: Buildings Flooded in Future Zone V ............................................................................................. 22
Figure 3: Logical framework for calculating damages for each property ................................................... 23
Figure 4: Illustrative Shoreline Dynamics - Observed Historic Shoreline Change ....................................... 31
Figure 5: Frequency Distribution: NY Shore Protection Projects ................................................................ 32
Figure 6: Scatter Plot of LF of Shore versus CY / LF Avg. per Shore Protection Project.............................. 32
Figure 7: Schematic of Living Breakwaters Underwater View .................................................................... 39
Figure 8: Living Breakwaters Project Net Present Value at Varying Discount Rates .................................. 48
Figure 9: Living Breakwaters Project Benefits: Cumulative Present Values (2016-2066)........................... 51
[5]
I. Executive Summary
This benefit cost analysis (BCA) was prepared for the Living Breakwaters: Tottenville Pilot Rebuild By
Design Project (Living Breakwaters or the Project) by Louis Berger on behalf of the Governor’s Office of
Storm Recovery (GOSR). The project is located in the waters of Raritan Bay (Lower New York Harbor) along
the shoreline of Staten Island, extending from Tottenville and Conference House Park, from Wards Point
in the Southwest to Butler Manor Woods in the Northeast (Figure ES1).
The BCA was prepared following US Department of Housing and Urban Development (HUD) Benefit Cost
Analysis (BCA) Guidance for Action Plan Amendments (APA) for Rebuild by Design (RBD) Projects (HUD
CPD-16-06). The analysis used generally accepted economic and financial principles for BCA as articulated
in OMB Circular A-94.
The Project consists of the following elements:
(1) A system of specially designed breakwaters and physical habitat enhancements on the
breakwater system, including shellfish (oyster) restoration on the breakwaters, along with
apportion of shoreline restoration;
(2) Oyster cultivation and activities supporting oyster restoration including: oyster cultivation
(hatchery expansion, remote setting facility, etc.), shell collection and curing, and the installation
of oyster nurseries;
(3) A community Water Hub and seasonal floating dock and boat launch. The Water Hub is an on-
shore public facility that will provide a physical space for access to the waterfront as well as
orientation, education and information on shoreline resiliency, community gathering space and
equipment storage for NYC Department of Parks and Recreation maintenance. The Water Hub
site would provide direct water access from shore by way of a seasonal floating dock; and
(4) Programming including educational, stewardship, and capacity-building activities related to the
above.
The Project is designed to 1) Reduce coastal risk through decreasing exposure to wave action and
associated erosion along the shoreline in Tottenville, Staten Island; 2) Enhance habitat functions and
values supporting local ecosystems through the creation and improvement of near shore and coastal
habitat; and 3) Foster stewardship, and recreational and educational use of the coast and near shore,
through increased awareness, access, and participation.
The BCA indicates that the Project will generate substantial net benefits (i.e., the benefits exceed the costs
over the life of the Project) to the shoreline community of Tottenville, Staten Island, New York, as well as
other beneficiaries from the New York metropolitan region.

[6]
Figure ES1
Living Breakwaters: Tottenville Pilot Rebuild by Design Project Illustration

[7]
A discussion of the BCA results is provided below and the values are presented in Table ES1: Living
Breakwaters Project – Benefit Cost Analysis Summary and Figure ES1A.
The BCA was completed using a 7% discount rate and a 50-year planning evaluation horizon. Using these
parameters, the lifecycle costs to build and operate the Project (amounting to $62.4 million in constant
2016 present value dollars) would generate the following benefits:
Total Benefits of $ 76.1 million, of which:
o Total Resiliency Values are $ 53.2 million;
o Total Environmental Values are $ 11.6 million;
o Total Social Values are $ 8.3 million; and
o Economic Revitalization Benefits are $2.95 million.
The Project’s cumulative present value of net benefits (benefits minus costs) is $ 13.7 million, and the
Benefit Cost Ratio (BCR) (Benefits divided by Costs) is 1.22. These net benefits demonstrate that the
Project has merit and would add value to the community of Tottenville, Staten Island, New York, and
provide benefits to other beneficiaries throughout the New York metropolitan region.
The Project’s future annual benefit and cost streams, projected over the 50-year planning horizon, were
subjected to a sensitivity analysis. The sensitivity analysis tested how key variables and parameters, if
changed, would alter the economic feasibility of the Project, measured by the BCR and the net present
value. The sensitivity analysis examined potential construction cost overruns and operation and
maintenance (O&M) increases as well as substantial reductions in the largest benefit categories. The
results showed that the Project’s net present value of benefits is robust and can withstand these standard
stress factors given the uncertainties that may arise, and remain economically viable over this period.

[8]
Table ES1: Living Breakwaters Project - Benefit Cost Analysis Summary Constant 2016 US Dollars
Cumulative Present Values (2016-2066)
At Discount Rates of:
7% 3%
LIFECYCLE COSTS
Project Investment Costs \a $54,909,955 $61,150,787
Operations & Maintenance (O&M)
Maintenance $7,080,207 $14,507,755
Monitoring $453,411 $829,867
Total O&M $7,533,618 $15,337,622
Total Costs $62,443,573 $76,488,409
BENEFITS
Resiliency Values
Avoided Property Damages $4,888,646 $12,645,701
Avoided Casualties (Mortality & Injuries) $2,859,166 $5,858,597
Avoided Mental Health Treatment Costs $506,972 $965,226
Avoided Lost Productivity Costs $1,128,405 $2,148,374
Avoided shoreline erosion/dune reconstruction costs $41,858,316 $56,815,891
Avoided displacement/disruption costs $526,326 $1,376,525
Avoided Road Closure/Travel Disruption costs $315,901 $647,300
Avoided Cost of Power Outages $1,050,543 $2,152,587
Avoided Vehicle Damages $63,787 $189,399
Total Resiliency Values $53,198,061 $82,799,601
Environmental Values
Total Gross Ecosystem Annual Service Gains (+) $11,860,749 $24,625,205
Total Ecosystem Annual Services Displaced (-) $264,537 $509,059
Net Ecosystem Annual Service Gains $11,596,212 $24,116,146
Social Values
Educational/Environmental Stewardship $1,253,995 $2,569,509
Recreation $7,095,681 $14,539,461
Total Social Values $8,349,676 $17,108,970
Economic Revitalization Benefits
Property Value Impacts (ʃ[Distance and Beach Width]) $2,953,868 $6,052,646
Total Benefits $76,097,817 $130,077,363
Benefits less Costs (Net Present Value) $13,654,244 $53,588,954
Benefit Cost Ratio (BCR) 1.22 1.70
Notes: Includes adjustment over time for 30 inch Sea Level Rise (SLR) \a Note that because Project construction is anticipated to occur over 2018, 2019 and the first quarter of 2020, the present value calculation of costs (as of 2016) will appear to be lower than the nominal project investment costs shown in the Opinion of Probable Cost Document due to the application of the 7% HUD recommended discount rate

[9]
Figure ES2

[10]
II. Introduction
The Rebuild by Design Living Breakwaters Project (Living Breakwaters or the Project) Benefit Cost Analysis
(BCA) was completed by applying procedures described in the US Department of Housing and Urban
Development (HUD) Guidance document CPD-16-06 for Rebuild by Design (RBD) projects. The analysis is
also consistent with procedures and principles found in OMB Circular A-94. The analysis follows the “with
without” project evaluation framework that is used to isolate the net benefits of the intervention.
Future “With Project” Scenario
In the Future with Project Scenario, the Project would be constructed, consisting of the following
elements:
(1) A system of specially designed breakwaters and physical habitat enhancements on the
breakwater system, including shellfish (oyster) restoration on the breakwaters, along with a
portion of shoreline restoration;
(2) Oyster cultivation and activities supporting oyster restoration including: oyster cultivation
(hatchery expansion, remote setting facility, etc.), shell collection and curing, and the installation
of oyster nurseries;
(3) A community Water Hub and accessory seasonal dock. The Water Hub is an on-shore public
facility that will provide a physical space for access to the waterfront as well as orientation,
education and information on shoreline resiliency, community gathering space and equipment
storage for NYC Department of Parks and Recreation maintenance. The Water Hub site would
provide direct water access from shore by way of a seasonal floating dock; and
(4) Programming including educational, stewardship, and capacity-building activities related to the
above.
Components of the project include a system of off-shore breakwaters engineered to provide maximum
habitat and ecological restoration opportunities. In this scenario, the Project will:
1) Reduce coastal risk through decreasing exposure to wave action and associated erosion along the
shoreline in Tottenville, Staten Island;
2) Enhance habitat functions and values supporting local ecosystems through the creation and
improvement of near shore and coastal habitat; and
3) Foster stewardship and recreational and educational use of the coast and nearshore through
increased awareness, access, and participation.
Future “Without Project” Scenario
In the Future without Project Scenario, the Project would not be built. If the Project is not constructed,
the Tottenville, Staten Island shoreline would continue to be at increased risk of continued erosion and
shoreline communities within the Limits of the Moderate Wave Action (LiMWA) zone would face the risk
of damaging storm waves, as experienced during Superstorm Sandy. Without the construction of the

[11]
Project, the community may continue to lose parkland, and other open spaces and natural resources, and
residents will continue to face the risk of bodily injury, loss of life, loss of property and damage to public
infrastructure. These cumulative impacts would have a negative effect on the health and productivity of
residents, and the economy.
The aquatic habitat of the bay adjacent to Tottenville would remain in its current state, characterized by
a sand/gravel bottom condition with limited structured habitat to support the variety of fish, crustacean,
bivalves and other benthic invertebrates identified as a priority in the Hudson Raritan Estuary
comprehensive restoration plan. Shoreline habitat would remain subject to the disturbance and erosion
effects of high-energy wave action during severe storms not attenuated by the project
Educational programming in Conference House Park and the Billion Oyster Projects programming in
Staten Island would remain as is.
Key Analysis Aspects
This BCA quantifies risk reduction benefits (Resiliency Values), Environmental Values, Social Values and
Economic Revitalization Values that would be generated by the Project per HUD Guidelines. Details on
these categories of benefits are provided below. An overview of assumptions and data used for the BCA
is included in Attachment A - Parameters and Assumptions Technical Memorandum.
The project evaluation time horizon is 50 years and the analysis applies the recommended 7% discount
rate. The net benefits were also calculated using the 3% discount rate that is often applied in studies
valuing environmental and ecosystem benefits. The BCA also includes a sensitivity analysis that assesses
the change in net benefits (cumulative net present value) for various stress events and for a range of
Project discount rates.
The analysis includes valuations based on physical point estimate quantities for projected habitats that
provide ecosystem services and values obtained from peer reviewed literature that have been applied to
value these resources using benefits-transfer techniques. It is noted that the Federal Emergency
Management Agency (FEMA) has applied similar methods to value ecosystem services for environmental
infrastructure projects or projects that remove obstructions to watersheds and floodplains to restore
ecosystem services (FEMA, 2013).
III. Process for Preparing Benefit Cost Analysis
This BCA was prepared by Louis Berger U.S, Inc. (Louis Berger) using inputs provided by the Governor’s
Office of Storm Recovery (GOSR) and the Living Breakwaters design team including SCAPE Landscape
Architecture, Ocean and Coastal Consultants COWI, WSP Parsons Brinckerhoff, the NY Harbor Foundation,
MFS Engineers & Surveyors , Arcadis, and GOSR’s consultant preparing the environmental review for the
Project, AKRF. Louis Berger provided guidance and analysis on various sections of the BCA including
expertise in resilience, landscape design, coastal and environmental engineering, ecology, economic
analysis, geographic information systems, project evaluation, engineering economics and socio-
economics.

[12]
The BCA relied on inputs, data and information from the Living Breakwaters design team as well as
information on the project area and information from GOSR, and information transmitted through the
authors of the environmental impact statement (EIS). In addition, Louis Berger applied its own research
findings, collective multidisciplinary expertise, experience, and professional judgment in completing the
BCA on behalf of the State of New York.
IV. Proposed Funded Project
The integrated purposes of the Living Breakwaters Project are threefold:
1) to reduce coastal risk through decreasing exposure to wave action and associated erosion along
the shoreline in Tottenville, Staten Island;
2) to enhance habitat functions and values supporting local ecosystems through the creation and
improvement of near shore and coastal habitat; and
3) to foster stewardship and recreational and educational use of the coast and nearshore through
increased awareness, access, and participation.
The Project is an innovative coastal green infrastructure project that aims to increase physical, ecological,
and social resilience. The project is located in the waters of Raritan Bay (Lower New York Harbor) along
the shoreline of Staten Island. The affected shoreline extends from Tottenville and Conference House
Park, from Wards Point in the Southwest to Butler Manor Woods in the Northeast. The project area is a
shallow estuary that has historically supported commercial fisheries and shell fisheries. The Project
consists of the following main elements (SCAPE, FDR30 Percent, 2016):
(1) A system of engineered breakwaters and physical habitat enhancements on the breakwater
system, including shellfish (oyster) restoration on the breakwaters, along with a portion of
shoreline restoration;
(2) Oyster cultivation and activities supporting oyster restoration including: oyster cultivation
(hatchery expansion, remote setting facility, etc.), shell collection and curing, and the
installation of oyster nurseries;
(3) A Water Hub - an on-shore public facility (building and site) to house educational programs,
community stewardship activities, science and monitoring efforts, recreational program and
equipment and exhibitions related to the project and its objectives of risk reduction and
resilience, ecological enhancement and community building; and
(4) Programming including educational, stewardship, and capacity-building activities related to
the above.

[13]
Project Schedule, Useful Life and Discount Rate:
Project construction is anticipated to start in mid-2018 and continue through the first quarter of 2020.
For the purposes of this BCA, a 19-month construction schedule is assumed. This period factors in fish
and crab spawning months that may prevent certain construction activities from occurring during certain
times of the year. This assumption is consistent with conservative economic modelling principles applied
in BCA. The BCA also assumes a 50-year project evaluation time horizon. A discount rate of 7%,
recommended by HUD and per OMB Guidelines, has been applied. The BCA also presents, for comparison,
the main results by BCA element applying a 3% discount rate. The 3% discount rate has previously been
applied in economic analysis of environmental infrastructure projects (Freeman, 1999).
V. Full Project Cost
The nominal base Project cost without contingencies is estimated to be $66.5 million. Applying a 30
percent contingency to the base cost, the estimated cost would be $79.1 million. The cumulative present
value of estimated O&M plus periodic monitoring is $7.5 million. On an annual worth equivalent basis,
using a 7% discount rate over a 50-year period, these cumulative O&M and monitoring costs would be
approximately $550,000 per year.
VI. Current Situation and Problem to be Solved
The need for enhanced erosion protection, wave attenuation, and social resiliency were demonstrated
during the severe storm events of 2011 and 2012 (including “Superstorm Sandy” in 2012) when the
Tottenville, Staten Island community experienced severe damage from storm waves. In addition to storm
events, the shoreline has experienced ongoing erosion over the last 35 years. While shoreline change
patterns oscillate between erosion and accretion, most of the shoreline in the project area has
experienced erosion. In many locations, erosion rates average over one foot per year and in one section
of the Conference House Park shoreline, the average rate of erosion is 3 feet per year. To put these rates
into context, Figure 1 depicts the historic shoreline change in part of the project area over the past 35
years.

[14]
Figure 1: Historic long-term shoreline change
(Source: SCAPE, FDR 30 Percent, 2016)
The need for habitat enhancement within Raritan Bay has been well documented through ecological
assessments and reports including National Marine Fisheries Service Raritan Bay habitat evaluations and
the New York State Department of Environmental Conservation Shellfish Assessments developed for the
Food and Drug Administration in support of their northern quahog (Mercenaria mercenaria) fishery and
the New York – New Jersey Comprehensive Restoration Plan for New York Harbor (HRE-CRP).
The Project is taking a thematically and spatially layered approach to reducing coastal risk, restoring and
enhancing habitats important to local ecosystems, improving water access, and engaging with residents
through community and educational programs directly related to the project’s coastal and ecological
resilience efforts. The project is consistent with New York City’s Coastal Protection Initiatives and planning
studies for the Tottenville area as well as the HRE-CRP. The efforts and objectives were guided by the
harbor-wide assessment of habitats, and their functions and values used in the drafting of the
Comprehensive Restoration Plan (SCAPE, FDR30 Percent, 2016, Bain et. al., 2006).
VII. Risks Facing Project Area Community
Without the Project, the Tottenville community would continue to face risks associated with the ongoing
erosion of shoreline, vulnerability to unbridled wave action and destructive wave energy, and ongoing
susceptibility to future damages and social dislocations. These types of impacts were experienced and
most noticeable during the severe storm events of 2011 and 2012 (including “Superstorm Sandy”) when
the Tottenville, Staten Island community experienced severe damage from storm waves. However, it is
apparent that without the Project, ongoing changes to the community’s shoreline will affect quality of life
going forward. In addition to storm events, the shoreline has experienced ongoing erosion over the last
Historic Shoreline loss

[15]
35 years at rates depicted in Figure 1. While shoreline change patterns oscillate between erosion and
accretion, most of the shoreline in the project area has experienced erosion. If unaddressed, these erosion
patterns can alter the character of the community and generate ongoing costly maintenance and
restoration activities in the future. Narrower beaches mean decreased protection from wave action,
greater exposure of shoreline features such as dunes to erosion and loss of important shoreline public
space. In fact, some segments of the Tottenville beach are not accessible at high tide, and with the current
rates of erosion and sea level rise (SLR), the extent of these zones will only increase.
VIII. Benefits and Costs
a. Lifecycle Costs
The lifecycle costs of the intervention over the Project’s lifetime are necessary for the BCA and to
determine economic feasibility (i.e., whether the cumulative present value of the Project benefits exceed
the cumulative present value of costs over this period). The Project’s lifecycle costs consist of both project
investment costs (upfront capital construction costs) and long-term annually recurring operations and
maintenance costs. In addition, regulatory related monitoring costs are included for the first five years of
operations, and additional monitoring costs (for breakwaters structure plus oyster reef) are modelled to
recur at less-frequent periodic intervals (every 5 years thereafter) extending out over the 50 year project
time horizon. Periodic monitoring costs associated with structural integrity monitoring and assessment
of the breakwaters will be incurred. Furthermore, scientific monitoring and sampling/upkeep of ecological
restoration efforts will be necessary. These activities will incur costs related to monitoring of the oyster
habitat and colonization growth over time to ensure that the goals and objectives of the Project are being
realized.
Project investment costs were obtained from the Opinion of Probable Cost (OPC) for the 30 Percent Living
Breakwaters Design (SCAPE, OCC & MFS, 2016). Table 1 shows the breakdown of the Project capital
investment costs.
Table 1: Living Breakwaters Project – 30 Percent Design Scenario Opinion of Probable Cost (OPC)
Base OPC (No Contingency)
Recommended OPC with 30
Percent Contingency
Breakwaters Only $56,400,000 $67,900,000
Additional Line Items $10,100,000 $11,200,000
Breakwater Project Total: $66,500,000 $79,100,000 Source: (SCAPE OCC MFS, 2016)
A sensitivity analysis provided in Section IX.b. includes the net benefits and BCRs calculated with full
contingencies and simulated construction cost overruns as part of a stress test. In addition, project work

[16]
files include the full Project Resource Statement MS Excel worksheet created for this Project. The Project
Resource Statement appendix contains the capital cost phasing applied over the periods 2018 to 2020.
O&M costs were estimated on an annually recurring basis. These costs relate to operating the water hub
building and to operating the breakwaters and oyster reef installation activities. These costs are for
annual sustainment required for the breakwaters structure and for oyster restoration/colonization
activities. Project annual O&M costs were estimated by multiplying 0.95% of the Base OPC capital cost
shown in Table 1. This technique has been applied at the 30 percent design phase for capital investments.
Using this factor results in an annually recurring O&M cost of approximately $633,000 per year. For this
BCA, it is assumed that O&M costs would start in the year 2020 (post-construction activities scheduled for
Q1). The BCA assumed that periodic monitoring per permitting compliance would occur for the first five
years, and then recur at five (5) year intervals, thereafter at a cost of $150,000 per year.
As a frame of reference for the water hub, Louis Berger compared the annual operations cost of the Alley
Pond Environmental Center (APEC)- a facility with a dedicated nature and watershed educational
structure, and interpretative space that provides exhibits, aquariums, and classroom facilities, and is
supported by utilities and dedicated staff. The APEC also operates an educational and community
outreach program. The annual O&M costs calculated for the Living Breakwaters Project were within a
reasonable range of the annual sustainment costs experienced by the APEC facility per recent financial
statements (APEC, 2016).
As mentioned above, the Project’s investment costs (capital construction) were sourced from the Opinion
of Probable Cost document for the Project’s 30 Percent Design ($66.5 million). To calculate the BCR, the
construction costs were phased in over a 19-month period spanning the years 2018-2020 per the
anticipated construction schedule provided by GOSR.
b. Resiliency Values
Resiliency values are the benefits that capture risk reduction, and the risk avoidance and property and
infrastructure protection values offered by the Project. Under the Future with Project scenario, these
values are determined from avoided costs that would have been incurred under the Future without
Project scenario (in the absence of the Living Breakwaters Project). An avoided cost that would no longer
be incurred under the Future with Project situation is counted as an annual benefit in economic analysis.
i. Reduction in Expected Property Damages
Introduction
Mitigated damages to property structures and building contents, and mitigated disruption and
displacement costs, were quantified using a methodology that compared damages and costs of various
storm events in the Future with Project and the Future without Project scenarios. In the Future with
Project scenario, the Project was assumed to be constructed and would have benefits with the existing
dune assumed to be 9 feet NAVD88. In the Future without Project scenario, the Project was assumed to
not be constructed but the effects of the existing dune were still considered. Thus, the mitigated damages

[17]
and costs quantify the benefits for the Living Breakwaters Project assuming the existing dunes are in place.
The storm intervals analyzed as part of the BCA include a 10-year, 25-year, 50-year, and 100-year storm
events, their anticipated flood levels, and waves for both current and projected 30-inch sea level rise. All
assumptions were taken from Attachment A noted above.
Within the BCA, the avoided damages from storm events are calculated using the Expected Annual
Damages (EAD) framework. The EAD framework takes a weighted average sum of multiple storm events
(of differing magnitudes and annual chance occurrences) and depicts these values as one annual-avoided-
damages figure within the Project Resource Statement applied to calculate the BCR (Louis Berger).
The results of the Project’s 30 Percent Design Report were used to determine the benefits of the Project
based on a reduction of wave energy.
The Project attenuates wave energy and lowers incoming wave heights up to a 100-year storm event. The
existing dune offers protection from water levels associated with frequent and small storm events and
sea level rise less than 9 feet. The analysis assumed that the dune would not experience erosion during a
storm. However, avoided maintenance costs of the dune was accounted for in a subsequent analysis, The
Project attenuates wave energy and lowers incoming wave heights. While the existing dune provides
some baseline flood protection, the Project enhances the existing dune’s benefits by lowering incoming
wave heights, thereby enabling the dune to more effectively protect against more severe storms and
slowing or preventing erosion of the dune itself. In addition, the Project mitigates the impacts of waves
on the shoreline, which lowers shoreline maintenance costs.
Methods & Data Applied
An approach using geographic information systems (GIS) was utilized to quantify the benefits and costs.
The approach utilized ArcGIS and GIS layers to determine real properties affected by storm events. The
resulting data was used to quantify the damages and cost. The approach is similar to those utilized by
HAZUS1 and FEMA’s standardized methodology for estimating potential losses. While compatible with the
aforementioned approaches, the approach used for this study provides for greater specificity as it relates
to the types of damages quantified, the data used to quantify the damages, and the storm events studied.
Because the two methodologies are similar as both utilize depth damage functions (DDFs), similar results
are expected. The data sets used for this BCA are described below:
FEMA Preliminary Flood Hazard Data
FEMA provides map products that outline areas susceptible to floods and wave damages for 100-year and
500-year events. FEMA provides preliminary versions of these map products that give users an early look
at a community’s projected risk to flood hazards. Because this study assesses mitigated damages and costs
under future scenarios when the Project would be built, the preliminary versions of these map products
were used since they better represent future scenarios.
1 Hazus is a nationally applicable standardized methodology that estimates potential losses from earthquakes, hurricane winds and floods. The Federal Emergency Management Agency (FEMA) developed Hazus under contract with the National Institute of Building Sciences (NIBS). (https://www.fema.gov/hazus-mh-overview)

[18]
USACE North Atlantic Coast Comprehensive Study Depth-Damage Functions
The USACE North Atlantic Coast Comprehensive Study included a Physical Depth Damage Function
Summary Report Appendix. The appended analyses was the result of a workshop that developed depth-
damage relationships by soliciting opinions from expert panelists including coastal and structural
engineers, appraisers, restorers, and catastrophe modelers from the insurance industry (NACCS, 2015). In
the workshops, the panelists utilized their experience and expert knowledge on recent storm events to
quantity the depth-damage relationships. The quantified depth-damage relationships, called depth
damage functions (DDFs), are used in USACE implementation studies and help reduce the studies’
duration and costs. The depth-damage functions quantify the physical damages to building structures and
contents caused by various storm events. The depth-damage functions provide damages as a percentage
of the property value, dependent on the inundation depth or wave height. The curves estimate a structure
and contents damage value as a percentage of market value based on the depth of inundation or wave
height. As mentioned above, the damages are then expressed as expected annual damages (EAD) and
take into account the various annual probabilities of storm events of varying magnitudes and annual
chances of occurrence. As a simplifying assumption, the depth damage functions do not consider the
following to be factors in the damage analysis: age of building, basement use, construction quality, city
codes, dune or seawall presence, lobby layout, backwater valves, and layout of mechanical, electrical and
plumbing systems.
NYC Department of Finance Assessment Rolls
Property values in the study area were obtained from assessment rolls provided by the NYC Department
of Finance. The assessment rolls are official databases updated annually that include detailed information
about New York City property, including assessed and market values. The assessment rolls include data
for all tax classes, defined as follows:
Tax Class 1: Residential property up to three units and condominiums no more than three stories
Tax Class 2: Residential property larger than those defined for Tax Class 1
Tax Class 3: Utility property
Tax Class 4: Commercial or industrial property
NYC Department of City Planning MapPLUTO
The location of each property defined in the assessment rolls were identified using NYC Department of
City Planning’s MapPLUTO data. MapPLUTO data are ArcGIS shapefiles that delineate the outline of each
property as defined by the NYC Department of Finance’s Digital Tax Map. MapPLUTO data also includes
extensive land use and geographic data for each property.
Property Structure and Content
Damage to structures and their contents are a key component of storm event and wave damages.
Structures and their contents constitute the financial assets of property owners and tenants, and damages
to these assets negatively affect the economic well-being of affected individuals. Damages can be incurred
from flooding that inundates the structure and its contents or wave action that causes structural damage.
The magnitude of damages to structures and contents are proportional to the flooding depth of the
structure and can be modeled as a percentage of the property value. Depth-damage functions depict this
mathematical relationship between the flood depth and the percent damage. Depth-damage functions

[19]
from the USACE North Atlantic Coast Comprehensive Study can also be used to estimate damages from
waves based on wave depth at the structure.
Methodology
Storm Events and Wave Impacts
The BCA has quantified damages to structures and contents for properties mitigated by the Project. As
stated above, mitigated damages for the 10-year, 25-year, 50-year, and 100-year storm events, and their
related flood and wave impacts for both current and projected 30-inch sea level rise scenarios, were
quantified. Water levels and wave heights assumed for each event are depicted in Table 2 below.
Table 2: Storm Events and Wave Impacts
Return Period
Annual Chance
Time Period
"today" With 30" sea level rise
Stillwater Elevation
(feet, NAVD88)
Significant Wave Height (feet)
Stillwater Elevation
(feet, NAVD88)
Significant Wave Height (feet)
10 year 10% Today 8.1 3.9 10.6 3.9
25 year 4% Today 9.3 4.3 11.8 4.3
50 year 2% Today 11.3 4.9 13.8 4.9
100 year 1% Today 12.9 5.3 15.4 5.3
Depth-damage functions specified in USACE’s North Atlantic Coast Comprehensive Study (NACCS) were
used. Separate depth-damage functions were used for residential and commercial properties, and for
flood and wave damages. For residential properties, the analysis utilized the depth damage function for a
single story apartment with no basement. This depth damage function was used in the analysis because
the values were lower than that of a single story residence. Thus, this assumption would provide a
conservative estimate of the benefits. Approximately 40% of residential properties in the study area have
more than one residential unit. For commercial properties, the analysis utilized the depth damage
function for engineering commercial construction. The values in the depth damage function for the “Most
Likely” scenario was used. Tables 3 thru 6 depict these depth-damage functions.
Table 3: Residential Properties – Structure and Content Damages from Inundation as a Percentage of Property Value
Inundation depth (ft) Structure Damage (%) Content Damage (%)
-1 0% 0%
-0.5 0% 0.0%
0 10% 4%
0.5 16% 14%

[20]
Table 3: Residential Properties – Structure and Content Damages from Inundation as a Percentage of Property Value
Inundation depth (ft) Structure Damage (%) Content Damage (%)
1 25% 28%
2 35% 45%
3 43% 60%
5 60% 81%
7 68% 100%
Table 4: Commercial Properties – Structure and Content Damages from Inundation as a Percentage of Property Values
Inundation Depth (ft) Structure Damage (%) Contents Damage (%)
-1 0% 0%
-0.5 0% 0.0%
0 5% 5%
0.5 10% 18%
1 20% 35%
2 30% 39%
3 35% 43%
5 40% 47%
7 53% 70%
10 58% 75%

[21]
Table 5: Residential Property – Structure and Content Damages from Waves as a Percentage of Property Values
Wave Crest Depth (ft)
Structure Damage (%)
Content Damage (%)
-1 0% 0%
0 0% 3.5%
1 25% 30%
2 38% 50%
3 90% 90%
5 100% 100%
Table 6: Commercial Property – Structure and Content Damages from Waves as a Percentage of Property Values
Wave Crest Depth (ft) Structure Damage Content Damage
-1 0% 0%
0 0% 3.0%
1 9% 18%
2 20% 30%
3 33% 41%
5 55% 75%
7 65% 95%
10 82% 95%
The mitigated damages for the project were quantified as the difference between the damages under the
Future without Project Scenario and the Future with Project scenario. For the Living Breakwaters project,
the wave reduction scenario as modeled in the Final 30 Percent Design Report was used. The existing
dunes were assumed to have a crest elevation of 9 feet NAVD88, which was the average elevation along
the dune alignment. The dunes also provide wave reduction, since we can assume that the maximum
height of a wave is reduced to 78% of the water depth above any feature based on FEMA’s Guidance for
Flood Risk Analysis and Mapping.i

[22]
For both the Future without Project and the Future with Project scenarios, there are two possibilities:
properties would not flood due to their ground elevation, or properties would flood and incur damages
from waves and inundation. In the Future with Project scenario, the inundated properties would
experience a lower wave depth than in the Future without Project scenario because of the wave reduction
effects of the Project. Wave damage was assumed only for properties in the Preliminary FEMA Zone V.
For today’s scenario, no buildings were located in the Preliminary FEMA Zone V. For the 30” sea level rise
scenarios, a “future” Zone V was estimated by adding 30” to the ground elevation at the landward extent
of the Preliminary FEMA Zone V. The buildings within this “future” Zone V are shown in Figure 2 below.
The Zone V (used for 100-year storms) was assumed to be the same for other storm events. All buildings,
in addition to the first row of buildings landward of Raritan Bay, were assumed to experience wave
damage.
Figure 2: Buildings in Potential Future Zone V (Assuming 30” Sea Level Rise)
This logical framework for estimating inundation and wave damages is depicted in Figure 3 below. The
framework in this diagram is used for both residential and commercial values and for both Without and
With project scenarios. The difference in the mitigated damages of each scenario reflects the mitigated
risk of the Project.

[23]
Figure 3: Logical Framework for Calculating Damages for Each Property
Results
The mitigated damages for each event as described above are shown in Table 7 below. Mitigated damages
would be incurred for today’s 100-year storm event and for the 50 year and 100 year storm events with
30” sea level rise. For all other storm events, the existing dune would provide sufficient wave attenuation
to prevent wave damage to buildings, even without the breakwaters. Without the breakwaters, the dune
could be lost due to wave damage and erosion, however for the purposes of the benefit cost analysis, it
is assumed that the dune is maintained in good condition and the avoided costs of this maintenance with
the project are included in the section below on avoided shore erosion / dune reconstruction.
As the severity of the storm event increases, the mitigated damage increases due to the prevented
geographic extent and inundation and wave depth. This is because as the geographic extent and
inundation depth of properties increase with the severity of the storm depth; more properties are
affected and each property is affected more for high severity events. Thus, mitigation of higher severity
storm events would result in the mitigation of both a higher count of properties and extent of damages
for each property.
Table 7: Mitigated Damages to Structures and Contents from Inundation and Waves
Return Period
Annual Chance
Time Period
Mitigated Damages for Residential Properties
(MD)
Mitigated Damages for Commercial Properties
(MD)
Mitigated Damages
for All Properties
(MD)
EAD: Expected Annual
Damages
100 year 1% Today $5,689,880 $5,689,880 $56,899
50 year 2% With 30" sea level rise $28,931,890 $441,900 $29,373,790 $587,476
100 year 1% With 30" sea level rise $84,074,417 $898,530 $84,972,947 $849,729

[24]
The Expected Annual Damages converts the total mitigated damages per storm event to the annual
chance equivalent. The annual damages were entered into each respective year over the 50-year
evaluation period. The 2016 value was the base year. For subsequent years’ annual chance expected
damages, the intervening years were calculated by applying linear interpolation from the base year up to
the expected year that would experience the 30 inches of sea-level rise. Therefore, the sum total per year
(t) for EADt damages would be equal to the following combination of risk adjusted damages ([MD] x
[1/Return Period]) shown in Equation 1.
EADt = Σ ([MD100 yr. x 1%] + [MD50 yr. x 2%] + [MD100 yr. x 1%] (Equation 1)
ii. Reduction in Displacement Costs
During storm events, tenants of both residential and commercial properties are forced to evacuate their
homes and businesses. Displacement costs consist of the damages associated with this forced-evacuation.
The displacement cost consists of “a one-time disruption cost along with a recurring monthly rental cost
for the duration of the displacement.” (FEMA, 2011)
Methodology
The BCA quantified displacement costs that would be mitigated by the Project. Mitigated damages for
each storm event outlined in the Property Structure and Contents section above were quantified. The
FEMA BCA methodology for quantifying displacement costs was applied for this task. As described above,
displacement costs represent the sum of a one-time disruption cost and a recurring displacement cost for
the duration of displacement. This relationship is shown in Equation 2 below.
𝐷𝑖𝑠𝑝𝑙𝑎𝑐𝑒𝑚𝑒𝑛𝑡 𝐶𝑜𝑠𝑡 = (𝐷𝑖𝑠𝑟𝑢𝑝𝑡𝑖𝑜𝑛 𝐶𝑜𝑠𝑡 ∗ 𝐹𝑙𝑜𝑜𝑟 𝐴𝑟𝑒𝑎) +(𝑅𝑒𝑛𝑡𝑎𝑙 𝐶𝑜𝑠𝑡 ∗ 𝐹𝑙𝑜𝑜𝑟 𝐴𝑟𝑒𝑎 ∗ 𝐷𝑢𝑟𝑎𝑡𝑖𝑜𝑛 𝑜𝑓 𝐷𝑖𝑠𝑝𝑙𝑎𝑐𝑒𝑚𝑒𝑛𝑡)
(Equation 2)
The displacement cost was assumed to be linearly proportional to the rental cost of the building. Both
rental costs and disruption costs were estimated as a per-square-foot value dependent on the occupancy
type: single-family residential, multi-family residential, or commercial. These per-square-foot values were
obtained from the FEMA Benefit-Cost Analysis Re-engineering document and are shown in Table 8 below
(FEMA, 2011). The duration of displacement was assumed to be dependent on both occupancy type and
inundation depth and is shown in Table 9 below.

[25]
Table 8: Rental Costs and Disruption Costs by Occupancy Type
Occupancy Type Rental Cost (2008, $/sq. ft./month)
Disruption Costs (2008, $/sq. ft.)
Rental Cost (2016, $/sq. ft./month)
Disruption Costs (2016, $/sq. ft.)
Single Family Area
0.73 0.88 0.82 0.99
Multi Family Area 0.65 0.88 0.73 0.99
Retail Trade Area 1.25 1.16 1.40 1.30
Table 9: Duration of Displacement by Occupancy Type and Inundation Depth
Occupancy Type Displacement
for 0' - 4' Displacement
for 4' - 8'
Displacement for 8' +
(Inside FP)
Displacement for 8' +
(Outside FP)
Single Family Area 12 15 24 18
Multi Family Area 14 15 18 24
Retail Trade Area 14 15 18 24
The square foot floor area of each building within the affected areas were obtained from NYC Department
of City Planning’s MapPLUTO data. The data also contained land use information used to determine the
occupancy type of each building. The methodology outlined in the Property Structure and Content section
above was used to determine the water levels at each property in each storm event scenario.
Results
The mitigated damages for each storm event are shown in Table 10 below. Both the existing dunes and
the Living Breakwaters Project contribute to the mitigated costs due to their flood prevention and wave
reduction effects. The Expected Annual Damages are shown below in Table 10. Similar to the mitigated
property structure and content damages, mitigated displacement costs were incurred only for the 50 year
and 100 year storm events with 30” sea level rise. In these storm events, the Project provided wave energy
reductions that resulted in a quantifiable reduction in displacement and disruption time.
Table 10: Mitigated Displacement Costs
Return Period
Annual Chance
Time Period
Mitigated Damages for Residential Properties
Mitigated Damages for Commercial Properties
Mitigated Damages
for Commercial Properties
EAD: Expected Annual
Damages
50 year 2% With 30" sea
level rise $2,161,535 $157,250 $2,318,785 $46,376
100 year 1% With 30" sea
level rise $8,076,002 $8,764 $8,084,766 $80,848

[26]
iii. Reduction in Expected Casualties (Mortality and Injuries)
Projected Mortality and Injury Estimates
Mortality estimates were developed assuming impacts would be comparable to those for a Superstorm
Sandy type event and a 100-year storm return period extrapolated over the 50-year project evaluation
period (planning horizon). The historical record was examined and two individual deaths were reported
for the Tottenville section of Staten Island (Annese, 2012). These Sandy deaths were related to individuals
being carried away by the storm due to wave damage to the structures they occupied. Drowning deaths
can result from high velocity of destabilizing moving water enhanced by wave action. Furthermore,
injuries such as lacerations can result as storm victims are pushed into sharp objects by moving water
enhanced by waves. Therefore, the BCA includes likely avoided mortality benefits and associated injuries
that would be attributed to the wave attenuation properties of the Living Breakwater Project. The
Expected Annual Damages calculation applied for this BCA over the 50-year project evaluation horizon is
based on the 1% annual chance event. The adjustment factor calculation adjusts the total Value of
Statistical Lives (VSL) monetary estimate for two expected deaths by a 1% factor (return period reciprocal:
1/100) each and every year over the projection period. The 1% factor is also applied to the estimated
projected injuries.
Parameters and Assumptions Applied
Table 11 shows key parameters and assumptions applied in the mortality and injury estimates.
Table 11: Parameters and Assumptions Applied in Mortality and Injury Estimates
Parameters Value
Discount Rate 0.07
\a Expected Fatalities avoided: 2
Storm event return period 100
Annual 1% chance storm 0.01
Fatality Rate (% of base population at risk) 0.274%
\b Injury Rate: 10.4%
The fatality rate, shown in Equation 3 was calculated as the number of reported deaths divided by the
estimated population at risk shown below in Table 12. This fatality rate was applied to the projected
population at risk over the projection period time horizon.
Fatality Rate = [2 / 730] x 100 = 0.274% (Equation 3)
Population at Risk
Analysis of the population at risk was based on the historical record and the base population for the
number of households located within the FEMA at risk zone for the Tottenville, Staten Island project area.

[27]
A buffer area was applied to account for residents impacted by Superstorm Sandy who were also injured
from the storm event, and were located adjacent to FEMA designated zones, but outside of the flood risk
zones (CDC, 2014). Table 12 shows the data that was used to estimate the population at risk.
Table 12: Data Applied to Estimate Population at Risk
Data Value Source
Avg. HH Size 2.99 2010 Census, Tottenville/EIS
Residential Units (FEMA zone + buffer) 244
Estimated At Risk Population 730
Population Growth Rates
The population growth rates applied to the base population at risk in the projections were sourced from
New York Metropolitan Transportation Council’s (NYMTC) population projections for Traffic Analysis Zone
(TAZ) 2206 (NYMTC, 2016). Table 13 shows the population levels for this TAZ corresponding to the
Tottenville, Staten Island area, and the annual growth rates calculated.
Table 13: Projected Population for TAZ 2206
Year Population Gr. % CAGR (5 yr. intervals)
2010 4259
2015 4490 5.4% 1.1%
2020 4618 2.9% 0.6%
2025 4617 0.0% 0.0%
2030 4617 0.0% 0.0%
2035 4617 0.0% 0.0%
2040 4617 0.0% 0.0%
2045 4617 0.0% 0.0%
2050 4617 0.0% 0.0%
Source: \c NYMTC
The injury rate was sourced from a Centers for Disease Control (CDC) report released post-Superstorm
Sandy. This study entitled Nonfatal Injuries 1 Week after Hurricane Sandy — New York City Metropolitan
Area, October 2012 examined reported injuries one week after Sandy, by area (CDC, 2014). The study
found that of the at-risk population, 10.4% sustained an injury in the first week after Sandy (CDC, 2014).
Table 14 shows the data that was applied to calculate a base year number of likely injuries sustained.

[28]
Table 14: Data Applied to Estimate Non-fatal injuries Parameter Value Note
Estimated At Risk Population 730
Injury Rate: 10.4% \a sustained an injury within first week after Sandy
Percent with 2 or more injuries: 70% \a
Average injuries per person (for the 70%) 3.1 " "
Base Pop. level estimated no. of injuries: 75.87 Estimate from at Risk Population
70 % population with est. 3.1 injuries 53 \a
Remaining population, assigned 1 injury 22.76
Estimated total injuries 187 Source: \a CDC. MMWR / October 24, 2014 / No. 42
The injury rate was applied to the projected population at risk over the project evaluation period to
calculate the expected number of non-fatal injuries adjusted by the number of multiple injuries sustained
by 70% of the impacted population at risk. From Table 2 of the CDC Study, the severity of injuries reported
were mostly arm cuts, leg cuts, hand cuts and back, leg and foot strains. These types of injuries were
cross-referenced to the most likely Abbreviated Injury Scale (AIS) suggested for use under the HUD
Guidance for Benefit Cost Analysis (HUD CDP 16-06). Table 15 reproduces the AIS table below.
Table 15: Selected Sample of Injuries by the Abbreviated Injury Scale (AIS) AIS Injury Severity Selected Injuries
1 Minor Superficial abrasion or laceration of skin; digit sprain; first-degree burn; head trauma with headache or dizziness (no other neurological signs).
2 Moderate Major abrasion or laceration of skin; cerebral concussion (unconscious less than 15 minutes); finger or toe crush/amputation; closed pelvic fracture with or without dislocation.
3 Serious Major nerve laceration; multiple rib fracture (but without flail chest); abdominal organ contusion; hand, foot, or arm crush/amputation.
4 Severe Spleen rupture; leg crush; chest-wall perforation; cerebral concussion with other neurological signs (unconscious less than 24 hours).
5 Critical Spinal cord injury (with cord transection); extensive second-or third degree burns; cerebral concussion with severe neurological signs (unconscious more than 24 hours).
6 Unsurvivable Injuries, which although not fatal within the first 30 days after an accident ultimately result in death.
Source: HUD CPD-16-06
The estimated injuries were therefore assigned as AIS 1 Minor given that they corresponded to AIS 1.
Estimating the Avoided Monetary Cost of Mortality and Injuries
To estimate the avoided monetary cost of projected deaths and injuries, the HUD Guidance Source, Table
2-2: Relative Disutility Factors by Injury Severity Level, (for Use with 3% or 7% Discount Rates) (HUD CPD-

[29]
16-06) was applied. The cumulative number of deaths and injuries were valued by applying the 2016
Dollar values to these injury estimates by year.
Table 16: Relative Disutility Factors by Injury Severity Level, (for Use with 3% or 7% Discount Rates)
AIS Code Description of Injury
Fraction of VSL
2015 Dollar Value
2016 Dollar Value
AIS 1 Minor 0.003 $28,800 $29,287
AIS 2 Moderate 0.047 $451,200 $458,828
AIS 3 Serious 0.105 $1,008,000 $1,025,042
AIS 4 Severe 0.266 $2,553,600 $2,596,773
AIS 5 Critical 0.593 $5,692,800 $5,789,047
AIS 6 Unsurvivable/Fatal 1 $9,600,000 $9,762,305 Sources:
See HUD CPD-16-06, page 9. Note that the original table found within the HUD Guidance was updated per the table called “Relative Disutility Factors by Injury Severity Level, (for use with 3% or 7% Discount Rates) sourced from the FAA document, <<econ-value-section-2-tx-values.pdf>> https://www.faa.gov/regulations_policies/policy_guidance/benefit_cost/media/econ-value-section-2-tx-values.pdf U.S. Department of Labor, Bureau of Labor Statistics, CPI
Combined annual values for both the projected avoided costs of mortality and the avoided cost of injuries
were calculated in the final step of the valuation procedure. The projected annual values were then
discounted to present values by applying the HUD BCA Guidance 7% discount rate (HUD CPD-16-06).
iv. Avoided Mental Health Treatment Costs
After Superstorm Sandy, researchers quantified the incidence of depression, anxiety and Post Traumatic
Stress Disorder (PTSD) on the impacted populations in the New York metropolitan region. In a study titled,
The Impact of Hurricane Sandy on the Mental Health of New York Area Residents, Schwartz et. al. (2015)
applied multivariable logistic regression models to examine the relationships between Superstorm Sandy
exposure and depression, anxiety, and post-traumatic stress syndrome (PTSD). The probable depression
was reported in 33.4 percent of the participants and the probable anxiety in 46 percent, and PTSD in 21.1
percent. Increased exposure to Superstorm Sandy was associated with a greater likelihood of depression
even after controlling for demographic factors known to increase susceptibility to mental health issues
(Schwartz, et. al., 2015).
To quantify the monetary cost of the avoided mental health treatment for depression and anxiety, this
BCA applies the results of the incidence rate for PTSD of 21 percent to the estimate of the exposed
population calculated for the Tottenville, Staten Island area for the casualty estimate. From this
depression-affected sub-set of area residents, the BCA then applied the updated total per person
treatment cost for mental health care that is used by FEMA (FEMA, 2012). This mental health treatment
cost value was then adjusted for the expected annual chances of the storm events modelled in the avoided
property damages estimates.

[30]
v. Avoided Lost Productivity Costs
The BCA applied the established FEMA methodology to calculate the avoided lost productivity costs for
the cohort that would most likely experience mental health problems, anxiety and depression calculated
above. FEMA also published suggested lost productivity losses per worker per day in their supplementary
guidance (FEMA, 2012). These values were escalated to current 2016 US$ values per HUD Guidance. To
calculate the number of wage earners who would most likely be unproductive because of mental health
problems and anxiety, the labor force participation rate of 62.7% was applied to the group of individuals
estimated from the exposed population of the Project alignment area who would most likely experience
PTSD and anxiety. This lost productivity avoided cost estimate value was then adjusted for (annualized)
the expected annual chances of the storm events modelled in the avoided property damages estimates.
vi. Avoided Shore Erosion/Dune Reconstruction Costs
Shoreline erosion benefits were based on the cost of restoring and replacing the cubic yards of shoreline
that would have been lost annually over the 50-year evaluation period under the Future without Project
scenario. This measure is a way of estimating the economic value of lost land that would occur in the
absence of the Project, without any interventions that arrest erosion. The Living Breakwaters Project
would avoid these maintenance and restoration costs over time. Because of the increased interest in
beach restoration and nourishment projects in the New York and New Jersey area, the demand and supply
market balance for fill materials has led to higher premium prices (SCAPE Appendix D, 2016). From this
perspective, the Project offers substantial economic benefits as the up-front investment costs would
result in substantial periodic maintenance cost savings over the 50-year evaluation period.
The avoided cost estimate is based on the volume (cubic yards) of materials that would be replaced at
various intervals over time. Under the Future Without project scenario, modelling results have indicated
that the projected shoreline change with erosion would amount to 12,940 cubic yards per year over the
50-year Planning Horizon. The avoided total volume of sand placement from the Project was estimated
to be 647,000 cubic yards. The cost per cubic yard ($101/cy) was sourced from the Opinion of Probable
Cost analysis and reflects current local market conditions as described above. The Design team
characterized this process based on historical erosion rates occurring over the period spanning 1978-2012.
Without the project, this erosion is expected to occur over the entire shoreline affected by the Project,
within a 5000 – 6000 linear foot range (Arcadis, December 9, 2016).
In addition, the Project area is susceptible to the ocean-like shoreline conditions of Staten Island under
storm/erosion conditions due to the regional funnel/surge effect that makes it comparable to ocean
environments in terms of storm-induced erosion. The New York Bight Apex always experiences
abnormally high surge levels attributable to the right angle made by Long Island and New Jersey coastlines
that significantly increases storm surge levels wherever a hurricane has made landfall in the New York
Bight Apex (Coch 2015).
The estimates of shoreline restoration costs and nourishment project interventions (that would be
avoided with Living Breakwaters) are supported by a review of case studies examined for the purposes of

[31]
assessing the actual historic volumes of fill materials that would be mobilized (per project) for shoreline
protection. These case studies were reviewed to get a sense of the volume of materials associated with
actual projects in the New York coastal zone per linear foot of shore protection project. Select beach
locations were available for the New York shoreline and they provided an indication of the volume of
materials mobilized for these projects (BND, 2016).
Figure 4
Illustrative Shoreline Dynamics - Observed Historic Shoreline Change
1978- Spring 2012 (Pre-Sandy)
Source: Modeling Report. Arcadis

[32]
Figure 5
Figure 5 shows a bi-modal distribution of projects and the average volumes of material per linear foot (LF)
of shore. At least 10 projects show fill volumes between 51-101 cubic yards per LF of shoreline protected.
A scatter plot was also prepared for shorelines that were close in length to the Project alignment area.
Figure 6 shows the scatter plot of LF of shore protection projects versus the cubic yards per LF of materials
mobilized. Projects with shore lengths between 4,000 and 7,000 LF were characterized by CY/LF amounts
of between 50 and 75 cubic yards/LF.
Figure 6

[33]
This above data was referenced to inform and simulate the likely size of shoreline nourishment events
(projects), given the total volumes estimated from the modelling exercise.
The avoided cost estimate was based on replacing fill along the shoreline erosion area at periodic intervals
(every four years), as well as periodically reconstructing the dune based on a dune reconstruction cost
estimate provided by NYC Department of Parks & Recreation (NYC Parks, 12/12/16). In addition, the BCA
also simulates a total dune replacement construction cost that would occur two times over the project
evaluation horizon of 50 years. This latter cost was also sourced from NYC Parks and was escalated to
2016 dollars from the original 2013 dollar cost (NYC Parks, 01/03/17).
It was assumed that without the Project sustained erosion would continue, punctuated by storms (and
their impacts). For purposes of Benefit Cost Analysis, it was assumed that – absent the Project - this would
require more frequent reconstruction efforts every few years. The BCA addresses the value of land that
would be lost “but for” the Living Breakwaters Project. The avoided cost of shoreline nourishment and
dune reconstruction addresses this value over time because it is linked to rates of erosion.
To address the value of eroded shoreline, unit costs for replacement fill were also sourced from the
Opinion of Probable Cost for the Project’s 30 Percent Design Report document and applied in the
estimates. The cost per cubic yard of fill for shoreline restoration (source, transport, and load/install sand)
was applied as derived from the 30 Percent Design Report Opinion of Probable Costs. These unit costs
were applied to the volumes of shoreline that would be eroded over time without the project.
vii. Avoided Road Closure/Travel Disruption costs
Superstorm Sandy resulted in substantial travel time delays for commuters due to closed roads, poor road
conditions and damages sustained from debris carried onto roads from wave surges and strong winds
(PlaNYC, 2013). Following Sandy, commuters who did not have the option to telecommute experienced
increased frustration levels and substantial increases in commute times from traffic congestion and
detours, with commute times sometimes spanning two to three times as long as their normal pre-Sandy
daily commute. Since Staten Island is geographically separated from the major centers of employment in
Manhattan, the frustration levels (measured by an index out of 10, with 10 being the highest) were
relatively high (7 out of 10). For Staten Island residents the average pre-Sandy commute time was 84
minutes. The average post-Sandy commute time (Nov. 1-2) was 240 minutes (Kaufman et. al. 2012).
The BCA applies the FEMA methodology to value the cost of avoided road closures based on the value of
time. This method recognizes that individuals who experience increased travel time due to bridge or road
closures attach an economic value to the lost time incurred (FEMA, 2011).
To value the avoided travel time delays associated with avoided road closures and disruptions, the
working age population was estimated from the Traffic Analysis Zone (TAZ, 2206) population for the
Tottenville shoreline community based on the labor force participation rate. It was assumed that an

[34]
average two-hour delay would be incurred over a two-week period for this group of estimated
commuters. The value per hour applied ($33.5/ hour, 2016) was updated from FEMA’s guidance value for
2011 based on applying the Consumer Price Index. The resulting travel time disruption value was then
converted to an Expected Annual Damages amount. The Expected Annual Damages amount was based
on the 1% chance annual storm event factor for the 100-year design event per the Project assumptions
noted in the appendix.
viii. Avoided Cost of Power Outages
Power outages caused considerable disruptions following Sandy. It has been estimated that 120,000
customers lost power on Staten Island, and repairing damage to the aboveground electrical power
network took approximately two weeks (PlaNYC, 2013).
The BCA applies the FEMA method to value power outages under the 100-year design storm event (FEMA,
2011). Application of the FEMA method involved first estimating the functional downtime (measured as
the system days of lost service). Using this approach, a two-week functional electrical service disruption
estimate was assumed for the Tottenville community under a 100-year design storm event. This
corresponds to the likely impacts from a 100-year storm event. The population for the Traffic Analysis
Zone (TAZ 2206) applicable to the study area was used as a proxy for the number of people served by the
electric power utility. The economic impacts of lost electric power service was then calculated using the
per capita economic impacts and the affected population. FEMA has developed per capita values to
calculate the economic impacts, and these values were updated to 2016. Table 17a shows the value
applied in the BCA.
Table 17a: Economic Impacts of Loss of Electric Power (per capita per day)
Category Economic Impact (2010 dollars)
Economic Impact (2016 dollars)
Impact on Economic Activity $106 $118
Impact on Residential Customers $25 $27
Total Economic Impact $131 $145 Source: FEMA 2011
The resulting avoided annual cost of lost power was then converted to an Expected Annual Damages
amount based on the 1% chance annual storm event factor for the 100-year design event.

[35]
ix. Avoided Cost of Damaged Vehicles
Inundation would damage motor vehicles—including cars, small trucks, and heavy-duty trucks. The
damaged incurred to vehicles depends on the vehicle type. Automobiles, which are closer to the ground
than small trucks or heavy-duty trucks, are more susceptible to water damage than larger vehicles.
In the study area, vehicles parked at residences are at risk. However, unlike other assets, motor vehicles
could be moved away from potential inundation zones, avoiding damage from inundation. The number
of vehicles within the study area was determined using the Hazus Daytime Vehicle Inventory. In this
database, vehicle distributions within a census block are estimated based on the occupancy-type of each
census block. The database also includes the total value of vehicles susceptible to inundation in each
census block.
The damage to vehicles was calculated as a portion of the total value of vehicles in a census block. First,
the number of vehicles affected by inundation was estimated by applying the percentage of inundation
buildings in a census block to the total valuation of vehicles in a census block. For example, if 40% of
buildings within a census block were affected by inundation, 40% of the vehicle valuation in a census block
was estimated to be affected by inundation. Next, depth damage functions for vehicles were used to
estimate the damages as a function of the value of affected vehicle valuations. For example, if 10% of the
inundation area had a depth of 1 feet, then the damages to vehicles at that flood depth was estimated as
15% of the vehicle valuation.
Using this methodology for both Future with and Future without scenarios, the mitigated damages to
vehicles for various storm events were calculated. The results are shown in Table 17b below. As stated in
the previous sections, the mitigated damages were estimated for today’s 100-year storm event and for
the 50-year and 100-year storm events with 30” sea level rise. For all other storm events, the existing
dune would provide sufficient wave attenuation to prevent wave damage to buildings, even without the
breakwaters.
Table 17b: Mitigated damages to vehicles
Storm Event Vehicle Damages under
Build Scenario
Vehicle Damages under
No Build Scenario
Difference (Mitigated
Damages, per event)
Today 100 Year $ 2,309,557.68 $ 2,309,557.68 $0.00
SLR 50 Year $ 2,501,928.67 $ 3,321,572.61 $819,643.94
SLR 100 Year $ 3,473,547.91 $ 4,441,396.94 $967,849.03
The mitigated event based damages were converted to Expected Annual Damages (EAD) in the benefit
cost analysis by applying Equation 1 above.

[36]
c. Environmental Value
The environmental value of the Project was estimated through the evaluation of ecosystem service
provisioning provided by the Project and subtracting negative effects of the Project on ecosystem services.
The ecosystem services for the Project were derived from a combination of the estimated habitat area (in
sq. ft./acres), and from habitat values per acre obtained from published literature sources (Grabowski et
al, 2012). The SCAPE team provided the estimates of the habitat sizes in acres for the Project that would
be both gained and displaced. The ecosystems services valuation for the BCA is limited to the value of net
acres gained by ecological service type.
Table 18 below shows the ecosystem service types valued and the original values per hectare per year.
The HUD BCA Guidelines (HUD CPD-16-06) guidance on escalating prior year values to 2016 constant
dollars was applied to update the original value estimates to 2016 values.
Changes in the intertidal and subtidal habitat areas related to shoreline restoration activities were not
addressed since the net change in area is insignificant and thus a change in ecosystem service value would
not be appreciable.
Table 18: Summary of Ecosystem Services Applied to the Proposed Living Breakwaters/Oyster Reef Project
Service Type Measurement Average Value/hectare
/year
Original Date of
Valuation
Oyster habitat/reef sustainability
density (ind./m-2) $ 880 2011
Production Augmentation Finfish and Crustaceans-
Commercial $4.12 / 10m-2 of reef area $ 4,123 2011
Shoreline Stabilization 10% reef stabilizes shoreline $ 8,600 2011
Water quality
Nitrogen removal 246 micromoles/h-1/m-22 of reef below MHW occupied by filter feeders
$ 4,050 2011
SAV enhancement 1 ha reef = 0.0 05ha SAV $ 1,292 2011
i. Total Gross Ecosystem Annual Service Gains (+)
Ecosystem services annual gains were assessed for the proposed ecologically enhanced breakwater
system and oyster restoration using the services of habitat/reef sustainability, commercial finfish, water
quality, habitat and recreation. Monetary values are derived from Grabowski et al (2012), Costanza et. al.
(2006) and Kaval and Loomis (2003). The monetary values from the literature were adjusted to 2016

[37]
values using the U.S. Bureau of Labor Statistics CPI index (Table 19). The estimated square feet of each
habitat type was derived from the calculations provided by the design team in a December 13, 2016
memorandum entitled Calculation of Available Surface Area and Marine Habitat Generated for Living
Breakwaters (SCAPE, December 13, 2016). The design team estimated that approximately 70% percent of
the total accessible surface area (ASA) of the structure would be below the mean high water tide elevation
(MHW) and suitable for marine organism colonization and use. Since this area below MHW would be a
complex area with niches and crevices inhabitable by fish and other benthic species, the actual surface
area of usable habitat created would be substantially greater than the planar surface area of the
structures. In addition, a subset of this area, approximately 40 percent, was assumed available for oyster
establishment during the initial maintenance period. These factors were applied to adjust the available
surface area of the structures that have the potential to provide ecosystem services.
Table 19. Summary of 2016 annual ecosystem service values for the breakwater/oyster reef system.
Breakwater / Oyster Reef
Service Type Accessible Surface Area1
(square feet)
Planar Reef Area
(square feet)
Acres 2016 Average Value / acre / year
Oyster habitat/reef sustainability
753375 17.3 $2,336.84
Finfish and Crustaceans
Commercial 1884437 43.3 $10,948.62
Water Quality
Nitrogen removal 1507550 34.6 $10,754.77
SAV enhancement 553212 12.7 $14,177.33
Habitat
Refugia 1884437 43.3 $435.78
Recreation (diving) NA NA 12 $9077.50 Notes: 1 – ASA is the area of reef below mean high water elevation. 2 – Recreation service is based on a single reef system.
To account for a lag time in the establishment of reef habitat and benefits, percentages (out of 100% of
full annual ecosystem service delivery) are applied to specific services during the first three years post-
construction. Table 20 lists the modifiers used in this analysis. The values applied are based on references
reporting on monitoring observations for constructed reefs and breakwaters.

[38]
Table 20: Ecosystem Habitat Extended Value/Time Lag Modifiers
Breakwater/Oyster Reef Extended Value / Time Lag Modifiers
Service Type Year 1 Year 2 Year 3
Oyster habitat / reef sustainability 0.50 0.75 1.0
Finfish and Crustaceans
Commercial 0.90 1.0 1.0
Water Quality
Nitrogen removal 0.50 0.75 1.0
SAV enhancement 0.50 0.75 1.0
Habitat
Refugia 0.9 1 1
Recreation (diving) 1 1 1
ii. Total Ecosystem Annual Services Displaced (-)
The construction of the breakwaters would displace approximately 12.7 acres of subtidal small and large
grained bottom habitat. For Sub-tidal sandy bottom, service areas and monetary values were derived from
Costanza et al (2004) and include water supply, biological control, nutrient regulation, and cultural and
spiritual values. Costanza (2004) referred to the subtidal coastal zones as “Coastal Shelf” which was
defined as the subtidal zone below the beach elevation.
Table 21: Summary of Ecosystem Services Applied to the Displaced Subtidal Habitat: Subtidal small and large grained bottom habitat
Service Type Measurement Avg. Value /acre /year
Date
Water supply acre/year $ 521 2004
Biological Control acre/year $ 20 2004
Nutrient Regulation acre/year $ 723 2004
iii. Net Ecosystem Annual Service Gains (-)
The total calculated value for the displaced subtidal habitat was subtracted or netted from the
breakwater/oyster reef total values. The net annual per acre value of the combined ecosystem service
values for Breakwater/Oyster Reef habitat is $36,123 after three years post-construction based on an
estimated 43.3 acres of habitat. The cumulative NPV from 2016 to 2066 is $11,596,212.
There is some uncertainty associated with the source of the ecosystem service values and their direct
application to the New Ecosystem Annual Service Gains, which may experience lower oyster densities and
growth rates of filter feeders, and the ability of the breakwater/oyster reef in achieving full functionality.

[39]
To account for this uncertainty, a three-year lag time for some services was built into annual valuation
based on literature sources (La Peyre et al, 2013).
To better visualize the types of ecosystem services that will be supported by the Project in the future,
Figure 7 is reproduced below.
Figure 7: Schematic of Living Breakwaters Underwater View
Source: SCAPE Press packet images.
d. Social Value
To estimate the social values that would arise from the Project, a combination of comparable usage at
similar educational and environmental stewardship facilities and area park recreational visitation patterns
was combined with benefits transfer. Benefits transfer is the process of adapting an existing value
estimate (such as the willingness to pay for an amenity or park service) and transferring it to a new
application that is in another location and may be similar, but is different from the original one. There are
two types of benefit transfers, value transfers and function transfers. A value transfer takes a single point
estimate or an average of point estimates from multiple studies, to transfer to a new policy application.
A function transfers uses an estimated equation to predict a customized value for a new policy application.
Social values for the Project were estimated by applying a “value” transfer to the unit values applied, that
represent the willingness to pay for recreational and specific type of environmental education among
potential users.

[40]
i. Education and Environmental Stewardship
The project will provide educational opportunities for area residents and recreational users, through the
application of environmental and stewardship programs, and the use of the on-shore community water
hub. It is anticipated that most educational users would be area residents from the immediate area and
lesser so from the region, as well as nearby school systems. The water hub itself will in part be geared
towards education, with classrooms and learning facilities that will make environmental education
possible year-round. All proposed water hub design concepts incorporate these types of educational
program possibilities. The water hub will be particularly relevant for education during late fall and winter,
and early spring, when outdoor activities are limited. The augmentation of the beach and surrounding
open areas by the Living Breakwaters Project will provide enhanced outdoor educational opportunities as
well. The Project offers a unique opportunity for marine based education within an urban setting.
The community water hub has the advantage of not competing with other types of facilities offering
similar amenities because it offers local and regional residents (clustered around Raritan Bay) a unique
opportunity. From this perspective, the potential for capturing specific types of visitors and the potential
for sustained growth over time is possible if it does not interfere with the activities of permanent residents
and homeowners in the Project area.
Education in a recreational and outdoor setting is typically geared towards specific extracurricular
environmental activities, and is considered a measurable aspect of recreation. It was determined that the
educational benefits associated with the Project represented a quantifiable value. To determine the
overall education value, a per-visit utility value was applied. This visitor utility value was based on the
results of a per visitor value obtained from a study conducted by Texas A&M University (Harnik and
Crompton, 2014). This figure was applied to an estimate of the total persons per year who would be
availing themselves of educational opportunities at the Project including the water hub and associated
programming, which was derived from NYC Department of Parks and Recreation figures provided by the
GOSR, to arrive at an estimated annual benefit for the project.
Based on this methodology, the cumulative present value of these benefits was estimated to be
$1,253,995.
ii. Recreation
The completion of the project will enhance recreation opportunities along the shoreline as well as just
offshore. The addition of the community water hub will allow waterfront access and a place where kayaks
can be launched and stored. The additional beach area (beach width) and calmer waters resulting from
the breakwaters will provide opportunities for the community to fish, view the waterfront, boat, and
perform other beach and water activities. These recreational opportunities represent a tangible direct use
benefit that the Project would provide. It is anticipated that the majority of recreational users will be local
area residents and some residents from the greater region.

[41]
Several approaches were considered for obtaining an estimated recreational benefit value, including
applying a value per acre value as well as a per visit utility figure. An approach using a value per visit utility
figure was used, as obtainable data supported this approach best. To obtain an estimated value, three
separate per-visit utility values were applied: one for walking, hiking, biking, and fishing (these activities
all had the same utility within the primary study utilized). Kayaking was assigned the boating value. These
value estimates were sourced from a study conducted by Texas A&M University (Harnik and Crompton,
2014). In addition, an estimate of the overall annual visitation was derived using visitation figures from a
nearby State park, Clay Pit Ponds State Park Preserve on Staten Island (CPPSP, 2016).2
The percent of annual visitors that would engage in each activity was estimated in Table 22 below.
Table 22: Recreational Users Breakout
Type of Recreation Percent of Annual Visitors
Walking, hiking, biking, and fishing
70%
Kayaking 20%
Boating 10%
The per-visit utility figure was applied to each estimated number of recreation users to arrive at an
estimated annual benefit for each type of recreation. These were then added together to arrive at a total
annual figure for all recreation. Other types of recreation may occur at the Project site, such as seashell
collecting or bird watching. As utility figures for such activities would be quite difficult to find, and
considering these types of activities could be grouped as walking or hiking, it is assumed such activities
fall into the categories for walking and hiking.
Given the novel feature that the Living Breakwaters will represent to local boating enthusiasts, additional
research was conducted on the number of small boat slips at marinas on Staten Island that could access
the Project. From the total number of slips, an estimate of potential visitation associated with these small
boats was completed. The number of potential visitors who would likely visit the Project area by small
boat was then valued by applying the above per visit utility figure. Table 23 shows the estimate of marina
slip capacity.
Table 23: Staten Island Marinas
Name Slip Capacity
Atlantis Marina 170
Captains Marine Mercury 160
Great Kills Yacht club 250
Mansion Marina 217
2 Clay Pit Ponds State Park Preserve is a 265-acre nature preserve near the southwest shore of Staten Island. It contains a variety of unique habitats, such as wetlands, ponds, sand barrens, spring-fed streams and woodlands. The preserve is managed to retain its unique ecology and to provide educational and recreational opportunities for people of all ages. Educational programs, such as nature walks, pond ecology, birdwatching and tree and flower identification, are offered, as are many activities geared to school children. The Preserve also has an Interpretive Center that is a fully accessible building featuring interpretive displays of the history of the park and of its natural elements. The Park's educational and community programs are offered at the interpretive center.

[42]
Table 23: Staten Island Marinas
Name Slip Capacity
Marina Café 270
Nichols Great Kills Marine 350
Port Atlantic Marina 240
Richmond County Yacht Club 40
Staten Island Yacht Sales 50
Tottenville Marina 240
Unnamed Marina 166
\a Estimated Total: 2153 Note: \a Select marina capacities were estimated from aerial photographs. Source: http://marinas.com/search/?search=1&category=marina&country=US®ion=NY&city=Staten+Island
The estimate of small boat total visitors was based on assuming a boat party size of three persons. It was
assumed that two-thirds of the slip capacity boats would visit the Project area three times over the course
of a year. Based on these assumptions, approximately 13,000 annual boat trips could be generated from
the available marine slip capacities estimated.
The cumulative present value of recreation benefits was estimated to be $7,095,681 over the fifty-year
period.
iii. Community Cohesion
Parks and beaches offer an opportunity for community members to meet, interact, strengthen the
community and build social capital. Several studies on the value of parks and open space include
community cohesion as one of the benefits of parks (NPRA, 2010, and Harnik, 2014). In neighborhood
parks, residents of all ages have the opportunity to interact, which improves the quality of life in the
neighborhood. Furthermore, the social capital that is created through parks - especially when neighbors
work together to create, save or renew a park or open space - not only benefits resident quality of life but
wards off anti-social problems, reducing the need for police, prisons, and rehabilitation (Harnik, 2014).
The benefit of community cohesion was not quantified. The magnitude of the benefit will be affected by
the level of community involvement during the planning and development of the project as well as by the
use of the project area and facilities by residents upon the project’s completion.
iv. Workforce Development
The Project includes a workforce development program for which the details still have to be developed.
It is expected that the program will train participants prior to the construction period (e.g., skills such as
welding), during construction and during operations (e.g., marine education skills). Children of
participants in the workforce development program are expected to benefit from their parents’

[43]
employment beyond the value of increased wages and benefits (Ridley 2011). Examples include improved
academic achievement, health improvements and improved workforce prospects (Magnuson 2007).
Studies show that when mothers with low education levels complete additional education, their children
appear to have improved language and reading skills (Magnuson 2009).
The social value impact of the workforce development programs on families who would benefit from the
Project was not quantified. The magnitude of the benefit will depend on the number of participants with
families and the prior education and income levels of participants, however, there is a community benefit
to performing this service.
The program objectives will allow students from disadvantaged, minority and low-income communities
to attend educational events and enjoy trips to the water hub, and Project area. The goals of the program
are to provide these educational and environmental stewardship services to public schools who could
arrange for trips to the Project area. Therefore, the water hub and associated programming activities
provides an outlet for these students from all walks of life who attend schools within the NY Metro area.
This proximity will result in greater access and exposure to the resilient environmental and community
asset.
e. Economic Revitalization
Economic revitalization benefits will arise from the Project’s short-term construction phase impacts on
jobs, earnings and regional output, and will accrue to local adjacent property owners from anticipated
positive property value impacts beyond those provided by the coastal risk reduction function of the
Project.
i. Economic Impacts
Job Creation
During the construction phase, the project will support jobs in construction and related industries. Upon
its completion, the project will support jobs related to the O&M of the community water hub and
programming activities, breakwater, oyster restoration efforts and beach. While typically not a net
benefit to society, job creation constitutes a positive contribution to the New York City and New York
State economies. Due to the unique character of the Project, it may attract local and out-of-state visitors
whose spending would further increase the economic contribution of the Project to the New York City
and State economy, respectively.
Construction Phase
An analysis performed by AKRF as part of the Draft Environmental Impact Statement (DEIS) for the Project
found that the construction of the Project (Alternative 3 in DEIS) would support a total of direct jobs,

[44]
equivalent to 282 person-years3 of employment in the construction and related industries. Considering
the indirect and induced jobs that would be generated through the multiplier effect, the Project would
support an additional 129 person-years of employment in New York City and an additional 8 person-years
of employment in the rest of New York State.
The estimate is based on a cost of approximately $66.5 million in 2016 dollars, which includes all hard
costs for the Living Breakwaters Project but excludes contingency costs.
Operation and Maintenance Expenditures
O&M expenditures of the community water hub would include utilities (energy, water, and solid waste),
programming expenditures including programming staff, and building maintenance expenditures, which
would also include staff. In addition, O&M expenditures would arise from breakwaters and oyster reef
annual sustainment. In addition, monitoring activities would also generate annual spending impacts to
the region. The BCA referenced the Alley Pond Environmental Center Inc. (APEC), located in Queens, as
an example of an organization with a similar related mission of environmental education and stewardship,
as a frame of reference for a portion of the Project’s O&M. APEC is a non-profit organization dedicated
to educating children and adults in the New York metropolitan area, protecting and preserving Alley Pond
Park, open spaces and water bodies, and advocating for sustainable environmental policies and practices.4
Based on the APEC 2014-15 Annual Report, a total of 45,239 children and 17,570 adults were served by
APEC’s education programs. The operating expenditures of the APEC in the fiscal year 2014-2015 were
$910,000 of which $550,000 was used for employee compensation and building utilities and sustainment.5
While not entirely comparable, these values do provide an indication of the type of annual spending
impact in terms of the relative magnitude of dollars per year that would be indicative of a similar range
for the Project. These annually recurring expenditures would also generate direct, indirect and induced
economic impacts within the community and region.
Visitors (not quantified)
Should the Living Breakwater Project attract visitors from outside New York City, or outside New York
State, spending by these visitors (i.e., food, retail, transportation, and other recreation) would generate a
positive impact on the New York City and New York State economies. For example, it can be expected
that a portion of the visitors attending the family and adult education programs and/or persons traveling
to the area for recreational purposes (e.g., kayaking) may reside outside of New York City, especially from
neighboring New Jersey. The potential impact of visitor spending was not quantified due to the difficultly
of anticipating the number of regional visitors but it is expected to add some value in the future.
Increased Earnings and Benefits
The Project includes a workforce development program for which the details have not been developed. It
is expected that the program will train participants prior to the construction period (e.g., skills such as
3 A person-year of employment is the equivalent of one person working full-time for one-year. 4 Alley Pond Environmental Center, 2014-2015 Annual Report 5 Alley Pond Environmental Center, 2014-2015 Financial Statements

[45]
welding), during construction and during operations (e.g., marine education skills/operations). After
completing the training, participants in this program may benefit from a lifetime increase in earnings,
which would represent a long-term benefit of the project.
ii. Property Value Impacts
Economists have applied hedonic property price based statistical (regression based) methods to isolate
the effects of various attributes or amenities that can influence property values. Hedonic methods analyze
how the different characteristics of a marketed good, including environmental quality, might affect the
price people pay for the good or factor. This type of analysis provides estimates of the implicit prices paid
for each characteristic, such as the number of rooms, and the quality of the adjacent host environment.
A hedonic price function for residential property sales might decompose sale prices into implicit prices for
the characteristics of the lot (e.g., acreage), characteristics of the house (e.g., structural attributes such as
square footage of living area), and neighborhood and environmental quality characteristics. In terms of
aquatic ecosystems, properties with closer proximity to these systems may sell for more than similar
properties that do not have this adjacency or proximity (NRC, 2005).
The hedonic analysis method is a statistical procedure for accounting for, and disentangling estimates of
the market price premium that residents pay for ocean frontage or having access to higher quality
recreational amenities and ecological services. The BCA applied a hedonic market study that quantified
the market value property value premium associated with the width of the beach itself. This study was
particularly relevant to the Project’s objectives of arresting beach erosion and providing for a contiguous
beachfront and improved utility and access along the Project alignment.
The BCA applied a particular study that examined the increase in residential property values associated
with a one-foot increase in beach width (Gopalakrishnam et. al, 2010). The study included a functional
determination or elasticity of (distance to x beach width) with respect to home prices. According to the
study, a one-foot increase in beach width was associated with a 0.5% increase in home prices for those
homes located within 32.8 feet from the LiMWA. To apply the results of this study through benefits
transfer techniques, the BCA used GIS to isolate those homes within the Project area that were within 10
meters (32.8 feet) from the Limits of Moderate Wave Action (LiMWA).
For the parcels located within 32.8 feet from the LiMWA, the cumulative present value of the beach width
premium portion of the property value increase amounted to $2,953,868 over the period spanning from
2016-2066 (a 50 year period). This market premium was based on holding the current market value of
these properties constant in 2016 dollars as per HUD BCA Guidance (HUD CPD-16-06).

[46]
IX. Project Risks
a. Description of Project Risks
Project risks generally relate to issues that could influence both the cost and timing of construction (SCAPE
Appendix D, 2016), as follows:
Ecological Limitations on Construction Periods - The winter flounder spawning season typically
spans from January to May, while the horseshoe crab spawning season can potentially impact
the project from Mid-April to Mid-August. Flounder and horseshoe crab mating seasons have the
potential to lengthen the Project construction phase as construction activities could be
suspended during the spawning seasons thereby extending the needed timeframe for
construction. The BCA incorporates these restrictions to the construction timeline. For the BCA,
a 19-month construction schedule was applied instead of a 14-15 month construction schedule.
Availability of Construction Materials - Other factors relate to sourcing and availability of raw
materials used in construction. This risk relates to contracting with the lowest cost suppliers of
stones in sufficient quantities, with the appropriate rock sizes and qualities, having the needed
surface textures to support and grow habitats. In addition, there is some risk related to sourcing
sand quantities that meet quality and suitability criteria for shoreline restoration. Given high
demand for beach nourishment fill in the New York/New Jersey region unit prices may be higher
for these materials that could influence Project construction costs.
Localized Unfavorable Construction Conditions - In addition, some project aspects could
influence the estimated construction costs such as unanticipated soft soils/sediments that may
be encountered in certain locations. These soils could lead to remedial procedures that could
raise costs.
Extreme Weather Conditions - The storm/hurricane season in New York has the potential to
influence the construction schedule.
Stakeholder Concerns - Other risks relate to the possibility that certain stakeholders have
concerns about the Project that could affect its construction schedule and cost. It is noted that
the Design Team has performed informative outreach activities, and will continue to perform
these activities, to inform stakeholders about the goals, objectives and benefits of the Living
Breakwaters Project and get regular feedback from stakeholders throughout the design process.

[47]
b. Sensitivity Analysis
A sensitivity analysis was completed that assessed the impacts on the Project’s cumulative present value
of net benefits and BCRs of potential increases in Project costs and reductions in anticipated Project
benefits for the categories providing the most value (and thus most likely to affect the BCR and NPV).
Table 24 shows the results of the sensitivity analysis.
Table 24: BCA Sensitivity Analysis Test Baseline Project Net
Present Value / BCR Project Net Present Value with Change
BCR with Change
Switching Value \a
[1] [2] [3] [4] [5]
Increase in Capital Costs (30%) $13,654,244 / 1.22 -$2,818,743 0.96 24.867%
Increase in Annual O&M (50%) $13,654,244 / 1.22 $10,114,140 1.15 192.9%
Decrease in Resiliency Benefits (Percent of Baseline Estimates): 74.33%
90% of Baseline $13,654,244 / 1.22 $8,334,438 1.13
80% of Baseline $13,654,244 / 1.22 $3,014,632 1.05
70% of Baseline $13,654,244 / 1.22 -$2,305,174 0.96
Decrease in Environmental Values (Percent of Baseline Estimates)::
90% of Baseline $13,654,244 / 1.22 $12,491,148 1.20
80% of Baseline $13,654,244 / 1.22 $11,328,053 1.18
70% of Baseline $13,654,244 / 1.22 $10,164,958 1.16
60% of Baseline $13,654,244 / 1.22 $9,001,862 1.14
50% of Baseline $13,654,244 / 1.22 $7,838,767 1.13
0% of Baseline $13,654,244 / 1.22 $2,023,290 1.03
Notes: \a The switching value is the value that renders the cumulative net present value of the Project equal to zero, (B=C, BCR=1.0), holding all of the other variables constant.
Column [1] shows the type of stress test the BCR and present value of net benefits (NPV) were subjected
to. A thirty percent increase in capital costs would lower the BCR from 1.22 to 0.96, and erase the positive
cumulative net present value of the Project. The Switching Value shows the increase in capital costs that
would render the net present value of the Project equal to zero. A fifty percent increase in annual O&M
would lower the baseline BCR from 1.22 to 1.15, holding all other variables constant.
Resiliency and environmental values provide the majority of the benefits for the Project. The sensitivity
analysis starts by reducing the combined value of resiliency benefits to a percentage of the baseline total
values. The Project’s total net present value would still be positive even if resiliency benefits fell to 80
percent of their current estimated level. The switching value for combined resiliency benefits is 74.3
percent of the baseline level.
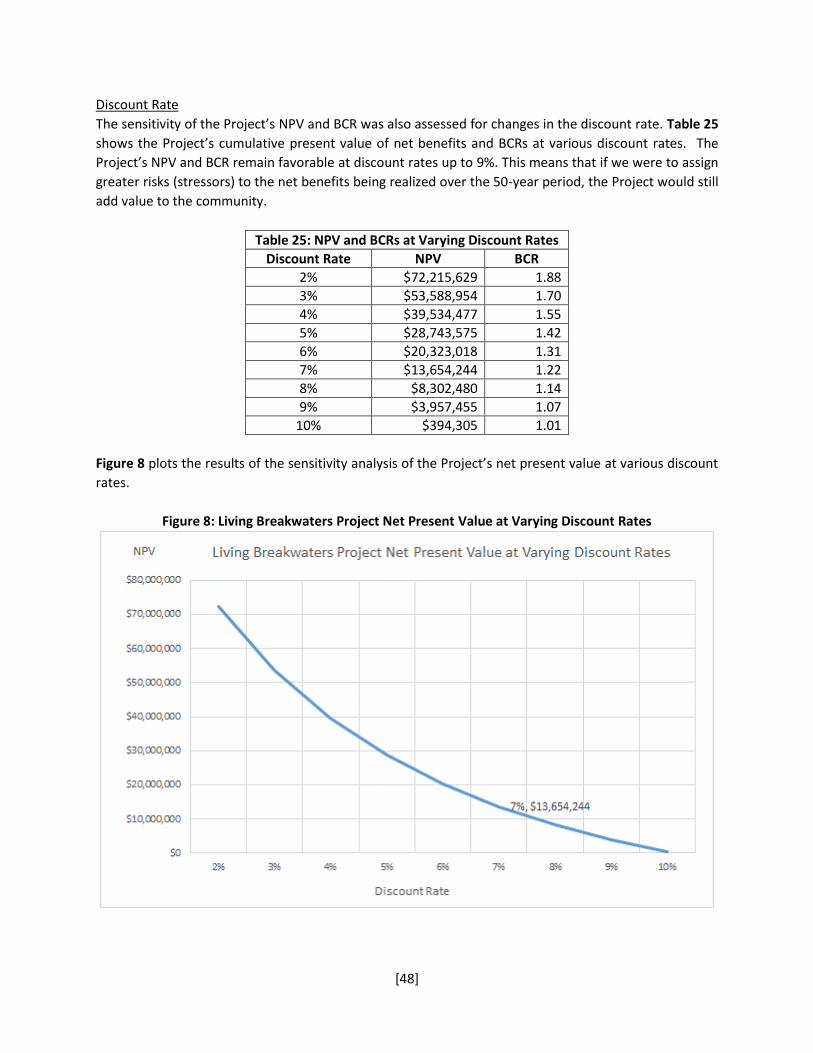
[48]
Discount Rate
The sensitivity of the Project’s NPV and BCR was also assessed for changes in the discount rate. Table 25
shows the Project’s cumulative present value of net benefits and BCRs at various discount rates. The
Project’s NPV and BCR remain favorable at discount rates up to 9%. This means that if we were to assign
greater risks (stressors) to the net benefits being realized over the 50-year period, the Project would still
add value to the community.
Table 25: NPV and BCRs at Varying Discount Rates
Discount Rate NPV BCR
2% $72,215,629 1.88
3% $53,588,954 1.70
4% $39,534,477 1.55
5% $28,743,575 1.42
6% $20,323,018 1.31
7% $13,654,244 1.22
8% $8,302,480 1.14
9% $3,957,455 1.07
10% $394,305 1.01
Figure 8 plots the results of the sensitivity analysis of the Project’s net present value at various discount
rates.
Figure 8: Living Breakwaters Project Net Present Value at Varying Discount Rates

[49]
X. Assessment of Implementation Challenges
As outlined in the description of the Project risks noted above, the Project faces some implementation
challenges. These challenges relate to coping with unforeseen factors that can affect construction costs
and unanticipated delays in the construction schedule, and other uncertainties associated with offshore
coastal construction and permitting. In addition, some challenges relate to effectively explaining the
Project benefits to select constituencies and the overall community.
However, the sponsor and design team are effectively addressing these challenges in pro-active and
engaging ways that are reducing the risk to successful implementation of the Project. A variety of public
outreach and informational meetings have been scheduled, including the creation of a Citizen’s Advisory
Committee to allow stakeholders to advise GOSR on design concerns and ultimately construction impacts.
These activities will continue to be hosted and promoted in the future.
XI. Conclusion
This BCA for the Living Breakwaters Project was prepared by following the HUD BCA Guidance for APA for
RBD Projects (HUD CPD-16-06). The analysis was completed using generally accepted economic and
financial principles for BCA as articulated in OMB Circular A-94.
The Project is designed to 1) Reduce coastal risk through decreasing exposure to wave action and
associated erosion along the shoreline in Tottenville, Staten Island; 2) Enhance habitat functions and
values supporting local ecosystems through the creation and improvement of near shore and coastal
habitat; and 3) Foster stewardship and recreational and educational use of the coast and nearshore
through increased awareness, access, and participation.
Using a 7% discount rate, and a 50-year planning evaluation horizon, the Project will generate substantial
net benefits to the shoreline community of Tottenville, Staten Island, New York, as well as other
beneficiaries from the New York metropolitan region, and regional visitors who use this community asset.
Table 26 and Figure 9 Living Breakwaters Project – Benefit Cost Analysis Summary provides more details
on the categories of benefits and costs that were estimated.
To summarize, the lifecycle costs to build and operate the proposed Living Breakwaters Project
investment (amounting to $62.4 million in constant 2016 present value dollars) would generate the
following quantified benefits (and not including benefits discussed above but not quantified for various
reasons):
Total Benefits of $ 76.1 million, of which:
o Total Resiliency Values are $53.2 million
o Total Environmental Values are $11.6 million
o Total Social Values are $ 8.3 million, and
o Economic Revitalization Benefits are $2.95 million

[50]
The Project’s cumulative present value of net benefits is $13.7 million and the BCR is 1.22. These
measures of project merit demonstrate that the Project is viable and would add value to the community,
the environment and the economy.
The Project’s future annual benefit and cost streams, projected over the 50-year horizon, were also
subjected to a sensitivity analysis examining the impacts of implementation phase and operational risks.
The sensitivity analysis examined potential cost overruns and increases as well as significant reductions in
the largest benefit categories. The results showed that the Project’s net present value of benefits are
robust and can withstand these stress events given the uncertainties that may arise, and still be
economically viable over this period.
Table 26: Living Breakwaters Project - Benefit Cost Analysis Summary Constant 2016 US Dollars
Cumulative Present Values (2016-2066)
At Discount Rates of:
7% 3%
LIFECYCLE COSTS
Project Investment Costs \a $54,909,955 $61,150,787
Operations & Maintenance (O&M)
Maintenance $7,080,207 $14,507,755
Monitoring $453,411 $829,867
Total O&M $7,533,618 $15,337,622
Total Costs $62,443,573 $76,488,409
BENEFITS
Resiliency Values
Avoided Property Damages $4,888,646 $12,645,701
Avoided Casualties (Mortality & Injuries) $2,859,166 $5,858,597
Avoided Mental Health Treatment Costs $506,972 $965,226
Avoided Lost Productivity Costs $1,128,405 $2,148,374
Avoided shoreline erosion/dune reconstruction costs $41,858,316 $56,815,891
Avoided displacement/disruption costs $526,326 $1,376,525
Avoided Road Closure/Travel Disruption costs $315,901 $647,300
Avoided Cost of Power Outages $1,050,543 $2,152,587
Avoided Vehicle Damages $63,787 $189,399
Total Resiliency Values $53,198,061 $82,799,601
Environmental Values
Total Gross Ecosystem Annual Service Gains (+) $11,860,749 $24,625,205
Total Ecosystem Annual Services Displaced (-) $264,537 $509,059
Net Ecosystem Annual Service Gains $11,596,212 $24,116,146
Social Values
Educational/Environmental Stewardship $1,253,995 $2,569,509
Recreation $7,095,681 $14,539,461
Total Social Values $8,349,676 $17,108,970
Economic Revitalization Benefits
Property Value Impacts (ʃ[Distance and Beach Width]) $2,953,868 $6,052,646
Total Benefits $76,097,817 $130,077,363
Benefits less Costs (Net Present Value) $13,654,244 $53,588,954
Benefit Cost Ratio (BCR) 1.22 1.70

[51]
Notes: Includes adjustment over time for 30 inch Sea Level Rise (SLR) \a Note that because Project construction is anticipated to occur over 2018, 2019 and the first quarter of 2020, the present value calculation of costs (as of 2016) will appear to be lower than the nominal project investment costs shown in the Opinion of Probable Cost Document due to the application of the 7% HUD recommended discount rate
Figure 9

[52]
XII. References
Annese, 2012, © 2016 SILive.com.
http://www.silive.com/southshore/index.ssf/2012/11/staten_island_mom_who_lost_hus.html
APEC, 2016. Alley Pond Environmental Center.
http://www.alleypond.com/
Alley Pond Environmental Center, Inc., July 2014- June 2015, Annual Report and Financial Statements for
the Years Ended June 30, 2014-2015.
Arcadis, 12/12/16. Email from Vince DeCapio (Arcadis) to Ian Miller (Louis Berger) and Alex Zablocki
(GOSR).
Bain et. al. 2006. Bain M., D. Suszkowski, J. Lodge, and L. Xu. 2006. Setting Targets for Restoration of the
Hudson-Raritan Estuary: Report of an Interdisciplinary Workshop. Hudson River Foundation, New York,
New York
BND 2016, Beach Nourishment Viewer, Program for the Study of Developed Shorelines @ Western
Carolina University, http://beachnourishment.wcu.edu/
CDC, 2014. Centers for Disease Control and Prevention, MMWR, Morbidity and Mortality Weekly
Mortality Report, October 24, 2014, "Weekly / Vol. 63 / No. 42. See Brackbill et. al., Nonfatal Injuries 1
Week After Hurricane Sandy — New York City Metropolitan Area, October 2012"
Coch 2015. Coch, Nikolas K., Unique Vulnerability of the New York–New Jersey Metropolitan Area to
Hurricane Destruction, Journal of Coastal Research, Vol. 31, No. 1, 2015.
Costanza 2006. Costanza, Robert, Matthew Wilson, Austin Troy, Alexey Voinov, Shuang Liu, John
D’Agostino. 2006. The Value of New Jersey’s Ecosystem Services and Natural Capital. Prep. By: Gund
Institute for Ecological Economics, Univ. Vermont. Prep. For: New Jersey Department of Environmental
Protection, Division of Science, Research, and Technology, Trenton, NJ.
CPPSP, 2016, Clay Pit Ponds State Park Preserve, http://nysparks.com/parks/166/details.aspx
FAA, 2016. https://www.faa.gov/regulations_policies/policy_guidance/benefit_cost/media/econ-value-
section-2-tx-values.pdf, Table 2-2: Relative Disutility Factors by Injury Severity Level, (for Use with 3% or
7% Discount Rates) *
FEMA, 2011. FEMA Benefit-Cost Analysis Re-engineering (BCAR) Development of Standard Economic
Values, Version 6.0 December 2011
https://www.fema.gov/media-library-data/1436988186869-
3f81a0a72df11e00b8c088e8d3bd635a/TAW_Slope_Hmo_Guidance_May_2015.pdf

[53]
FEMA (2012), Final Sustainability Benefits Methodology Report, Contract #: HSFEHQ-10-D-0806; Task
Order # HSFEHQ-11-J-1408.
FEMA 2013, FEMA MITIGATION POLICY-FP-108-024-01, Consideration of Environmental Benefits in the
Evaluation of Acquisition Projects under the Hazard Mitigation Assistance (HMA) Programs, June 18,
2013.
FEMA 2015. Guidance for Flood Risk Analysis and Mapping, Calculation of Incident Wave Height and
Slope for use with TAW Wave Runup Method, Guidance Document 33, May 2015.
Freeman, A. Myrick, III, The Measurement of Environmental and Resource Values: Theory and Methods,
Resources for the Future, Washington D.C., 1999.
Gopalakrishnan, 2010. Sathya Gopalakrishnan, Martin D. Smith, Jordan M. Slott, and A. Brad Murray,
The Value of Disappearing Beaches: A Hedonic Pricing Model with Endogenous Beach Width, Working
Paper EE 10-04, September 2010, Duke Environmental Economics Working Paper Series, organized by
the Nicholas Institute for Environmental Policy Solutions, Duke University,
Grabowski et. al., 2012. Jonathan H. Grabowski, Robert D. Brumbaugh, Robert F. Conrad, Andrew G.
Keeler, James J. Opaluch, Charles H. Peterson, Michael F. Piehler, Sean P. Powers, and Ashley R. Smyth,
Economic Valuation of Ecosystem Services Provided by Oyster Reefs, BioScience • October 2012 / Vol.
62 No. 10, 900-909.
Harnik, 2014. Harnik, Peter, and John L. Compton (2014), Measuring the total economic value of a park
system to a community, Managing Leisure, 2014, http://dx.doi.org/10.1080/13606719.2014.885713,
Taylor & Francis
HUD CPD-16-06, U.S. Department of Housing and Urban Development, Notice CPD-16-06, Issued April
20, 2016, Community Development Block Grant Disaster Recovery (CDBG-DR) Rebuild by Design:
Guidance regarding content and format of materials for approval of CDBG-DR Action Plan Amendments
releasing funds for construction of Rebuild by Design (RBD) projects, including guidance for Benefit-Cost
Analysis.
Kaval, P. and J. B. Loomis. 2003. Updated outdoor recreation use values with emphasis on National Park
recreation. Fort Collins, National Park Service.
Kaufman et. al., 2012. Transportation During and After Hurricane Sandy, Sarah Kaufman, Carson Qing,
Nolan Levenson and Melinda Hanson, Rudin Center for Transportation, NYU Wagner Graduate School of
Public Service, November 2012
La Peyre, Megan K., Austin T. Humphries, Sandra M. Casas, Jerome F. La Peyre. 2013. Temporal variation
in development of ecosystem services from oyster reef restoration. Ecological Engineering 63 (2014) 34–
44.

[54]
Magnuson, 2009. K. Magnuson, H. Sexton, P. Davis-Kean, and A. Huston, “Increases in Maternal
Education and Young Children’s Language Skills,” Merrill-Palmer Quarterly, Vol. 55, No. 3, July 2009,
http://muse.jhu.edu/login?uri=/journals/merrill-palmer_quarterly/v055/55.3.magnuson.pdf
Magnuson 2007. Katherine Magnuson, Investing in the Adult Workforce: An Opportunity to Improve
Children’s Life Chances, prepared for the Annie E. Casey Foundation Initiative on Investing in Workforce
Development, March 2007, http://www.aecf.org/news/fes/dec2008/pdf/Magnuson.pdf
Mortality history for Tottenville was provided by GOSR and was also referenced in the following article:
http://www.nytimes.com/interactive/2012/11/17/nyregion/hurricane-sandy-map.html?_r=0
NACCS, 2015. North Atlantic Coast Comprehensive Study: Resilient Adaptation to Increasing Risk MAIN
REPORT Final Report January 2015, US Army Corps of Engineers.
NACCS, 2015. North Atlantic Coast Comprehensive Study (NACCS), United States Army Corps of
Engineers ® Physical Depth-Damage Function Summary Report North Atlantic Coast Comprehensive
Study: Resilient Adaptation to Increasing Risk, January 2015.
NPRA, 2010. National Parks and Recreation Association, Why Parks and Recreation are essential
services, 2010, Accessed from
https://www.nrpa.org/uploadedFiles/nrpa.org/Advocacy/Resources/Parks-Recreation-Essential-Public-
Services-January-2010.pdf
NRC, 2005. Valuing Ecosystem Services: Toward Better Environmental Decision-Making, Committee on
Assessing and Valuing the Services of Aquatic and Related Terrestrial Ecosystems, National Research
Council, National Academies Press, ISBN 978-0-309-09318-7, http://nap.edu/11139.
NYC Department of Parks and Recreation, 12/12/16. Email from Grace Parks (NYC Parks) to Ian Miller
(Louis Berger).
NYC Parks, 01/03/17. Email from "Jordan, Elizabeth (Parks)" [email protected] To:
"Zablocki, Alex (STORMRECOVERY)" [email protected], Subject: RE: 2013 Tottenville
Dune construction cost.
NYMTC, 2016, received email permission from Larisa Morozovskaya, Larisa (DOT)
[email protected] on 11/16/2016. Data provided by Josh Wagner of Louis Berger from
GIS file extract for TAZ.
Parsons Brinckerhoff excel file called, <<Copy of RBD_BCA_tottenville_140411B_updated.xlsx>>
PlaNYC, 2013. A Stronger More Resilient New York, the City of New York, Mayor Michael H. Bloomberg
Ridley 2011. Ridley, N. and Kenefick, E., Research shows effectiveness of workforce programs.
http://www.clasp.org/resources-and-publications/files/workforce-effectiveness.pdf

[55]
RM Schwartz et al. (2015), The Impact of Hurricane Sandy on the Mental Health of New York Area
Residents, Am J Disaster Med 10 (4), 339-346. 2015,
https://www.ncbi.nlm.nih.gov/labs/articles/27149315/
SCAPE Appendix D, 2016. <<D_30%-Feasibility-and-Constructability-Report_161007.pdf>>, Feasibility
and Constructability Report, 10/7/2016, Prepared by: MFS Consulting Engineers and Surveyor, DPC
SCAPE, December, 2016. Calculation of Available Surface Area and Marine Habitat Generated for Living
Breakwaters, December 13, 2016. Version: 2, revised from initial memo submitted November 28, 2016,
From SCAPE, OCC, SEARC, To: AKRF, GOSR.
SCAPE email 12/9/16. Email from Pippa Brashear (SCAPE) to Ian Miller (Louis Berger) with attached file
called, << 161208-LB-Habitat_Quantification_calcs.xlsx>>.
SCAPE, FDR 30%, 2016. LIVING BREAKWATERS FINAL 30% DESIGN REPORT, Prepared for: NY Governor’s
Office of Storm Recovery (GOSR) Date: 10/07/2016, Prepared by: Scape Landscape Architecture PLLC
With Ocean And Coastal Consultants Engineering, P.C. | Arcadis Of New York, Inc. | Parsons
Brinckerhoff, Inc. | Searc Ecological Consulting, Ltd. |New York Harbor Foundation New York Harbor
School | LOT-EK, Corp. |MFS Consulting Engineers And Surveyor, DPC | Prudent Engineering LLP
U.S. Department of Labor, Bureau of Labor Statistics, Consumer Price Index,
http://data.bls.gov/pdq/SurveyOutputServlet
2010 Census, average HH size Tottenville, see also, http://www.city-
data.com/neighborhood/Tottenville-Staten-Island-NY.html

[56]
Living Breakwaters Project - BCA Project Resource Statement (2016-2024) constant 2016 US Dollars
0 1 2 3 4 5 6 7 8
Year Construction Construction (Q2:2020): Operations (Q2 2020)….. ===>
HUD Guidance Categories 2016 2017 2018 2019 2020 2021 2022 2023 2024
LIFECYCLE COSTS CAPEX Phasing
Percent Installed, % 26% 63% 11%
Project Investment Costs $0.00 $0.00 $17,500,000 $42,000,000 $7,000,000 $0.0 $0.0 $0.0 $0.0
Operations & Maintenance
Maintenance $0.00 $0.00 $0.00 $0.00 $633,495 $633,495 $633,495 $633,495 $633,495
Monitoring $0.00 $0.00 $0.00 $0.00 $75,000 $75,000 $75,000 $75,000 $75,000
Total O&M $0.00 $0 $0 $0 $708,495 $708,495 $708,495 $708,495 $708,495
Total Costs $0.00 $0 $17,500,000 $42,000,000 $7,708,495 $708,495 $708,495 $708,495 $708,495
BENEFITS
Resiliency Values $0 $0 $0 $0 $22,660,245 $931,222 $800,477 $818,763 $22,880,477
Avoided Property Damages $0 $0 $0 $0 $181,012 $201,948 $222,885 $243,821 $264,758
Avoided Casualties (Mortality & Injuries) $0.00 $0.00 $0.00 $0.00 $255,821 $255,821 $255,821 $255,821 $255,821
Avoided Mental Health Treatment Costs $0 $0 $0 $0 $57,734 $55,733 $53,946 $52,341 $50,891
Avoided Lost Productivity Costs $0 $0 $0 $0 $128,502 $124,049 $120,072 $116,499 $113,272
Avoided shoreline erosion/dune reconstruction costs $0 $0 $0 $0 $21,894,480 $148,446 $0 $0 $22,042,926
Avoided displacement/disruption costs $0 $0 $0 $0 $18,020 $20,394 $22,768 $25,142 $27,516
Avoided Road Closure/Travel Disruption costs $0 $0 $0 $0 $28,265 $28,265 $28,265 $28,265 $28,265
Avoided Cost of Power Outages $0 $0 $0 $0 $94,013 $94,009 $94,005 $94,001 $93,997
Avoided Vehicle Damages $0 $0 $0 $0 $2,398 $2,557 $2,715 $2,873 $3,032
Environmental Values
Total Gross Ecosystem Annual Service Gains (+) $0 $0 $0 $0 $748,673 $946,097 $1,094,272 $1,094,272 $1,094,272
Total Ecosystem Annual Services Displaced (-) $0 $0 $20,561 $20,561 $20,561 $20,561 $20,561 $20,561 $20,561
Net Ecosystem Annual Service Gains $0 $0 -$20,561 -$20,561 $728,113 $925,537 $1,073,711 $1,073,711 $1,073,711
Social Values
Educational/Environmental Stewardship $0.00 $0.00 $0.00 $0.00 $112,200 $112,200 $112,200 $112,200 $112,200
Recreation $0 $0 $0 $0 $634,879 $634,879 $634,879 $634,879 $634,879
Economic Revitalization Benefits
Property Value Impacts (ʃ[Distance and Beach Width]) $0 $0 $0 $0 $264,294 $264,294 $264,294 $264,294 $264,294
Total Benefits $0 $0 -$20,561 -$20,561 $24,399,731 $2,868,132 $2,885,561 $2,903,848 $24,965,561
Benefits less Costs $0.00 $0 -$17,520,561 -$42,020,561 $16,691,237 $2,159,637 $2,177,066 $2,195,353 $24,257,066

[57]
Living Breakwaters Project - BCA Project Resource Statement (2025-2033) constant 2016 US Dollars
9 10 11 12 13 14 15 16 17
HUD Guidance Categories 2025 2026 2027 2028 2029 2030 2031 2032 2033
LIFECYCLE COSTS
Percent Installed, %
Project Investment Costs $0.0 $0.0 $0.0 $0.0 $0.0 $0.0 $0.0 $0.0 $0.0
Operations & Maintenance
Maintenance $633,495 $633,495 $633,495 $633,495 $633,495 $633,495 $633,495 $633,495 $633,495
Monitoring $0.00 $0.00 $0.00 $0.00 $150,000 $0.00 $0.00 $0.00 $0.00
Total O&M $633,495 $633,495 $633,495 $633,495 $783,495 $633,495 $633,495 $633,495 $633,495
Total Costs $633,495 $633,495 $633,495 $633,495 $783,495 $633,495 $633,495 $633,495 $633,495
BENEFITS
Resiliency Values $856,769 $3,599,366 $1,044,736 $22,810,981 $936,966 $1,106,102 $978,546 $999,616 $1,169,294
Avoided Property Damages $285,694 $306,631 $327,568 $348,504 $369,441 $390,377 $411,314 $432,250 $453,187
Avoided Casualties (Mortality & Injuries) $255,821 $255,821 $255,821 $255,821 $255,821 $255,821 $255,821 $255,821 $255,821
Avoided Mental Health Treatment Costs $49,575 $48,374 $47,275 $46,266 $45,334 $44,473 $43,673 $42,930 $42,236
Avoided Lost Productivity Costs $110,342 $107,670 $105,224 $102,977 $100,904 $98,986 $97,207 $95,552 $94,009
Avoided shoreline erosion/dune reconstruction costs $0 $2,723,000 $148,446 $21,894,480 $0 $148,446 $0 $0 $148,446
Avoided displacement/disruption costs $29,890 $32,264 $34,638 $37,012 $39,386 $41,760 $44,134 $46,508 $48,882
Avoided Road Closure/Travel Disruption costs $28,265 $28,265 $28,265 $28,265 $28,265 $28,265 $28,265 $28,265 $28,265
Avoided Cost of Power Outages $93,992 $93,992 $93,992 $93,992 $93,992 $93,992 $93,992 $93,992 $93,992
Avoided Vehicle Damages $3,190 $3,348 $3,506 $3,665 $3,823 $3,981 $4,139 $4,298 $4,456
Environmental Values
Total Gross Ecosystem Annual Service Gains (+) $1,094,272 $1,094,272 $1,094,272 $1,094,272 $1,094,272 $1,094,272 $1,094,272 $1,094,272 $1,094,272
Total Ecosystem Annual Services Displaced (-) $20,561 $20,561 $20,561 $20,561 $20,561 $20,561 $20,561 $20,561 $20,561
Net Ecosystem Annual Service Gains $1,073,711 $1,073,711 $1,073,711 $1,073,711 $1,073,711 $1,073,711 $1,073,711 $1,073,711 $1,073,711
Social Values
Educational/Environmental Stewardship $112,200 $112,200 $112,200 $112,200 $112,200 $112,200 $112,200 $112,200 $112,200
Recreation $634,879 $634,879 $634,879 $634,879 $634,879 $634,879 $634,879 $634,879 $634,879
Economic Revitalization Benefits
Property Value Impacts (ʃ[Distance and Beach Width]) $264,294 $264,294 $264,294 $264,294 $264,294 $264,294 $264,294 $264,294 $264,294
Total Benefits $2,941,853 $5,684,450 $3,129,820 $24,896,065 $3,022,050 $3,191,186 $3,063,630 $3,084,701 $3,254,379
Benefits less Costs $2,308,359 $5,050,955 $2,496,326 $24,262,571 $2,238,555 $2,557,691 $2,430,136 $2,451,206 $2,620,884

[58]
Living Breakwaters Project - BCA Project Resource Statement (2034-2042) constant 2016 US Dollars
18 19 20 21 22 23 24 25 26
HUD Guidance Categories 2034 2035 2036 2037 2038 2039 2040 2041 2042
LIFECYCLE COSTS
Percent Installed, %
Project Investment Costs $0.0 $0.0 $0.0 $0.0 $0.0 $0.0 $0.0 $0.0 $0.0
Operations & Maintenance
Maintenance $633,495 $633,495 $633,495 $633,495 $633,495 $633,495 $633,495 $633,495 $633,495
Monitoring $150,000 $0.00 $0.00 $0.00 $0.00 $150,000 $0.00 $0.00 $0.00
Total O&M $783,495 $633,495 $633,495 $633,495 $633,495 $783,495 $633,495 $633,495 $633,495
Total Costs $783,495 $633,495 $633,495 $633,495 $633,495 $783,495 $633,495 $633,495 $633,495
BENEFITS
Resiliency Values $1,042,226 $3,786,735 $1,233,811 $1,107,104 $1,128,942 $1,299,318 $1,172,886 $1,194,977 $1,365,585
Avoided Property Damages $474,123 $495,060 $515,997 $536,933 $557,870 $578,806 $599,743 $620,679 $641,616
Avoided Casualties (Mortality & Injuries) $255,821 $255,821 $255,821 $255,821 $255,821 $255,821 $255,821 $255,821 $255,821
Avoided Mental Health Treatment Costs $41,588 $40,981 $40,411 $39,874 $39,369 $38,892 $38,441 $38,014 $37,608
Avoided Lost Productivity Costs $92,566 $91,214 $89,945 $88,751 $87,626 $86,564 $85,560 $84,610 $83,708
Avoided shoreline erosion/dune reconstruction costs $0 $2,723,000 $148,446 $0 $0 $148,446 $0 $0 $148,446
Avoided displacement/disruption costs $51,256 $53,630 $56,004 $58,378 $60,752 $63,126 $65,500 $67,874 $70,248
Avoided Road Closure/Travel Disruption costs $28,265 $28,265 $28,265 $28,265 $28,265 $28,265 $28,265 $28,265 $28,265
Avoided Cost of Power Outages $93,992 $93,992 $93,992 $93,992 $93,992 $93,992 $93,992 $93,992 $93,992
Avoided Vehicle Damages $4,614 $4,772 $4,931 $5,089 $5,247 $5,405 $5,564 $5,722 $5,880
Environmental Values
Total Gross Ecosystem Annual Service Gains (+) $1,094,272 $1,094,272 $1,094,272 $1,094,272 $1,094,272 $1,094,272 $1,094,272 $1,094,272 $1,094,272
Total Ecosystem Annual Services Displaced (-) $20,561 $20,561 $20,561 $20,561 $20,561 $20,561 $20,561 $20,561 $20,561
Net Ecosystem Annual Service Gains $1,073,711 $1,073,711 $1,073,711 $1,073,711 $1,073,711 $1,073,711 $1,073,711 $1,073,711 $1,073,711
Social Values
Educational/Environmental Stewardship $112,200 $112,200 $112,200 $112,200 $112,200 $112,200 $112,200 $112,200 $112,200
Recreation $634,879 $634,879 $634,879 $634,879 $634,879 $634,879 $634,879 $634,879 $634,879
Economic Revitalization Benefits
Property Value Impacts (ʃ[Distance and Beach Width]) $264,294 $264,294 $264,294 $264,294 $264,294 $264,294 $264,294 $264,294 $264,294
Total Benefits $3,127,310 $5,871,819 $3,318,895 $3,192,188 $3,214,026 $3,384,402 $3,257,970 $3,280,061 $3,450,669
Benefits less Costs $2,343,816 $5,238,325 $2,685,401 $2,558,693 $2,580,532 $2,600,908 $2,624,475 $2,646,566 $2,817,175

[59]
Living Breakwaters Project - BCA Project Resource Statement (2043-2051) constant 2016 US Dollars
27 28 29 30 31 32 33 34 35
HUD Guidance Categories 2043 2044 2045 2046 2047 2048 2049 2050 2051
LIFECYCLE COSTS
Percent Installed, %
Project Investment Costs $0.0 $0.0 $0.0 $0.0 $0.0 $0.0 $0.0 $0.0 $0.0
Operations & Maintenance
Maintenance $633,495 $633,495 $633,495 $633,495 $633,495 $633,495 $633,495 $633,495 $633,495
Monitoring $0.00 $150,000 $0.00 $0.00 $0.00 $0.00 $150,000 $0.00 $0.00
Total O&M $633,495 $783,495 $633,495 $633,495 $633,495 $633,495 $783,495 $633,495 $633,495
Total Costs $633,495 $783,495 $633,495 $633,495 $633,495 $633,495 $783,495 $633,495 $633,495
BENEFITS
Resiliency Values $1,239,367 $1,261,656 $1,432,447 $1,312,575 $1,335,534 $1,506,983 $1,381,584 $1,404,670 $1,576,240
Avoided Property Damages $662,552 $683,489 $704,426 $725,362 $746,299 $767,235 $788,172 $809,108 $830,045
Avoided Casualties (Mortality & Injuries) $255,821 $255,821 $255,821 $255,821 $255,821 $255,821 $255,821 $255,821 $255,821
Avoided Mental Health Treatment Costs $37,224 $36,858 $36,510 $36,178 $35,861 $35,559 $35,270 $34,993 $34,727
Avoided Lost Productivity Costs $82,852 $82,038 $81,263 $80,524 $79,819 $79,146 $78,502 $77,886 $77,295
Avoided shoreline erosion/dune reconstruction costs $0 $0 $148,446 $0 $0 $148,446 $0 $0 $148,446
Avoided displacement/disruption costs $72,622 $74,996 $77,370 $79,744 $82,118 $84,492 $86,866 $89,240 $91,614
Avoided Road Closure/Travel Disruption costs $28,265 $28,265 $28,265 $28,265 $28,265 $28,265 $28,265 $28,265 $28,265
Avoided Cost of Power Outages $93,992 $93,992 $93,992 $93,992 $93,992 $93,992 $93,992 $93,992 $93,992
Avoided Vehicle Damages $6,038 $6,197 $6,355 $12,689 $13,358 $14,027 $14,697 $15,366 $16,035
Environmental Values
Total Gross Ecosystem Annual Service Gains (+) $1,094,272 $1,094,272 $1,094,272 $1,094,272 $1,094,272 $1,094,272 $1,094,272 $1,094,272 $1,094,272
Total Ecosystem Annual Services Displaced (-) $20,561 $20,561 $20,561 $20,561 $20,561 $20,561 $20,561 $20,561 $20,561
Net Ecosystem Annual Service Gains $1,073,711 $1,073,711 $1,073,711 $1,073,711 $1,073,711 $1,073,711 $1,073,711 $1,073,711 $1,073,711
Social Values
Educational/Environmental Stewardship $112,200 $112,200 $112,200 $112,200 $112,200 $112,200 $112,200 $112,200 $112,200
Recreation $634,879 $634,879 $634,879 $634,879 $634,879 $634,879 $634,879 $634,879 $634,879
Economic Revitalization Benefits
Property Value Impacts (ʃ[Distance and Beach Width]) $264,294 $264,294 $264,294 $264,294 $264,294 $264,294 $264,294 $264,294 $264,294
Total Benefits $3,324,451 $3,346,740 $3,517,532 $3,397,660 $3,420,618 $3,592,068 $3,466,668 $3,489,755 $3,661,325
Benefits less Costs $2,690,957 $2,563,246 $2,884,037 $2,764,165 $2,787,123 $2,958,573 $2,683,174 $2,856,260 $3,027,830

[60]
Living Breakwaters Project - BCA Project Resource Statement (2052-2060) constant 2016 US Dollars
36 37 38 39 40 41 42 43 44
HUD Guidance Categories 2052 2053 2054 2055 2056 2057 2058 2059 2060
LIFECYCLE COSTS
Percent Installed, %
Project Investment Costs $0.0 $0.0 $0.0 $0.0 $0.0 $0.0 $0.0 $0.0 $0.0
Operations & Maintenance
Maintenance $633,495 $633,495 $633,495 $633,495 $633,495 $633,495 $633,495 $633,495 $633,495
Monitoring $0.00 $0.00 $150,000 $0.00 $0.00 $0.00 $0.00 $150,000 $0.00
Total O&M $633,495 $633,495 $783,495 $633,495 $633,495 $633,495 $633,495 $783,495 $633,495
Total Costs $633,495 $633,495 $783,495 $633,495 $633,495 $633,495 $633,495 $783,495 $633,495
BENEFITS
Resiliency Values $1,450,953 $1,474,146 $1,645,815 $1,520,621 $1,543,901 $1,715,654 $1,590,538 $1,613,892 $1,785,714
Avoided Property Damages $850,982 $871,918 $892,855 $913,791 $934,728 $955,664 $976,601 $997,537 $1,018,474
Avoided Casualties (Mortality & Injuries) $255,821 $255,821 $255,821 $255,821 $255,821 $255,821 $255,821 $255,821 $255,821
Avoided Mental Health Treatment Costs $34,473 $34,229 $33,994 $33,769 $33,552 $33,343 $33,142 $32,948 $32,761
Avoided Lost Productivity Costs $76,729 $76,186 $75,664 $75,162 $74,679 $74,215 $73,767 $73,335 $72,919
Avoided shoreline erosion/dune reconstruction costs $0 $0 $148,446 $0 $0 $148,446 $0 $0 $148,446
Avoided displacement/disruption costs $93,988 $96,362 $98,736 $101,109 $103,483 $105,857 $108,231 $110,605 $112,979
Avoided Road Closure/Travel Disruption costs $28,265 $28,265 $28,265 $28,265 $28,265 $28,265 $28,265 $28,265 $28,265
Avoided Cost of Power Outages $93,992 $93,992 $93,992 $93,992 $93,992 $93,992 $93,992 $93,992 $93,992
Avoided Vehicle Damages $16,704 $17,373 $18,042 $18,711 $19,380 $20,049 $20,719 $21,388 $22,057
Environmental Values
Total Gross Ecosystem Annual Service Gains (+) $1,094,272 $1,094,272 $1,094,272 $1,094,272 $1,094,272 $1,094,272 $1,094,272 $1,094,272 $1,094,272
Total Ecosystem Annual Services Displaced (-) $20,561 $20,561 $20,561 $20,561 $20,561 $20,561 $20,561 $20,561 $20,561
Net Ecosystem Annual Service Gains $1,073,711 $1,073,711 $1,073,711 $1,073,711 $1,073,711 $1,073,711 $1,073,711 $1,073,711 $1,073,711
Social Values
Educational/Environmental Stewardship $112,200 $112,200 $112,200 $112,200 $112,200 $112,200 $112,200 $112,200 $112,200
Recreation $634,879 $634,879 $634,879 $634,879 $634,879 $634,879 $634,879 $634,879 $634,879
Economic Revitalization Benefits
Property Value Impacts (ʃ[Distance and Beach Width]) $264,294 $264,294 $264,294 $264,294 $264,294 $264,294 $264,294 $264,294 $264,294
Total Benefits $3,536,038 $3,559,230 $3,730,899 $3,605,706 $3,628,986 $3,800,738 $3,675,623 $3,698,977 $3,870,799
Benefits less Costs $2,902,543 $2,925,735 $2,947,405 $2,972,211 $2,995,491 $3,167,243 $3,042,128 $2,915,482 $3,237,304

[61]
Living Breakwaters Project - BCA Project Resource Statement (2061-2066) constant 2016 US Dollars
45 46 47 48 49 50
HUD Guidance Categories 2061 2062 2063 2064 2065 2066
LIFECYCLE COSTS
Percent Installed, %
Project Investment Costs $0.0 $0.0 $0.0 $0.0 $0.0 $0.0
Operations & Maintenance
Maintenance $633,495 $633,495 $633,495 $633,495 $633,495 $633,495
Monitoring $0.00 $0.00 $0.00 $150,000 $0.00 $0.00
Total O&M $633,495 $633,495 $633,495 $783,495 $633,495 $633,495
Total Costs $633,495 $633,495 $633,495 $783,495 $633,495 $633,495
BENEFITS
Resiliency Values $1,660,665 $1,684,082 $1,855,964 $1,730,972 $1,754,443 $1,926,376
Avoided Property Damages $1,039,411 $1,060,347 $1,081,284 $1,102,220 $1,123,157 $1,144,093
Avoided Casualties (Mortality & Injuries) $255,821 $255,821 $255,821 $255,821 $255,821 $255,821
Avoided Mental Health Treatment Costs $32,580 $32,406 $32,237 $32,074 $31,917 $31,764
Avoided Lost Productivity Costs $72,517 $72,128 $71,753 $71,390 $71,039 $70,699
Avoided shoreline erosion/dune reconstruction costs $0 $0 $148,446 $0 $0 $148,446
Avoided displacement/disruption costs $115,353 $117,727 $120,101 $122,475 $124,849 $127,223
Avoided Road Closure/Travel Disruption costs $28,265 $28,265 $28,265 $28,265 $28,265 $28,265
Avoided Cost of Power Outages $93,992 $93,992 $93,992 $93,992 $93,992 $93,992
Avoided Vehicle Damages $22,726 $23,395 $24,064 $24,733 $25,402 $26,071
Environmental Values
Total Gross Ecosystem Annual Service Gains (+) $1,094,272 $1,094,272 $1,094,272 $1,094,272 $1,094,272 $1,094,272
Total Ecosystem Annual Services Displaced (-) $20,561 $20,561 $20,561 $20,561 $20,561 $20,561
Net Ecosystem Annual Service Gains $1,073,711 $1,073,711 $1,073,711 $1,073,711 $1,073,711 $1,073,711
Social Values
Educational/Environmental Stewardship $112,200 $112,200 $112,200 $112,200 $112,200 $112,200
Recreation $634,879 $634,879 $634,879 $634,879 $634,879 $634,879
Economic Revitalization Benefits
Property Value Impacts (ʃ[Distance and Beach Width]) $264,294 $264,294 $264,294 $264,294 $264,294 $264,294
Total Benefits $3,745,750 $3,769,167 $3,941,049 $3,816,056 $3,839,527 $4,011,460
Benefits less Costs $3,112,255 $3,135,672 $3,307,554 $3,032,562 $3,206,032 $3,377,966

SCAPE / LANDSCAPE ARCHITECTURE PLLC
277 BROADWAY SUITE 1606 NEW YORK NY 10007
T 212 462 2628 F 212 462 4164
SCAPESTUDIO.COM
Attachment A: Parameters and Assumptions:
Living Breakwaters & Tottenville Shoreline Protection Schematic Design: Standards & Assumptions For Project Screening And 30% Design, v. 4

SCAPE / LANDSCAPE ARCHITECTURE PLLC
Page 63 of 75
MEMO
Date: September 29, 2016
From: Pippa Brashear / SCAPE
To: Living Breakwaters & Tottenville Shoreline Protection Design and EIS teams / GOSR, AKRF, STANTEC TEAM
Cc: SCAPE, OCC/COWI, ARCADIS, PB, MFS, SEARC, NYHF, Prudent (SCAPE team)
Re: Living Breakwaters & Tottenville Shoreline Protection Schematic Design: Standards & Assumptions For Project Screening And 30% Design, v. 4
Previous Versions
Version date notes
1 9/29/2015 based on the team meeting Friday 6/5/2015 ,SCAPE and AKRF team member conversation regarding climate change assumptions on 7/10, internal review by the SCAPE and Stantec Design teams, and a final conversation among GOSR, ARKF and the SCAPE and Stantec design teams on 8/21/2015
2 11/09/2015 Updated to include shoreline definition and existing topography assumptions. Changes reviewed and approved by project team.
3 6/10/2016 Updated to include detail on storm scenario selection and refined parameters for hydrodynamic modeling assumptions. The Shoreline definition was also update based on LB and TSP team work to date.
4 9/08/2016 Updated to include wave and water level table and sediment grain size table as well as Updated to include data used for screening for Shoreline Protection project.
This document contains a summary of the latest project assumptions and parameters that are to be used for the initial analysis and screening of alternatives and for 30% Design for both the Living Breakwaters (LBW) and Tottenville Shoreline Protection Projects (TSPP). This is a living document to help in coordination among the Living Breakwaters and Tottenville Shoreline Protection Design Teams as well as the joint project EIS team.
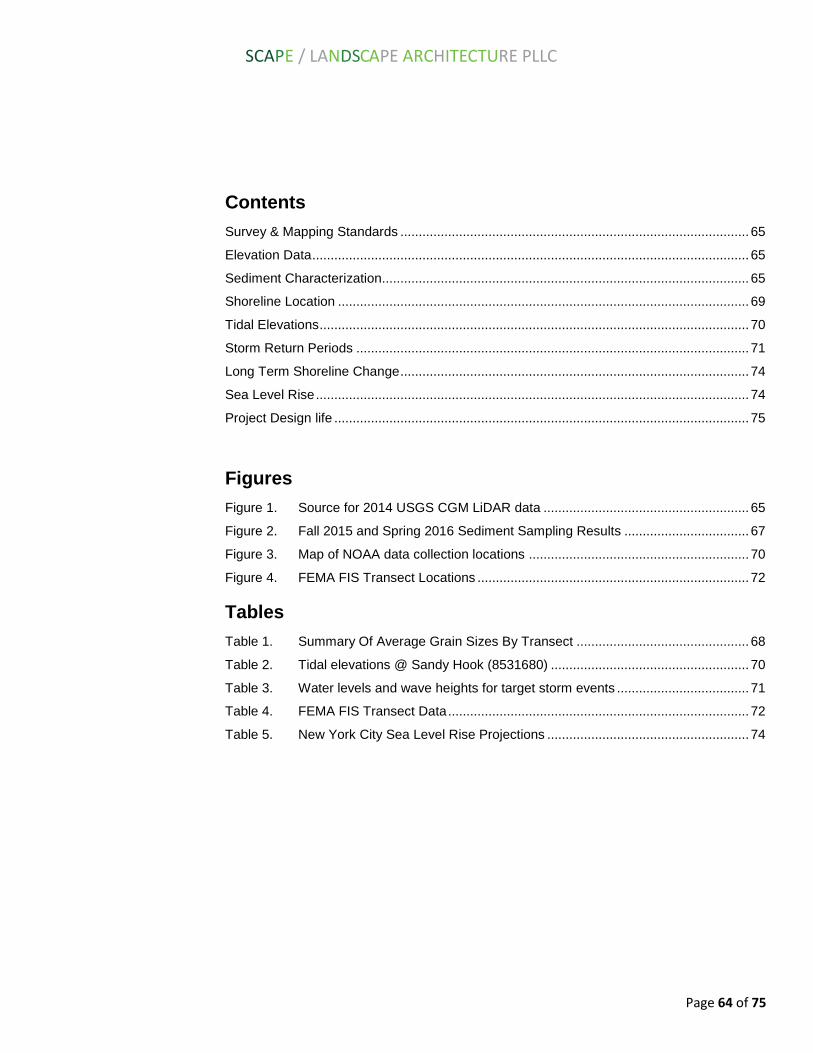
SCAPE / LANDSCAPE ARCHITECTURE PLLC
Page 64 of 75
Contents
Survey & Mapping Standards ............................................................................................... 65
Elevation Data ....................................................................................................................... 65
Sediment Characterization.................................................................................................... 65
Shoreline Location ................................................................................................................ 69
Tidal Elevations ..................................................................................................................... 70
Storm Return Periods ........................................................................................................... 71
Long Term Shoreline Change ............................................................................................... 74
Sea Level Rise ...................................................................................................................... 74
Project Design life ................................................................................................................. 75
Figures
Figure 1. Source for 2014 USGS CGM LiDAR data ........................................................ 65
Figure 2. Fall 2015 and Spring 2016 Sediment Sampling Results .................................. 67
Figure 3. Map of NOAA data collection locations ............................................................ 70
Figure 4. FEMA FIS Transect Locations .......................................................................... 72
Tables
Table 1. Summary Of Average Grain Sizes By Transect ............................................... 68
Table 2. Tidal elevations @ Sandy Hook (8531680) ...................................................... 70
Table 3. Water levels and wave heights for target storm events .................................... 71
Table 4. FEMA FIS Transect Data .................................................................................. 72
Table 5. New York City Sea Level Rise Projections ....................................................... 74

SCAPE / LANDSCAPE ARCHITECTURE PLLC
Page 65 of 75
Survey & Mapping Standards
Vertical Datum: North American Vertical Datum of 1988 (NAVD88), Geoid 2012A (this is consistent with the initial bathymetric survey already completed by Hill/ASI). All elevations and survey data are to be provided relative to this datum.
Horizontal Control Datum: North American Datum of 1983 (NAD 83)
Coordinate System / Projection for printed maps: New York Long Island State Plane FIPS 3104 (US survey feet)
Project stationing: Project station locations and alignments to be established for the combined Living Breakwater and Shoreline Protection projects. These are tbd. Surveying teams to include monumentation in their survey work (to be decided / confirmed by GOSR).
Metadata requirements: All data and field survey results to be accompanied with complete metadata; metadata standards to be developed and agreed upon by team.
Elevation Data
Within the project area, the following sources are being used for bathymetric and topographic information:
Bathymetry: June 2015 Bathymetric survey performed by Hill/ASI.
Topograpy: Fall 2015 land-side topographic and boundary surveys performed by Naik for the Stantec Team (for Tottenville Shoreline Protection Area only).
Beach profile transects
November 2015 beach profile transect surveys performed by MFS Engineers and Prudent Engineering
May 2016 beach profile transect surveys performed by MFS Engineers and Prudent Engineering.
For areas outside the Tottenville Shoreline Protection survey area, land-side topographic information will be based on the 2014 USGS CGM LiDAR: Post Sandy for New York City, available for download from the NOAA Digital Coast viewer (screenshot below). Metadata for this topography information is available here.
Source for 2014 USGS CGM LiDAR data
Sediment Characterization
Within the project area, the following sources are being used for sediment information:

SCAPE / LANDSCAPE ARCHITECTURE PLLC
Page 66 of 75
Sediment grab samples and analysis performed at 28 in water locations throughout the project area by Hill/ASI in June 2015.
Sediment grab samples along the beach survey transects in 72 locations by MFS in December 2015
Geotechnical borings in the potential breakwater construction region were taken at 20 locations to depths of 52-105 feet in November 2015
Sediment grab samples taken at 39 in water locations by Prudent and 78 beach locations by MFS along the 23 survey transects in April/May 2016
The above sediment sample results can all be downloaded from the project sharepoint site.
The sediment data is summarized in the following figures and table. Average grain sizes are the provided for the entire data set along each survey transect and also with the coarsest grain sizes observed at MLW removed.

SCAPE / LANDSCAPE ARCHITECTURE PLLC
Page 67 of 75
Fall 2015 and Spring 2016 Sediment Sampling Results

SCAPE / LANDSCAPE ARCHITECTURE PLLC
Page 68 of 75
Table 1. Summary Of Average Grain Sizes By Transect
Transect
Average D50 of Samples (mm)
Average D50 Excluding MLW Sample Locations (mm)
Fall 2015
Spring 2016
Average Fall 2015
Spring 2016
Average
1 0.64 0.68 0.66 0.64 0.66 0.65
2 0.66 0.67 0.67 0.34 0.38 0.36
3 1.93 0.60 1.27 1.91 0.30 1.11
4 0.62 0.54 0.58 0.66 0.57 0.62
5 1.00 2.04 1.52 0.25 1.98 1.11
6 0.54 0.52 0.53 0.58 0.52 0.55
7 0.44 0.59 0.51 0.45 0.58 0.51
8 0.84 1.02 0.93 0.42 0.49 0.46
9 1.18 0.53 0.85 0.40 0.33 0.36
10 0.46 0.38 0.42 0.54 0.42 0.48
11 0.62 0.88 0.75 0.40 0.65 0.53
12 0.31 0.91 0.61 0.37 0.41 0.39
13 0.65 0.79 0.72 0.42 0.34 0.38
14 1.10 3.21 2.16 0.48 1.15 0.81
15 0.40 0.63 0.52 0.41 0.56 0.48
16 0.53 0.65 0.59 0.45 0.65 0.55
17 2.18 1.02 1.60 0.47 0.98 0.72
18 3.67 1.30 2.48 1.26 0.56 0.91
19 0.82 0.70 0.76 0.40 0.51 0.45
20 1.88 2.03 1.95 0.57 1.91 1.24
21 0.68 0.50 0.59 0.77 0.37 0.57
22 0.52 0.71 0.61 0.36 0.61 0.49
23 0.30 0.41 0.35 0.30 0.42 0.36
Average 0.95 0.93 0.94 0.56 0.67 0.61

SCAPE / LANDSCAPE ARCHITECTURE PLLC
Page 69 of 75
Shoreline Location
The “shoreline” will generally be shown as the current MHW line on maps.
For this project, unless otherwise indicated, Mean High Water (MHW) is defined to be MHW at the NOAA station at Sandy Hook, NJ (8531680) for the current epoch w (2.08 NAVD88). The current MHW line, is defined to be the intersection of this elevation with the on-land Bathymetry as surveyed by the Stantec team in the Fall of 2015 or, outside that area the 2014 USGS CGM LiDAR: Post Sandy for New York City
Historic shorelines were defined by the most recent high tide mark as delineated from historic orthoimagery. This was quantified by extracting the measured high tide at Sandy Hook for each orthoimage date. The average for all the orthoimages analyzed was 2.04 NAVD88, very close to the published MHW datum of 2.08 NAVD88.
Sometimes, for the purposes of mapping, the FEMA shoreline, as defined in the 2013 FEMA Preliminary
FIRMs may be shown as a general reference.
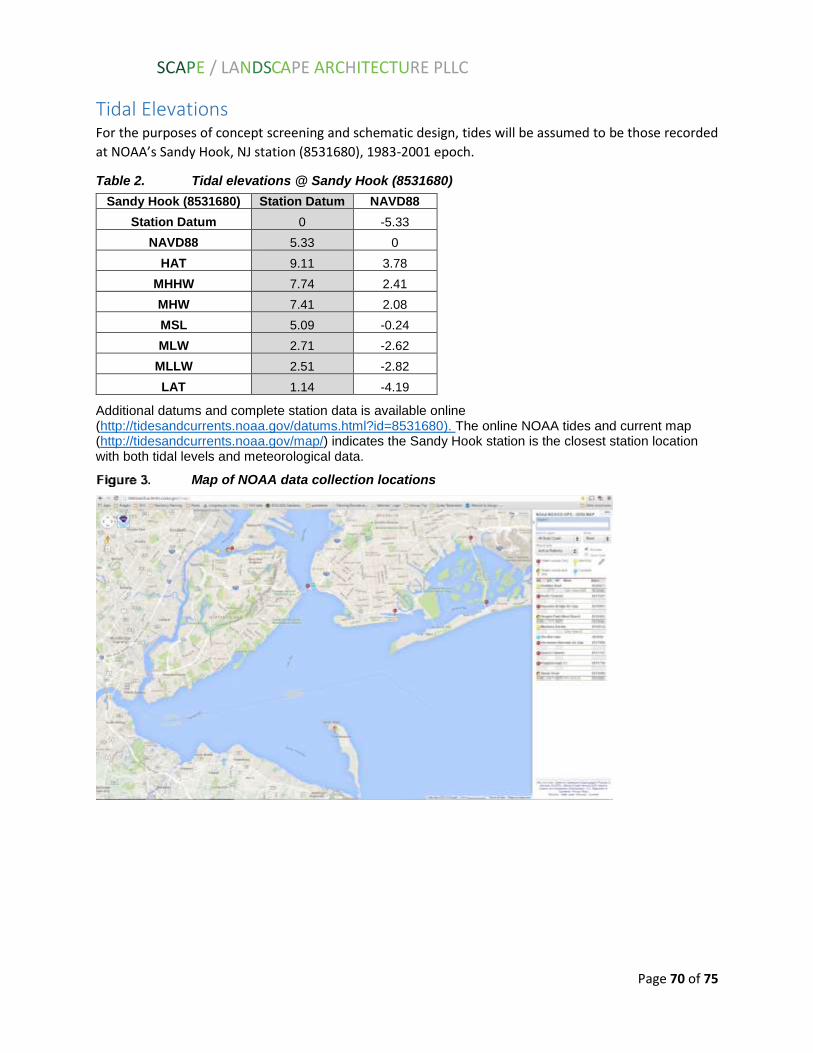
SCAPE / LANDSCAPE ARCHITECTURE PLLC
Page 70 of 75
Tidal Elevations For the purposes of concept screening and schematic design, tides will be assumed to be those recorded
at NOAA’s Sandy Hook, NJ station (8531680), 1983-2001 epoch.
Table 2. Tidal elevations @ Sandy Hook (8531680)
Sandy Hook (8531680) Station Datum NAVD88
Station Datum 0 -5.33
NAVD88 5.33 0
HAT 9.11 3.78
MHHW 7.74 2.41
MHW 7.41 2.08
MSL 5.09 -0.24
MLW 2.71 -2.62
MLLW 2.51 -2.82
LAT 1.14 -4.19
Additional datums and complete station data is available online (http://tidesandcurrents.noaa.gov/datums.html?id=8531680). The online NOAA tides and current map (http://tidesandcurrents.noaa.gov/map/) indicates the Sandy Hook station is the closest station location with both tidal levels and meteorological data.
Map of NOAA data collection locations

SCAPE / LANDSCAPE ARCHITECTURE PLLC
Page 71 of 75
Storm Return Periods
For the purpose of 30% design, the following storm return periods will be considered / studied:
10 year
25 year
50 year
100 year
Hurricane Sandy
Storm time series of water levels and waves for 10, 25, 50, and 100-year events will be extracted from the storm surge and wave modeling (ADCIRC/SWAN) used by FEMA to develop the 2013 PFIRM and 2015 effective maps. Hurricane Sandy information will be taken from available existing ADCIRC modeling. Details of the storm set selection will be provided in the Living Breakwaters 30% Design Modeling Report.
The same return periods will be used for performance analysis of both the Living Breakwaters and Shoreline Protection. Alternative return periods may be analyzed if agreed upon by the Living Breakwaters and Shoreline Protection design project teams.
The source and reference information for the storms or suite of storms considered have been described, documented and agreed upon by the Living Breakwaters and Shoreline Protection design teams in coordination and consultation with each other. The agreed upon storm conditions in the project vicinity are provided in the table below.
Table 3. Water levels and wave heights for target storm events
"today" With 30" sea level rise
Return Period
% annual chance
stillwater elevation
significant wave
height
stillwater elevation
significant wave height
NAVD88 (feet)
feet NAVD88
(feet) feet
10 YEAR 10% 8.1 3.9 10.6 3.9
25 YEAR 4% 9.3 4.3 11.8 4.3
50 YEAR 2% 11.3 4.9 13.8 4.9
100 YEAR 1% 12.9 5.3 15.4 5.3
SANDY n/a 12.9 6.3 15.4 6.3
MHW n/a 2.1 3.0 4.6 3.0
Early on, for initial concept development and screening, the assumed stillwater surge elevations for each
storm return period was based on the stillwater elevations identified in the 2013 FEMA Flood Insurance
Rate Study for New York City (FIS # 360497V000B, version 1.0.0.0).
The FEMA FIS transects associated with the project site include R-35, R-36, R-37, R-38 and R-39 and are
noted below.

SCAPE / LANDSCAPE ARCHITECTURE PLLC
Page 72 of 75
FEMA FIS Transect Locations
Table 4. FEMA FIS Transect Data
Source: 2013 FEMA Flood Insurance Rate Study for New York City (FIS # 360497V000B, version 1.0.0.0)
Living Breakwaters Analysis of system response to Storm WaveS The Living Breakwaters team will utilize the water levels, wave heights and storm hydrographs associated
with these storms to inform wave refraction and diffraction modeling of the breakwaters system during
storm events as well as anticipated wave transmission for the breakwater systems. This information will

SCAPE / LANDSCAPE ARCHITECTURE PLLC
Page 73 of 75
also be used to inform event-based erosion modeling using SBEACH or CSHORE for locations outside the
TSPP project area (within the TSPP project area, analysis will be performed by the TSPP team). Event-
based erosion modeling by the Living Breakwaters team will be calibrated using pre- and post- Sandy
LiDAR data.
TSPP Analysis of system response to Storm WaveS The Shoreline Protection features will be analyzed for wave runup, overtopping, and localized
scour/erosion for the 10, 25, 50, and 100-year storm events. The water elevations and wave time series
for this analysis will be the same as used for the LBW project design. Initial assessment will be based on
the condition of no LBW case. Stone and structural components will be sized for stability under the 100-
year event, however sand cover and surficial components may experience erosion. Since the crest
elevation has already been determined based on existing topographic features, the applicable return
period for which the Shoreline Protection features influence runup and overtopping will be calculated.
Revetment and stone core bottom of toe elevations will be based upon estimates for scour potential upon
guidance within the USACE Coastal Engineering Manual (CEM). SBEACH will also be used to compare
erosion potential. SBEACH analysis will be based upon grain size analysis and wave time series d noted in
other sections herein. Other SBEACH parameters for 30% design will follow USACE South Shore of Staten
Island, New York, Coastal Storm Risk Management, Fort Wadsworth to Oakwood Beach, Draft Main
Report, June 2015.
Prior TSPP analysis The Shoreline Protection alternative was previously assessed during screening of design options for the 1,
10, 25, 50, and 100-year recurrence interval environmental conditions, i.e. winds, water surface elevation,
and waves, to be used for comparison with the performance dune reinforced with stone core (herein
referred to as hybrid dune) and of a levee alternative. The maximum significant wave height, peak wave
period, water level, and wind speeds associated with the initial screening of each of these storm events is
summarized in the table below:
Table 5. Summary of storm information use for TSPP initial screening (superseded by information in table 3 for 30% design)
Return Design (FEMA) Design Water Level ACES Calculated Wind
Period Water Level Water Level + 30" SLR Wave Height Wave Period Speed
(yr) (ft NAVD 88) (ft NAVD 88) (ft) (sec) (mph)
100 12.8 15.3 8.4 5.31 96
50 11.3 13.8 7.66 5.1 90
25 9.9 12.4 6.92 4.87 85
10 8.1 10.6 6.02 4.58 76
1 3.4 5.9 3.9 3.79 55
This preliminary screening included the assessment of hybrid dunes and a levee option. Based upon this
assessment, the levee alternative was not pursued for further design. Following this initial assessment,

SCAPE / LANDSCAPE ARCHITECTURE PLLC
Page 74 of 75
the hybrid dune elevation was set based upon site constraints and the linear extend of the stone core
dune was revised. Adjoining the stone core dune, areas of eco-revetment, earthen berm, and raised
pathway (collectively shoreline protection features) were incorporated along reaches of shoreline.
Long Term Shoreline Change Historic shoreline change was analyzed using aerial imagery obtained from the New York State
Department of Environmental Conservation (DEC) and New York City Department of Information
Technology and Telecommunications (DOITT).
Projected long term shoreline change is being analyzed using the GENESIS shoreline change model.
Wave climate assumptions for this modeling is based on available USACE offshore wave hindcast data
and/or measured wave data. Hourly wave data were transformed by the Living Breakwaters project team
from offshore to the project site using the numerical model SWAN for the available time period of 1982-
2012. A description of the methodology used will be provided in the Living Breakwaters will be provided
in the Living Breakwaters 30% Design Modeling Report. .
Sea Level Rise For the purpose of initial screening and analysis and 30% design, a single sea level rise assumption will be
made. Once a preferred breakwater design or limited number of design scenarios are arrived at,
performance under additional SLR scenarios may be studied.
The following assumption for Sea Level Rise will be made for the purpose of developing, analyzing and
screening design scenarios for 30% design (for both the Living Breakwaters and Shoreline Protections): 30
inches.
This is consistent with a mid-range SLR projection for the 2080s according to the New York City Panel on
Climate Change (NPCC). The 2080s projection was selected because it is the closest projection window to
the projects target completion year (2020) plus assumed design life (50 years), 2070. This SLR is also
consistent with the NPCCs 90th percentile estimate for 2050, ensuring that the high SLR estimate for the
first half of the design life is accounted for. See the NPCC SLR projections below for reference)
Table 6. New York City Sea Level Rise Projections
Source: Ann. N.Y. Acad. Sci. ISSN 0077-8923; “New York City Panel on Climate Change 2015 Report, Chapter 2: Sea Level Rise and Coastal Storms” by Radley Horton, Christopher Little, Vivien Gornitz, Daniel Bader, and Michael Oppenheimer. http://onlinelibrary.wiley.com/doi/10.1111/nyas.12593/epdf

SCAPE / LANDSCAPE ARCHITECTURE PLLC
Page 75 of 75
Project Design life
Living Breakwaters For the purposes of developing and screening initial Living Breakwaters design concepts, the target
functional design life will be 50 years. This does not mean that it is assumed that the Living Breakwaters
will fail or cease to function after 50 years, but simply that this is the period over which we hope to
maintain desired performance. After 50 years it is assumed that the Living Breakwaters would be able to
be upgraded or adapted to maintain performance over a longer timeframe. This assumption is made for
the purposes of initial analysis and screening, in developing the preferred scenario(s) the different project
functional and structural design lives may be explored and analyzed.
Tottenville Shoreline Protection Project The rock core of the Shoreline Protection structure will be considered for a 50-yr design life. It should be
noted for the Shoreline Protection alternative that periodic nourishment of the beach and Shoreline
Protection may be required within the project life span. Such nourishment requirements will be assessed
as part of this effort and will need to be considered as operational and maintenance costs associated with
this alternative.