rba chart pack (8 may 2013)
TRANSCRIPT
The Australian Economy andFinancial MarketsChart Pack May 2013


Contents
GraphsWorld Economy 1–3Australian GDP Growth and Inflation 4Household Sector 5–6Business Sector 7–8Credit and Money 9Factors of Production and Labour Market 10–11Regions and Industry 12–13Government 14Commodity Prices 15Balance of Payments and External Position 16–17Interest Rates 18–22Share Markets 23–24Bond Issuance 25Equity Raisings and Business Financing 26Exchange Rates 27–28Banking Indicators 29–30
The Australian Economy and Financial Markets


CHARt PACk | MAy 2013 1
-4
-2
0
2
4
6
-4
-2
0
2
4
6
GDP Growth – WorldYear-ended
% %
Major trading partners*
World**
* Weighted using Australian export shares** PPP-weighted; accounts for 87 per cent of world GDPSources: ABS; CEIC; IMF; RBA; Thomson Reuters
2012200620032000 20090
5
10
0
5
10
2013
GDP Growth – China and IndiaYear-ended
India
China
% %
2010200720042001Sources: CEIC; RBA
-12
-8
-4
0
4
-12
-8
-4
0
4
GDP Growth – Advanced EconomiesYear-ended
Source: Thomson Reuters2013
Euro area
% %
US
Japan
200720042001 2010-10
-5
0
5
10
-10
-5
0
5
10
GDP Growth – East AsiaYear-ended
% %
ASEAN-4*
Higher-income Asian economies**
* Indonesia, Malaysia, Philippines and Thailand; PPP-weighted** Hong Kong, Singapore, South Korea and Taiwan; PPP-weightedSources: CEIC; IMF; RBA
2012200620032000 2009
World Economy

CHARt PACk | MAy 2013 2
-4
0
4
8
-4
0
4
8
2013
Inflation – East AsiaYear-ended
% %
201020072004* Indonesia, Malaysia, Philippines and Thailand; PPP-weighted** Hong Kong, Singapore, South Korea and Taiwan; PPP-weightedSources: CEIC; IMF; RBA; Thomson Reuters
ASEAN-4*
Higher-income Asianeconomies**
2001
2
6
10
2
6
10
Unemployment Rate – Advanced Economies
Source: Thomson Reuters
Euro area
%
US
Japan
%
20132010200720042001
-2
-1
0
1
2
-2
-1
0
1
2
Core Inflation* – Advanced EconomiesYear-ended
US**
Euro area
Japan
%%
* Excluding food and energy, and for the euro area also excluding alcoholand tobacco
** Core price index for personal consumption expendituresSource: Thomson Reuters
20132010200720042001-4
0
4
8
-4
0
4
8
Inflation – China and IndiaYear-ended
* Consumer price index** Wholesale price indexSources: CEIC; RBA
2013
India**
%
China*
%
2010200720042001
World Economy

CHARt PACk | MAy 2013 3
China – Monthly Activity Indicators*Nominal growth
2011
0
3
0
3
-3
0
3
-3
0
3
%Retail sales%
20092007
%%
* RBA estimates prior to February 2011Sources: CEIC; RBA
Fixed asset investment
2013
90
100
110
120
130
Index
35
50
65
80
95
Prices2006 average = 100
Floor space sold
China – Residential Property Market*
M(m2)
2013200920132009* RBA estimatesSources: CEIC; RBA
10
20
30
10
20
30
China – Credit and Money Supply GrowthYear-ended
Source: CEIC
Credit
%%
201120092007
M2 money supply
2013
China – Output IndicatorsLog scale; 2005 average = 100
Industrial production
Index
Sources: CEIC; RBA
5050
100100
200200
Index
Crude steel
Rail freight
Electricityconsumption
20132009201320092005 2005
World Economy

CHARt PACk | MAy 2013 4
Australian GDP Growth and Inflation
-2
0
2
4
-2
0
2
4
Year-ended
2012
%%
Quarterly
GDP Growth
2008Source: ABS
1996 20042000-1
0
1
2
3
4
5
-1
0
1
2
3
4
5
Consumer Price Inflation*
2013
%%
Year-ended
* Excluding interest charges prior to the September quarter 1998 andadjusted for the tax changes of 1999–2000
Sources: ABS; RBA
Quarterly (seasonally adjusted)
20092005200119971993
Underlying Inflation*
%
0
1
2
3
4
5
0
1
2
3
4
5
2013
Weighted median
Trimmed mean
* Excluding interest charges prior to the September quarter 1998 andadjusted for the tax changes of 1999–2000
Sources: ABS; RBA
CPI excl volatile items
%
20092005200119971993
Non-tradables and Tradables Inflation
-2
0
2
4
-2
0
2
4
2013
%
Year-ended
Non-tradables* Tradables**%
* Excluding deposit & loan facilities to June 2011** Excluding volatile items (fruit, vegetables & automotive fuel) and tobaccoSources: ABS; RBA
Quarterly(seasonally adjusted)
200920092005 2013 2005

CHARt PACk | MAy 2013 5
Household Sector
4
8
4
8
% %Retail Sales Growth
* Percentage change over year to latest three monthsSource: ABS
-5
0
-5
0
Volumes (quarterly)% %
20132010200720042001
Volumes(year-ended)
Values(year-ended*)
-5
0
5
10
15
-5
0
5
10
15
Household Saving Ratio*Per cent of household disposable income
* Net of depreciationSource: ABS
2012
%
2007200219921987
%
1997
0
5
10
15
0
5
10
15
Private Residential Building Approvals
Source: ABS2013
’000Total
’000
Higher-density housing
Detachedhouses
2008200319981993
Monthly
60
80
100
120
60
80
100
120
Consumer SentimentAverage since 1980 = 100
201320092005
Index Index
Source: Melbourne Institute and Westpac200119971993

CHARt PACk | MAy 2013 6
Household Sector
25
50
75
100
125
150
4
6
8
10
12
14
* Household sector excludes unincorporated enterprises; disposableincome is after tax and before the deduction of interest payments
Sources: ABS; RBA
201220021992
% %Debt Interest paid
20122002
Household Finances*Per cent of household disposable income
19920
150
300
450
600
0
150
300
450
600
%%
* Household liabilities exclude the liabilities of unincorporated enterprises;disposable income is after tax and before the deduction of interest payments
Sources: ABS; RBA; RP Data-Rismark
20122008200420001996
Liabilities
Net worth
Dwellings
Financial assets
Household Wealth and Liabilities*Per cent of annual household disposable income
Dwelling Prices
200
300
400
500
600
200
300
400
500
600
Brisbane
Sydney
Perth
MelbourneAdelaide
Canberra
Regional*
2013
Australia
2009 20132009* Excluding apartments; measured as areas outside of capital cities in
mainland statesSources: RBA; RP Data-Rismark
$’000$’000
0
5
10
15
20
0
5
10
15
20
$b$b
Sources: ABS; RBA20132011200920072003
Total
Non-first home buyerowner-occupiers
First home buyers
Investors
Housing Loan Approvals
2005

CHARt PACk | MAy 2013 7
Business Sector
0
4
8
12
0
4
8
12
2012
%
Private Non-financial Corporation Profits*Share of nominal GDP
%
Mining
2008* Gross operating profits; inventory valuation adjustedSources: ABS; RBA
Non-mining
20042000
-30
-15
0
15
-30
-15
0
15
72
75
78
81
84
72
75
78
81
84
-30
-15
0
15
-30
-15
0
15
NAB Business Survey
* Net balance; deviation from average since 1989Sources: NAB; RBA
pptBusiness conditions*
Business confidence*
Capacity utilisation
20132008200319981993
ppt
%
ppt
ppt
%
30
40
50
60
9
12
15
18
% %Business Finances
Business creditPer cent of nominal GDP
Interest paid*Per cent of profits**
* Interest on intermediated debt from Australian-domiciled financialinstitutions
** Profits are private non-financial gross operating surplus (adjusted forprivatisations) and gross mixed income
Sources: ABS; RBA
2012200720022012200720021997

CHARt PACk | MAy 2013 8
Business Sector
Business Investment*
10
12
14
16
18
10
12
14
16
18
Share of nominal GDP
2002
%%
2012* Excludes second-hand asset transfers between the private and other
sectors; no adjustments have been made for privatisationsSource: ABS
20071992 1997
Capital Expenditure – Mining and Non-mining*Nominal, financial year, log scale
* Sample of firms’ spending plans; dots represent the survey’s most recentestimates for 2012/13 adjusted for historical realised spending
Sources: ABS; RBA
2013
$b Mining $bNon-mining
20031993
4
8
16
32
64
2
4
8
16
32
64
2201320031993
128 128
0
2
4
6
8
0
2
4
6
8
Business Investment Components*Share of nominal GDP
Buildings
%%
Machinery and equipment
20122007200219971992* Excludes second-hand asset transfers between the private and other
sectors; no adjustments have been made for privatisationsSource: ABS
Engineering
0
1
2
3
0
1
2
3
Private Non-residential Building ApprovalsPer cent of nominal GDP
Source: ABS2013
%%
20082003199819931988

CHARt PACk | MAy 2013 9
Credit and Money
0
5
10
15
0
5
10
15
% %
Credit
Broad money
Source: RBA
Credit and Broad Money GrowthYear-ended
20132005 2009200119970.5
0.8
1.1
1.4
0.5
0.8
1.1
1.4
Credit*Ratio to nominal GDP
Ratio Ratio
* Not adjusted for breaksSources: ABS; RBA
20132003 200819981993
Monetary Aggregates GrowthYear-ended
% %
M3
0
6
12
18
0
6
12
18
Currency
Source: RBA20132005 200920011997
-10
0
10
20
-10
0
10
20
Credit Growth by SectorYear-ended
Business
Housing
Personal
% %
Source: RBA20132005 200920011997

CHARt PACk | MAy 2013 10
Factors of Production and Labour Market
Year-ended changeLabour Productivity
Source: ABS
2012
Output
%
-4
0
4
8
-4
0
4
8
-8
-4
0
4
-8
-4
0
4
Total hours worked
Output per hour worked
200720021997199219871982
%
%%
Annual growthFactors of Production
* Excluding livestock & orchards, dwellings and ownership transfer costsSources: ABS; RBA
11/12
%Capital stock*
3
5
3
5
1.0
1.5
2.0
1.0
1.5
2.0
05/0699/00
Working-age population
%
%%
93/9487/8881/82
-4
-2
0
2
4
-4
-2
0
2
4
Growth in Labour Input
Year-ended, trend
Source: ABS2013
Employment
%%Total hours worked
2009200520011997199380
100
120
140
160
180
80
100
120
140
160
180
Capital Ratios*
1979/80 = 100
* Capital stock excludes livestock & orchards, dwellings and ownershiptransfer costs
Sources: ABS; RBA
11/12
Capital-labour ratio
IndexIndex
Capital-output ratio
06/0701/0296/9791/9286/8781/82

CHARt PACk | MAy 2013 11
Factors of Production and Labour Market
Unemployment and Participation Rates
62
63
64
65
66
3
5
7
9
11
% %
2013200920052001Source: ABS
Participation rate(RHS)
Unemployment rate(LHS)
19971993
Full-time and Part-time Employment
5.5
6.0
6.5
7.0
7.5
8.0
1.5
2.0
2.5
3.0
3.5
4.0
5.5
6.0
6.5
7.0
7.5
8.0
1.5
2.0
2.5
3.0
3.5
4.0
M M
2013Source: ABS
Full-time(LHS)
Part-time(RHS)
20092005200119971993
0
1
2
3
4
5
0
1
2
3
4
5
Source: ABS
2012
%%
201220072002
Wage Price Index Growth
Private sector
Year-ended
Quarterly
Public sector
20072002 0.5
1.0
1.5
2.0
0.5
1.0
1.5
2.0
Job Vacancies and AdvertisementsPer cent of labour force
* This survey was suspended between May 2008 and November 2009Sources: ABS; ANZ
2013
Vacancies*(ABS survey)
% %Advertisements
(ANZ survey)
2010200720042001

CHARt PACk | MAy 2013 12
Regions and Industry
0
5
10
15
20
25
30
35
0
5
10
15
20
25
30
35
State Share of Output*
* NominalSource: ABS
11/12
New South Wales%
Victoria
Queensland
Western Australia
South Australia
Tasmania
03/04 07/0899/0095/9691/92
%
-5
0
5
10
-5
0
5
10
-10
-5
0
5
10
15
-10
-5
0
5
10
15
-5
0
5
10
15
-5
0
5
10
15
New South Wales
Victoria
State Final Demand Growth
Year-ended
Western Australia
Queensland
Tasmania*South Australia
% %
201220082004200019961992* Adjusted for the purchase and sale of ferries in 2002Sources: ABS; RBA
% %
% %
State Unemployment Rates
Trend
2
3
4
5
6
7
2
3
4
5
6
7
Source: ABS2013
New South Wales
% %
2009 20132009
Queensland
Victoria
Tasmania
Western Australia
South Australia
2005

CHARt PACk | MAy 2013 13
Regions and Industry
2
4
6
8
10
12
14
2
4
6
8
10
12
14
11/12
%Industry Share of Output*
Manufacturing
Retail and wholesale trade
Construction
Mining
Other business services**
07/0803/0499/0095/96* Nominal gross value added** Includes: information media and telecommunications; rental, hiring and real
estate services; professional scientific and technical services;administrative and support services
Source: ABS
%
91/92
Agriculture
Financial and insuranceservices
0
10
20
30
40
0
10
20
30
40
Industry Share of Business Investment*
Manufacturing
%
Other businessservices**
Agriculture
Mining
Retail andwholesale trade
Construction
11/1207/0803/0499/0095/9691/92* Nominal** Includes: information media and telecommunications; rental, hiring and real
estate services; professional scientific and technical services;administrative and support services
Source: ABS
%
Financial andinsurance services
50
100
150
200
250
300
350
50
100
150
200
250
300
350
2008 201320032008 20132003
Other businessservices** (14.9%)
Retail and wholesale trade (14.5%)
Mining (2.3%)
Manufacturing (8.1%)
Construction (8.8%)
Financial andinsurance services
(3.5%)
* Figures in parentheses represent share of total employment based onlatest quarterly data
** Includes: information media and telecommunications; rental, hiring andreal estate services; professional, scientific and technical services;administrative and support services
Source: ABS
Employment by Industry*2000 average = 100
IndexIndex
1998-60 -40 -20 0 20 40 60
Contributions to Employment GrowthYear to February 2013, trend
Source: ABS’000
Health care & social assistance
Mining
Public administration & safety
Professional, scientific & technical
Financial & insuranceOther services
Wholesale trade
Rental, hiring & real estateUtilities
Information & telecommunications
Arts & recreation
Administrative & support
Education & training
Agriculture, forestry & fishing
Construction
Transport, postal & warehousing
Manufacturing
Retail trade
Accommodation & food services

CHARt PACk | MAy 2013 14
Government
-5
-4
-3
-2
-1
0
1
2
-5
-4
-3
-2
-1
0
1
2
%%
Australian Government Budget Balance*
Per cent of nominal GDP
* Underlying cash balanceSource: Australian Treasury
15/1609/1003/0497/9891/9285/86-1.2
-0.8
-0.4
0.0
0.4
0.8
-1.2
-0.8
-0.4
0.0
0.4
0.8
State Budget Balances*Per cent of nominal GDP
%%
* Underlying cash balanceSource: ABS
11/1206/0701/0291/9286/87 96/9781/82
0
1
2
3
0
1
2
3
Public Construction Work DonePer cent of nominal GDP
Source: ABS
2012
Total
%
Engineering
Building
%
20082004200019961992 -10
0
10
20
30
-10
0
10
20
30
11/1207/0803/04
Non-financial Public Sector Net Debt*Per cent of nominal GDP
% %Non-financial public sector
Australian Government
State and local general governments
* Estimates as at the 2012/13 MYEFOSource: Australian Treasury
99/0095/9691/92

CHARt PACk | MAy 2013 15
Commodity Prices
20
40
60
80
100
20
40
60
80
100
20
40
60
80
100
20
40
60
80
100
RBA Index of Commodity Prices
SDR, 2011/12 average = 100Index Index
20132008200319981993Source: RBA
1988
Base Metals, Rural and Oil PricesWeekly
l l l l l l l I70
100
130
160
190
220
l l l l l l l I 25
50
75
100
125
150
* RBA Index of Commodity Prices sub-indices; SDR terms;2005 average = 100
Sources: Bloomberg; RBA
Index US$/b
Base metals*
Brent oil
2009
Rural*
2013 2009 20132005
l l I 50
150
250
350
l l I50
90
130
170
Bulk Commodity PricesFree on board basis
* Iron ore fines, Newcastle thermal coal and premium hard coking coalSources: ABS; Bloomberg; Citigroup; Energy Publishing; globalCOAL;
Macquarie Bank; RBA
2013
Spot price*
Iron ore(LHS)
Thermal coal(LHS)
Coking coal(RHS)
Average Australianexport price
20132013 201120112011
US$/tUS$/t
l l I 20
40
60
80
100
20
40
60
80
100
Terms of Trade*
2010/11 average = 100Index Index
2012* Annual data are used prior to 1960Sources: ABS; RBA
1997198219671952
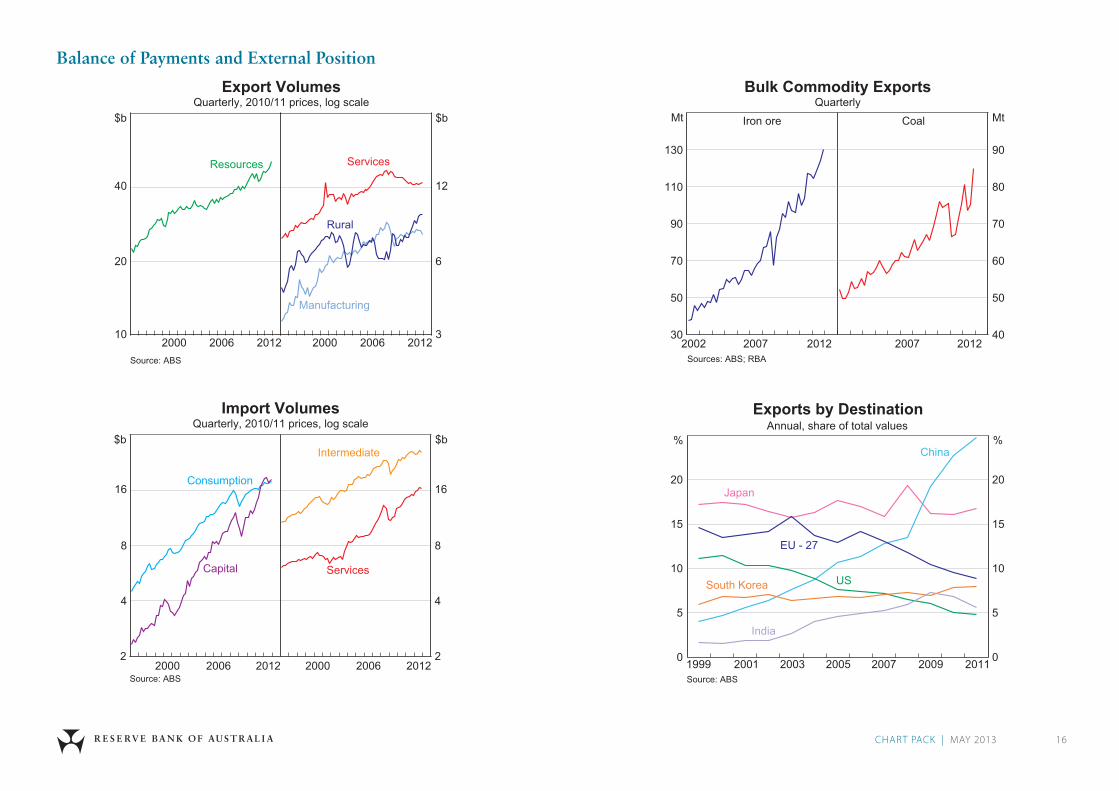
CHARt PACk | MAy 2013 16
Balance of Payments and External Position
Export VolumesQuarterly, 2010/11 prices, log scale
Source: ABS
$b $b
20122006
20
Resources
Rural
Services
Manufacturing
200020122006200010
40
6
3
12
30
50
70
90
110
130
Bulk Commodity ExportsQuarterly
40
50
60
70
80
90
Sources: ABS; RBA2012
Mt Iron ore MtCoal
20072002 20122007
Import VolumesQuarterly, 2010/11 prices, log scale
Source: ABS
$b $b
20122006
4
8
16
2 2
4
8
16Consumption
Capital Services
Intermediate
20002012200620000
5
10
15
20
0
5
10
15
20
Exports by Destination
Annual, share of total values
Source: ABS2011
% %
200920072003
Japan
EU - 27
US
China
South Korea
India
2001 20051999

CHARt PACk | MAy 2013 17
Balance of Payments and External Position
-9
-6
-3
0
-9
-6
-3
0
Current Account BalancePer cent of nominal GDP
Net incomebalance
Current account balance
Trade balance
% %
Source: ABS20132008200319981993
-4
-2
0
2
4
6
8
-4
-2
0
2
4
6
8
% %
Debt
Equity
20122009Source: ABS
2006
Net Capital InflowPer cent of nominal GDP
20032000
* 2012 values for GDP and net capital flows are year to SeptemberquarterSource: ABS
Net Foreign LiabilitiesPer cent of nominal GDP
0
15
30
45
60
0
15
30
45
60
% %
Total
Debt
Equity
Source: ABS20132008200319981993
l l l l l l l l l l 0
500
External PositionComposition after hedging, quarterly*
Gross foreign assets
n Foreign currencyn Australian dollar
$bGross foreign liabilities$b
1 000
1 500
1 000
1 500
* Hedge ratios inferred from the Foreign Currency Exposure surveySources: ABS; RBA
2 0002 000
l l l l l l l l l l0
500
2012 20082004 201220082004

CHARt PACk | MAy 2013 18
Policy Interest Rates – Selected
Advanced Economies
SwitzerlandSweden
Canada
UK
% %
0
2
4
6
8
0
2
4
6
8NZ
Source: central banks2007 2009 2011 20132005
-3
0
3
6
9
-3
0
3
6
9
Australian Cash Rate
Real cash rate*
2003
Cash rate
% %
201320081998
Sources: ABS; RBA* Calculated using average of weighted median and trimmed mean inflation1993
Policy Interest Rates – G3
US
Euro area
% %
-1
0
1
2
3
4
5
-1
0
1
2
3
4
5
-1
0
1
2
3
4
5
-1
0
1
2
3
4
5
Japan*
2005 2007 2009 20132011* Since April 2013, the Bank of Japan's main operating target has been
the money baseSource: central banks
l l l l l l l l l2
3
4
5
6
7
8
2
3
4
5
6
7
8
Australian Cash Rate and 90-day Bill Yield%
Cash rate
90-day bill yield
Sources: AFMAData; RBA
2005
%
2007 2009 20132011
Interest Rates

CHARt PACk | MAy 2013 19
%
0
1
2
3
4
5
6
0
1
2
3
4
5
6US
%
Germany
Japan
2013
10-year Government Bond Yields
Source: Thomson Reuters2010200720042001
0
5
10
15
20
0
5
10
15
20
% %
South Africa
Mexico
Brazil
Russia
Policy Interest Rates – Emerging Markets
Source: central banks2013
Poland
2009 201120072005
%
Indonesia
Policy Interest Rates – Asia
Malaysia
China*
0
1
2
3
4
5
%South Korea
Taiwan
Thailand
* 1-year lending rateSource: central banks
201320090
3
6
9
12
15
India
2005201320092005Source: RBA
2
3
4
5
6
7
2
3
4
5
6
7
% %
20102001
10-year Australian Government Bond Yield
20072004 2013
Interest Rates

CHARt PACk | MAy 2013 20
0
3
6
9
0
3
6
9
%
AAA corporates*
US government
%
BBB corporates*
* Includes financials and non-financialsSources: Bank of America Merrill Lynch; Bloomberg
Swap
US Bond Yields
2005 2009 20132001
3–5 years
1997
0
200
400
600
800
0
200
400
600
800
US Bond Spreads
Bps
AAA corporates*
A corporates*
BBB corporates*
* Includes financials and non-financialsSources: Bank of America Merrill Lynch; Bloomberg
Swap
Bps
2005 2009 20132001
To US government bonds, 3–5 years
1997l l l l l l l l l l l l l l l l l l l l l l l-100
0
100
200
300
400
500
-100
0
100
200
300
400
500
Differential between Australian and US10-year Government Bond Yields
Bps
Sources: Bloomberg; RBA
Bps
1993 1997 2009 201320052001
Source: RBA
-6
-4
-2
0
2
4
-6
-4
-2
0
2
4
% %
Spread between Australian 10-year
Bond Yield and the Cash Rate
1993 1997 2009 201320052001
Interest Rates

CHARt PACk | MAy 2013 21
l l l l l l l l l l l l l l l2
4
6
8
2
4
6
8
Australian Bond Yields*%%
BBB corporates
* Australian Government yields and swap rates are for 3-year maturity.Corporate bond yields are a weighted average of senior bonds withremaining maturities of 1 to 5 years; they include financial and non-financial corporates.
Sources: Bloomberg; RBA; UBS AG, Australia Branch
AustralianGovernment
Swap
AA corporates
2001 2005 2009 2013
* Swap spreads are for 3-year maturity. Corporate bond spreads are aweighted average of senior bonds with remaining maturities of 1 to 5years; they include financial and non-financial corporates.
l l l l l l l l l l l l l l l0
100
200
300
400
500
0
100
200
300
400
500
Australian Bond Spreads*Spread over government yields
Bps
A corporates
Bps
BBB corporates
Swap
Sources: Bloomberg; RBA; UBS AG, Australia Branch
AA corporates
2001 2005 2009 20130
300
600
900
0
300
600
900
Bps
Emerging Market Bond Spreads
Latin America
Asia
Bps
Sources: Bloomberg; RBA; Thomson Reuters
1 500
1 200
1 500
1 200
2001 201320092005
Europe
1997
To US government bonds, duration matched
0
4
8
12
16
20
0
4
8
12
16
20
%Emerging Market Bond Yields
2001
Latin America
Asia
%
Sources: Bloomberg; RBA; Thomson Reuters201320092005
Europe
1997
Interest Rates

CHARt PACk | MAy 2013 22
1993 1998 2003 2008 20132
4
6
8
10
2
4
6
8
10
Australian Housing Lending Rates
Sources: ABS; APRA; Perpetual; RBA
Cash rate
%%
Banks’ indicator rate on new loans
Actual rate on outstanding loans
Average interest rate on variable-rate loans
1993 1998 2003 2008 20132
4
6
8
10
12
2
4
6
8
10
12
Australian Fixed Interest Rates
Sources: Bloomberg; RBA
Small business
%3-year maturity
%
Swap rate
Housing
2
4
6
8
10
12
2
4
6
8
10
12
Australian Small Business Interest Rates
* Indicator rates** Including risk marginsSources: APRA; RBA
Cash rate
%%Weighted-average outstanding
variable rate**
Term loanresidential security*
Overdraftother security*
1997 2001 2005 2009 20131993
Sources: APRA; RBA
6
8
10
6
8
10
2
4
6
8
2
4
6
8
% %
% %
Small business
Large business
Australian Business Lending Rates
20092005 20132001
Average interest rate on outstanding lending
1997
Interest Rates

CHARt PACk | MAy 2013 23
40
100
40
100
Major Economies’ Share Price Indices
Japan
US
UK
IndexIndexLog scale, end December 1994 = 100
Euro area300
200
300
200
Source: Bloomberg1997 20132005 20092001
80
100
80
100
Australian and World Share Price Indices
Log scale, end December 1994 = 100
Sources: Bloomberg; RBA; Thomson Reuters
S&P 500
Index Index
ASX 200
MSCI World
300
200
300
200
350
250
150
350
250
150
2005 2009 201320011997
60
100
60
100
Australian Share Price IndicesLog scale, end December 1994 = 100
Sources: Bloomberg; RBA; Thomson Reuters
Financials
Index Index
Resources
All other sectors
600500
400
300
200
600500
400
300
200
2005 2009 20132001199740
100
40
100
Emerging Asia
Index
Share Price Indices
Latin America
IndexLog scale, end December 1994 = 100
Sources: Bloomberg; MSCI20052001 2009 2013
1 000
1 500Emerging Europe
500500
1 500
1 000
China
World
1997
200 200
Share Markets

CHARt PACk | MAy 2013 24
0
2
4
6
0
2
4
6
%
Source: Thomson Reuters
%
MSCI Worldexcluding Australia
MSCI Australia
Dividend Yields
2001 2007 201319951989
50
70
90
50
70
90
Forecast Earnings per Share
Index
Source: Thomson Reuters
MSCI AustraliaIndex
06/07
07/08
09/10
11/12
08/09
10/11
05/06
12/13
13/14
20132011200920072005
0
10
20
0
10
20
Ratio
Source: Thomson Reuters
Ratio
MSCI World
MSCI Australia
Forward P/E Ratios
2001 2007 201319951989
0
10
20
30
0
10
20
30
Ratio
Source: Thomson Reuters
Ratio
MSCI Worldexcluding Australia
MSCI Australia
Trailing P/E Ratios
2001 2007 201319951989
Share Markets

CHARt PACk | MAy 2013 25
0
100
200
300
0
100
200
300
Non-government Bonds on Issue OffshoreAll currency denominations
* Australian dollar-denominated bonds onlySources: ABS; RBA
Financials
$b
Non-financialcorporates
Non-residents*
$b
201320092001 20051997
Asset-backed securities
1993
Gross issuanceNon-government Bond Issuance
* Excludes ADIs’ self-securitisations** Offshore non-resident issuance includes Australian dollar-denominated
bonds onlySource: RBA
$b Australia
20
40
20
40
$b
$b $bOffshore
2001 2004 2007 2010 20130
20
40
60
0
20
40
60
n Domestic issuers*n Non-resident issuers**
1993 1997 2001 2005 2009 20130
50
100
150
0
50
100
150
Non-government Bonds on Issue in Australia
* Excludes ADIs’ self-securitisationsSources: ABS; RBA
Financials
Asset-backed securities*
Non-residents
$b$b
Non-financial corporates
1993 1997 2001 2005 2009 20130
100
200
300
400
0
100
200
300
400
Bonds on Issue in Australia
$b
Australian Government*
Non-government**$b
State governments
* Excludes bonds purchased by the Australian Government** Excludes ADIs’ self-securitisations, includes government-guaranteed
bondsSources: ABS; RBA
Bond Issuance

CHARt PACk | MAy 2013 26
Net Non-intermediated Capital Raisings*
-25
0
25
50
$b$b Non-financial corporates
-25
0
25
50
Financials and asset-backed securities**
* Includes equity, hybrids, bonds, and short term-debt** Excludes ADIs’ self-securitisations; financials include banks and non-
bank financialsSources: APRA; ASX; Austraclear; RBA
20082003 2013 20082003 2013
$b
4
8
4
8
7
14
21
28
7
14
21
28
-5
0
-10
-5
0
$b
$b$b
$b$b
IPOs
Other raisings
Buybacks
-10
Australian Equity Raisings*
* All listed companiesSources: ASX; RBA
2010 20132004 20072001
-10
-5
0
5
10
15
-10
-5
0
5
10
15
Business External FundingNet change as a share of GDP
%%n Business creditn Non-intermediated debt
n Equity
Sources: ABS; APRA; ASX; RBA
2003 2008 20131993 1998
Total
-5
0
5
10
15
20
25
-5
0
5
10
15
20
25
$b$bn Financials**n Non-financial corporates
Australian Net Equity Raisings*
* All listed companies** Includes banks and non-bank financialsSources: ASX; RBA
2010 20132004 20072001
Equity Raisings and Business Financing

CHARt PACk | MAy 2013 27
20
40
60
80
20
40
60
80
-4
-2
0
2
4
-4
-2
0
2
4
-2
0
2
4
-2
0
2
4
Official Reserve Assets
* Excludes foreign exchange swaps** Includes market, government and other outright transactions, excludes
swap deliveries*** Data up to 29 June 2012; a positive value indicates a purchase of foreign
exchange, while a negative value indicates a sale of foreign exchangeSource: RBA
2013
Gross
A$b
RBA foreign exchange market intervention transactions***
A$b
A$bA$b
Net*
2009200520011997
RBA net purchases of foreign exchange**
A$bA$b
50
100
150
200
0.40
0.60
0.80
1.00
Yen per A$(LHS)
Euro per A$*(RHS)
Yen US$,Euro
* ECU per A$ until 31 December 1998Sources: Thomson Reuters; WM/Reuters
Australian Dollar against US Dollar,
Euro and Yen
20131998 2003 200819931988
US$ per A$(RHS)
40
50
60
70
80
40
50
60
70
80
Real
Nominal
IndexAustralian Dollar TWI*
Index
20131998 2003 200819931988* May 1970 = 100 for nominal; real indexed to equate post-float averagesSources: ABS; RBA; Thomson Reuters; WM/Reuters
Exchange Rates

CHARt PACk | MAy 2013 28
40
60
80
100
120
140
40
60
80
100
120
140
40
60
80
100
120
140
40
60
80
100
120
140
Selected Asian Currencies against the US Dollar
Indonesia
Index1 January 2000 = 100
Index
South Korea
MalaysiaThailand
Source: Bloomberg2004 2007
India
2010 2013
Singapore
2001
50
90
130
170
210
250
2.90
2.50
2.10
1.70
1.30
0.90
Yen US$
Yen per US$(LHS)
US$ per euro*(RHS, inverted scale)
1993 19981988 2013
US Dollar against Euro and Yen
2003 2008* US$ per ECU until 31 December 1998Sources: Bloomberg; Eurostat
60
70
80
90
100
110
9.0
8.5
8.0
7.5
7.0
6.5
Chinese Renminbi
Sources: BIS; Bloomberg; RBA2013
Nominal effective exchange rate(LHS, 2010 average = 100)
Index Yuan
Yuan per US$(RHS, inverted scale)
201020072004200160
80
100
120
60
80
100
120
Nominal TWIMarch quarter 1999 = 100
Sources: Bank of Japan; Board of Governors of the Federal Reserve System; European Central Bank
2013
YenIndex Index
Euro
US dollar
201020072001 2004
Exchange Rates

CHARt PACk | MAy 2013 29
6
12
Bank Profits
$b
0.0
0.4
6
12
0.0
0.4
$b
$b$b
2013-1.6
0.0
1.6
-1.6
0.0
1.6
$b$b
2010201320102007n Actualn Analysts’ forecasts
n Actualn Analysts’ forecasts
Major banks* Major banks*
Regional banks** Regional banks**
Foreign-owned banks*** Foreign-owned banks***
Profits after tax Bad and doubtful debt charge
Sources: APRA; Credit Suisse; Deutsche Bank; Nomura Equity Research;RBA; UBS Securities Australia; banks’ annual and interim reports
* ANZ, NAB and Westpac report half yearly to March and September, whileCBA reports to June and December
** Suncorp Bank, and Bendigo and Adelaide Bank report half yearly to Juneand December, while Bank of Queensland reports to February and August
*** All results are half year to June and December
2007
na na
0
10
20
0
10
20
Bank Profitability*
% %Post-tax and minority interests
0.0
0.5
1.0
1.5
0.0
0.5
1.0
1.5
Charge for bad and doubtful debtsPer cent of average assets
%%
Return on shareholders’ equity
* From 2006 data are on an IFRS basis; prior years are on an AGAAP basis;includes St. George and, from 2009, Bankwest
Sources: RBA; banks’ annual and interim reports
Regional banks
Major banks
Major banks
Institutions operating in Australia
Regional banks
201220072002199719921987
1.5
2.0
2.5
3.0
1.5
2.0
2.5
3.0
Major Banks’ Net Interest Margin*
* From 2006 data are on an IFRS basis; prior years are on AGAAP basis;excludes St George Bank and Bankwest prior to the first half of 2009
%Domestic, half-yearly
%
2009 20132001 2005
Sources: RBA; banks’ financial reports
Banking Indicators

CHARt PACk | MAy 2013 30
0
1
2
3
4
5
0
1
2
3
4
5
Banks’ Non-performing Assets
Domestic books, share of loans by type
* Includes lending to financial businesses, bills and debt securitiesSource: APRA
Housing
% %
Personal
2012
Business and other*
Total*
2010200820062004
Banks’ Non-performing Assets
0
2
4
6
0
2
4
6
Consolidated global operations, share of on-balance sheet assets
Impaired
Total*
* Includes assets 90+ days past due that are well securedSource: APRA
2004 2008 2012200019961992
% %
%
Bank Funding*
%
0
10
20
30
40
50
0
10
20
30
40
50
2011
Short-term debt**
Equity
Securitisation
20092005* Adjusted for movements in foreign exchange rates** Includes deposits and intragroup funding from non-residentsSources: APRA; RBA; Standard & Poor’s
Long-term debt
Share of total, all banks
Domestic deposits
20132007
Capital Ratios*
0
5
10
15
0
5
10
15
Building societies
Other ADIsLocally incorporated banks
Tier 1
Tier 2
Total
Credit unions
1991* Per cent of risk-weighted assets; break in March 2008 due to the
introduction of Basel II for most ADIsSource: APRA
201220051998
% %Consolidated global operations
201220051998
Banking Indicators