technical analysis chart pack - metlife
TRANSCRIPT
Technical Analysis Chart PackJun Jiang, CMT, CFAAssociate Director, Market StrategistGlobal Economic & Market Strategy
April 9, 2021
2
Key Market Themes
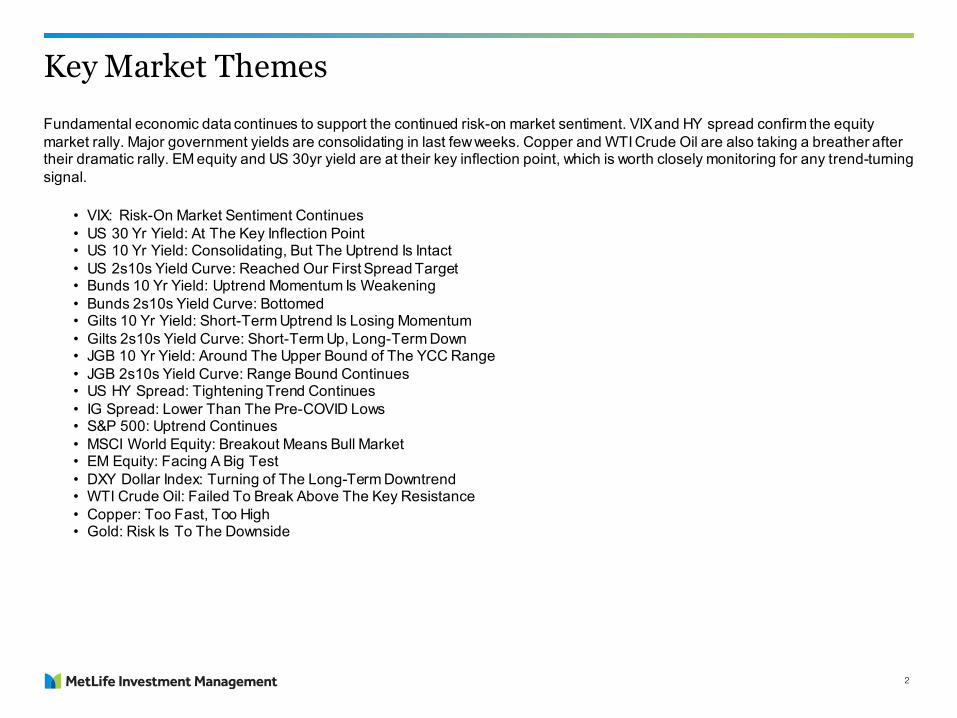
Fundamental economic data continues to support the continued risk-on market sentiment. VIX and HY spread confirm the equity market rally. Major government yields are consolidating in last few weeks. Copper and WTI Crude Oil are also taking a breather after their dramatic rally. EM equity and US 30yr yield are at their key inflection point, which is worth closely monitoring for any trend-turning signal.
• VIX: Risk-On Market Sentiment Continues• US 30 Yr Yield: At The Key Inflection Point• US 10 Yr Yield: Consolidating, But The Uptrend Is Intact• US 2s10s Yield Curve: Reached Our First Spread Target• Bunds 10 Yr Yield: Uptrend Momentum Is Weakening • Bunds 2s10s Yield Curve: Bottomed• Gilts 10 Yr Yield: Short-Term Uptrend Is Losing Momentum• Gilts 2s10s Yield Curve: Short-Term Up, Long-Term Down• JGB 10 Yr Yield: Around The Upper Bound of The YCC Range• JGB 2s10s Yield Curve: Range Bound Continues• US HY Spread: Tightening Trend Continues• IG Spread: Lower Than The Pre-COVID Lows• S&P 500: Uptrend Continues• MSCI World Equity: Breakout Means Bull Market• EM Equity: Facing A Big Test• DXY Dollar Index: Turning of The Long-Term Downtrend• WTI Crude Oil: Failed To Break Above The Key Resistance• Copper: Too Fast, Too High• Gold: Risk Is To The Downside
3
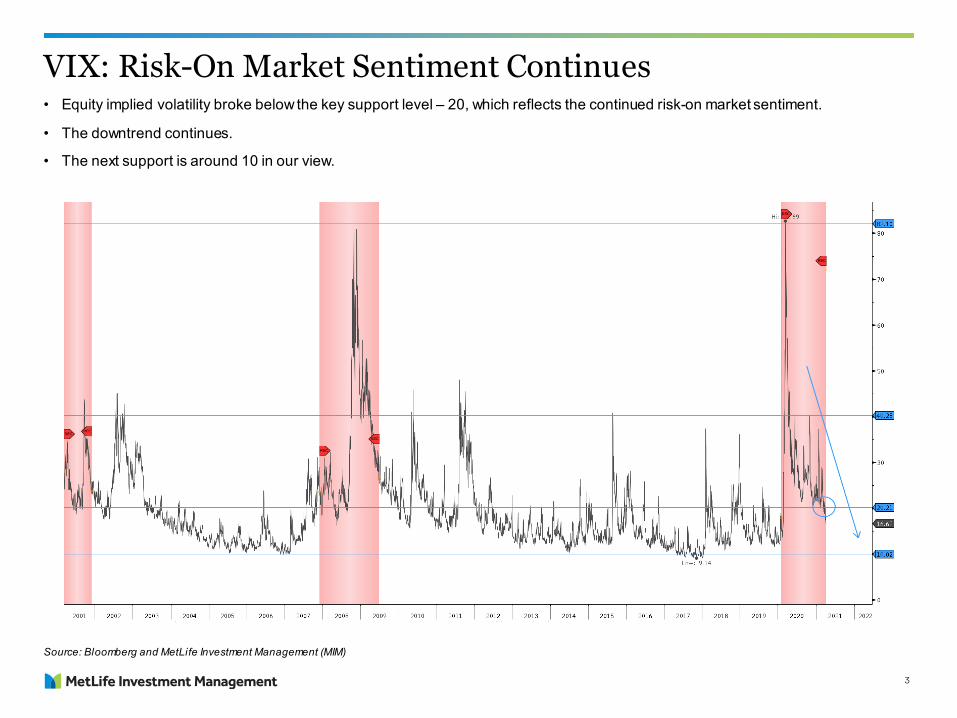
VIX: Risk-On Market Sentiment Continues• Equity implied volatility broke below the key support level – 20, which reflects the continued risk-on market sentiment.
• The downtrend continues.
• The next support is around 10 in our view.
Source: Bloomberg and MetLife Investment Management (MIM)

4
US 30 Yr. Yield: At The Key Inflection Point• The yield has rallied to the key market level, i.e., the upper bound of the long-term downward trading channel.
• We feel the RSI indicator in the second panel suggests that the bond is oversold.
• If the RSI indicator crosses back below 70, it could indicate a turning of the current short to medium-term uptrend.
Source: Bloomberg and MIM
5
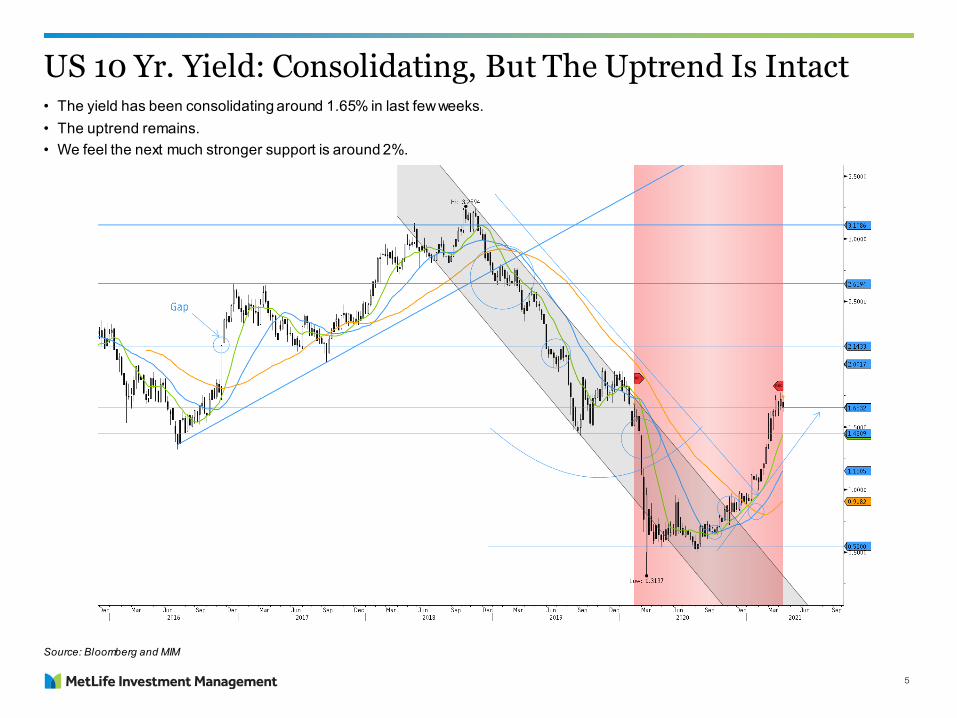
US 10 Yr. Yield: Consolidating, But The Uptrend Is Intact
Source: Bloomberg and MIM
• The yield has been consolidating around 1.65% in last few weeks. • The uptrend remains.• We feel the next much stronger support is around 2%.
6
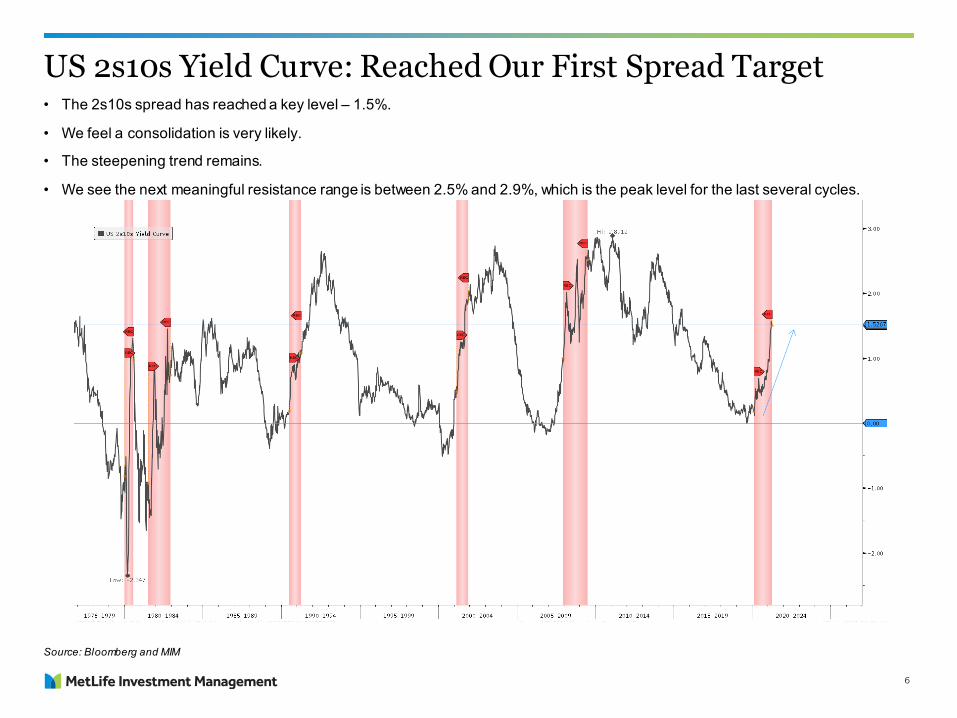
US 2s10s Yield Curve: Reached Our First Spread Target• The 2s10s spread has reached a key level – 1.5%.
• We feel a consolidation is very likely.
• The steepening trend remains.
• We see the next meaningful resistance range is between 2.5% and 2.9%, which is the peak level for the last several cycles.
Source: Bloomberg and MIM
7
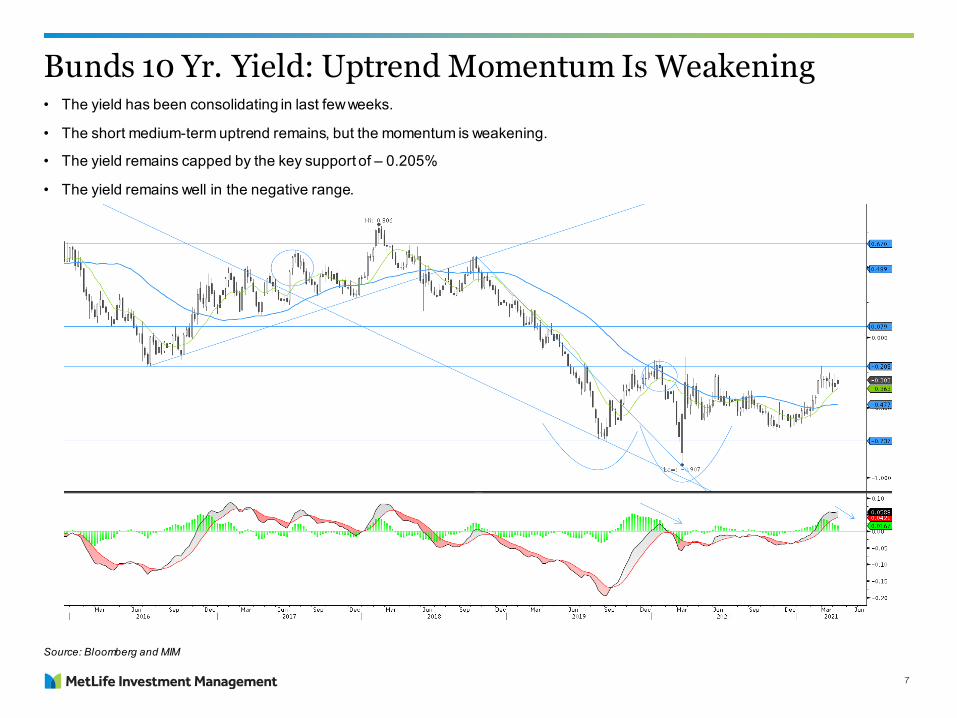
Bunds 10 Yr. Yield: Uptrend Momentum Is Weakening • The yield has been consolidating in last few weeks.
• The short medium-term uptrend remains, but the momentum is weakening.
• The yield remains capped by the key support of – 0.205%
• The yield remains well in the negative range.
Source: Bloomberg and MIM
8
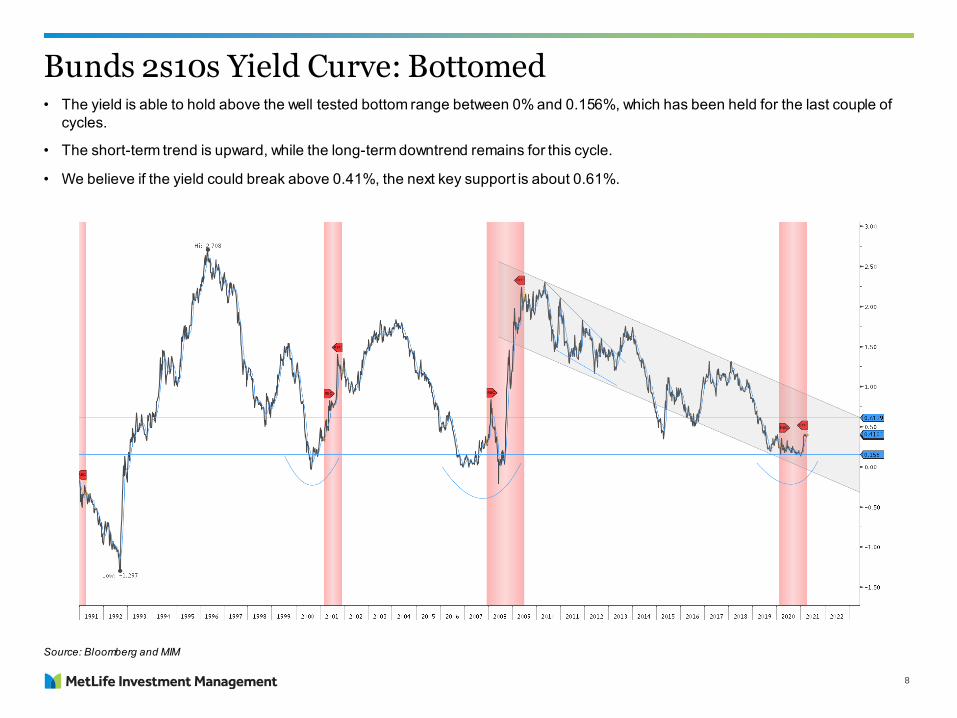
Bunds 2s10s Yield Curve: Bottomed• The yield is able to hold above the well tested bottom range between 0% and 0.156%, which has been held for the last couple of
cycles.
• The short-term trend is upward, while the long-term downtrend remains for this cycle.
• We believe if the yield could break above 0.41%, the next key support is about 0.61%.
Source: Bloomberg and MIM
9
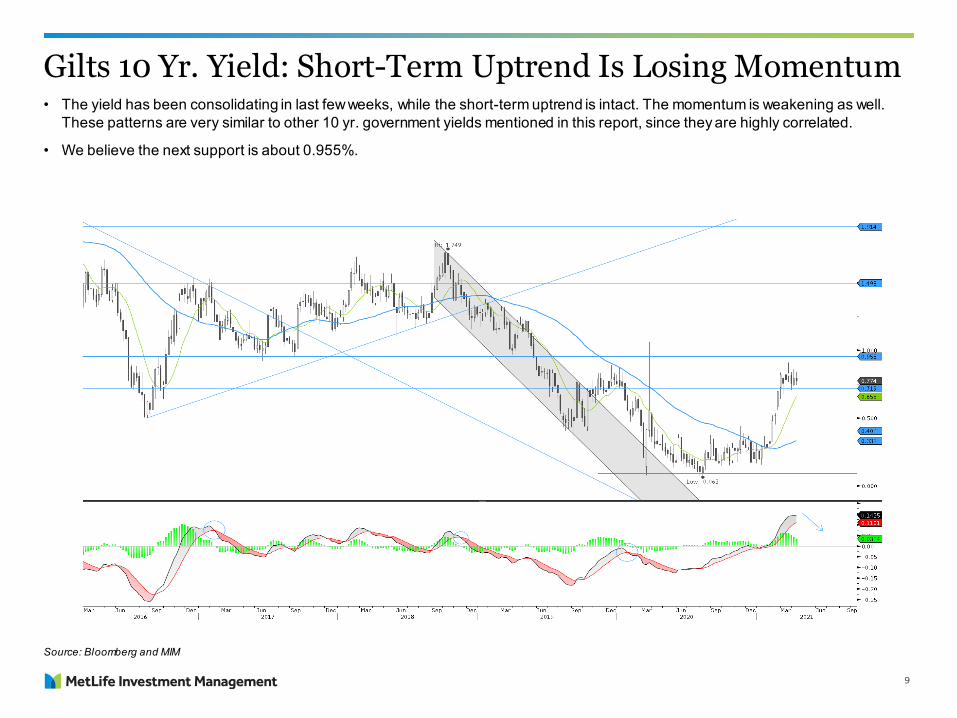
Gilts 10 Yr. Yield: Short-Term Uptrend Is Losing Momentum• The yield has been consolidating in last few weeks, while the short-term uptrend is intact. The momentum is weakening as well.
These patterns are very similar to other 10 yr. government yields mentioned in this report, since they are highly correlated.
• We believe the next support is about 0.955%.
Source: Bloomberg and MIM
10
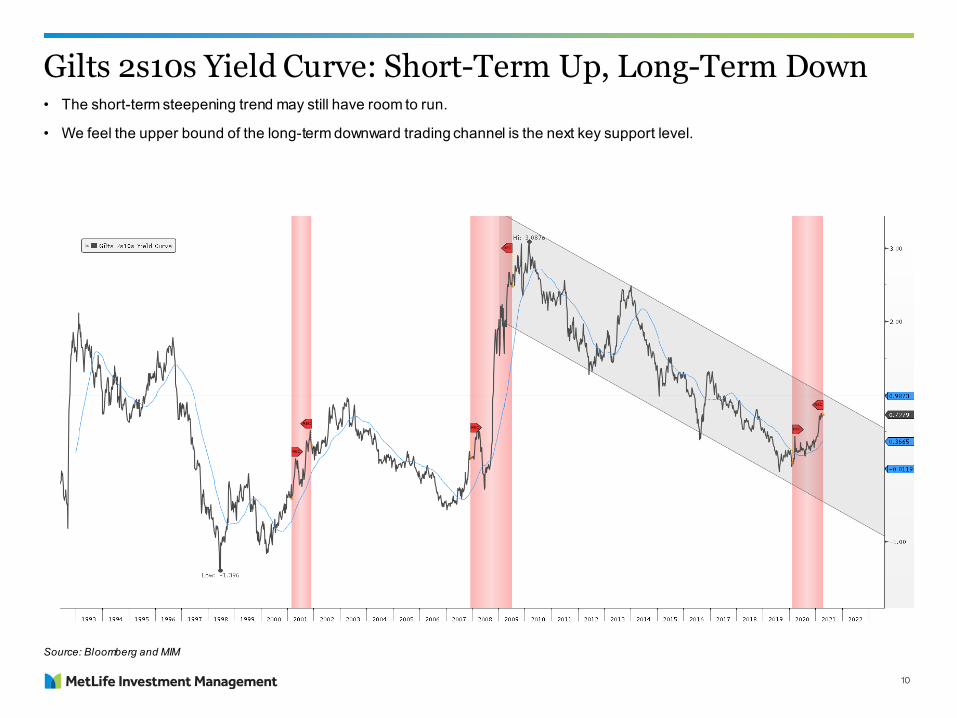
Gilts 2s10s Yield Curve: Short-Term Up, Long-Term Down• The short-term steepening trend may still have room to run.
• We feel the upper bound of the long-term downward trading channel is the next key support level.
Source: Bloomberg and MIM
11
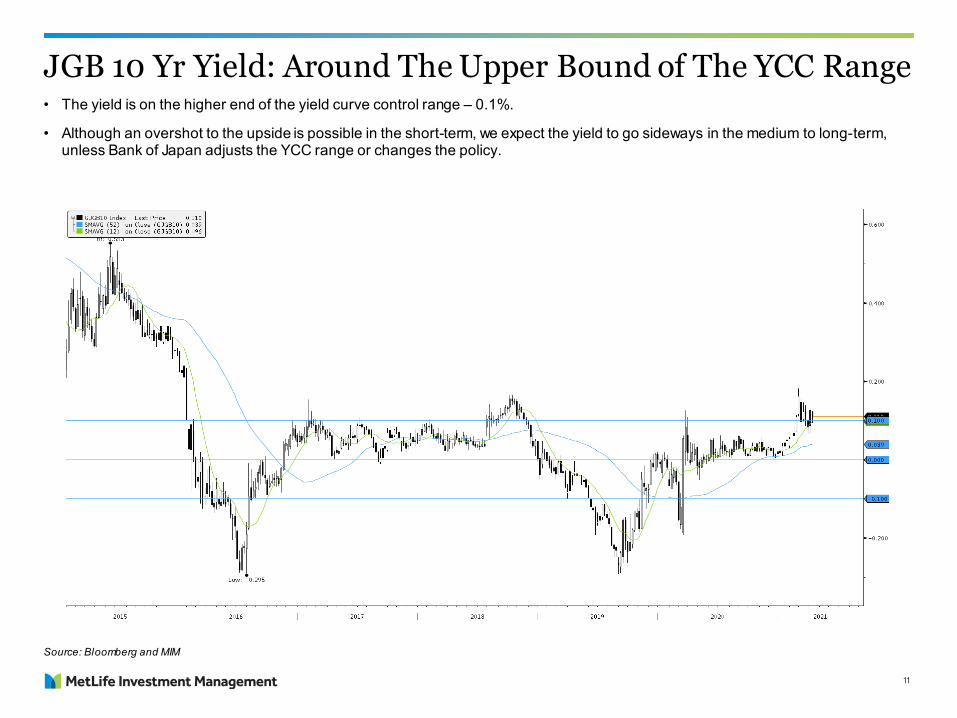
JGB 10 Yr Yield: Around The Upper Bound of The YCC Range• The yield is on the higher end of the yield curve control range – 0.1%.
• Although an overshot to the upside is possible in the short-term, we expect the yield to go sideways in the medium to long-term,unless Bank of Japan adjusts the YCC range or changes the policy.
Source: Bloomberg and MIM
12
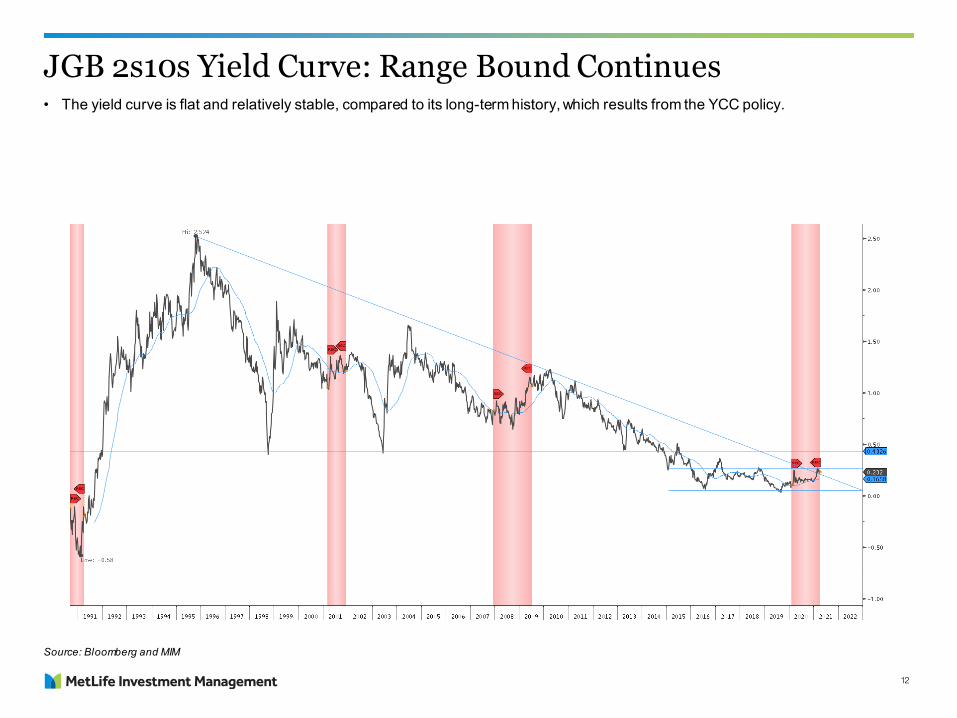
JGB 2s10s Yield Curve: Range Bound Continues• The yield curve is flat and relatively stable, compared to its long-term history, which results from the YCC policy.
Source: Bloomberg and MIM
13
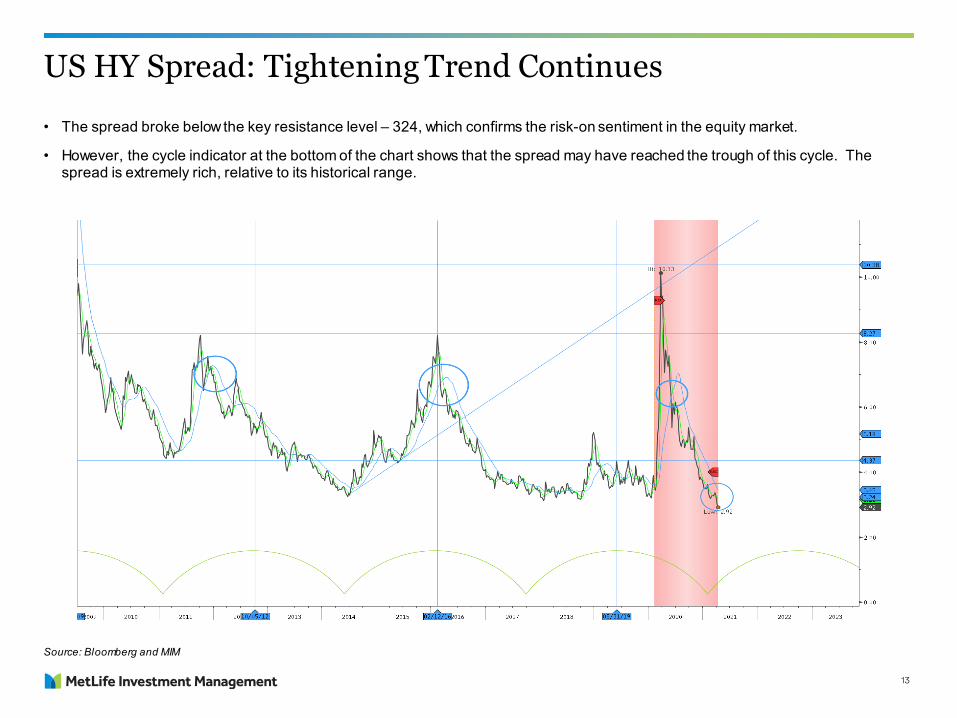
US HY Spread: Tightening Trend Continues
• The spread broke below the key resistance level – 324, which confirms the risk-on sentiment in the equity market.
• However, the cycle indicator at the bottom of the chart shows that the spread may have reached the trough of this cycle. Thespread is extremely rich, relative to its historical range.
Source: Bloomberg and MIM
14
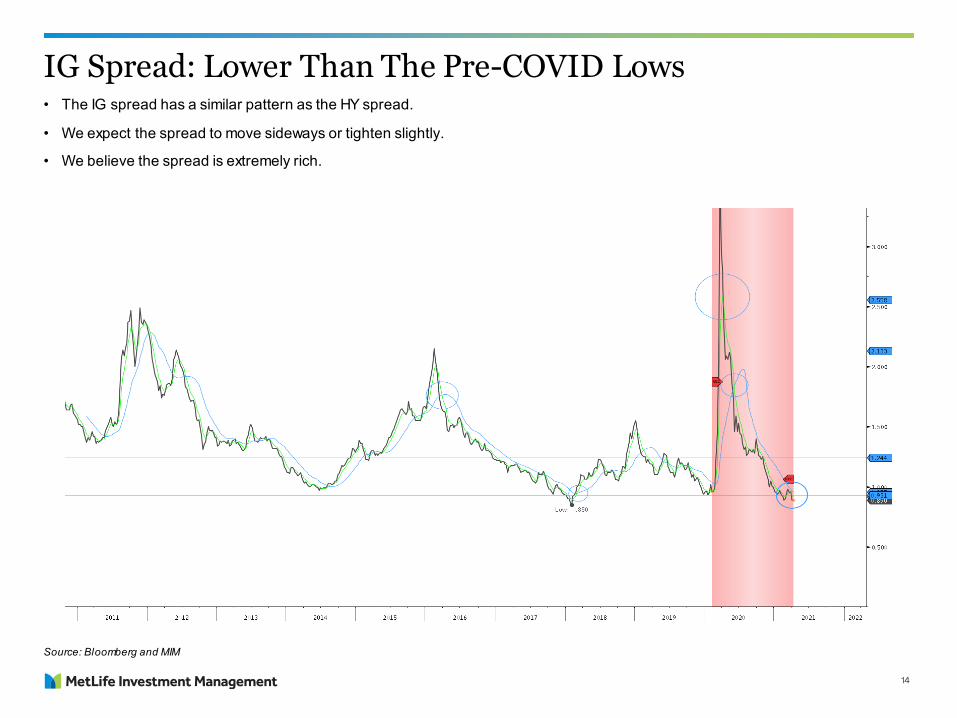
IG Spread: Lower Than The Pre-COVID Lows• The IG spread has a similar pattern as the HY spread.
• We expect the spread to move sideways or tighten slightly.
• We believe the spread is extremely rich.
Source: Bloomberg and MIM
15
S&P 500: Uptrend Continues
Source: Bloomberg and MIM
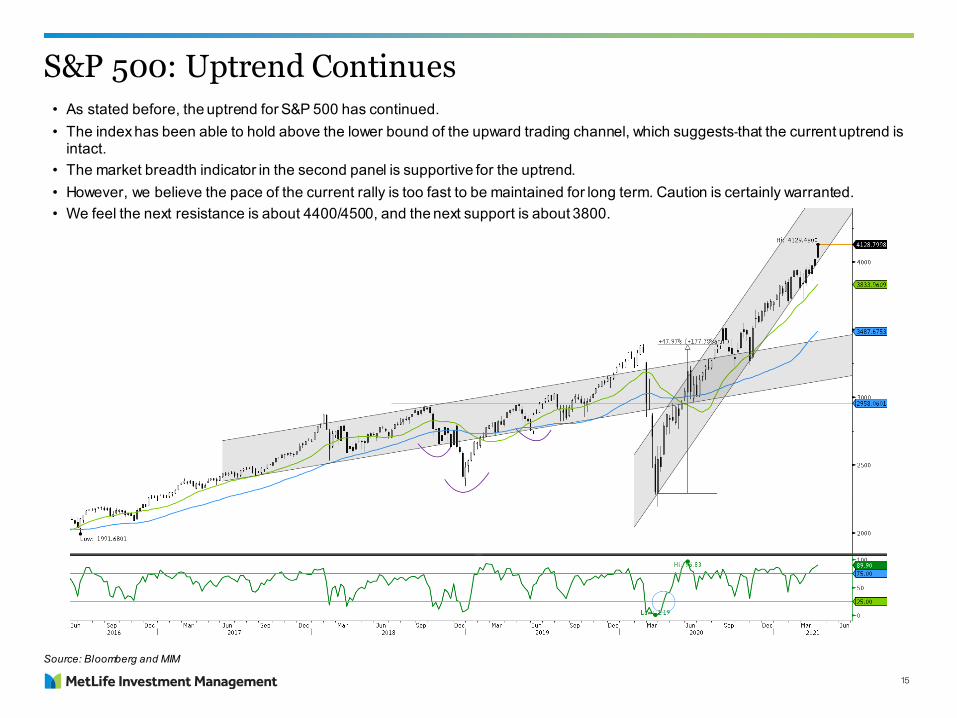
• As stated before, the uptrend for S&P 500 has continued. • The index has been able to hold above the lower bound of the upward trading channel, which suggests that the current uptrend is
intact.• The market breadth indicator in the second panel is supportive for the uptrend.• However, we believe the pace of the current rally is too fast to be maintained for long term. Caution is certainly warranted.• We feel the next resistance is about 4400/4500, and the next support is about 3800.
16
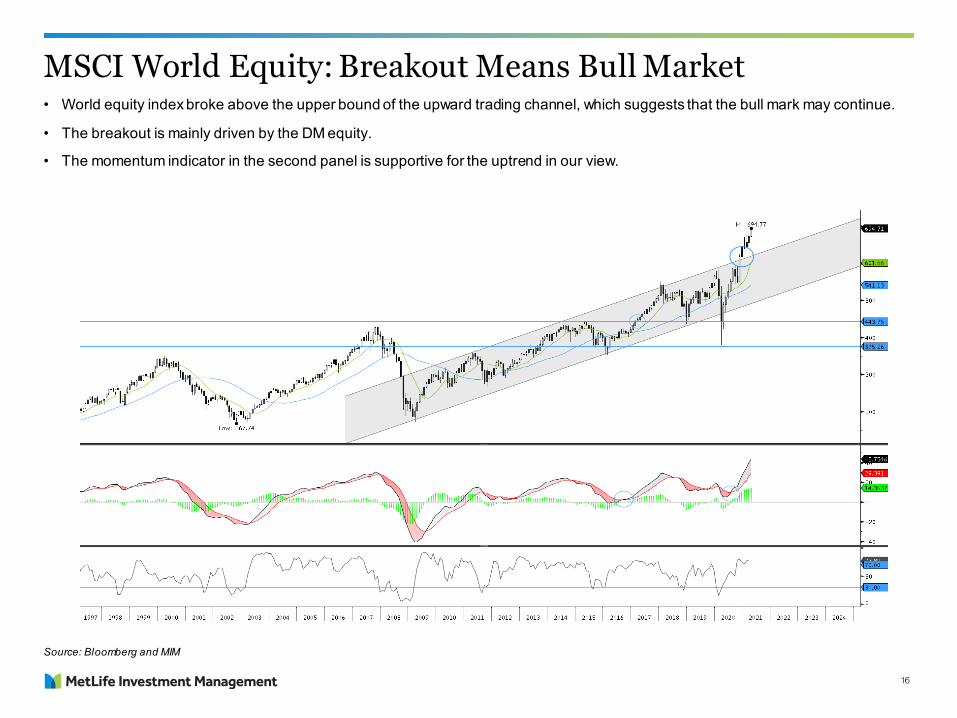
MSCI World Equity: Breakout Means Bull Market• World equity index broke above the upper bound of the upward trading channel, which suggests that the bull mark may continue.
• The breakout is mainly driven by the DM equity.
• The momentum indicator in the second panel is supportive for the uptrend in our view.
Source: Bloomberg and MIM
17
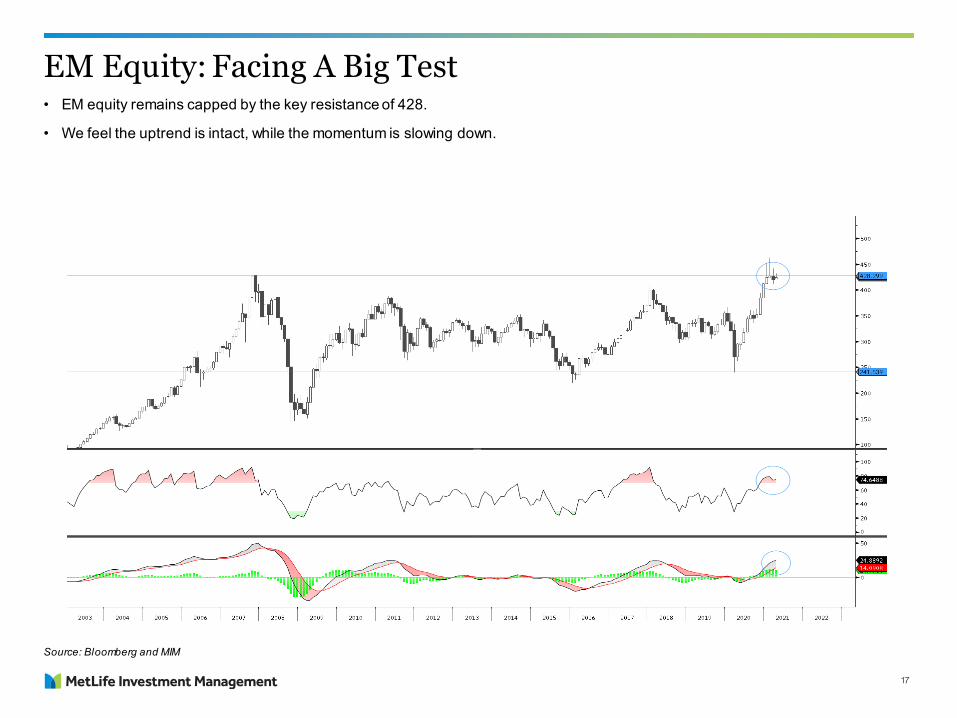
EM Equity: Facing A Big Test• EM equity remains capped by the key resistance of 428.
• We feel the uptrend is intact, while the momentum is slowing down.
Source: Bloomberg and MIM
18
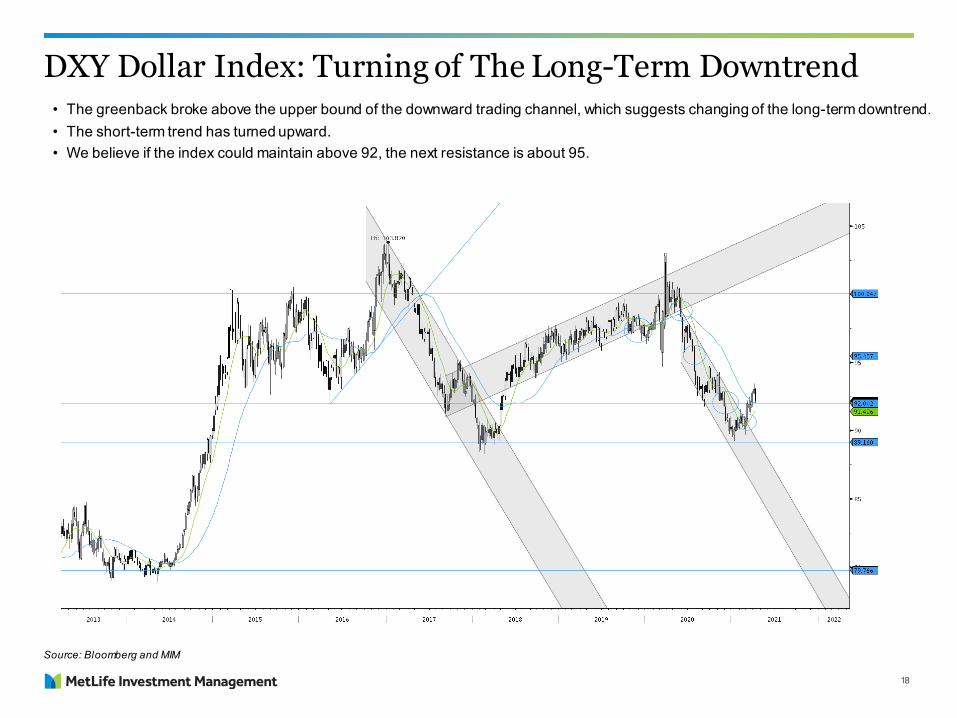
DXY Dollar Index: Turning of The Long-Term Downtrend
Source: Bloomberg and MIM
• The greenback broke above the upper bound of the downward trading channel, which suggests changing of the long-term downtrend.• The short-term trend has turned upward.• We believe if the index could maintain above 92, the next resistance is about 95.
19
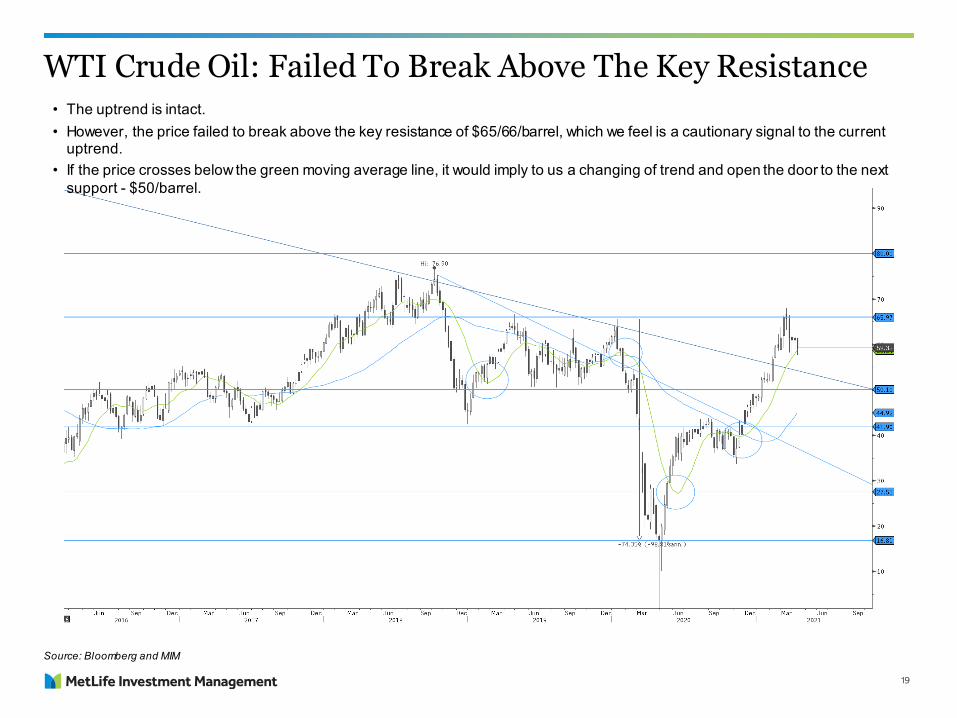
WTI Crude Oil: Failed To Break Above The Key Resistance
Source: Bloomberg and MIM
• The uptrend is intact. • However, the price failed to break above the key resistance of $65/66/barrel, which we feel is a cautionary signal to the current
uptrend.• If the price crosses below the green moving average line, it would imply to us a changing of trend and open the door to the next
support - $50/barrel.
20
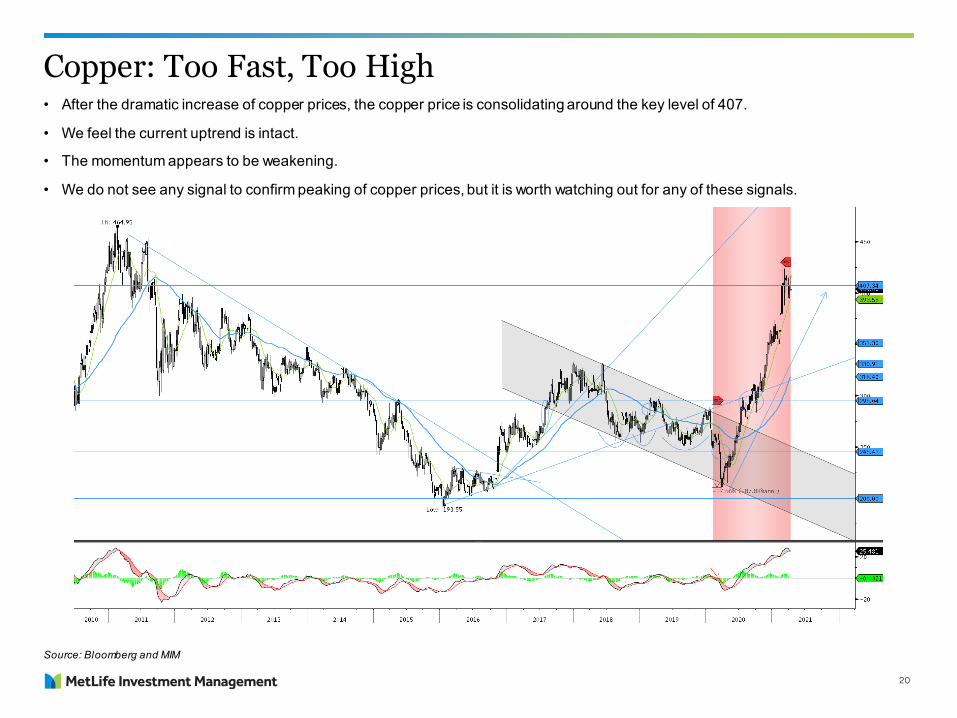
Copper: Too Fast, Too High• After the dramatic increase of copper prices, the copper price is consolidating around the key level of 407.
• We feel the current uptrend is intact.
• The momentum appears to be weakening.
• We do not see any signal to confirm peaking of copper prices, but it is worth watching out for any of these signals.
Source: Bloomberg and MIM
21
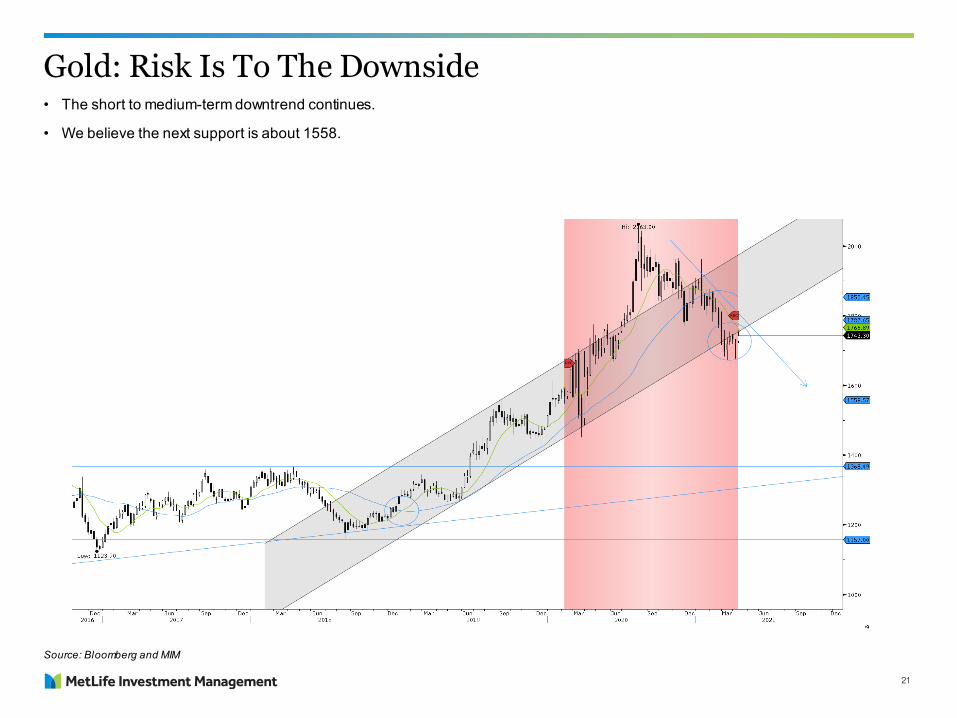
Gold: Risk Is To The Downside• The short to medium-term downtrend continues.
• We believe the next support is about 1558.
Source: Bloomberg and MIM
22
About MetLife Investment Management
Author
JUN JIANG CMT, CFAGlobal Economic & Market Strategy
Jun Jiang is a Market Strategist in Global Economic & Market Strategy team, where he helps to develop and communicate the firm’s global macro-economic outlook and market views as well as assisting in the overall asset allocation and portfolio management process. Previously, Mr. Jiang was in the Global Portfolio Strategy unit, where he worked on portfolio strategy and portfolio analytics. Mr. Jiang joined MetLife in 2011. Prior to joining MetLife, Mr. Jiang was a Credit & Portfolio Risk Management Analyst at Citigroup.
Mr. Jiang earned a Ph.D. degree in Polymer Physics from SUNY-Stony Brook in 2007 and an MBA degree from Cornell University in 2009. Mr. Jiang is a Chartered Market Technician (CMT) and Chartered Financial Analyst (CFA) charterholder.
1 MetLife Investment Management (“MIM”) is MetLife, Inc.’s institutional management business and the marketing name for subsidiaries of MetLife that provide investment management services to MetLife’s general account, separate accounts and/or unaffil iated/third party investors, including: Metropolitan Life Insurance Company, MetLife Investment Management, LLC, MetLife Investment Management Limited, MetLife Investments Limited, MetLife Investments Asia Limited, MetLife Latin America Asesorias e Inversiones Limitada, MetLife Asset Management Corp. (Japan), and MIM I LLC.
2 At estimated fair value. Includes MetLife general account and separate account assets and unaffi l iated/third party assets.
MetLife Investment Management (MIM),1 which had over $659.6 billion in total assets under management as of December 31, 2020,2
serves institutional investors by combining a client- centric approach with deep and long- established asset class expertise. Focused on managing Public Fixed Income, Private Capital and Real Estate assets, we aim to deliver strong, risk-adjusted returns by building tailored portfolio solutions. We listen first, strategize second, and collaborate constantly as we strive to meet clients’ long-term investment objectives. Leveraging the broader resources and 150-year history of the MetLife enterprise helps provide us with deep expertise in navigating ever changing markets. We are institutional, but far from typical.
For more information, visit: investments.metlife
23
Disclosures
1 MetLife Investment Management (“MIM”) is MetLife, Inc.’s institutional management business and the marketing name for subsidiaries of MetLife that provide investment management services to MetLife’s general account, separate accounts and/or unaffil iated/third party investors, including: Metropolitan Life Insurance Company, MetLife Investment Management, LLC, MetLife Investment Management Limited, MetLife Investments Limited, MetLife Investments Asia Limited, MetLife Latin America Asesorias e Inversiones Limitada, MetLife Asset Management Corp. (Japan), and MIM I LLC.
For Institutional Investor, Qualified Investor and Professional Investor use only. Not for use with Retail public.
This document has been prepared by MetLife Investment Management (“MIM”)1 solely for informational purposes and does not constitute a recommendation regarding any investments or the provision of any investment advice, or constitute or form part of any advertisement of, offer for sale or subscription of, solicitation or invitation of any offer or recommendation to purchase or subscribe for any securities or investment advisory services. The views expressed herein are solely those of MIM and do not necessarily reflect, nor are they necessarily consistent with, the views held by, or the forecasts uti l ized by, the entities within the MetLife enterprise that provide insurance products, annuities and employee benefit programs. The information and opinions presented or contained in this document are provided as the date it was written. It should be understood that subsequentdevelopments may materially affect the information contained in this document, which none of MIM, its affi l iates, advisors or representatives are under an obligation to update, revise or affirm. It is not MIM’s intention to provide, and you may not rely on this document as providing, a recommendation with respect to any particular investment strategy or investment. The information provided herein is neither tax nor legal advice. Investors should speak to their tax professional for specific information regarding their tax situation. Investment involves risk including possible loss of principal. Affiliates of MIM may perform services for, solicit business from, hold long or short positions in, or otherwise be interested in the investments (including derivatives) of any company mentioned herein. This document may contain forward-looking statements, as well as predictions, projections and forecasts of the economy or economic trends of the markets, which are not necessarily indicative of the future. Any or all forward-looking statements, as well as those included in any other material discussed at the presentation, may turn out to be wrong.L0421013019[exp0423][All States] L0421013020[exp1021][All States] L0421013008[exp1121][All States] L0421012998[exp0423][All States]
© 2021 MetLif e Services and Solutions, LLC, New York, NY 10166 - All Rights Reserved.