mlc popular chart pack
TRANSCRIPT

MLC POPULAR CHART PACK
Updated as at 30 June 2019
This presentation is not for
circulation to retail investors
2
Important information
The information in this presentation has been provided by MLC Investments Limited (ABN 30 002 641 661, AFSL 230705), a member of the
National Australia Bank Limited (ABN 12 004 044 937, AFSL 230686) (NAB) group of companies (NAB Group), 105–153 Miller Street, North
Sydney 2060. NAB does not guarantee or otherwise accept any liability in respect of any financial product referred to in this presentation.
This presentation has been prepared for licensed financial advisers only. This document must not be distributed to “retail clients”
(as defined in the Corporations Act 2001 (Cth)) or any other persons.
This information is directed to and prepared for Australian residents only.
This information may constitute general advice. It has been prepared without taking account of an investor’s objectives, financial situation or
needs and because of that an investor should, before acting on the advice, consider the appropriateness of the advice having regard to their
personal objectives, financial situation and needs.
You should obtain a Product Disclosure Statement (PDS) relating to the financial products mentioned in this communication issued by MLC
Investments Limited, and consider it before making any decision about whether to acquire or continue to hold these products. A copy of the PDS
is available upon request by phoning the MLC call centre on 132 652 or on our website at mlc.com.au
Past performance is not a reliable indicator of future performance. The value of an investment may rise or fall with the changes in the market.
The performance returns in this communication are reported before deducting management fees and taxes unless otherwise stated.
Actual returns may vary from any target return described in this presentation and there is a risk that the investment may achieve lower than
expected returns.
Any opinions expressed in this presentation constitute our judgement at the time of issue and are subject to change. We believe that the
information contained in this presentation is correct and that any estimates, opinions, conclusions or recommendations are reasonably held or
made at the time of compilation. However, no warranty is made as to their accuracy or reliability (which may change without notice) or other
information contained in this presentation.
MLC Investments Limited relies on third parties to provide certain information and is not responsible for its accuracy. MLC Investments Limited
is not liable for any loss arising from persons relying on information provided by third parties.
MLC Investments Limited may use the services of NAB Group companies where it makes good business sense to do so and will benefit
customers. Amounts paid for these services are always negotiated on an arm’s length basis.
Bloomberg Finance L.P. and its affiliates (collectively, “Bloomberg”) do not approve or endorse any information included in this material and
disclaim all liability for any loss or damage of any kind arising out of the use of all or any part of this material.
The funds referred to herein are not sponsored, endorsed, or promoted by MSCI, and MSCI bears no liability with respect to any such fund.
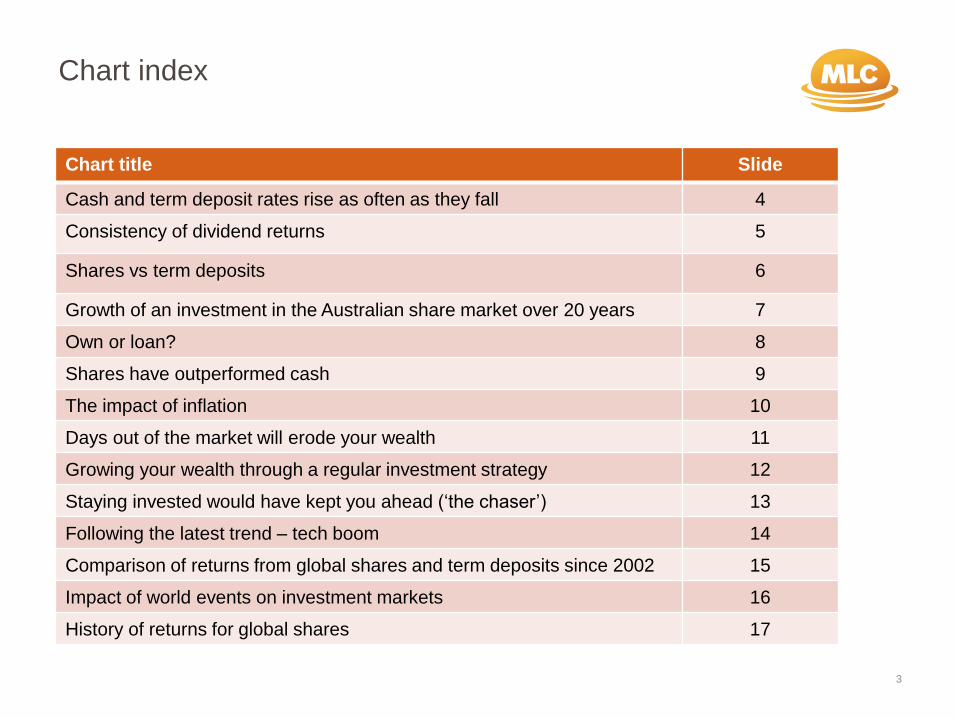
Chart index
3
Chart title Slide
Cash and term deposit rates rise as often as they fall 4
Consistency of dividend returns 5
Shares vs term deposits 6
Growth of an investment in the Australian share market over 20 years 7
Own or loan? 8
Shares have outperformed cash 9
The impact of inflation 10
Days out of the market will erode your wealth 11
Growing your wealth through a regular investment strategy 12
Staying invested would have kept you ahead (‘the chaser’) 13
Following the latest trend – tech boom 14
Comparison of returns from global shares and term deposits since 2002 15
Impact of world events on investment markets 16
History of returns for global shares 17
-
1.00
2.00
3.00
4.00
5.00
6.00
7.00
8.00
9.00
De
c-9
7
Jun-9
8
De
c-9
8
Jun-9
9
De
c-9
9
Jun-0
0
De
c-0
0
Jun-0
1
De
c-0
1
Jun-0
2
De
c-0
2
Jun-0
3
De
c-0
3
Jun-0
4
De
c-0
4
Jun-0
5
De
c-0
5
Jun-0
6
De
c-0
6
Jun-0
7
De
c-0
7
Jun-0
8
De
c-0
8
Jun-0
9
De
c-0
9
Jun-1
0
De
c-1
0
Jun-1
1
De
c-1
1
Jun-1
2
De
c-1
2
Jun-1
3
De
c-1
3
Jun-1
4
De
c-1
4
Jun-1
5
De
c-1
5
Jun-1
6
De
c-1
6
Jun-1
7
De
c-1
7
Jun-1
8
TermDeposits
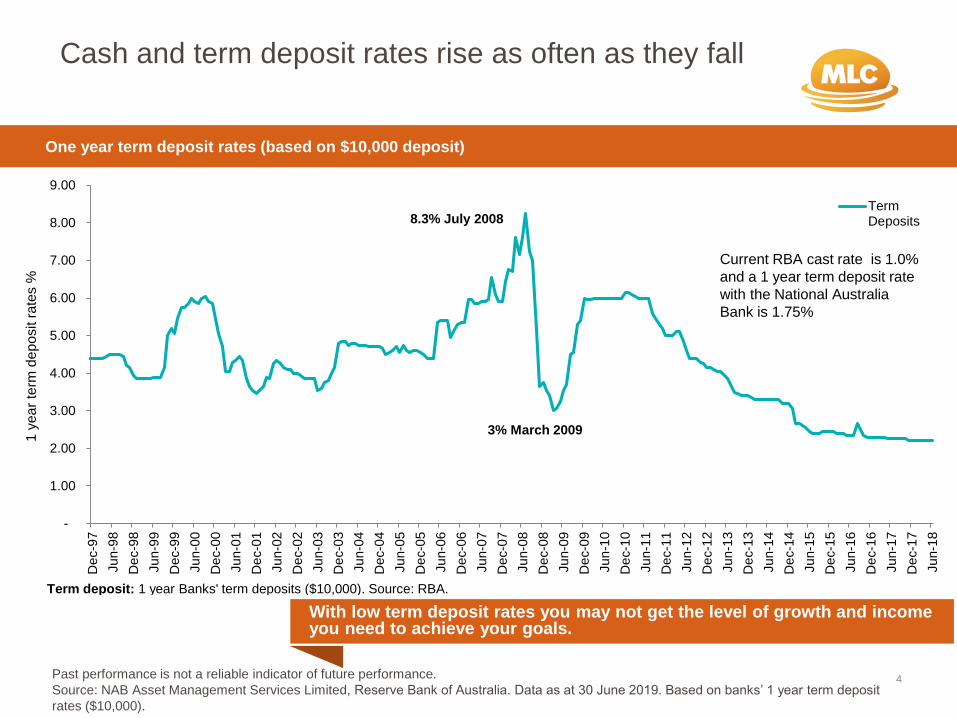
Term deposit: 1 year Banks' term deposits ($10,000). Source: RBA.
One year term deposit rates (based on $10,000 deposit)
Cash and term deposit rates rise as often as they fall
4
With low term deposit rates you may not get the level of growth and income you need to achieve your goals.
Current RBA cast rate is 1.0%
and a 1 year term deposit rate
with the National Australia
Bank is 1.75%
8.3% July 2008
3% March 2009
1 y
ea
r te
rm d
ep
osit r
ate
s %
Past performance is not a reliable indicator of future performance.
Source: NAB Asset Management Services Limited, Reserve Bank of Australia. Data as at 30 June 2019. Based on banks’ 1 year term deposit
rates ($10,000).
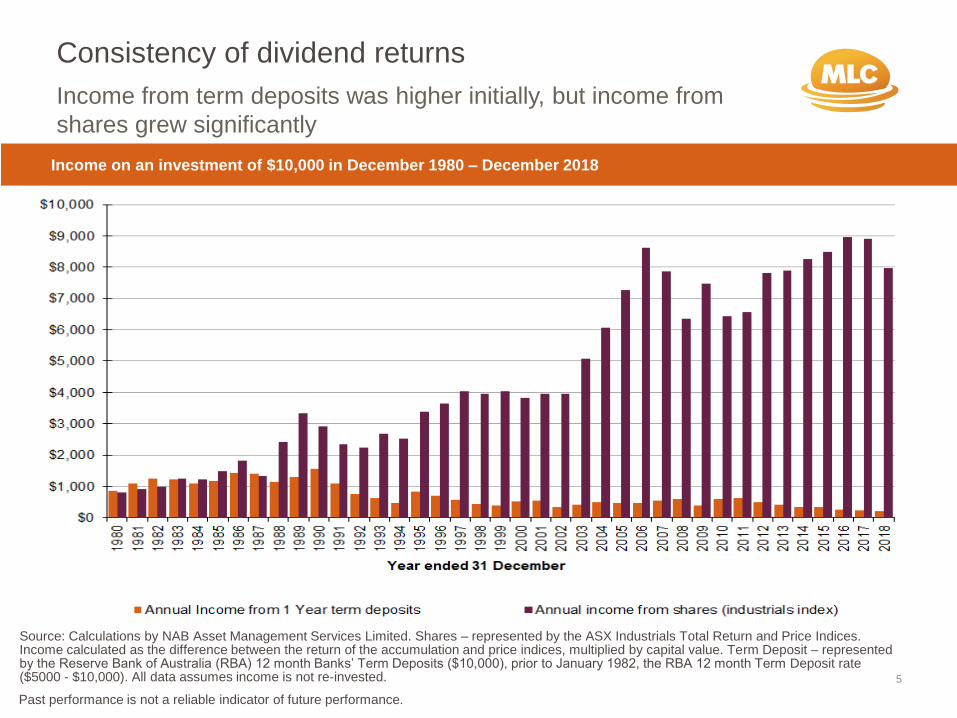
Consistency of dividend returns
5
Source: Calculations by NAB Asset Management Services Limited. Shares – represented by the ASX Industrials Total Return and Price Indices. Income calculated as the difference between the return of the accumulation and price indices, multiplied by capital value. Term Deposit – represented by the Reserve Bank of Australia (RBA) 12 month Banks’ Term Deposits ($10,000), prior to January 1982, the RBA 12 month Term Deposit rate ($5000 - $10,000). All data assumes income is not re-invested.
Income on an investment of $10,000 in December 1980 – December 2018
Income from term deposits was higher initially, but income from
shares grew significantly
Past performance is not a reliable indicator of future performance.
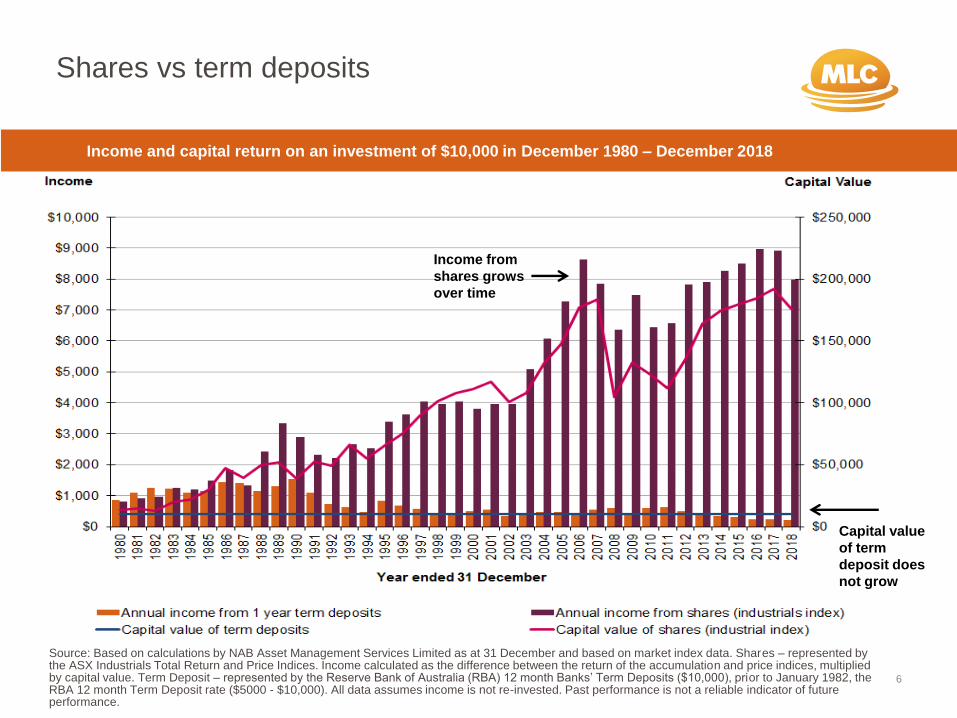
Shares vs term deposits
6
Source: Based on calculations by NAB Asset Management Services Limited as at 31 December and based on market index data. Shares – represented by the ASX Industrials Total Return and Price Indices. Income calculated as the difference between the return of the accumulation and price indices, multiplied by capital value. Term Deposit – represented by the Reserve Bank of Australia (RBA) 12 month Banks’ Term Deposits ($10,000), prior to January 1982, the RBA 12 month Term Deposit rate ($5000 - $10,000). All data assumes income is not re-invested. Past performance is not a reliable indicator of future performance.
Capital value
of term
deposit does
not grow
Income from
shares grows
over time
Income and capital return on an investment of $10,000 in December 1980 – December 2018
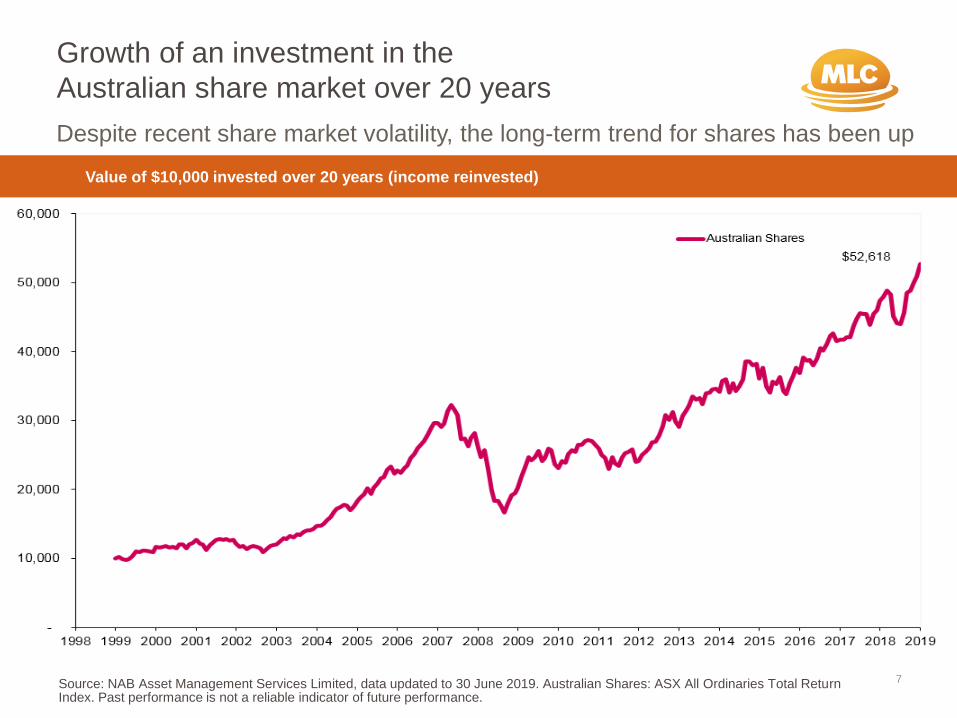
Despite recent share market volatility, the long-term trend for shares has been up
Growth of an investment in the
Australian share market over 20 years
7
Value of $10,000 invested over 20 years (income reinvested)
Source: NAB Asset Management Services Limited, data updated to 30 June 2019. Australian Shares: ASX All Ordinaries Total Return Index. Past performance is not a reliable indicator of future performance.
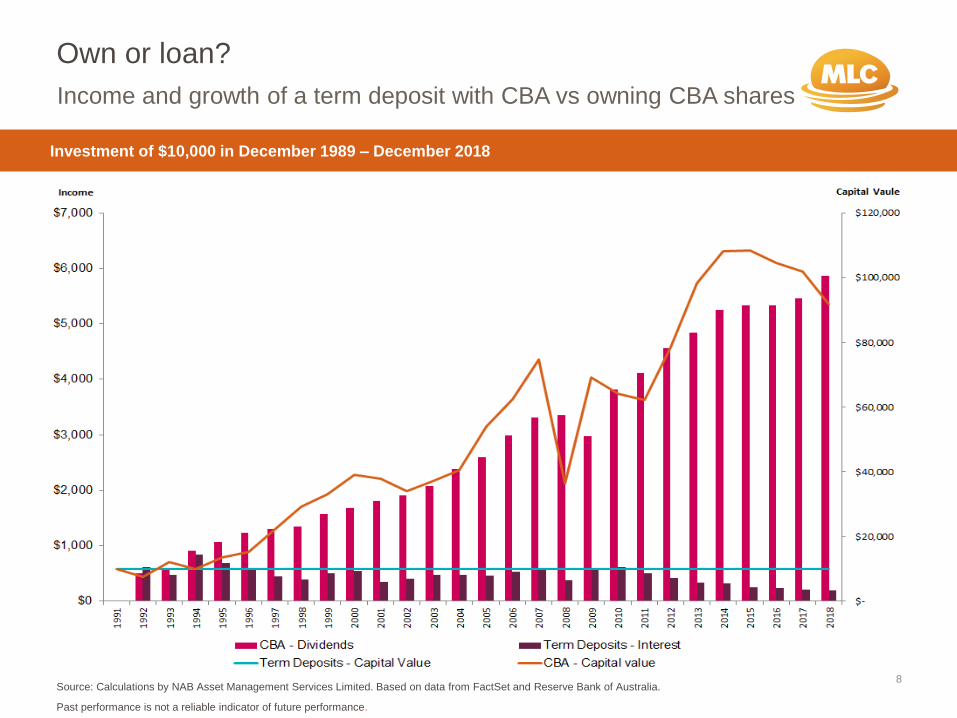
Own or loan?
Source: Calculations by NAB Asset Management Services Limited. Based on data from FactSet and Reserve Bank of Australia.
Past performance is not a reliable indicator of future performance.
8
Investment of $10,000 in December 1989 – December 2018
Income and growth of a term deposit with CBA vs owning CBA shares
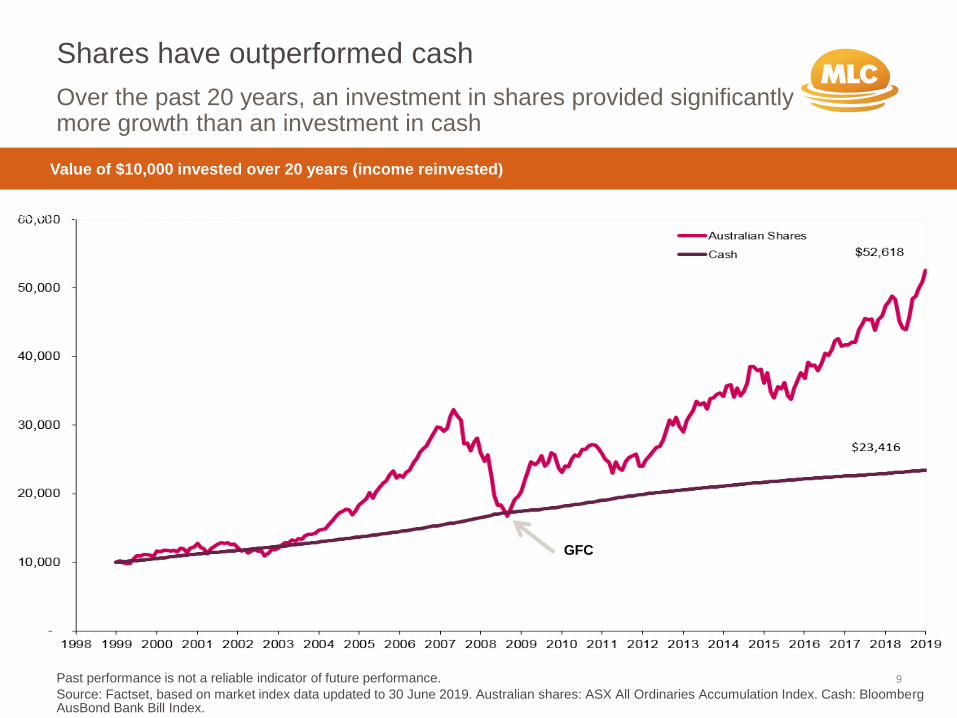
Shares have outperformed cash
9Past performance is not a reliable indicator of future performance.
Source: Factset, based on market index data updated to 30 June 2019. Australian shares: ASX All Ordinaries Accumulation Index. Cash: Bloomberg AusBond Bank Bill Index.
Based on an investment of $10,000
Value of $10,000 invested over 20 years (income reinvested)
Over the past 20 years, an investment in shares provided significantly more growth than an investment in cash
GFC
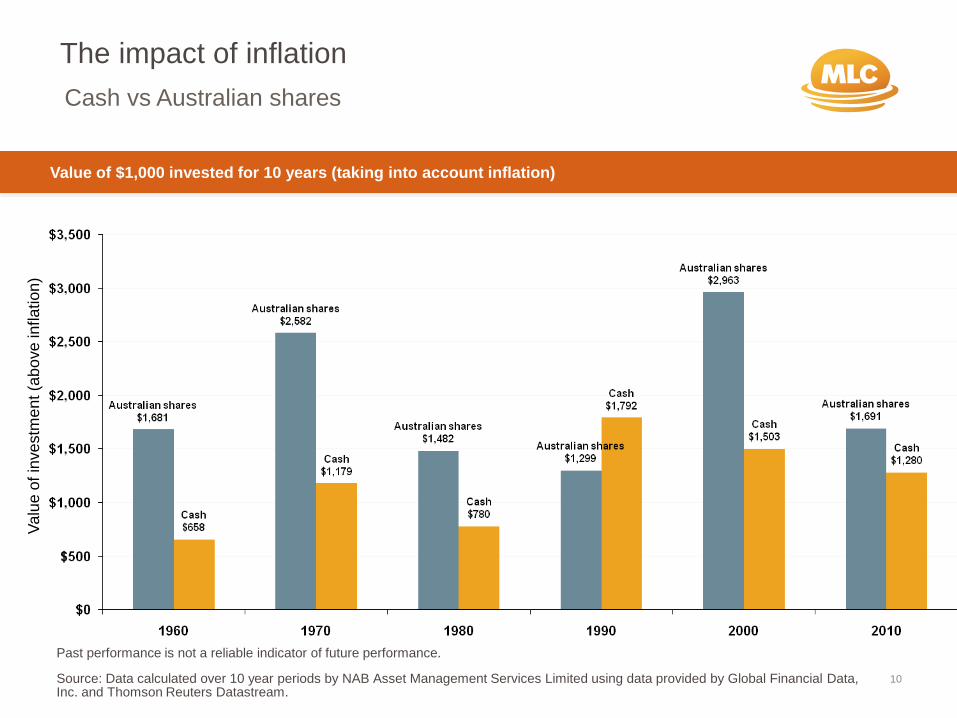
The impact of inflation
Past performance is not a reliable indicator of future performance.
Source: Data calculated over 10 year periods by NAB Asset Management Services Limited using data provided by Global Financial Data, Inc. and Thomson Reuters Datastream.
10
Va
lue
of in
ve
stm
en
t (a
bo
ve
inflation)
Cash vs Australian shares
Value of $1,000 invested for 10 years (taking into account inflation)
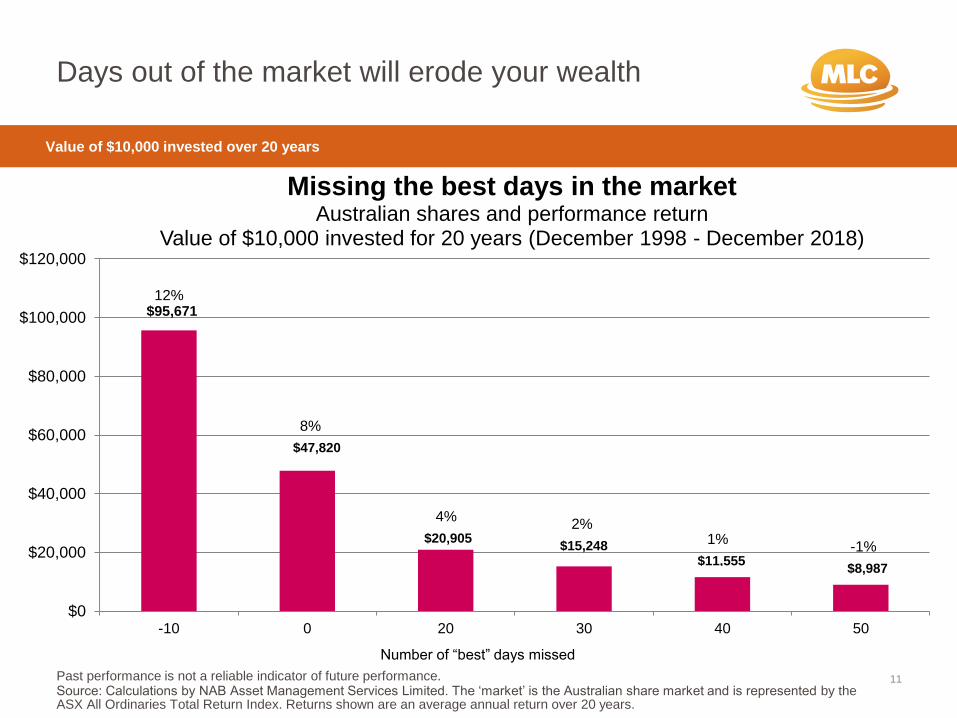
Days out of the market will erode your wealth
Past performance is not a reliable indicator of future performance. Source: Calculations by NAB Asset Management Services Limited. The ‘market’ is the Australian share market and is represented by the ASX All Ordinaries Total Return Index. Returns shown are an average annual return over 20 years.
11
Value of $10,000 invested over 20 years
Number of “best” days missed
$0
$20,000
$40,000
$60,000
$80,000
$100,000
$120,000
-10 0 20 30 40 50
Missing the best days in the market Australian shares and performance return
Value of $10,000 invested for 20 years (December 1998 - December 2018)
$47,820
$20,905 $15,248
$11,555 $8,987
8%
4%2%
1%-1%
12%$95,671
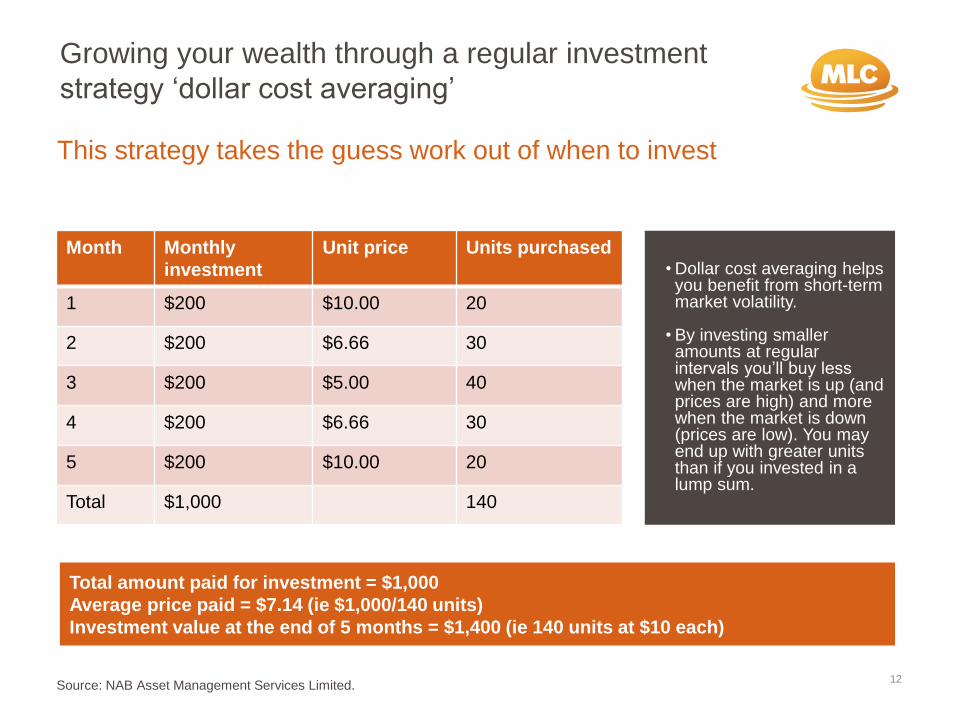
This strategy takes the guess work out of when to invest
Growing your wealth through a regular investment
strategy ‘dollar cost averaging’
12
Month Monthly
investment
Unit price Units purchased
1 $200 $10.00 20
2 $200 $6.66 30
3 $200 $5.00 40
4 $200 $6.66 30
5 $200 $10.00 20
Total $1,000 140
• Dollar cost averaging helps you benefit from short-term market volatility.
• By investing smaller amounts at regular intervals you’ll buy less when the market is up (and prices are high) and more when the market is down (prices are low). You may end up with greater units than if you invested in a lump sum.
Total amount paid for investment = $1,000
Average price paid = $7.14 (ie $1,000/140 units)
Investment value at the end of 5 months = $1,400 (ie 140 units at $10 each)
Source: NAB Asset Management Services Limited.
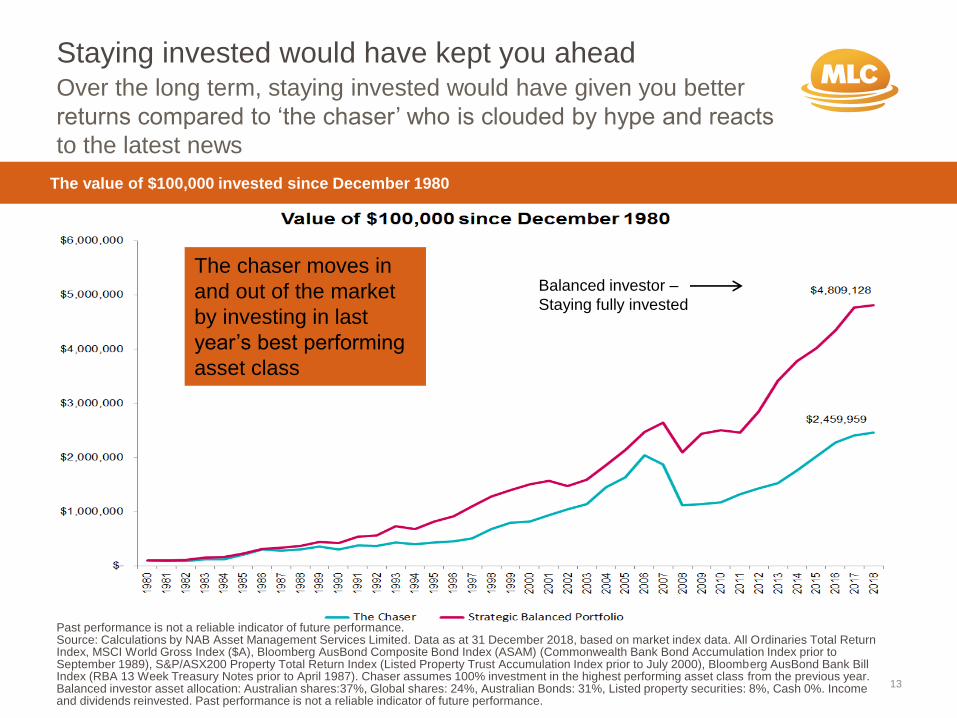
Over the long term, staying invested would have given you better
returns compared to ‘the chaser’ who is clouded by hype and reacts
to the latest news
Staying invested would have kept you ahead
Past performance is not a reliable indicator of future performance. Source: Calculations by NAB Asset Management Services Limited. Data as at 31 December 2018, based on market index data. All Ordinaries Total Return Index, MSCI World Gross Index ($A), Bloomberg AusBond Composite Bond Index (ASAM) (Commonwealth Bank Bond Accumulation Index prior to September 1989), S&P/ASX200 Property Total Return Index (Listed Property Trust Accumulation Index prior to July 2000), Bloomberg AusBond Bank Bill Index (RBA 13 Week Treasury Notes prior to April 1987). Chaser assumes 100% investment in the highest performing asset class from the previous year. Balanced investor asset allocation: Australian shares:37%, Global shares: 24%, Australian Bonds: 31%, Listed property securities: 8%, Cash 0%. Income and dividends reinvested. Past performance is not a reliable indicator of future performance.
13
Balanced investor –
Staying fully invested
The value of $100,000 invested since December 1980
The chaser moves in
and out of the market
by investing in last
year’s best performing
asset class
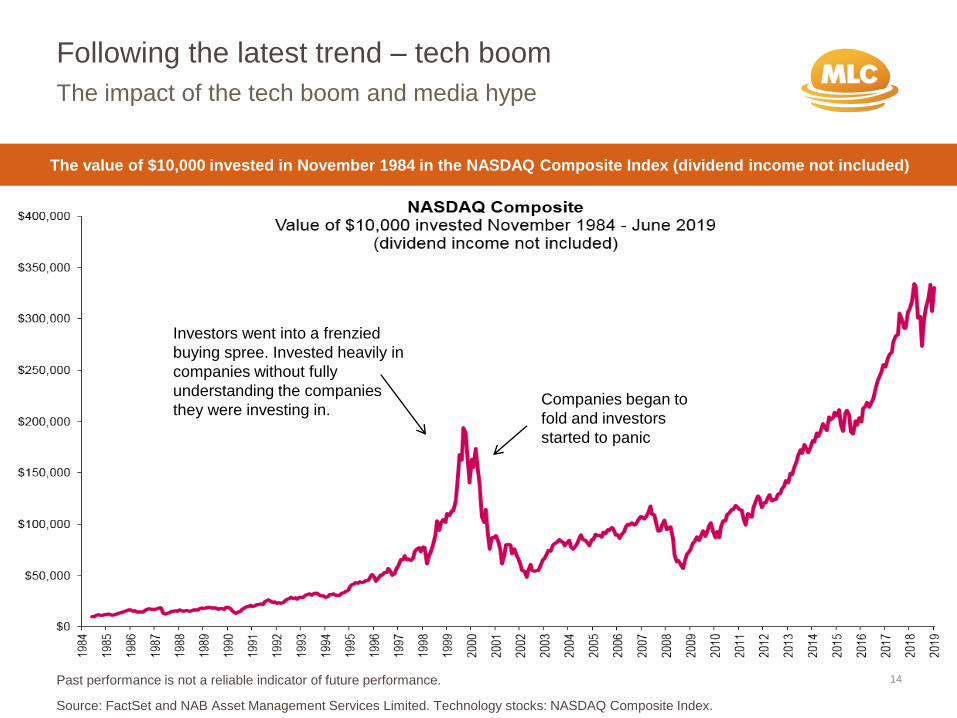
Following the latest trend – tech boom
Past performance is not a reliable indicator of future performance.
Source: FactSet and NAB Asset Management Services Limited. Technology stocks: NASDAQ Composite Index.
14
The value of $10,000 invested in November 1984 in the NASDAQ Composite Index (dividend income not included)
The impact of the tech boom and media hype
Investors went into a frenzied
buying spree. Invested heavily in
companies without fully
understanding the companies
they were investing in.Companies began to
fold and investors
started to panic
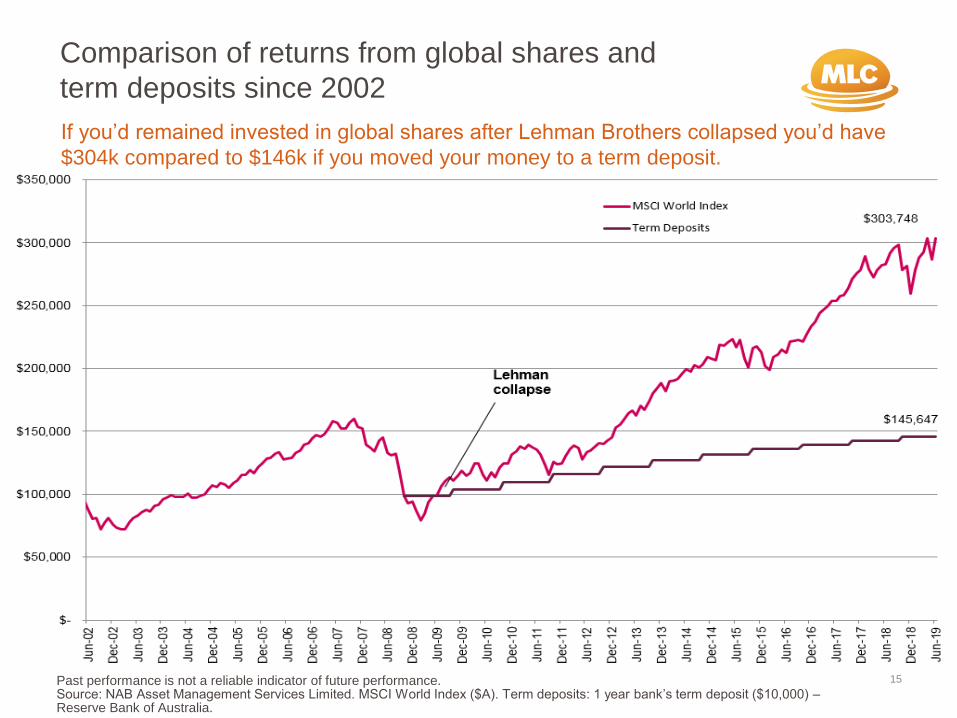
If you’d remained invested in global shares after Lehman Brothers collapsed you’d have
$304k compared to $146k if you moved your money to a term deposit.
Comparison of returns from global shares and
term deposits since 2002
Past performance is not a reliable indicator of future performance. Source: NAB Asset Management Services Limited. MSCI World Index ($A). Term deposits: 1 year bank’s term deposit ($10,000) –Reserve Bank of Australia.
15
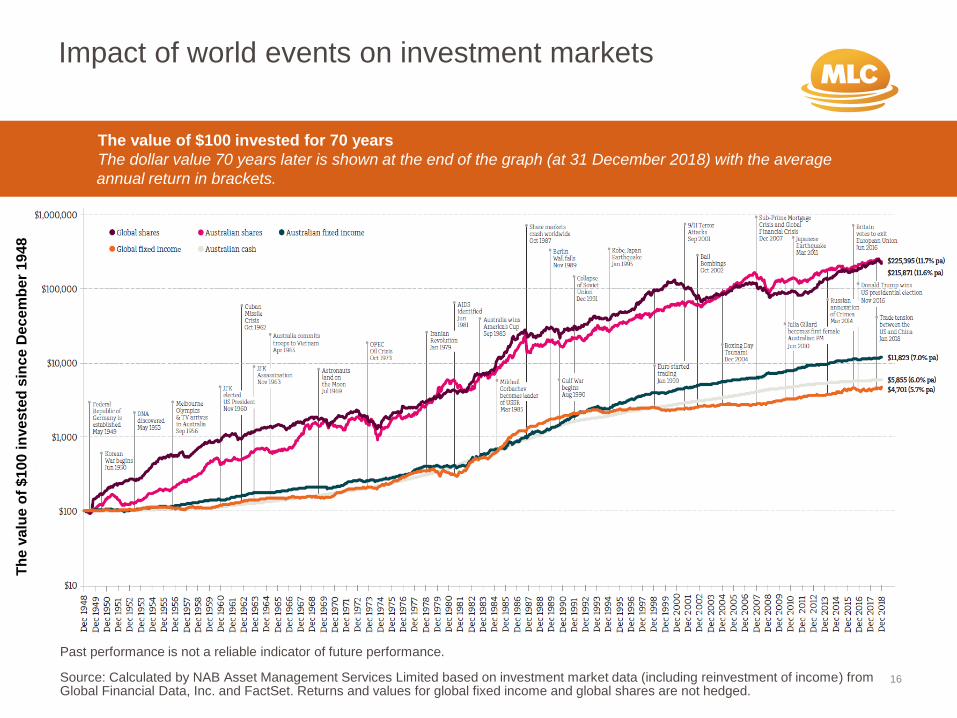
Impact of world events on investment markets
Past performance is not a reliable indicator of future performance.
Source: Calculated by NAB Asset Management Services Limited based on investment market data (including reinvestment of income) from Global Financial Data, Inc. and FactSet. Returns and values for global fixed income and global shares are not hedged.
16
The value of $100 invested for 70 years
The dollar value 70 years later is shown at the end of the graph (at 31 December 2018) with the average
annual return in brackets.
Th
e v
alu
e o
f $
10
0 i
nve
ste
d s
inc
e D
ece
mb
er
194
8
17
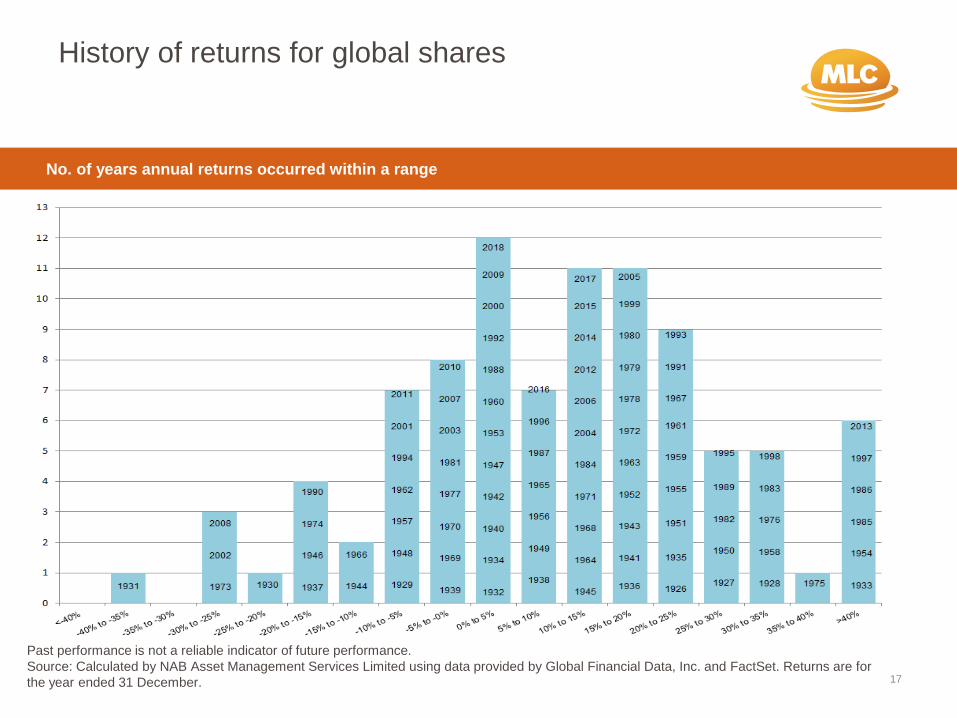
History of returns for global shares
No. of years annual returns occurred within a range
Past performance is not a reliable indicator of future performance.
Source: Calculated by NAB Asset Management Services Limited using data provided by Global Financial Data, Inc. and FactSet. Returns are for
the year ended 31 December.