ramirez v. greenpoint-howell jackson expert report - national
TRANSCRIPT

UNITED STATES DISTRICT COURT
NORTHERN DISTRICT OF CALIFORNIA SAN FRANCISCO DIVISION
) ANA RAMIREZ, ISMAEL RAMIREZ and ) JORGE SALAZAR, on behalf of themselves and ) all others similarly situated, ) Case No. 3:08-cv-00369-TEH ) Plaintiffs, ) CLASS CERTIFICATION REPORT ) OF HOWELL E. JACKSON v. ) ) GREENPOINT MORTGAGE FUNDING, INC. ) ) Defendant. ) )
CONFIDENTIAL—SUBJECT TO PROTECTIVE ORDER
Case3:08-cv-00369-TEH Document181 Filed04/01/10 Page1 of 91
Smith 3270
-2-
TABLE OF CONTENTS
I. Introduction ..........................................................................................................................3
II. Qualifications .......................................................................................................................4
III. Summary of Conclusions .....................................................................................................6
IV. Disparate Impact Can Be Proven through Common Evidence and Methods ......................8 A. Mortgage Industry Overview ...................................................................................8
1. Overview ......................................................................................................8 2. Discretionary Pricing Policies Have Resulted in Minorities Paying
Higher Prices than Whites with Similar Risk Characteristics ...................15 B. Introduction to Disparate Impact Testing ..............................................................20
1. Prima Facie Evidence of Discrimination ...................................................21 2. Testing for Disparate Impact with Controls for Legitimate Explanatory
Factors ........................................................................................................22
V. A Statistical Analysis of Defendant’s Data Shows Disparate Impact ...............................26 A. Overview of Defendant’s Data ..............................................................................27 B. Mean Comparisons Show that Minorities Paid More for Greenpoint Loans than
White Borrowers with Similar Risk Characteristics ..............................................31 C. Regression Models Show Disparate Impact on Minorities ....................................33
VI. Analysis of The Typicality of the Named Plaintiffs’ Claims ............................................41
VII. Computation of Aggregate Monetary Relief to the Class as a Whole Is Manageable and Can Be Completed Using Common Evidence and Methods .............................................44
VIII. Conclusion .........................................................................................................................51
Appendix 1: Materials Relied Upon ..............................................................................................52
Appendix 2: Curriculum Vitae of Howell Jackson ........................................................................56
Appendix 3: Cases in Which Howell Jackson Has Testified at Deposition or Trial in the Last Four Years ..........................................................................................................................61
Appendix 4: Summary Statistics of Variables in Greenpoint’s Loan Database, 2004-2007 .........62
Appendix 5: Results of APR Regressions Estimated over Entire Sample .....................................68
Appendix 6: Results of APR Regressions Estimated over Subsets of Data ..................................74
Appendix 7: Results of APR Regressions Estimated Using Alternative Race Classifications .....82
Case3:08-cv-00369-TEH Document181 Filed04/01/10 Page2 of 91
Smith 3271
-3-
I. I NTRODUCTION
1. I have been asked by counsel for Ana Ramirez, Ismael Ramierz, Jorge Salazar,
and similarly situated individuals (“Plaintiffs”) to analyze whether (1) disparate impact of the
mortgage loan pricing policies of Greenpoint Mortgage Funding (“Greenpoint” or
“Defendant”) on Class members can be proven with common evidence and methods, (2) the
claims made by the named Plaintiffs are typical of the Class, and (3) the calculation of
individual and aggregate monetary relief is manageable and may be reliably performed on an
aggregate or class-wide basis. I have read the Amended Complaint (“Complaint”), filed March
13, 2008, in this matter. This and other materials that I relied upon in forming my opinions are
listed in Appendix 1.1
2. Plaintiffs allege, among other things, that the lending practices of the Defendant
have imposed a disparate impact on protected classes of minorities.2 For example, Plaintiffs
allege that Greenpoint engaged in a “Discretionary Pricing Policy” under which its executive
officers, staff, and brokers could impose subjective, discretionary charges and interest rate mark-
ups in the loans that the company originated in the wholesale market.3 These subjective charges
are added to the objective, risk-based rates that Greenpoint establishes for its borrowers.
Plaintiffs allege that Greenpoint’s policies for wholesale access to its loan products subject
African American and Hispanic (collectively, “minority”) customers to a significantly higher
likelihood of exposure to discretionary points, fees, and interest rate mark-ups.4 These
1. Consultants from Empiris, LLC provided assistance in the preparation of this report. 2. First Amended Complaint, Case No. 3:08-cv-00369-TEH, ¶ 2 [hereinafter Complaint]. 3. Id., ¶79. 4. Id., ¶3.
Case3:08-cv-00369-TEH Document181 Filed04/01/10 Page3 of 91
Smith 3272
-4-
allegations have been brought pursuant to the Equal Credit Opportunity Act (ECOA) and the Fair
Housing Act (FHA).5
3. Plaintiffs have brought an action on behalf of themselves and a proposed class of
borrowers defined as “all minority consumers (the “Class”) who obtained a Greenpoint home
mortgage loan in the United States between January 1, 200[4] and the date of judgment in this
action (the “Class Period”) and who were subject to Greenpoint’s Discretionary Pricing Policy
pursuant to which they paid discretionary points, fees or interest rate mark-ups in connection
with their loan. For the purposes of this Complaint, the term “minority” is intended to include
black and Hispanic consumers.”6
II. Q UALIFICATIONS
4. I am the James S. Reid, Jr., Professor of Law at Harvard Law School. My
research interests include financial regulation, international finance, the securitization of
financial assets, consumer protection, federal budget policy, and entitlement reform. I have
served as a consultant to the United States Treasury Department, the United Nations
Development Program, and the World Bank/International Monetary Fund. I am a member of the
National Academy on Social Insurance, a trustee of the College Retirement Equities Fund
(CREF) and its affiliated TIAA-CREF investment companies, a member of the panel of outside
scholars for the NBER Retirement Research Center, and a senior editor for Cambridge
University Press Series on International Corporate Law and Financial Regulation. I frequently
testify before Congress and consult with government agencies on issues of financial regulation. I
am co-editor of Fiscal Challenges: An Inter-Disciplinary Approach to Budget Policy (Cambridge
5. Id., ¶77. 6. Id., ¶77. I understand that the class period originally began in 2001, but has been amended to begin in 2004.
Case3:08-cv-00369-TEH Document181 Filed04/01/10 Page4 of 91
Smith 3273
-5-
University Press 2008), co-author of Analytical Methods for Lawyers (Foundation Press 2003)
and Regulation of Financial Institutions (West 1999), and author of numerous scholarly articles.
Before joining the Harvard Law School faculty in 1989, I was a law clerk for Associate Justice
Thurgood Marshall and practiced law in Washington, D.C., from 1984 to 1989. I received J.D.
and M.B.A. degrees from Harvard University in 1982 and a B.A. from Brown University in
1976.
5. I have previously consulted with government agencies and private litigants in
litigation involving allegations of abusive and discriminatory practices in the origination of
residential mortgages. In one of those cases, I submitted expert reports that are now subject to a
confidentiality agreement. Partially on the basis of that work, I have written several scholarly
articles and testified before the Senate Banking Committee.7 I have also served as an expert
witness on behalf of the Internal Revenue Service in a case involving international banking
transactions and on behalf of corporate defendants in suits arising under the Employee
Retirement Income Security Act of 1974. I have not testified as an expert witness at deposition
or trial in the last four years (Appendix 2).
6. I have attached (as Appendix 3) a list of documents that I have considered for my
work on this case and to which I may refer during deposition or at trial.
7. I file this report in my individual capacity and have no financial stake in the
outcome of this case. My hourly rate in this matter is $750. My compensation is not contingent
7. See Howell E. Jackson & Laurie Burlingame, Kickbacks or C ompensation: T he C ase of Yi eld Sp read Premiums, 12 STANFORD J. L. BUS. & FIN. 289 (2007); Howell E. Jackson, The Trilateral Dilemma in Financial Regulation, in IMPROVING THE EFFECTIVENESS OF FINANCIAL EDUCATION & SAVINGS PROGRAMS (Anna Maria Lusardi, ed.) (University of Chicago Press 2008); Predatory Mortgage Lending Practices: Abusive Uses of Yield Spread Premi ums: He aring Bef ore t he S. C omm. o n B anking, H ousing & Urba n Af fairs, 107th Cong. (2002) (statement of Howell E. Jackson, Finn M.W. Caspersen and Household International Professor of Law and Associate Dean for Research and Special Programs, Harvard Law School), available at http://banking.senate.gov/02_01hrg/010802/jackson.htm.
Case3:08-cv-00369-TEH Document181 Filed04/01/10 Page5 of 91
Smith 3274

-6-
on any action or event resulting from the analyses, opinions or conclusions in, or the use of, this
report.
III. SUMMARY OF CONCLUSIONS
8. The disparate impact imposed on the proposed Class may be proven here through
evidence and methods that are common to the Class. As a disparate impact case under ECOA
and FHA, Plaintiffs’ claims cannot be proven by looking only to the circumstances of their
individual loans. Rather, the only way to prove Plaintiffs’ case is on a class-wide basis—that is,
to look at how Defendant’s policies affect minorities versus whites, in general. For the reasons
detailed in this report, I conclude that Greenpoint maintains sufficient data concerning its
borrowers to permit just the kind of class-wide examination of Greenpoint’s policies as required
by a disparate impact case. In addition, my analysis of the data provided to Plaintiffs shows that
minorities paid more for Greenpoint wholesale mortgage loans than whites with similar risk-
characteristics. Table 1 shows the difference in loan costs (represented by the annual percentage
rate, or “APR”) paid by white and minority borrowers for Greenpoint wholesale loans originated
from 2004 to 2007.8
TABLE 1: SUMMARY OF DISPARATE IMPACT & MONETARY RELIEF
African
Americans Hispanics Total Wholesale Loans (2004-2007) Mean APR for Given Minority 7.297% 7.166% Mean APR for Whites 6.602% 6.602%
Difference 0.695% 0.565% Difference after Controlling for Relevant Risk Factors with Regressions 0.094% 0.076%
Undiscounted Monetary Relief over Five Years ($ Millions) $33.0 $69.6 $102.5 Number of Borrowers 30,175 64,611 94,786 Undiscounted Monetary Relief over Five Years per Borrower $1,093 $1,076 $1,082
8. My analysis of wholesale loans includes loans for which the business channel (wholesale, retail, or correspondent) could not be definitively identified in Greenpoint’s data provided to Plaintiffs. As discussed below, the vast majority of these unclassified loans are likely wholesale loans.
Case3:08-cv-00369-TEH Document181 Filed04/01/10 Page6 of 91
Smith 3275

-7-
As Table 1 shows, the mean APR of a Greenpoint wholesale loan to white borrowers was 6.602
percent, whereas the mean APR to African American and Hispanic borrowers was 7.297 percent
and 7.166 percent, respectively. Even when controlling with regression analysis the risk-based
factors used by lenders to price mortgage loans, the APRs for African Americans and Hispanics
were 9.4 and 7.6 basis points higher than the APRs for whites.9 (A basis point is equal to 1/100th
of a percentage point). Using assumptions and methodologies (discussed below) that can be
further refined once merits discovery is complete, I calculate aggregate undiscounted monetary
relief to African Americans and Hispanics of $102.5 million over the five years following loan
origination—an average of $1,082 per minority borrower. Monetary relief can also be calculated
for other periods as the court deems appropriate.
9. My report is organized as follows. In Section IV, I give an overview of the
mortgage lending industry and the appropriate methodology for statistical analysis in disparate
impact cases. I explain that the evidence and analysis required to show disparate impact is
common to the class. In Section V, I show that Greenpoint’s pricing policies imposed a disparate
impact on minorities through higher priced loans by using Greenpoint’s internal data on
mortgage applications and originations. This evidence and analysis, discussed in more detail
below, is common to the Class, in that none of it depends on an individualized inquiry of Class
members. If this case were to proceed as individual trials, each plaintiff would rely on the
common evidence presented here.
9. These estimates are based on my preferred regression model; comparable estimates using alternative model specifications are discussed below and in the appendices to this report.
Case3:08-cv-00369-TEH Document181 Filed04/01/10 Page7 of 91
Smith 3276

-8-
10. In Section VI, I examine the named Plaintiffs in this case and show that their
situations are typical of other Class members in that they suffered disparate impact resulting
from Greenpoint’s pricing policies.
11. In Section VII, I explain that monetary relief to the class may be reliably
estimated on an aggregate basis to the Class as a whole. I propose a model that could be used to
estimate the harm resulting from Defendant’s challenged conduct. This model would estimate
the finance charges Class members would have paid but-for Defendant’s alleged practices.
Computing aggregate overpayment would incorporate Defendant’s own data on its mortgage
originations. Accordingly, I conclude that aggregate and individual monetary relief to the Class
may be reliably estimated on an aggregate basis to the Class as a whole. This analysis does not
create any problems of manageability.
12. My review of materials and data is continuing, and I reserve the right to modify
my opinions as new materials emerge.
IV. DISPARATE IMPACT CAN BE PROVEN THROUGH COMMON EVIDENCE AND METHODS
13. Common evidence and methods are available to show that Greenpoint’s policies
had a disparate impact on minorities such that minorities paid more for wholesale home
mortgage loans than whites with similar risk characteristics. Using statistical tests such as
regression analysis of legitimate mortgage underwriting factors that are common to the Class, my
analysis of Greenpoint’s internal data shows that Greenpoint’s pricing policies and practices had
a disparate impact on minority members of the Class.
A. Mortgage Industry Overview
1. Overview
14. In recent years, the capital markets have played an increasingly important role in
financing residential mortgages in the United States. For many decades, under a variety of
Case3:08-cv-00369-TEH Document181 Filed04/01/10 Page8 of 91
Smith 3277

-9-
programs overseen by government sponsored enterprises such as the Federal National Mortgage
Association (Fannie Mae) and Federal Home Loan Mortgage Corporation (Freddie Mac),
conforming loans (or prime loans) have been repackaged into mortgage backed securities in a
process known as securitization and funded through the capital markets. Since the mid 1990’s,
non-conforming residential mortgages (subprime, Alt-A and jumbo) have had access to capital
market funding, initially through securitization transactions sponsored by private firms but later
with support from expanded programs of the government sponsored enterprises.10 Access to
capital market funding sparked a dramatic increase in the origination of subprime and Alt-A
residential mortgages, with annual originations ballooning from an estimated $190 billion and
$60 billion in 2001 to $600 billion and $400 billion in 2006.11 Over the same period, the
percentage of subprime and Alt-A loans sold into the capital markets also expanded dramatically.
By the mid 2000’s, an estimated 75 percent of all new subprime and 91 percent of new Alt-A
loans were sold into the capital markets.12
15. The emergence of capital market funding for the full spectrum of residential
mortgages transformed the business model of many residential mortgage lenders in the United
States. Traditionally, mortgage lenders made loans and then held them on their balance sheet.
Under the capital market funding model upon which securitization depends, loan originators hold
loans only for a brief period of time before selling the loans to mortgage pool assemblers who
10. Adam B. Ashcraft & Til Schuermann, Understanding the S ecuritization o f Su bprime Mo rtgage Cred it, Federal Reserve Bank of New York Staff Report No. 318 (Mar. 2008).
11. Id. at 2. According to the data provided to Plaintiffs, only 10 percent of Greenpoint’s loans originated from 2004 to 2007 were classified as “Conforming A” loans, with the rest classified as Alt-A, Jumbo A, Closed-End Second, Commercial, Government, HELOC, or A-Minus during the Class period. GPM-E-01-000001 - GPM-E-01-000006; GPM-E-02-000001; GPM-E-01-000003 B; GPM-E-01-000006 B.
12. Ashcraft & Til Schuermann, supra note 10, at 2.
Case3:08-cv-00369-TEH Document181 Filed04/01/10 Page9 of 91
Smith 3278
-10-
then resell large pools of mortgages to capital market investors in securitization transactions.13
With this “originate to distribute” model, many major mortgage originators, like Greenpoint, sell
substantially all of their mortgage loans shortly after origination.14 When these loan originators
make an individual mortgage loan, they have quite accurate estimates of the price at which that
loan can be sold into the secondary market, based on a relatively limited number of factors
concerning the type of loan (e.g., loan amount, fixed or adjustable rate terms, maturity, and loan
purpose – home purchase or refinance), characteristics of the borrower (credit score, income-to-
debt service ratios, loan-to-value ratio of the loan), geographic location (e.g., state and
metropolitan statistical area (MSA)), and a limited number of loan features (e.g., prepayment
penalties and repricing formulas for adjustable rate mortgages).15 Through the period at issue in
this litigation, major mortgage originators constantly monitor the secondary mortgage market to
ascertain changes that may affect the value of the loans that the firms are about to originate and
used that information to update the pricing of their new mortgage originations. Under this
originate-to-distribute business model, originator profits depend largely on the difference
between the secondary market value of a loan at the time of origination and the originator’s cost
of making the loan, including most significantly the principal amount of the loan extended to the
borrower and the credit risk factors associated with the loan.
16. According to depositions of Greenpoint witnesses in this litigation, Greenpoint
relied almost exclusively on this originate-to-distribute model of funding through the capital
13. Kathleen C. Engel & Patricia A. McCoy, Turning a Blind Eye: Wall Street Finance of Predatory Lending, 75 FORDHAM L. REV. 102 (2007).
14. According to witnesses in this case, Greenpoint held less than 2 percent of the loans that it originated. See Deposition of Steve Abreu at 25-28 (Sep. 10, 2008).
15. See Robert B. Avery et al., Credit Risk, Credit Scoring, and the Performance of Home Mortgages, FED. RES. BULL., July 1996, at 621; Alan M. White, Risk-Based Mo rtgage Pricin g: Presen t & Fu ture Research , 15 HOUSING POL’Y DEBATE 503 (2004).
Case3:08-cv-00369-TEH Document181 Filed04/01/10 Page10 of 91
Smith 3279

-11-
markets. While the firms sold loans to several hundred different investors, its two largest sources
of funding were Bear Stearns and Lehman Brothers.16 The Greenpoint executives charged with
these secondary market sales of mortgages were in daily contact with potential investors,
supplying those investors with extensive loan-level data on the kinds of mortgage loans that the
firm was originating.17 Investors used this loan level information to determine the prices that
these investors would pay Greenpoint for its mortgages.18 Based on its expectation of the prices
that loans would earn in the secondary market, Greenpoint then would adjust on a daily basis the
rates that the firm would set on its own mortgages.19 All but a small fraction of Greenpoint’s loan
originations were sold into the secondary market during the class period. Even when investors
returned loans for failure to comply with underwriting standards or some other reason, the firm
had a practice of repackaging the returned loans and reselling them into the market.20
Accordingly, Greenpoint operated on a funding model that was entirely dependent on secondary
market pricing, and all of the information necessary for the market to value Greenpoint
mortgages, including their credit risk, was communicated to potential investors in the form of
loan-level data. Greenpoint used the same loan-level data to set the prices for its mortgage
originations.
17. Mortgage originators such as Greenpoint had several different ways to originate
residential mortgages.21 Most commonly, Greenpoint employed mortgage brokers to identify
buyers and facilitate the loan origination process. This market is often called the wholesale
16. See Deposition of Kevin Hughes at 42-45 (Dec. 3. 2008). 17. Id. at 52-55. 18. Id. at 36-50. 19. Id. at 60-73. 20. Id. at 71-79. 21. Jackson & Burlingame, supra note 7; Alan M. White, Borrowing W hile Bl ack: A pplying F air Le nding
Laws to Risk-Based Mortgage Pricing, 60 S. CAROLINA L. REV. 677 (2009); Michael LaCour-Little, The Pricing of Mortgages by Brokers: An Agency Problem?, 31 J. REAL EST. RES. 235 (2009).
Case3:08-cv-00369-TEH Document181 Filed04/01/10 Page11 of 91
Smith 3280

-12-
market for loan originations and Greenpoint was one of the largest participants in the wholesale
originations market.22 Up to 93 percent of Greenpoint loans originated from 2004 to 2007,
including all of the named Plaintiffs’ loans, were originated through wholesale brokers.23 To
apprise mortgage brokers of current prices, loan originators would typically provide elaborate
“rate sheets” indicating the loan terms available for a variety of loans programs (including a
spectrum of fixed- and adjustable-rate mortgages) and reflecting a range of loan characteristics,
based on the factors described above that affect the price at which individual loans could be sold
into the secondary market.24 For each loan program, the rate sheet would typically also offer a
range of different prices. The “par value” rate would be the interest rate at which the originator
would offer to fund the loan at precisely the face amount of the loan – that is $100,000 for a
mortgage with a $100,000 face amount. Adjustments to the “par value” rate could be made
according to terms on the rate sheet based on objective credit characteristics, resulting in a post-
adjustment “rate sheet price”. An “above par” loan would bear a higher interest rate and would
carry a higher price than the rate sheet price – that is, the originator would offer to pay a
22. See Deposition of Steve Abreu at 18 (Sept. 10, 2008). The prominence of Greenpoint in wholesale originations is confirmed in contemporaneous trade accounts. See Tom MaMalfa, Who’s Who in Wholesale 2005, Mortgage Banking, August 2006, available at http://findarticles.com/p/articles/mi_hb5246/ is_11_66/ai_n29289151/pg_5/?tag=content;col1 (“GreenPoint ranked seventh for the second straight year, with volume of $40.9 billion. Approximately 90 percent of its production came from brokers. The company is best known for its reduced-doc programs.”).
23. Based on Greenpoint’s loan-level data and the business channel classification scheme provided to Plaintiffs, 77.5 percent of the 401,110 Greenpoint loans originated from 2004 to 2007 were identified as broker-originated wholesale loans. GPM-E-01-000001 – GPM-E-01-000006; GPM-E-02-000001; GPM-E-01-000003 B; GPM-E-01-000006 B; Letter from Anand S. Raman, Skadden, Arps, Slate, Meagher & Flom LLP, to Gary Klein, Roddy Klein & Ryan (June 23, 2009). The origination channel for another 15.3 percent of loans were not classifiable based on information in the data, but most are likely to be wholesale originations. See Letter from Anand S. Raman, Skadden, Arps, Slate, Meagher & Flom LLP, to Gary Klein, Roddy Klein & Ryan (June 23, 2009). For example, 12 percent of all loans originated from 2004 to 2007 are not definitively classified as wholesale loans in the data but are identified as “Greenpoint Express” originations. Most of these unclassified Greenpoint Express loans were likely broker-originated loans. See Deposition of J. Steven Gilcrest at 9-10 (Sep. 11, 2008). Greenpoint Express loans were agency loans originated directly for Fannie Mae or Freddie Mac using their underwriting systems. See Deposition of Kevin Hughes at 185-186 (Dec. 3, 2008).
24. See Jackson & Burlingame, supra note 7.
Case3:08-cv-00369-TEH Document181 Filed04/01/10 Page12 of 91
Smith 3281

-13-
premium to fund the loan of as much as several percent of the loan amount.25 These premiums,
known in the industry as yield spread premiums, reflect the higher price the “above par” loans
fetch when resold through securitization transactions, and might generate on a $100,000
mortgage loan an additional payment to the mortgage broker of several thousand dollars.
Between the mid-1990’s and the mid-2000’s, yield spread premiums became an increasingly
important source of compensation for mortgage brokers, and were often more significant than the
other principal source of mortgage broker compensation, origination fees and direct charges.
With yield spread premiums, the cost of mortgage broker compensation is imposed on borrowers
in the form of higher interest payments over the life of the mortgage.
18. The second major channel of mortgage originations by lenders such as Greenpoint
would be direct lending operations, sometimes referred to as retail loans. All of Greenpoint’s
retail loans were refinancings of loans that it already serviced.26 These loans were originated
through a single telemarketing processing center rather than through physical branch offices.27
This channel is comparable to wholesale lending in that the originator’s retail office is provided
pricing information similar to the rate sheets provided to mortgage brokers. The retail pricing
information is based on a variety of loan programs, and the pricing reflects current conditions in
the secondary mortgage market. Retail origination offices, like mortgage brokers, also receive a
portion of their compensation through origination fees and direct charges. One difference with
retail loans is that there is typically no explicit yield spread premium paid for loans with “above
25. Rate sheets also typically include a variety of “below par” loans with lower interest rates for each loan program. With below par loans, originators fund less than the face amount of a loan (perhaps $98,000 on a $100,000) and the borrowers pays additional “discount points” to cover the shortfall (perhaps $2,000 or two points). In exchange for these additional upfront payments, the borrower pays lower interest payments over the life of the loan than would have been true with a par loan or above par loan.
26. Deposition of Steve Abreu at 76, 106-107 (Sep. 10, 2008); Deposition of J. Steven Gilcrest at 71-74 (Sep. 11, 2008).
27. Id.
Case3:08-cv-00369-TEH Document181 Filed04/01/10 Page13 of 91
Smith 3282

-14-
par” rates as the mortgage lenders fund the loans directly. Retail loans with higher interests do,
however, also command higher prices when sold into loan securitization transactions and so
mortgage lenders do generate more profits when their retail offices steer borrowers into above
par loans. Moreover, borrowers incur additional costs through higher interest payments on above
par retail mortgages, just as they do with above par wholesale loans. Based on Greenpoint’s
loan-level data provided to Plaintiffs, 3.2 percent (12,852) of Greenpoint loans originated from
2004 to 2007 were retail originations.28 Per instructions from Plaintiffs’ counsel, I exclude these
12,852 retail loans from my analysis.
19. A third and less common channel for mortgage originations is through
correspondent banking arrangements under which a correspondent bank identifies the borrower
and facilitates the transaction. Economically, correspondent mortgage originations are similar to
the wholesale market via mortgage brokers, though originators may devise separate loan
programs and rate sheets for their correspondent relationships. Greenpoint’s loan-level data
provided to Plaintiffs identifies 15,992 loans originated from 2004 to 2007 as correspondent
originations.29 Again, per instructions from Plaintiffs’ counsel, I exclude these loans from my
analysis because these were loans that Greenpoint acquired.30
20. A system of Federal regulations governed the disclosure of information to
borrowers in residential mortgage originations during the Class Period. Under the Real Estate
Settlement Procedures Act, originators were required to disclose both direct compensation and
28. GPM-E-01-000001 – GPM-E-01-000006; GPM-E-02-000001; GPM-E-01-000003 B; GPM-E-01-000006 B; Letter from Anand S. Raman, Skadden, Arps, Slate, Meagher & Flom LLP, to Gary Klein, Roddy Klein & Ryan (June 23, 2009).
29. Id. 30. See Deposition of Kevin Hughes at 91, 94 (Dec. 3, 2008).
Case3:08-cv-00369-TEH Document181 Filed04/01/10 Page14 of 91
Smith 3283

-15-
yield spread premiums paid to mortgage brokers for loan originations.31 Retail originators were
required to report direct compensation. Under regulations promulgated by the Federal Reserve
Board under the Truth in Lending Act, borrowers were also required to be informed of the
annual percentage rate (APR) of mortgage loans, an estimate of interest rates reflecting both the
direct costs of origination (including origination fees and other direct charges) as well as
projected interest rates over the life of the loans.32 The APR reflects the cost of yield spread
premiums on wholesale loans and of analogous above par rates on retail loans and is generally
regarded as a more accurate measure of the costs of borrowing than the stated interest rate on a
loan.33 Under the Home Mortgage Disclosure Act and implementing Federal Reserve Board
regulations, mortgage originators are required to maintain and report a range of information
about loan originations, including information on the racial characteristics of borrowers.34
Finally, under the Equal Credit Opportunity Act35 and Fair Housing Act,36 mortgage originators
such as Greenpoint are prohibited from engaging in discriminatory lending practices.
2. Discretionary Pricing Policies Ha ve Re sulted in Minorities Payin g Higher Prices than Whites with Similar Risk Characteristics
21. Over the past two decades, a large number of academic studies have explored the
relationship between borrower race and the availability or the cost of obtaining residential
31. Jackson & Burlingame, supra note 7. 32. The Truth in Lending Act, 15 U.S.C. §1606(a) (2006), and the Federal Reserve Board’s Regulation Z
(Truth in Lending), 12 C.F.R. §226.22(a)(1) (2008), define APR. The APR for mortgages is typically higher than the interest rate because it treats all prepaid finance charges (lender points and broker fees) as reductions in the loan principal. See id. §226.18(b).
33. The Truth in Lending Act, 15 U.S.C. § 1606 et seq. (2006); Federal Reserve Board’s Regulation Z (Truth in Lending), 12 C.F.R. §226.22(a)(1) (2008). For a recent Federal Reserve Board discussion of APRs, see Federal Reserve System, Truth in Lending, 74 Fed. Reg. 43,232, 43,241-44 (proposed Aug. 26, 2009) (to be codified at 12 C.F.R. pt. 226).
34. See Robert B. Avery et al., New Information Reported Under HMDA and Its Application in Fair Lending Enforcement, FED. RES. BULL., Summer 2005, at 244.
35. Regulation B (Equal Credit Opportunity), 12 C.F.R. § 202 et seq. (2009). 36. Fair Housing Act, 42 U.S.C. § 3601 et seq.
Case3:08-cv-00369-TEH Document181 Filed04/01/10 Page15 of 91
Smith 3284
-16-
mortgage loans in the United States. Two recent literature reviews can be found in White
(2009)37 and Courchane (2007).38 As explained in greater detail in these reviews, early academic
studies focused on the relationship between mortgage denials and the racial composition of
neighborhoods.39 Early studies also included audit tests of lenders. For example, a 1999 study by
the Urban Institute found that minorities were offered mortgages at higher rates than whites in
similar circumstances.40 The Urban Institute findings were based in part on paired audit testing
conducted by the National Fair Housing Alliance that was carried out by people of different
racial and ethnic backgrounds in a sample of seven cities. Each group of testers - including one
white and one or more minorities - told lenders they had similar credit histories, incomes and
financial histories, and had the same type of mortgage needs. The testing found that minorities
were less likely to receive information about loan products, and received less time and
information from loan officers. Most importantly for our purposes, this audit study found that
minorities “were quoted higher interest rates in most of the cities where tests were conducted.”41
37. See Alan M. White, Borrowing W hile Bl ack: A pplying Fai r Le nding Law s t o Risk-Based M ortgage Pricing, 60 S. C L. REV. 677 (2009).
38. See Marsha J. Courchane, The Pricing of Home Mortgage Loans to Minority Borrowers: How Much of the APR Different ial Can We Explain? , 29 J. REAL EST. RES. 399 (2007). In her own analysis of loan costs, Dr. Courchane finds statistically significant disparities between loan costs for minority borrowers when compared to white borrowers. While this aspect of Ms. Courcane’s analysis is consistent with my own work, I have reservations concerning certain aspects of her methodology
39. See, e.g., Alicia H. Munnell et al., Mortgage Lending in Boston: Interpreting HMDA Data, 86 AM. ECON. REV. 25 (1996).
40. Margery Austin Turner & Felicity Skidmore, the Urban Institute, MORTGAGE LENDING DISCRIMINATION: A
REVIEW OF EXISTING EVIDENCE (1999). 41. Id. at 8. See also id. at 36-37 (interest rate offered African-Americans statistically greater than those offered
whites only in Atlanta tests). The report also found: “One early analytic study found discrimination against blacks and Hispanics in interest rates and loan fees but
not in loan maturities. Another also found discrimination against blacks in the setting of interest rates. Both studies used extensive statistical controls to isolate the effect of race and ethnicity from the effects of other factors. Two more recent studies examine discrimination in overages, defined as the excess of the final contractual interest rate over the lender’s official rate when it first commits to a loan. Both of these studies find cases in which the overages charged to black and Hispanic borrowers are higher than those charged white customers by a small but statistically significant amount.” Id. at 19.
Case3:08-cv-00369-TEH Document181 Filed04/01/10 Page16 of 91
Smith 3285

-17-
22. These earlier studies were suggestive of significant racial effects, but suffered
from an absence of controls for credit risk and other underwriting considerations when
examining substantially large samples of actual loan originations as opposed to more limited
audit tests. Over time, as government reporting requirements improved and litigation and various
investigations offered more complete data sets, researchers were able to include a number of
these controls in their studies and developed more complete empirical models of the residential
mortgage origination process. Some focused on the impact of race on credit spreads and found
statistically significant racial disparities.42 Later studies expanded this analysis by controlling for
loan channels, and found reduced, but still statistically significant racial effect on the APR of
mortgage loans.43 Yet other studies, including my own published work, found statistically and
economically significant racial disparities in the amount of compensation earned by mortgage
brokers on residential mortgage originals and in FHA closing costs charged to borrowers.44
23. The notion that minority borrowers may pay more for home loans than similarly
situated white borrowers due to discretionary pricing policies is not altogether surprising. A wide
body of literature has shown that individuals can be influenced (even subconsciously) by race.
The theory that the racial disparities in borrowing costs are the by-product (at least in part) of
42. See Avery et al., supra note 34; Debbie Gruenstein Bocian, Keith S. Ernst, & Wei Li, Center for Responsible Lending, Unfair Lending: The Effect of Race & Ethnicity on the Price of Subprime Mortgages 3 (May 31, 2008), available at http://www.responsiblelending.org/mortgage-lending/research-analysis/rr011-Unfair_Lending-0506.pdf. See also Allen J. Fishbein & Patrick Woodall, Consumer Federation of America, Subprime Cities: Pa tterns o f Geog raphic Dispa rity in S ubrime Len ding (Sept. 2005), available at http://www.consumerfed.org/pdfs/Subprimecities090805.pdf; and Allen J. Fishbein & Patrick Woodall, Consumer Federation of America, Subprime L ocations: P atterns of Geo graphic Di sparity (Sept. 2006), available at http://www.consumerfed.org/pdfs/SubprimeLocationsStudy090506.pdf (finding correlations between race and participation in subprime loan markets).
43. See Courchane, supra note 38; but see White, supra note 21, at 685-686 (questioning the appropriateness of controlling for loan channels). See also LaCour-Little, supra note 21 (finding racial effects on note rates in some but not all models based on a sample of loans within conforming loan size parameters).
44. See Jackson & Burlingame, supra note 7; Susan E. Woodward, U.S. Department of Housing & Urban Development, A St udy of C losing C osts f or FH A Mort gages (2008), available at http://www.huduser.org/Publications/pdf/FHA_closing_cost.pdf.
Case3:08-cv-00369-TEH Document181 Filed04/01/10 Page17 of 91
Smith 3286

-18-
racially influenced credit pricing decisions in no way implies that loan officers and brokers must
harbor animus toward minorities or that they are engaging in intentional discrimination. There
are, for example, a number of studies that have found that economic decisionmakers are
influenced by racially conscious or unconscious stereotypes.45 For example, the Implicit
Attitudes Tests (which can be completed in less than 5 minutes on the Internet)46 suggest that
many people of professed goodwill find it impossible not to treat African-American pictures
differently than white pictures when asked to perform a simple sorting exercise. These tests are
part of a growing literature documenting unconscious bias against African-Americans and other
minorities.47 These studies are relevant to this litigation because, to the extent that economic
decisionmakers often harbor unconscious, but biased racial stereotypes, it becomes more
plausible that the subjective pricing process that Greenpoint established for setting loan terms (in
which a loan officer or broker can often plausibly deny that its treatment of a individual
consumer was based on some attribute other than race) might mask what are in fact racially
influenced decisions. In Watson v. Fort Worth Bank & Trust, the Supreme Court’s recognition of
the existence of subconscious stereotypes was cited as one of the reasons for approving the use
of a disparate impact analysis to evaluate subjective decisionmaking processes at issue in that
case. (“Furthermore, even if one assumed that any such discrimination can be adequately policed
45. See, e.g., Joleen Kirschenman & Kathryn M. Neckerman, We'd Love to Hire Them But ... ! The Meaning of Race to E mployers, in THE URBAN UNDERCLASS, eds. Christopher Jencks & Paul E. Peterson (The Brookings Institution 1991).
46. Project Implicit, at https://implicit.harvard.edu/implicit/. 47. See, e.g., Eric J. Vanman et al., The Modem Face of Prejudice and Structural Features That Moderate the
Effect of Cooperation on Affect, 73 J. PERSONALITY & SOC. PSYCHOL. 941, 944-45 (1997); Yolanda F. Niemann et al., Intergroup Sterotypes of Working Class Blacks and Whites: Implications for Stereotype Threat, 22 WESTERN J. BLACK STUD. 103 (1988); John F. Dovidio et al, Racial St ereotypes: The C ontents of T heir C ognitive Representations, 22 J. EXPERIMENTAL SOC. PSYCHOL. 22 (1986); Mark Chen & John A. Bargh, Nonconscious Behavioral Con firmation Pro cesses: Th e S elf-Fulfilling Consequences o f Au tomatic S tereotype Activa tion, 33 J. EXPERIMENTAL SOC. PSYCHOL. 541 (1997).
Case3:08-cv-00369-TEH Document181 Filed04/01/10 Page18 of 91
Smith 3287

-19-
through disparate treatment analysis, the problem of subconscious stereotypes and prejudices
would remain.”)48
24. There is a substantial body of empirical evidence finding that, even after
controlling for differences in credit quality and other legitimate cost differentials, financial firms
often charge minority borrowers more for credit than they charge similarly situation non-
minority borrowers. Outside of the mortgage field summarized earlier, this evidence extends to
automobile financing,49 commercial lending,50 and even foreign lending markets.51
25. Greenpoint’s Discretionary Pricing Policy was, in my view, susceptible to
discrimination.52 As explained in the deposition of one Greenpoint witness, the firm engaged a
larger number of mortgage brokers as an alternative to expanding its own retail operations.53
While Greenpoint’s wholesale mortgage pricing was nominally based on objective criteria tied to
credit quality and loan characteristics, its mortgage brokers were given discretion to place
48. Watson v. Fort Worth Bank & Trust, 487 U.S. 977, 990 (1988). 49. Mark A. Cohen, Imperfect Competition in Auto Lending: Subjective Markup, Racial Disparity, and Class
Action Li tigation at 36 (2008), available at http://works.bepress.com/mark_cohen/1/. Additional evidence of discriminatory treatment has been found in the pricing of automobiles themselves. See IAN AYRES, PERVASIVE
PREJUDICE?: NON-TRADITIONAL EVIDENCE OF RACE & GENDER DISCRIMINATION ch. 3 (University of Chicago Press 2002); Ian Ayres, Further E vidence of Di scrimination i n N ew C ar N egotiations and Est imates of It s C ause, 94 MICHIGAN LAW REV. 109 (1995).
50. David G. Blanchflower, Phillip B. Levine, & David J. Zimmerman, Discrimination in the Small Business Credit Market, 85 REV. ECON. & STAT. 930, 936 (Nov. 2003). See also Ken S. Cavalluzzo, Linda C. Cavalluzzo, & John D. Wolken, Competition, Small Business Financing, and Discrimination: Evidence from a New Survey, 75 J. BUS. 641 (2002).
51. Geraldo Cerqueiro, Hans Degryse, & Steven Ongena, Rules versus Discretion in Loan Rate Setting (Feb. 2008), available at http://www.ifw-kiel.de/konfer/staff-seminar/paper/folder.2008-02-22.4077567561/degryse.pdf.
52. That Greenpoint’s mortgage brokers might engage in discriminatory lending practices that could implicate Greenpoint’s legal obligations is confirmed by a contractual provision in Greenpoint’s agreements with mortgage brokers, under which Greenpoint required its mortgage brokers to represent that they were acting in compliance with federal fair lending laws. See Greenpoint Mortgage Funding, Inc., Broker Agreement ¶ 11.f, Deposition of J. Steven Gilcrest Exhibit 19 (Sept. 11, 2008). See also Deposition of Burnett K. Jarvis at 201 (Dec. 9, 2008) (brokers “had fair lending duties and responsibilities that they certified to become a [Greenpoint] broker”). Similarly, Greenpoint Mortgage’s Internal Policies and Procedures required that its Fair Lending Committee monitor exceptions to broker compensation limits. See Deposition of Steve Abreu Exhibit 8, ¶ 5 (Sept. 10, 2008).
53. See Deposition of Burnett K. Jarvis at 212 (Dec. 9, 2008) (“I would say that wholesale [use of mortgage brokers] was an efficient way to, you know, get business versus building your own retail network. . . . In essence, you’re outsourcing a function of your origination to someone else on a variable cost basis.”).
Case3:08-cv-00369-TEH Document181 Filed04/01/10 Page19 of 91
Smith 3288

-20-
borrowers into higher cost above par loans to finance yield spread premiums and also to impose
differential fees and charges,54 both of which actions could – and based on my analysis of the
data did – raise the APRs of minority borrowers. An additional dimension of discretion relates to
Greenpoint’s practice of granting a very large number of pricing waivers at the request of
mortgage brokers.55 That is, while mortgage brokers were initially required to price wholesale
mortgages from objective rate sheets, Greenpoint had a liberal practice of granting exceptions,
which created another source of discretion in the pricing of wholesale mortgage. According to
some contemporaneous trade press sources, Greenpoint had a reputation of being
accommodating of mortgage brokers and that practice was thought to be a source of its rapid
growth in wholesale lending markets during the class period.56 Again, this latitude that
Greenpoint afforded its mortgage brokers increased the likelihood of discriminatory pricing with
respect to vulnerable minority borrowers.
B. Introduction to Disparate Impact Testing
26. A simple calculation of the average cost of a loan for borrowers of each race can
show whether minorities pay more, on average, than white borrowers. In addition, one can break
down the set of Greenpoint wholesale loans into subsets to determine whether minority
borrowers with given characteristics paid more for loans than white borrowers with the same
characteristics. Regression analysis can control for any legitimate underwriting characteristics
54. See id. at 213-215. 55. See Deposition of Kevin Hughes at 104-112 (Dec. 3, 2008) (noting that pricing exceptions were made on
“30 to 35 percent of loans originated and/or acquired by GreenPoint”). 56. See Anthony Garritano & Scott Kersnar, 25 Tec h-Savvy Lenders , Mortgage Technology (Aug. 1, 2007)
available at http://www.mortgage-technology.com/plus/archive/?id=156640 (“GreenPoint’s claim to fame has been its use of technology to offer a broad array of mortgage products and to make the process easier for its brokers.”). See also Tom LaMalfa, Who’s W ho i n W holesale 2 005, MORTGAGE BANKING, Aug. 2006, at 80 (“GreenPoint ranked seventh for the second straight year, with volume of $40.9 billion. Approximately 90 percent of its production came from brokers. The company is best known for its reduced-doc programs.”).
Case3:08-cv-00369-TEH Document181 Filed04/01/10 Page20 of 91
Smith 3289

-21-
that affect the cost of a loan to a consumer and show whether minorities pay more for their loans
than whites with similar risk characteristics.
27. Regression analysis is a statistical method for determining the relationship that
exists in a set of data between a variable to be explained—called the “dependent variable”—and
one or more “explanatory variables.” The type of regression analysis I use to evaluate disparate
impact is known as “ordinary least squares” (OLS). In this case, the dependent variable is the
cost of the loan to the consumer. This cost is reflected in the form of the APR of the loan, which
is the measure that the staff of the Federal Reserve Board devised to communicate accurately the
total cost of a loan to a consumer.57 The explanatory variables include the race and ethnicity of
the borrower and other non-race characteristics of the borrower and property that affect the cost
of the loan to the lender. The regression model will show whether minority borrowers paid
disproportionately higher APRs than non-minority borrowers even after controlling for plausible
non-race “legitimate business need” characteristics.
1. Prima Facie Evidence of Discrimination
28. The appropriate test for assessing whether there is a prima facie disparate racial
impact is both simple and straightforward. One must simply compare the average finance
charges incurred by minority and white borrowers. To the extent one finds that the average
finance charge paid by minority Greenpoint borrowers is statistically larger than that paid by
white Greenpoint borrowers, this evidence is consistent with an inference that the Defendant’s
Discretionary Pricing Policy has a disparate racial impact.
57. See, e.g., Regulation C (Home Mortgage Disclosure), 12 C.F.R. § 203 et seq. (2009); Regulation Z (Truth in Lending), 12 C.F.R. § 226 et seq. (2009).
Case3:08-cv-00369-TEH Document181 Filed04/01/10 Page21 of 91
Smith 3290
-22-
29. In Section V.C of this report, I present statistics that show prima facie disparate
racial impact. African-American borrowers on average paid $1,093 more in finance charges than
whites over five years. See Table 9. Hispanic borrowers on average paid $1,076 more in finance
charges than whites over five years. These differences are highly statistically significant.
2. Testing for Disparate Impact with Controls for Legitimate Explanatory Factors
30. It is also possible with the aggregate data made available from Greenpoint to use
regression analysis to statistically analyze whether disparate racial impact persists after
controlling for decision factors that “meet a legitimate business need.”58 Thus, beyond assessing
whether there is persuasive prima facie evidence of a disparate impact, it is possible with
aggregate data to use regression analysis to assess whether there is persuasive evidence of
whether a disparate impact was justified by a legitimate business need. My analysis therefore
includes in a regression those variables that would reflect a legitimate business need for
differential pricing practice among borrowers. If, after including these “legitimate business need”
variables in the regression, the racial disparity remains and is statistically significant, then the
data establishes a strong inference of racial discrimination against the affected class.
31. The kind of regressions that would be appropriate to use in this litigation – what
economists call “ordinary least squares” (OLS) regressions with a limited number of right-hand
side variables – are a standard and generally accepted statistical technique. In my experience, this
is the form of statistical analysis that government agencies and academic experts generally
58. The quoted language comes from commentaries on ECOA regulation: “The act and regulation may prohibit a creditor practice that is discriminatory in effect because it has a disproportionately negative impact on a prohibited basis, even though the creditor has no intent to discriminate and the practice appears neutral on its face, unless the creditor practice meets a legitimate business need that cannot reasonably be achieved as well by means that are less disparate in their impact.” Official S taff Interp retations, Regulation B (Equal Credit Opportunity), 12 C.F.R. § 202.6(a)-2 (2009).
Case3:08-cv-00369-TEH Document181 Filed04/01/10 Page22 of 91
Smith 3291

-23-
employ to detect discriminatory lending practices in financial institutions. And, particularly since
the HMDA amendments went into effect in 2004, borrower APRs as defined under the Truth-in-
Lending Act is the most common measure of the cost of borrowing in these analyses.59
32. A regression testing for unjustified disparate impacts should control for only those
variables that would provide a plausible valid business justification. It is my opinion that only
attributes related to a decisionmaker’s expected marginal cost60 provide a valid business
justification – and hence only such attributes should be included in the business justification
regression. This standard resonates with the standard approach in the literature. For example,
John Yinger succinctly describes (i) the problem of “included variable bias” (what he calls
“diverting variable bias”); (ii) the need to purposefully exclude certain non-legitimate controls
from a regression; and (iii) what constitutes “legitimate” controls:
Diverting variable bias arises when a variable that is not a legitimate control variable, but that is correlated with race or ethnicity, is included in the regression. The key issue, of course, is how to define what variables are “legitimate.” Under most circumstances, economists are taught to err on the side of including too many variables. In this case, however, illegitimate controls may pick up some of the effect of race or ethnicity and lead one to conclude that there is no discrimination when in fact there is. According to the definition of discrimination used here, legitimate controls are those associated with a person’s qualifications to rent or buy a house, buy a car or so on-or to use a legal term business necessity.61
Notice that the legitimate controls turn on a person’s ability to perform their part of the bargain –
in the case of fair lending claims, that is primarily the capacity of the borrower to repay the loan
59. For recent presentations by a Federal Reserve Board economist identifying APRs as an appropriate dependent variable and outlining a methodology comparable to the one employed in this report, see Lynn Gottschalk, Fair Le nding M odeling of Pri cing Deci sions (Sept. 10, 2008), available at http://www.occ.treas.gov/flc/2008/Lynn%20Gottschalk.pdf.
60. “Marginal” cost refers to the cost of a seller supplying one additional item (or service). A “marginal” cost contrasts with a seller’s “fixed” or “overhead” costs which are invariant to the number of items (or services) supplied. The concept of “cost” includes earning a reasonable profit as a return on capital invested.
61. John Yinger, Evidence on Discrimination in Consumer Markets, 12 J. ECON. PERSPECTIVES 23, 27 (1998).
Case3:08-cv-00369-TEH Document181 Filed04/01/10 Page23 of 91
Smith 3292

-24-
according to its terms. In the credit context, other scholars have similarly applied a performance
standard for determining what characteristics are relevant:
Discrimination occurs whenever the terms of a transaction are affected by personal characteristics of the participants that are not relevant to the transaction. In credit markets, discrimination on the basis of race and/or gender exist if loan approval rates or interest rates charged differ across groups with equal ability to repay.62
Again, it is legitimate to control for factors that relate to a person’s probable performance of her
contractual commitment – which in the credit context is chiefly whether or not the loan will be
repaid:
Discrimination may be apparent if banks approve loans to equally credit-worthy minority and white-owned firms, but charge the minority-owned firms a higher rate of interest.63
Focusing on creditworthiness or the likelihood of repayment is also consistent with a standard
that focuses on a decisionmaker’s costs. Borrowers who fail to pay off their loans can impose
substantial costs on a lender. It would be appropriate in analyzing a lender’s decisions about a
borrower’s cost of borrowing to control for factors that affect the likely costs of default.64
33. Greenpoint’s centralized electronic databases include abundant and
comprehensive evidence of the basis on which Greenpoint evaluated individual borrowers’
62. Blanchflower, et al., supra note 50, at 930. 63. Id. at 940. 64. See A.B. & S. Auto Service, Inc. v. South Shore Bank of Chicago, 962 F. Supp. 1056 (N.D. Ill. 1997) (“[In a
disparate impact claim under the ECOA], once the plaintiff has made the prima facie case, the defendant-lender must demonstrate that any policy, procedure, or practice has a manifest relationship to the creditworthiness of the applicant….In other words, the onus is on the defendant to show that the particular practice make’s defendant’s credit evaluation system more predictive than it would be otherwise.”). See also Lewis v. ACB Business Services , Inc., 135 F.3d 389, 406 (6th Cir. 1998) (“The Act was only intended to prohibit credit determinations based on ‘characteristics unrelated to creditworthiness.’”). Attributes related solely to the potential for supra-competitive revenues that a lender or broker might extract from different classes of consumers do not constitute a valid business justification. Extracting supra-competitive revenues from a class of consumers – not because they impose higher costs on a seller but merely because the seller has the power to do so – is not consistent with business necessity (and thus would constitute an unjustified disparate impact). Sellers are justified in charging higher prices to cover their expected costs of serving particular types of consumers. Such pricing is consistent with business necessity. But sellers are not justified in charging higher prices to a disproportionately African-American and Hispanic class of consumers simply to make supra-competitive profits.
Case3:08-cv-00369-TEH Document181 Filed04/01/10 Page24 of 91
Smith 3293

-25-
creditworthiness. Greenpoint’s electronic data would allow them to statistically evaluate factors
related to the borrower’s credit history, the loan collateral, the borrower’s “capacity” to borrow
and the borrower’s stability.
34. The credit industry is in many ways unique in amassing centralized and aggregate
data on the creditworthiness of individual borrowers. The use of statistical “credit scoring”
systems to determine whether to grant a loan and at what rate is well established and has largely
replaced more subjective determinations. As one reviewer of the credit scoring approach noted:
The arrival of credit cards in the late 1960s made the banks and other credit card issuers realize the usefulness of credit scoring. The number of people applying for credit cards each day made it impossible both in economic and manpower terms to do anything but automate the lending decision. When these organizations used credit scoring, they found that it also was a much better predictor than any judgmental scheme and default rates would drop by 50% or more ...
The event that ensured the complete acceptance of credit scoring was the passing of the Equal Credit Opportunity Acts (ECOA 1975, ECOA 1976) in the US in 1975 and 1976.65
Regulation B of ECOA comprehensively regulates the workings of “credit scoring systems” to
assess creditworthiness:
To qualify as an empirically derived, demonstrably and statistically sound, credit scoring syste m, the system must be: (i) Based on data that are derived from an empirical comparison of sample groups of the population of creditworthy and noncreditworthy applicants who applied for credit within a reasonable preceding period of time; (ii) Developed for the purpose of evaluating the creditworthiness of applicants with respect to the legitimate business interests of the creditor utilizing the system (including, but not limited to, minimizing bad debt losses and operating expenses in accordance with the creditor’s business judgment); (iii) Developed and validated using accepted statistical principles and methodology; and (iv) Periodically revalidated by the use of appropriate statistical principles and methodology and adjusted as necessary to maintain predictive ability.66
65. Lyn C. Thomas, A Survey of Credit and B ehavioural Scoring: Forecasting Financial Risk of Le nding to Consumers, 16 INT’L J. FORECASTING 149 (2000).
66. Regulation B (Equal Credit Opportunity), 12 C.F.R. § 202.2 (p) (2009).
Case3:08-cv-00369-TEH Document181 Filed04/01/10 Page25 of 91
Smith 3294

-26-
35. Through Greenpoint’s data, I can reliably control for any creditworthiness
variables that could influence the cost of the mortgage to the borrower, so long as those variables
fulfill a legitimate business need. This is an industry where, except for discretionary pricing:
lending decisions are made en masse by automated systems; and
lending decisions are based on the formulaic application of objective, statistically-
validated criteria, which also determine the price at which loans are sold into the
secondary market.
The whole purpose of this centralized credit pricing process is to base credit determinations on
arms-length, objective criteria whose validity can be periodically assessed with aggregate
statistical analysis. Another chief purpose of the objective underwriting process is to avoid bias
against certain classes of consumers.67 Any argument that disparate impact cannot be proven on
a class wide basis because the creditworthiness of a borrower requires an individualized inquiry
is unjustified.
V. A STATISTICAL ANALYSIS OF DEFENDANT’S DATA SHOWS DISPARATE IMPACT
36. In this section, I describe Defendant’s mortgage loan data provided to Plaintiffs,
which is common evidence that I use to show the disparate impact of Defendant’s Discretionary
Pricing Policy to minority borrowers. Unless otherwise indicated, my analysis only considers
Defendant’s wholesale loans.68
67. Deposition of J. Steven Gilcrest at 83 (Sep. 11, 2008). “Q. Is the reason why the underwriting process used an objective criteria, at least in part, to avoid biases to specific borrowers? A. Yes.”
68. I include as wholesale loans all the loans for which the business channel could not be definitively classified, but most of which were wholesale loans, as discussed above in n.23. In Appendix 5, I perform several robustness checks with alternative formulations that control for loan classifications, including two – Models (17) and (18) – which control for the unknown business channel. In these models, the key results of my analysis are not materially changed.
Case3:08-cv-00369-TEH Document181 Filed04/01/10 Page26 of 91
Smith 3295

-27-
A. Overview of Defendant’s Data
37. Plaintiffs have been provided with a database of loans originated by Greenpoint
from 1999 through 200769 along with files explaining the data contained in that database.70 This
data constitutes common evidence of disparate impact to the Class. Defendant’s loan database
includes data about the applicants and the applicants’ properties that Greenpoint used in its
underwriting process. The database also includes details about the characteristics of the loans,
including loan interest rates. Finally, the database includes demographic information of the
applicants collected by Greenpoint pursuant to HMDA regulations, including race and ethnicity.
38. As of the date of this report, the version of Greenpoint’s database provided to
Plaintiffs is incomplete in that data for many variables are missing for several years. For
example, data on the APR and broker compensation for those loans is only available for loans
originated from 2004 to 2007. Therefore, my analysis of the cost of Greenpoint’s loans in this
report is limited to those 2004-2007 loans.71
39. Defendant’s loan database includes information on the race and ethnicity of the
borrower and co-borrower. These race classifications appear to follow the conventions set forth
through HMDA data filing requirements. Beginning in 2004, HMDA records ethnicity and race
in separate variables. The two ethnicity options consisted of Hispanic or Latino, or not Hispanic
or Latino. Therefore, an applicant can be identified with both a race and an ethnicity beginning in
2004. For example, an applicant can be identified as being both African American and Hispanic.
69. GPM-E-01-000001 - GPM-E-01-000006; GPM-E-02-000001; GPM-E-01-000003 B; GPM-E-01-000006 B.
70. Greenpoint Mortgage Funding, Inc., Data Dictionary for Data Produced on August 28, 2008; Letter from Anand S. Raman, Skadden, Arps, Slate, Meagher & Flom LLP, to Gary Klein, Roddy Klein & Ryan (June 23, 2009), Exhibit A.
71. As I discussed earlier, I exclude from my analysis the approximately 29,000 loans identified as retail or correspondent loans in Defendant’s loan database. Further discussion of various technical refinements to the data set is presented in the note to Appendix 4.
Case3:08-cv-00369-TEH Document181 Filed04/01/10 Page27 of 91
Smith 3296

-28-
The HMDA standards also allow for applicants and co-applicants to be assigned to multiple race
classifications beginning in 2004.
40. For all loans, the race and ethnicity can be recorded by the lender as not provided
if the application was not taken in-person and the applicant failed to give a response to the race
or ethnicity questions on the loan application. If the applicant was “not a natural person” (such as
a business), then the race and ethnicity was recorded as “Not applicable”.72
41. For purposes of my basic analysis,73 I assign each loan to a single race based on
the race and ethnicity of the borrower or co-borrower in Defendant’s loan database in a
sequential order. First, I classify the race of a loan as “African American” if any of the races
given for either the borrower or co-borrower is African American. Next, I classify the race of a
loan as “Hispanic” if (1) the ethnicity of the borrower or co-borrower is “Hispanic or Latino”,
and (2) I do not classify the loan as “African American”. I classify the race of a loan as “Asian”
if (1) any of the races given for either the borrower or co-borrower is Asian, and (2) I do not
classify the loan as “African American” or “Hispanic”. I classify the race of a loan as “American
Indian” if (1) any of the races given for either the borrower or co-borrower is American Indian or
Alaskan Native, and (2) I do not classify the loan as “African American”, “Hispanic”, or
“Asian”. I classify the race of a loan as “Hawaiian” if (1) any of the races given for either the
borrower or co-borrower is Native Hawaiian or Other Pacific Islander, and (2) I do not classify
the loan as “African American”, “Hispanic”, “Asian”, or “American Indian”. I classify the race
72. See, e.g., Federal Financial Institutions Examination Council, A Gu ide to HMDA Repo rting: Getting It Right! (2006 ed.), at A-5 – A-7, available at http://www.ffiec.gov/Hmda/pdf/2006guide.pdf. Applicants could also be classified according to HMDA standards as “Not applicable” under other circumstances if the loan application was taken in 2003 but final action on the loan did not occur until 2004 or later. See SUPPLEMENT I TO PAR T 203—Staff Commentary, Regulation C (Home Mortgage Disclosure), 12 C.F.R. § 203.4(a)(iv)(B)(3) (2009).
73. In Appendix 7, I analyze alternative racial/ethnic classifications of loans, which do not affect the substance of the findings of disparate impact in my basic analysis.
Case3:08-cv-00369-TEH Document181 Filed04/01/10 Page28 of 91
Smith 3297

-29-
of a loan as “White” if (1) the first race listed for the borrower is White, (2) any other race listed
for the borrower is unknown or missing, (3) the co-borrower’s race is White or unknown, and (4)
I do not classify the loan as “African American”, “Hispanic”, “Asian”, or “American Indian”. I
classify the race of all other loans as “Missing”. Table 2 shows the breakdown of the wholesale
loans in Defendant’s loan database by year of origination based on this racial classification.
TABLE 2: RACIAL COMPOSITION OF BORROWERS IN DEFENDANT’S LOAN DATABASE
Year American
Indian Asian African
American Hawaiian Hispanic Missing White Total 2004 329 8,243 7,319 729 13,901 9,622 72,804 112,947 2005 382 11,053 8,161 1,068 17,333 7,705 64,974 110,676 2006 496 8,944 10,478 1,049 24,269 8,915 51,655 105,806 2007 313 3,232 4,223 353 9,119 4,701 20,851 42,792 Total 1 ,520 31,472 30,181 3,199 64,622 30,943 210,284 372,221
% of Total 0.4% 8.5% 8.1% 0.9% 17.4% 8.3% 56.5% 100.0%
As Table 2 shows, 8.1 percent of the loans in Defendant’s loan database were made to African
American borrowers, and another 17.4 percent were made to Hispanic borrowers. At least 94,000
Greenpoint loans were made to African American and Hispanic borrowers from 2004 to 2007.
42. Defendant’s loan database contains several variables related to the cost of the loan
to borrowers that can be divided into two categories: interest rates and fees. Two of the interest
rate variables in Defendant’s loan database are the note rate and the APR. The note rate of a
mortgage loan is the interest rate upon which mortgage payments are calculated. For a fixed-rate
mortgage, the interest rate of the loan is always equal to the initial note rate. For adjustable rate
mortgages (ARMs), the interest rate for the loan can change after a specified period of time. The
note rate as given in Defendant’s loan database does not consider any projected future changes in
the loan’s interest rate for adjustable-rate loans, as the APR does. Examining only the initial
interest rate for disparities would not account for disparities caused by anticipated future interest
rate changes for adjustable-rate loans, especially if the initial interest rate is a low “teaser” rate in
Case3:08-cv-00369-TEH Document181 Filed04/01/10 Page29 of 91
Smith 3298

-30-
effect for a brief period. In addition, unlike the APR, the note rate does not incorporate any
upfront fees paid by the borrower. For example, the loan for the named plaintiffs Ramirezes’
loan has an APR (6.191 percent) that is more than four percentage points higher than the initial
interest rate of the loan (2 percent). Because the APR takes into account forecasted changes in
the loan interest rate and upfront fees, it is a better representation of the cost of the loan than the
initial interest rate. Therefore, the APR is a more appropriate interest rate to use to measure
disparate impact than the initial interest rate of the loan as represented by the note rate.
43. In addition to the interest rate, Defendant’s loan database includes numerous
variables related to the characteristics of the borrower, home, and loan. Home characteristics
include the type of property (such as one-to-four family or manufactured housing) and whether
the property will be owner-occupied. Borrower characteristics (besides race and ethnicity)
include debt-to-income ratio (“total debt ratio”), FICO credit score, and the level of
documentation given for the loan (such as “Full Documentation”, “Stated Income”, and “NIV -
No income verif (Limited EZ Doc)”).
44. Loan characteristics in the database include the loan amount, the purpose of the
loan (such as purchase or refinance), the term length of the loan (10-year, 15-year, 30-year, etc.),
the length of any prepayment penalty (for some years), and the lien status of the loan (first lien or
subordinate lien). The database also categorizes each loan from 2004 to 2007 by one of 538
unique loan program codes. The descriptions of these loan program codes include “ALT A
AP_30 YEAR FIXED”, “CONFORMING A GX_30 YEAR FIXED AU”, “ALT A
AP_PIG_3YR/6MO LIBOR ARM I.O.”, and “JUMBO A AQ_PIG_3YR/6MO I.O. LIBOR
ARM”. General descriptions of the meaning and structure for many of the loan program codes
Case3:08-cv-00369-TEH Document181 Filed04/01/10 Page30 of 91
Smith 3299

-31-
are also provided in documentation provided to Plaintiffs.74 Using this information, I categorized
the 538 unique loan program codes into 59 categories of loans based on their term structure, such
as 30-year fixed, 15-year fixed, 2yr/1yr ARM, 3yr/6mo ARM, and 30/15 balloon.
45. Appendix 4 includes summary statistics of the loan cost variables and the other
borrower, home, and loan characteristics contained in Defendant’s loan database. Should
Greenpoint produce additional variables to Plaintiffs that would be appropriate to incorporate in
a disparate impact analysis, I will update my analysis accordingly.
B. Mean Comparisons S how that Minorities Paid More for Green point Loans than White Borrowers with Similar Risk Characteristics
46. As I discussed above, regression analysis is the primary tool I use to estimate
disparity in the cost to minorities for Greenpoint mortgages because regression analysis can
control for the loans’ risk-based characteristics with valid business justification. Before
performing the regression analysis, I first examine the simple mean costs of Greenpoint
mortgages for minorities and for whites. Table 3 shows the mean APR for wholesale loans made
to whites and minorities in Defendant’s loan database.
TABLE 3: MEAN APR BY RACE, 2004-2007
Year Mean for White
Borrowers
Mean for African American Borrowers
Difference between African
American & White Borrowers
Mean APR for Hispanic
Borrowers
Difference between Hispanic
& White Borrowers
APR (%) 2004 5.251 5.848 0.597 5.534 0.283 2005 6.482 6.752 0.271 6.509 0.027 2006 8.102 8.364 0.262 8.207 0.106 2007 7.976 8.214 0.237 8.135 0.159 Total 6.602 7.297 0.695 7.166 0.565
74. Greenpoint Mortgage Funding, Inc., Data Dictionary for Data Produced on August 28, 2008; Letter from Anand S. Raman, Skadden, Arps, Slate, Meagher & Flom LLP, to Gary Klein, Roddy Klein & Ryan (June 23, 2009) (Exhibits A & B).
Case3:08-cv-00369-TEH Document181 Filed04/01/10 Page31 of 91
Smith 3300

-32-
Table 3 shows that the mean APR for African American borrowers is consistently higher than
the mean APR for white borrowers in every year. The mean APR for Hispanic borrowers is
always higher than the mean APR for white borrowers. Across all years, the average African
American APR is 69.5 basis points higher and the average Hispanic APR is 56.5 basis points
higher than the average white APR. These averages by themselves provide evidence of disparate
racial impact. However, these raw differences in APRs are not as informative as the regression
analysis I perform below because the risk-based characteristics of the loan are not taken into
account in Table 3. It is possible that the differences shown in Table 3 may be explained by the
risk characteristics of the borrower and loan with valid business justification. The regression
analysis will control for these risk-based characteristics.
47. Before moving on to the regression analysis, I examine loan costs for borrowers
with similar risk profiles by comparing the mean APR for borrowers of a given race and risk
profile to the mean APR for borrowers of another race and the same risk profile. My measure of
borrower risk profile in this illustrative comparison is the borrower credit score. Table 4 shows
the mean APR for loans made to minorities and whites in Defendant’s loan database broken
down by credit score ranges.
TABLE 4: MEAN APR BY RACE AND CREDIT SCORE, 2004-2007
Loans Mean APR Loans Mean APR Loans Mean APRMissing score 58 7.785 123 7.550 341 7.314 0.471 0.236300-599 30 8.261 38 7.711 110 7.385 0.876 0.326600-619 50 7.936 69 7.167 195 7.383 0.553 -0.216620-639 1,079 7.344 1,442 7.162 4,174 6.976 0.367 0.186640-659 3,028 7.527 4,475 7.416 12,744 6.989 0.538 0.427660-679 5,364 7.572 9,586 7.567 25,173 6.946 0.627 0.621680-699 5,797 7.257 11,604 7.212 33,940 6.634 0.623 0.578700-719 5,228 7.263 12,050 7.089 35,002 6.627 0.636 0.462720-739 3,641 7.151 9,219 7.060 29,045 6.525 0.626 0.535≥ 740 5,906 7.064 16,016 6.940 69,560 6.380 0.684 0.560All Credit Scores 30,181 7.297 64,622 7.166 210,284 6.602 0.695 0.565
Difference between Mean Af. Amer.
APR & Mean White APR
Difference between Mean Hisp. APR & Mean White APR
African American Hispanic Whites
Case3:08-cv-00369-TEH Document181 Filed04/01/10 Page32 of 91
Smith 3301
-33-
As Table 4 shows, the mean APR for Greenpoint African American borrowers is always higher
than the mean APR for its white borrowers, regardless of the range of credit scores used. The
mean APR for Hispanic borrowers is always higher than the mean APR for white borrowers for
all credit scores except in one instance in which the data sample is extremely small.
C. Regression Models Show Disparate Impact on Minorities
48. As discussed above, regression analysis is the method by which I measure
disparate impact because regression analysis can control for the risk-based attributes that lenders
use in a race-neutral underwriting process. As I discussed above, a regression model is a
mathematical equation that measures the relationship between a “dependent variable” (the APR,
in this case) and numerous “explanatory” variables. In the regression model I employ here, I use
the racial identity of the borrowers and objective risk-based characteristics of the borrowers to
explain loan prices in terms of the APR.75
49. Defendant’s own data, rate sheets,76 and the existing academic literature inform
my choices of the characteristics to use as explanatory variables in the regressions. Major
explanatory variables considered in the literature and rate sheets include the applicant’s credit
history, the type of the property, the applicant’s total debt ratio, the amount of the loan, the loan-
to-value ratio, the combined loan-to-value ratio, the loan term, the lien position of the loan, the
level of documentation provided by the applicant, the presence of any prepayment penalties, and
75. The regression model that I use to show disparate impact to the Class takes a form similar to Equation 1: [1]
ik
ikkr
irriii xxHispanicAfAmAPR ,,210,
where APRi is the APR of customer i’s loan, AfAmi is an indicator (or “dummy”) variable equal to one when borrower i is an African American, Hispanici is an indicator variable equal to one when borrower i is an Hispanic, xr,t represents all the other potential races (excluding whites) for borrowers, xk,i represents all other observable characteristics that could explain the price of the loan, and t represents the error term. In this report, I estimate all regression models with robust standard errors to account for any potential heteroscedasticity in the error term.
76. See Deposition of Steve Abreu Exhibit 10 (Sep. 10, 2008); Deposition of Kevin Hughes Exhibit 3 (Dec. 3, 2008).
Case3:08-cv-00369-TEH Document181 Filed04/01/10 Page33 of 91
Smith 3302

-34-
the purpose of the loan.77 Greenpoint included many of these risk-based variables in their
marketing materials to purchasers in the secondary market, lending credence to the conjecture
that these variables are risk-based metrics that meet a business necessity.78 The explanatory
variables in the regression model could also include the time at which the interest rate was
locked on the loan and the location of the property in terms of broad geographic boundaries such
as states or metropolitan areas.
50. Estimating the regression model on Defendant’s data determines the marginal
effect of each explanatory characteristic (including the applicant’s race) on the APR of the loan.
The model that I use is estimated over hundreds of thousands of observations, making this type
of analysis appropriate for class-wide treatment. As long as the marginal effects of the racial
identity of minority borrowers are greater than zero and statistically significant, then the model
will show that Defendant’s policies had a disparate impact on minorities.
51. Appendix 5 includes complete results from various regressions estimated on
Defendant’s loan database. Table 5 shows the marginal effect of a borrower’s minority race
(relative to white borrowers) as measured by estimating regressions using different sets of
explanatory variables over all the loans with available data in Defendant’s loan database. Each
number (or “coefficient”) measuring the marginal effect of race in Table 5 can be interpreted as
the marginal increment by which the APR for minority borrowers exceeded the APR for white
borrowers with the same non-race characteristics being controlled for in the regressions.
77. See, e.g., id.; Bocian, et al., supra note 42; Courchane, supra note 38; Jackson & Burlingame, supra note 7; Elaine Fortowsky & Michael LaCour-Little, Credit Scor ing a nd Di sparate Im pact, Working Paper, Wells Fargo Home Mortgage, available at http://fic.wharton.upenn.edu/fic/lacour.pdf.
78. Deposition of Kevin Hughes at 35-40 (Dec. 3, 2008).
Case3:08-cv-00369-TEH Document181 Filed04/01/10 Page34 of 91
Smith 3303

-35-
TABLE 5: EFFECT OF RACE ON APR (BASIS POINTS) USING REGRESSIONS ESTIMATED ON ALL
LOANS Race Model (1) Model (2) Model (3) Model (4) African American 69.53*** 27.08*** 22.40*** 9.44*** (1.11) (0.58) (0.58) (0.44)
Hispanic 56.49*** 8.35*** 6.52*** 7.64*** (0.79) (0.39) (0.38) (0.32)
American Indian 18.34*** -17.65*** -36.12*** -5.83*** (3.91) (2.33) (2.66) (2.02)
Asian 8.98*** -3.33*** -1.95*** 2.61*** (1.01) (0.49) (0.49) (0.39)
Hawaiian 27.67*** -1.09 -1.90 4.36*** (3.06) (1.33) (1.32) (1.08)
Missing 26.39*** 9.25*** 7.62*** 4.08*** (1.12) (0.62) (0.61) (0.42) Observations 372,186 372,186 372,186 372,038 R-squared 0.02055 0.73689 0.74322 0.87352 Adjusted R-squared 0.02053 0.73685 0.74317 0.87330
Note: Standard errors in parentheses. *** Statistically significant at 1%, ** Statistically significant at 5%, * Statistically significant at 10%. Coefficients and standard errors for other explanatory variables are shown in Appendix 5. Explanatory variables for each model consist of: Model (1): Race dummy variables only. Model (2): Race dummy variables, interest rate lock month dummy variables, and subordinate lien dummy variable. Model (3): Same as Model (2), but add FICO score bin dummy variables. Model (4): Same as Model (3), but add loan amount bin dummy variables, LTV bin dummy variables (for first lien loans), CLTV bin dummy variables (for subordinate lien loans), self-employed borrower/co-borrower dummy variable, total debt ratio bin dummy variables, HELOC dummy variable, FHA/VA dummy variable, co-applicant dummy variable, documentation type dummy variables, loan purpose dummy variables, loan term dummy variables (e.g., 15-year, 20-year, 30-year), loan payment type and term dummy variables (e.g., 30-year fixed, 3/1 ARM, 40/30 balloon), dummy variables for residence type interacted with property type, state dummy variables, and metropolitan area (MSA) dummy variables. Alternative model specifications estimated on the entire sample of loans can be found in Appendix 5. Model (1) is the most basic regression model in Table 5; it controls for the race of the borrowers
but no other characteristics of the loans. This model implies that African Americans pay 69.5
basis points more in APR than whites, and Hispanics pay 56.5 basis points more in APR than
whites. These differences are statistically significant (p < 1%). Model (2) controls for race as
well as the month at which the loan’s interest rate was locked. This addition helps control for
interest rate movements over time. Model (2) also controls for whether a loan was a subordinate
lien loan.
Case3:08-cv-00369-TEH Document181 Filed04/01/10 Page35 of 91
Smith 3304

-36-
52. Because Model (2) does not control for any credit-related characteristics of the
borrower, Model (3) adds controls for the borrower’s credit score. Model (3) shows that, after
adding basic controls for borrower’s credit worthiness, African Americans’ APRs are 22.4 basis
points greater than whites’ APRs, and Hispanics’ APRs are 6.5 basis points greater than whites’
APRs. Finally, Model (4) controls for a host of other potential risk-based characteristics, in
addition to credit scores, widely considered in the literature to be useful in predicting loan
performance. Some of these additional characteristics include loan-to-value ratios, debt ratios,
the structure of the loan (in terms of whether it has a fixed or adjustable rate, the fixed-period
before rate adjustment, etc.), and the term of the loan (10-year, 20-year, 30-year, etc.). Model (4)
shows that even when a comprehensive list of risk-based characteristics are controlled for,
African Americans’ APRs are 9.4 basis points greater than whites’ APRs, and Hispanics’ APRs
are 7.6 basis points greater than whites’ APRs. These disparities are statistically significant at the
1 percent confidence level. These regression results show that Defendant’s minority borrowers
pay more in finance charges (reflected by the APR) than white borrowers with similar risk
characteristics.79 Model (4) is my preferred model for estimating the discriminatory impact of
Defendant’s Discretionary Pricing Policy as the model incorporates all of the important risk-
based controls used to price mortgages in the secondary market and it produces a good fit with
the dependent variable, generating an adjusted R-squared of 0.8733, meaning that the model
explains over 87 percent of the variation in loan pricing.
79. I do not include in Model (4) a set of variables representing seven Greenpoint program categories (A Minus, Alt-A, Closed-End Second, Commercial, Conforming A, Jumbo A, or unknown). Controlling for all these categories is, in my view, potentially misleading because I already control for other risk-based characteristics that would correlate with these categories. To the extent that borrowers were steered by Defendant or its brokers into more expensive A Minus or Alt-A loans when they could have qualified for Conforming loans, controlling for these categories in a regression would understate the true disparity in loan costs for minorities compared to whites. Nevertheless, I include a regression (Model (16)) in Appendix 5 that controls for all these loan categories. The statistically significant disparate impact on minority APRs persists when controlling for these program categories.
Case3:08-cv-00369-TEH Document181 Filed04/01/10 Page36 of 91
Smith 3305

-37-
53. In addition to estimating several regression models over all loans in Defendant’s
loan database, I also estimate separate regressions for different samples of loans within the
database to check the robustness of my results. Table 6 shows the coefficients for African
Americans and Hispanics when estimating regressions using the same explanatory variables as
Model (4) over subsets of the database rather than all loans in the database. The results in Table
6 reflect Model (4) estimated separately for first lien loans, subordinate lien loans, loans
originated in 2004, loans originated in 2005, loans originated in 2006, and loans originated in
2007.
Case3:08-cv-00369-TEH Document181 Filed04/01/10 Page37 of 91
Smith 3306

-38-
TABLE 6: EFFECT OF RACE ON APR (BASIS POINTS) USING SEPARATE REGRESSIONS BY YEAR, LIEN STATUS, & BUSINESS CHANNEL
African American Hispanic Observations Adj. R-sq. Model (4) Estimated for All Loans 9.44*** 7.64*** 372,038 0.87330 (0.44) (0.32) Model (4) Estimated Separately by Lien Status
Model (4-L1): First Lien 8.98*** 8.66*** 340,512 0.81189 (0.43) (0.31) Model (4-L2): Subordinate Lien 5.42*** -2.01* 31,526 0.77111 (1.50) (1.15)
Model (4) Estimated Separately by Year of Origination1
Model (4-2004) 10.60*** 7.21*** 112,946 0.88526 (0.67) (0.49) Model (4-2005) 7.29*** 3.79*** 110,582 0.83258 (0.59) (0.39) Model (4-2006) 5.63*** 1.66*** 105,787 0.88072 (0.64) (0.46) Model (4-2007) 7.15*** 2.07*** 42,723 0.87890 (0.98) (0.72)
Note: Standard errors in parentheses. *** Statistically significant at 1%, ** Statistically significant at 5%, * Statistically significant at 10%. Coefficients and standard errors for other explanatory variables are shown in Appendix 6. 1The models estimated separately on individual years include additional variables not included in the models estimated over multiple years at once because some variables are only provided in the database for certain years:
2004: Length of rate lock; presence of a prepayment penalty. 2005: Length of rate lock; type of refinance (cash-out or rate and term); lender-paid mortgage insurance presence; waiver of escrow for taxes and insurance; presence & length of prepayment penalty. 2006: Length of rate lock; type of refinance (cash-out or rate and term); lender-paid mortgage insurance presence; waiver of escrow for taxes and insurance; presence & length of prepayment penalty. 2007: Type of refinance (cash-out or rate and term).
As Table 6 shows, every subset of the data examined shows a statistically significant, positive
disparity between minority and white APRs, with the exception of subordinate-lien loans for
Hispanic borrowers, which represent only 6,831 loans (less than 2 percent of the 372,000
wholesale loans in the data). These results indicate that the disparities between whites and
Case3:08-cv-00369-TEH Document181 Filed04/01/10 Page38 of 91
Smith 3307

-39-
minorities persist across the spectrum of Greenpoint loans, and are not isolated to a specific time
period or loan type, besides the limited number of subordinate-lien Hispanic loans.80
54. To further illustrate the persistence of disparities between minorities and whites
regardless of borrower credit characteristics, I construct an alternative regression specification to
Model (4) called Model (4-RF) in which I interact the race dummy variables with the FICO score
dummy variables. All other explanatory variables in Model (4-RF) are the same as Model (4). By
using interactive terms in Model (4-RF), I can measure the effect of minority status on APR for
borrowers within a given range of FICO scores. Using the interactive terms in the regression
analysis is analogous to Table 4, with the addition that the regression controls for the other risk-
based characteristics of the borrower and loan, such as lien status, rate lock month, loan-to-value
ratio, and loan program characteristics, that the mean comparisons in Table 4 do not incorporate.
Table 7 shows the coefficients for the interactive terms of minority and FICO scores.81
80. During the Class period, lenders often appear to have originated a subordinate lien loan simultaneously with a first lien loan. For example, when 100 percent of a home’s value was financed, borrowers would often take a first-lien loan for 80 percent of the home value and a subordinate lien loan for the other 20 percent of the home value. In calculating APRs, many of the upfront closing costs, including broker fees, would be allocated to the first-lien loan in such combinations. For Greenpoint’s wholesale loans with broker fee data, the mean broker fee for first-lien loans was $5,621, whereas the mean broker fee for subordinate-lien loans was $404. To the extent that any of the disparate impact in the APR for Greenpoint loans comes from broker fees allocated to the first-lien loans, an analysis of first-lien loan APRs would show greater disparate impact than an analysis of subordinate lien loan. To the extent that appropriate data is available in the Defendant’s database, I may undertake additional analysis of the relationship between subordinated and first-lien loans.
81. As another robustness check, I construct two other models shown only in Appendix 7 (along with the model using the interaction of race and FICO scores). These models use alternative classifications of loans by race to the classification described at the beginning of Section V. These alternative classifications are explained in Appendix 7. The results in Appendix 7 show that disparate impact for minority borrowers persists under these alternative classifications.
Case3:08-cv-00369-TEH Document181 Filed04/01/10 Page39 of 91
Smith 3308

-40-
TABLE 7: RACE EFFECTS ON APR USING INTERACTIONS OF RACE & FICO SCORE
Model (4-RF) African American Hispanic FICO missing 33.61** 37.38*** (14.62) (9.82) FICO < 600 64.98*** 22.60 (23.15) (26.29) 600 ≤ FICO < 620 35.53** -28.33** (17.95) (13.88) 620 ≤ FICO < 640 4.57* 6.49*** (2.58) (2.39) 640 ≤ FICO < 660 11.59*** 11.63*** (1.51) (1.18) 660 ≤ FICO < 680 12.69*** 12.24*** (1.04) (0.78) 680 ≤ FICO < 700 10.83*** 10.21*** (0.94) (0.67) 700 ≤ FICO < 720 9.15*** 7.11*** (0.95) (0.66) 720 ≤ FICO < 740 8.12*** 6.47*** (1.15) (0.77) FICO ≥ 740 6.66*** 3.54*** (0.93) (0.56) Observations 372,038 Adj. R-sq. 0.87353
Note: Standard errors in parentheses. *** Statistically significant at 1%, ** Statistically significant at 5%, * Statistically significant at 10%. Coefficients and standard errors for other explanatory variables are shown in Appendix 7.
The coefficients in Table 7 show the disparity in APR between minorities with the given range of
FICO scores and whites with the given range of FICO scores, when controlling for all the other
risk-based characteristics included in Model (4). For example, the APR for a Greenpoint loan
made to an African American with a FICO score less than 600 is an average of 65.0 basis points
greater than the APR for a loan made to a white borrower with the same FICO score, after
controlling for the other variables included in Model (4). As credit scores increase, the disparities
in APRs between minority and white borrowers persist, but tend to decrease. For example, the
APR for a Greenpoint loan made to an African American with a credit score of at least 740 is an
average of 6.7 basis points greater than the APR for a white borrower with a similar credit score.
The coefficient for Hispanic borrowers with credit scores between 600 and 620 (representing
Case3:08-cv-00369-TEH Document181 Filed04/01/10 Page40 of 91
Smith 3309
-41-
only 69 loans, as shown in Table 4) is the only negative coefficient in Table 7. The results for all
other subsets in Table 7 are further confirmation that disparities in loan costs between minorities
and whites cannot be explained by differences in credit quality.
55. The analysis of Defendant’s data using regression analysis shows that
Defendant’s policies had a disparate impact on the Class as alleged by Plaintiffs. Defendant’s
data shows that African Americans and Hispanics paid more for loans than whites with similar
risk characteristics. As elaborated in Appendices 5-7, these findings are robust to numerous
alternative formulations of my basic model. This data analysis is common to all Class members,
using data that is common to all Class members, and shows disparate impact which is common
to the Class.
VI. ANALYSIS OF THE TYPICALITY OF THE NAMED PLAINTIFFS’ CLAIMS
56. Using information provided in the Complaint and plaintiff HUD-1 statements,82 I
have identified each of the individual named plaintiffs’ loans in the data produced by Greenpoint
to Plaintiffs. Each of the named Plaintiffs’ loans includes the interest rate (in terms of the
original note rate and the APR) and data on the risk-based characteristics controlled for in the
regressions in Section V.
57. Ana Ramirez and Ismael Ramierz, Hispanic borrowers, received a broker-
originated $469,000 refinance loan from Greenpoint in August 2005 for their primary residence
in Massachusetts. The credit score listed for the Ramirez loan in Defendant’s loan database is
and they received an Alt-A 30-year ARM with a fixed-rate of 2 percent for the first month,
resetting every 12 months thereafter. The APR for the Ramirez’s loan was 6.191 percent.
82. HUD-1 Settlement Statement for Ricky Norris (Aug. 9, 2007).
Case3:08-cv-00369-TEH Document181 Filed04/01/10 Page41 of 91
Smith 3310

-42-
58. Jorge Salazar, a Hispanic borrower, received a broker-originated $475,000
refinance loan from Greenpoint in August 2006 for his primary residence in California. Mr.
Salazar’s credit score was , and he received a 30-year loan with a fixed-rate of 6.875 percent.
The APR for Mr. Salazar’s loan was 7.182 percent.
59. Ricky Norris,83 an African-American borrower, received a broker-originated
$137,000 purchase loan from Greenpoint in August 2007 for a single-family investment property
in Maryland. Mr. Norris’s credit score was , and he received an Alt-A negative amortization
interest-only 30-year ARM with a fixed-rate for the first 5 years, resetting every 6 months
thereafter. The APR for Mr. Norris’s loan was 9.649 percent.
60. Using coefficients from the regression models estimated in Section V, I calculate
the APR for each loan of the named Plaintiffs after removing the marginal effect the Plaintiffs’
race on the APR. That is, I calculate the Plaintiffs’ APRs but-for the disparate impact of
Defendant’s policies. This but-for APR represents the estimated race-neutral cost of the loan to
the named Plaintiff.
61. Table 8 shows the named Plaintiffs’ actual APRs, less the marginal effect that
their minority status had on the actual APR. This is calculated by subtracting the race coefficient
corresponding to the Plaintiff’s race from the Plaintiff’s actual APR. The race coefficients and
estimated race-neutral APRs are calculated using (1) Model (4) as it was estimated on the entire
sample of loans in Defendant’s loan database (shown in Table 5), (2) Model (4-L1) as it was
estimated separately on the first-lien loans (shown in Table 6) (all named Plaintiff loans were
first-lien loans), (3) Model (4-2005), (4-2006), and (4-2007) as they were estimated separately by
83. While preparing this report, I was notified by Plaintiffs’ counsel that Mr. Norris had died.
Case3:08-cv-00369-TEH Document181 Filed04/01/10 Page42 of 91
Smith 3311

-43-
the year of the loan origination (shown in Table 6), and (4) Model (4-RF) using the interaction of
race indicator variables and FICO range indicator variables (shown in Table 7).
TABLE 8: ACTUAL AND ESTIMATED RACE-NEUTRAL APRS (%) OF NAMED PLAINTIFFS Norris Ramirez Salazar Actual APR 9.649 6.191 7.182 Model (4) Estimated Race-Neutral APRs for All Wholesale Loans Actual APR less Marginal Effect of Minority Status 9.555 6.115 7.106
Difference from Actual 0.094 0.076 0.076 Model (4-L1) Estimated Race-Neutral APRs for First Lien Wholesale Loans Actual APR less Marginal Effect of Minority Status 9.559 6.104 7.095
Difference from Actual 0.090 0.087 0.087 Model (4) Estimated Race-Neutral APRs Separated by Year Actual APR less Marginal Effect of Minority Status 9.577 6.153 7.165
Difference from Actual 0.072 0.038 0.017 Model (4-RF) Estimated Race-Neutral APRs for All Wholesale Loans (Race & FICO interactions) Actual APR less Marginal Effect of Minority Status 9.582 6.126 7.117
Difference from Actual 0.067 0.065 0.065
62. Because the regression coefficients for the African American and Hispanic
indicator variables are positive and statistically significant (as shown in Section V), the members
of the proposed Class pay, on average, more for their mortgage loans than white borrowers with
similar risk characteristics. Table 8 shows that when the coefficients from the regressions are
subtracted from the named Plaintiffs’ actual APRs (thus removing the average disparate impact
to the Class), their APRs decrease for each of these model specifications. For example, Salazar’s
actual APR is 7.182 percent. When the disparate impact to Hispanics (as calculated using Model
(4)) is removed from his APR, his APR decreases to 7.106 percent.
63. Each regression model shows a statistically significant disparate impact against
minorities. Because each named Plaintiff was subject to the same Discretionary Pricing Policy
that disproportionately affected minority borrowers, the named Plaintiffs have claims that are
typical of the Class.
Case3:08-cv-00369-TEH Document181 Filed04/01/10 Page43 of 91
Smith 3312

-44-
VII. C OMPUTATION OF AGGREGATE MONETARY RELIEF TO THE CLASS AS A WHOLE IS MANAGEABLE AND CAN BE COMPLETED USING COMMON EVIDENCE AND METHODS
64. Monetary relief in this case can be calculated using available, objective
information that is already contained in Defendant’s own centralized databases. To calculate
relief for a particular class member, I calculate the difference between (1) the actual finance
charges that the member paid (as measured by the APR), and (2) the finance charges the class
member paid after removing the disparate impact to that member’s race, as predicted using my
regression models. These charges are a function of the same inputs used in the regression models
used above to prove disparate impact. This is a calculation that with the help of computers can be
done mechanically and can produce individualized as well as an aggregate monetary relief
amount on the basis of readily available data.
65. If Defendant was able to show that it had a business justification to charge a
higher (or lower) average finance charge to a certain subgroup of its borrowers, then it would be
appropriate to calculate the average finance charge paid by whites in this subclass and compare it
to the finance charges actually paid by class members in the subgroup. But this subgroup
analysis can still be made on the basis of objective information that is currently available in
Defendant’s own databases. For example, calculations for relief could easily control for the loan
product or business channel used to originate the loan. These central loan provisions are
accessible in Defendant’s own databases and readily amenable to computer manipulation.
However, I have seen no basis in the academic literature or in materials provided by Defendant
that indicate brokers’ costs vary by borrower race and it would be highly implausible, in my
view, that such cost differentials could justify disparities in APRs of the magnitude present in
Defendant’s database.
Case3:08-cv-00369-TEH Document181 Filed04/01/10 Page44 of 91
Smith 3313

-45-
66. It would, however, be inappropriate in calculating monetary relief to control for
revenue-based factors (such as buyers’ negotiation skills, preferences and self-assessment of
creditworthiness), since, as discussed above, it was not business justified for Greenpoint to
charge minorities a higher price for credit based on such factors. More particularly, it would not
be appropriate to calculate what monetary relief would be for the subclass of borrowers with
strong (or weak) negotiation skills, because doing so would, in effect, suggest that such
differences provide a justification to limit defendant’s liability.
67. Thus, individualized evidentiary hearings on monetary damages are not necessary
or appropriate. Calculation of monetary relief is amenable to mechanistic computation based on
readily available and objective data.
68. To estimate monetary relief, I first determine the APR for each individual Class
member after removing the marginal effect on APR of the member’s minority status as estimated
in my regression model.84 For any given Class member’s loan, this “but-for” APR is calculated
by subtracting from the member’s actual APR the marginal effect of the member’s race on APR,
as measured by the Model (4) regression estimated over the large set of Greenpoint wholesale
loans.
69. The time period over which monetary relief is calculated can be determined using
a number of assumptions. For example, further discovery could yield more information about
payment of Greenpoint loans, including prepayments and defaults. In addition, a variety of
prepayment prediction models exist in the literature that could be used to estimate the expected
84. This “but-for” APR is calculated using Equation [2]. [2] riiw APRAPR ,
For any given Class member’s loan, the but-for APR (APRw,i) is calculated using the marginal effect (the coefficient) corresponding to the member’s race obtained from estimating Equation [1] over the large set of Greenpoint wholesale loans.
Case3:08-cv-00369-TEH Document181 Filed04/01/10 Page45 of 91
Smith 3314

-46-
life of each loan.85 The likelihood of prepayment for any given loan depends on various factors,
including the underwriting factors of the loan, the interest rate of the loan relative to current and
forecasted market rates, and home prices. If I were to use a prepayment model in my calculations
of monetary relief, this model would use inputs that are common to the Class.
70. To show that monetary relief for the Class is in fact estimable, I calculate
monetary relief for each Class member under three alternative assumptions: (1) every loan
remains current (i.e., does not prepay or become delinquent) for the full term of the loan, (2)
every loan remains current for a period of 10 years from the date it was originated, and (3) every
loan remains current for a period of five years. Under each scenario, I assume that interest is paid
at a constant interest rate equal to the APR, and that payments are made on an estimated full-
amortization schedule over the given loan term.
71. Additional information on the actual payment history of the loan, currently
unavailable to me, could yield a more accurate estimate of monetary relief than any of the three
scenarios discussed above. For example, if a borrower prepaid his loan three years after
origination, then I would calculate monetary relief for that borrower over a 3-year period. If a
loan was still current as of the date of my calculation, I could calculate monetary relief based on
the expected remaining life of the loan, given the characteristics of that loan and a prepayment
prediction model (discussed above). For purposes of this report, however, I use the full-term, 10-
year, and 5-year scenarios to calculate monetary relief for illustrative purposes, given the lack of
85. See, e.g., Geetesh Bhardwaj & Rajdeep Sengupta, Did Prepayments Sustain the Subprime Market?, Federal Reserve Bank of St. Louis Working Paper 2008-039B (May 2009), available at http://research.stlouisfed.org/wp/2008/2008-039.pdf; Charles A Calhoun & Yongheng Dung, A Dynamic Analysis of Fixed- and A djustable-Rate Mort gage Te rminations, 24 J. REAL ESTATE FIN. & ECON. 9 (2002); Roberto G. Quercia, Michael A. Stegman, & Walter R. Davis, The Impact of Predatory Loan Terms on Subprime Foreclosures: The Special Case of Prepayment Penalties and Balloon Payments, 18 HOUSING POL’Y DEBATE 311 (2007).
Case3:08-cv-00369-TEH Document181 Filed04/01/10 Page46 of 91
Smith 3315

-47-
data on actual loan payment histories. Any refinement of the period over which to calculate
monetary relief for a given Class member would use common methods and data that is common
to the Class.
72. The assumption of a shorter calculation period of five years may be closest to the
actual experience of Greenpoint loans, based on the recent history of mortgage longevity before
prepayment. In a 2008 position paper, the Mortgage Bankers Association noted that issuers of
securities backed by ARM mortgages assumed a Constant Prepayment Rate (CPR) within a
range of 18 to 30 percent, with 25 percent being the most commonly used CPR.86 The CPR is the
annualized prepayment speed of a pool of mortgages. A CPR range of 18 to 30 percent translates
to an average life of 2.8 to 5.1 years for a pool of 30-year mortgages.87 A 25 percent CPR
translates to an average life of 3.5 years for a pool of 30-year mortgages. In his statement before
a Senate hearing on mortgage abuse, the chairman of the Mortgage Bankers Association noted
that the average life of a subprime mortgage was 2.5 years, whereas the average life of a prime
mortgage was slightly longer than four years.88
73. Although the examples of the length an average mortgage life are shorter than
five years, that longer average life may be more appropriate because I use the APR as my
86. Mortgage Bankers Association, Position Paper: Identifying Prepayment Speeds Used to Price Ginnie Mae Securities Backed by Pools of Certain Ty pes of Loans , Mar. 20, 2008, available at http://www.mbaa.org/files/Advocacy/2008/MBAPositionPaperWidelyHeldFixedInvestmentTrusts(WHFITs).pdf.
87. To calculate the average life of a 30-year mortgage pool under a given CPR, I first convert the CPR into the Single Monthly Mortality (SMM) rate using the formula:
1 – CPR = (1 – SMM)12 where SMM is the monthly prepayment rate. I then calculate the number of mortgages that prepay in a given pool every month under that SMM and calculate the average life of the mortgages within the pool. A summary of the arithmetic of mortgage pricing, payments, and prepayments can be found in Ararat Yesayan, Mortgage Pri cing (June 4, 2009), available at http://ssrn.com/abstract=1414351.
88. Ending Mortgage Abuse: S afeguarding Ho mebuyers: Heari ng Before the S ubcomm. on Housing, Transportation & Community Development of the S. Comm. on Banking, Housing, & Urban Affairs, 110th Cong. 10-11 (2007) (statement of John M. Robbins, CMB, Chairman of Mortgage Bankers Association), available at http://www.mbaa.org/files/Advocacy/2007/MBATestimony6262007EndingMortgageAbuseSafeguardingHomebuyers.pdf.
Case3:08-cv-00369-TEH Document181 Filed04/01/10 Page47 of 91
Smith 3316

-48-
measure of finance charges, and the APR is calculated based on spreading out upfront fees over
the life of the loan. Simply using the actual average life of a loan would understate the degree to
which minorities were overcharged if minorities paid more in upfront fees than white borrowers
with similar risk characteristics.
74. In addition to considerations of prepayments, the choice of a term over which to
estimate finance charge disparity using the APR also depends on the degree to which disparity in
the APR results from disparity in upfront fees as opposed to disparities in note rates or yield
spread premia. Upfront fees are included in the calculation of an APR by spreading out the effect
of those fees over the loan term, even though those fees are typically paid immediately at
origination.89 To the extent that disparate impact in the APR is due to disparate impact in upfront
fees, calculating finance charge differentials over a longer period closer to the original loan term
is appropriate, so that the full effect of the upfront fee disparity can be captured. Yield spread
premia for Greenpoint loans, on the other hand, raise borrower finance costs through a higher
interest rate for the entire term of the loan (for fixed-rate loans), or at least over the initial fixed-
rate term (for ARMs).90 To the extent that disparate impact in the APR is due to disparate impact
in yield spread premium, calculating finance charge differentials over a shorter period closer to
the actual life of the loan is appropriate.
75. For purposes of illustrating monetary relief for this report, however, I do not
attempt to make any of these refinements related to upfront fees, yield spread premium, or
89. In mortgage lending, upfront closing fees are sometimes added to the loan principal rather than paid upfront at loan closing. However, a Greenpoint witness testified that he did not think that Greenpoint ever added origination fees (and presumably other closing costs) to the loan principal. See Deposition of Burnett K. Jarvis at 114 (Dec. 9, 2008).
90. Id. at 96-97, 114-115.
Case3:08-cv-00369-TEH Document181 Filed04/01/10 Page48 of 91
Smith 3317

-49-
prepayments.91 Instead, I present monetary relief under the three scenarios (estimating finance
charge disparities using the APR over the full-term, 10 years, and 5 years) outlined above.
Aggregate monetary relief to the Class is merely equal to the sum of the monetary relief for all
Class members. Table 9 shows the aggregate results of my calculations of monetary relief, based
on regression Model (4) estimated on all wholesale loans in Defendant’s loan database. Again,
with additional data, I could develop a more nuanced estimate of damages based on the structure
of APRs for individual borrowers. And, again, any such refinement to calculate monetary relief
for a given Class member would use common methods and data that is common to the Class.
91. I reserve the right for an expert report on merits to adjust my calculations to account for these refinements.
Case3:08-cv-00369-TEH Document181 Filed04/01/10 Page49 of 91
Smith 3318

-50-
TABLE 9: MONETARY RELIEF TO GREENPOINT MINORITY BORROWERS USING THE APRS
PREDICTED BY MODEL (4)
African
Americans Hispanics Total Over entire loan term
Undiscounted ($Millions) $159.0 $336.5 $495.5 Present Value of Relief ($Millions) $114.9 $242.3 $357.2
Over 10 years Undiscounted ($Millions) $65.5 $138.0 $203.5 Present Value of Relief ($Millions) $63.9 $134.5 $198.4
Over 5 years Undiscounted ($Millions) $33.0 $69.6 $102.5
Number of Loans* 30,175 64,611 94,786 Avg undiscounted relief per loan over 5 years ($) $1,093 $1,076 $1,082
Present Value of Relief ($Millions) $35.8 $75.3 $111.1 Number of Loans* 30,175 64,611 94,786 Avg. present value of relief per loan over 5 years ($) $1,185 $1,166 $1,172
Note: For purposes of these illustrations, the present value (as of March 2010) of the undiscounted relief is calculated using the 20-year Treasury rate (as of Mar. 5, 2010) of 4.49 percent as the discount rate. Federal Reserve Statistical Release H.15, 20-year Treasury constant maturities (nominal), available at http://www.federalreserve.gov/releases/h15/data/Business_day/H15_TCMNOM_Y20.txt. For the 10-year and 30-year scenarios, in which most of the harm comes in the form of disparities in future interest payments, the present value is smaller than the undiscounted value. For the 5-year scenario, in which most of the harm comes in the form of disparities in past interest payments, the present value is higher than the undiscounted value. I use a 20-year Treasury rate as the discount rate illustratively here. With additional analysis, more precise discount rates could be utilized to estimate class-wide monetary damages. For example, I could use the 7-year Treasury rate as of the date of origination to estimate the present value of relief for a plaintiff whose loan was originated 7-years prior to the date that relief is paid.
76. As Table 9 shows, minorities suffered $495.5 million in harm over the full term of
their loans. The present value of this $495.5 million harm is $357.2 million. When measured
over five years, minorities suffered $102.5 million in (undiscounted) harm. African American
borrowers who are assigned monetary relief based on my methodology suffered an average of
$1,093 per loan (undiscounted) over five years, and Hispanic borrowers suffered an average of
$1,076 per loan (undiscounted).
77. The monetary relief for each individual Class member is easily ascertainable. My
methodology estimates the monetary relief for each individual Class member based on his or her
loan characteristics. For example, the undiscounted monetary relief under the 5-year scenario for
Case3:08-cv-00369-TEH Document181 Filed04/01/10 Page50 of 91
Smith 3319
-51-
named Plaintiff Salazar is $1,843. This relief of $1,834 is equal to the difference in Mr. Salazar’s
interest payments over the first five years of his loan, based on his loan amount ($475,000) and
fixed-rate amortization schedules using his actual APR (7.182 percent) and his but-for APR
when removing the effect of the disparate impact (7.106 percent—7.6 basis points lower than his
actual APR). The aggregate monetary relief shown in Table 9 is merely the sum of the effect of
the disparate impact on each Class member’s loan terms.
VIII. C ONCLUSION
78. In summary, Greenpoint maintains sufficient data concerning its loan applicants
to allow a statistical analysis to determine the effect of Defendant’s policies on borrowers by
race. By using these statistical methods, one can reliably estimate whether Greenpoint’s policies
had a disparate impact on minorities through higher cost loans than white borrowers with similar
risk characteristics as alleged in Plaintiffs’ Complaint. Finally, the statistical tests relevant to
estimating disparate impact and calculating aggregate and individual monetary relief can be
resolved on a class-wide basis common to the borrowers in the class. My analysis of Defendant’s
data shows that Greenpoint’s minority borrowers paid hundreds of millions of dollars more in
finance charges than its white borrowers with similar risk characteristics.
* * *
I declare under penalty of perjury under the laws of the United States of America that the
foregoing is true and correct.
Executed on March 15, 2010.
____________________________________
Howell E. Jackson
Case3:08-cv-00369-TEH Document181 Filed04/01/10 Page51 of 91
Smith 3320

-52-
APPENDIX 1: MATERIALS RELIED UPON
Pleadings:
First Amended Complaint, Case No. 3:08-cv-00369-TEH.
Deposition Testimony:
Deposition of Steve Abreu (Sep. 10, 2008). Deposition of J. Steven Gilcrest (Sep. 11, 2008). Deposition of Kevin Hughes (Dec. 3, 2008). Deposition of Burnett K. Jarvis (Dec. 9, 2008).
Court Cases:
Watson v. Fort Worth Bank & Trust, 487 U.S. 977 (1988). A.B. & S. Auto Service, Inc. v. South Shore Bank of Chicago, 962 F. Supp. 1056 (N.D. Ill. 1997) Lewis v. ACB Business Services, Inc., 135 F.3d 389 (6th Cir. 1998).
Congressional Testimony:
Predatory Mortgage Lending Pract ices: Abusive Uses of Yield Spread Premiums: Hearing Before the S. Comm. on Banking, Housing & Urban Affairs, 107th Cong. (2002) (statement of Howell E. Jackson, Finn M.W. Caspersen and Household International Professor of Law and Associate Dean for Research and Special Programs, Harvard Law School), available at http://banking.senate.gov/02_01hrg/010802/jackson.htm.
Ending Mortgage Abuse: S afeguarding Ho mebuyers: Heari ng Before the S ubcomm. on Housing, Transportation & Community Development of the S. Comm. on Banking, Housing, & Urban Affairs, 110th Cong. 10-11 (2007) (statement of John M. Robbins, CMB, Chairman of Mortgage Bankers Association, available at http://www.mbaa.org/files/Advocacy/2007/MBATestimony6262007EndingMortgageAbuse SafeguardingHomebuyers.pdf. Data
Federal Reserve Statistical Release H.15, 20-year Treasury constant maturities (nominal), available at http://www.federalreserve.gov/releases/h15/data/Business_day/H15_TCMNOM_Y20.txt.
GPM-E-01-000001 – GPM-E-01-000006. GPM-E-02-000001. GPM-E-01-000003 B. GPM-E-01-000006 B. Greenpoint Mortgage Funding, Inc., Data Dictionary for Data Produced on August 28, 2008.
Other Bates-Labeled Documents
Guide for Understanding Loan Program Codes (Bates No. GPM-14-000001 – GPM-14-000002). GPM-15-000001 – GPM-15-000808.
Letters, E-Mails, and Other Correspondences
Letter from Anand S. Raman, Skadden, Arps, Slate, Meagher & Flom LLP, to Gary Klein, Roddy Klein & Ryan (June 23, 2009).
Case3:08-cv-00369-TEH Document181 Filed04/01/10 Page52 of 91
Smith 3321

-53-
Letter from Anand S. Raman, Skadden, Arps, Slate, Meagher & Flom LLP, to Gary Klein, Roddy Klein & Ryan (July 7, 2009). Laws, Regulations, and Other Government Publications:
Regulation B (Equal Credit Opportunity), 12 C.F.R. § 202 et seq. (2009). Regulation C (Home Mortgage Disclosure), 12 C.F.R. § 203 et seq. (2009). Regulation Z (Truth in Lending), 12 C.F.R. § 226 et seq. (2009). Truth in Lending Act, 15 U.S.C. §1606 et seq. (2006). Fair Housing Act, 42 U.S.C. § 3601 et seq. Federal Financial Institutions Examination Council, A Guide to HMDA Reporting: Getting It Right! (2006
ed.), available at http://www.ffiec.gov/Hmda/pdf/2006guide.pdf. Federal Reserve System, Truth in Lending, 74 Fed. Reg. 43,232 (proposed Aug. 26, 2009) (to be codified
at 12 C.F.R. pt. 226). Books:
IAN AYRES, PERVASIVE PREJUDICE?: NON-TRADITIONAL EVIDENCE OF RACE & GENDER DISCRIMINATION
(University of Chicago Press 2002). News & Trade Articles
Anthony Garritano & Scott Kersnar, 25 Tech-Savvy Lenders, Mortgage Technology (Aug. 1, 2007) available at http://www.mortgage-technology.com/plus/archive/?id=156640.
Tom LaMalfa, Who’s Who in Wholesale 2005, MORTGAGE BANKING, Aug. 2006, at 74-83.
Academic Articles & Other Studies, Presentations:
Adam B. Ashcraft & Til Schuermann, Understanding the S ecuritization o f Su bprime Mo rtgage Cred it, Federal Reserve Bank of New York Staff Report No. 318 (Mar. 2008).
Robert B. Avery et al., Credit Risk, Credit Scoring, and the Performance of Home Mortgages, FED. RES. BULL., July 1996.
Robert B. Avery et al., New Inf ormation Rep orted U nder HMDA and It s Ap plication i n F air Lending Enforcement, FED. RES. BULL., Summer 2005.
Ian Ayres, Further Evidence of Discrimination in New Car Negotiations and Est imates of Its Cause, 94 MICHIGAN LAW REV. 109 (1995).
Ian Ayres, Market Power and Inequality: A Co mpetitive Conduct Standard for Assessing When Disparate Impacts a re Ju stified, 95 CAL. L. REV. 669 (2007), available at http://islandia.law.yale.edu/ayres/Market%20Failure%20and%20Inequality.doc.
Geetesh Bhardwaj & Rajdeep Sengupta, Did Prepayments Sustain the Subprime Market?, Federal Reserve Bank of St. Louis Working Paper 2008-039B (May 2009), available a t http://research.stlouisfed.org/wp/2008/2008-039.pdf.
David G. Blanchflower, Phillip B. Levine, & David J. Zimmerman, Discrimination in the Small Business Credit Market, 85 REV. ECON. & STAT. 930 (Nov. 2003).
Debbie Gruenstein Bocian, Keith S. Ernst, & Wei Li, Center for Responsible Lending, Unfair Lending: The Effect of Rac e & Ethnicity on the Pri ce of Subprime M ortgages (May 31, 2008), available at http://www.responsiblelending.org/mortgage-lending/research-analysis/rr011-Unfair_Lending-0506.pdf.
Charles A Calhoun & Yongheng Dung, A Dy namic Analysis of Fi xed- a nd A djustable-Rate M ortgage Terminations, 24 J. REAL ESTATE FIN. & ECON. 9 (2002).
Ken S. Cavalluzzo, Linda C. Cavalluzzo, & John D. Wolken, Competition, Small Business Financing, and Discrimination: Evidence from a New Survey, 75 J. BUS. 641 (2002).
Ken S. Cavalluzzo & John D. Wolken, Small B usiness L oan T urndowns, Pe rsonal We alth, & Discrimination, 78 J. BUS. 2153 (2005).
Case3:08-cv-00369-TEH Document181 Filed04/01/10 Page53 of 91
Smith 3322

-54-
Geraldo Cerqueiro, Hans Degryse, & Steven Ongena, Rules versus Discretion in Loan Rate Setting (Feb. 2008), available at http://www.ifw-kiel.de/konfer/staff-seminar/paper/folder.2008-02-22.4077567561/degryse.pdf.
Mark Chen & John A. Bargh, Nonconscious Beha vioral Co nfirmation Pro cesses: The S elf-Fulfilling Consequences of Automatic Stereotype Activation, 33 J. EXPERIMENTAL SOC. PSYCHOL. 541 (1997).
Mark A. Cohen, Imperfect Competition in Auto Lending: Subjective Markup, Racial Disparity, and Class Action Litigation (2008), available at http://works.bepress.com/mark_cohen/1.
Marsha J. Courchane, The Pricing of Home Mortgage Loans to Minority Borrowers: How Much of the APR Differential Can We Explain?, 29 J. REAL EST. RES. 399 (2007).
John F. Dovidio et al, Racial Stereotypes: The Cont ents of Thei r C ognitive Represe ntations, 22 J. EXPERIMENTAL SOC. PSYCHOL. 22 (1986).
Kathleen C. Engel & Patricia A. McCoy, Turning a Blind Eye: Wall Street Finance of Predatory Lending, 75 FORDHAM L. REV. 102 (2007).
Elaine Fortowsky & Michael LaCour-Little, Credit Scoring and Disparate Impact, Working Paper (Dec. 2001), available at http://fic.wharton.upenn.edu/fic/lacour.pdf.
Scott Frame, Andreas Lehnert, & Ned Prescott, A Snapshot of Mortgage Conditions with an Emphasis on Subprime Mort gage Pe rformance (Aug. 2008), available at http://federalreserveonline.org/pdf/MF_Knowledge_Snapshot-082708.pdf.
Lynn Gottschalk, Fair Le nding Mo deling of Pri cing D ecisions (Sept. 10, 2008), available at http://www.occ.treas.gov/flc/2008/Lynn%20Gottschalk.pdf.
Howell E. Jackson & Laurie Burlingame, Kickbacks or C ompensation: The C ase of Yi eld Sp read Premiums, 12 STANFORD J. L. BUS. & FIN. 289 (2007).
Joleen Kirschenman & Kathryn M. Neckerman, We'd Love to Hire Them But ... ! The Meaning of Race to Employers, in THE URBAN UNDERCLASS, eds. Christopher Jencks & Paul E. Peterson (The Brookings Institution 1991).
Michael LaCour-Little, The Pricing of Mortgages by Brokers: an Agency Problem?, 31 J. REAL EST. RES. 235 (2009).
Mortgage Bankers Association, Position Paper: Identifying Prepayment Speeds Used to Price Ginnie Mae Securities Backed by Pools of Certain Types of Loans, Mar. 20, 2008, available at http://www.mbaa.org/files/Advocacy/2008/MBAPositionPaperWidelyHeldFixedInvestmentTrusts(WHFITs).pdf.
Yolanda F. Niemann et al., Intergroup Sterotypes of Working Class Blacks and Whi tes: Implications for Stereotype Threat, 22 WESTERN J. BLACK STUD. 103 (1988).
Roberto G. Quercia, Michael A. Stegman, & Walter R. Davis, The Impact of Predatory Loan Terms on Subprime Foreclo sures: The Sp ecial Case of Prep ayment Pena lties and Ba lloon Pa yments, 18 HOUSING
POL’Y DEBATE 311 (2007). Lyn C. Thomas, A Survey of Credit and B ehavioural Scoring: Forecasting Financial Risk of Le nding to
Consumers, 16 INT’L J. FORECASTING 149 (2000). Margery Austin Turner & Felicity Skidmore, the Urban Institute, MORTGAGE LENDING DISCRIMINATION: A
REVIEW OF EXISTING EVIDENCE (1999). Eric J. Vanman et al., The Modem Face of Prejudice and Structural Features That Moderate the Effect of
Cooperation on Affect, 73 J. PERSONALITY & SOC. PSYCHOL. 941 (1997). Alan M. White, Risk-Based Mortgage Pricing: Present & Future Rese arch, 15 HOUSING POL’Y DEBATE
503 (2004). Alan M. White, Borrowing While Black: Applying Fair Lending Laws to Risk-Based Mortgage Pricing, 60
S. CAROLINA L. REV. 677 (2009). Susan E. Woodward, U.S. Department of Housing & Urban Development, A Study of Closing Costs for
FHA Mortgages (2008), available at http://www.huduser.org/Publications/pdf/FHA_closing_cost.pdf. Ararat Yesayan, Mortgage Pricing (June 4, 2009), available at http://ssrn.com/abstract=1414351. John Yinger, Evidence of Discrimination in Consumer Markets, 12 J. ECON PERSPECTIVES 23 (1998).
Other:
HUD-1 Settlement Statement for Ricky Norris (Aug. 9, 2007).
Case3:08-cv-00369-TEH Document181 Filed04/01/10 Page54 of 91
Smith 3323

-55-
Web sites:
Project Implicit, at https://implicit.harvard.edu/implicit/.
Case3:08-cv-00369-TEH Document181 Filed04/01/10 Page55 of 91
Smith 3324

-56-
APPENDIX 2: CURRICULUM VITAE OF HOWELL JACKSON
HOWELL E. JACKSON Griswold 510
Harvard Law School Cambridge, Massachusetts 02138
(617) 495-5466 fax: (617) 495-4299
[email protected] EMPLOYMENT 1989-present HARVARD LAW SCHOOL CAMBRIDGE, MA
Acting Dean, 2009 Vice Dean for Budget, 2003 to 2006 Associate Dean for Research and Research Programs, 2001-2003 James S. Reid Jr. Professor of Law, 2004 to present Finn. M.W. Caspersen and Household International Professor of Law, 1999 to 2004. Professor of Law, 1994-1999. Assistant Professor of Law, 1989-1994. Research interests include financial institutions, consumer protection, federal budget
policy, government accounting, social security and entitlement programs, securities regulation, international finance.
1987-1989 ARNOLD & PORTER WASHINGTON, DC Associate: Financial Institutions Practice Group. 1984-1986 CAPLIN & DRYSDALE, CHARTERED WASHINGTON, DC Associate: Corporate/Banking/Securities Group. 1983-1984 UNITED STATES SUPREME COURT WASHINGTON, DC Law Clerk to Associate Justice Thurgood Marshall. 1982-1983 UNITED STATES COURT OF APPEALS HARTFORD, CT FOR THE SECOND CIRCUIT Law Clerk to Judge Jon O. Newman. 1976-1978 NATIONAL COUNCIL FOR US-CHINA TRADE WASHINGTON, DC Escort Officer and Associate Editor China Business Review. ACADEMIC 1978-1982 HARVARD UNIVERSITY CAMBRIDGE, MA MBA & JD, magna cum laude. 1972-1976 BROWN UNIVERSITY PROVIDENCE, RI B.A., magna cum laude:
PROFESSIONAL ACTIVITIES Harvard University Financial Management Committee Trustee, CREF and Affiliated TIAA-CREF Mutual Funds. Senior Editor, Cambridge University Press Series on Int’l Corporate Law and
Financial Regulation Past Chair, AALS Sections on Securities Regulation and Financial Institutions.
Case3:08-cv-00369-TEH Document181 Filed04/01/10 Page56 of 91
Smith 3325

-57-
Member, Social Security Academic Advisory Board for NBER Retirement Research Program; National Academy of Social Insurance; and Bar of the District of Columbia.
Miscellaneous consulting projects for World Bank, International Monetary Fund, U.S. Treasury Department,
and various other foreign and domestic regulatory agencies.
SELECTED PUBLICATIONS
Howell E. Jackson & Avery T. Day, Current Issues in Federal Budgeting: Harvard Law School Briefing Papers on Federal Budget Policy (draft of Feb. 22, 2010) (briefing papers available at http://www.law.harvard.edu/faculty/hjackson/budget.php).
Howell E. Jackson, Loan-Level Disclosure in Securitization Transactions: A Problem with Three Dimensions (draft of Feb. 15, 2010).
John C. Campbell, Howell E. Jackson. Brigitte Madrian, and Peter Tufano, The Regulation of Consumer Finance, Journal of Economic Perspectives (forthcoming 2010).
Howell E. Jackson, Toward a New R egulatory Paradigm for the Trans-Atlantic Financial Market and Beyond: Legal and Economic Perspectives, EUROPEAN BUS. ORG. L. REV. (forthcoming 2010).
Matthew C. Stephenson & Howell E. Jackson, Lobbyists as Imperfect Agents: Implications for Public Policy in a Pluralist System 57 Harvard Journal of Legislation 1 (2010) (avail at http://papers.ssrn.com/sol3/papers.cfm?abstract_id=1331503).
Howell E. Jackson & Mark J. Roe, Public Enforcement of Securities Laws: Resource-Based Evidence, 93 Journal of Financial Economics 207 (2009)(avail at http://papers.ssrn.com/sol3/papers.cfm?abstract_id=1000086).
FISCAL CHALLENGES: AN INTERDISCIPLINARY APPROACH TO BUDGET POLICY (Elizabeth Garrett, Elizabeth Graddy, & Howell E. Jackson, eds.) (Cambridge University Press 2009) (paperback edition).
Howell E. Jackson, Learning from Eddy: A Meditation Upon Organizational Reform of Financi al Supervision, in PERSPECTIVES IN COMPANY LAW AND FINANCIAL REGULATION (Michel Tison, et al. eds.) (Cambridge University Press 2009) (avail. at http://papers.ssrn.com/sol3/papers.cfm?abstract_id=1325510).
Testimony of Howell E. Jackson Before the Senate Committee on Homeland Security and Government Affairs, Hearings on The Financial Crisis and the Breakdown of Financial Governance (Jan. 21, 2009).
Howell E. Jackson, A Pragmatic Approach to the Phased Consolidation of Financial Regulation in the United States (Nov. 12, 2008) (avail. at http://papers.ssrn.com/sol3/papers.cfm?abstract_id=1300431).
Howell E. Jackson & Eric Pan, Regulatory Competi tion in Interna tional Securities Mar kets: Evidenc e from Europe – Part II, 3 VA. L. & BUS. REV. 207 (2008).
Howell E. Jackson, Building a Better Bailout, CHRISTIAN SCIENCE MONITOR, Sept. 25, 2008.
Margaret E. Tayhar, Jaap Willeumier, Eric J. Pan, Howell E. Jackson, & Eilis Ferran, Final Report of the Securities Law Subcommittee of the Task Force on Extraterritorial Jurisdiction of the International B a r A ssociation (July 1, 2008) (avail. at http://papers.ssrn.com/sol3/papers.cfm?abstract_id=1109061).
Howell E. Jackson, The Impact of Enforcem ent: A Reflection , 156 U. PENN. L. REV. PENNumbra 400 (2008) (avail. at http://www.pennumbra.com/responses/02-2008/Jackson.pdf).
Howell E. Jackson, “The Trilateral Dilemma in Financial Regulation,” in IMPROVING THE
EFFECTIVESNESS OF FINANCIAL EDUCATION AND SAVINGS PROGRAMS (Anna Maria Lusardi, ed.)
Case3:08-cv-00369-TEH Document181 Filed04/01/10 Page57 of 91
Smith 3326

-58-
(University of Chicago Press 2008) (avail. at http://papers.ssrn.com/sol3/papers.cfm?abstract_id=1300419).
FISCAL CHALLENGES: AN INTERDISCIPLINARY APPROACH TO BUDGET POLICY (Elizabeth Garrett, Elizabeth Graddy, & Howell E. Jackson, eds.) (Cambridge University Press 2008).
Howell E. Jackson, “Counting the Ways: The Structure of Federal Spending,” in FISCAL CHALLENGES: AN INTERDISCIPLINARY APPROACH TO BUDGET POLICY (Elizabeth Garrett, Elizabeth Graddy, & Howell E. Jackson, eds.) (Cambridge University Press 2008) (avail. http://papers.ssrn.com/sol3/papers.cfm?abstract_id=985201).
Howell E. Jackson, Enlisting Market Mechanisms To Police the Origination of Home Mortgages (draft of Nov. 2007).
Stavros Gadinis & Howell E. Jackson, Markets as Regulators: A Survey , 80 S.C. L. REV. 1239 (2007) (previously avail. as John M. Olin Center Working Paper No. 579 (Oct. 6, 2006) at http://papers.ssrn.com/sol3/papers.cfm?abstract_id=960168).
Howell E. Jackson & Stacy A. Anderson, Can States Tax National Banks to Educate Consumers Abou t Predatory L ending Practices? , 30 HARV J. LAW & PUB. POL’Y 831 (2007) (avail. at http://www.law.harvard.edu/students/orgs/jlpp/Vol30_No3_Jacksononline.pdf ).
Howell E. Jackson & Laurie Burlingame, Kickbacks or Compensation: The Case of Yield Spread Premiums, 12 STAN. J. LAW, BUS. & FIN. 289 (2007).
Howell E. Jackson, Variation i n the Intensity of Financial Regulation: Preliminary Evidence and Potential Implications , 24 YALE J. REGULATION 253 (2007) (avail. at http://papers.ssrn.com/sol3/papers.cfm?abstract_id=839250).
Howell E. Jackson, A System of Selective Substitute Compliance , 48 HARV. INT’L L.J.105 (Winter 2007) (avail at http://www.harvardilj.org/attach.php?id=77).
Kern Alexander, Eilis Ferran, Howell Jackson & Niamh Moloney, Transatlantic Financ ial Services Regulatory Dialogue , 7 EUROPEAN BUS. ORGANIZATION LAW REV. 647 (2006) (avail. at http://papers.ssrn.com/sol3/papers.cfm?abstract_id=963381).
Howell E. Jackson, Regulatory Intensity in the Regulation of Capital Markets: A Preliminary Comparison of Canadian and U.S. Approaches (July 30, 2006) (Study Commissioned by the Task Force to Modernize Securities Legislation in Canada) (avail. at http://www.tfmsl.ca/docs/V6(2)%20Jackson.pdf).
Howell E. Jackson, Big Li ability: Social Security, Medicare, and Accounting , NEW REPUBLIC ONLINE
(July 12, 2006) (avail. at http://www.tnr.com/docprint.mhtml?i=w060710&s=jackson071206).
Howell E. Jackson, Mark Gurevich, & Andreas M, Fleckner, The Controver sy O ver the P lacement o f Remote Trading Screens from Foreign Exchanges in the United States, 1 CAPITAL MARKETS LAW J. 54 (2006). (avail. at http://papers.ssrn.com/sol3/papers.cfm?abstract_id=921435).
Howell E. Jackson, “Accounting for Social Security Benefits,” in BEHAVIORAL PUBLIC FINANCE (2006) (Edward J. McCaffery & Joel Slemrod, eds) (previously released as John M. Olin C e nter W o rking Paper No. 520)( available at http://papers.ssrn.com/sol3/papers.cfm?abstract_id=839246).
Howell E. Jackson, An American Perspective on the FSA: Politics, Goals & Regulatory Intensity, in REGULATORY REFORMS IN THE AGE OF FINANCIAL CONSOLIDATION: THE EMERGING MARKET
ECONOMY AND ADVANCED COUNTRIES 39 (2006) (Lee-Jay Cho & Joonkyung Kim, eds.)(avail. at http://www.kdi.re.kr/kdi_eng/database/report_read05.jsp?1=1&pub_no=00009931) (also avail. in draft at http://papers.ssrn.com/sol3/papers.cfm?abstract_id=839284).
Case3:08-cv-00369-TEH Document181 Filed04/01/10 Page58 of 91
Smith 3327

-59-
Howell E, Jackson, Commentary on The Supervisory Challenges of Financial Conglomerates in Korea, in REGULATORY REFORMS IN THE AGE OF FINANCIAL CONSOLIDATION: THE EMERGING MARKET
ECONOMY AND ADVANCED COUNTRIES 285(2006) (Lee-Jay Cho & Joonkyung Kim, eds.)
Contributor to National Academy of Social Insurance Study Panel Final Report on Uncharted Waters: Paying Benefits from Individual Accounts in Federal Retirement Policy (Jan. 2005) (Kenneth S. Apfel & Michael J. Graetz, co-chairs).
Howell E. Jackson, Consolidated “Capital Regulation for Financial Conglomerates,” in CAPITAL
ADEQUACY BEYOND BASEL: BANKING, SECURITIES AND INSURANCE, 123- 45 (2005, Hal S. Scott, ed.) (Oxford University Press).
Howell E. Jackson, The True Cost of Privatizing Social Security, TAX NOTES, Jan. 3, 2005, at 109.
Howell E. Jackson, Mind the Gap, TAX NOTES, Dec. 20, 2004, at 4.
HOWELL E. JACKSON, ACCOUNTING AND FINANCE (Foundation Press 2004).
Howell E. Jackson, Reply, 41 HARV. J. LEGIS. 221 (Winter 2004).
Howell E. Jackson, Accounting for Social Security and Its Reform, 41 HARV. J. LEGIS. 59 (Winter 2004).
HOWELL E. JACKSON, LOUIS KAPLOW, STEVEN SHAVELL, KIP VISCUSI, DAVID COPE, & HEATHER
MAHAR, TEACHERS’ MANUAL FOR ANALYTICAL METHODS FOR LAWYERS (2004).
Howell E. Jackson, To What Extent Shoul d We Rely on the Mechanisms of Market Efficiency: A Preliminary Investigation of Dispersion in Individual Investor Returns, 28 J. CORP. 671 (Summer 2003).
Howell E. Jackson, Analytical Methods for Lawyers, 53 J. LEGAL EDUCATION 321 (Sept. 2003).
Howell E. Jackson, It’s Even Worse than You Think, N.Y. TIMES, Oct. 9, 2003, at A35.
HOWELL E. JACKSON, LOUIS KAPLOW, STEVEN SHAVELL, KIP VISCUSI, & DAVID COPE, ANALYTICAL
METHODS FOR LAWYERS (2003) (Foundation Press).
Howell E. Jackson, Centralization, Competition, and Pr ivatization i n Financial Regulation, 2 THEORETICAL INQUIRIES IN LAW 649 (2001).
Howell E. Jackson, The Role of Rating Agencies in the Establishment of Capital Standards for Financial Institutions i n a Global Economy, in THE CHALLENGES FACING FINANCIAL REGULATION 311 (2001) (Eilis Ferran & Charles A.E. Goodhart, eds) (available at http://papers.ssrn.com/sol3/papers.cfm?abstract_id=250166&high=%20Howell%20Jackson).
Howell E. Jackson, Could We Invest the Surplus?, 90 TAX NOTES 1245 (Feb. 26, 2001).
Howell E. Jackson & Eric Pan, Regulatory Competi tion in Interna tional Securities Mar kets: Evidenc e from Europe in 1999 – Part I, 56 BUS. LAW. 653 (2001).
Howell E. Jackson, Regulation of a Multisectored Financial Services Industry: An Exploratory Essay, 77 WASH. U. L.Q. 319 (1999) (avail. at http://papers.ssrn.com/sol3/papers.cfm?abstract_id=166651).
HOWELL E. JACKSON & EDWARD L. SYMONS, THE REGULATION OF FINANCIAL INSTITUTIONS: CASES
AND MATERIALS (1999) (West Publications).
HOWELL E. JACKSON & EDWARD L. SYMONS, THE REGULATION OF FINANCIAL INSTITUTIONS: SELECTED
STATUTES, REGULATIONS AND FORMS (1999) (West Publications).
Howell E. Jackson, Selective Incorp oration of Foreign Legal Systems to Promote Nepal as a n International Financial Services Center in REGULATION AND DEREGULATION: POLICY AND PRACTICE IN
THE UTILITIES AND FINANCIAL SERVICES INDUSTRY (1999)(Christopher McCrudden, ed.) (Clarendon Press, Oxford).
Case3:08-cv-00369-TEH Document181 Filed04/01/10 Page59 of 91
Smith 3328

-60-
Howell E. Jackson. Regulatory Prob lems in Privatizing S ocial Security , in FRAMING THE SOCIAL
SECURITY DEBATE: VALUES, POLITICS AND ECONOMICS (1999) (Brookings Institute).
Howell E. Jackson. Entry on the Regulation of Financial Holding Companies, The New Palgrave for Law & Economics (1998).
Howell E. Jackson, Fees and the Investment Company Industry: An Analysis of Current Developments , in ALI-ABA MATERIALS FOR ADVANCE COURSE ON INVESTMENT MANAGEMENT (October 1996).
Howell E. Jackson, The Securitization of Financial Assets: An Introductory Essay (Nov. 14, 1994) (working paper).
Howell E. Jackson, The Expanding Obligations of Financial Ho lding Companies, 107 HARVARD LAW
REV. 507 (January 1994).
Howell E. Jackson, Note on Double Liability of Bank Sharehol ders: A Response to Macey a nd Miller, 28 WAKE FOREST LAW REV. 919 (December 1993).
Howell E. Jackson, The Superior Performance of Savings and Loan Associations with Substanti al Holding Companies, 22 J. LEGAL STUDIES 405 (June 1993).
Howell E. Jackson, Reflections Upon Kaye, Scholer: Enlisting Lawyers to I mprove the Regulation of Financial Institutions, 66 SOUTHERN CALIFORNIA LAW REV. 1019 (1993)
Howell E. Jackson, Commentary on Helen A. Garten, W hatever Happened to M arket Discipline of Banks?, 1991 NYU ANNUAL SURVEY OF AMERICAN LAW 801 (1992).
Howell E. Jackson, Commentary on Mark J. Flannery, Government Risk-Bearing in the Financial Sector of a Ca pitalist Economy , in GOVERNMENT RISK-BEARING: PROCEEDINGS OF A CONFERENCE HELT AT
THE FEDERAL RESERVE BANK OF CLEVELAND, MAY 1991 (Mark. S. Sniderman, ed. 1993).
Case3:08-cv-00369-TEH Document181 Filed04/01/10 Page60 of 91
Smith 3329

-61-
APPENDIX 3: CASES IN WHICH HOWELL JACKSON HAS TESTIFIED AT DEPOSITION OR TRIAL IN THE LAST FOUR YEARS
None.
Case3:08-cv-00369-TEH Document181 Filed04/01/10 Page61 of 91
Smith 3330

-62-
APPENDIX 4: SUMMARY STATISTICS OF VARIABLES IN GREENPOINT’S LOAN DATABASE, 2004-2007
Variable Obs Mean Std. Dev. Min Max APR 372,186 6.7886 1.8038 2.3820 19.0790 Note rate 355,278 5.7241 2.5376 1.0000 18.0000 Total broker compensation ($) 304,673 $5,142 $4,312 -$885 $101,574 Total broker compensation (points) 304,673 1.9823 1.1542 -0.1362 15.6818 Race
American Indian 372,221 0.4% 6.4% 0% 100% Asian 372,221 8.5% 27.8% 0% 100% Black 372,221 8.1% 27.3% 0% 100% Hawaiian 372,221 0.9% 9.2% 0% 100% Hispanic 372,221 17.4% 37.9% 0% 100% Missing 372,221 8.3% 27.6% 0% 100% White 372,221 56.5% 49.6% 0% 100%
Credit score 371,447 715.59 43.05 443 830 Missing credit score 372,221 0.2% 4.6% 0% 100% Credit score < 600 372,221 0.1% 3.1% 0% 100% 600 ≤ Credit score < 620 372,221 0.1% 3.6% 0% 100% 620 ≤ Credit score < 640 372,221 2.2% 14.6% 0% 100% 640 ≤ Credit score < 660 372,221 6.5% 24.6% 0% 100% 660 ≤ Credit score < 680 372,221 13.0% 33.6% 0% 100% 680 ≤ Credit score < 700 372,221 16.7% 37.3% 0% 100% 700 ≤ Credit score < 720 372,221 17.1% 37.7% 0% 100% 720 ≤ Credit score < 740 372,221 13.8% 34.4% 0% 100% Credit score ≥ 740 372,221 30.4% 46.0% 0% 100%
Loan amount ($000) 372,221 272.5 203.7 7.0 4,950.0 Loan amount < $40K 372,221 5.4% 22.5% 0% 100% $40K ≤ Loan amount < $50K 372,221 1.6% 12.6% 0% 100% $50K ≤ Loan amount < $75K 372,221 4.7% 21.3% 0% 100% $75K ≤ Loan amount < $150K 372,221 18.3% 38.7% 0% 100% $150K ≤ Loan amount < $200K 372,221 12.4% 32.9% 0% 100% $200K ≤ Loan amount < $300K 372,221 21.3% 41.0% 0% 100% $300K ≤ Loan amount < $500K 372,221 24.6% 43.0% 0% 100% Loan amount ≥ $500K 372,221 11.7% 32.1% 0% 100%
Lien Status First lien 372,221 91.5% 27.8% 0% 100% Subordinate lien 372,221 8.5% 27.8% 0% 100%
Total debt ratio (%) 353,123 34.9 8.0 0.23 291.79 No total debt ratio 372,221 5.1% 22.1% 0% 100% Total debt ratio ≤ 40% 372,221 74.2% 43.8% 0% 100% 40% < total debt ratio ≤ 45% 372,221 14.9% 35.6% 0% 100% Total debt ratio > 45% 372,221 5.8% 23.3% 0% 100% Total debt ratio > 36% 372,221 47.4% 49.9% 0% 100%
Housing debt ratio (%) 351,055 24.0 9.5 0.00 295.62 No housing debt ratio 372,221 5.7% 23.2% 0% 100% Housing debt ratio ≤ 28% 372,221 61.2% 48.7% 0% 100% 28% < housing debt ratio ≤ 33% 372,221 16.0% 36.6% 0% 100% 33% < housing debt ratio ≤ 40% 372,221 13.4% 34.0% 0% 100%
Case3:08-cv-00369-TEH Document181 Filed04/01/10 Page62 of 91
Smith 3331
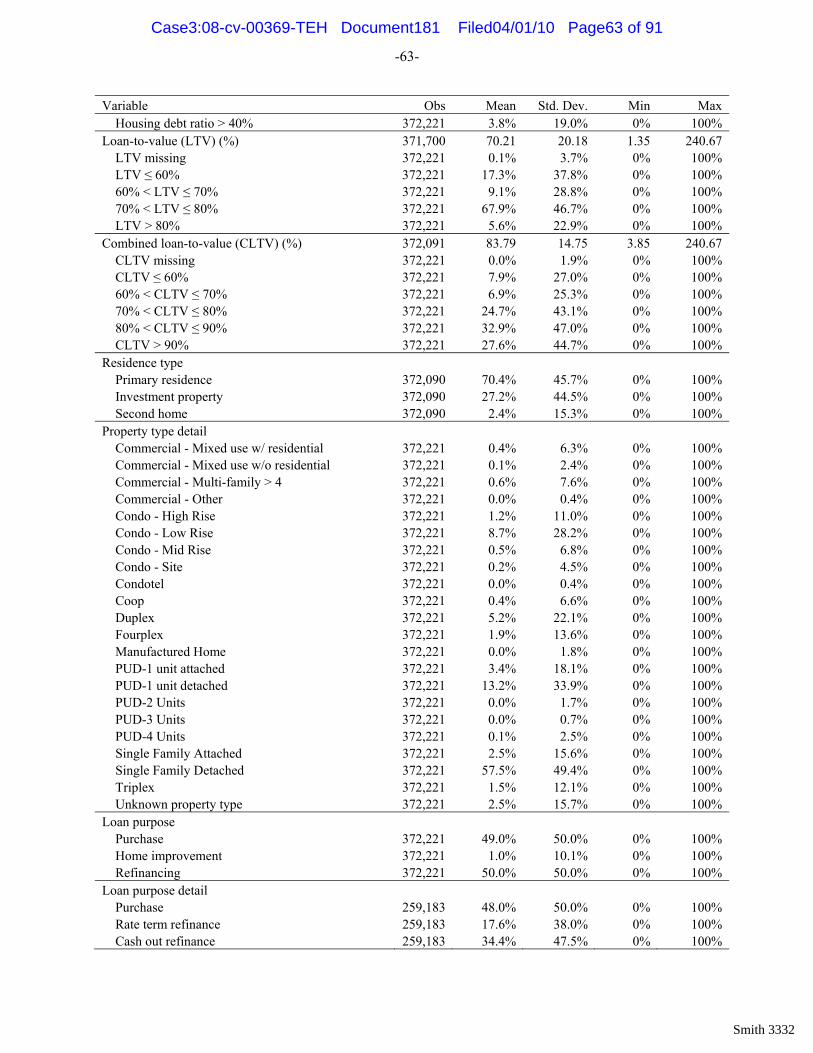
-63-
Variable Obs Mean Std. Dev. Min Max Housing debt ratio > 40% 372,221 3.8% 19.0% 0% 100%
Loan-to-value (LTV) (%) 371,700 70.21 20.18 1.35 240.67 LTV missing 372,221 0.1% 3.7% 0% 100% LTV ≤ 60% 372,221 17.3% 37.8% 0% 100% 60% < LTV ≤ 70% 372,221 9.1% 28.8% 0% 100% 70% < LTV ≤ 80% 372,221 67.9% 46.7% 0% 100% LTV > 80% 372,221 5.6% 22.9% 0% 100%
Combined loan-to-value (CLTV) (%) 372,091 83.79 14.75 3.85 240.67 CLTV missing 372,221 0.0% 1.9% 0% 100% CLTV ≤ 60% 372,221 7.9% 27.0% 0% 100% 60% < CLTV ≤ 70% 372,221 6.9% 25.3% 0% 100% 70% < CLTV ≤ 80% 372,221 24.7% 43.1% 0% 100% 80% < CLTV ≤ 90% 372,221 32.9% 47.0% 0% 100% CLTV > 90% 372,221 27.6% 44.7% 0% 100%
Residence type Primary residence 372,090 70.4% 45.7% 0% 100% Investment property 372,090 27.2% 44.5% 0% 100% Second home 372,090 2.4% 15.3% 0% 100%
Property type detail Commercial - Mixed use w/ residential 372,221 0.4% 6.3% 0% 100% Commercial - Mixed use w/o residential 372,221 0.1% 2.4% 0% 100% Commercial - Multi-family > 4 372,221 0.6% 7.6% 0% 100% Commercial - Other 372,221 0.0% 0.4% 0% 100% Condo - High Rise 372,221 1.2% 11.0% 0% 100% Condo - Low Rise 372,221 8.7% 28.2% 0% 100% Condo - Mid Rise 372,221 0.5% 6.8% 0% 100% Condo - Site 372,221 0.2% 4.5% 0% 100% Condotel 372,221 0.0% 0.4% 0% 100% Coop 372,221 0.4% 6.6% 0% 100% Duplex 372,221 5.2% 22.1% 0% 100% Fourplex 372,221 1.9% 13.6% 0% 100% Manufactured Home 372,221 0.0% 1.8% 0% 100% PUD-1 unit attached 372,221 3.4% 18.1% 0% 100% PUD-1 unit detached 372,221 13.2% 33.9% 0% 100% PUD-2 Units 372,221 0.0% 1.7% 0% 100% PUD-3 Units 372,221 0.0% 0.7% 0% 100% PUD-4 Units 372,221 0.1% 2.5% 0% 100% Single Family Attached 372,221 2.5% 15.6% 0% 100% Single Family Detached 372,221 57.5% 49.4% 0% 100% Triplex 372,221 1.5% 12.1% 0% 100% Unknown property type 372,221 2.5% 15.7% 0% 100%
Loan purpose Purchase 372,221 49.0% 50.0% 0% 100% Home improvement 372,221 1.0% 10.1% 0% 100% Refinancing 372,221 50.0% 50.0% 0% 100%
Loan purpose detail Purchase 259,183 48.0% 50.0% 0% 100% Rate term refinance 259,183 17.6% 38.0% 0% 100% Cash out refinance 259,183 34.4% 47.5% 0% 100%
Case3:08-cv-00369-TEH Document181 Filed04/01/10 Page63 of 91
Smith 3332
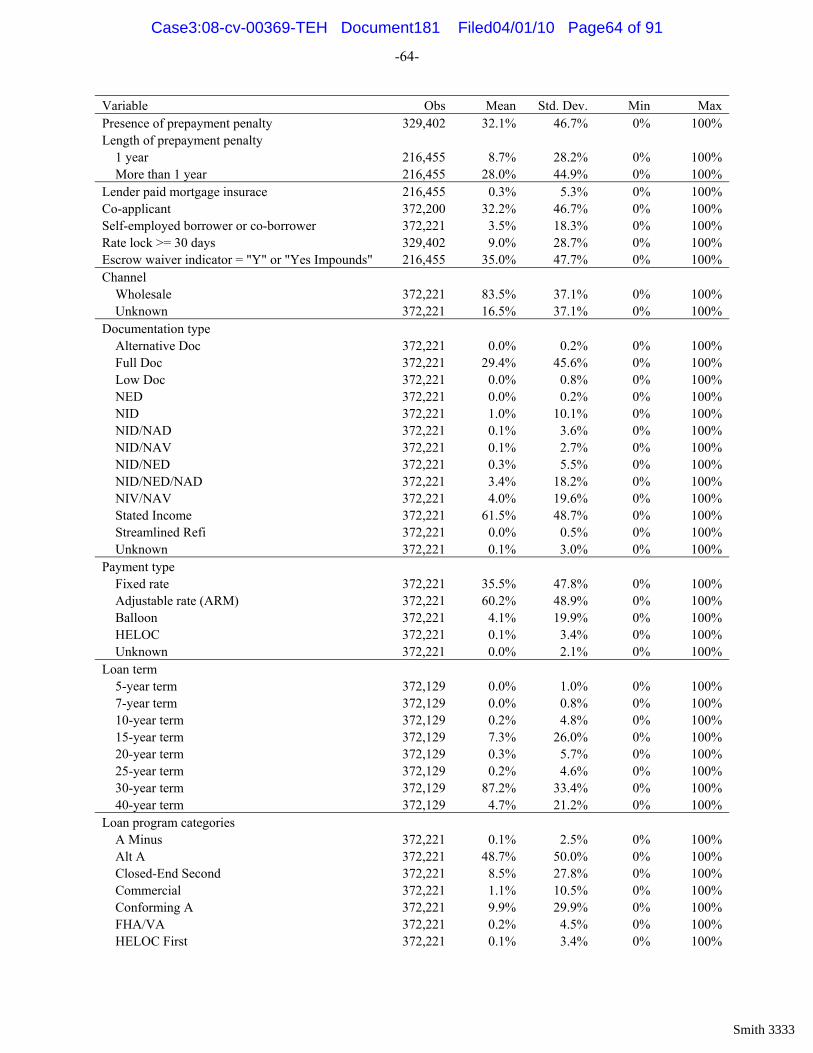
-64-
Variable Obs Mean Std. Dev. Min Max Presence of prepayment penalty 329,402 32.1% 46.7% 0% 100% Length of prepayment penalty
1 year 216,455 8.7% 28.2% 0% 100% More than 1 year 216,455 28.0% 44.9% 0% 100%
Lender paid mortgage insurace 216,455 0.3% 5.3% 0% 100% Co-applicant 372,200 32.2% 46.7% 0% 100% Self-employed borrower or co-borrower 372,221 3.5% 18.3% 0% 100% Rate lock >= 30 days 329,402 9.0% 28.7% 0% 100% Escrow waiver indicator = "Y" or "Yes Impounds" 216,455 35.0% 47.7% 0% 100% Channel
Wholesale 372,221 83.5% 37.1% 0% 100% Unknown 372,221 16.5% 37.1% 0% 100%
Documentation type Alternative Doc 372,221 0.0% 0.2% 0% 100% Full Doc 372,221 29.4% 45.6% 0% 100% Low Doc 372,221 0.0% 0.8% 0% 100% NED 372,221 0.0% 0.2% 0% 100% NID 372,221 1.0% 10.1% 0% 100% NID/NAD 372,221 0.1% 3.6% 0% 100% NID/NAV 372,221 0.1% 2.7% 0% 100% NID/NED 372,221 0.3% 5.5% 0% 100% NID/NED/NAD 372,221 3.4% 18.2% 0% 100% NIV/NAV 372,221 4.0% 19.6% 0% 100% Stated Income 372,221 61.5% 48.7% 0% 100% Streamlined Refi 372,221 0.0% 0.5% 0% 100% Unknown 372,221 0.1% 3.0% 0% 100%
Payment type Fixed rate 372,221 35.5% 47.8% 0% 100% Adjustable rate (ARM) 372,221 60.2% 48.9% 0% 100% Balloon 372,221 4.1% 19.9% 0% 100% HELOC 372,221 0.1% 3.4% 0% 100% Unknown 372,221 0.0% 2.1% 0% 100%
Loan term 5-year term 372,129 0.0% 1.0% 0% 100% 7-year term 372,129 0.0% 0.8% 0% 100% 10-year term 372,129 0.2% 4.8% 0% 100% 15-year term 372,129 7.3% 26.0% 0% 100% 20-year term 372,129 0.3% 5.7% 0% 100% 25-year term 372,129 0.2% 4.6% 0% 100% 30-year term 372,129 87.2% 33.4% 0% 100% 40-year term 372,129 4.7% 21.2% 0% 100%
Loan program categories A Minus 372,221 0.1% 2.5% 0% 100% Alt A 372,221 48.7% 50.0% 0% 100% Closed-End Second 372,221 8.5% 27.8% 0% 100% Commercial 372,221 1.1% 10.5% 0% 100% Conforming A 372,221 9.9% 29.9% 0% 100% FHA/VA 372,221 0.2% 4.5% 0% 100% HELOC First 372,221 0.1% 3.4% 0% 100%
Case3:08-cv-00369-TEH Document181 Filed04/01/10 Page64 of 91
Smith 3333

-65-
Variable Obs Mean Std. Dev. Min Max Jumbo A 372,221 31.3% 46.4% 0% 100% Unknown 372,221 0.1% 3.7% 0% 100%
Loan terms ARM (unknown term) 372,221 0.1% 3.9% 0% 100% ARM 10YR/1YR 372,221 0.0% 1.0% 0% 100% ARM 10YR/6MO 372,221 0.5% 7.0% 0% 100% ARM 1MO/1MO 372,221 1.3% 11.2% 0% 100% ARM 1MO/1YR 372,221 16.1% 36.8% 0% 100% ARM 1MO/2YR 372,221 0.2% 4.1% 0% 100% ARM 1MO/3YR 372,221 0.3% 5.6% 0% 100% ARM 1MO/5YR 372,221 0.4% 6.2% 0% 100% ARM 1YR/10YR 372,221 0.0% 0.2% 0% 100% ARM 1YR/1MO 372,221 0.0% 2.1% 0% 100% ARM 1YR/1YR 372,221 0.8% 8.9% 0% 100% ARM 1YR/25YR 372,221 0.0% 0.2% 0% 100% ARM 1YR/30YR 372,221 0.0% 1.4% 0% 100% ARM 2YR/1MO 372,221 0.0% 0.2% 0% 100% ARM 2YR/6MO 372,221 1.0% 9.7% 0% 100% ARM 3MO/1YR 372,221 1.2% 10.7% 0% 100% ARM 3MO/2YR 372,221 0.0% 1.1% 0% 100% ARM 3MO/3YR 372,221 0.0% 1.0% 0% 100% ARM 3MO/5YR 372,221 0.0% 0.9% 0% 100% ARM 3YR/10YR 372,221 0.0% 0.2% 0% 100% ARM 3YR/15YR 372,221 0.0% 0.8% 0% 100% ARM 3YR/1MO 372,221 0.0% 0.2% 0% 100% ARM 3YR/1YR 372,221 0.2% 4.6% 0% 100% ARM 3YR/20YR 372,221 0.0% 1.0% 0% 100% ARM 3YR/25YR 372,221 0.1% 3.3% 0% 100% ARM 3YR/30YR 372,221 0.1% 3.5% 0% 100% ARM 3YR/6MO 372,221 17.0% 37.5% 0% 100% ARM 4YR/1YR 372,221 0.0% 1.5% 0% 100% ARM 5YR/10YR 372,221 0.0% 0.4% 0% 100% ARM 5YR/15YR 372,221 0.0% 0.9% 0% 100% ARM 5YR/1MO 372,221 0.0% 0.3% 0% 100% ARM 5YR/1YR 372,221 0.7% 8.2% 0% 100% ARM 5YR/20YR 372,221 0.0% 1.1% 0% 100% ARM 5YR/25YR 372,221 0.1% 2.9% 0% 100% ARM 5YR/30YR 372,221 0.2% 4.8% 0% 100% ARM 5YR/6MO 372,221 12.9% 33.6% 0% 100% ARM 6MO/6MO 372,221 6.1% 23.9% 0% 100% ARM 6YR/1YR 372,221 0.0% 1.1% 0% 100% ARM 7YR/1YR 372,221 0.2% 4.3% 0% 100% ARM 7YR/6MO 372,221 0.7% 8.2% 0% 100% Balloon (unknown term) 372,221 0.0% 0.2% 0% 100% 20/10 Balloon 372,221 0.0% 0.3% 0% 100% 25/10 Balloon 372,221 0.0% 0.5% 0% 100% 25/15 Balloon 372,221 0.0% 0.3% 0% 100% 30/10 Balloon 372,221 0.2% 4.2% 0% 100% 30/15 Balloon 372,221 3.7% 18.8% 0% 100%
Case3:08-cv-00369-TEH Document181 Filed04/01/10 Page65 of 91
Smith 3334

-66-
Variable Obs Mean Std. Dev. Min Max 40/10 Balloon 372,221 0.0% 0.6% 0% 100% 40/15 Balloon 372,221 0.0% 1.4% 0% 100% 40/30 Balloon 372,221 0.3% 5.0% 0% 100% 5/25 Balloon 372,221 0.0% 1.0% 0% 100% 7/23 Balloon 372,221 0.0% 0.8% 0% 100% 5-year fixed 372,221 0.0% 0.2% 0% 100% 10-year fixed 372,221 0.0% 2.2% 0% 100% 15-year fixed 372,221 3.5% 18.3% 0% 100% 20-year fixed 372,221 0.3% 5.5% 0% 100% 30-year fixed 372,221 31.6% 46.5% 0% 100% 40-year fixed 372,221 0.1% 3.1% 0% 100% HELOC 372,221 0.1% 3.4% 0% 100% Unknown 372,221 0.0% 2.1% 0% 100%
Alternate race classification 1 American Indian, non-Hispanic 372,221 0.4% 6.4% 0% 100% American Indian, Hispanic 372,221 0.5% 7.3% 0% 100% Asian, non-Hispanic 372,221 8.5% 27.8% 0% 100% Asian, Hispanic 372,221 0.2% 4.3% 0% 100% Black, non-Hispanic 372,221 7.9% 27.0% 0% 100% Black, Hispanic 372,221 0.2% 4.7% 0% 100% Hawaiian, non-Hispanic 372,221 0.9% 9.2% 0% 100% Hawaiian, Hispanic 372,221 0.2% 4.2% 0% 100% Missing, non-Hispanic 372,221 8.3% 27.6% 0% 100% Missing, Hispanic 372,221 1.0% 9.8% 0% 100% White, non-Hispanic 372,221 56.5% 49.6% 0% 100% White, Hispanic 372,221 15.5% 36.2% 0% 100%
Alternate race classification: allow single loan to take multiple dummies
American Indian 372,221 1.0% 9.9% 0% 100% Asian 372,221 8.7% 28.2% 0% 100% Black 372,221 8.1% 27.3% 0% 100% Hawaiian 372,221 1.1% 10.4% 0% 100% Hispanic 372,221 17.6% 38.1% 0% 100% Missing 372,221 8.3% 27.6% 0% 100% White 372,221 72.8% 44.5% 0% 100%
Note: I make the following assumptions and changes to the original data provided to Plaintiffs:
I exclude the 28,844 loans in the data identified as retail or correspondent loans. The origination channel (wholesale, retail, correspondent, or unknown) is determined based on the Letter from Anand S. Raman, Skadden, Arps, Slate, Meagher & Flom LLP, to Gary Klein, Roddy Klein & Ryan (June 23, 2009).
45 unique loan application numbers have two observations in the database, each in a different year. All other unique loan application numbers have one observation in the database. In cases with multiple loan application numbers, I use the loan data from the record for the later year.
For loans originated before 2005 with no data on the rate lock date, or loans originated in 2005 or later with no data for the action date or rate lock date (113,921 loans), I assume that the rate lock date is equal to the application date plus the mean difference between the application date and the rate lock date for those loans with data for both dates. For the loans originated in 2005 or later with no data for the rate lock date (1,021 loans), I use the action (origination) date as the rate lock date because those loans did not have a rate lock until closing, per the Letter from Anand S. Raman, Skadden, Arps, Slate, Meagher & Flom LLP, to Gary Klein, Roddy Klein & Ryan (June 23, 2009).
Case3:08-cv-00369-TEH Document181 Filed04/01/10 Page66 of 91
Smith 3335

-67-
I replace the note rates for 23 loans with values less than 1% with missing values. For the 22 loans with no lien status, I assume that the loans are first-lien loans. None of these 22 loans has
APR data present, so they are excluded from my regression and monetary relief calculations. I assume a missing credit score for the 359 loans in the database with credit scores equal to zero or
otherwise outside the typical FICO credit score range of 300 to 850. I set the values of the housing debt ratio (1,253 loans), and total debt ratio (391 loans) to missing if the
values in the database are less than or equal to zero or if they are greater than 300%. Program codes are categorized into broader variables of loan term structure based on the program code
description field, the code definitions set forth in the Letter from Anand S. Raman, Skadden, Arps, Slate, Meagher & Flom LLP, to Gary Klein, Roddy Klein & Ryan (June 23, 2009), the “Fixed or adjustable rate” field, the “Length of fixed rate period (ARMs)” field, and the “Length of reset period (ARMs)” field.
Total broker compensation is calculated only for wholesale loans, and is equal to the sum of: o “801 origination fee to broker” o the absolute value of “802 discount/yield spread premium” if that field is negative (if the field is
negative, it represents yield spread premium; if it is positive, it represents discount points paid by the borrower to Greenpoint to lower the rate, and is excluded from total broker compensation)
o “807 recovery fees” o “808 other broker fees” o “814 process/admin fee to broker” o “821 broker points”
The modifications to values in the original data described in this list of assumptions (besides the exclusion of correspondent loans, retail loans, or multiple observations for single loan application numbers) affect a total of 114,968 loans in the 2004-2007 data sample. Most of these changes are due to missing rate lock dates.
Case3:08-cv-00369-TEH Document181 Filed04/01/10 Page67 of 91
Smith 3336

Model (1) Model (2) Model (3) Model (4) Model (5) Model (6) Model (7) Model (8) Model (9) Model (10) Model (11) Model (12) Model (13) Model (14) Model (15) Model (16) Model (17) Model (18)
Dependent variable: APR (basis points)Race
dummies only
Race, rate lock month & subordinate
lien dummiesSame as (2), add
FICO bin dummies
Same as (3), add risk-based
characteristics
Same as (2), use rate lock week
dummies in place of rate lock month
dummies
Add various explanatory
variables
Interact residence type & property
type
Interact LTV x 1st lien, CLTV
x sub. lien
Add HELOC dummy
Omit HELOC loans from
sample
Add documentation
type Add MSA
Same as Model (4), substitute broader loan amortization types for
loan programs
Same as Model (4), add housing debt
ratio dummies
Same as Model (4), substitute
total debt ratio > 36% dummy
Same as Model (4), add program category dummies
Same as Model (4), add unknown
business channel dummy
Same as Model (4), add program category &
unknown business channel dummies
Race: African American 69.53*** 27.08*** 22.40*** 9.44*** 27.09*** 9.82*** 9.67*** 10.45*** 10.47*** 10.47*** 11.81*** 11.71*** 12.10*** 9.20*** 9.41*** 8.53*** 8.23*** 8.03***(1.11) (0.58) (0.58) (0.44) (0.58) (0.51) (0.51) (0.51) (0.51) (0.51) (0.49) (0.50) (0.48) (0.44) (0.44) (0.43) (0.43) (0.43)
Race: Hispanic 56.49*** 8.35*** 6.52*** 7.64*** 8.34*** 11.87*** 11.64*** 12.05*** 12.09*** 12.10*** 7.59*** 7.27*** 8.66*** 6.90*** 7.48*** 7.29*** 6.97*** 6.97***(0.79) (0.39) (0.38) (0.32) (0.39) (0.35) (0.35) (0.35) (0.35) (0.35) (0.34) (0.35) (0.34) (0.32) (0.32) (0.31) (0.31) (0.31)
Race: American Indian 18.34*** -17.65*** -36.12*** -5.83*** -17.59*** -5.04** -5.21** -5.03** -4.98** -4.91** -3.03 -2.95 -5.27** -5.75*** -5.48*** -4.13** -5.65*** -4.70**(3.91) (2.33) (2.66) (2.02) (2.32) (2.49) (2.48) (2.45) (2.45) (2.45) (2.37) (2.37) (2.27) (2.01) (2.02) (1.96) (1.96) (1.92)
Race: Asian 8.98*** -3.33*** -1.95*** 2.61*** -3.32*** 6.61*** 6.54*** 6.13*** 6.21*** 6.24*** 2.99*** 3.67*** 3.05*** 2.31*** 2.51*** 2.86*** 3.18*** 3.07***(1.01) (0.49) (0.49) (0.39) (0.49) (0.44) (0.44) (0.44) (0.44) (0.44) (0.43) (0.44) (0.42) (0.39) (0.39) (0.38) (0.38) (0.38)
Race: Hawaiian 27.67*** -1.09 -1.90 4.36*** -1.09 5.71*** 5.60*** 6.11*** 6.17*** 6.18*** 3.76*** 4.82*** 6.46*** 4.12*** 4.29*** 4.47*** 3.95*** 4.24***(3.06) (1.33) (1.32) (1.08) (1.33) (1.19) (1.19) (1.18) (1.18) (1.18) (1.14) (1.15) (1.15) (1.08) (1.08) (1.05) (1.06) (1.05)
Race: Missing 26.39*** 9.25*** 7.62*** 4.08*** 9.15*** 1.82*** 1.52*** 1.79*** 1.87*** 1.78*** 1.62*** 1.65*** 3.21*** 3.89*** 4.01*** 4.04*** 3.95*** 3.96***(1.12) (0.62) (0.61) (0.42) (0.62) (0.51) (0.51) (0.51) (0.51) (0.51) (0.49) (0.49) (0.47) (0.42) (0.42) (0.41) (0.41) (0.40)
Subordinate lien 353.91*** 353.21*** 235.06*** 353.77*** 313.12*** 313.50*** 230.20*** 230.53*** 230.56*** 230.17*** 232.98*** 219.65*** 234.73*** 235.27*** 223.28***(0.71) (0.70) (1.23) (0.71) (1.15) (1.14) (1.33) (1.33) (1.33) (1.27) (1.29) (1.27) (1.23) (1.23) (1.21)
Missing FICO 75.58*** 64.49*** 62.03*** 61.86*** 58.05*** 58.22*** 58.05*** 66.69*** 66.90*** 71.38*** 65.03*** 64.42*** 55.29*** 62.18*** 54.22***(4.18) (4.37) (4.62) (4.64) (4.57) (4.57) (4.57) (5.05) (5.05) (4.61) (4.36) (4.36) (4.22) (4.24) (4.14)
300 <= FICO < 600 121.38*** 113.47*** 127.29*** 127.61*** 126.67*** 126.75*** 126.81*** 133.12*** 131.80*** 128.51*** 114.11*** 113.11*** 49.21*** 103.33*** 44.97***(8.81) (6.93) (7.70) (7.80) (7.70) (7.70) (7.69) (8.02) (8.02) (7.60) (6.91) (6.87) (4.89) (6.52) (4.86)
600 <= FICO < 620 132.00*** 87.81*** 97.07*** 96.78*** 96.79*** 96.72*** 97.62*** 97.21*** 97.75*** 99.82*** 88.15*** 87.18*** 49.19*** 81.98*** 47.18***(6.79) (4.90) (5.63) (5.63) (5.56) (5.58) (5.58) (5.70) (5.68) (5.38) (4.89) (4.89) (3.98) (4.69) (3.97)
620 <= FICO < 640 44.71*** 40.29*** 47.19*** 47.19*** 47.14*** 47.23*** 47.29*** 54.94*** 54.42*** 50.00*** 40.68*** 39.88*** 31.76*** 40.43*** 30.45***(1.23) (0.91) (1.05) (1.05) (1.05) (1.05) (1.05) (1.00) (1.00) (0.97) (0.91) (0.91) (0.85) (0.86) (0.85)
640 <= FICO < 660 42.98*** 38.08*** 45.51*** 45.44*** 45.26*** 45.32*** 45.35*** 47.19*** 46.60*** 44.98*** 38.40*** 37.84*** 29.54*** 36.01*** 27.96***(0.69) (0.51) (0.60) (0.60) (0.60) (0.60) (0.60) (0.57) (0.57) (0.55) (0.51) (0.51) (0.51) (0.50) (0.50)
660 <= FICO < 680 29.58*** 24.88*** 31.16*** 31.13*** 31.58*** 31.61*** 31.61*** 29.73*** 29.25*** 28.52*** 25.25*** 24.64*** 21.09*** 22.80*** 19.69***(0.50) (0.37) (0.44) (0.44) (0.44) (0.44) (0.44) (0.42) (0.42) (0.40) (0.37) (0.37) (0.36) (0.36) (0.36)
680 <= FICO < 700 20.26*** 13.31*** 19.74*** 19.72*** 20.48*** 20.51*** 20.49*** 16.09*** 15.70*** 15.63*** 13.72*** 13.07*** 11.92*** 12.20*** 11.38***(0.45) (0.32) (0.39) (0.39) (0.39) (0.39) (0.39) (0.38) (0.37) (0.36) (0.32) (0.32) (0.31) (0.32) (0.31)
700 <= FICO < 720 12.89*** 4.08*** 9.57*** 9.56*** 10.36*** 10.38*** 10.35*** 5.78*** 5.50*** 5.68*** 4.48*** 3.88*** 3.75*** 3.56*** 3.58***(0.44) (0.31) (0.37) (0.37) (0.37) (0.37) (0.37) (0.36) (0.36) (0.35) (0.31) (0.31) (0.31) (0.31) (0.30)
720 <= FICO < 740 9.79*** 1.79*** 5.87*** 5.82*** 6.54*** 6.58*** 6.57*** 2.74*** 2.54*** 2.79*** 2.07*** 1.59*** 1.66*** 1.53*** 1.58***(0.48) (0.34) (0.41) (0.41) (0.41) (0.41) (0.41) (0.40) (0.40) (0.38) (0.34) (0.34) (0.33) (0.33) (0.33)
0K <= Loan Amount < 40K 47.99*** 66.64*** 66.18*** 71.01*** 71.26*** 71.52*** 83.81*** 79.56*** 60.31*** 48.92*** 48.66*** 46.07*** 51.54*** 48.02***(1.31) (1.39) (1.39) (1.43) (1.43) (1.43) (1.38) (1.44) (1.37) (1.31) (1.31) (1.31) (1.29) (1.29)
40K <= Loan Amount < 50K 35.05*** 59.95*** 59.42*** 61.84*** 61.92*** 62.10*** 71.70*** 67.81*** 43.93*** 35.53*** 35.51*** 29.10*** 37.38*** 30.61***(1.35) (1.53) (1.52) (1.51) (1.51) (1.51) (1.46) (1.49) (1.41) (1.35) (1.35) (1.35) (1.32) (1.32)
50K <= Loan Amount < 75K 31.70*** 53.78*** 53.40*** 56.22*** 56.18*** 56.43*** 64.26*** 61.17*** 38.78*** 32.08*** 32.09*** 27.81*** 33.27*** 27.90***(0.80) (0.92) (0.92) (0.91) (0.91) (0.91) (0.89) (0.93) (0.89) (0.80) (0.81) (0.78) (0.79) (0.78)
75K <= Loan Amount < 150K 13.03*** 25.75*** 25.68*** 28.68*** 28.66*** 28.75*** 36.06*** 34.22*** 18.04*** 13.61*** 13.24*** 12.68*** 16.37*** 12.92***(0.49) (0.56) (0.56) (0.56) (0.56) (0.56) (0.54) (0.59) (0.57) (0.49) (0.49) (0.47) (0.49) (0.47)
Race Coefficients Are Also Shown in Table 6
Appendix 5: Results of APR Regressions Estimated Over Entire Sample
( ) ( ) ( ) ( ) ( ) ( ) ( ) ( ) ( ) ( ) ( ) ( ) ( ) ( )150K <= Loan Amount < 200K 2.50*** 9.70*** 9.80*** 12.39*** 12.41*** 12.43*** 18.55*** 17.32*** 5.36*** 3.09*** 2.53*** 4.47*** 6.76*** 4.92***
(0.47) (0.54) (0.54) (0.53) (0.53) (0.53) (0.52) (0.55) (0.54) (0.47) (0.47) (0.45) (0.46) (0.45)200K <= Loan Amount < 300K -1.74*** 4.09*** 4.22*** 6.19*** 6.19*** 6.19*** 10.73*** 9.74*** 0.42 -1.38*** -1.87*** 1.22*** 3.01*** 1.77***
(0.39) (0.44) (0.44) (0.44) (0.44) (0.44) (0.43) (0.46) (0.45) (0.39) (0.39) (0.38) (0.39) (0.37)300K <= Loan Amount < 500K -5.40*** -2.38*** -2.30*** -0.90** -0.89** -0.91** 1.22*** 0.66* -4.97*** -5.37*** -5.62*** -2.73*** -2.11*** -2.18***
(0.34) (0.39) (0.39) (0.39) (0.39) (0.39) (0.38) (0.39) (0.39) (0.34) (0.34) (0.33) (0.33) (0.32)40% < total debt ratio <= 45% 7.96*** 4.69*** 4.60*** 4.99*** 5.01*** 4.98*** 9.84*** 9.78*** 8.65*** 5.90*** 7.09*** 8.35*** 7.32***
(0.31) (0.36) (0.36) (0.36) (0.36) (0.36) (0.35) (0.35) (0.34) (0.33) (0.30) (0.30) (0.30)Total debt ratio > 45% -7.13*** -11.72*** -11.75*** -11.88*** -11.81*** -11.84*** 6.62*** 6.27*** -5.57*** -9.63*** 0.36 3.76*** 3.19***
(0.52) (0.62) (0.62) (0.62) (0.62) (0.62) (0.61) (0.61) (0.59) (0.56) (0.52) (0.51) (0.50)No total debt ratio 14.33*** 84.86*** 84.63*** 81.74*** 81.73*** 82.01*** 16.14*** 16.47*** 14.52*** 11.95** 16.57*** 11.03** 1.65 2.75
(5.42) (0.80) (0.81) (0.80) (0.80) (0.80) (5.96) (5.90) (5.55) (5.50) (5.43) (5.41) (5.76) (5.82)Total debt ratio > 36% 5.86***
(0.22)28% < housing debt ratio <= 33% 6.32***
(0.31)33% < housing debt ratio <= 40% 10.63***
(0.35)Housing debt ratio > 40% 5.91***
(0.67)No housing debt ratio 5.62***
(1.54)LTV missing -194.56*** -188.18***
(5.31) (5.50)0% < LTV <= 60% -103.62*** -104.06***
(0.91) (0.92)60% < LTV <= 70% -100.86*** -101.43***
(0.88) (0.88)70% < LTV <= 80% -91.45*** -91.99***
(0.74) (0.74)CLTV missing -49.05*** -45.14***
(6.24) (6.67)0% < CLTV <= 80% -19.28*** -19.16***
(0.41) (0.41)80% < CLTV <= 90% -14.58*** -14.42***
(0.38) (0.38)(First lien) x (LTV missing) -15.57 -191.73*** -191.73*** -192.07*** -96.33*** -94.06*** -89.33*** -14.19 -15.32 -249.57*** -44.76*** -248.03***
(11.63) (5.20) (5.21) (5.20) (8.36) (8.30) (8.17) (11.62) (11.63) (22.35) (12.21) (21.78)(First lien) x (0% < LTV <= 60%) -100.67*** -112.51*** -112.82*** -112.80*** -105.52*** -104.94*** -109.68*** -100.10*** -100.26*** -90.10*** -97.45*** -89.58***
(0.71) (0.88) (0.88) (0.88) (0.84) (0.84) (0.81) (0.71) (0.71) (0.68) (0.69) (0.67)
- 68 -Case3:08-cv-00369-TEH Document181 Filed04/01/10 Page68 of 91
Smith 3337

Model (1) Model (2) Model (3) Model (4) Model (5) Model (6) Model (7) Model (8) Model (9) Model (10) Model (11) Model (12) Model (13) Model (14) Model (15) Model (16) Model (17) Model (18)
Dependent variable: APR (basis points)Race
dummies only
Race, rate lock month & subordinate
lien dummiesSame as (2), add
FICO bin dummies
Same as (3), add risk-based
characteristics
Same as (2), use rate lock week
dummies in place of rate lock month
dummies
Add various explanatory
variables
Interact residence type & property
type
Interact LTV x 1st lien, CLTV
x sub. lien
Add HELOC dummy
Omit HELOC loans from
sample
Add documentation
type Add MSA
Same as Model (4), substitute broader loan amortization types for
loan programs
Same as Model (4), add housing debt
ratio dummies
Same as Model (4), substitute
total debt ratio > 36% dummy
Same as Model (4), add program category dummies
Same as Model (4), add unknown
business channel dummy
Same as Model (4), add program category &
unknown business channel dummies
Race Coefficients Are Also Shown in Table 6
(First lien) x (60% < LTV <= 70%) -95.72*** -108.30*** -108.36*** -108.38*** -104.53*** -104.15*** -104.49*** -95.52*** -95.41*** -87.58*** -94.66*** -87.17***(0.69) (0.86) (0.86) (0.86) (0.82) (0.82) (0.78) (0.69) (0.69) (0.66) (0.67) (0.65)
(First lien) x (70% < LTV <= 80%) -84.74*** -94.41*** -94.41*** -94.31*** -91.55*** -90.93*** -86.61*** -84.64*** -84.33*** -82.38*** -86.87*** -82.33***(0.60) (0.74) (0.74) (0.74) (0.70) (0.70) (0.67) (0.60) (0.60) (0.57) (0.58) (0.57)
(Subordinate lien) x (CLTV missing) -44.26 -156.80*** -156.88*** -157.43*** -49.23* -47.04 -51.55* -42.21 -43.98 -47.64 -71.95*** -47.51(27.49) (28.33) (28.23) (28.20) (28.69) (29.01) (26.73) (27.34) (27.46) (33.04) (27.15) (32.54)
(Subordinate lien) x (0% < CLTV <= 80%) -103.67*** -105.90*** -105.41*** -105.34*** -110.60*** -111.26*** -105.17*** -103.77*** -104.40*** -103.60*** -93.83*** -89.65***(2.81) (3.04) (3.04) (3.04) (2.85) (2.85) (2.77) (2.82) (2.80) (2.94) (2.71) (2.80)
(Subordinate lien) x (80% < CLTV <= 90%) -34.99*** -37.68*** -37.58*** -37.55*** -42.81*** -41.90*** -41.26*** -35.11*** -34.99*** -27.04*** -32.37*** -25.86***(1.24) (1.31) (1.31) (1.31) (1.25) (1.25) (1.23) (1.24) (1.24) (1.30) (1.24) (1.28)
Unknown business origination channel -52.34*** -57.94***(0.50) (0.95)
Program CategoryA Minus 230.88*** 181.04***
(5.15) (5.22)Alt-A 66.53*** 17.96***
(0.59) (1.02)Closed-End Second 277.06*** 228.35***
(1.28) (1.52)Commercial 70.38*** 26.44***
(7.23) (7.25)Jumbo A 34.75*** -16.37***
(0.51) (1.01)Unknown program category 287.15*** 193.86***
(22.92) (22.19)HELOC -46.16*** 56.90*** 53.67*** 54.27*** 31.70*** -45.96*** -45.14*** -22.94** -70.69*** -72.96***
(11.34) (4.54) (4.09) (4.09) (4.07) (11.33) (11.35) (11.30) (11.59) (11.04)FHA/VA -123.17*** -136.13*** -136.19*** -131.89*** -131.90*** -132.03*** -105.82*** -106.92*** -127.00*** -121.86*** -121.79*** -81.52*** -119.25*** -102.09***
(3.98) (4.68) (4.70) (4.63) (4.63) (4.63) (4.51) (4.52) (4.42) (3.95) (3.95) (3.61) (3.77) (3.49)Coapplicant present -2.75*** -10.91*** -10.74*** -11.00*** -10.98*** -10.96*** -2.31*** -2.19*** -3.40*** -1.83*** -2.67*** -2.44*** -2.44*** -2.24***
(0.24) (0.28) (0.28) (0.28) (0.28) (0.28) (0.28) (0.28) (0.27) (0.24) (0.24) (0.23) (0.23) (0.23)Self-employed borrower or co-borrower 15.31*** 26.79*** 27.03*** 26.95*** 26.97*** 26.96*** 16.67*** 16.51*** 15.99*** 16.05*** 15.72*** 12.73*** 12.15*** 12.03***
(0.77) (0.76) (0.76) (0.76) (0.76) (0.76) (0.73) (0.74) (0.84) (0.77) (0.77) (0.78) (0.78) (0.77)Documentation typeAlternative Doc -18.09*** -53.49*** -49.28*** -16.31*** -26.83*** -13.59*** -26.55*** -17.15*** -22.74***
(4.90) (6.31) (6.38) (5.57) (4.90) (4.88) (4.57) (4.62) (4.41)Low Doc 48.84*** 75.45*** 76.32*** 71.00*** 48.78*** 49.76*** 18.75 43.93*** 23.80
(13.75) (14.66) (15.13) (16.42) (13.61) (13.65) (14.46) (14.90) (14.83)NED -44.66*** -39.06*** -35.63*** -52.07*** -46.62*** -43.47*** -68.50*** -54.64*** -64.17***
(5.91) (6.17) (6.37) (6.09) (5.89) (5.92) (5.89) (6.21) (6.25)NID 59.10*** 64.35*** 64.28*** 69.52*** 58.74*** 59.85*** 34.50*** 55.87*** 40.02***
(5.50) (6.03) (5.97) (5.63) (5.48) (5.50) (5.50) (5.83) (5.89)NID/NAD 104.47*** 130.82*** 130.15*** 124.61*** 104.44*** 105.38*** 72.06*** 99.18*** 77.12***
(6.62) (7.56) (7.51) (6.82) (6.60) (6.63) (6.61) (6.85) (6.94)( ) ( ) ( ) ( ) ( ) ( ) ( ) ( ) ( )NID/NAV 134.98*** 169.99*** 169.44*** 153.91*** 134.79*** 136.19*** 100.19*** 125.63*** 104.73***
(7.10) (8.14) (8.08) (7.54) (7.06) (7.11) (7.08) (7.33) (7.38)NID/NED 84.00*** 102.70*** 102.38*** 105.17*** 83.03*** 84.60*** 48.18*** 76.56*** 52.51***
(5.72) (6.36) (6.30) (5.87) (5.70) (5.73) (5.73) (6.04) (6.11)NID/NED/NAD 95.37*** 109.74*** 109.40*** 109.89*** 94.64*** 96.22*** 63.66*** 87.80*** 68.49***
(5.48) (6.04) (5.98) (5.62) (5.46) (5.48) (5.48) (5.81) (5.88)NIV/NAV 44.72*** 66.96*** 66.41*** 54.91*** 44.99*** 45.70*** 6.39*** 58.01*** 41.28***
(0.60) (0.68) (0.68) (0.67) (0.60) (0.59) (0.71) (0.60) (0.93)Stated Income 43.87*** 44.66*** 44.79*** 52.64*** 44.23*** 44.88*** 29.15*** 31.13*** 27.17***
(0.29) (0.34) (0.34) (0.33) (0.29) (0.29) (0.32) (0.31) (0.31)Streamlined Refi 10.74 24.60 19.91 33.24 9.01 11.12 37.28 15.79 30.92
(36.28) (40.79) (40.88) (33.69) (35.97) (36.54) (28.89) (35.38) (30.03)Unknown doc type -21.24** -15.66* -15.65* -15.98* -22.37** -20.35** -29.18*** -36.51*** -29.54***
(10.14) (8.62) (8.60) (8.34) (10.20) (10.14) (10.20) (10.40) (10.14)Loan purpose: Home improvement 7.15*** 10.86*** 10.78*** 5.73*** 5.55*** 5.77*** 7.31*** 7.35*** 7.38*** 7.14*** 7.48*** 2.35** 5.88*** 2.10**
(1.03) (1.24) (1.24) (1.22) (1.22) (1.22) (1.18) (1.18) (1.15) (1.03) (1.03) (1.00) (1.02) (0.99)Loan purpose: Refinance 1.70*** 2.35*** 2.33*** -1.69*** -1.72*** -1.70*** 1.16*** 1.16*** 0.48* 1.65*** 1.86*** -0.22 2.09*** -0.22
(0.25) (0.31) (0.31) (0.28) (0.28) (0.28) (0.27) (0.27) (0.26) (0.25) (0.25) (0.24) (0.24) (0.24)Loan term5-year term 88.48*** 35.66*** 36.12*** 34.65*** 34.70*** 34.79*** 56.35*** 55.71*** 33.95*** 89.91*** 89.33*** 110.17*** 81.89*** 91.44***
(3.24) (6.84) (6.77) (6.49) (6.49) (6.47) (6.08) (6.21) (6.47) (3.24) (3.23) (3.35) (3.13) (3.22)7-year term 13.89* 54.80*** 54.38*** 49.72*** 49.85*** 49.92*** 71.23*** 67.54*** 44.69*** 13.85* 14.35* 35.39*** 26.77*** 26.80***
(8.04) (11.02) (11.22) (11.21) (11.23) (11.25) (10.34) (9.97) (9.62) (8.08) (7.66) (7.31) (9.54) (8.99)10-year term 99.86** 3.56 2.05 6.24* 5.24 6.37** 5.17* 4.27 -24.22*** 100.03** 100.52** 101.97** 99.09** 103.51**
(43.16) (3.23) (3.23) (3.18) (3.19) (3.19) (3.05) (3.06) (3.21) (43.21) (43.29) (43.27) (43.35) (43.16)15-year term 79.11*** 14.94*** 14.82*** 17.23*** 16.10*** 15.79*** 17.01*** 16.35*** 4.88*** 78.66*** 78.56*** 85.27*** 83.75*** 82.83***
(10.72) (0.75) (0.75) (0.75) (0.76) (0.76) (0.72) (0.72) (0.77) (10.71) (10.73) (10.59) (10.95) (10.27)20-year term -7.19 13.23*** 11.47*** 10.00*** 9.99*** 10.15*** 21.87*** 21.49*** 4.19* -7.79 -7.27 -4.20 -6.10 -5.31
(7.73) (2.76) (2.72) (2.73) (2.73) (2.73) (2.57) (2.57) (2.40) (7.72) (7.73) (8.25) (7.66) (8.30)25-year term 42.54*** 81.18*** 70.05*** 71.31*** 65.49*** 74.99*** 60.47*** 59.78*** 74.36*** 43.01*** 41.77*** 74.49*** 58.88*** 73.69***
(12.21) (3.25) (3.45) (3.43) (3.58) (3.71) (3.62) (3.63) (3.44) (12.22) (12.21) (12.14) (12.37) (11.85)40-year term 21.48*** 24.62*** 24.58*** 22.09*** 22.10*** 22.14*** 19.35*** 20.02*** 32.68*** 21.37*** 21.48*** 20.27*** 20.99*** 20.07***
(0.45) (0.44) (0.44) (0.43) (0.43) (0.43) (0.42) (0.42) (0.45) (0.45) (0.45) (0.44) (0.44) (0.44)Loan amortizationARM -56.17***
(0.34)Balloon -7.38***
(1.07)Unknown -21.38***
(7.84)
- 69 -Case3:08-cv-00369-TEH Document181 Filed04/01/10 Page69 of 91
Smith 3338

Model (1) Model (2) Model (3) Model (4) Model (5) Model (6) Model (7) Model (8) Model (9) Model (10) Model (11) Model (12) Model (13) Model (14) Model (15) Model (16) Model (17) Model (18)
Dependent variable: APR (basis points)Race
dummies only
Race, rate lock month & subordinate
lien dummiesSame as (2), add
FICO bin dummies
Same as (3), add risk-based
characteristics
Same as (2), use rate lock week
dummies in place of rate lock month
dummies
Add various explanatory
variables
Interact residence type & property
type
Interact LTV x 1st lien, CLTV
x sub. lien
Add HELOC dummy
Omit HELOC loans from
sample
Add documentation
type Add MSA
Same as Model (4), substitute broader loan amortization types for
loan programs
Same as Model (4), add housing debt
ratio dummies
Same as Model (4), substitute
total debt ratio > 36% dummy
Same as Model (4), add program category dummies
Same as Model (4), add unknown
business channel dummy
Same as Model (4), add program category &
unknown business channel dummies
Race Coefficients Are Also Shown in Table 6
Loan payment termsARM (unknown term) -190.04*** -189.59*** -189.16*** -196.96*** -207.19*** -197.51***
(2.30) (2.31) (2.29) (2.27) (2.34) (2.24)ARM 10YR/1YR 5.75 6.36 5.80 23.43*** 27.32*** 26.54***
(4.57) (4.60) (4.31) (4.10) (4.19) (4.06)ARM 10YR/6MO 6.88*** 6.93*** 7.63*** 0.85 -4.63*** -0.73
(1.03) (1.03) (1.04) (0.96) (1.02) (0.94)ARM 1MO/1MO -167.38*** -167.19*** -166.29*** -182.71*** -182.84*** -184.50***
(1.01) (1.01) (1.01) (0.95) (1.05) (0.94)ARM 1MO/1YR -34.27*** -34.26*** -33.51*** -56.24*** -46.05*** -58.77***
(0.39) (0.39) (0.38) (0.42) (0.40) (0.42)ARM 1MO/2YR 9.68*** 9.09*** 10.46*** -12.03*** -2.71 -14.57***
(2.08) (2.08) (2.08) (2.04) (2.04) (2.04)ARM 1MO/3YR 21.23*** 20.69*** 22.22*** -0.05 8.57*** -2.60*
(1.57) (1.57) (1.57) (1.55) (1.55) (1.55)ARM 1MO/5YR 22.03*** 21.42*** 23.01*** -0.85 8.37*** -3.61***
(1.41) (1.41) (1.41) (1.37) (1.39) (1.36)ARM 1YR/10YR -199.42*** -199.00*** -199.85*** -203.49*** -197.04*** -205.92***
(43.15) (43.19) (43.28) (43.26) (43.33) (43.15)ARM 1YR/1MO -105.26*** -104.89*** -104.62*** -110.67*** -117.20*** -112.04***
(9.44) (9.43) (9.43) (9.32) (9.95) (9.35)ARM 1YR/1YR -21.15*** -21.13*** -20.47*** -27.26*** -32.59*** -28.79***
(1.11) (1.11) (1.11) (1.03) (1.09) (1.01)ARM 1YR/25YR -219.72*** -219.41*** -218.43*** -256.87*** -239.81*** -256.99***
(23.53) (23.43) (23.53) (19.86) (22.28) (19.19)ARM 1YR/30YR -143.86*** -143.55*** -143.50*** -145.94*** -144.49*** -146.65***
(5.10) (5.09) (5.09) (5.29) (5.12) (5.32)ARM 2YR/1MO -160.85*** -157.42*** -160.13*** -156.85*** -174.22*** -160.04***
(10.49) (10.43) (10.49) (10.57) (11.03) (10.55)ARM 2YR/6MO -0.72 -0.95 -0.19 -13.94*** -12.79*** -16.03***
(0.69) (0.69) (0.68) (0.65) (0.66) (0.64)ARM 3MO/1YR -63.69*** -63.44*** -62.75*** -84.04*** -77.09*** -86.74***
(0.79) (0.79) (0.79) (0.80) (0.77) (0.79)ARM 3MO/2YR -18.45*** -18.59*** -17.40*** -39.49*** -28.54*** -41.30***
(6.48) (6.46) (6.39) (6.11) (6.09) (6.06)ARM 3MO/3YR -9.68 -9.74 -7.87 -31.87*** -20.02*** -34.34***
(6.69) (6.81) (6.71) (6.61) (6.65) (6.62)ARM 3MO/5YR -0.99 -1.74 0.83 -21.66** -14.28* -25.49***
(8.88) (8.98) (9.05) (8.73) (8.45) (8.37)ARM 3YR/10YR -105.82** -105.61** -106.16** -115.40*** -111.03** -118.61***
(43.27) (43.28) (43.40) (43.40) (43.47) (43.29)ARM 3YR/15YR -140.81*** -141.18*** -140.42*** -138.78*** -143.19*** -137.03***
(16.12) (16.15) (16.13) (16.66) (16.22) (16.50)ARM 3YR/1MO -119.77*** -120.12*** -119.45*** -111.37*** -130.45*** -115.59***
(9.77) (9.80) (9.76) (9.71) (10.29) (9.71)ARM 3YR/1YR -55.02*** -54.79*** -55.20*** -48.86*** -50.56*** -48.02***
(2.11) (2.13) (2.10) (2.21) (2.25) (2.24)ARM 3YR/20YR -39.95** -40.17** -40.00** -32.81** -38.29** -32.15**
(15.69) (15.69) (15.68) (14.22) (15.40) (14.20)ARM 3YR/25YR -47.40*** -48.72*** -46.65*** -76.15*** -62.14*** -75.94***
(12.82) (12.84) (12.83) (13.00) (12.97) (12.74)ARM 3YR/30YR -44.04*** -44.18*** -43.88*** -42.99*** -43.78*** -43.45***
(4.29) (4.28) (4.29) (4.43) (4.30) (4.43)ARM 3YR/6MO -68.82*** -68.70*** -68.14*** -79.48*** -80.46*** -81.20***
(0.40) (0.40) (0.40) (0.40) (0.41) (0.40)ARM 4YR/1YR 5.60 6.27* 7.27* -2.09 -10.62*** -4.03
(3.82) (3.78) (3.76) (3.50) (3.53) (3.46)ARM 5YR/10YR -14.46 -15.86 -15.48 -15.87 -14.62 -18.47
(56.41) (56.39) (56.53) (56.87) (56.13) (56.98)ARM 5YR/15YR -74.10*** -74.40*** -73.67*** -78.48*** -78.15*** -76.71***
(15.86) (15.86) (15.85) (15.98) (15.93) (15.80)ARM 5YR/1MO -121.23*** -120.17*** -120.91*** -118.77*** -133.07*** -120.94***
(16.63) (16.82) (16.46) (14.74) (17.71) (15.58)ARM 5YR/1YR -37.74*** -37.28*** -36.71*** -41.71*** -47.33*** -42.72***
(1.05) (1.05) (1.05) (0.97) (0.97) (0.96)ARM 5YR/25YR -21.81* -22.87* -21.05 -49.28*** -36.79*** -49.30***
(12.95) (12.96) (12.95) (13.25) (13.10) (12.99)ARM 5YR/30YR -91.21*** -91.07*** -91.06*** -91.76*** -91.50*** -92.32***
(2.98) (2.97) (2.98) (3.13) (2.97) (3.12)ARM 5YR/6MO -28.28*** -28.12*** -27.40*** -39.66*** -40.69*** -41.03***
(0.37) (0.37) (0.36) (0.37) (0.38) (0.37)ARM 6MO/6MO -168.23*** -167.94*** -167.14*** -177.20*** -185.58*** -178.56***
(0.58) (0.58) (0.58) (0.59) (0.61) (0.58)ARM 6YR/1YR -14.26*** -12.15*** -11.57*** -25.35*** -32.84*** -27.62***
(3.50) (3.55) (3.57) (2.72) (2.95) (2.66)ARM 7YR/1YR -21.83*** -21.43*** -20.25*** -29.34*** -37.03*** -31.08***
(1.19) (1.20) (1.20) (1.07) (1.14) (1.07)ARM 7YR/6MO -21.00*** -20.98*** -20.26*** -25.75*** -33.59*** -27.00***
(0.76) (0.76) (0.76) (0.72) (0.74) (0.71)Balloon (unknown term) 152.33*** 149.01*** 149.75*** 145.11*** 111.86*** 108.11***
(10.80) (10.80) (10.82) (10.68) (11.04) (10.37)20/10 Balloon -80.75 -81.68 -81.32 -81.00 -82.12 -83.13
(60.95) (60.92) (61.01) (62.71) (60.12) (62.90)
- 70 -Case3:08-cv-00369-TEH Document181 Filed04/01/10 Page70 of 91
Smith 3339

Model (1) Model (2) Model (3) Model (4) Model (5) Model (6) Model (7) Model (8) Model (9) Model (10) Model (11) Model (12) Model (13) Model (14) Model (15) Model (16) Model (17) Model (18)
Dependent variable: APR (basis points)Race
dummies only
Race, rate lock month & subordinate
lien dummiesSame as (2), add
FICO bin dummies
Same as (3), add risk-based
characteristics
Same as (2), use rate lock week
dummies in place of rate lock month
dummies
Add various explanatory
variables
Interact residence type & property
type
Interact LTV x 1st lien, CLTV
x sub. lien
Add HELOC dummy
Omit HELOC loans from
sample
Add documentation
type Add MSA
Same as Model (4), substitute broader loan amortization types for
loan programs
Same as Model (4), add housing debt
ratio dummies
Same as Model (4), substitute
total debt ratio > 36% dummy
Same as Model (4), add program category dummies
Same as Model (4), add unknown
business channel dummy
Same as Model (4), add program category &
unknown business channel dummies
Race Coefficients Are Also Shown in Table 6
25/10 Balloon -132.63*** -133.07*** -133.16*** -135.55*** -132.69*** -138.01***(47.48) (47.49) (47.59) (47.62) (47.46) (47.52)
25/15 Balloon -142.34*** -143.09*** -141.99*** -147.65*** -148.57*** -145.19***(44.29) (44.37) (44.32) (40.39) (39.88) (39.29)
30/10 Balloon -157.50*** -157.64*** -158.02*** -161.33*** -158.23*** -163.47***(43.22) (43.27) (43.35) (43.33) (43.41) (43.22)
30/15 Balloon -83.89*** -83.46*** -83.17*** -91.38*** -89.46*** -88.49***(10.73) (10.73) (10.75) (10.61) (10.96) (10.28)
40/10 Balloon -141.23*** -141.37*** -141.73*** -141.43*** -141.24*** -142.89***(44.99) (45.00) (45.11) (44.55) (45.11) (44.44)
40/15 Balloon -109.47*** -109.13*** -108.74*** -114.84*** -114.62*** -111.94***(12.00) (11.98) (12.02) (11.89) (12.21) (11.63)
40/30 Balloon -29.49*** -29.88*** -29.06*** -38.65*** -43.61*** -41.20***(1.38) (1.37) (1.37) (1.31) (1.36) (1.30)
5/25 Balloon -90.07*** -90.56*** -91.13*** -89.94*** -68.49*** -77.16***(7.29) (7.26) (7.09) (7.25) (7.50) (7.46)
10-year fixed -83.19* -83.36* -84.03* -84.67* -81.98* -85.19**(43.27) (43.31) (43.40) (43.43) (43.48) (43.31)
15-year fixed -88.81*** -88.32*** -88.21*** -93.94*** -90.92*** -90.32***(10.73) (10.73) (10.75) (10.61) (10.96) (10.28)
20-year fixed -0.93 -0.13 -1.60 9.73 9.64 11.91(8.06) (8.04) (8.06) (8.59) (7.96) (8.62)
40-year fixed -51.43*** -51.13*** -53.67*** -42.63*** -44.41*** -41.78***(2.20) (2.18) (2.16) (2.20) (2.20) (2.29)
Unknown term -90.94*** -90.57*** -90.31*** -100.32*** -103.61*** -100.09***(11.05) (10.98) (11.06) (10.92) (11.58) (10.82)
Property typeCommercial - Mixed use w/ residential -20.47***
(2.64)Commercial - Mixed use w/o residential -24.16***
(4.27)Commercial - Multi-family > 4 -38.23***
(2.11)Commercial - Other 22.96*
(13.67)Condo - High Rise -0.68
(1.03)Condo - Low Rise 0.10
(0.44)Condo - Mid Rise 4.75***
(1.76)Condo - Site 0.51
(2.35)Condotel -2.12
(16.73)Coop -18.63***
(1.61)Duplex 16.25***
(0.61)Fourplex 28.52***
(0.98)Manufactured Home 10.89
(9.29)PUD-1 unit attached -5.03***
(0.64)PUD-1 unit detached -2.91***
(0.40)PUD-2 Units 6.73
(6.66)PUD-3 Units 43.81
(28.05)PUD-4 Units 15.78***
(4.53)Single Family Attached -1.65*
(0.87)Triplex 35.67***
(1.19)Unknown property type 11.78***
(2.71)Residence typeInvestment property 59.06***
(0.37)Second home 20.10***
(0.87)Property & residence typeInvesment, unknown type 79.06*** 104.93*** 100.88*** 101.22*** 100.84*** 100.69*** 100.07*** 99.49*** 80.51*** 79.26*** 59.78*** 122.16*** 111.15***
(2.38) (3.21) (3.20) (3.20) (3.20) (3.11) (3.10) (2.65) (2.38) (2.38) (2.32) (2.31) (2.43)Invesment, Commercial - Mixed use w/ residential 66.00*** 40.43*** 37.78*** 39.24*** 37.03*** 27.74*** 27.57*** 47.95*** 67.25*** 66.24*** 52.63*** 113.92*** 104.58***
(2.73) (2.63) (2.62) (2.64) (2.65) (2.65) (2.66) (2.55) (2.72) (2.73) (6.43) (2.74) (6.48)Invesment, Commercial - Mixed use w/o residential 56.48*** 36.06*** 35.13*** 35.65*** 35.16*** 21.14*** 20.89*** 39.07*** 57.89*** 56.66*** 46.00*** 106.17*** 98.72***
(3.77) (4.26) (4.28) (4.27) (4.27) (4.24) (4.24) (4.30) (3.76) (3.76) (7.72) (3.91) (7.77)Invesment, Commercial - Multi-family > 4 41.46*** 22.36*** 20.18*** 21.30*** 19.86*** 9.28*** 7.25*** 22.89*** 42.71*** 41.76*** 27.61*** 89.19*** 79.75***
(2.31) (2.08) (2.08) (2.09) (2.08) (2.14) (2.15) (2.07) (2.31) (2.31) (6.65) (2.37) (6.69)
- 71 -Case3:08-cv-00369-TEH Document181 Filed04/01/10 Page71 of 91
Smith 3340

Model (1) Model (2) Model (3) Model (4) Model (5) Model (6) Model (7) Model (8) Model (9) Model (10) Model (11) Model (12) Model (13) Model (14) Model (15) Model (16) Model (17) Model (18)
Dependent variable: APR (basis points)Race
dummies only
Race, rate lock month & subordinate
lien dummiesSame as (2), add
FICO bin dummies
Same as (3), add risk-based
characteristics
Same as (2), use rate lock week
dummies in place of rate lock month
dummies
Add various explanatory
variables
Interact residence type & property
type
Interact LTV x 1st lien, CLTV
x sub. lien
Add HELOC dummy
Omit HELOC loans from
sample
Add documentation
type Add MSA
Same as Model (4), substitute broader loan amortization types for
loan programs
Same as Model (4), add housing debt
ratio dummies
Same as Model (4), substitute
total debt ratio > 36% dummy
Same as Model (4), add program category dummies
Same as Model (4), add unknown
business channel dummy
Same as Model (4), add program category &
unknown business channel dummies
Race Coefficients Are Also Shown in Table 6
Invesment, Commercial - Other 77.34*** 90.40*** 86.91*** 91.38*** 84.42*** 80.99*** 80.47*** 98.57*** 78.49*** 77.41*** 59.60*** 123.20*** 111.25***(11.59) (12.69) (12.45) (12.06) (12.74) (11.15) (10.97) (10.89) (11.53) (11.57) (12.28) (11.68) (12.46)
Invesment, Condo - High Rise 45.93*** 52.34*** 47.84*** 47.82*** 47.74*** 46.01*** 44.19*** 53.36*** 48.73*** 46.03*** 30.59*** 43.23*** 28.30***(1.66) (1.72) (1.72) (1.71) (1.71) (1.71) (1.73) (1.66) (1.67) (1.67) (1.63) (1.63) (1.62)
Invesment, Condo - Low Rise 51.28*** 55.96*** 51.13*** 51.17*** 51.11*** 49.76*** 50.06*** 58.24*** 53.70*** 51.21*** 34.28*** 47.29*** 31.82***(0.72) (0.78) (0.77) (0.77) (0.77) (0.76) (0.77) (0.74) (0.73) (0.72) (0.74) (0.71) (0.73)
Invesment, Condo - Mid Rise 58.74*** 66.23*** 61.68*** 61.61*** 61.23*** 59.98*** 59.53*** 67.73*** 61.34*** 58.86*** 43.77*** 55.85*** 41.73***(3.15) (3.37) (3.45) (3.43) (3.42) (3.46) (3.46) (3.27) (3.16) (3.16) (3.10) (3.10) (3.10)
Invesment, Condo - Site 50.39*** 54.12*** 49.73*** 49.79*** 49.81*** 47.84*** 47.59*** 56.71*** 53.01*** 50.15*** 34.37*** 46.41*** 31.35***(5.06) (4.74) (4.80) (4.81) (4.81) (4.63) (4.59) (4.72) (5.09) (5.12) (5.19) (4.93) (5.06)
Invesment, Condotel 32.49** 56.77*** 50.96*** 51.00*** 50.95*** 47.96*** 39.54*** 39.31** 34.40** 31.91*** 24.09 29.08* 24.27(13.14) (16.65) (15.94) (15.91) (15.93) (13.37) (12.34) (19.73) (13.58) (12.02) (18.85) (16.12) (19.45)
Invesment, Coop 1.60 -55.83*** -62.14*** -61.99*** -62.36*** -32.40*** -31.62*** 9.08*** 4.59*** 3.74*** -23.16*** -7.98*** -26.04***(1.28) (1.53) (1.52) (1.52) (1.52) (1.49) (1.62) (1.45) (1.28) (1.29) (1.26) (1.26) (1.25)
Invesment, Duplex 58.79*** 72.05*** 68.56*** 68.64*** 68.57*** 67.64*** 66.68*** 68.22*** 60.89*** 58.97*** 40.74*** 54.38*** 38.24***(0.73) (0.84) (0.84) (0.84) (0.84) (0.83) (0.83) (0.78) (0.74) (0.73) (0.75) (0.71) (0.74)
Invesment, Fourplex 69.21*** 85.31*** 81.45*** 81.53*** 81.51*** 80.98*** 79.25*** 79.97*** 71.41*** 69.71*** 48.85*** 63.97*** 45.97***(0.94) (1.06) (1.06) (1.06) (1.06) (1.06) (1.06) (0.98) (0.95) (0.95) (0.96) (0.92) (0.95)
Invesment, PUD-1 unit attached 46.70*** 51.57*** 47.61*** 47.63*** 47.59*** 46.21*** 46.12*** 54.82*** 49.19*** 46.65*** 30.33*** 43.15*** 27.76***(1.08) (1.17) (1.17) (1.17) (1.17) (1.14) (1.14) (1.13) (1.09) (1.08) (1.10) (1.07) (1.09)
Invesment, PUD-1 unit detached 49.76*** 56.82*** 53.84*** 53.87*** 53.85*** 52.85*** 52.81*** 60.44*** 51.85*** 49.81*** 32.79*** 46.32*** 30.40***(0.66) (0.70) (0.70) (0.70) (0.70) (0.69) (0.70) (0.69) (0.67) (0.66) (0.68) (0.65) (0.68)
Invesment, PUD-2 units 44.76*** 62.33*** 57.61*** 57.84*** 57.87*** 58.52*** 56.41*** 52.50*** 46.32*** 44.82*** 20.38*** 36.28*** 17.38***(6.20) (7.62) (7.55) (7.55) (7.55) (7.58) (7.53) (6.41) (6.23) (6.19) (5.77) (5.89) (5.77)
Invesment, PUD-3 units 75.72*** 101.87*** 98.30*** 98.39*** 98.31*** 101.69*** 104.47*** 93.53*** 78.48*** 76.57*** 52.28** 67.18*** 49.58**(24.90) (29.68) (29.00) (29.02) (29.00) (33.59) (33.75) (28.62) (24.83) (25.13) (21.03) (22.70) (20.77)
Invesment, PUD-4 units 53.88*** 74.02*** 68.74*** 68.78*** 68.82*** 67.77*** 66.52*** 63.76*** 55.99*** 54.55*** 32.79*** 49.10*** 30.05***(4.32) (4.65) (4.66) (4.66) (4.66) (4.85) (4.78) (4.45) (4.32) (4.31) (4.20) (4.20) (4.18)
Invesment, Single Family Attached 52.25*** 57.18*** 52.99*** 53.04*** 52.96*** 50.49*** 51.94*** 57.02*** 54.19*** 52.44*** 35.80*** 47.49*** 32.92***(1.26) (1.45) (1.45) (1.45) (1.45) (1.43) (1.44) (1.35) (1.26) (1.26) (1.24) (1.23) (1.23)
Invesment, Single Family Detached 49.38*** 59.07*** 55.42*** 55.46*** 55.38*** 52.87*** 52.76*** 57.70*** 51.57*** 49.41*** 32.38*** 45.57*** 29.98***(0.40) (0.46) (0.44) (0.44) (0.44) (0.43) (0.44) (0.42) (0.41) (0.40) (0.44) (0.39) (0.43)
Invesment, Triplex 74.07*** 90.83*** 86.44*** 86.54*** 86.52*** 85.73*** 83.79*** 83.02*** 76.27*** 74.64*** 53.38*** 68.10*** 50.32***(1.27) (1.48) (1.48) (1.48) (1.48) (1.48) (1.47) (1.33) (1.27) (1.27) (1.27) (1.23) (1.25)
Primary, unknown type 2.24 -6.80** -7.51*** -7.65*** -7.18** -6.52** -6.40** -3.01 2.47 2.22 0.60 45.25*** 48.98***(1.97) (2.89) (2.86) (2.87) (2.87) (2.76) (2.75) (2.36) (1.97) (1.97) (1.88) (1.92) (1.96)
Primary, Commercial - Mixed use w/ residential 119.06*** 108.22*** 108.59*** 111.58*** 106.95*** 96.98*** 97.10*** 116.34*** 120.21*** 119.32*** 101.06*** 162.85*** 152.08***(18.25) (21.39) (21.58) (21.39) (21.69) (20.95) (20.91) (19.75) (18.22) (18.29) (18.44) (17.79) (18.36)
Primary, Commercial - Multi-family > 4 150.66*** 141.94*** 139.77*** 141.88*** 138.66*** 126.96*** 125.50*** 137.98*** 151.96*** 151.10*** 134.18*** 194.73*** 185.31***(33.94) (44.12) (44.81) (44.78) (44.86) (41.85) (42.66) (40.26) (33.72) (33.92) (34.51) (33.18) (34.45)
Primary, Condo - High Rise 9.13*** 2.77** 1.66 1.68 1.69 7.32*** 5.84*** 14.86*** 9.42*** 9.28*** 6.76*** 7.24*** 6.08***(1.20) (1.32) (1.33) (1.33) (1.33) (1.26) (1.28) (1.29) (1.20) (1.20) (1.14) (1.17) (1.13)
Primary, Condo - Low Rise 5.32*** 1.24** 1.62*** 1.64*** 1.62*** 2.84*** 2.49*** 5.68*** 5.46*** 5.37*** 4.92*** 4.58*** 4.55***(0.48) (0.53) (0.53) (0.53) (0.53) (0.51) (0.53) (0.52) (0.48) (0.48) (0.46) (0.47) (0.46)( ) ( ) ( ) ( ) ( ) ( ) ( ) ( ) ( ) ( ) ( ) ( ) ( )
Primary, Condo - Mid Rise 9.73*** 5.47** 4.91** 4.89** 5.13** 8.11*** 7.99*** 12.68*** 9.95*** 9.88*** 8.78*** 10.15*** 8.82***(1.86) (2.17) (2.16) (2.16) (2.15) (2.02) (2.02) (2.03) (1.85) (1.85) (1.76) (1.80) (1.74)
Primary, Condo - Site 2.09 1.81 2.63 2.65 2.68 3.32 2.24 5.50** 1.57 2.15 0.89 0.01 0.38(2.38) (2.62) (2.63) (2.63) (2.63) (2.51) (2.52) (2.56) (2.38) (2.38) (2.32) (2.34) (2.28)
Primary, Coop 6.50*** -17.84*** -22.87*** -22.66*** -22.84*** -0.66 -0.70 18.03*** 7.57*** 7.50*** -0.56 -2.58* -3.23**(1.65) (1.63) (1.63) (1.63) (1.63) (1.58) (1.66) (1.76) (1.65) (1.65) (1.47) (1.51) (1.47)
Primary, Duplex 11.28*** 20.24*** 20.17*** 20.23*** 20.21*** 16.10*** 15.02*** 13.19*** 10.55*** 11.09*** 6.51*** 10.73*** 6.15***(0.73) (0.85) (0.84) (0.84) (0.84) (0.80) (0.83) (0.80) (0.73) (0.74) (0.71) (0.72) (0.71)
Primary, Fourplex 31.04*** 42.69*** 40.36*** 40.47*** 40.45*** 38.54*** 36.00*** 36.25*** 30.55*** 31.22*** 17.36*** 28.20*** 14.61***(2.05) (2.45) (2.44) (2.44) (2.44) (2.37) (2.36) (2.19) (2.06) (2.05) (1.99) (2.00) (1.98)
Primary, Manufactured Home 13.57* 10.37 7.69 7.73 7.73 7.23 7.94 11.71 13.82* 12.67 11.47* 16.51** 14.01*(7.89) (9.31) (9.24) (9.24) (9.25) (8.92) (9.02) (8.83) (7.83) (7.79) (6.97) (8.00) (7.36)
Primary, PUD-1 unit attached -0.47 -4.42*** -4.02*** -4.02*** -4.05*** -3.64*** -2.97*** -0.07 -0.61 -0.51 -0.24 -1.12 -0.53(0.69) (0.76) (0.76) (0.76) (0.76) (0.72) (0.74) (0.74) (0.69) (0.69) (0.67) (0.68) (0.67)
Primary, PUD-1 unit detached -2.91*** -3.65*** -3.56*** -3.56*** -3.57*** -3.28*** -3.36*** -2.97*** -2.94*** -3.02*** -3.10*** -3.31*** -3.16***(0.39) (0.46) (0.46) (0.46) (0.46) (0.44) (0.45) (0.44) (0.39) (0.39) (0.38) (0.38) (0.38)
Primary, PUD-2 units 5.44 20.37 18.08 18.17 18.06 13.12 13.28 18.48 6.62 5.95 -0.15 7.25 0.60(12.84) (12.68) (12.85) (12.86) (12.85) (13.36) (13.16) (12.25) (12.77) (12.78) (12.38) (12.79) (12.76)
Primary, PUD-3 units 61.30*** 56.94*** 65.38*** 65.53*** 65.55*** 101.63*** 108.82*** 116.21*** 55.21*** 63.96*** 25.82*** 48.15*** 21.19***(0.86) (0.84) (0.83) (0.83) (0.83) (0.87) (1.01) (0.91) (0.89) (0.87) (0.89) (0.86) (0.88)
Primary, PUD-4 units 28.77* 27.72 26.66 26.72 26.73 22.03 23.84 27.26 27.18* 29.05* 19.56 29.28* 17.95(16.31) (19.48) (18.72) (18.75) (18.75) (19.67) (19.74) (20.23) (16.39) (16.27) (15.78) (15.06) (15.55)
Primary, Single Family Attached -0.12 -1.34 -1.20 -1.14 -1.13 -1.04 -0.30 0.13 0.05 -0.04 -0.17 0.92 0.38(0.88) (1.06) (1.05) (1.05) (1.05) (1.00) (1.01) (0.98) (0.87) (0.88) (0.85) (0.86) (0.84)
Primary, Triplex 36.32*** 44.82*** 43.02*** 43.07*** 43.17*** 40.29*** 38.54*** 41.72*** 35.83*** 36.29*** 22.83*** 32.24*** 19.17***(1.55) (1.87) (1.86) (1.86) (1.86) (1.80) (1.80) (1.66) (1.55) (1.55) (1.52) (1.51) (1.50)
Second home, unknown type 28.65*** 14.53 11.09 10.34 8.60 14.69 13.31 18.14** 30.43*** 27.87*** 25.35*** 71.00*** 71.53***(5.97) (9.81) (9.86) (9.79) (9.85) (9.49) (9.43) (8.17) (5.97) (5.97) (5.77) (5.80) (5.62)
Second home, Condo - High Rise 17.63*** 16.60*** 12.68*** 12.60*** 12.02*** 15.46*** 14.16*** 21.54*** 20.73*** 17.42*** 10.17*** 16.71*** 9.17***(2.76) (3.48) (3.50) (3.47) (3.43) (3.32) (3.34) (3.33) (2.76) (2.77) (2.64) (2.70) (2.62)
Second home, Condo - Low Rise 24.66*** 24.83*** 20.74*** 20.73*** 20.57*** 21.88*** 22.04*** 27.68*** 27.51*** 24.42*** 17.06*** 24.47*** 15.83***(1.54) (1.85) (1.85) (1.85) (1.85) (1.79) (1.80) (1.78) (1.55) (1.55) (1.46) (1.51) (1.46)
Second home, Condo - Mid Rise 17.03*** 10.93* 6.98 6.99 6.99 10.36* 11.23* 16.82*** 20.17*** 16.11*** 12.18** 17.71*** 11.10**(5.25) (6.32) (6.37) (6.37) (6.37) (5.88) (5.81) (5.91) (5.26) (5.29) (5.00) (5.11) (4.94)
Second home, Condo - Site 7.85 -1.39 -6.04 -5.93 -5.90 -18.79 -18.23 -9.80 11.23 6.98 -0.92 6.02 -2.35(17.68) (19.84) (19.93) (19.93) (19.92) (21.34) (21.10) (22.77) (17.75) (17.59) (17.66) (17.60) (17.74)
Second home, Coop 30.64*** -6.69 -11.16** -11.00** -11.12** 11.46** 11.56** 44.70*** 34.49*** 31.18*** 23.18*** 18.77*** 20.99***(5.36) (5.18) (5.29) (5.30) (5.29) (5.40) (5.28) (6.01) (5.35) (5.41) (4.78) (4.78) (4.70)
Second home, PUD-1 unit attached 20.64*** 18.47*** 14.16*** 14.22*** 14.22*** 15.64*** 14.77*** 20.47*** 23.25*** 19.97*** 14.94*** 21.22*** 14.00***(3.64) (4.45) (4.48) (4.48) (4.48) (4.35) (4.31) (4.25) (3.65) (3.67) (3.54) (3.59) (3.50)
- 72 -Case3:08-cv-00369-TEH Document181 Filed04/01/10 Page72 of 91
Smith 3341

Model (1) Model (2) Model (3) Model (4) Model (5) Model (6) Model (7) Model (8) Model (9) Model (10) Model (11) Model (12) Model (13) Model (14) Model (15) Model (16) Model (17) Model (18)
Dependent variable: APR (basis points)Race
dummies only
Race, rate lock month & subordinate
lien dummiesSame as (2), add
FICO bin dummies
Same as (3), add risk-based
characteristics
Same as (2), use rate lock week
dummies in place of rate lock month
dummies
Add various explanatory
variables
Interact residence type & property
type
Interact LTV x 1st lien, CLTV
x sub. lien
Add HELOC dummy
Omit HELOC loans from
sample
Add documentation
type Add MSA
Same as Model (4), substitute broader loan amortization types for
loan programs
Same as Model (4), add housing debt
ratio dummies
Same as Model (4), substitute
total debt ratio > 36% dummy
Same as Model (4), add program category dummies
Same as Model (4), add unknown
business channel dummy
Same as Model (4), add program category &
unknown business channel dummies
Race Coefficients Are Also Shown in Table 6
Second home, PUD-1 unit detached 18.07*** 21.64*** 18.19*** 18.10*** 17.71*** 17.08*** 16.17*** 20.39*** 20.86*** 17.77*** 10.45*** 18.47*** 9.70***(1.45) (1.63) (1.63) (1.63) (1.62) (1.57) (1.58) (1.62) (1.46) (1.45) (1.41) (1.43) (1.41)
Second home, Single Family Attached 12.48* 13.09 10.49 10.57 10.54 11.59 11.73 15.66* 14.90** 11.46* 7.22 13.74** 6.31(6.88) (8.62) (8.91) (8.92) (8.92) (8.38) (8.44) (8.00) (6.88) (6.77) (6.56) (6.70) (6.53)
Second home, Single Family Detached 17.35*** 17.02*** 13.42*** 13.42*** 13.23*** 14.31*** 13.59*** 18.04*** 20.09*** 17.04*** 11.93*** 17.62*** 10.73***(1.04) (1.28) (1.28) (1.28) (1.28) (1.24) (1.25) (1.22) (1.04) (1.04) (1.00) (1.01) (0.99)
Constant 660.15*** 500.61*** 489.18*** 562.02*** 473.40*** 519.00*** 518.89*** 514.29*** 514.28*** 513.88*** 472.75*** 470.34*** 524.59*** 557.51*** 559.69*** 533.76*** 588.73*** 593.94***(0.39) (67.99) (64.02) (34.83) (0.01) (44.32) (42.57) (42.14) (42.15) (42.11) (38.37) (39.00) (34.94) (35.06) (34.64) (34.58) (33.54) (33.94)
Observations 372186 372186 372186 372038 372186 372038 372038 372038 372038 371609 372038 372038 372038 372038 372038 372038 372038 372038R-squared 0.02055 0.73689 0.74322 0.87352 0.73765 0.81732 0.81786 0.81835 0.81846 0.81866 0.83015 0.83145 0.84466 0.87387 0.87340 0.87995 0.87789 0.88208Adjusted R-squared 0.02053 0.73685 0.74317 0.87330 0.73748 0.81723 0.81777 0.81826 0.81837 0.81856 0.83005 0.83118 0.84442 0.87365 0.87318 0.87974 0.87768 0.88187Robust standard errors in parentheses*** p<0.01, ** p<0.05, * p<0.1Standard errors in parentheses*** p<0.01, ** p<0.05, * p<0.1Coefficients and standard errors for rate lock month, rate lock week, state, and MSA dummy variables excluded from this table for brevity.
- 73 -Case3:08-cv-00369-TEH Document181 Filed04/01/10 Page73 of 91
Smith 3342

Model (4) Model (4-L1) Model (4-L2) Model (4-2004) Model (4-2005) Model (4-2006) Model (4-2007)
Dependent variable: APR (basis points) First lien loans onlySubordinate lien
loans only 2004 loans only 2005 loans only 2006 loans only 2007 loans only
Race: African American 9.44*** 8.98*** 5.42*** 10.60*** 7.29*** 5.63*** 7.15***(0.44) (0.43) (1.50) (0.67) (0.59) (0.64) (0.98)
Race: Hispanic 7.64*** 8.66*** -2.01* 7.21*** 3.79*** 1.66*** 2.07***(0.32) (0.31) (1.15) (0.49) (0.39) (0.46) (0.72)
Race: American Indian -5.83*** -8.40*** 15.94** -7.23** -3.02 0.28 -0.40(2.02) (1.96) (7.82) (2.96) (2.41) (3.02) (4.09)
Race: Asian 2.61*** 2.70*** -0.98 -0.61 1.25*** 0.92 0.49(0.39) (0.37) (1.63) (0.59) (0.44) (0.60) (0.98)
Race: Hawaiian 4.36*** 4.90*** -1.27 4.75** 2.68** 1.01 -2.25(1.08) (1.05) (4.14) (1.90) (1.22) (1.49) (2.50)
Race: Missing 4.08*** 3.78*** 2.73* 4.09*** 2.83*** 3.74*** 2.30***(0.42) (0.40) (1.57) (0.59) (0.54) (0.65) (0.85)
Subordinate lien 235.06*** 194.51*** 212.50*** 290.73*** 324.78***(1.23) (3.48) (3.97) (1.98) (2.75)
Missing FICO 64.49*** 61.12*** 132.09*** 58.17*** 69.37*** 49.21*** 12.43**(4.37) (4.36) (34.23) (4.92) (7.30) (6.32) (6.02)
300 <= FICO < 600 113.47*** 107.85*** 93.89*** 133.75*** 87.24*** 46.88*** 28.01***(6.93) (6.81) (5.17) (7.98) (11.35) (6.11) (5.51)
600 <= FICO < 620 87.81*** 83.77*** 135.76*** 91.71*** 76.36*** 52.01*** 31.41***(4.90) (4.94) (29.46) (6.38) (7.97) (5.51) (9.08)
620 <= FICO < 640 40.29*** 29.59*** 178.61*** 40.74*** 28.38*** 55.73*** 47.18***(0.91) (0.86) (4.27) (1.19) (1.29) (1.47) (1.89)
640 <= FICO < 660 38.08*** 29.06*** 144.73*** 31.34*** 30.26*** 51.76*** 44.91***(0.51) (0.48) (2.14) (0.68) (0.71) (0.78) (1.24)
660 <= FICO < 680 24.88*** 16.49*** 103.17*** 16.18*** 19.26*** 35.12*** 33.73***(0.37) (0.35) (1.24) (0.52) (0.49) (0.54) (0.86)
680 <= FICO < 700 13.31*** 7.75*** 74.05*** 8.81*** 9.16*** 22.40*** 22.62***(0.32) (0.31) (1.22) (0.45) (0.40) (0.50) (0.77)
700 <= FICO < 720 4.08*** 3.39*** 14.21*** 5.40*** 3.58*** 5.19*** 6.42***(0.31) (0.30) (1.16) (0.45) (0.37) (0.49) (0.72)
720 <= FICO < 740 1.79*** 1.85*** 2.75** 2.60*** 1.80*** 2.12*** 2.82***(0.34) (0.33) (1.31) (0.49) (0.40) (0.55) (0.80)
0K <= Loan Amount < 40K 47.99*** 99.11*** -61.69*** 63.90*** 47.60*** 27.65*** 37.36***(1.31) (1.89) (20.75) (2.37) (2.40) (1.91) (3.81)
40K <= Loan Amount < 50K 35.05*** 64.72*** -61.73*** 51.44*** 49.98*** 10.55*** 12.64***(1.35) (1.52) (20.76) (1.90) (2.23) (2.02) (3.83)
50K <= Loan Amount < 75K 31.70*** 41.98*** -54.28*** 38.30*** 44.05*** 15.49*** 13.34***(0.80) (0.80) (20.76) (1.07) (1.12) (1.32) (2.08)
75K <= Loan Amount < 150K 13.03*** 15.97*** -45.86** 18.94*** 19.14*** 11.00*** 5.19***(0.49) (0.48) (20.78) (0.68) (0.62) (0.78) (1.17)
150K <= Loan Amount < 200K 2.50*** 4.88*** -17.96 8.36*** 6.97*** 3.02*** -1.00(0.47) (0.46) (20.98) (0.66) (0.57) (0.70) (1.02)
Appendix 6: Results of APR Regressions Estimated Over Subsets of Data
- 74 -Case3:08-cv-00369-TEH Document181 Filed04/01/10 Page74 of 91
Smith 3343

Model (4) Model (4-L1) Model (4-L2) Model (4-2004) Model (4-2005) Model (4-2006) Model (4-2007)
Dependent variable: APR (basis points) First lien loans onlySubordinate lien
loans only 2004 loans only 2005 loans only 2006 loans only 2007 loans only200K <= Loan Amount < 300K -1.74*** -0.03 -8.00 2.49*** 2.25*** -0.89 -4.76***
(0.39) (0.38) (21.48) (0.59) (0.46) (0.54) (0.81)300K <= Loan Amount < 500K -5.40*** -4.56*** 33.70 -1.61*** -1.41*** -2.98*** -5.09***
(0.34) (0.34) (25.86) (0.55) (0.38) (0.44) (0.67)40% < total debt ratio <= 45% 7.96*** 8.09*** 7.21*** 2.52*** 3.12*** 5.17*** 3.35***
(0.31) (0.29) (1.04) (0.50) (0.41) (0.45) (0.65)Total debt ratio > 45% -7.13*** -10.51*** 18.00*** -5.27*** -5.69*** -2.92*** -6.36***
(0.52) (0.49) (1.81) (0.75) (0.68) (0.91) (0.96)No total debt ratio 14.33*** 10.68* 33.65*** 16.63*** 3.06 3.51 -4.18
(5.42) (5.58) (11.37) (6.44) (9.51) (6.83) (17.46)(First lien) x (LTV missing) -15.57 -9.39 -26.87 -101.25***
(11.63) (11.92) (21.86) (19.46)(First lien) x (0% < LTV <= 60%) -100.67*** -102.17*** -91.55*** -90.67*** -101.44*** -107.58***
(0.71) (0.71) (0.95) (1.16) (1.49) (1.06)(First lien) x (60% < LTV <= 70%) -95.72*** -95.36*** -84.84*** -85.37*** -97.50*** -107.67***
(0.69) (0.69) (0.94) (1.13) (1.47) (0.99)(First lien) x (70% < LTV <= 80%) -84.74*** -83.69*** -73.07*** -77.43*** -83.12*** -90.94***
(0.60) (0.61) (0.83) (1.05) (1.38) (0.73)(Subordinate lien) x (CLTV missing) -44.26 -72.04* -153.95*** -52.12
(27.49) (37.95) (25.26) (32.26)(Subordinate lien) x (0% < CLTV <= 80%) -103.67*** -166.12*** -100.95*** -118.91*** -102.74*** -98.56***
(2.81) (2.23) (5.88) (4.98) (3.88) (10.69)(Subordinate lien) x (80% < CLTV <= 90%) -34.99*** -85.95*** -22.62*** -43.49*** -34.40*** -39.09***
(1.24) (1.10) (3.46) (2.39) (1.59) (3.76)HELOC -46.16*** -21.64 -175.82*** -11.81
(11.34) (14.31) (16.08) (15.37)FHA/VA -123.17*** -123.36*** -100.45*** -94.46*** -86.96*** -91.53***
(3.98) (3.94) (7.73) (6.43) (5.16) (5.06)Coapplicant present -2.75*** -2.39*** -2.35** -2.85*** -1.97*** -2.27*** -5.34***
(0.24) (0.23) (0.92) (0.33) (0.29) (0.38) (0.56)Self-employed borrower or co-borrower 15.31*** 16.09*** 3.81* -2.21***
(0.77) (0.73) (2.27) (0.60)Documentation typeAlternative Doc -18.09*** -33.71*** 52.70***
(4.90) (4.93) (3.50)Low Doc 48.84*** 47.77*** 6.00 54.64** 51.02*** 14.85
(13.75) (13.99) (20.09) (27.70) (8.95) (18.04)NED -44.66*** -49.26*** 0.88
(5.91) (6.23) (7.68)NID 59.10*** 54.22*** 115.48*** 46.45*** 60.84*** 78.74*** 68.66***
(5.50) (5.64) (11.73) (6.68) (9.65) (6.95) (17.46)NID/NAD 104.47*** 104.14*** 77.54*** 75.11*** 105.55*** 94.00***
(6.62) (6.78) (7.23) (10.81) (9.15) (19.51)NID/NAV 134.98*** 134.77*** 89.57*** 139.51*** 91.57*** 72.19***
(7.10) (7.19) (7.73) (15.59) (8.53) (20.16)
- 75 -Case3:08-cv-00369-TEH Document181 Filed04/01/10 Page75 of 91
Smith 3344

Model (4) Model (4-L1) Model (4-L2) Model (4-2004) Model (4-2005) Model (4-2006) Model (4-2007)
Dependent variable: APR (basis points) First lien loans onlySubordinate lien
loans only 2004 loans only 2005 loans only 2006 loans only 2007 loans onlyNID/NED 84.00*** 82.55*** 66.42*** 79.59*** 101.67*** 90.94***
(5.72) (5.88) (6.64) (9.78) (7.49) (18.20)NID/NED/NAD 95.37*** 95.54*** -68.13*** 81.79*** 95.77*** 108.25*** 81.92***
(5.48) (5.64) (24.10) (6.49) (9.57) (6.97) (17.48)NIV/NAV 44.72*** 38.47*** 127.10*** 19.92*** 30.30*** 61.89*** 52.97***
(0.60) (0.57) (2.76) (0.79) (0.76) (0.99) (1.10)Stated Income 43.87*** 37.31*** 109.68*** 31.19*** 34.23*** 53.78*** 48.18***
(0.29) (0.28) (1.11) (0.37) (0.37) (0.57) (0.81)Streamlined Refi 10.74 7.52 -33.16 48.51
(36.28) (35.50) (29.43) (44.38)Unknown doc type -21.24** -30.03*** 20.95 -29.72** 12.69
(10.14) (10.29) (45.40) (12.46) (9.42)Lender paid mortgage insurance 8.43 14.91***
(7.51) (3.36)Escrow/impound waiver indicator = 'Y' or 'Yes Impounds' -2.29*** -3.66***
(0.30) (0.34)Loan purpose: Home improvement 7.15*** 6.50*** 30.50*** 0.95
(1.03) (0.99) (6.01) (1.79)Loan purpose: Refinance 1.70*** 1.50*** 24.04*** -5.20***
(0.25) (0.23) (0.95) (0.36)Cash-out refinance 0.92*** 15.95*** 7.36***
(0.35) (0.43) (0.65)Rate & term refinance -5.69*** -0.65 -4.89***
(0.39) (0.46) (0.67)Rate lock >= 30 days -1.11** 0.72 1.12
(0.55) (0.48) (0.72)No prepayment penalty 2.64***
(0.41)1-yr prepayment penalty 1.57** 3.25***
(0.65) (0.48)Prepayment penalty > 1 year 6.01*** 0.08
(0.32) (0.42)Loan term5-year term 88.48*** -1.91 404.20*** -80.18*** 102.57***
(3.24) (6.61) (20.87) (6.29) (4.57)7-year term 13.89* 14.27* -67.03*** 0.52 7.39***
(8.04) (7.79) (7.84) (1.28) (1.90)10-year term 99.86** 9.17 60.18* 151.65*** -6.63 73.41** 282.48***
(43.16) (31.73) (32.58) (15.89) (48.40) (34.95) (6.43)15-year term 79.11*** 54.77*** 19.61 99.31*** 113.18*** -24.24 -6.67
(10.72) (14.11) (13.01) (15.39) (13.59) (45.21) (54.19)20-year term -7.19 -40.80*** -139.03*** -41.19*** -17.34*** -7.73***
(7.73) (13.58) (14.63) (13.72) (2.35) (2.81)25-year term 42.54*** 20.16 67.45*** 75.35*** -140.24*** -8.63
(12.21) (14.12) (16.87) (18.90) (6.53) (12.76)
- 76 -Case3:08-cv-00369-TEH Document181 Filed04/01/10 Page76 of 91
Smith 3345

Model (4) Model (4-L1) Model (4-L2) Model (4-2004) Model (4-2005) Model (4-2006) Model (4-2007)
Dependent variable: APR (basis points) First lien loans onlySubordinate lien
loans only 2004 loans only 2005 loans only 2006 loans only 2007 loans only40-year term 21.48*** 20.74*** 18.26*** 13.16*** 10.79***
(0.45) (0.45) (0.48) (0.59) (1.48)Loan payment termsARM (unknown term) -190.04*** -189.89*** -284.40*** 22.47***
(2.30) (2.27) (1.88) (7.34)ARM 10YR/1YR 5.75 3.41 -83.07*** 4.70 51.82*** 24.92
(4.57) (4.43) (4.68) (5.04) (3.25) (18.74)ARM 10YR/6MO 6.88*** 12.53*** -88.96*** 20.84*** 57.84*** 57.18***
(1.03) (1.03) (1.56) (2.21) (1.92) (2.33)ARM 1MO/1MO -167.38*** -167.21*** -47.91 -273.70*** -91.94*** 21.17
(1.01) (1.02) (30.25) (0.92) (1.74) (13.07)ARM 1MO/1YR -34.27*** -31.09*** -223.71*** -59.12*** 30.50*** 118.34***
(0.39) (0.38) (1.38) (0.46) (0.54) (1.00)ARM 1MO/2YR 9.68*** 12.20*** -26.23*** 58.86*** 127.24***
(2.08) (2.12) (3.25) (2.42) (5.47)ARM 1MO/3YR 21.23*** 24.32*** -19.37*** 65.19*** 128.13***
(1.57) (1.58) (2.49) (1.83) (3.16)ARM 1MO/5YR 22.03*** 24.13*** -18.92*** 67.56*** 129.08***
(1.41) (1.41) (2.27) (1.64) (3.13)ARM 1YR/10YR -199.42*** -110.42*** -97.49***
(43.15) (31.71) (35.05)ARM 1YR/1MO -105.26*** -102.05*** -39.56*** 6.07
(9.44) (9.48) (11.47) (7.52)ARM 1YR/1YR -21.15*** -20.55*** -183.54*** 4.61*** 67.17***
(1.11) (1.07) (1.34) (0.74) (4.95)ARM 1YR/25YR -219.72*** -197.27*** -272.58***
(23.53) (21.98) (20.76)ARM 1YR/30YR -143.86*** -142.41*** -198.16*** -69.81*** 9.38**
(5.10) (5.16) (11.67) (8.11) (4.17)ARM 2YR/1MO -160.85*** -154.64*** -27.48***
(10.49) (10.67) (8.96)ARM 2YR/6MO -0.72 -0.09 4.22 -10.81*** 64.87*** 82.76***
(0.69) (0.67) (7.21) (0.75) (1.12) (2.86)ARM 3MO/1YR -63.69*** -63.43*** -196.71*** -57.39*** 34.09*
(0.79) (0.75) (1.56) (0.77) (17.80)ARM 3MO/2YR -18.45*** -18.71*** -25.86***
(6.48) (6.36) (5.98)ARM 3MO/3YR -9.68 -10.25 -16.17**
(6.69) (6.59) (6.60)ARM 3MO/5YR -0.99 -3.51 -9.49
(8.88) (8.43) (8.92)ARM 3YR/10YR -105.82** -14.30 -284.65***
(43.27) (31.77) (16.81)ARM 3YR/15YR -140.81*** -111.30*** -238.10*** -201.61*** -25.17
(16.12) (18.36) (18.74) (23.70) (54.39)
- 77 -Case3:08-cv-00369-TEH Document181 Filed04/01/10 Page77 of 91
Smith 3346

Model (4) Model (4-L1) Model (4-L2) Model (4-2004) Model (4-2005) Model (4-2006) Model (4-2007)
Dependent variable: APR (basis points) First lien loans onlySubordinate lien
loans only 2004 loans only 2005 loans only 2006 loans only 2007 loans onlyARM 3YR/1MO -119.77*** -114.30*** -7.97
(9.77) (9.86) (9.26)ARM 3YR/1YR -55.02*** -54.66*** -177.12*** -38.24*** 26.23*** 69.95***
(2.11) (2.05) (2.72) (3.51) (2.79) (7.55)ARM 3YR/20YR -39.95** -6.82
(15.69) (31.92)ARM 3YR/25YR -47.40*** -18.56 -166.37*** -104.08*** 157.88***
(12.82) (14.62) (17.41) (24.24) (32.13)ARM 3YR/30YR -44.04*** -42.11*** -117.37*** -53.26*** -48.44*** -20.99***
(4.29) (4.33) (9.40) (9.43) (7.70) (7.92)ARM 3YR/6MO -68.82*** -65.43*** -746.16*** -191.58*** -36.58*** 44.93*** 63.97***
(0.40) (0.40) (21.45) (0.50) (0.45) (0.52) (1.18)ARM 4YR/1YR 5.60 2.93 56.02*** 68.48***
(3.82) (3.56) (4.56) (3.15)ARM 5YR/10YR -14.46 82.24* -131.40*** 14.42
(56.41) (49.45) (28.95) (35.43)ARM 5YR/15YR -74.10*** -43.58** -169.17*** -137.43*** 30.26 44.73
(15.86) (18.15) (19.86) (29.32) (46.05) (54.28)ARM 5YR/1MO -121.23*** -113.85*** -1.04
(16.63) (15.82) (10.03)ARM 5YR/1YR -37.74*** -38.80*** -160.23*** -31.01*** 33.16*** 64.55***
(1.05) (1.01) (1.70) (1.45) (1.40) (4.41)ARM 5YR/20YR 36.78** 55.73*** -12.48
(15.49) (17.02) (12.24)ARM 5YR/25YR -21.81* 5.79 -115.99*** -127.35*** 91.06*** 23.66
(12.95) (14.76) (17.42) (22.51) (9.85) (21.67)ARM 5YR/30YR -91.21*** -89.48*** -71.11*** -61.95*** -53.79*** -16.23***
(2.98) (3.01) (12.26) (9.32) (6.37) (3.00)ARM 5YR/6MO -28.28*** -24.48*** -161.71*** -16.29*** 36.72*** 64.24***
(0.37) (0.36) (0.48) (0.47) (0.49) (0.59)ARM 6MO/6MO -168.23*** -168.94*** -62.00*** -257.13*** -114.69*** 73.80***
(0.58) (0.58) (20.73) (0.60) (1.35) (22.71)ARM 6YR/1YR -14.26*** -16.28*** 52.04*** 71.54***
(3.50) (3.23) (4.71) (10.27)ARM 7YR/1YR -21.83*** -26.08*** -107.07*** -29.90*** 30.52*** 39.99*
(1.19) (1.13) (4.70) (1.47) (1.91) (23.83)ARM 7YR/6MO -21.00*** -18.02*** -129.22*** -11.38*** 30.33*** 45.51***
(0.76) (0.74) (1.37) (1.35) (1.11) (1.37)Balloon (unknown term) 152.33*** 181.92*** 70.15***
(10.80) (14.17) (15.45)20/10 Balloon -80.75 15.10 -181.11*** -74.79
(60.95) (55.61) (16.70) (54.39)25/10 Balloon -132.63*** -38.30 -264.17*** 4.81 -76.46*
(47.48) (37.14) (16.65) (51.05) (40.05)
- 78 -Case3:08-cv-00369-TEH Document181 Filed04/01/10 Page78 of 91
Smith 3347

Model (4) Model (4-L1) Model (4-L2) Model (4-2004) Model (4-2005) Model (4-2006) Model (4-2007)
Dependent variable: APR (basis points) First lien loans onlySubordinate lien
loans only 2004 loans only 2005 loans only 2006 loans only 2007 loans only25/15 Balloon -142.34*** -112.86*** 21.99
(44.29) (41.28) (61.07)30/10 Balloon -157.50*** -63.80** -245.33*** -64.08 -101.52*** -261.74***
(43.22) (31.81) (17.82) (49.42) (35.20) (7.29)30/15 Balloon -83.89*** -49.20*** -3.55 -116.23*** -127.69*** 46.80 35.03
(10.73) (14.15) (13.06) (15.38) (13.40) (45.18) (54.20)40/10 Balloon -141.23*** -46.52 -254.82***
(44.99) (33.81) (10.78)40/15 Balloon -109.47*** -79.24*** 33.40
(12.00) (15.02) (54.36)40/30 Balloon -29.49*** -26.04*** -12.29*** 10.48*** 19.54***
(1.38) (1.34) (2.22) (1.69) (3.46)5/25 Balloon -90.07***
(7.29)10-year fixed -83.19* 3.38 -49.92 -191.06*** -28.82 -51.55 -246.69***
(43.27) (33.79) (32.67) (21.50) (52.59) (34.74) (16.27)15-year fixed -88.81*** -65.82*** -21.30 -142.66*** -141.97*** 9.71 -6.77
(10.73) (14.13) (13.10) (15.38) (13.56) (45.23) (54.23)20-year fixed -0.93 30.30** 126.61*** 23.75*
(8.06) (13.77) (14.84) (14.00)40-year fixed -51.43*** -48.89*** -150.11*** -6.31**
(2.20) (2.20) (2.47) (2.50)Unknown term -90.94*** -85.36*** -34.50 -31.39**
(11.05) (10.55) (46.16) (12.95)Property & residence typeInvesment, unknown type 79.06*** 69.42*** 169.94*** 70.27*** 39.89*** 96.54***
(2.38) (2.41) (7.81) (1.53) (14.59) (20.51)Invesment, Commercial - Mixed use w/ residential 66.00*** 62.55*** 97.24*** 96.12*** 47.92*** 62.32***
(2.73) (2.76) (4.78) (8.84) (6.61) (3.01)Invesment, Commercial - Mixed use w/o residential 56.48*** 55.21*** 141.93*** 42.01*** 84.41***
(3.77) (3.80) (19.62) (9.36) (3.34)Invesment, Commercial - Multi-family > 4 41.46*** 38.67*** 87.94*** 70.81*** 28.72*** 55.96***
(2.31) (2.35) (4.99) (8.80) (6.36) (2.29)Invesment, Commercial - Other 77.34*** 70.88*** 86.86***
(11.59) (12.27) (14.37)Invesment, Condo - High Rise 45.93*** 39.04*** 176.50*** 47.97*** 35.83*** 55.16*** 67.87***
(1.66) (1.54) (10.50) (2.63) (1.54) (3.13) (4.62)Invesment, Condo - Low Rise 51.28*** 38.81*** 208.29*** 44.79*** 40.38*** 65.91*** 65.10***
(0.72) (0.67) (3.15) (1.14) (0.84) (1.20) (1.86)Invesment, Condo - Mid Rise 58.74*** 46.20*** 209.44*** 60.20*** 36.52*** 62.57*** 63.47***
(3.15) (2.89) (13.38) (6.39) (2.86) (4.90) (5.88)Invesment, Condo - Site 50.39*** 42.93*** 170.57*** 48.72*** 51.41*** 47.99*** 53.48**
(5.06) (4.99) (23.64) (5.53) (7.72) (5.59) (21.47)Invesment, Condotel 32.49** 32.74*** 31.60** 29.73***
(13.14) (12.14) (13.83) (8.84)
- 79 -Case3:08-cv-00369-TEH Document181 Filed04/01/10 Page79 of 91
Smith 3348

Model (4) Model (4-L1) Model (4-L2) Model (4-2004) Model (4-2005) Model (4-2006) Model (4-2007)
Dependent variable: APR (basis points) First lien loans onlySubordinate lien
loans only 2004 loans only 2005 loans only 2006 loans only 2007 loans onlyInvesment, Coop 1.60 -1.37 47.61***
(1.28) (1.27) (1.41)Invesment, Duplex 58.79*** 49.14*** 177.32*** 57.91*** 53.17*** 62.35*** 68.10***
(0.73) (0.72) (2.15) (1.01) (0.95) (1.12) (1.77)Invesment, Fourplex 69.21*** 56.90*** 225.32*** 71.83*** 60.56*** 76.43*** 80.04***
(0.94) (0.90) (2.73) (1.14) (1.24) (1.52) (2.79)Invesment, PUD-1 unit attached 46.70*** 36.59*** 174.51*** 45.81*** 35.25*** 58.28*** 57.81***
(1.08) (1.02) (4.37) (1.69) (1.17) (1.81) (3.16)Invesment, PUD-1 unit detached 49.76*** 41.17*** 158.79*** 49.96*** 41.92*** 55.86*** 58.64***
(0.66) (0.63) (2.15) (0.96) (0.78) (1.12) (1.82)Invesment, PUD-2 units 44.76*** 42.59*** 112.77*** 52.60*** 54.18*** 61.01*** 74.83***
(6.20) (6.55) (26.40) (7.01) (7.17) (7.21) (15.89)Invesment, PUD-3 units 75.72*** 77.64*** 198.39*** 66.12*** 80.17*** 11.40***
(24.90) (25.60) (4.46) (17.47) (19.61) (2.24)Invesment, PUD-4 units 53.88*** 46.66*** 201.87*** 74.40*** 45.49*** 61.70*** 73.07***
(4.32) (4.14) (14.47) (6.66) (5.26) (5.73) (11.20)Invesment, Single Family Attached 52.25*** 37.50*** 173.05*** 45.92*** 48.52*** 62.27*** 62.53***
(1.26) (1.19) (4.89) (1.62) (1.58) (2.23) (3.08)Invesment, Single Family Detached 49.38*** 38.46*** 169.57*** 48.50*** 42.57*** 58.76*** 59.13***
(0.40) (0.38) (1.46) (0.55) (0.50) (0.67) (0.97)Invesment, Triplex 74.07*** 63.14*** 239.21*** 76.54*** 62.78*** 79.80*** 80.58***
(1.27) (1.23) (3.64) (1.50) (1.64) (2.06) (3.19)Primary, unknown type 2.24 2.00 -9.45 5.15*** -39.51** 37.34**
(1.97) (2.00) (7.00) (1.31) (17.14) (18.76)Primary, Commercial - Mixed use w/ residential 119.06*** 116.12*** 105.66*** 140.09*** 40.42***
(18.25) (18.33) (15.88) (28.39) (2.55)Primary, Commercial - Multi-family > 4 150.66*** 146.84*** 150.79*** 140.74*** 17.22**
(33.94) (34.27) (24.90) (32.52) (6.87)Primary, Condo - High Rise 9.13*** 5.79*** 37.50*** 7.29*** 7.02*** 9.83*** 14.60***
(1.20) (1.16) (5.57) (2.66) (1.44) (1.60) (2.75)Primary, Condo - Low Rise 5.32*** 1.92*** 43.05*** 1.95*** 1.88*** 9.67*** 7.80***
(0.48) (0.46) (1.85) (0.73) (0.58) (0.70) (1.10)Primary, Condo - Mid Rise 9.73*** 3.66** 77.78*** 1.77 5.67** 18.29*** 8.45**
(1.86) (1.75) (9.85) (2.89) (2.28) (2.93) (4.26)Primary, Condo - Site 2.09 2.35 15.76** -1.51 2.62 0.07 -4.52
(2.38) (2.20) (7.80) (4.01) (2.62) (3.39) (7.75)Primary, Coop 6.50*** 1.02 7.60** 11.06*** 11.95*** 0.41
(1.65) (1.64) (3.86) (1.95) (1.71) (2.95)Primary, Duplex 11.28*** 8.97*** 35.75*** 15.50*** 10.64*** 13.28*** 17.50***
(0.73) (0.72) (2.84) (1.17) (0.94) (0.98) (1.56)Primary, Fourplex 31.04*** 29.25*** 67.71*** 45.26*** 29.15*** 32.84*** 27.54***
(2.05) (2.03) (8.54) (2.54) (2.39) (2.79) (4.90)Primary, Manufactured Home 13.57* 13.03* 0.70 13.56 23.90*** -0.00
(7.89) (7.76) (24.04) (11.43) (9.27) (8.32)
- 80 -Case3:08-cv-00369-TEH Document181 Filed04/01/10 Page80 of 91
Smith 3349
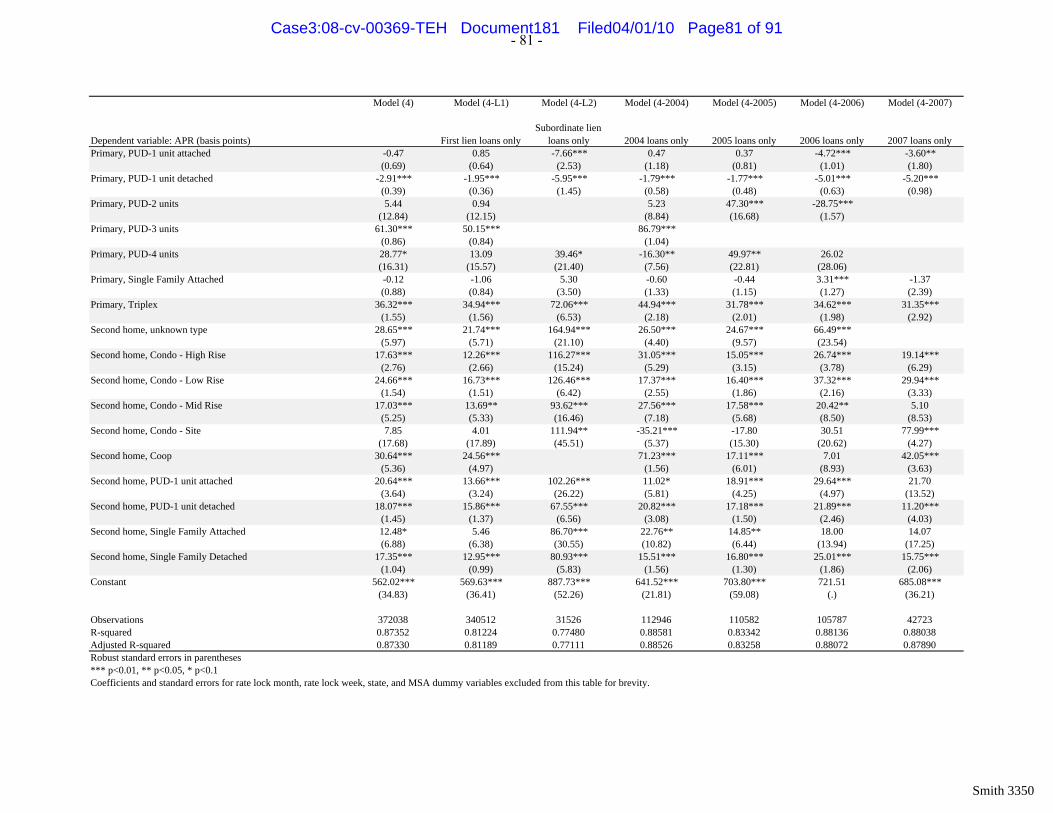
Model (4) Model (4-L1) Model (4-L2) Model (4-2004) Model (4-2005) Model (4-2006) Model (4-2007)
Dependent variable: APR (basis points) First lien loans onlySubordinate lien
loans only 2004 loans only 2005 loans only 2006 loans only 2007 loans onlyPrimary, PUD-1 unit attached -0.47 0.85 -7.66*** 0.47 0.37 -4.72*** -3.60**
(0.69) (0.64) (2.53) (1.18) (0.81) (1.01) (1.80)Primary, PUD-1 unit detached -2.91*** -1.95*** -5.95*** -1.79*** -1.77*** -5.01*** -5.20***
(0.39) (0.36) (1.45) (0.58) (0.48) (0.63) (0.98)Primary, PUD-2 units 5.44 0.94 5.23 47.30*** -28.75***
(12.84) (12.15) (8.84) (16.68) (1.57)Primary, PUD-3 units 61.30*** 50.15*** 86.79***
(0.86) (0.84) (1.04)Primary, PUD-4 units 28.77* 13.09 39.46* -16.30** 49.97** 26.02
(16.31) (15.57) (21.40) (7.56) (22.81) (28.06)Primary, Single Family Attached -0.12 -1.06 5.30 -0.60 -0.44 3.31*** -1.37
(0.88) (0.84) (3.50) (1.33) (1.15) (1.27) (2.39)Primary, Triplex 36.32*** 34.94*** 72.06*** 44.94*** 31.78*** 34.62*** 31.35***
(1.55) (1.56) (6.53) (2.18) (2.01) (1.98) (2.92)Second home, unknown type 28.65*** 21.74*** 164.94*** 26.50*** 24.67*** 66.49***
(5.97) (5.71) (21.10) (4.40) (9.57) (23.54)Second home, Condo - High Rise 17.63*** 12.26*** 116.27*** 31.05*** 15.05*** 26.74*** 19.14***
(2.76) (2.66) (15.24) (5.29) (3.15) (3.78) (6.29)Second home, Condo - Low Rise 24.66*** 16.73*** 126.46*** 17.37*** 16.40*** 37.32*** 29.94***
(1.54) (1.51) (6.42) (2.55) (1.86) (2.16) (3.33)Second home, Condo - Mid Rise 17.03*** 13.69** 93.62*** 27.56*** 17.58*** 20.42** 5.10
(5.25) (5.33) (16.46) (7.18) (5.68) (8.50) (8.53)Second home, Condo - Site 7.85 4.01 111.94** -35.21*** -17.80 30.51 77.99***
(17.68) (17.89) (45.51) (5.37) (15.30) (20.62) (4.27)Second home, Coop 30.64*** 24.56*** 71.23*** 17.11*** 7.01 42.05***
(5.36) (4.97) (1.56) (6.01) (8.93) (3.63)Second home, PUD-1 unit attached 20.64*** 13.66*** 102.26*** 11.02* 18.91*** 29.64*** 21.70
(3.64) (3.24) (26.22) (5.81) (4.25) (4.97) (13.52)Second home, PUD-1 unit detached 18.07*** 15.86*** 67.55*** 20.82*** 17.18*** 21.89*** 11.20***
(1.45) (1.37) (6.56) (3.08) (1.50) (2.46) (4.03)Second home, Single Family Attached 12.48* 5.46 86.70*** 22.76** 14.85** 18.00 14.07
(6.88) (6.38) (30.55) (10.82) (6.44) (13.94) (17.25)Second home, Single Family Detached 17.35*** 12.95*** 80.93*** 15.51*** 16.80*** 25.01*** 15.75***
(1.04) (0.99) (5.83) (1.56) (1.30) (1.86) (2.06)Constant 562.02*** 569.63*** 887.73*** 641.52*** 703.80*** 721.51 685.08***
(34.83) (36.41) (52.26) (21.81) (59.08) (.) (36.21)
Observations 372038 340512 31526 112946 110582 105787 42723R-squared 0.87352 0.81224 0.77480 0.88581 0.83342 0.88136 0.88038Adjusted R-squared 0.87330 0.81189 0.77111 0.88526 0.83258 0.88072 0.87890Robust standard errors in parentheses*** p<0.01, ** p<0.05, * p<0.1Coefficients and standard errors for rate lock month, rate lock week, state, and MSA dummy variables excluded from this table for brevity.
- 81 -Case3:08-cv-00369-TEH Document181 Filed04/01/10 Page81 of 91
Smith 3350

Model (4) Model (4-RF) Model (4-X) Model (4-Y)
Dependent variable: APR (basis points)Interact Race &
FICOInteract Ethnicity &
Race
Allow Multiple Race
Classifications
Race: African American 9.44***(0.44)
Race: Hispanic 7.64***(0.32)
Race: American Indian -5.83***(2.02)
Race: Asian 2.61***(0.39)
Race: Hawaiian 4.36***(1.08)
Race: Missing 4.08***(0.42)
American Indian, non-Hispanic -5.90***(2.02)
American Indian, Hispanic 3.82***(1.39)
Asian, non-Hispanic 2.60***(0.39)
Asian, Hispanic 8.11***(2.22)
African American, non-Hispanic 9.50***(0.45)
African American, Hispanic 6.90***(2.46)
Hawaiian, non-Hispanic 4.34***(1.08)
Hawaiian, Hispanic 10.77***(2.39)
Missing, non-Hispanic 4.08***(0.42)
Missing, Hispanic 11.49***(1.26)
White, Hispanic 7.46***(0.33)
Black 5.19***(0.92)
Hispanic 7.29***(0.32)
Asian -1.38(0.87)
American Indian -7.80***(1.30)
Hawaiian 0.66(1.18)
White -4.10***(0.84)
Missing -0.05(0.93)
Appendix 7: Results of APR Regressions Estimated Using Alternative Race Classifications
- 82 -Case3:08-cv-00369-TEH Document181 Filed04/01/10 Page82 of 91
Smith 3351

Model (4) Model (4-RF) Model (4-X) Model (4-Y)
Dependent variable: APR (basis points)Interact Race &
FICOInteract Ethnicity &
Race
Allow Multiple Race
Classifications(FICO missing) x African American 33.61**
(14.62)(FICO < 600) x African American 64.98***
(23.15)(600 <= FICO < 620) x African American 35.53**
(17.95)(620 <= FICO < 640) x African American 4.57*
(2.58)(640 <= FICO < 660) x African American 11.59***
(1.51)(660 <= FICO < 680) x African American 12.69***
(1.04)(680 <= FICO < 700) x African American 10.83***
(0.94)(700 <= FICO < 720) x African American 9.15***
(0.95)(720 <= FICO < 740) x African American 8.12***
(1.15)(FICO >= 740) x African American 6.66***
(0.93)(FICO missing) x Hispanic 37.38***
(9.82)(FICO < 600) x Hispanic 22.60
(26.29)(600 <= FICO < 620) x Hispanic -28.33**
(13.88)(620 <= FICO < 640) x Hispanic 6.49***
(2.39)(640 <= FICO < 660) x Hispanic 11.63***
(1.18)(660 <= FICO < 680) x Hispanic 12.24***
(0.78)(680 <= FICO < 700) x Hispanic 10.21***
(0.67)(700 <= FICO < 720) x Hispanic 7.11***
(0.66)(720 <= FICO < 740) x Hispanic 6.47***
(0.77)(FICO >= 740) x Hispanic 3.54***
(0.56)(FICO missing) x American Indian -33.44***
(10.07)(FICO < 600) x American Indian -129.58***
(12.70)(600 <= FICO < 620) x American Indian -104.06***
(11.04)(620 <= FICO < 640) x American Indian 0.11
(8.85)(640 <= FICO < 660) x American Indian -6.72
(5.89)(660 <= FICO < 680) x American Indian -7.59
(4.67)
- 83 -Case3:08-cv-00369-TEH Document181 Filed04/01/10 Page83 of 91
Smith 3352

Model (4) Model (4-RF) Model (4-X) Model (4-Y)
Dependent variable: APR (basis points)Interact Race &
FICOInteract Ethnicity &
Race
Allow Multiple Race
Classifications(680 <= FICO < 700) x American Indian 13.04**
(5.39)(700 <= FICO < 720) x American Indian 11.37**
(4.65)(720 <= FICO < 740) x American Indian -0.35
(4.27)(FICO >= 740) x American Indian -4.06
(3.24)(FICO missing) x Asian 9.31
(10.61)(FICO < 600) x Asian 73.03**
(32.52)(600 <= FICO < 620) x Asian -41.30**
(19.18)(620 <= FICO < 640) x Asian 8.39**
(3.74)(640 <= FICO < 660) x Asian 5.15***
(1.92)(660 <= FICO < 680) x Asian 3.98***
(1.20)(680 <= FICO < 700) x Asian 2.70***
(0.93)(700 <= FICO < 720) x Asian 1.79**
(0.86)(720 <= FICO < 740) x Asian 1.87**
(0.94)(FICO >= 740) x Asian 2.14***
(0.62)(FICO missing) x Hawaiian 5.41
(18.89)(FICO < 600) x Hawaiian -84.09*
(48.99)(600 <= FICO < 620) x Hawaiian -23.84
(46.64)(620 <= FICO < 640) x Hawaiian 1.48
(8.78)(640 <= FICO < 660) x Hawaiian 13.91***
(5.40)(660 <= FICO < 680) x Hawaiian 8.57***
(2.87)(680 <= FICO < 700) x Hawaiian 6.01**
(2.56)(700 <= FICO < 720) x Hawaiian 5.12**
(2.50)(720 <= FICO < 740) x Hawaiian 1.50
(2.86)(FICO >= 740) x Hawaiian 0.82
(1.92)(FICO missing) x Missing race -40.96***
(10.62)(FICO < 600) x Missing race -9.82
(26.47)
- 84 -Case3:08-cv-00369-TEH Document181 Filed04/01/10 Page84 of 91
Smith 3353

Model (4) Model (4-RF) Model (4-X) Model (4-Y)
Dependent variable: APR (basis points)Interact Race &
FICOInteract Ethnicity &
Race
Allow Multiple Race
Classifications(600 <= FICO < 620) x Missing race -27.06**
(13.73)(620 <= FICO < 640) x Missing race 1.41
(3.05)(640 <= FICO < 660) x Missing race 6.23***
(1.70)(660 <= FICO < 680) x Missing race 7.39***
(1.15)(680 <= FICO < 700) x Missing race 5.58***
(0.98)(700 <= FICO < 720) x Missing race 2.71***
(0.94)(720 <= FICO < 740) x Missing race 5.05***
(1.12)(FICO >= 740) x Missing race 2.51***
(0.71)Subordinate lien 235.06*** 235.19*** 235.09*** 235.08***
(1.23) (1.22) (1.23) (1.23)Missing FICO 64.49*** 63.91*** 64.45*** 64.37***
(4.37) (5.88) (4.36) (4.36)300 <= FICO < 600 113.47*** 142.36*** 113.44*** 113.26***
(6.93) (11.69) (6.92) (6.93)600 <= FICO < 620 87.81*** 104.94*** 87.81*** 87.83***
(4.90) (7.54) (4.90) (4.90)620 <= FICO < 640 40.29*** 40.00*** 40.30*** 40.30***
(0.91) (1.27) (0.91) (0.91)640 <= FICO < 660 38.08*** 35.68*** 38.07*** 38.07***
(0.51) (0.69) (0.51) (0.51)660 <= FICO < 680 24.88*** 22.23*** 24.88*** 24.89***
(0.37) (0.49) (0.37) (0.37)680 <= FICO < 700 13.31*** 11.55*** 13.31*** 13.31***
(0.32) (0.43) (0.32) (0.32)700 <= FICO < 720 4.08*** 3.37*** 4.09*** 4.09***
(0.31) (0.41) (0.31) (0.31)720 <= FICO < 740 1.79*** 1.15** 1.79*** 1.79***
(0.34) (0.45) (0.34) (0.34)0K <= Loan Amount < 40K 47.99*** 47.81*** 47.98*** 48.01***
(1.31) (1.31) (1.31) (1.31)40K <= Loan Amount < 50K 35.05*** 34.78*** 35.05*** 35.08***
(1.35) (1.35) (1.35) (1.35)50K <= Loan Amount < 75K 31.70*** 31.54*** 31.71*** 31.73***
(0.80) (0.80) (0.80) (0.80)75K <= Loan Amount < 150K 13.03*** 12.91*** 13.04*** 13.05***
(0.49) (0.49) (0.49) (0.49)150K <= Loan Amount < 200K 2.50*** 2.39*** 2.50*** 2.52***
(0.47) (0.47) (0.47) (0.47)200K <= Loan Amount < 300K -1.74*** -1.81*** -1.73*** -1.72***
(0.39) (0.39) (0.39) (0.39)300K <= Loan Amount < 500K -5.40*** -5.43*** -5.40*** -5.39***
(0.34) (0.34) (0.34) (0.34)40% < total debt ratio <= 45% 7.96*** 7.92*** 7.96*** 7.97***
(0.31) (0.31) (0.31) (0.31)
- 85 -Case3:08-cv-00369-TEH Document181 Filed04/01/10 Page85 of 91
Smith 3354

Model (4) Model (4-RF) Model (4-X) Model (4-Y)
Dependent variable: APR (basis points)Interact Race &
FICOInteract Ethnicity &
Race
Allow Multiple Race
ClassificationsTotal debt ratio > 45% -7.13*** -7.27*** -7.13*** -7.13***
(0.52) (0.52) (0.52) (0.52)No total debt ratio 14.33*** 15.19*** 14.35*** 14.30***
(5.42) (5.50) (5.42) (5.42)(First lien) x (LTV missing) -15.57 -16.08 -15.44 -15.45
(11.63) (11.72) (11.63) (11.63)(First lien) x (0% < LTV <= 60%) -100.67*** -100.74*** -100.66*** -100.67***
(0.71) (0.71) (0.71) (0.71)(First lien) x (60% < LTV <= 70%) -95.72*** -95.74*** -95.71*** -95.72***
(0.69) (0.69) (0.69) (0.69)(First lien) x (70% < LTV <= 80%) -84.74*** -84.70*** -84.73*** -84.73***
(0.60) (0.60) (0.60) (0.60)(Subordinate lien) x (CLTV missing) -44.26 -51.08* -44.14 -43.69
(27.49) (27.52) (27.49) (27.66)(Subordinate lien) x (0% < CLTV <= 80%) -103.67*** -103.70*** -103.68*** -103.69***
(2.81) (2.81) (2.81) (2.81)(Subordinate lien) x (80% < CLTV <= 90%) -34.99*** -35.07*** -34.99*** -34.99***
(1.24) (1.24) (1.24) (1.24)HELOC -46.16*** -46.34*** -46.13*** -46.18***
(11.34) (11.32) (11.35) (11.36)FHA/VA -123.17*** -104.22*** -122.95*** -124.24***
(3.98) (4.04) (3.97) (3.78)Coapplicant present -2.75*** -2.76*** -2.75*** -2.70***
(0.24) (0.24) (0.24) (0.24)Self-employed borrower or co-borrower 15.31*** 15.18*** 15.31*** 15.31***
(0.77) (0.77) (0.77) (0.77)Documentation typeAlternative Doc -18.09*** -18.60*** -17.84*** -17.88***
(4.90) (4.89) (4.90) (4.90)Low Doc 48.84*** 47.49*** 48.85*** 48.80***
(13.75) (13.85) (13.75) (13.76)NED -44.66*** -46.43*** -44.68*** -44.64***
(5.91) (5.98) (5.91) (5.91)NID 59.10*** 58.20*** 59.05*** 59.11***
(5.50) (5.57) (5.50) (5.49)NID/NAD 104.47*** 103.96*** 104.34*** 104.38***
(6.62) (6.68) (6.61) (6.61)NID/NAV 134.98*** 134.42*** 134.88*** 134.95***
(7.10) (7.17) (7.10) (7.10)NID/NED 84.00*** 83.04*** 83.99*** 83.99***
(5.72) (5.79) (5.72) (5.72)NID/NED/NAD 95.37*** 94.33*** 95.32*** 95.38***
(5.48) (5.56) (5.48) (5.48)NIV/NAV 44.72*** 44.90*** 44.73*** 44.72***
(0.60) (0.60) (0.60) (0.60)Stated Income 43.87*** 43.91*** 43.87*** 43.86***
(0.29) (0.29) (0.29) (0.29)Streamlined Refi 10.74 -31.26 7.88 9.35
(36.28) (39.93) (36.40) (36.34)Unknown doc type -21.24** -28.37*** -21.11** -21.03**
(10.14) (10.61) (10.14) (10.14)
- 86 -Case3:08-cv-00369-TEH Document181 Filed04/01/10 Page86 of 91
Smith 3355

Model (4) Model (4-RF) Model (4-X) Model (4-Y)
Dependent variable: APR (basis points)Interact Race &
FICOInteract Ethnicity &
Race
Allow Multiple Race
ClassificationsLoan purpose: Home improvement 7.15*** 7.21*** 7.13*** 7.13***
(1.03) (1.03) (1.03) (1.03)Loan purpose: Refinance 1.70*** 1.73*** 1.70*** 1.70***
(0.25) (0.25) (0.25) (0.25)Loan term5-year term 88.48*** 88.61*** 88.47*** 88.40***
(3.24) (3.24) (3.24) (3.24)7-year term 13.89* 14.23* 13.95* 13.89*
(8.04) (7.98) (8.04) (8.03)10-year term 99.86** 100.73** 99.87** 99.87**
(43.16) (43.45) (43.16) (43.18)15-year term 79.11*** 79.24*** 79.08*** 79.10***
(10.72) (10.70) (10.73) (10.73)20-year term -7.19 -8.01 -7.06 -7.03
(7.73) (7.84) (7.74) (7.74)25-year term 42.54*** 43.39*** 42.56*** 42.62***
(12.21) (12.10) (12.22) (12.22)40-year term 21.48*** 21.48*** 21.47*** 21.47***
(0.45) (0.45) (0.45) (0.45)Loan payment termsARM (unknown term) -190.04*** -190.51*** -189.94*** -189.94***
(2.30) (2.29) (2.30) (2.30)ARM 10YR/1YR 5.75 6.07 5.75 5.80
(4.57) (4.51) (4.57) (4.56)ARM 10YR/6MO 6.88*** 6.88*** 6.89*** 6.89***
(1.03) (1.03) (1.03) (1.04)ARM 1MO/1MO -167.38*** -167.51*** -167.38*** -167.38***
(1.01) (1.01) (1.01) (1.01)ARM 1MO/1YR -34.27*** -34.38*** -34.26*** -34.26***
(0.39) (0.39) (0.39) (0.39)ARM 1MO/2YR 9.68*** 9.57*** 9.69*** 9.68***
(2.08) (2.08) (2.08) (2.08)ARM 1MO/3YR 21.23*** 21.17*** 21.23*** 21.22***
(1.57) (1.57) (1.57) (1.57)ARM 1MO/5YR 22.03*** 21.98*** 22.01*** 22.02***
(1.41) (1.41) (1.41) (1.41)ARM 1YR/10YR -199.42*** -200.05*** -199.36*** -199.29***
(43.15) (43.43) (43.14) (43.16)ARM 1YR/1MO -105.26*** -104.67*** -105.21*** -105.23***
(9.44) (9.57) (9.44) (9.44)ARM 1YR/1YR -21.15*** -21.18*** -21.14*** -21.14***
(1.11) (1.11) (1.11) (1.11)ARM 1YR/25YR -219.72*** -221.88*** -218.39*** -223.31***
(23.53) (23.25) (22.79) (25.70)ARM 1YR/30YR -143.86*** -144.23*** -143.76*** -143.72***
(5.10) (5.08) (5.10) (5.10)ARM 2YR/1MO -160.85*** -161.71*** -160.91*** -160.92***
(10.49) (10.53) (10.49) (10.49)ARM 2YR/6MO -0.72 -1.05 -0.71 -0.70
(0.69) (0.68) (0.69) (0.69)ARM 3MO/1YR -63.69*** -63.82*** -63.69*** -63.70***
(0.79) (0.79) (0.79) (0.79)
- 87 -Case3:08-cv-00369-TEH Document181 Filed04/01/10 Page87 of 91
Smith 3356

Model (4) Model (4-RF) Model (4-X) Model (4-Y)
Dependent variable: APR (basis points)Interact Race &
FICOInteract Ethnicity &
Race
Allow Multiple Race
ClassificationsARM 3MO/2YR -18.45*** -18.31*** -18.42*** -18.40***
(6.48) (6.47) (6.48) (6.48)ARM 3MO/3YR -9.68 -9.69 -9.67 -9.67
(6.69) (6.66) (6.69) (6.69)ARM 3MO/5YR -0.99 -0.75 -1.00 -0.99
(8.88) (8.89) (8.88) (8.88)ARM 3YR/10YR -105.82** -106.13** -105.74** -105.76**
(43.27) (43.57) (43.26) (43.28)ARM 3YR/15YR -140.81*** -139.17*** -140.56*** -140.56***
(16.12) (16.29) (16.12) (16.12)ARM 3YR/1MO -119.77*** -143.25*** -119.78*** -119.55***
(9.77) (11.19) (9.78) (9.78)ARM 3YR/1YR -55.02*** -55.44*** -55.00*** -55.01***
(2.11) (2.13) (2.11) (2.11)ARM 3YR/20YR -39.95** -41.11** -39.89** -39.89**
(15.69) (16.09) (15.69) (15.69)ARM 3YR/25YR -47.40*** -48.12*** -47.27*** -47.33***
(12.82) (12.71) (12.83) (12.83)ARM 3YR/30YR -44.04*** -44.22*** -44.01*** -44.01***
(4.29) (4.30) (4.29) (4.29)ARM 3YR/6MO -68.82*** -68.77*** -68.80*** -68.79***
(0.40) (0.40) (0.40) (0.40)ARM 4YR/1YR 5.60 5.51 5.61 5.69
(3.82) (3.84) (3.82) (3.82)ARM 5YR/10YR -14.46 -14.59 -14.24 -14.21
(56.41) (56.66) (56.39) (56.40)ARM 5YR/15YR -74.10*** -74.84*** -73.96*** -73.95***
(15.86) (15.89) (15.88) (15.88)ARM 5YR/1MO -121.23*** -124.17*** -121.24*** -121.12***
(16.63) (22.42) (16.69) (16.65)ARM 5YR/1YR -37.74*** -37.89*** -37.73*** -37.70***
(1.05) (1.04) (1.05) (1.05)ARM 5YR/25YR -21.81* -22.36* -21.68* -21.72*
(12.95) (12.85) (12.96) (12.96)ARM 5YR/30YR -91.21*** -91.31*** -91.15*** -91.14***
(2.98) (2.99) (2.98) (2.98)ARM 5YR/6MO -28.28*** -28.31*** -28.27*** -28.27***
(0.37) (0.37) (0.37) (0.37)ARM 6MO/6MO -168.23*** -168.28*** -168.21*** -168.21***
(0.58) (0.58) (0.58) (0.58)ARM 6YR/1YR -14.26*** -14.34*** -14.24*** -14.25***
(3.50) (3.48) (3.50) (3.50)ARM 7YR/1YR -21.83*** -22.05*** -21.82*** -21.76***
(1.19) (1.19) (1.19) (1.19)ARM 7YR/6MO -21.00*** -20.97*** -21.01*** -21.00***
(0.76) (0.76) (0.76) (0.76)Balloon (unknown term) 152.33*** 153.06*** 152.35*** 152.29***
(10.80) (10.79) (10.82) (10.82)20/10 Balloon -80.75 -81.00 -80.65 -80.63
(60.95) (61.06) (60.95) (60.96)25/10 Balloon -132.63*** -134.04*** -132.54*** -132.53***
(47.48) (47.73) (47.47) (47.49)
- 88 -Case3:08-cv-00369-TEH Document181 Filed04/01/10 Page88 of 91
Smith 3357

Model (4) Model (4-RF) Model (4-X) Model (4-Y)
Dependent variable: APR (basis points)Interact Race &
FICOInteract Ethnicity &
Race
Allow Multiple Race
Classifications25/15 Balloon -142.34*** -127.68*** -142.20*** -142.22***
(44.29) (33.51) (44.28) (44.24)30/10 Balloon -157.50*** -158.55*** -157.43*** -157.46***
(43.22) (43.51) (43.22) (43.24)30/15 Balloon -83.89*** -83.98*** -83.86*** -83.88***
(10.73) (10.72) (10.75) (10.75)40/10 Balloon -141.23*** -144.55*** -141.15*** -141.15***
(44.99) (45.71) (44.99) (45.01)40/15 Balloon -109.47*** -110.78*** -109.49*** -109.44***
(12.00) (12.05) (12.01) (12.01)40/30 Balloon -29.49*** -29.51*** -29.49*** -29.49***
(1.38) (1.38) (1.37) (1.37)5/25 Balloon -90.07*** -88.60*** -89.94*** -89.82***
(7.29) (7.19) (7.31) (7.30)10-year fixed -83.19* -84.47* -83.15* -83.16*
(43.27) (43.55) (43.27) (43.29)15-year fixed -88.81*** -88.93*** -88.78*** -88.81***
(10.73) (10.72) (10.75) (10.75)20-year fixed -0.93 0.02 -1.03 -1.10
(8.06) (8.17) (8.07) (8.07)40-year fixed -51.43*** -51.48*** -51.44*** -51.46***
(2.20) (2.20) (2.20) (2.20)Unknown term -90.94*** -93.74*** -90.86*** -90.83***
(11.05) (11.29) (11.05) (11.05)Invesment, unknown type 79.06*** 79.28*** 78.97*** 79.00***
(2.38) (2.38) (2.38) (2.38)Invesment, Commercial - Mixed use w/ residential 66.00*** 66.49*** 65.89*** 65.90***
(2.73) (2.73) (2.73) (2.73)Invesment, Commercial - Mixed use w/o residential 56.48*** 56.89*** 56.41*** 56.41***
(3.77) (3.80) (3.77) (3.77)Invesment, Commercial - Multi-family > 4 41.46*** 42.00*** 41.35*** 41.36***
(2.31) (2.31) (2.31) (2.31)Invesment, Commercial - Other 77.34*** 77.53*** 77.25*** 77.25***
(11.59) (11.38) (11.59) (11.59)Invesment, Condo - High Rise 45.93*** 46.03*** 45.91*** 45.87***
(1.66) (1.66) (1.66) (1.66)Invesment, Condo - Low Rise 51.28*** 51.34*** 51.26*** 51.24***
(0.72) (0.72) (0.72) (0.72)Invesment, Condo - Mid Rise 58.74*** 58.83*** 58.71*** 58.69***
(3.15) (3.15) (3.15) (3.15)Invesment, Condo - Site 50.39*** 49.96*** 50.37*** 50.34***
(5.06) (5.07) (5.06) (5.05)Invesment, Condotel 32.49** 32.70** 32.44** 32.41**
(13.14) (12.96) (13.13) (13.15)Invesment, Coop 1.60 3.46*** 1.63 1.63
(1.28) (1.31) (1.28) (1.28)Invesment, Duplex 58.79*** 58.83*** 58.78*** 58.79***
(0.73) (0.73) (0.73) (0.73)Invesment, Fourplex 69.21*** 69.29*** 69.19*** 69.22***
(0.94) (0.94) (0.94) (0.94)Invesment, PUD-1 unit attached 46.70*** 46.77*** 46.69*** 46.66***
(1.08) (1.08) (1.08) (1.08)
- 89 -Case3:08-cv-00369-TEH Document181 Filed04/01/10 Page89 of 91
Smith 3358

Model (4) Model (4-RF) Model (4-X) Model (4-Y)
Dependent variable: APR (basis points)Interact Race &
FICOInteract Ethnicity &
Race
Allow Multiple Race
ClassificationsInvesment, PUD-1 unit detached 49.76*** 49.73*** 49.73*** 49.73***
(0.66) (0.66) (0.66) (0.66)Invesment, PUD-2 units 44.76*** 44.96*** 44.77*** 44.76***
(6.20) (6.21) (6.20) (6.20)Invesment, PUD-3 units 75.72*** 75.51*** 75.70*** 75.71***
(24.90) (25.35) (24.89) (24.88)Invesment, PUD-4 units 53.88*** 53.81*** 53.85*** 53.94***
(4.32) (4.31) (4.32) (4.32)Invesment, Single Family Attached 52.25*** 52.37*** 52.24*** 52.23***
(1.26) (1.26) (1.26) (1.26)Invesment, Single Family Detached 49.38*** 49.41*** 49.37*** 49.36***
(0.40) (0.40) (0.40) (0.40)Invesment, Triplex 74.07*** 74.16*** 74.05*** 74.06***
(1.27) (1.27) (1.27) (1.27)Primary, unknown type 2.24 2.11 1.96 1.98
(1.97) (1.97) (1.97) (1.97)Primary, Commercial - Mixed use w/ residential 119.06*** 119.41*** 119.00*** 119.03***
(18.25) (18.16) (18.25) (18.26)Primary, Commercial - Multi-family > 4 150.66*** 150.68*** 150.59*** 150.61***
(33.94) (33.79) (33.95) (33.95)Primary, Condo - High Rise 9.13*** 9.05*** 9.12*** 9.10***
(1.20) (1.20) (1.20) (1.20)Primary, Condo - Low Rise 5.32*** 5.32*** 5.31*** 5.31***
(0.48) (0.48) (0.48) (0.48)Primary, Condo - Mid Rise 9.73*** 9.61*** 9.71*** 9.72***
(1.86) (1.86) (1.86) (1.86)Primary, Condo - Site 2.09 2.15 2.06 2.12
(2.38) (2.38) (2.38) (2.38)Primary, Coop 6.50*** 6.48*** 6.48*** 6.49***
(1.65) (1.65) (1.65) (1.65)Primary, Duplex 11.28*** 11.25*** 11.31*** 11.31***
(0.73) (0.73) (0.73) (0.73)Primary, Fourplex 31.04*** 30.89*** 31.04*** 31.06***
(2.05) (2.05) (2.05) (2.05)Primary, Manufactured Home 13.57* 6.66 13.62* 13.56*
(7.89) (6.87) (7.88) (7.93)Primary, PUD-1 unit attached -0.47 -0.48 -0.48 -0.49
(0.69) (0.69) (0.69) (0.69)Primary, PUD-1 unit detached -2.91*** -2.93*** -2.93*** -2.94***
(0.39) (0.39) (0.39) (0.39)Primary, PUD-2 units 5.44 2.84 5.25 5.25
(12.84) (12.45) (12.87) (12.87)Primary, PUD-3 units 61.30*** 60.36*** 61.26*** 61.23***
(0.86) (0.87) (0.86) (0.86)Primary, PUD-4 units 28.77* 28.46* 28.73* 28.74*
(16.31) (16.32) (16.30) (16.31)Primary, Single Family Attached -0.12 -0.11 -0.12 -0.11
(0.88) (0.87) (0.88) (0.88)Primary, Triplex 36.32*** 36.25*** 36.34*** 36.38***
(1.55) (1.55) (1.55) (1.55)Second home, unknown type 28.65*** 28.68*** 28.74*** 28.77***
(5.97) (5.98) (5.97) (5.97)
- 90 -Case3:08-cv-00369-TEH Document181 Filed04/01/10 Page90 of 91
Smith 3359

Model (4) Model (4-RF) Model (4-X) Model (4-Y)
Dependent variable: APR (basis points)Interact Race &
FICOInteract Ethnicity &
Race
Allow Multiple Race
ClassificationsSecond home, Condo - High Rise 17.63*** 17.72*** 17.60*** 17.60***
(2.76) (2.76) (2.76) (2.76)Second home, Condo - Low Rise 24.66*** 24.64*** 24.65*** 24.63***
(1.54) (1.54) (1.54) (1.54)Second home, Condo - Mid Rise 17.03*** 16.82*** 17.01*** 17.01***
(5.25) (5.24) (5.25) (5.25)Second home, Condo - Site 7.85 7.49 7.83 7.80
(17.68) (17.62) (17.68) (17.67)Second home, Coop 30.64*** 30.56*** 30.62*** 30.59***
(5.36) (5.34) (5.35) (5.36)Second home, PUD-1 unit attached 20.64*** 20.80*** 20.53*** 20.54***
(3.64) (3.65) (3.64) (3.64)Second home, PUD-1 unit detached 18.07*** 18.03*** 18.04*** 18.02***
(1.45) (1.45) (1.45) (1.45)Second home, Single Family Attached 12.48* 12.53* 12.42* 12.43*
(6.88) (6.88) (6.87) (6.88)Second home, Single Family Detached 17.35*** 17.28*** 17.33*** 17.33***
(1.04) (1.04) (1.04) (1.04)Constant 562.02*** 563.56*** 561.70*** 565.81***
(34.83) (34.72) (34.87) (34.87)
Observations 372038 372038 372038 372038R-squared 0.87352 0.87377 0.87353 0.87353Adjusted R-squared 0.87330 0.87353 0.87331 0.87331Robust standard errors in parentheses*** p<0.01, ** p<0.05, * p<0.1
Coefficients and standard errors for rate lock month, rate lock week, state, and MSA dummy variables excluded from this table forbrevity.Notes : Model (4) assigns each loan to a single race as described in Section V.Model (4-RF) interacts the race and FICO score dummy variables as described in Section V.In estimating Model (4-X), each loan is assigned to a race and ethnicity separately based on the race and ethnicity of the borrower orcoborrower in Defendants’ loan database in a sequential order. Model (4-X) uses the interaction of the assigned race and ethnicityvariables in place of the single race variable from Model (4). To assign each loan to an ethnicity for Model (4-X), I classify the ethnicityof a loan as “Hispanic” if the ethnicity of the borrower or co-borrower is “Hispanic or Latino”. The loan ethnicity is classified as “non-Hispanic” if I do not classify the loan ethnicity as Hispanic. I classify the race of a loan as “African American” if any of the races givenfor either the borrower or co-borrower is African American. Next, I classify the race of a loan as “Asian” if (1) any of the races givenfor either the borrower or co-borrower is Asian, and (2) I do not classify the loan as “African American”. I classify the race of a loan as“American Indian” if (1) any of the races given for either the borrower or co-borrower is American Indian or Alaskan Native, and (2) Ido not classify the loan as “African American”, or “Asian”. I classify the race of a loan as “Hawaiian” if (1) any of the races given foreither the borrower or co-borrower is Native Hawaiian or Other Pacific Islander, and (2) I do not classify the loan as “AfricanAmerican”, “Asian”, or “American Indian”. I classify the race of a loan as “White” if (1) the first race listed for the borrower is White,(2) any other races listed for the borrower is unknown or missing, (3) the co-borrower’s race is White or unknown, and (4) I do notclassify the loan as “African American”, “Asian”, or “American Indian”. I classify the race of all other loans as “Missing”. In estimating Model (4-Y), each loan is assigned to any race or ethnicity that appears in the data for that loan. For example, if the raceof the borrower is African American and the ethnicity of the borrower is Hispanic, then the dummy variables for both “AfricanAmerican” and “Hispanic” are equal to 1 for that loan. If the race of the borrower is African American, the ethnicity of the borrower isnon-Hispanic, the race of the co-borrower is White, and the ethnicity of the co-borrower is Hispanic, then the dummy variables for“African American”, “Hispanic”, and “White” are equal to 1 for that loan.
- 91 -Case3:08-cv-00369-TEH Document181 Filed04/01/10 Page91 of 91
Smith 3360