rainfall climatology of rtff region chennai region
TRANSCRIPT
www.jbaconsulting.com
Rainfall Climatology of RTFF Region
Chennai Region –
Rainfall Climatology and Recent Rainfall
Trends
Y.E.A.Raj(Retd) Deputy Director General of Meteorology & Head
Regional Meteorological Centre Chennai
&
Meteorological Consultant
Real Time Flood Forecasting Project for Chennai
( TN Govt & SECON & JBA)
For the IMS one day seminar on Chennai Water
3 August 2019

www.jbaconsulting.com
We consider 3 districts collocated with Chennai city viz Chennai, Kanchipuram and
Tiruvallur as Chennai Region . The dams/lakes which supply water to Chennai City
and the catchment areas of such dams/rivers are located within these districts
The Nungambakkam and Meenambakkam observatories represent Chennai city &
Suburbs
The normal rainfall of these 3 districts & 2 observatories for all the 4 seasons are
presented seasonwise.
Inter annual variation of rainfall of Nbk & Mbk for the 50 year period 1969-2018
presented by means of charts
Trend analysis of Nbk & Mbk RF . Difference of rainfall means of I & II halves
analysed
Breaching of several RF records for Chennai Nbk & Mbk in recent years highlighted
Rainfall of the 3 districts & Nbk&Mbk for the years 2015,16,17,18 presented and
discussed
Importance of Evaporation data while interpreting the rainfall data
Outline of the presentation

www.jbaconsulting.com
Geographical extent of the region

www.jbaconsulting.com
Geography of rivers and water bodies
www.jbaconsulting.com
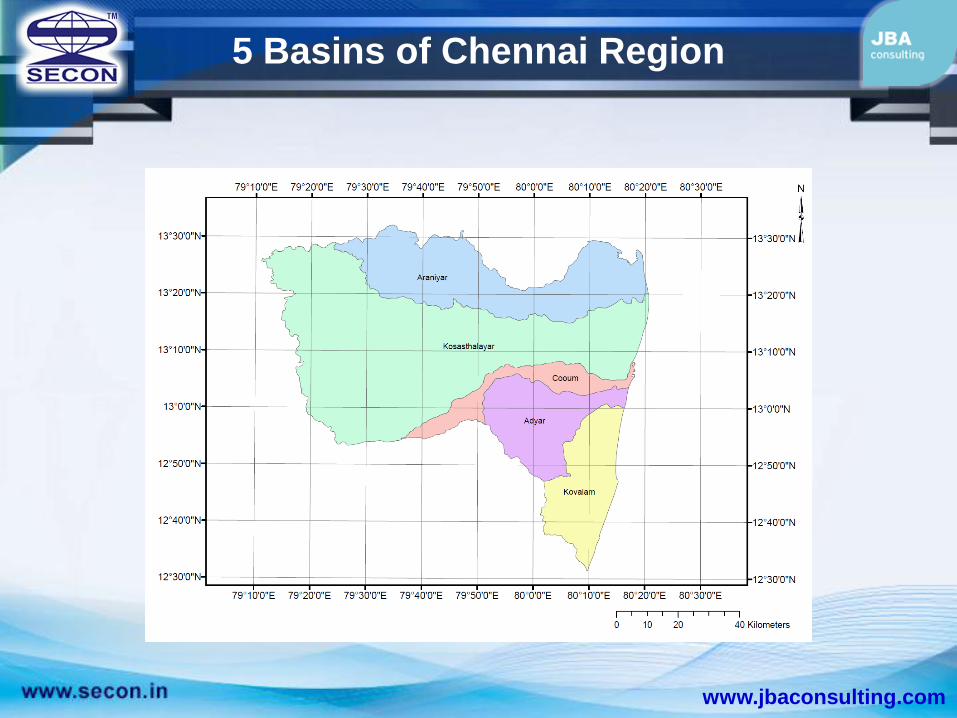
5 Basins of Chennai Region

www.jbaconsulting.com
India has four seasons. These are:
Seasons of India
Name Duration
Winter Jan-Feb
Pre Monsoon /
Summer
Mar-May
Monsoon Jun-Sep
Post / North East
Monsoon
Oct-Dec

www.jbaconsulting.com
For Tamil Nadu the most important rainfall season is the North East
monsoon season of Oct-Dec
However the South west monsoon season of Jun-Sep is also important
in the northern parts of Tamil Nadu and the Chennai Region as defined
above
The North East monsoon sets in over Tamil Nadu around 20 Oct which is
the normal date of onset with a Standard deviation of 7-8 days
The withdrawal takes place in the last week of Dec ( 30 Dec) with a std
deviation of 12-13 days
North East monsoon

www.jbaconsulting.com
Normal seasonal rainfall (in mm) of a few stations ( Source IMD, 1951-2000 normals)
situated in the Chennai Region
Normal Rainfall – Stations
Station Dist JF MAM JJAS OND Annual
Nungambakkam Chennai 38.4 65.0 442.6 856.7 1402.7
Minambakkam Kanchi 42.1 68.6 487.8 777.7 1376.2
Chengalpattu Kanchi 28.7 58.3 461.7 622.7 1171.4
Sriperumbudur Kanchi 24.5 71.1 459.7 637.1 1192.4
Kanchipuram Kanchi 22.1 80.8 558.4 531.9 1193.2
Tiruthani Tiruvallur 29.2 79.4 461.9 441.8 1012.3
R.K.Pet Tiruvallur 12.5 76.5 406.9 397.9 893.8
Poondi Tiruvallur 39.6 67.0 538.6 591.5 1236.7
RedHills Tiruvallur 39.0 62.7 404.8 750.5 1257.0
Ponneri Tiruvallur 39.0 55.2 427.5 757.1 1278.8
Arakkonam Vellore 23.9 79.9 504.8 509.5 1118.1
www.jbaconsulting.com
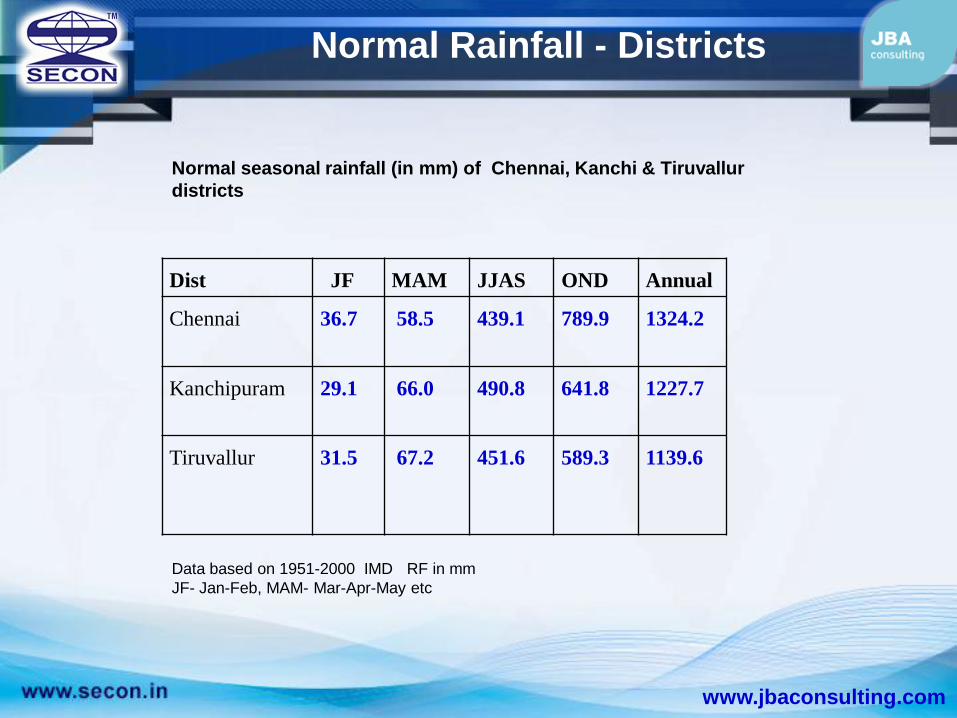
Normal Rainfall - Districts
Normal seasonal rainfall (in mm) of Chennai, Kanchi & Tiruvallur
districts
Data based on 1951-2000 IMD RF in mm
JF- Jan-Feb, MAM- Mar-Apr-May etc
Dist JF MAM JJAS OND Annual
Chennai 36.7 58.5 439.1 789.9 1324.2
Kanchipuram 29.1 66.0 490.8 641.8 1227.7
Tiruvallur 31.5 67.2 451.6 589.3 1139.6
www.jbaconsulting.com
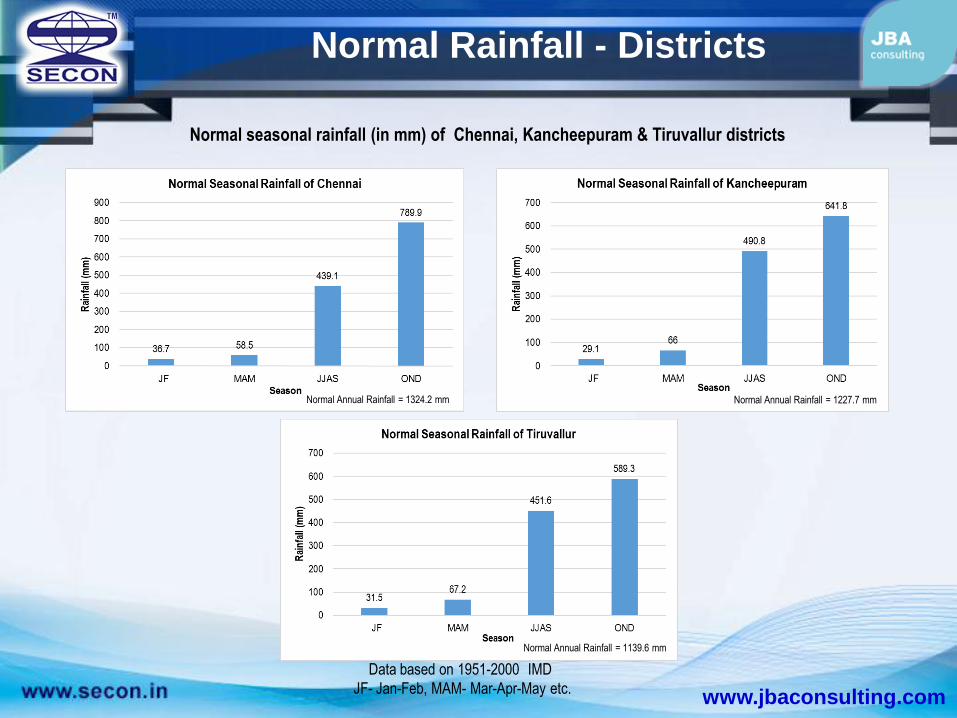
Normal Rainfall - Districts
Normal seasonal rainfall (in mm) of Chennai, Kancheepuram & Tiruvallur districts
Data based on 1951-2000 IMD
JF- Jan-Feb, MAM- Mar-Apr-May etc.
Normal Annual Rainfall = 1324.2 mm Normal Annual Rainfall = 1227.7 mm
Normal Annual Rainfall = 1139.6 mm

www.jbaconsulting.com
Lon variation of cum rainfall over Chennai & Nbhd
During NE monsoon – DWR estimated RF
www.jbaconsulting.com
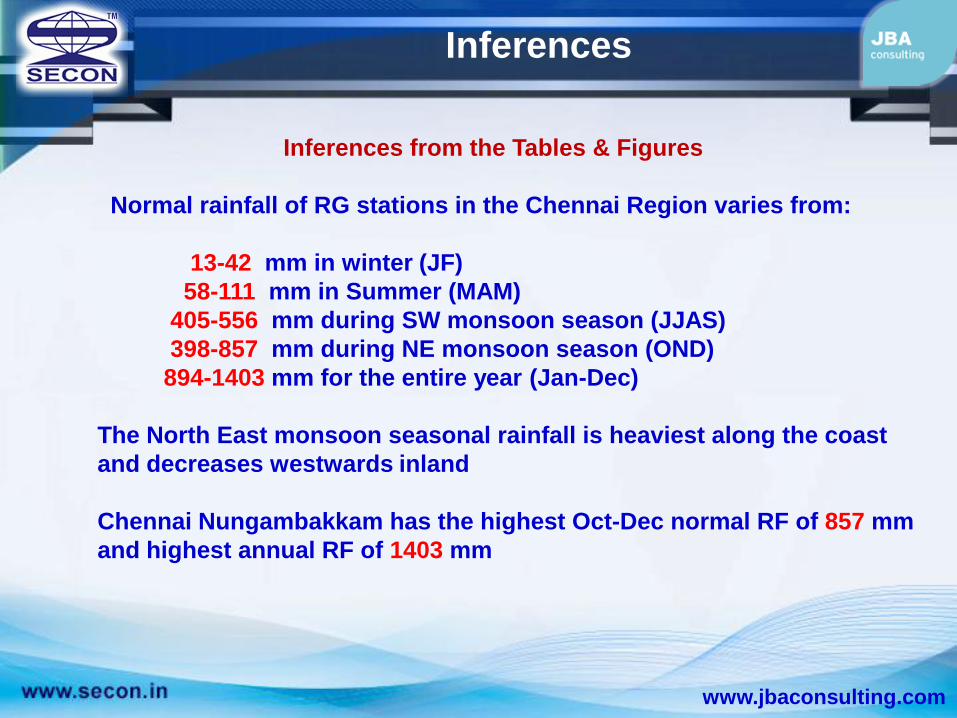
Inferences from the Tables & Figures
Normal rainfall of RG stations in the Chennai Region varies from:
13-42 mm in winter (JF)
58-111 mm in Summer (MAM)
405-556 mm during SW monsoon season (JJAS)
398-857 mm during NE monsoon season (OND)
894-1403 mm for the entire year (Jan-Dec)
The North East monsoon seasonal rainfall is heaviest along the coast
and decreases westwards inland
Chennai Nungambakkam has the highest Oct-Dec normal RF of 857 mm
and highest annual RF of 1403 mm
Inferences

www.jbaconsulting.com
Geographical location- Nbk & Mbk

www.jbaconsulting.com
Rainfall – Chennai Nbk and Mbk
Normal seasonal rainfall (in mm) and statistics of Nungambakkam observatory
based on 1969-2018 data ( 50 years)
CV- Coeff of Variation NRD – No of rainy days
Station JF MAM JJAS OND Annual
Nbk Mean mm 33.9 58.0 461.8 840.0 1393.6
CV % 208.1 144.2 37.0 41.6 27.2
0-398.7 0-423.7 197.2-
1178.3
311.5-
2105.7
738.1-
2562.8
Range mm
NRD 1.6 2.7 26.2 27.3 57.8
www.jbaconsulting.com
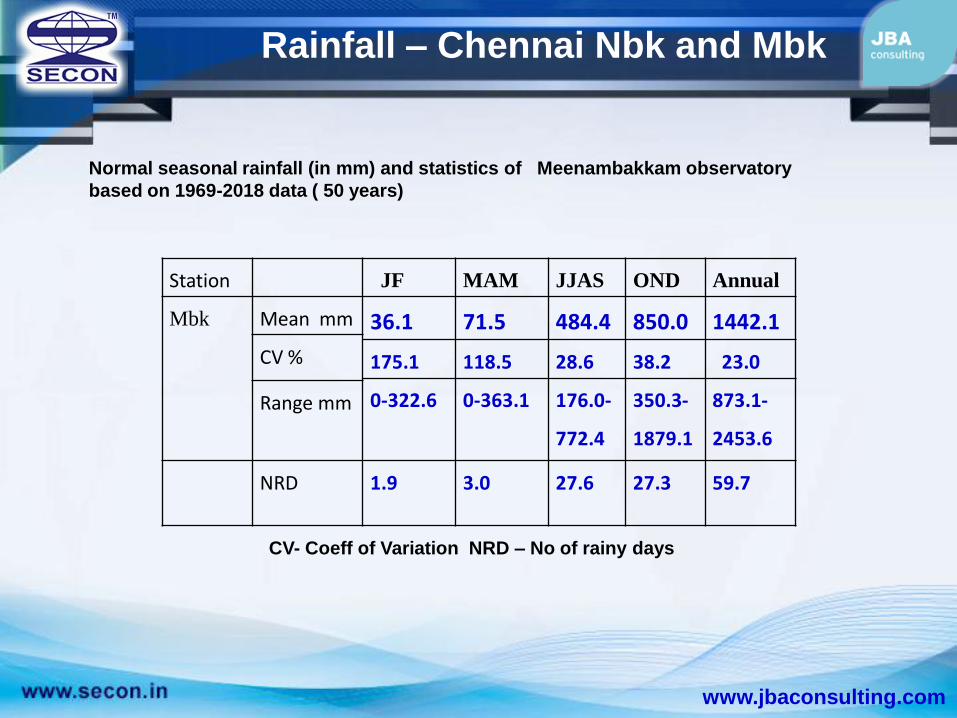
Rainfall – Chennai Nbk and Mbk
Normal seasonal rainfall (in mm) and statistics of Meenambakkam observatory
based on 1969-2018 data ( 50 years)
CV- Coeff of Variation NRD – No of rainy days
Station JF MAM JJAS OND Annual
Mbk Mean mm 36.1 71.5 484.4 850.0 1442.1
CV % 175.1 118.5 28.6 38.2 23.0
0-322.6 0-363.1 176.0-
772.4
350.3-
1879.1
873.1-
2453.6
Range mm
NRD 1.9 3.0 27.6 27.3 59.7

www.jbaconsulting.com
Rainfall – Chennai NBK and MBK
Normal seasonal rainfall (in mm) and statistics of Nungambakkam (NBK) observatory based on
1969-2018 data ( 50 years)
Annual Mean Rainfall = 1393.6 mm
www.jbaconsulting.com
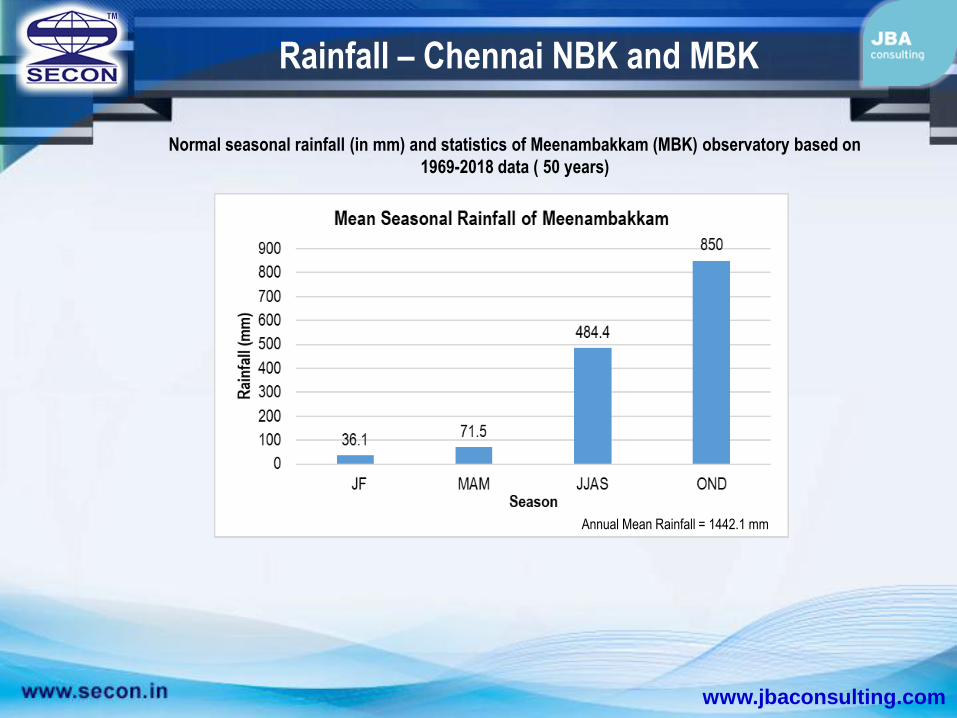
Rainfall – Chennai NBK and MBK
Normal seasonal rainfall (in mm) and statistics of Meenambakkam (MBK) observatory based on
1969-2018 data ( 50 years)
Annual Mean Rainfall = 1442.1 mm
www.jbaconsulting.com
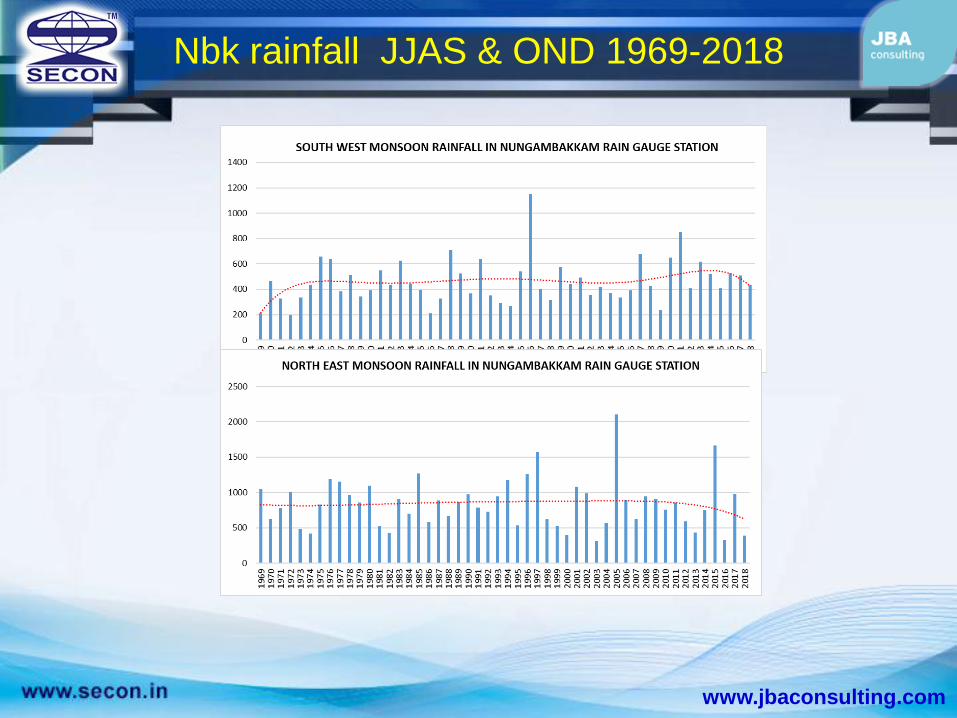
Nbk rainfall JJAS & OND 1969-2018

www.jbaconsulting.com
Nbk rainfall Annual 1969-2018
www.jbaconsulting.com
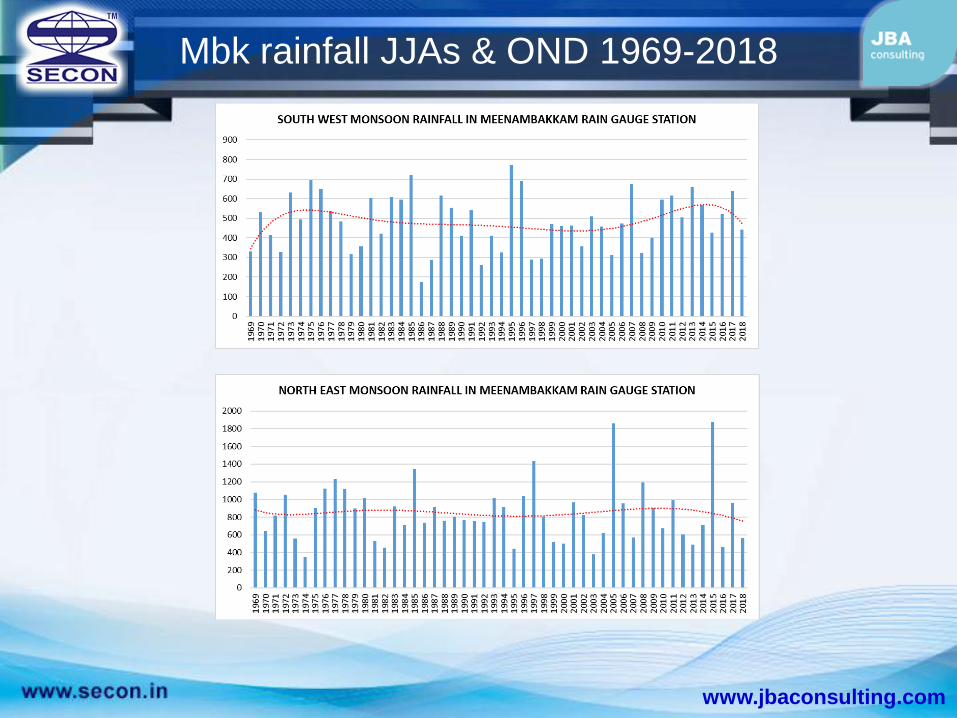
Mbk rainfall JJAs & OND 1969-2018
www.jbaconsulting.com
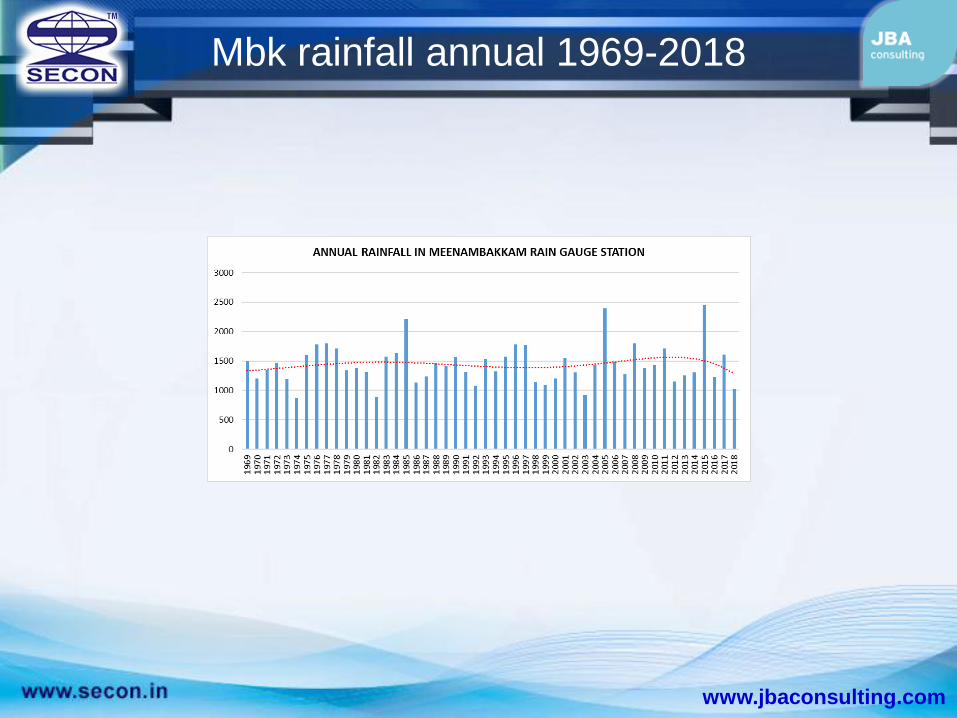
Mbk rainfall annual 1969-2018

www.jbaconsulting.com
Nbk and Mbk RF Trend

www.jbaconsulting.com
Inferences from the Tables
When rainfall of Nbk and Mbk observatories are considered several
Rainfall records have been breached recently. Details…
Nbk observatory (1901-1943 & 1951 to now)
Nbk JJAS 1961 712.5 mm
1996 1178.3
Nbk OND 1913 1417.4 mm
1997 1570.7
2005 2105.7
Nbk Annual
1903 1946.2 mm
1996 2438.6
2005 2562.8
Breaching of Rainfall Records
www.jbaconsulting.com
Inferences from the Tables
When rainfall of Nbk and Mbk observatories are considered several
Rainfall records have been breached recently. Details…
For Meenambakkam ( Opened in 1943)
Mbk OND
1946 1546.8 mm
2005 1859.9
2015 1879.1
Mbk Annual
In 1977 1798.1 mm,
1985 2214.0
2005 2394.8
2015 2453.6
Breaching of Rainfall Records

www.jbaconsulting.com
Inferences from the Rainfall Normals, 1969-2018 RF data
and from trend analysis
The 3 districts of Chennai Region receive annual rainfall of 115-135 cm which is
quite a decent figure
Both the observatories in Chennai City receive nearly 139-144 cm of annual
rainfall
At Nbk Annual RF increased from 134 to 144 cm an increase of 10 cm during
the recent 25 years compared to 25 years before
Increase in Mbk is from 142 to 146 cm
These increases are welcome for a water stressed city such as Chennai
Statements such as Chennai does not receive any rain, Chennai
hardly receives any rain, Chennai rainfall is decreasing etc are
obviously fallacious and unfounded
Infrences

www.jbaconsulting.com
Less than 100 cm of annual rainfall
Nbk received less than 100 cm annual rainfall in 50
years 1969-2018:
1973,1974,1982,1986,1998, 2003 & 2018 ( Freq 7/50 years)
Mbk received less than 100 cm annual rainfall in
1974,1982 and 2003 ( Freq 3/50 years)

www.jbaconsulting.com
2015-2018 rainfall
In the forth coming slides we present the rainfall figures
Both actual and percentage departure from normal of
Chennai, Kanchipuram and Tiruvallur districts
and also of
Chennai Nbk & Mbk observatories
for each year of 2015-19 for JJAS , OND seasons & Annual

www.jbaconsulting.com
2015 Rainfall
Rainfall of Chennai , Kanchi & Tiruvallur Districts JJAS , OND &
Annual in mm
JJAS : Jun-Sep, OND: Oct-Dec, Annual :Jan-Dec RF in mm
A- Actual PDN- % departure from normal
Year Dist JJAS
A
JJAS
P
OND
A
OND
PDN
Ann
A
Ann
PDN
2015 Chennai 370.0 -16 1614.5 104 2057.6 55
2015 Kanchi 345.0 -30 1815.1 183 2256.6 84
2015 Tiruvallur 455.1 1 1469.9 149 2019.2 77

www.jbaconsulting.com
2016 Rainfall
Rainfall of Chennai , Kanchi & Tiruvallur Districts JJAS , OND &
Annual in mm
JJAS : Jun-Sep, OND: Oct-Dec, Annual :Jan-Dec RF in mm
A- Actual PDN- % departure from normal
Year Dist JJAS
A
JJAS
P
OND
A
OND
PDN
Ann
A
Ann
PDN
2016 Chennai 495.8 13 342.1 -57 1036.6 -22
2016 Kanchi 484.2 -1 334.8 -48 992.5 -19
2016 Tiruvallur 406.8 -10 247.8 -58 814.3 -29
www.jbaconsulting.com
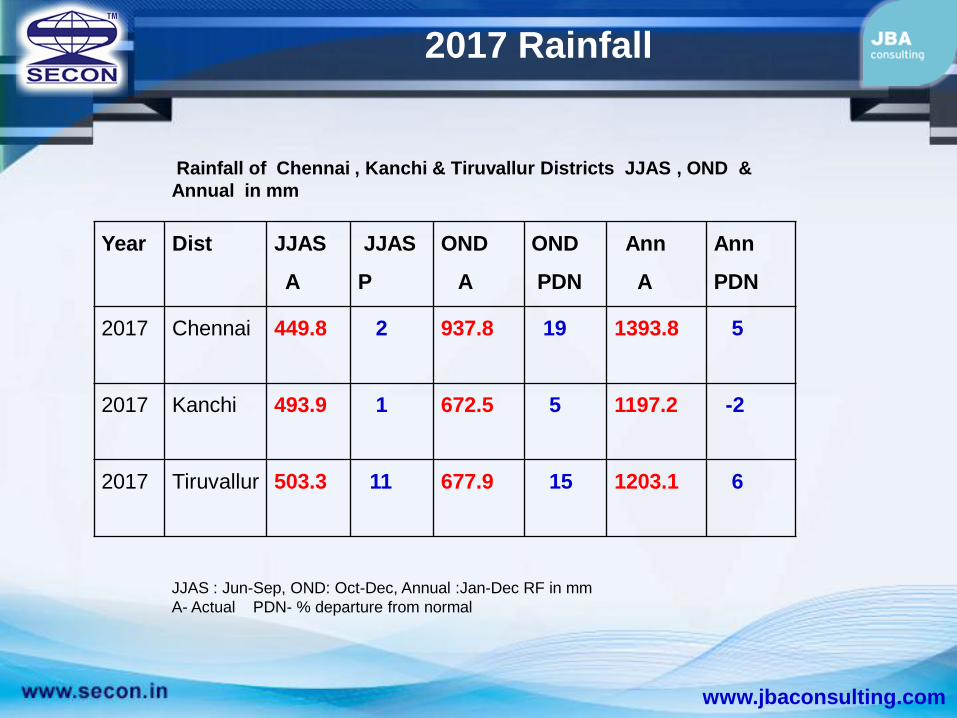
2017 Rainfall
Rainfall of Chennai , Kanchi & Tiruvallur Districts JJAS , OND &
Annual in mm
JJAS : Jun-Sep, OND: Oct-Dec, Annual :Jan-Dec RF in mm
A- Actual PDN- % departure from normal
Year Dist JJAS
A
JJAS
P
OND
A
OND
PDN
Ann
A
Ann
PDN
2017 Chennai 449.8 2 937.8 19 1393.8 5
2017 Kanchi 493.9 1 672.5 5 1197.2 -2
2017 Tiruvallur 503.3 11 677.9 15 1203.1 6

www.jbaconsulting.com
2018 Rainfall
Rainfall of Chennai , Kanchi & Tiruvallur Districts JJAS , OND &
Annual in mm
JJAS : Jun-Sep, OND: Oct-Dec, Annual :Jan-Dec RF in mm
A- Actual PDN- % departure from normal
Year Dist JJAS
A
JJAS
P
OND
A
OND
PDN
Ann
A
Ann
PDN
2018 Chennai 395.3 -10 353.6 -55 754.9 -43
2018 Kanchi 397.0 -19 417.1 -41 833.0 -32
2018 Tiruvallur 364.3 -20 343.2 -42 733.4 -35

www.jbaconsulting.com
2015-2019 Rainfall of Chennai
Rainfall ( in mm) of Chennai , Nungambakkam and
Meenambakkam
Nbk Nbk Nbk Mbk Mbk Mbk
Year JJAS OND Ann JJAS OND ANN
2015 407.7 1663.9 2094.6 427.9 1879.1 2453.6
2016 526.3 324.6 1060.7 522.5 459.1 1228.8
2017 508.7 978.5 1494.8 638.2 960.6 1609.5
2018 432.3 388.7 826.8 441.1 563.9 1018.2

www.jbaconsulting.com
2015-2018 Rainfall of Chennai
Rainfall ( in mm) of Chennai , Nungambakkam and Meenambakkam
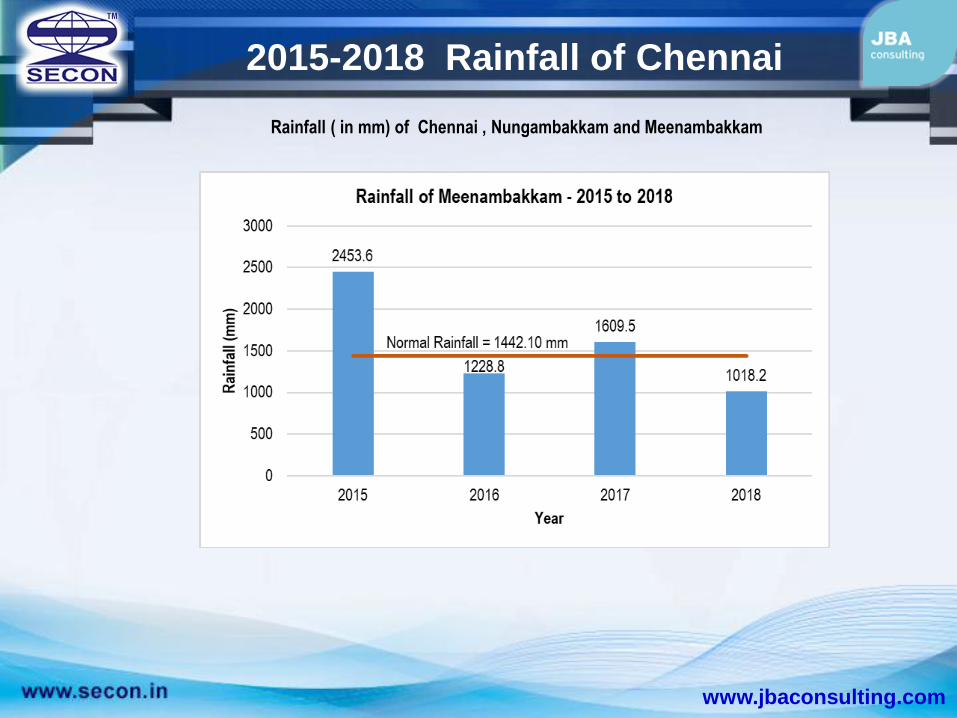
www.jbaconsulting.com
2015-2018 Rainfall of Chennai
Rainfall ( in mm) of Chennai , Nungambakkam and Meenambakkam

www.jbaconsulting.com
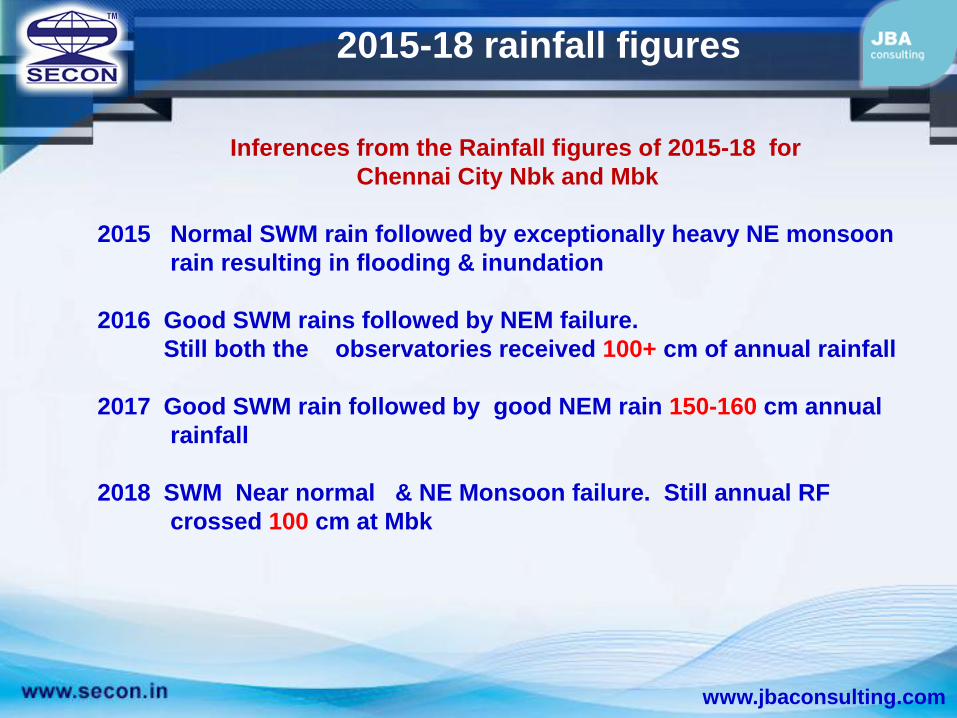
Inferences from the Rainfall figures of 2015-18 for
the 3 Districts
2015 Below normal SWM rain followed by exceptionally heavy NE
monsoon rain
2016 Poor NE monsoon rain but preceded by normal SWM rain
2017 Normal SWM rain , good NEM rain, annual rainfall normal
2018 SWM below normal & NE Monsoon failure. Annual RF between
73- 83 cm
2015-18 rainfall figures
www.jbaconsulting.com
Inferences from the Rainfall figures of 2015-18 for
Chennai City Nbk and Mbk
2015 Normal SWM rain followed by exceptionally heavy NE monsoon
rain resulting in flooding & inundation
2016 Good SWM rains followed by NEM failure.
Still both the observatories received 100+ cm of annual rainfall
2017 Good SWM rain followed by good NEM rain 150-160 cm annual
rainfall
2018 SWM Near normal & NE Monsoon failure. Still annual RF
crossed 100 cm at Mbk
2015-18 rainfall figures

www.jbaconsulting.com
Evaporation ( Pan ) over India – Chennai region 200 cm annual
www.jbaconsulting.com
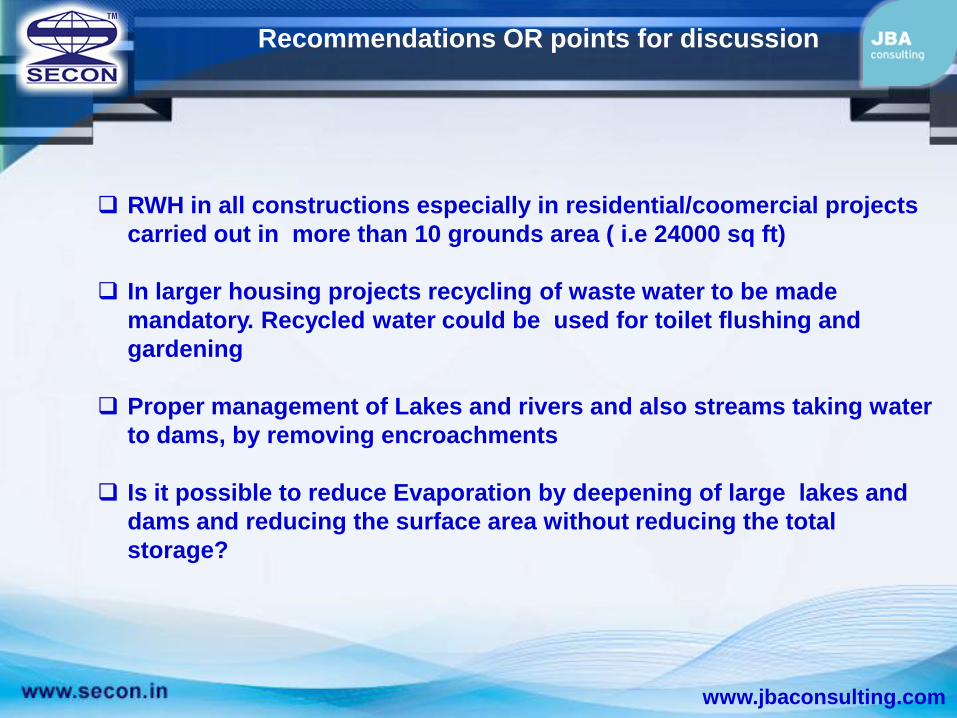
RWH in all constructions especially in residential/coomercial projects
carried out in more than 10 grounds area ( i.e 24000 sq ft)
In larger housing projects recycling of waste water to be made
mandatory. Recycled water could be used for toilet flushing and
gardening
Proper management of Lakes and rivers and also streams taking water
to dams, by removing encroachments
Is it possible to reduce Evaporation by deepening of large lakes and
dams and reducing the surface area without reducing the total
storage?
Recommendations OR points for discussion

www.jbaconsulting.com
Thank You!