aerodrome konstantin veliki nis climatology · aerodrome konstantin veliki nis climatology lyni...
TRANSCRIPT
AERODROME KONSTANTIN VELIKI
NIS CLIMATOLOGY
LYNI
Republic Hydrometeorological Service of Serbia Beograd, 2014
AERODOROME CLIMATOLOGY LYNI L
RHMSS – www.hidmet.gov.rs 1
AERODROME
KONSTANTIN VELIKI NIS
CLIMATOLOGY Authors: Dragan Djukic Aleksandar Pesic Miroslava Mihajlovic Katarina Stefanovic Slavko Petkovic Suncica Mijatovic Zarana Kaurin Mirjana Milenkovic Reublic Hydrometeorological Service
Departement of National Center for Climate Changes
Division for Climate Change Assessment and Applied Meteorology
Beograd, 2014.
AERODOROME CLIMATOLOGY LYNI L
RHMSS – www.hidmet.gov.rs 2
TABLE OF COTENT
INTRODUCTION ................................................................................................................ 3
1 CLIMATOLOGICAL CHARACTERISTICS OF AERODROME AREA ...................................... 5
Air temperature ..................................................................................................... 5
Humidity .............................................................................................................. 19
1.2.1 Relative humidity ...................................................................................................... 19
1.2.2 Difference between dew point temperature (Td) and air temperature (T) ............. 20
Air pressure.......................................................................................................... 27
Visibility and ceiling.............................................................................................. 29
1.4.1 Visibility ..................................................................................................................... 29
1.4.2 Ceiling ........................................................................................................................ 50
1.4.3 Visibility in relation to the ceiling .............................................................................. 68
Wind .................................................................................................................... 74
Weather phenomena ......................................................................................... 109
2 LIST OF FIGURE ...................................................................................................... 113
3 LIST OF TABLE ........................................................................................................ 114
AERODOROME CLIMATOLOGY LYNI L
RHMSS – www.hidmet.gov.rs 3
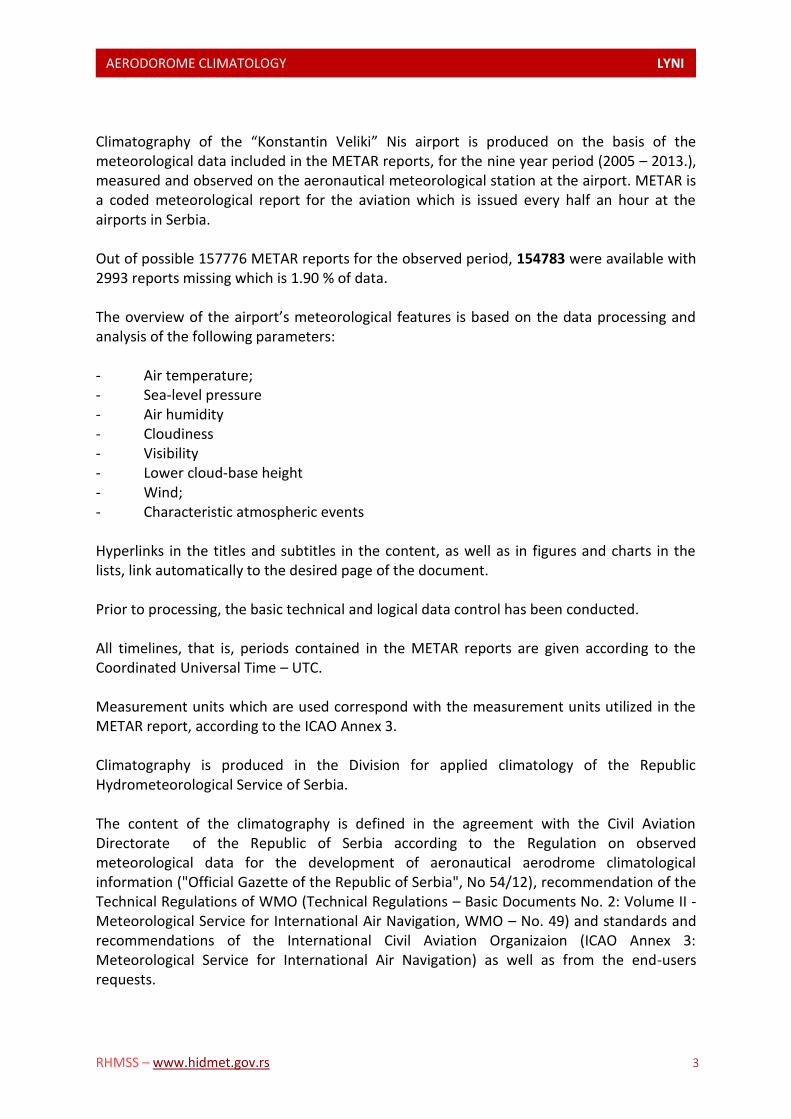
Climatography of the “Konstantin Veliki” Nis airport is produced on the basis of the meteorological data included in the METAR reports, for the nine year period (2005 – 2013.), measured and observed on the aeronautical meteorological station at the airport. METAR is a coded meteorological report for the aviation which is issued every half an hour at the airports in Serbia. Out of possible 157776 МETAR reports for the observed period, 154783 were available with 2993 reports missing which is 1.90 % of data. The overview of the airport’s meteorological features is based on the data processing and analysis of the following parameters: - Air temperature; - Sea-level pressure - Air humidity - Cloudiness - Visibility - Lower cloud-base height - Wind; - Characteristic atmospheric events Hyperlinks in the titles and subtitles in the content, as well as in figures and charts in the lists, link automatically to the desired page of the document. Prior to processing, the basic technical and logical data control has been conducted. All timelines, that is, periods contained in the METAR reports are given according to the Coordinated Universal Time – UTC. Measurement units which are used correspond with the measurement units utilized in the METAR report, according to the ICAO Annex 3. Climatography is produced in the Division for applied climatology of the Republic Hydrometeorological Service of Serbia. The content of the climatography is defined in the agreement with the Civil Aviation Directorate of the Republic of Serbia according to the Regulation on observed meteorological data for the development of aeronautical aerodrome climatological information ("Official Gazette of the Republic of Serbia", No 54/12), recommendation of the Technical Regulations of WMO (Technical Regulations – Basic Documents No. 2: Volume II - Meteorological Service for International Air Navigation, WMO – No. 49) and standards and recommendations of the International Civil Aviation Organizaion (ICAO Annex 3: Meteorological Service for International Air Navigation) as well as from the end-users requests.
AERODOROME CLIMATOLOGY LYNI L
RHMSS – www.hidmet.gov.rs 4
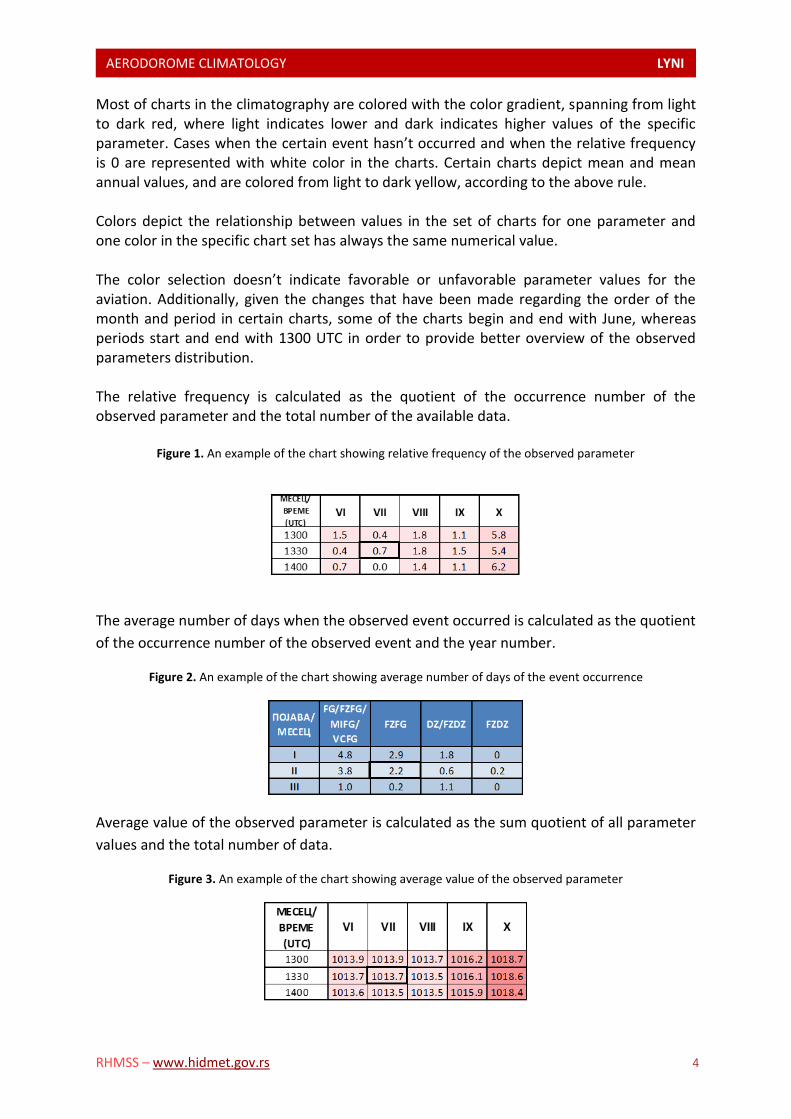
Most of charts in the climatography are colored with the color gradient, spanning from light to dark red, where light indicates lower and dark indicates higher values of the specific parameter. Cases when the certain event hasn’t occurred and when the relative frequency is 0 are represented with white color in the charts. Certain charts depict mean and mean annual values, and are colored from light to dark yellow, according to the above rule. Colors depict the relationship between values in the set of charts for one parameter and one color in the specific chart set has always the same numerical value. The color selection doesn’t indicate favorable or unfavorable parameter values for the aviation. Additionally, given the changes that have been made regarding the order of the month and period in certain charts, some of the charts begin and end with June, whereas periods start and end with 1300 UTC in order to provide better overview of the observed parameters distribution. The relative frequency is calculated as the quotient of the occurrence number of the observed parameter and the total number of the available data.
Figure 1. An example of the chart showing relative frequency of the observed parameter
The average number of days when the observed event occurred is calculated as the quotient
of the occurrence number of the observed event and the year number.
Figure 2. An example of the chart showing average number of days of the event occurrence
Average value of the observed parameter is calculated as the sum quotient of all parameter
values and the total number of data.
Figure 3. An example of the chart showing average value of the observed parameter
AERODOROME CLIMATOLOGY LYNI L
RHMSS – www.hidmet.gov.rs 5
CLIMATOLOGICAL CHARACTERISTICS OF AERODROME AREA
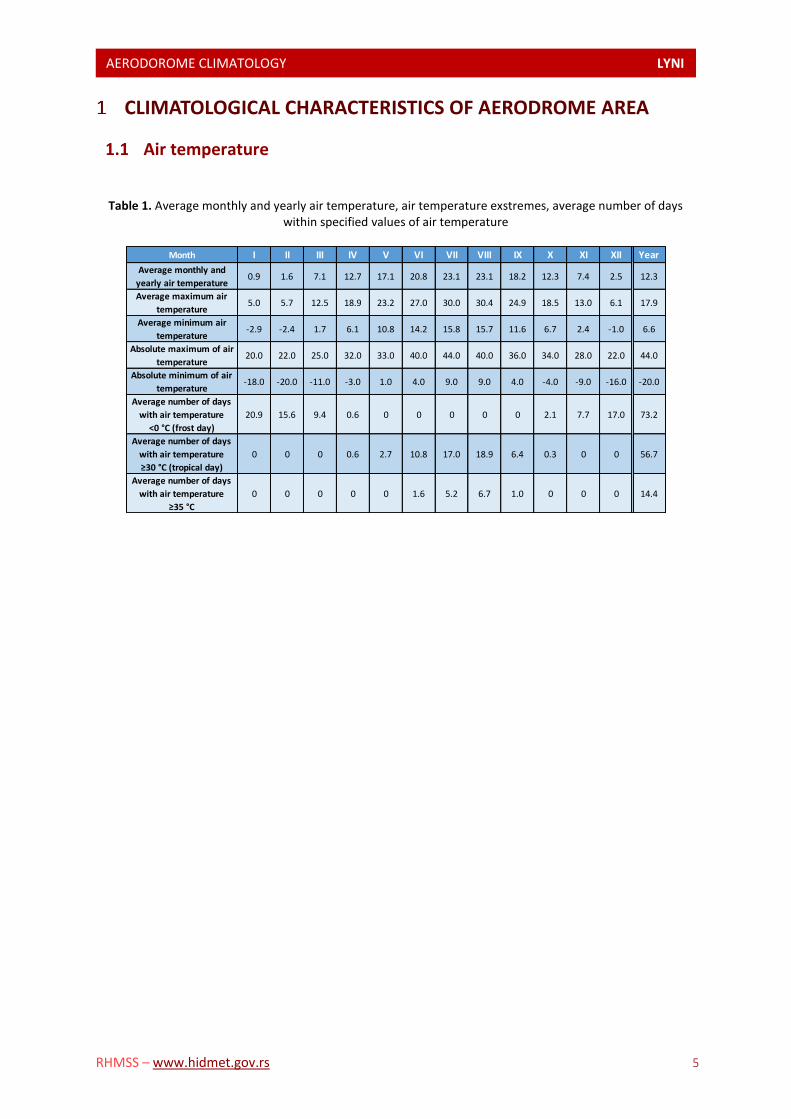
Air temperature
Table 1. Average monthly and yearly air temperature, air temperature exstremes, average number of days within specified values of air temperature
Month I II III IV V VI VII VIII IX X XI XII Year
Average monthly and
yearly air temperature0.9 1.6 7.1 12.7 17.1 20.8 23.1 23.1 18.2 12.3 7.4 2.5 12.3
Average maximum air
temperature5.0 5.7 12.5 18.9 23.2 27.0 30.0 30.4 24.9 18.5 13.0 6.1 17.9
Average minimum air
temperature-2.9 -2.4 1.7 6.1 10.8 14.2 15.8 15.7 11.6 6.7 2.4 -1.0 6.6
Absolute maximum of air
temperature20.0 22.0 25.0 32.0 33.0 40.0 44.0 40.0 36.0 34.0 28.0 22.0 44.0
Absolute minimum of air
temperature-18.0 -20.0 -11.0 -3.0 1.0 4.0 9.0 9.0 4.0 -4.0 -9.0 -16.0 -20.0
Average number of days
with air temperature
<0 °C (frost day)
20.9 15.6 9.4 0.6 0 0 0 0 0 2.1 7.7 17.0 73.2
Average number of days
with air temperature
≥30 °C (tropical day)
0 0 0 0.6 2.7 10.8 17.0 18.9 6.4 0.3 0 0 56.7
Average number of days
with air temperature
≥35 °C
0 0 0 0 0 1.6 5.2 6.7 1.0 0 0 0 14.4
AERODOROME CLIMATOLOGY LYNI L
RHMSS – www.hidmet.gov.rs 6
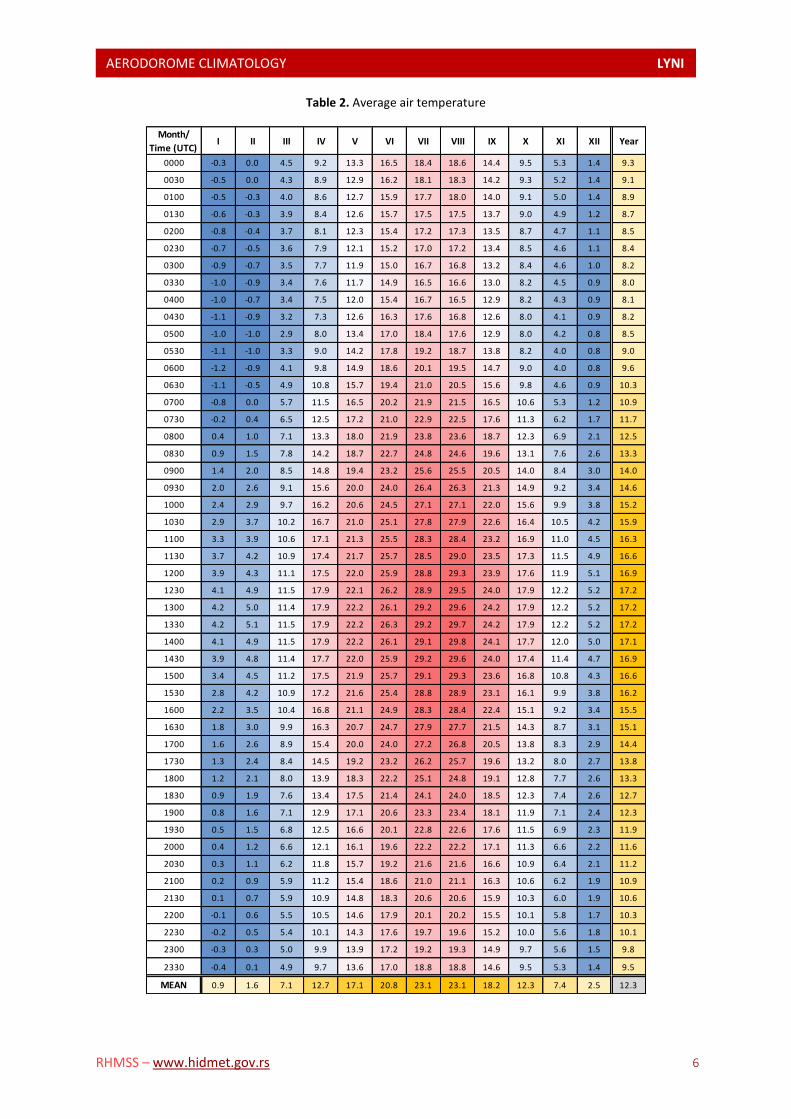
Table 2. Average air temperature
Month/
Time (UTC)I II III IV V VI VII VIII IX X XI XII Year
0000 -0.3 0.0 4.5 9.2 13.3 16.5 18.4 18.6 14.4 9.5 5.3 1.4 9.3
0030 -0.5 0.0 4.3 8.9 12.9 16.2 18.1 18.3 14.2 9.3 5.2 1.4 9.1
0100 -0.5 -0.3 4.0 8.6 12.7 15.9 17.7 18.0 14.0 9.1 5.0 1.4 8.9
0130 -0.6 -0.3 3.9 8.4 12.6 15.7 17.5 17.5 13.7 9.0 4.9 1.2 8.7
0200 -0.8 -0.4 3.7 8.1 12.3 15.4 17.2 17.3 13.5 8.7 4.7 1.1 8.5
0230 -0.7 -0.5 3.6 7.9 12.1 15.2 17.0 17.2 13.4 8.5 4.6 1.1 8.4
0300 -0.9 -0.7 3.5 7.7 11.9 15.0 16.7 16.8 13.2 8.4 4.6 1.0 8.2
0330 -1.0 -0.9 3.4 7.6 11.7 14.9 16.5 16.6 13.0 8.2 4.5 0.9 8.0
0400 -1.0 -0.7 3.4 7.5 12.0 15.4 16.7 16.5 12.9 8.2 4.3 0.9 8.1
0430 -1.1 -0.9 3.2 7.3 12.6 16.3 17.6 16.8 12.6 8.0 4.1 0.9 8.2
0500 -1.0 -1.0 2.9 8.0 13.4 17.0 18.4 17.6 12.9 8.0 4.2 0.8 8.5
0530 -1.1 -1.0 3.3 9.0 14.2 17.8 19.2 18.7 13.8 8.2 4.0 0.8 9.0
0600 -1.2 -0.9 4.1 9.8 14.9 18.6 20.1 19.5 14.7 9.0 4.0 0.8 9.6
0630 -1.1 -0.5 4.9 10.8 15.7 19.4 21.0 20.5 15.6 9.8 4.6 0.9 10.3
0700 -0.8 0.0 5.7 11.5 16.5 20.2 21.9 21.5 16.5 10.6 5.3 1.2 10.9
0730 -0.2 0.4 6.5 12.5 17.2 21.0 22.9 22.5 17.6 11.3 6.2 1.7 11.7
0800 0.4 1.0 7.1 13.3 18.0 21.9 23.8 23.6 18.7 12.3 6.9 2.1 12.5
0830 0.9 1.5 7.8 14.2 18.7 22.7 24.8 24.6 19.6 13.1 7.6 2.6 13.3
0900 1.4 2.0 8.5 14.8 19.4 23.2 25.6 25.5 20.5 14.0 8.4 3.0 14.0
0930 2.0 2.6 9.1 15.6 20.0 24.0 26.4 26.3 21.3 14.9 9.2 3.4 14.6
1000 2.4 2.9 9.7 16.2 20.6 24.5 27.1 27.1 22.0 15.6 9.9 3.8 15.2
1030 2.9 3.7 10.2 16.7 21.0 25.1 27.8 27.9 22.6 16.4 10.5 4.2 15.9
1100 3.3 3.9 10.6 17.1 21.3 25.5 28.3 28.4 23.2 16.9 11.0 4.5 16.3
1130 3.7 4.2 10.9 17.4 21.7 25.7 28.5 29.0 23.5 17.3 11.5 4.9 16.6
1200 3.9 4.3 11.1 17.5 22.0 25.9 28.8 29.3 23.9 17.6 11.9 5.1 16.9
1230 4.1 4.9 11.5 17.9 22.1 26.2 28.9 29.5 24.0 17.9 12.2 5.2 17.2
1300 4.2 5.0 11.4 17.9 22.2 26.1 29.2 29.6 24.2 17.9 12.2 5.2 17.2
1330 4.2 5.1 11.5 17.9 22.2 26.3 29.2 29.7 24.2 17.9 12.2 5.2 17.2
1400 4.1 4.9 11.5 17.9 22.2 26.1 29.1 29.8 24.1 17.7 12.0 5.0 17.1
1430 3.9 4.8 11.4 17.7 22.0 25.9 29.2 29.6 24.0 17.4 11.4 4.7 16.9
1500 3.4 4.5 11.2 17.5 21.9 25.7 29.1 29.3 23.6 16.8 10.8 4.3 16.6
1530 2.8 4.2 10.9 17.2 21.6 25.4 28.8 28.9 23.1 16.1 9.9 3.8 16.2
1600 2.2 3.5 10.4 16.8 21.1 24.9 28.3 28.4 22.4 15.1 9.2 3.4 15.5
1630 1.8 3.0 9.9 16.3 20.7 24.7 27.9 27.7 21.5 14.3 8.7 3.1 15.1
1700 1.6 2.6 8.9 15.4 20.0 24.0 27.2 26.8 20.5 13.8 8.3 2.9 14.4
1730 1.3 2.4 8.4 14.5 19.2 23.2 26.2 25.7 19.6 13.2 8.0 2.7 13.8
1800 1.2 2.1 8.0 13.9 18.3 22.2 25.1 24.8 19.1 12.8 7.7 2.6 13.3
1830 0.9 1.9 7.6 13.4 17.5 21.4 24.1 24.0 18.5 12.3 7.4 2.6 12.7
1900 0.8 1.6 7.1 12.9 17.1 20.6 23.3 23.4 18.1 11.9 7.1 2.4 12.3
1930 0.5 1.5 6.8 12.5 16.6 20.1 22.8 22.6 17.6 11.5 6.9 2.3 11.9
2000 0.4 1.2 6.6 12.1 16.1 19.6 22.2 22.2 17.1 11.3 6.6 2.2 11.6
2030 0.3 1.1 6.2 11.8 15.7 19.2 21.6 21.6 16.6 10.9 6.4 2.1 11.2
2100 0.2 0.9 5.9 11.2 15.4 18.6 21.0 21.1 16.3 10.6 6.2 1.9 10.9
2130 0.1 0.7 5.9 10.9 14.8 18.3 20.6 20.6 15.9 10.3 6.0 1.9 10.6
2200 -0.1 0.6 5.5 10.5 14.6 17.9 20.1 20.2 15.5 10.1 5.8 1.7 10.3
2230 -0.2 0.5 5.4 10.1 14.3 17.6 19.7 19.6 15.2 10.0 5.6 1.8 10.1
2300 -0.3 0.3 5.0 9.9 13.9 17.2 19.2 19.3 14.9 9.7 5.6 1.5 9.8
2330 -0.4 0.1 4.9 9.7 13.6 17.0 18.8 18.8 14.6 9.5 5.3 1.4 9.5
MEAN 0.9 1.6 7.1 12.7 17.1 20.8 23.1 23.1 18.2 12.3 7.4 2.5 12.3
AERODOROME CLIMATOLOGY LYNI L
RHMSS – www.hidmet.gov.rs 7
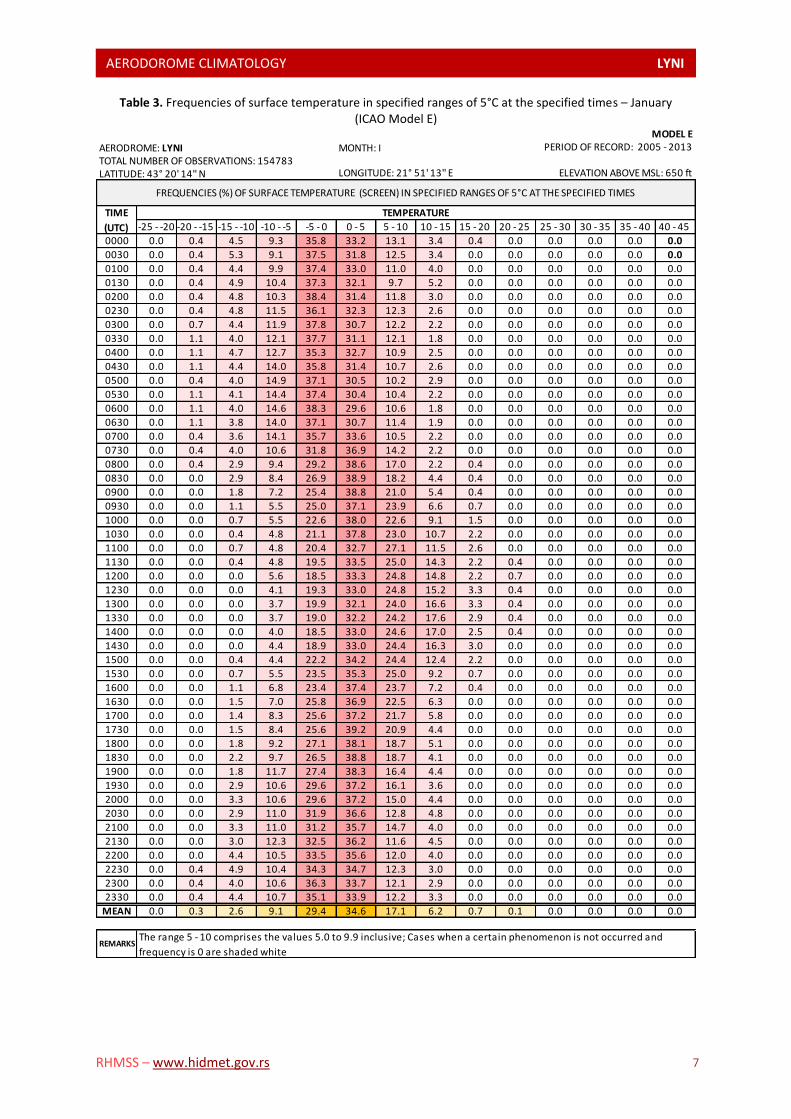
Table 3. Frequencies of surface temperature in specified ranges of 5°C at the specified times – January (ICAO Model E)
AERODROME: LYNI MONTH: ITOTAL NUMBER OF OBSERVATIONS: 154783LATITUDE: 43° 20' 14'' N
-25 - -20 -20 - -15 -15 - -10 -10 - -5 -5 - 0 0 - 5 5 - 10 10 - 15 15 - 20 20 - 25 25 - 30 30 - 35 35 - 40 40 - 45
0000 0.0 0.4 4.5 9.3 35.8 33.2 13.1 3.4 0.4 0.0 0.0 0.0 0.0 0.0
0030 0.0 0.4 5.3 9.1 37.5 31.8 12.5 3.4 0.0 0.0 0.0 0.0 0.0 0.0
0100 0.0 0.4 4.4 9.9 37.4 33.0 11.0 4.0 0.0 0.0 0.0 0.0 0.0 0.0
0130 0.0 0.4 4.9 10.4 37.3 32.1 9.7 5.2 0.0 0.0 0.0 0.0 0.0 0.0
0200 0.0 0.4 4.8 10.3 38.4 31.4 11.8 3.0 0.0 0.0 0.0 0.0 0.0 0.0
0230 0.0 0.4 4.8 11.5 36.1 32.3 12.3 2.6 0.0 0.0 0.0 0.0 0.0 0.0
0300 0.0 0.7 4.4 11.9 37.8 30.7 12.2 2.2 0.0 0.0 0.0 0.0 0.0 0.0
0330 0.0 1.1 4.0 12.1 37.7 31.1 12.1 1.8 0.0 0.0 0.0 0.0 0.0 0.0
0400 0.0 1.1 4.7 12.7 35.3 32.7 10.9 2.5 0.0 0.0 0.0 0.0 0.0 0.0
0430 0.0 1.1 4.4 14.0 35.8 31.4 10.7 2.6 0.0 0.0 0.0 0.0 0.0 0.0
0500 0.0 0.4 4.0 14.9 37.1 30.5 10.2 2.9 0.0 0.0 0.0 0.0 0.0 0.0
0530 0.0 1.1 4.1 14.4 37.4 30.4 10.4 2.2 0.0 0.0 0.0 0.0 0.0 0.0
0600 0.0 1.1 4.0 14.6 38.3 29.6 10.6 1.8 0.0 0.0 0.0 0.0 0.0 0.0
0630 0.0 1.1 3.8 14.0 37.1 30.7 11.4 1.9 0.0 0.0 0.0 0.0 0.0 0.0
0700 0.0 0.4 3.6 14.1 35.7 33.6 10.5 2.2 0.0 0.0 0.0 0.0 0.0 0.0
0730 0.0 0.4 4.0 10.6 31.8 36.9 14.2 2.2 0.0 0.0 0.0 0.0 0.0 0.0
0800 0.0 0.4 2.9 9.4 29.2 38.6 17.0 2.2 0.4 0.0 0.0 0.0 0.0 0.0
0830 0.0 0.0 2.9 8.4 26.9 38.9 18.2 4.4 0.4 0.0 0.0 0.0 0.0 0.0
0900 0.0 0.0 1.8 7.2 25.4 38.8 21.0 5.4 0.4 0.0 0.0 0.0 0.0 0.0
0930 0.0 0.0 1.1 5.5 25.0 37.1 23.9 6.6 0.7 0.0 0.0 0.0 0.0 0.0
1000 0.0 0.0 0.7 5.5 22.6 38.0 22.6 9.1 1.5 0.0 0.0 0.0 0.0 0.0
1030 0.0 0.0 0.4 4.8 21.1 37.8 23.0 10.7 2.2 0.0 0.0 0.0 0.0 0.0
1100 0.0 0.0 0.7 4.8 20.4 32.7 27.1 11.5 2.6 0.0 0.0 0.0 0.0 0.0
1130 0.0 0.0 0.4 4.8 19.5 33.5 25.0 14.3 2.2 0.4 0.0 0.0 0.0 0.0
1200 0.0 0.0 0.0 5.6 18.5 33.3 24.8 14.8 2.2 0.7 0.0 0.0 0.0 0.0
1230 0.0 0.0 0.0 4.1 19.3 33.0 24.8 15.2 3.3 0.4 0.0 0.0 0.0 0.0
1300 0.0 0.0 0.0 3.7 19.9 32.1 24.0 16.6 3.3 0.4 0.0 0.0 0.0 0.0
1330 0.0 0.0 0.0 3.7 19.0 32.2 24.2 17.6 2.9 0.4 0.0 0.0 0.0 0.0
1400 0.0 0.0 0.0 4.0 18.5 33.0 24.6 17.0 2.5 0.4 0.0 0.0 0.0 0.0
1430 0.0 0.0 0.0 4.4 18.9 33.0 24.4 16.3 3.0 0.0 0.0 0.0 0.0 0.0
1500 0.0 0.0 0.4 4.4 22.2 34.2 24.4 12.4 2.2 0.0 0.0 0.0 0.0 0.0
1530 0.0 0.0 0.7 5.5 23.5 35.3 25.0 9.2 0.7 0.0 0.0 0.0 0.0 0.0
1600 0.0 0.0 1.1 6.8 23.4 37.4 23.7 7.2 0.4 0.0 0.0 0.0 0.0 0.0
1630 0.0 0.0 1.5 7.0 25.8 36.9 22.5 6.3 0.0 0.0 0.0 0.0 0.0 0.0
1700 0.0 0.0 1.4 8.3 25.6 37.2 21.7 5.8 0.0 0.0 0.0 0.0 0.0 0.0
1730 0.0 0.0 1.5 8.4 25.6 39.2 20.9 4.4 0.0 0.0 0.0 0.0 0.0 0.0
1800 0.0 0.0 1.8 9.2 27.1 38.1 18.7 5.1 0.0 0.0 0.0 0.0 0.0 0.0
1830 0.0 0.0 2.2 9.7 26.5 38.8 18.7 4.1 0.0 0.0 0.0 0.0 0.0 0.0
1900 0.0 0.0 1.8 11.7 27.4 38.3 16.4 4.4 0.0 0.0 0.0 0.0 0.0 0.0
1930 0.0 0.0 2.9 10.6 29.6 37.2 16.1 3.6 0.0 0.0 0.0 0.0 0.0 0.0
2000 0.0 0.0 3.3 10.6 29.6 37.2 15.0 4.4 0.0 0.0 0.0 0.0 0.0 0.0
2030 0.0 0.0 2.9 11.0 31.9 36.6 12.8 4.8 0.0 0.0 0.0 0.0 0.0 0.0
2100 0.0 0.0 3.3 11.0 31.2 35.7 14.7 4.0 0.0 0.0 0.0 0.0 0.0 0.0
2130 0.0 0.0 3.0 12.3 32.5 36.2 11.6 4.5 0.0 0.0 0.0 0.0 0.0 0.0
2200 0.0 0.0 4.4 10.5 33.5 35.6 12.0 4.0 0.0 0.0 0.0 0.0 0.0 0.0
2230 0.0 0.4 4.9 10.4 34.3 34.7 12.3 3.0 0.0 0.0 0.0 0.0 0.0 0.0
2300 0.0 0.4 4.0 10.6 36.3 33.7 12.1 2.9 0.0 0.0 0.0 0.0 0.0 0.0
2330 0.0 0.4 4.4 10.7 35.1 33.9 12.2 3.3 0.0 0.0 0.0 0.0 0.0 0.0
MEAN 0.0 0.3 2.6 9.1 29.4 34.6 17.1 6.2 0.7 0.1 0.0 0.0 0.0 0.0
REMARKS
FREQUENCIES (%) OF SURFACE TEMPERATURE (SCREEN) IN SPECIFIED RANGES OF 5°C AT THE SPECIFIED TIMES
TIME
(UTC)
MODEL E
TEMPERATURE
PERIOD OF RECORD: 2005 - 2013
ELEVATION ABOVE MSL: 650 ftLONGITUDE: 21° 51' 13'' E
The range 5 - 10 comprises the values 5.0 to 9.9 inclusive; Cases when a certain phenomenon is not occurred and
frequency is 0 are shaded white

AERODOROME CLIMATOLOGY LYNI L
RHMSS – www.hidmet.gov.rs 8
Table 4. Frequencies of surface temperature in specified ranges of 5°C at the specified times – February (ICAO Model E)
AERODROME: LYNI MONTH: IITOTAL NUMBER OF OBSERVATIONS: 154783LATITUDE: 43° 20' 14'' N
-25 - -20 -20 - -15 -15 - -10 -10 - -5 -5 - 0 0 - 5 5 - 10 10 - 15 15 - 20 20 - 25 25 - 30 30 - 35 35 - 40 40 - 45
0000 0.0 1.3 4.2 9.2 28.0 38.5 17.2 1.7 0.0 0.0 0.0 0.0 0.0 0.0
0030 0.0 1.2 3.8 9.2 28.3 37.9 17.9 1.7 0.0 0.0 0.0 0.0 0.0 0.0
0100 0.0 2.0 3.6 8.5 29.1 39.3 16.2 1.2 0.0 0.0 0.0 0.0 0.0 0.0
0130 0.0 2.1 3.7 8.3 31.8 37.2 15.7 1.2 0.0 0.0 0.0 0.0 0.0 0.0
0200 0.0 2.5 3.3 9.5 31.3 36.2 16.5 0.8 0.0 0.0 0.0 0.0 0.0 0.0
0230 0.0 2.1 3.3 10.4 31.2 37.1 14.2 1.7 0.0 0.0 0.0 0.0 0.0 0.0
0300 0.0 2.8 4.0 10.1 31.2 36.0 14.6 1.2 0.0 0.0 0.0 0.0 0.0 0.0
0330 0.0 2.8 3.3 10.6 33.7 35.4 13.0 1.2 0.0 0.0 0.0 0.0 0.0 0.0
0400 0.0 2.4 4.0 9.7 32.8 36.0 14.6 0.4 0.0 0.0 0.0 0.0 0.0 0.0
0430 0.0 3.2 3.6 9.3 33.6 35.2 13.8 1.2 0.0 0.0 0.0 0.0 0.0 0.0
0500 0.0 3.6 4.0 9.1 35.3 34.1 13.1 0.8 0.0 0.0 0.0 0.0 0.0 0.0
0530 0.0 3.2 4.0 9.9 34.4 33.2 15.0 0.4 0.0 0.0 0.0 0.0 0.0 0.0
0600 0.0 3.0 3.4 10.2 34.9 32.8 14.9 0.9 0.0 0.0 0.0 0.0 0.0 0.0
0630 0.0 2.9 3.3 9.5 32.6 32.6 17.4 1.7 0.0 0.0 0.0 0.0 0.0 0.0
0700 0.0 2.0 4.0 8.5 30.0 35.2 18.6 1.6 0.0 0.0 0.0 0.0 0.0 0.0
0730 0.0 2.0 4.5 6.9 29.1 31.2 21.9 4.5 0.0 0.0 0.0 0.0 0.0 0.0
0800 0.0 0.0 5.7 6.9 27.5 31.2 23.1 5.3 0.4 0.0 0.0 0.0 0.0 0.0
0830 0.0 0.0 5.3 6.9 24.8 31.3 22.4 8.9 0.4 0.0 0.0 0.0 0.0 0.0
0900 0.0 0.0 5.4 6.3 23.4 29.3 20.9 13.8 0.8 0.0 0.0 0.0 0.0 0.0
0930 0.0 0.0 4.4 6.5 21.0 30.2 21.4 14.9 1.6 0.0 0.0 0.0 0.0 0.0
1000 0.0 0.0 3.6 7.2 20.4 29.6 22.0 15.2 2.0 0.0 0.0 0.0 0.0 0.0
1030 0.0 0.0 2.0 7.8 16.8 29.1 23.8 15.6 4.9 0.0 0.0 0.0 0.0 0.0
1100 0.0 0.0 0.8 9.6 15.6 28.4 24.8 14.8 5.6 0.4 0.0 0.0 0.0 0.0
1130 0.0 0.0 0.4 8.4 15.3 30.1 24.9 13.3 7.2 0.4 0.0 0.0 0.0 0.0
1200 0.0 0.0 0.4 8.3 14.5 29.5 25.3 12.9 8.7 0.4 0.0 0.0 0.0 0.0
1230 0.0 0.0 0.0 7.1 15.0 28.8 22.9 17.5 7.5 1.2 0.0 0.0 0.0 0.0
1300 0.0 0.0 0.0 8.1 14.5 27.0 23.8 16.9 8.5 1.2 0.0 0.0 0.0 0.0
1330 0.0 0.0 0.4 6.5 15.9 27.2 22.8 16.3 9.8 1.2 0.0 0.0 0.0 0.0
1400 0.0 0.0 0.4 6.8 15.3 27.7 22.9 16.9 8.8 1.2 0.0 0.0 0.0 0.0
1430 0.0 0.0 0.4 5.6 16.9 27.4 25.4 15.3 7.7 1.2 0.0 0.0 0.0 0.0
1500 0.0 0.0 0.8 7.2 15.5 27.9 25.9 15.1 6.8 0.8 0.0 0.0 0.0 0.0
1530 0.0 0.0 0.8 7.8 16.8 28.3 25.0 15.2 5.3 0.8 0.0 0.0 0.0 0.0
1600 0.0 0.0 0.8 8.8 17.5 30.3 23.5 16.3 2.8 0.0 0.0 0.0 0.0 0.0
1630 0.0 0.0 0.8 8.5 21.1 27.9 24.3 16.2 1.2 0.0 0.0 0.0 0.0 0.0
1700 0.0 0.0 0.4 9.6 23.2 28.0 24.8 13.2 0.8 0.0 0.0 0.0 0.0 0.0
1730 0.0 0.0 0.8 8.9 24.7 28.7 23.5 13.4 0.0 0.0 0.0 0.0 0.0 0.0
1800 0.0 0.0 2.1 8.5 24.2 29.7 23.7 11.9 0.0 0.0 0.0 0.0 0.0 0.0
1830 0.0 0.0 2.8 7.2 24.9 32.5 23.7 8.8 0.0 0.0 0.0 0.0 0.0 0.0
1900 0.0 0.0 3.6 7.2 25.6 33.2 22.0 8.4 0.0 0.0 0.0 0.0 0.0 0.0
1930 0.0 0.0 3.6 6.0 28.5 33.3 21.7 6.4 0.4 0.0 0.0 0.0 0.0 0.0
2000 0.0 0.0 4.4 6.0 29.4 31.9 22.2 6.0 0.0 0.0 0.0 0.0 0.0 0.0
2030 0.0 0.0 4.5 6.1 27.9 34.4 23.1 4.0 0.0 0.0 0.0 0.0 0.0 0.0
2100 0.0 0.4 4.0 6.4 28.5 34.9 20.9 4.8 0.0 0.0 0.0 0.0 0.0 0.0
2130 0.0 0.0 5.8 5.8 29.2 33.7 21.8 3.7 0.0 0.0 0.0 0.0 0.0 0.0
2200 0.0 0.8 3.7 7.3 31.7 31.7 20.7 4.1 0.0 0.0 0.0 0.0 0.0 0.0
2230 0.0 0.0 4.9 7.8 29.9 32.4 22.5 2.5 0.0 0.0 0.0 0.0 0.0 0.0
2300 0.0 0.8 3.3 8.6 30.2 35.5 19.6 2.0 0.0 0.0 0.0 0.0 0.0 0.0
2330 0.0 0.4 4.8 8.1 29.0 36.3 20.2 1.2 0.0 0.0 0.0 0.0 0.0 0.0
MEAN 0.0 0.9 2.9 8.1 25.5 32.2 20.6 7.8 1.9 0.2 0.0 0.0 0.0 0.0
MODEL E
REMARKS
FREQUENCIES (%) OF SURFACE TEMPERATURE (SCREEN) IN SPECIFIED RANGES OF 5°C AT THE SPECIFIED TIMES
TEMPERATURETIME
(UTC)
PERIOD OF RECORD: 2005 - 2013
ELEVATION ABOVE MSL: 650 ftLONGITUDE: 21° 51' 13'' E
The range 5 - 10 comprises the values 5.0 to 9.9 inclusive; Cases when a certain phenomenon is not occurred and
frequency is 0 are shaded white
AERODOROME CLIMATOLOGY LYNI L
RHMSS – www.hidmet.gov.rs 9
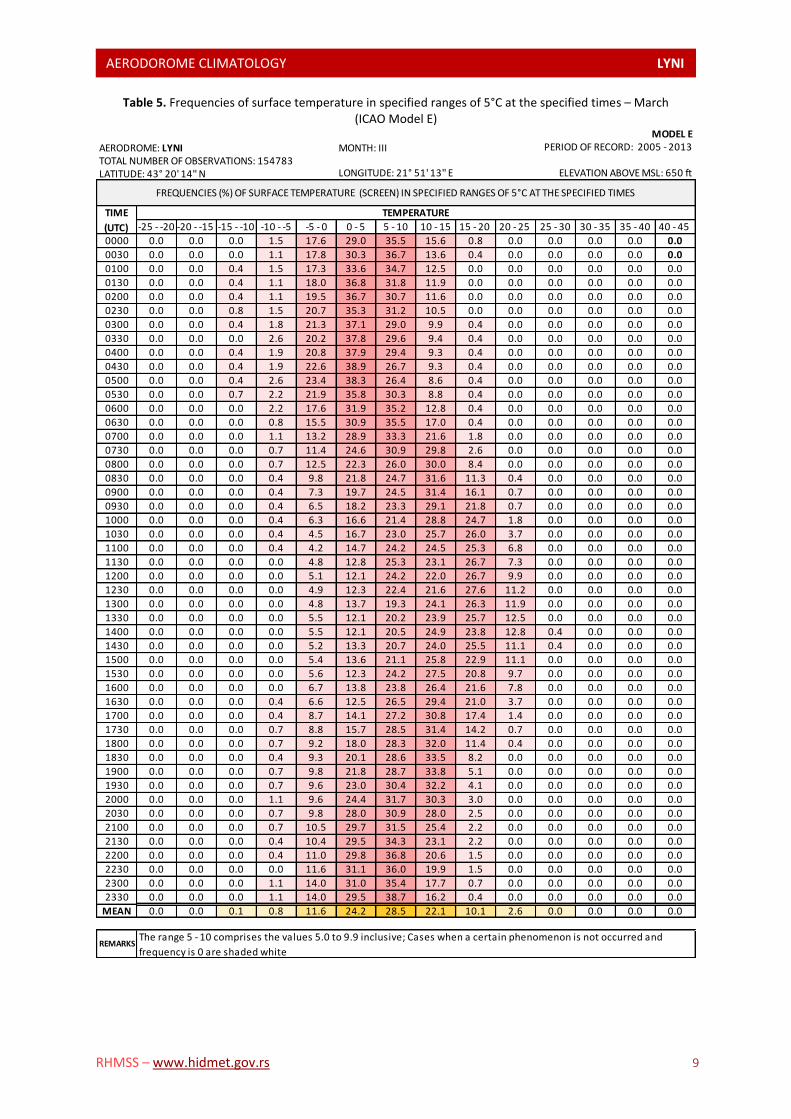
Table 5. Frequencies of surface temperature in specified ranges of 5°C at the specified times – March (ICAO Model E)
AERODROME: LYNI MONTH: IIITOTAL NUMBER OF OBSERVATIONS: 154783LATITUDE: 43° 20' 14'' N
-25 - -20 -20 - -15 -15 - -10 -10 - -5 -5 - 0 0 - 5 5 - 10 10 - 15 15 - 20 20 - 25 25 - 30 30 - 35 35 - 40 40 - 45
0000 0.0 0.0 0.0 1.5 17.6 29.0 35.5 15.6 0.8 0.0 0.0 0.0 0.0 0.0
0030 0.0 0.0 0.0 1.1 17.8 30.3 36.7 13.6 0.4 0.0 0.0 0.0 0.0 0.0
0100 0.0 0.0 0.4 1.5 17.3 33.6 34.7 12.5 0.0 0.0 0.0 0.0 0.0 0.0
0130 0.0 0.0 0.4 1.1 18.0 36.8 31.8 11.9 0.0 0.0 0.0 0.0 0.0 0.0
0200 0.0 0.0 0.4 1.1 19.5 36.7 30.7 11.6 0.0 0.0 0.0 0.0 0.0 0.0
0230 0.0 0.0 0.8 1.5 20.7 35.3 31.2 10.5 0.0 0.0 0.0 0.0 0.0 0.0
0300 0.0 0.0 0.4 1.8 21.3 37.1 29.0 9.9 0.4 0.0 0.0 0.0 0.0 0.0
0330 0.0 0.0 0.0 2.6 20.2 37.8 29.6 9.4 0.4 0.0 0.0 0.0 0.0 0.0
0400 0.0 0.0 0.4 1.9 20.8 37.9 29.4 9.3 0.4 0.0 0.0 0.0 0.0 0.0
0430 0.0 0.0 0.4 1.9 22.6 38.9 26.7 9.3 0.4 0.0 0.0 0.0 0.0 0.0
0500 0.0 0.0 0.4 2.6 23.4 38.3 26.4 8.6 0.4 0.0 0.0 0.0 0.0 0.0
0530 0.0 0.0 0.7 2.2 21.9 35.8 30.3 8.8 0.4 0.0 0.0 0.0 0.0 0.0
0600 0.0 0.0 0.0 2.2 17.6 31.9 35.2 12.8 0.4 0.0 0.0 0.0 0.0 0.0
0630 0.0 0.0 0.0 0.8 15.5 30.9 35.5 17.0 0.4 0.0 0.0 0.0 0.0 0.0
0700 0.0 0.0 0.0 1.1 13.2 28.9 33.3 21.6 1.8 0.0 0.0 0.0 0.0 0.0
0730 0.0 0.0 0.0 0.7 11.4 24.6 30.9 29.8 2.6 0.0 0.0 0.0 0.0 0.0
0800 0.0 0.0 0.0 0.7 12.5 22.3 26.0 30.0 8.4 0.0 0.0 0.0 0.0 0.0
0830 0.0 0.0 0.0 0.4 9.8 21.8 24.7 31.6 11.3 0.4 0.0 0.0 0.0 0.0
0900 0.0 0.0 0.0 0.4 7.3 19.7 24.5 31.4 16.1 0.7 0.0 0.0 0.0 0.0
0930 0.0 0.0 0.0 0.4 6.5 18.2 23.3 29.1 21.8 0.7 0.0 0.0 0.0 0.0
1000 0.0 0.0 0.0 0.4 6.3 16.6 21.4 28.8 24.7 1.8 0.0 0.0 0.0 0.0
1030 0.0 0.0 0.0 0.4 4.5 16.7 23.0 25.7 26.0 3.7 0.0 0.0 0.0 0.0
1100 0.0 0.0 0.0 0.4 4.2 14.7 24.2 24.5 25.3 6.8 0.0 0.0 0.0 0.0
1130 0.0 0.0 0.0 0.0 4.8 12.8 25.3 23.1 26.7 7.3 0.0 0.0 0.0 0.0
1200 0.0 0.0 0.0 0.0 5.1 12.1 24.2 22.0 26.7 9.9 0.0 0.0 0.0 0.0
1230 0.0 0.0 0.0 0.0 4.9 12.3 22.4 21.6 27.6 11.2 0.0 0.0 0.0 0.0
1300 0.0 0.0 0.0 0.0 4.8 13.7 19.3 24.1 26.3 11.9 0.0 0.0 0.0 0.0
1330 0.0 0.0 0.0 0.0 5.5 12.1 20.2 23.9 25.7 12.5 0.0 0.0 0.0 0.0
1400 0.0 0.0 0.0 0.0 5.5 12.1 20.5 24.9 23.8 12.8 0.4 0.0 0.0 0.0
1430 0.0 0.0 0.0 0.0 5.2 13.3 20.7 24.0 25.5 11.1 0.4 0.0 0.0 0.0
1500 0.0 0.0 0.0 0.0 5.4 13.6 21.1 25.8 22.9 11.1 0.0 0.0 0.0 0.0
1530 0.0 0.0 0.0 0.0 5.6 12.3 24.2 27.5 20.8 9.7 0.0 0.0 0.0 0.0
1600 0.0 0.0 0.0 0.0 6.7 13.8 23.8 26.4 21.6 7.8 0.0 0.0 0.0 0.0
1630 0.0 0.0 0.0 0.4 6.6 12.5 26.5 29.4 21.0 3.7 0.0 0.0 0.0 0.0
1700 0.0 0.0 0.0 0.4 8.7 14.1 27.2 30.8 17.4 1.4 0.0 0.0 0.0 0.0
1730 0.0 0.0 0.0 0.7 8.8 15.7 28.5 31.4 14.2 0.7 0.0 0.0 0.0 0.0
1800 0.0 0.0 0.0 0.7 9.2 18.0 28.3 32.0 11.4 0.4 0.0 0.0 0.0 0.0
1830 0.0 0.0 0.0 0.4 9.3 20.1 28.6 33.5 8.2 0.0 0.0 0.0 0.0 0.0
1900 0.0 0.0 0.0 0.7 9.8 21.8 28.7 33.8 5.1 0.0 0.0 0.0 0.0 0.0
1930 0.0 0.0 0.0 0.7 9.6 23.0 30.4 32.2 4.1 0.0 0.0 0.0 0.0 0.0
2000 0.0 0.0 0.0 1.1 9.6 24.4 31.7 30.3 3.0 0.0 0.0 0.0 0.0 0.0
2030 0.0 0.0 0.0 0.7 9.8 28.0 30.9 28.0 2.5 0.0 0.0 0.0 0.0 0.0
2100 0.0 0.0 0.0 0.7 10.5 29.7 31.5 25.4 2.2 0.0 0.0 0.0 0.0 0.0
2130 0.0 0.0 0.0 0.4 10.4 29.5 34.3 23.1 2.2 0.0 0.0 0.0 0.0 0.0
2200 0.0 0.0 0.0 0.4 11.0 29.8 36.8 20.6 1.5 0.0 0.0 0.0 0.0 0.0
2230 0.0 0.0 0.0 0.0 11.6 31.1 36.0 19.9 1.5 0.0 0.0 0.0 0.0 0.0
2300 0.0 0.0 0.0 1.1 14.0 31.0 35.4 17.7 0.7 0.0 0.0 0.0 0.0 0.0
2330 0.0 0.0 0.0 1.1 14.0 29.5 38.7 16.2 0.4 0.0 0.0 0.0 0.0 0.0
MEAN 0.0 0.0 0.1 0.8 11.6 24.2 28.5 22.1 10.1 2.6 0.0 0.0 0.0 0.0
MODEL E
REMARKS
FREQUENCIES (%) OF SURFACE TEMPERATURE (SCREEN) IN SPECIFIED RANGES OF 5°C AT THE SPECIFIED TIMES
TEMPERATURETIME
(UTC)
PERIOD OF RECORD: 2005 - 2013
ELEVATION ABOVE MSL: 650 ftLONGITUDE: 21° 51' 13'' E
The range 5 - 10 comprises the values 5.0 to 9.9 inclusive; Cases when a certain phenomenon is not occurred and
frequency is 0 are shaded white
AERODOROME CLIMATOLOGY LYNI L
RHMSS – www.hidmet.gov.rs 10
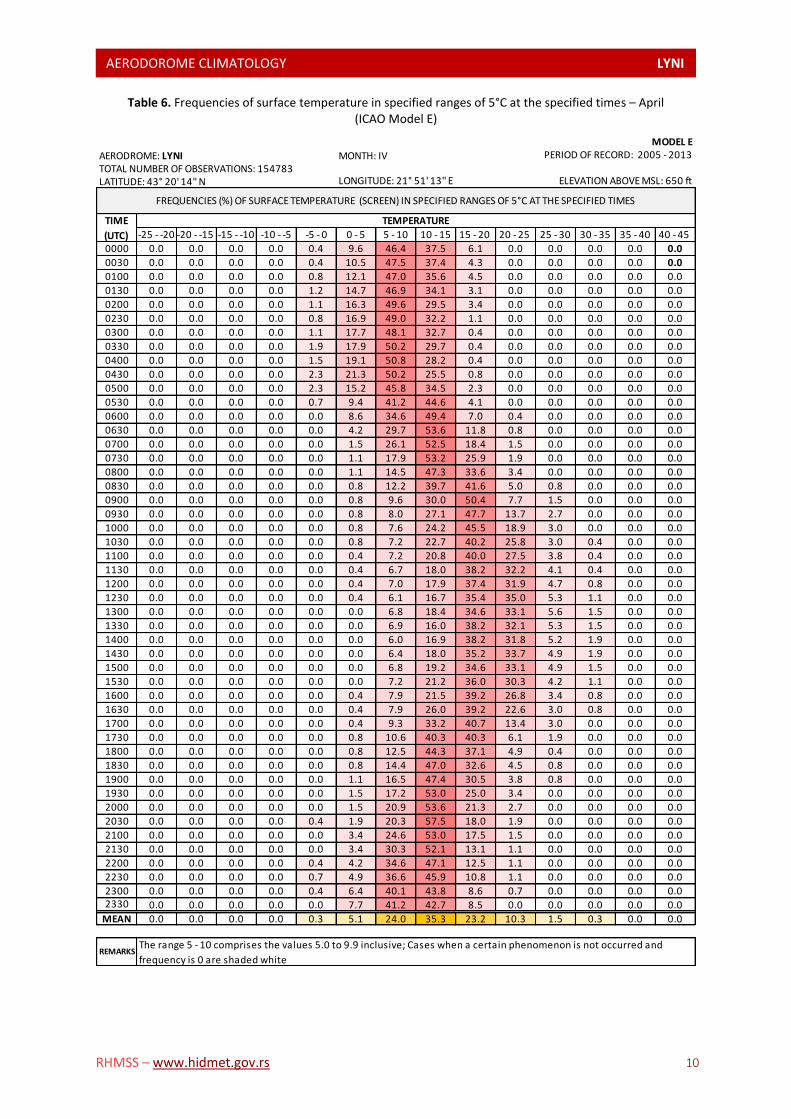
Table 6. Frequencies of surface temperature in specified ranges of 5°C at the specified times – April (ICAO Model E)
AERODROME: LYNI MONTH: IVTOTAL NUMBER OF OBSERVATIONS: 154783LATITUDE: 43° 20' 14'' N
-25 - -20 -20 - -15 -15 - -10 -10 - -5 -5 - 0 0 - 5 5 - 10 10 - 15 15 - 20 20 - 25 25 - 30 30 - 35 35 - 40 40 - 45
0000 0.0 0.0 0.0 0.0 0.4 9.6 46.4 37.5 6.1 0.0 0.0 0.0 0.0 0.0
0030 0.0 0.0 0.0 0.0 0.4 10.5 47.5 37.4 4.3 0.0 0.0 0.0 0.0 0.0
0100 0.0 0.0 0.0 0.0 0.8 12.1 47.0 35.6 4.5 0.0 0.0 0.0 0.0 0.0
0130 0.0 0.0 0.0 0.0 1.2 14.7 46.9 34.1 3.1 0.0 0.0 0.0 0.0 0.0
0200 0.0 0.0 0.0 0.0 1.1 16.3 49.6 29.5 3.4 0.0 0.0 0.0 0.0 0.0
0230 0.0 0.0 0.0 0.0 0.8 16.9 49.0 32.2 1.1 0.0 0.0 0.0 0.0 0.0
0300 0.0 0.0 0.0 0.0 1.1 17.7 48.1 32.7 0.4 0.0 0.0 0.0 0.0 0.0
0330 0.0 0.0 0.0 0.0 1.9 17.9 50.2 29.7 0.4 0.0 0.0 0.0 0.0 0.0
0400 0.0 0.0 0.0 0.0 1.5 19.1 50.8 28.2 0.4 0.0 0.0 0.0 0.0 0.0
0430 0.0 0.0 0.0 0.0 2.3 21.3 50.2 25.5 0.8 0.0 0.0 0.0 0.0 0.0
0500 0.0 0.0 0.0 0.0 2.3 15.2 45.8 34.5 2.3 0.0 0.0 0.0 0.0 0.0
0530 0.0 0.0 0.0 0.0 0.7 9.4 41.2 44.6 4.1 0.0 0.0 0.0 0.0 0.0
0600 0.0 0.0 0.0 0.0 0.0 8.6 34.6 49.4 7.0 0.4 0.0 0.0 0.0 0.0
0630 0.0 0.0 0.0 0.0 0.0 4.2 29.7 53.6 11.8 0.8 0.0 0.0 0.0 0.0
0700 0.0 0.0 0.0 0.0 0.0 1.5 26.1 52.5 18.4 1.5 0.0 0.0 0.0 0.0
0730 0.0 0.0 0.0 0.0 0.0 1.1 17.9 53.2 25.9 1.9 0.0 0.0 0.0 0.0
0800 0.0 0.0 0.0 0.0 0.0 1.1 14.5 47.3 33.6 3.4 0.0 0.0 0.0 0.0
0830 0.0 0.0 0.0 0.0 0.0 0.8 12.2 39.7 41.6 5.0 0.8 0.0 0.0 0.0
0900 0.0 0.0 0.0 0.0 0.0 0.8 9.6 30.0 50.4 7.7 1.5 0.0 0.0 0.0
0930 0.0 0.0 0.0 0.0 0.0 0.8 8.0 27.1 47.7 13.7 2.7 0.0 0.0 0.0
1000 0.0 0.0 0.0 0.0 0.0 0.8 7.6 24.2 45.5 18.9 3.0 0.0 0.0 0.0
1030 0.0 0.0 0.0 0.0 0.0 0.8 7.2 22.7 40.2 25.8 3.0 0.4 0.0 0.0
1100 0.0 0.0 0.0 0.0 0.0 0.4 7.2 20.8 40.0 27.5 3.8 0.4 0.0 0.0
1130 0.0 0.0 0.0 0.0 0.0 0.4 6.7 18.0 38.2 32.2 4.1 0.4 0.0 0.0
1200 0.0 0.0 0.0 0.0 0.0 0.4 7.0 17.9 37.4 31.9 4.7 0.8 0.0 0.0
1230 0.0 0.0 0.0 0.0 0.0 0.4 6.1 16.7 35.4 35.0 5.3 1.1 0.0 0.0
1300 0.0 0.0 0.0 0.0 0.0 0.0 6.8 18.4 34.6 33.1 5.6 1.5 0.0 0.0
1330 0.0 0.0 0.0 0.0 0.0 0.0 6.9 16.0 38.2 32.1 5.3 1.5 0.0 0.0
1400 0.0 0.0 0.0 0.0 0.0 0.0 6.0 16.9 38.2 31.8 5.2 1.9 0.0 0.0
1430 0.0 0.0 0.0 0.0 0.0 0.0 6.4 18.0 35.2 33.7 4.9 1.9 0.0 0.0
1500 0.0 0.0 0.0 0.0 0.0 0.0 6.8 19.2 34.6 33.1 4.9 1.5 0.0 0.0
1530 0.0 0.0 0.0 0.0 0.0 0.0 7.2 21.2 36.0 30.3 4.2 1.1 0.0 0.0
1600 0.0 0.0 0.0 0.0 0.0 0.4 7.9 21.5 39.2 26.8 3.4 0.8 0.0 0.0
1630 0.0 0.0 0.0 0.0 0.0 0.4 7.9 26.0 39.2 22.6 3.0 0.8 0.0 0.0
1700 0.0 0.0 0.0 0.0 0.0 0.4 9.3 33.2 40.7 13.4 3.0 0.0 0.0 0.0
1730 0.0 0.0 0.0 0.0 0.0 0.8 10.6 40.3 40.3 6.1 1.9 0.0 0.0 0.0
1800 0.0 0.0 0.0 0.0 0.0 0.8 12.5 44.3 37.1 4.9 0.4 0.0 0.0 0.0
1830 0.0 0.0 0.0 0.0 0.0 0.8 14.4 47.0 32.6 4.5 0.8 0.0 0.0 0.0
1900 0.0 0.0 0.0 0.0 0.0 1.1 16.5 47.4 30.5 3.8 0.8 0.0 0.0 0.0
1930 0.0 0.0 0.0 0.0 0.0 1.5 17.2 53.0 25.0 3.4 0.0 0.0 0.0 0.0
2000 0.0 0.0 0.0 0.0 0.0 1.5 20.9 53.6 21.3 2.7 0.0 0.0 0.0 0.0
2030 0.0 0.0 0.0 0.0 0.4 1.9 20.3 57.5 18.0 1.9 0.0 0.0 0.0 0.0
2100 0.0 0.0 0.0 0.0 0.0 3.4 24.6 53.0 17.5 1.5 0.0 0.0 0.0 0.0
2130 0.0 0.0 0.0 0.0 0.0 3.4 30.3 52.1 13.1 1.1 0.0 0.0 0.0 0.0
2200 0.0 0.0 0.0 0.0 0.4 4.2 34.6 47.1 12.5 1.1 0.0 0.0 0.0 0.0
2230 0.0 0.0 0.0 0.0 0.7 4.9 36.6 45.9 10.8 1.1 0.0 0.0 0.0 0.0
2300 0.0 0.0 0.0 0.0 0.4 6.4 40.1 43.8 8.6 0.7 0.0 0.0 0.0 0.02330 0.0 0.0 0.0 0.0 0.0 7.7 41.2 42.7 8.5 0.0 0.0 0.0 0.0 0.0
MEAN 0.0 0.0 0.0 0.0 0.3 5.1 24.0 35.3 23.2 10.3 1.5 0.3 0.0 0.0
REMARKS
TEMPERATURETIME
(UTC)
MODEL E
FREQUENCIES (%) OF SURFACE TEMPERATURE (SCREEN) IN SPECIFIED RANGES OF 5°C AT THE SPECIFIED TIMES
PERIOD OF RECORD: 2005 - 2013
ELEVATION ABOVE MSL: 650 ftLONGITUDE: 21° 51' 13'' E
The range 5 - 10 comprises the values 5.0 to 9.9 inclusive; Cases when a certain phenomenon is not occurred and
frequency is 0 are shaded white
AERODOROME CLIMATOLOGY LYNI L
RHMSS – www.hidmet.gov.rs 11
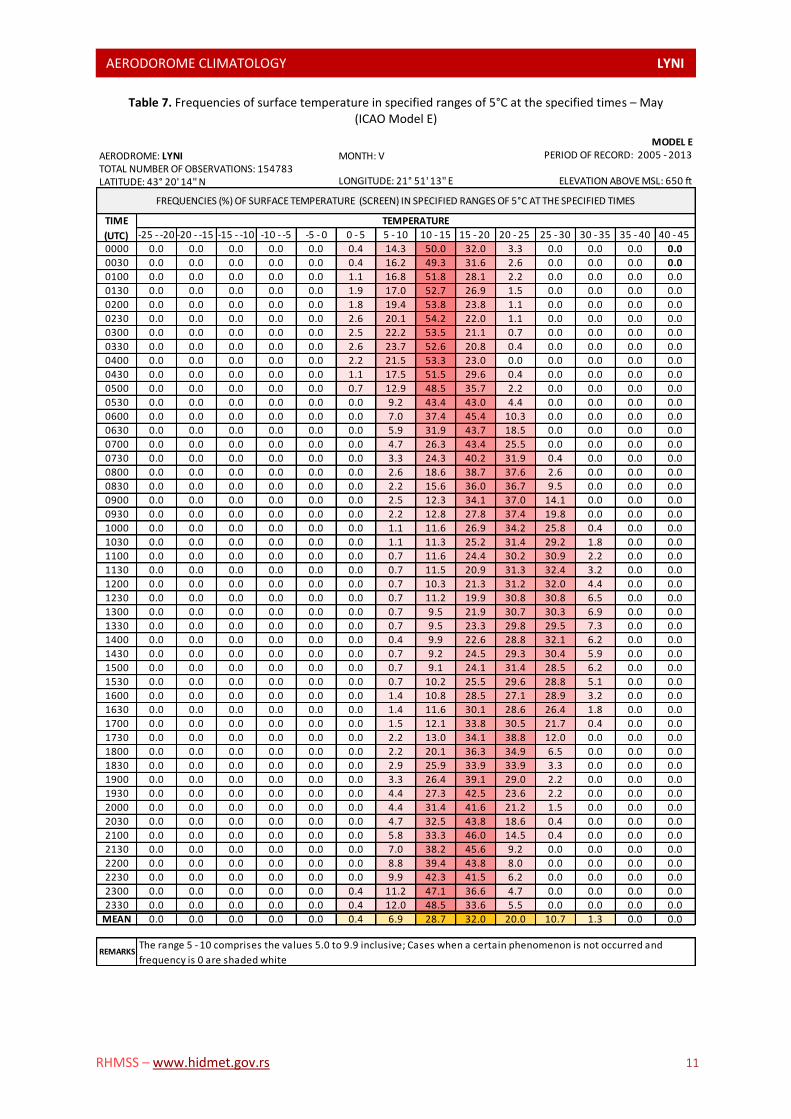
Table 7. Frequencies of surface temperature in specified ranges of 5°C at the specified times – May (ICAO Model E)
AERODROME: LYNI MONTH: VTOTAL NUMBER OF OBSERVATIONS: 154783LATITUDE: 43° 20' 14'' N
-25 - -20 -20 - -15 -15 - -10 -10 - -5 -5 - 0 0 - 5 5 - 10 10 - 15 15 - 20 20 - 25 25 - 30 30 - 35 35 - 40 40 - 45
0000 0.0 0.0 0.0 0.0 0.0 0.4 14.3 50.0 32.0 3.3 0.0 0.0 0.0 0.0
0030 0.0 0.0 0.0 0.0 0.0 0.4 16.2 49.3 31.6 2.6 0.0 0.0 0.0 0.0
0100 0.0 0.0 0.0 0.0 0.0 1.1 16.8 51.8 28.1 2.2 0.0 0.0 0.0 0.0
0130 0.0 0.0 0.0 0.0 0.0 1.9 17.0 52.7 26.9 1.5 0.0 0.0 0.0 0.0
0200 0.0 0.0 0.0 0.0 0.0 1.8 19.4 53.8 23.8 1.1 0.0 0.0 0.0 0.0
0230 0.0 0.0 0.0 0.0 0.0 2.6 20.1 54.2 22.0 1.1 0.0 0.0 0.0 0.0
0300 0.0 0.0 0.0 0.0 0.0 2.5 22.2 53.5 21.1 0.7 0.0 0.0 0.0 0.0
0330 0.0 0.0 0.0 0.0 0.0 2.6 23.7 52.6 20.8 0.4 0.0 0.0 0.0 0.0
0400 0.0 0.0 0.0 0.0 0.0 2.2 21.5 53.3 23.0 0.0 0.0 0.0 0.0 0.0
0430 0.0 0.0 0.0 0.0 0.0 1.1 17.5 51.5 29.6 0.4 0.0 0.0 0.0 0.0
0500 0.0 0.0 0.0 0.0 0.0 0.7 12.9 48.5 35.7 2.2 0.0 0.0 0.0 0.0
0530 0.0 0.0 0.0 0.0 0.0 0.0 9.2 43.4 43.0 4.4 0.0 0.0 0.0 0.0
0600 0.0 0.0 0.0 0.0 0.0 0.0 7.0 37.4 45.4 10.3 0.0 0.0 0.0 0.0
0630 0.0 0.0 0.0 0.0 0.0 0.0 5.9 31.9 43.7 18.5 0.0 0.0 0.0 0.0
0700 0.0 0.0 0.0 0.0 0.0 0.0 4.7 26.3 43.4 25.5 0.0 0.0 0.0 0.0
0730 0.0 0.0 0.0 0.0 0.0 0.0 3.3 24.3 40.2 31.9 0.4 0.0 0.0 0.0
0800 0.0 0.0 0.0 0.0 0.0 0.0 2.6 18.6 38.7 37.6 2.6 0.0 0.0 0.0
0830 0.0 0.0 0.0 0.0 0.0 0.0 2.2 15.6 36.0 36.7 9.5 0.0 0.0 0.0
0900 0.0 0.0 0.0 0.0 0.0 0.0 2.5 12.3 34.1 37.0 14.1 0.0 0.0 0.0
0930 0.0 0.0 0.0 0.0 0.0 0.0 2.2 12.8 27.8 37.4 19.8 0.0 0.0 0.0
1000 0.0 0.0 0.0 0.0 0.0 0.0 1.1 11.6 26.9 34.2 25.8 0.4 0.0 0.0
1030 0.0 0.0 0.0 0.0 0.0 0.0 1.1 11.3 25.2 31.4 29.2 1.8 0.0 0.0
1100 0.0 0.0 0.0 0.0 0.0 0.0 0.7 11.6 24.4 30.2 30.9 2.2 0.0 0.0
1130 0.0 0.0 0.0 0.0 0.0 0.0 0.7 11.5 20.9 31.3 32.4 3.2 0.0 0.0
1200 0.0 0.0 0.0 0.0 0.0 0.0 0.7 10.3 21.3 31.2 32.0 4.4 0.0 0.0
1230 0.0 0.0 0.0 0.0 0.0 0.0 0.7 11.2 19.9 30.8 30.8 6.5 0.0 0.0
1300 0.0 0.0 0.0 0.0 0.0 0.0 0.7 9.5 21.9 30.7 30.3 6.9 0.0 0.0
1330 0.0 0.0 0.0 0.0 0.0 0.0 0.7 9.5 23.3 29.8 29.5 7.3 0.0 0.0
1400 0.0 0.0 0.0 0.0 0.0 0.0 0.4 9.9 22.6 28.8 32.1 6.2 0.0 0.0
1430 0.0 0.0 0.0 0.0 0.0 0.0 0.7 9.2 24.5 29.3 30.4 5.9 0.0 0.0
1500 0.0 0.0 0.0 0.0 0.0 0.0 0.7 9.1 24.1 31.4 28.5 6.2 0.0 0.0
1530 0.0 0.0 0.0 0.0 0.0 0.0 0.7 10.2 25.5 29.6 28.8 5.1 0.0 0.0
1600 0.0 0.0 0.0 0.0 0.0 0.0 1.4 10.8 28.5 27.1 28.9 3.2 0.0 0.0
1630 0.0 0.0 0.0 0.0 0.0 0.0 1.4 11.6 30.1 28.6 26.4 1.8 0.0 0.0
1700 0.0 0.0 0.0 0.0 0.0 0.0 1.5 12.1 33.8 30.5 21.7 0.4 0.0 0.0
1730 0.0 0.0 0.0 0.0 0.0 0.0 2.2 13.0 34.1 38.8 12.0 0.0 0.0 0.0
1800 0.0 0.0 0.0 0.0 0.0 0.0 2.2 20.1 36.3 34.9 6.5 0.0 0.0 0.0
1830 0.0 0.0 0.0 0.0 0.0 0.0 2.9 25.9 33.9 33.9 3.3 0.0 0.0 0.0
1900 0.0 0.0 0.0 0.0 0.0 0.0 3.3 26.4 39.1 29.0 2.2 0.0 0.0 0.0
1930 0.0 0.0 0.0 0.0 0.0 0.0 4.4 27.3 42.5 23.6 2.2 0.0 0.0 0.0
2000 0.0 0.0 0.0 0.0 0.0 0.0 4.4 31.4 41.6 21.2 1.5 0.0 0.0 0.0
2030 0.0 0.0 0.0 0.0 0.0 0.0 4.7 32.5 43.8 18.6 0.4 0.0 0.0 0.0
2100 0.0 0.0 0.0 0.0 0.0 0.0 5.8 33.3 46.0 14.5 0.4 0.0 0.0 0.0
2130 0.0 0.0 0.0 0.0 0.0 0.0 7.0 38.2 45.6 9.2 0.0 0.0 0.0 0.0
2200 0.0 0.0 0.0 0.0 0.0 0.0 8.8 39.4 43.8 8.0 0.0 0.0 0.0 0.0
2230 0.0 0.0 0.0 0.0 0.0 0.0 9.9 42.3 41.5 6.2 0.0 0.0 0.0 0.0
2300 0.0 0.0 0.0 0.0 0.0 0.4 11.2 47.1 36.6 4.7 0.0 0.0 0.0 0.0
2330 0.0 0.0 0.0 0.0 0.0 0.4 12.0 48.5 33.6 5.5 0.0 0.0 0.0 0.0
MEAN 0.0 0.0 0.0 0.0 0.0 0.4 6.9 28.7 32.0 20.0 10.7 1.3 0.0 0.0
REMARKS
TEMPERATURETIME
(UTC)
MODEL E
FREQUENCIES (%) OF SURFACE TEMPERATURE (SCREEN) IN SPECIFIED RANGES OF 5°C AT THE SPECIFIED TIMES
PERIOD OF RECORD: 2005 - 2013
ELEVATION ABOVE MSL: 650 ftLONGITUDE: 21° 51' 13'' E
The range 5 - 10 comprises the values 5.0 to 9.9 inclusive; Cases when a certain phenomenon is not occurred and
frequency is 0 are shaded white
AERODOROME CLIMATOLOGY LYNI L
RHMSS – www.hidmet.gov.rs 12
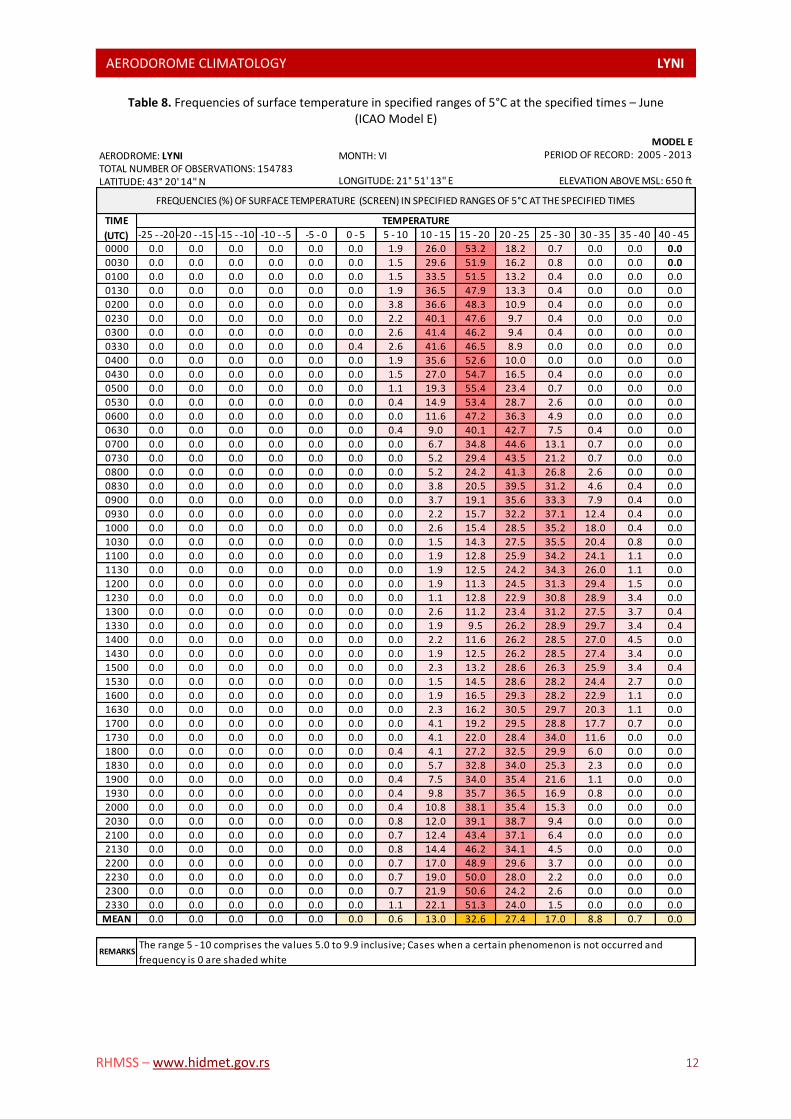
Table 8. Frequencies of surface temperature in specified ranges of 5°C at the specified times – June (ICAO Model E)
AERODROME: LYNI MONTH: VITOTAL NUMBER OF OBSERVATIONS: 154783LATITUDE: 43° 20' 14'' N
-25 - -20 -20 - -15 -15 - -10 -10 - -5 -5 - 0 0 - 5 5 - 10 10 - 15 15 - 20 20 - 25 25 - 30 30 - 35 35 - 40 40 - 45
0000 0.0 0.0 0.0 0.0 0.0 0.0 1.9 26.0 53.2 18.2 0.7 0.0 0.0 0.0
0030 0.0 0.0 0.0 0.0 0.0 0.0 1.5 29.6 51.9 16.2 0.8 0.0 0.0 0.0
0100 0.0 0.0 0.0 0.0 0.0 0.0 1.5 33.5 51.5 13.2 0.4 0.0 0.0 0.0
0130 0.0 0.0 0.0 0.0 0.0 0.0 1.9 36.5 47.9 13.3 0.4 0.0 0.0 0.0
0200 0.0 0.0 0.0 0.0 0.0 0.0 3.8 36.6 48.3 10.9 0.4 0.0 0.0 0.0
0230 0.0 0.0 0.0 0.0 0.0 0.0 2.2 40.1 47.6 9.7 0.4 0.0 0.0 0.0
0300 0.0 0.0 0.0 0.0 0.0 0.0 2.6 41.4 46.2 9.4 0.4 0.0 0.0 0.0
0330 0.0 0.0 0.0 0.0 0.0 0.4 2.6 41.6 46.5 8.9 0.0 0.0 0.0 0.0
0400 0.0 0.0 0.0 0.0 0.0 0.0 1.9 35.6 52.6 10.0 0.0 0.0 0.0 0.0
0430 0.0 0.0 0.0 0.0 0.0 0.0 1.5 27.0 54.7 16.5 0.4 0.0 0.0 0.0
0500 0.0 0.0 0.0 0.0 0.0 0.0 1.1 19.3 55.4 23.4 0.7 0.0 0.0 0.0
0530 0.0 0.0 0.0 0.0 0.0 0.0 0.4 14.9 53.4 28.7 2.6 0.0 0.0 0.0
0600 0.0 0.0 0.0 0.0 0.0 0.0 0.0 11.6 47.2 36.3 4.9 0.0 0.0 0.0
0630 0.0 0.0 0.0 0.0 0.0 0.0 0.4 9.0 40.1 42.7 7.5 0.4 0.0 0.0
0700 0.0 0.0 0.0 0.0 0.0 0.0 0.0 6.7 34.8 44.6 13.1 0.7 0.0 0.0
0730 0.0 0.0 0.0 0.0 0.0 0.0 0.0 5.2 29.4 43.5 21.2 0.7 0.0 0.0
0800 0.0 0.0 0.0 0.0 0.0 0.0 0.0 5.2 24.2 41.3 26.8 2.6 0.0 0.0
0830 0.0 0.0 0.0 0.0 0.0 0.0 0.0 3.8 20.5 39.5 31.2 4.6 0.4 0.0
0900 0.0 0.0 0.0 0.0 0.0 0.0 0.0 3.7 19.1 35.6 33.3 7.9 0.4 0.0
0930 0.0 0.0 0.0 0.0 0.0 0.0 0.0 2.2 15.7 32.2 37.1 12.4 0.4 0.0
1000 0.0 0.0 0.0 0.0 0.0 0.0 0.0 2.6 15.4 28.5 35.2 18.0 0.4 0.0
1030 0.0 0.0 0.0 0.0 0.0 0.0 0.0 1.5 14.3 27.5 35.5 20.4 0.8 0.0
1100 0.0 0.0 0.0 0.0 0.0 0.0 0.0 1.9 12.8 25.9 34.2 24.1 1.1 0.0
1130 0.0 0.0 0.0 0.0 0.0 0.0 0.0 1.9 12.5 24.2 34.3 26.0 1.1 0.0
1200 0.0 0.0 0.0 0.0 0.0 0.0 0.0 1.9 11.3 24.5 31.3 29.4 1.5 0.0
1230 0.0 0.0 0.0 0.0 0.0 0.0 0.0 1.1 12.8 22.9 30.8 28.9 3.4 0.0
1300 0.0 0.0 0.0 0.0 0.0 0.0 0.0 2.6 11.2 23.4 31.2 27.5 3.7 0.4
1330 0.0 0.0 0.0 0.0 0.0 0.0 0.0 1.9 9.5 26.2 28.9 29.7 3.4 0.4
1400 0.0 0.0 0.0 0.0 0.0 0.0 0.0 2.2 11.6 26.2 28.5 27.0 4.5 0.0
1430 0.0 0.0 0.0 0.0 0.0 0.0 0.0 1.9 12.5 26.2 28.5 27.4 3.4 0.0
1500 0.0 0.0 0.0 0.0 0.0 0.0 0.0 2.3 13.2 28.6 26.3 25.9 3.4 0.4
1530 0.0 0.0 0.0 0.0 0.0 0.0 0.0 1.5 14.5 28.6 28.2 24.4 2.7 0.0
1600 0.0 0.0 0.0 0.0 0.0 0.0 0.0 1.9 16.5 29.3 28.2 22.9 1.1 0.0
1630 0.0 0.0 0.0 0.0 0.0 0.0 0.0 2.3 16.2 30.5 29.7 20.3 1.1 0.0
1700 0.0 0.0 0.0 0.0 0.0 0.0 0.0 4.1 19.2 29.5 28.8 17.7 0.7 0.0
1730 0.0 0.0 0.0 0.0 0.0 0.0 0.0 4.1 22.0 28.4 34.0 11.6 0.0 0.0
1800 0.0 0.0 0.0 0.0 0.0 0.0 0.4 4.1 27.2 32.5 29.9 6.0 0.0 0.0
1830 0.0 0.0 0.0 0.0 0.0 0.0 0.0 5.7 32.8 34.0 25.3 2.3 0.0 0.0
1900 0.0 0.0 0.0 0.0 0.0 0.0 0.4 7.5 34.0 35.4 21.6 1.1 0.0 0.0
1930 0.0 0.0 0.0 0.0 0.0 0.0 0.4 9.8 35.7 36.5 16.9 0.8 0.0 0.0
2000 0.0 0.0 0.0 0.0 0.0 0.0 0.4 10.8 38.1 35.4 15.3 0.0 0.0 0.0
2030 0.0 0.0 0.0 0.0 0.0 0.0 0.8 12.0 39.1 38.7 9.4 0.0 0.0 0.0
2100 0.0 0.0 0.0 0.0 0.0 0.0 0.7 12.4 43.4 37.1 6.4 0.0 0.0 0.0
2130 0.0 0.0 0.0 0.0 0.0 0.0 0.8 14.4 46.2 34.1 4.5 0.0 0.0 0.0
2200 0.0 0.0 0.0 0.0 0.0 0.0 0.7 17.0 48.9 29.6 3.7 0.0 0.0 0.0
2230 0.0 0.0 0.0 0.0 0.0 0.0 0.7 19.0 50.0 28.0 2.2 0.0 0.0 0.0
2300 0.0 0.0 0.0 0.0 0.0 0.0 0.7 21.9 50.6 24.2 2.6 0.0 0.0 0.0
2330 0.0 0.0 0.0 0.0 0.0 0.0 1.1 22.1 51.3 24.0 1.5 0.0 0.0 0.0
MEAN 0.0 0.0 0.0 0.0 0.0 0.0 0.6 13.0 32.6 27.4 17.0 8.8 0.7 0.0
REMARKS
TEMPERATURETIME
(UTC)
MODEL E
FREQUENCIES (%) OF SURFACE TEMPERATURE (SCREEN) IN SPECIFIED RANGES OF 5°C AT THE SPECIFIED TIMES
PERIOD OF RECORD: 2005 - 2013
ELEVATION ABOVE MSL: 650 ftLONGITUDE: 21° 51' 13'' E
The range 5 - 10 comprises the values 5.0 to 9.9 inclusive; Cases when a certain phenomenon is not occurred and
frequency is 0 are shaded white
AERODOROME CLIMATOLOGY LYNI L
RHMSS – www.hidmet.gov.rs 13
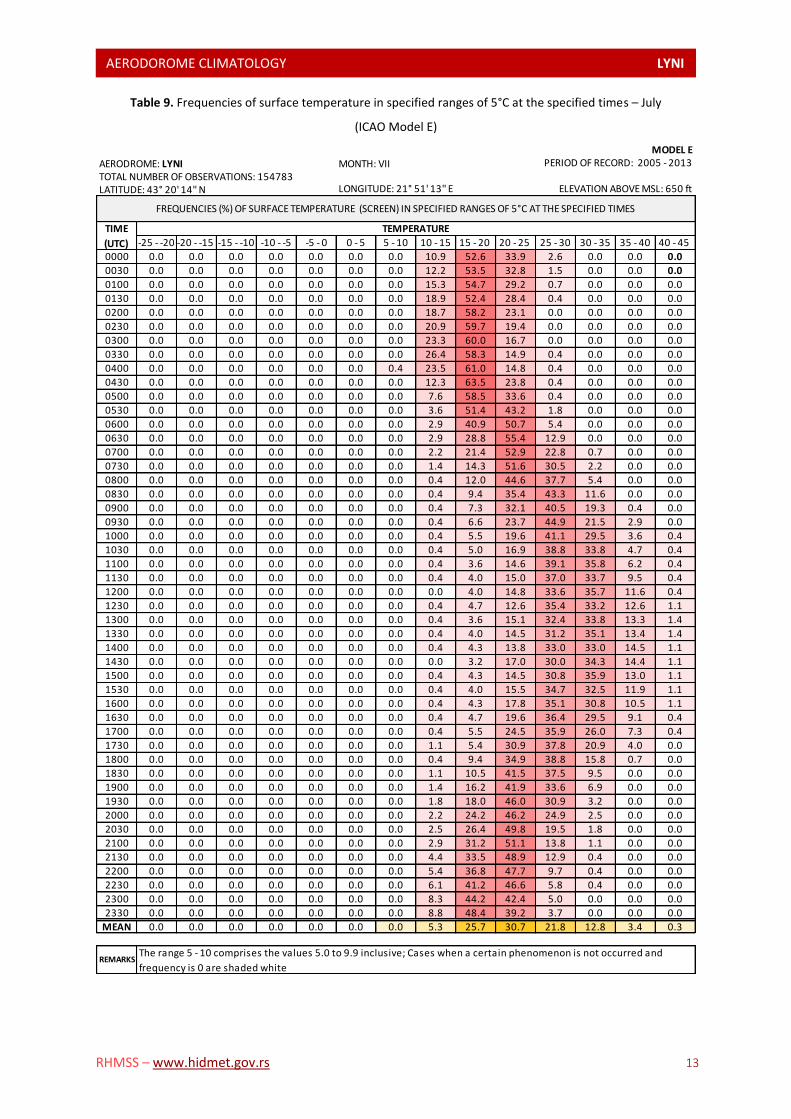
Table 9. Frequencies of surface temperature in specified ranges of 5°C at the specified times – July
(ICAO Model E)
AERODROME: LYNI MONTH: VIITOTAL NUMBER OF OBSERVATIONS: 154783LATITUDE: 43° 20' 14'' N
-25 - -20 -20 - -15 -15 - -10 -10 - -5 -5 - 0 0 - 5 5 - 10 10 - 15 15 - 20 20 - 25 25 - 30 30 - 35 35 - 40 40 - 45
0000 0.0 0.0 0.0 0.0 0.0 0.0 0.0 10.9 52.6 33.9 2.6 0.0 0.0 0.0
0030 0.0 0.0 0.0 0.0 0.0 0.0 0.0 12.2 53.5 32.8 1.5 0.0 0.0 0.0
0100 0.0 0.0 0.0 0.0 0.0 0.0 0.0 15.3 54.7 29.2 0.7 0.0 0.0 0.0
0130 0.0 0.0 0.0 0.0 0.0 0.0 0.0 18.9 52.4 28.4 0.4 0.0 0.0 0.0
0200 0.0 0.0 0.0 0.0 0.0 0.0 0.0 18.7 58.2 23.1 0.0 0.0 0.0 0.0
0230 0.0 0.0 0.0 0.0 0.0 0.0 0.0 20.9 59.7 19.4 0.0 0.0 0.0 0.0
0300 0.0 0.0 0.0 0.0 0.0 0.0 0.0 23.3 60.0 16.7 0.0 0.0 0.0 0.0
0330 0.0 0.0 0.0 0.0 0.0 0.0 0.0 26.4 58.3 14.9 0.4 0.0 0.0 0.0
0400 0.0 0.0 0.0 0.0 0.0 0.0 0.4 23.5 61.0 14.8 0.4 0.0 0.0 0.0
0430 0.0 0.0 0.0 0.0 0.0 0.0 0.0 12.3 63.5 23.8 0.4 0.0 0.0 0.0
0500 0.0 0.0 0.0 0.0 0.0 0.0 0.0 7.6 58.5 33.6 0.4 0.0 0.0 0.0
0530 0.0 0.0 0.0 0.0 0.0 0.0 0.0 3.6 51.4 43.2 1.8 0.0 0.0 0.0
0600 0.0 0.0 0.0 0.0 0.0 0.0 0.0 2.9 40.9 50.7 5.4 0.0 0.0 0.0
0630 0.0 0.0 0.0 0.0 0.0 0.0 0.0 2.9 28.8 55.4 12.9 0.0 0.0 0.0
0700 0.0 0.0 0.0 0.0 0.0 0.0 0.0 2.2 21.4 52.9 22.8 0.7 0.0 0.0
0730 0.0 0.0 0.0 0.0 0.0 0.0 0.0 1.4 14.3 51.6 30.5 2.2 0.0 0.0
0800 0.0 0.0 0.0 0.0 0.0 0.0 0.0 0.4 12.0 44.6 37.7 5.4 0.0 0.0
0830 0.0 0.0 0.0 0.0 0.0 0.0 0.0 0.4 9.4 35.4 43.3 11.6 0.0 0.0
0900 0.0 0.0 0.0 0.0 0.0 0.0 0.0 0.4 7.3 32.1 40.5 19.3 0.4 0.0
0930 0.0 0.0 0.0 0.0 0.0 0.0 0.0 0.4 6.6 23.7 44.9 21.5 2.9 0.0
1000 0.0 0.0 0.0 0.0 0.0 0.0 0.0 0.4 5.5 19.6 41.1 29.5 3.6 0.4
1030 0.0 0.0 0.0 0.0 0.0 0.0 0.0 0.4 5.0 16.9 38.8 33.8 4.7 0.4
1100 0.0 0.0 0.0 0.0 0.0 0.0 0.0 0.4 3.6 14.6 39.1 35.8 6.2 0.4
1130 0.0 0.0 0.0 0.0 0.0 0.0 0.0 0.4 4.0 15.0 37.0 33.7 9.5 0.4
1200 0.0 0.0 0.0 0.0 0.0 0.0 0.0 0.0 4.0 14.8 33.6 35.7 11.6 0.4
1230 0.0 0.0 0.0 0.0 0.0 0.0 0.0 0.4 4.7 12.6 35.4 33.2 12.6 1.1
1300 0.0 0.0 0.0 0.0 0.0 0.0 0.0 0.4 3.6 15.1 32.4 33.8 13.3 1.4
1330 0.0 0.0 0.0 0.0 0.0 0.0 0.0 0.4 4.0 14.5 31.2 35.1 13.4 1.4
1400 0.0 0.0 0.0 0.0 0.0 0.0 0.0 0.4 4.3 13.8 33.0 33.0 14.5 1.1
1430 0.0 0.0 0.0 0.0 0.0 0.0 0.0 0.0 3.2 17.0 30.0 34.3 14.4 1.1
1500 0.0 0.0 0.0 0.0 0.0 0.0 0.0 0.4 4.3 14.5 30.8 35.9 13.0 1.1
1530 0.0 0.0 0.0 0.0 0.0 0.0 0.0 0.4 4.0 15.5 34.7 32.5 11.9 1.1
1600 0.0 0.0 0.0 0.0 0.0 0.0 0.0 0.4 4.3 17.8 35.1 30.8 10.5 1.1
1630 0.0 0.0 0.0 0.0 0.0 0.0 0.0 0.4 4.7 19.6 36.4 29.5 9.1 0.4
1700 0.0 0.0 0.0 0.0 0.0 0.0 0.0 0.4 5.5 24.5 35.9 26.0 7.3 0.4
1730 0.0 0.0 0.0 0.0 0.0 0.0 0.0 1.1 5.4 30.9 37.8 20.9 4.0 0.0
1800 0.0 0.0 0.0 0.0 0.0 0.0 0.0 0.4 9.4 34.9 38.8 15.8 0.7 0.0
1830 0.0 0.0 0.0 0.0 0.0 0.0 0.0 1.1 10.5 41.5 37.5 9.5 0.0 0.0
1900 0.0 0.0 0.0 0.0 0.0 0.0 0.0 1.4 16.2 41.9 33.6 6.9 0.0 0.0
1930 0.0 0.0 0.0 0.0 0.0 0.0 0.0 1.8 18.0 46.0 30.9 3.2 0.0 0.0
2000 0.0 0.0 0.0 0.0 0.0 0.0 0.0 2.2 24.2 46.2 24.9 2.5 0.0 0.0
2030 0.0 0.0 0.0 0.0 0.0 0.0 0.0 2.5 26.4 49.8 19.5 1.8 0.0 0.0
2100 0.0 0.0 0.0 0.0 0.0 0.0 0.0 2.9 31.2 51.1 13.8 1.1 0.0 0.0
2130 0.0 0.0 0.0 0.0 0.0 0.0 0.0 4.4 33.5 48.9 12.9 0.4 0.0 0.0
2200 0.0 0.0 0.0 0.0 0.0 0.0 0.0 5.4 36.8 47.7 9.7 0.4 0.0 0.0
2230 0.0 0.0 0.0 0.0 0.0 0.0 0.0 6.1 41.2 46.6 5.8 0.4 0.0 0.0
2300 0.0 0.0 0.0 0.0 0.0 0.0 0.0 8.3 44.2 42.4 5.0 0.0 0.0 0.0
2330 0.0 0.0 0.0 0.0 0.0 0.0 0.0 8.8 48.4 39.2 3.7 0.0 0.0 0.0
MEAN 0.0 0.0 0.0 0.0 0.0 0.0 0.0 5.3 25.7 30.7 21.8 12.8 3.4 0.3
REMARKS
TEMPERATURETIME
(UTC)
MODEL E
FREQUENCIES (%) OF SURFACE TEMPERATURE (SCREEN) IN SPECIFIED RANGES OF 5°C AT THE SPECIFIED TIMES
PERIOD OF RECORD: 2005 - 2013
ELEVATION ABOVE MSL: 650 ftLONGITUDE: 21° 51' 13'' E
The range 5 - 10 comprises the values 5.0 to 9.9 inclusive; Cases when a certain phenomenon is not occurred and
frequency is 0 are shaded white
AERODOROME CLIMATOLOGY LYNI L
RHMSS – www.hidmet.gov.rs 14
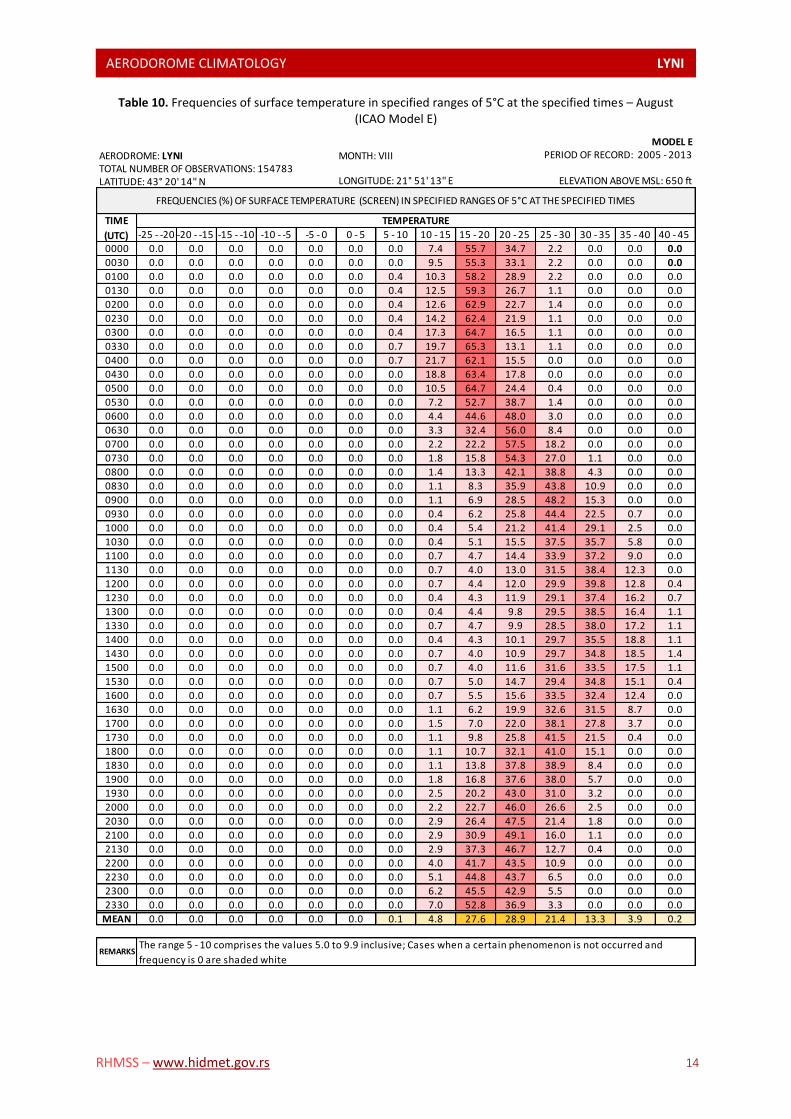
Table 10. Frequencies of surface temperature in specified ranges of 5°C at the specified times – August (ICAO Model E)
AERODROME: LYNI MONTH: VIIITOTAL NUMBER OF OBSERVATIONS: 154783LATITUDE: 43° 20' 14'' N
-25 - -20 -20 - -15 -15 - -10 -10 - -5 -5 - 0 0 - 5 5 - 10 10 - 15 15 - 20 20 - 25 25 - 30 30 - 35 35 - 40 40 - 45
0000 0.0 0.0 0.0 0.0 0.0 0.0 0.0 7.4 55.7 34.7 2.2 0.0 0.0 0.0
0030 0.0 0.0 0.0 0.0 0.0 0.0 0.0 9.5 55.3 33.1 2.2 0.0 0.0 0.0
0100 0.0 0.0 0.0 0.0 0.0 0.0 0.4 10.3 58.2 28.9 2.2 0.0 0.0 0.0
0130 0.0 0.0 0.0 0.0 0.0 0.0 0.4 12.5 59.3 26.7 1.1 0.0 0.0 0.0
0200 0.0 0.0 0.0 0.0 0.0 0.0 0.4 12.6 62.9 22.7 1.4 0.0 0.0 0.0
0230 0.0 0.0 0.0 0.0 0.0 0.0 0.4 14.2 62.4 21.9 1.1 0.0 0.0 0.0
0300 0.0 0.0 0.0 0.0 0.0 0.0 0.4 17.3 64.7 16.5 1.1 0.0 0.0 0.0
0330 0.0 0.0 0.0 0.0 0.0 0.0 0.7 19.7 65.3 13.1 1.1 0.0 0.0 0.0
0400 0.0 0.0 0.0 0.0 0.0 0.0 0.7 21.7 62.1 15.5 0.0 0.0 0.0 0.0
0430 0.0 0.0 0.0 0.0 0.0 0.0 0.0 18.8 63.4 17.8 0.0 0.0 0.0 0.0
0500 0.0 0.0 0.0 0.0 0.0 0.0 0.0 10.5 64.7 24.4 0.4 0.0 0.0 0.0
0530 0.0 0.0 0.0 0.0 0.0 0.0 0.0 7.2 52.7 38.7 1.4 0.0 0.0 0.0
0600 0.0 0.0 0.0 0.0 0.0 0.0 0.0 4.4 44.6 48.0 3.0 0.0 0.0 0.0
0630 0.0 0.0 0.0 0.0 0.0 0.0 0.0 3.3 32.4 56.0 8.4 0.0 0.0 0.0
0700 0.0 0.0 0.0 0.0 0.0 0.0 0.0 2.2 22.2 57.5 18.2 0.0 0.0 0.0
0730 0.0 0.0 0.0 0.0 0.0 0.0 0.0 1.8 15.8 54.3 27.0 1.1 0.0 0.0
0800 0.0 0.0 0.0 0.0 0.0 0.0 0.0 1.4 13.3 42.1 38.8 4.3 0.0 0.0
0830 0.0 0.0 0.0 0.0 0.0 0.0 0.0 1.1 8.3 35.9 43.8 10.9 0.0 0.0
0900 0.0 0.0 0.0 0.0 0.0 0.0 0.0 1.1 6.9 28.5 48.2 15.3 0.0 0.0
0930 0.0 0.0 0.0 0.0 0.0 0.0 0.0 0.4 6.2 25.8 44.4 22.5 0.7 0.0
1000 0.0 0.0 0.0 0.0 0.0 0.0 0.0 0.4 5.4 21.2 41.4 29.1 2.5 0.0
1030 0.0 0.0 0.0 0.0 0.0 0.0 0.0 0.4 5.1 15.5 37.5 35.7 5.8 0.0
1100 0.0 0.0 0.0 0.0 0.0 0.0 0.0 0.7 4.7 14.4 33.9 37.2 9.0 0.0
1130 0.0 0.0 0.0 0.0 0.0 0.0 0.0 0.7 4.0 13.0 31.5 38.4 12.3 0.0
1200 0.0 0.0 0.0 0.0 0.0 0.0 0.0 0.7 4.4 12.0 29.9 39.8 12.8 0.4
1230 0.0 0.0 0.0 0.0 0.0 0.0 0.0 0.4 4.3 11.9 29.1 37.4 16.2 0.7
1300 0.0 0.0 0.0 0.0 0.0 0.0 0.0 0.4 4.4 9.8 29.5 38.5 16.4 1.1
1330 0.0 0.0 0.0 0.0 0.0 0.0 0.0 0.7 4.7 9.9 28.5 38.0 17.2 1.1
1400 0.0 0.0 0.0 0.0 0.0 0.0 0.0 0.4 4.3 10.1 29.7 35.5 18.8 1.1
1430 0.0 0.0 0.0 0.0 0.0 0.0 0.0 0.7 4.0 10.9 29.7 34.8 18.5 1.4
1500 0.0 0.0 0.0 0.0 0.0 0.0 0.0 0.7 4.0 11.6 31.6 33.5 17.5 1.1
1530 0.0 0.0 0.0 0.0 0.0 0.0 0.0 0.7 5.0 14.7 29.4 34.8 15.1 0.4
1600 0.0 0.0 0.0 0.0 0.0 0.0 0.0 0.7 5.5 15.6 33.5 32.4 12.4 0.0
1630 0.0 0.0 0.0 0.0 0.0 0.0 0.0 1.1 6.2 19.9 32.6 31.5 8.7 0.0
1700 0.0 0.0 0.0 0.0 0.0 0.0 0.0 1.5 7.0 22.0 38.1 27.8 3.7 0.0
1730 0.0 0.0 0.0 0.0 0.0 0.0 0.0 1.1 9.8 25.8 41.5 21.5 0.4 0.0
1800 0.0 0.0 0.0 0.0 0.0 0.0 0.0 1.1 10.7 32.1 41.0 15.1 0.0 0.0
1830 0.0 0.0 0.0 0.0 0.0 0.0 0.0 1.1 13.8 37.8 38.9 8.4 0.0 0.0
1900 0.0 0.0 0.0 0.0 0.0 0.0 0.0 1.8 16.8 37.6 38.0 5.7 0.0 0.0
1930 0.0 0.0 0.0 0.0 0.0 0.0 0.0 2.5 20.2 43.0 31.0 3.2 0.0 0.0
2000 0.0 0.0 0.0 0.0 0.0 0.0 0.0 2.2 22.7 46.0 26.6 2.5 0.0 0.0
2030 0.0 0.0 0.0 0.0 0.0 0.0 0.0 2.9 26.4 47.5 21.4 1.8 0.0 0.0
2100 0.0 0.0 0.0 0.0 0.0 0.0 0.0 2.9 30.9 49.1 16.0 1.1 0.0 0.0
2130 0.0 0.0 0.0 0.0 0.0 0.0 0.0 2.9 37.3 46.7 12.7 0.4 0.0 0.0
2200 0.0 0.0 0.0 0.0 0.0 0.0 0.0 4.0 41.7 43.5 10.9 0.0 0.0 0.0
2230 0.0 0.0 0.0 0.0 0.0 0.0 0.0 5.1 44.8 43.7 6.5 0.0 0.0 0.0
2300 0.0 0.0 0.0 0.0 0.0 0.0 0.0 6.2 45.5 42.9 5.5 0.0 0.0 0.0
2330 0.0 0.0 0.0 0.0 0.0 0.0 0.0 7.0 52.8 36.9 3.3 0.0 0.0 0.0
MEAN 0.0 0.0 0.0 0.0 0.0 0.0 0.1 4.8 27.6 28.9 21.4 13.3 3.9 0.2
REMARKS
TEMPERATURETIME
(UTC)
MODEL E
FREQUENCIES (%) OF SURFACE TEMPERATURE (SCREEN) IN SPECIFIED RANGES OF 5°C AT THE SPECIFIED TIMES
PERIOD OF RECORD: 2005 - 2013
ELEVATION ABOVE MSL: 650 ftLONGITUDE: 21° 51' 13'' E
The range 5 - 10 comprises the values 5.0 to 9.9 inclusive; Cases when a certain phenomenon is not occurred and
frequency is 0 are shaded white
AERODOROME CLIMATOLOGY LYNI L
RHMSS – www.hidmet.gov.rs 15
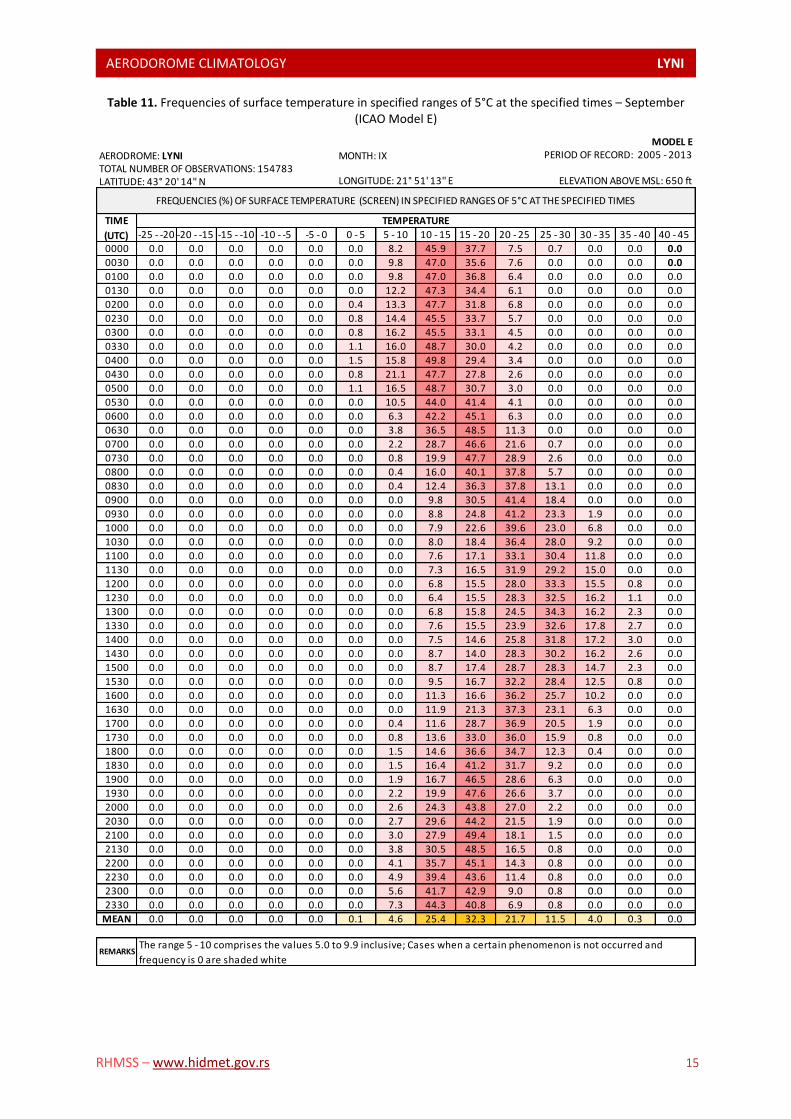
Table 11. Frequencies of surface temperature in specified ranges of 5°C at the specified times – September (ICAO Model E)
AERODROME: LYNI MONTH: IXTOTAL NUMBER OF OBSERVATIONS: 154783LATITUDE: 43° 20' 14'' N
-25 - -20 -20 - -15 -15 - -10 -10 - -5 -5 - 0 0 - 5 5 - 10 10 - 15 15 - 20 20 - 25 25 - 30 30 - 35 35 - 40 40 - 45
0000 0.0 0.0 0.0 0.0 0.0 0.0 8.2 45.9 37.7 7.5 0.7 0.0 0.0 0.0
0030 0.0 0.0 0.0 0.0 0.0 0.0 9.8 47.0 35.6 7.6 0.0 0.0 0.0 0.0
0100 0.0 0.0 0.0 0.0 0.0 0.0 9.8 47.0 36.8 6.4 0.0 0.0 0.0 0.0
0130 0.0 0.0 0.0 0.0 0.0 0.0 12.2 47.3 34.4 6.1 0.0 0.0 0.0 0.0
0200 0.0 0.0 0.0 0.0 0.0 0.4 13.3 47.7 31.8 6.8 0.0 0.0 0.0 0.0
0230 0.0 0.0 0.0 0.0 0.0 0.8 14.4 45.5 33.7 5.7 0.0 0.0 0.0 0.0
0300 0.0 0.0 0.0 0.0 0.0 0.8 16.2 45.5 33.1 4.5 0.0 0.0 0.0 0.0
0330 0.0 0.0 0.0 0.0 0.0 1.1 16.0 48.7 30.0 4.2 0.0 0.0 0.0 0.0
0400 0.0 0.0 0.0 0.0 0.0 1.5 15.8 49.8 29.4 3.4 0.0 0.0 0.0 0.0
0430 0.0 0.0 0.0 0.0 0.0 0.8 21.1 47.7 27.8 2.6 0.0 0.0 0.0 0.0
0500 0.0 0.0 0.0 0.0 0.0 1.1 16.5 48.7 30.7 3.0 0.0 0.0 0.0 0.0
0530 0.0 0.0 0.0 0.0 0.0 0.0 10.5 44.0 41.4 4.1 0.0 0.0 0.0 0.0
0600 0.0 0.0 0.0 0.0 0.0 0.0 6.3 42.2 45.1 6.3 0.0 0.0 0.0 0.0
0630 0.0 0.0 0.0 0.0 0.0 0.0 3.8 36.5 48.5 11.3 0.0 0.0 0.0 0.0
0700 0.0 0.0 0.0 0.0 0.0 0.0 2.2 28.7 46.6 21.6 0.7 0.0 0.0 0.0
0730 0.0 0.0 0.0 0.0 0.0 0.0 0.8 19.9 47.7 28.9 2.6 0.0 0.0 0.0
0800 0.0 0.0 0.0 0.0 0.0 0.0 0.4 16.0 40.1 37.8 5.7 0.0 0.0 0.0
0830 0.0 0.0 0.0 0.0 0.0 0.0 0.4 12.4 36.3 37.8 13.1 0.0 0.0 0.0
0900 0.0 0.0 0.0 0.0 0.0 0.0 0.0 9.8 30.5 41.4 18.4 0.0 0.0 0.0
0930 0.0 0.0 0.0 0.0 0.0 0.0 0.0 8.8 24.8 41.2 23.3 1.9 0.0 0.0
1000 0.0 0.0 0.0 0.0 0.0 0.0 0.0 7.9 22.6 39.6 23.0 6.8 0.0 0.0
1030 0.0 0.0 0.0 0.0 0.0 0.0 0.0 8.0 18.4 36.4 28.0 9.2 0.0 0.0
1100 0.0 0.0 0.0 0.0 0.0 0.0 0.0 7.6 17.1 33.1 30.4 11.8 0.0 0.0
1130 0.0 0.0 0.0 0.0 0.0 0.0 0.0 7.3 16.5 31.9 29.2 15.0 0.0 0.0
1200 0.0 0.0 0.0 0.0 0.0 0.0 0.0 6.8 15.5 28.0 33.3 15.5 0.8 0.0
1230 0.0 0.0 0.0 0.0 0.0 0.0 0.0 6.4 15.5 28.3 32.5 16.2 1.1 0.0
1300 0.0 0.0 0.0 0.0 0.0 0.0 0.0 6.8 15.8 24.5 34.3 16.2 2.3 0.0
1330 0.0 0.0 0.0 0.0 0.0 0.0 0.0 7.6 15.5 23.9 32.6 17.8 2.7 0.0
1400 0.0 0.0 0.0 0.0 0.0 0.0 0.0 7.5 14.6 25.8 31.8 17.2 3.0 0.0
1430 0.0 0.0 0.0 0.0 0.0 0.0 0.0 8.7 14.0 28.3 30.2 16.2 2.6 0.0
1500 0.0 0.0 0.0 0.0 0.0 0.0 0.0 8.7 17.4 28.7 28.3 14.7 2.3 0.0
1530 0.0 0.0 0.0 0.0 0.0 0.0 0.0 9.5 16.7 32.2 28.4 12.5 0.8 0.0
1600 0.0 0.0 0.0 0.0 0.0 0.0 0.0 11.3 16.6 36.2 25.7 10.2 0.0 0.0
1630 0.0 0.0 0.0 0.0 0.0 0.0 0.0 11.9 21.3 37.3 23.1 6.3 0.0 0.0
1700 0.0 0.0 0.0 0.0 0.0 0.0 0.4 11.6 28.7 36.9 20.5 1.9 0.0 0.0
1730 0.0 0.0 0.0 0.0 0.0 0.0 0.8 13.6 33.0 36.0 15.9 0.8 0.0 0.0
1800 0.0 0.0 0.0 0.0 0.0 0.0 1.5 14.6 36.6 34.7 12.3 0.4 0.0 0.0
1830 0.0 0.0 0.0 0.0 0.0 0.0 1.5 16.4 41.2 31.7 9.2 0.0 0.0 0.0
1900 0.0 0.0 0.0 0.0 0.0 0.0 1.9 16.7 46.5 28.6 6.3 0.0 0.0 0.0
1930 0.0 0.0 0.0 0.0 0.0 0.0 2.2 19.9 47.6 26.6 3.7 0.0 0.0 0.0
2000 0.0 0.0 0.0 0.0 0.0 0.0 2.6 24.3 43.8 27.0 2.2 0.0 0.0 0.0
2030 0.0 0.0 0.0 0.0 0.0 0.0 2.7 29.6 44.2 21.5 1.9 0.0 0.0 0.0
2100 0.0 0.0 0.0 0.0 0.0 0.0 3.0 27.9 49.4 18.1 1.5 0.0 0.0 0.0
2130 0.0 0.0 0.0 0.0 0.0 0.0 3.8 30.5 48.5 16.5 0.8 0.0 0.0 0.0
2200 0.0 0.0 0.0 0.0 0.0 0.0 4.1 35.7 45.1 14.3 0.8 0.0 0.0 0.0
2230 0.0 0.0 0.0 0.0 0.0 0.0 4.9 39.4 43.6 11.4 0.8 0.0 0.0 0.0
2300 0.0 0.0 0.0 0.0 0.0 0.0 5.6 41.7 42.9 9.0 0.8 0.0 0.0 0.0
2330 0.0 0.0 0.0 0.0 0.0 0.0 7.3 44.3 40.8 6.9 0.8 0.0 0.0 0.0
MEAN 0.0 0.0 0.0 0.0 0.0 0.1 4.6 25.4 32.3 21.7 11.5 4.0 0.3 0.0
REMARKS
TEMPERATURETIME
(UTC)
MODEL E
FREQUENCIES (%) OF SURFACE TEMPERATURE (SCREEN) IN SPECIFIED RANGES OF 5°C AT THE SPECIFIED TIMES
PERIOD OF RECORD: 2005 - 2013
ELEVATION ABOVE MSL: 650 ftLONGITUDE: 21° 51' 13'' E
The range 5 - 10 comprises the values 5.0 to 9.9 inclusive; Cases when a certain phenomenon is not occurred and
frequency is 0 are shaded white
AERODOROME CLIMATOLOGY LYNI L
RHMSS – www.hidmet.gov.rs 16
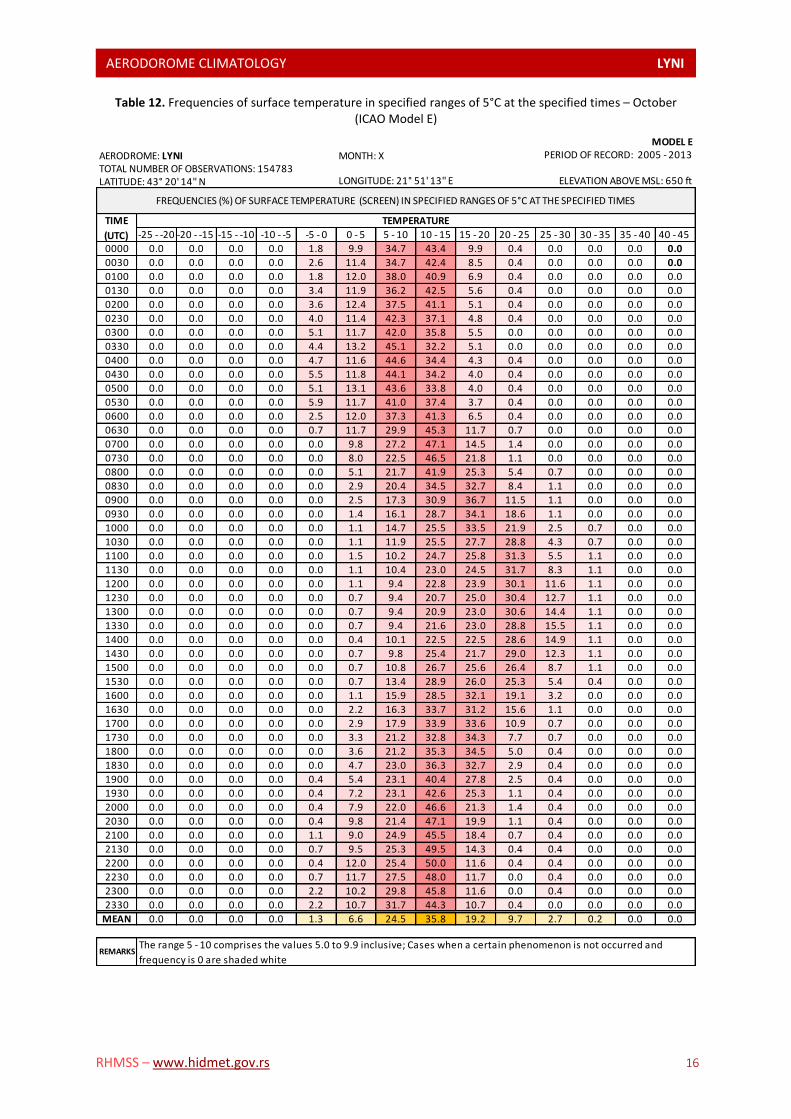
Table 12. Frequencies of surface temperature in specified ranges of 5°C at the specified times – October (ICAO Model E)
AERODROME: LYNI MONTH: XTOTAL NUMBER OF OBSERVATIONS: 154783LATITUDE: 43° 20' 14'' N
-25 - -20 -20 - -15 -15 - -10 -10 - -5 -5 - 0 0 - 5 5 - 10 10 - 15 15 - 20 20 - 25 25 - 30 30 - 35 35 - 40 40 - 45
0000 0.0 0.0 0.0 0.0 1.8 9.9 34.7 43.4 9.9 0.4 0.0 0.0 0.0 0.0
0030 0.0 0.0 0.0 0.0 2.6 11.4 34.7 42.4 8.5 0.4 0.0 0.0 0.0 0.0
0100 0.0 0.0 0.0 0.0 1.8 12.0 38.0 40.9 6.9 0.4 0.0 0.0 0.0 0.0
0130 0.0 0.0 0.0 0.0 3.4 11.9 36.2 42.5 5.6 0.4 0.0 0.0 0.0 0.0
0200 0.0 0.0 0.0 0.0 3.6 12.4 37.5 41.1 5.1 0.4 0.0 0.0 0.0 0.0
0230 0.0 0.0 0.0 0.0 4.0 11.4 42.3 37.1 4.8 0.4 0.0 0.0 0.0 0.0
0300 0.0 0.0 0.0 0.0 5.1 11.7 42.0 35.8 5.5 0.0 0.0 0.0 0.0 0.0
0330 0.0 0.0 0.0 0.0 4.4 13.2 45.1 32.2 5.1 0.0 0.0 0.0 0.0 0.0
0400 0.0 0.0 0.0 0.0 4.7 11.6 44.6 34.4 4.3 0.4 0.0 0.0 0.0 0.0
0430 0.0 0.0 0.0 0.0 5.5 11.8 44.1 34.2 4.0 0.4 0.0 0.0 0.0 0.0
0500 0.0 0.0 0.0 0.0 5.1 13.1 43.6 33.8 4.0 0.4 0.0 0.0 0.0 0.0
0530 0.0 0.0 0.0 0.0 5.9 11.7 41.0 37.4 3.7 0.4 0.0 0.0 0.0 0.0
0600 0.0 0.0 0.0 0.0 2.5 12.0 37.3 41.3 6.5 0.4 0.0 0.0 0.0 0.0
0630 0.0 0.0 0.0 0.0 0.7 11.7 29.9 45.3 11.7 0.7 0.0 0.0 0.0 0.0
0700 0.0 0.0 0.0 0.0 0.0 9.8 27.2 47.1 14.5 1.4 0.0 0.0 0.0 0.0
0730 0.0 0.0 0.0 0.0 0.0 8.0 22.5 46.5 21.8 1.1 0.0 0.0 0.0 0.0
0800 0.0 0.0 0.0 0.0 0.0 5.1 21.7 41.9 25.3 5.4 0.7 0.0 0.0 0.0
0830 0.0 0.0 0.0 0.0 0.0 2.9 20.4 34.5 32.7 8.4 1.1 0.0 0.0 0.0
0900 0.0 0.0 0.0 0.0 0.0 2.5 17.3 30.9 36.7 11.5 1.1 0.0 0.0 0.0
0930 0.0 0.0 0.0 0.0 0.0 1.4 16.1 28.7 34.1 18.6 1.1 0.0 0.0 0.0
1000 0.0 0.0 0.0 0.0 0.0 1.1 14.7 25.5 33.5 21.9 2.5 0.7 0.0 0.0
1030 0.0 0.0 0.0 0.0 0.0 1.1 11.9 25.5 27.7 28.8 4.3 0.7 0.0 0.0
1100 0.0 0.0 0.0 0.0 0.0 1.5 10.2 24.7 25.8 31.3 5.5 1.1 0.0 0.0
1130 0.0 0.0 0.0 0.0 0.0 1.1 10.4 23.0 24.5 31.7 8.3 1.1 0.0 0.0
1200 0.0 0.0 0.0 0.0 0.0 1.1 9.4 22.8 23.9 30.1 11.6 1.1 0.0 0.0
1230 0.0 0.0 0.0 0.0 0.0 0.7 9.4 20.7 25.0 30.4 12.7 1.1 0.0 0.0
1300 0.0 0.0 0.0 0.0 0.0 0.7 9.4 20.9 23.0 30.6 14.4 1.1 0.0 0.0
1330 0.0 0.0 0.0 0.0 0.0 0.7 9.4 21.6 23.0 28.8 15.5 1.1 0.0 0.0
1400 0.0 0.0 0.0 0.0 0.0 0.4 10.1 22.5 22.5 28.6 14.9 1.1 0.0 0.0
1430 0.0 0.0 0.0 0.0 0.0 0.7 9.8 25.4 21.7 29.0 12.3 1.1 0.0 0.0
1500 0.0 0.0 0.0 0.0 0.0 0.7 10.8 26.7 25.6 26.4 8.7 1.1 0.0 0.0
1530 0.0 0.0 0.0 0.0 0.0 0.7 13.4 28.9 26.0 25.3 5.4 0.4 0.0 0.0
1600 0.0 0.0 0.0 0.0 0.0 1.1 15.9 28.5 32.1 19.1 3.2 0.0 0.0 0.0
1630 0.0 0.0 0.0 0.0 0.0 2.2 16.3 33.7 31.2 15.6 1.1 0.0 0.0 0.0
1700 0.0 0.0 0.0 0.0 0.0 2.9 17.9 33.9 33.6 10.9 0.7 0.0 0.0 0.0
1730 0.0 0.0 0.0 0.0 0.0 3.3 21.2 32.8 34.3 7.7 0.7 0.0 0.0 0.0
1800 0.0 0.0 0.0 0.0 0.0 3.6 21.2 35.3 34.5 5.0 0.4 0.0 0.0 0.0
1830 0.0 0.0 0.0 0.0 0.0 4.7 23.0 36.3 32.7 2.9 0.4 0.0 0.0 0.0
1900 0.0 0.0 0.0 0.0 0.4 5.4 23.1 40.4 27.8 2.5 0.4 0.0 0.0 0.0
1930 0.0 0.0 0.0 0.0 0.4 7.2 23.1 42.6 25.3 1.1 0.4 0.0 0.0 0.0
2000 0.0 0.0 0.0 0.0 0.4 7.9 22.0 46.6 21.3 1.4 0.4 0.0 0.0 0.0
2030 0.0 0.0 0.0 0.0 0.4 9.8 21.4 47.1 19.9 1.1 0.4 0.0 0.0 0.0
2100 0.0 0.0 0.0 0.0 1.1 9.0 24.9 45.5 18.4 0.7 0.4 0.0 0.0 0.0
2130 0.0 0.0 0.0 0.0 0.7 9.5 25.3 49.5 14.3 0.4 0.4 0.0 0.0 0.0
2200 0.0 0.0 0.0 0.0 0.4 12.0 25.4 50.0 11.6 0.4 0.4 0.0 0.0 0.0
2230 0.0 0.0 0.0 0.0 0.7 11.7 27.5 48.0 11.7 0.0 0.4 0.0 0.0 0.0
2300 0.0 0.0 0.0 0.0 2.2 10.2 29.8 45.8 11.6 0.0 0.4 0.0 0.0 0.0
2330 0.0 0.0 0.0 0.0 2.2 10.7 31.7 44.3 10.7 0.4 0.0 0.0 0.0 0.0
MEAN 0.0 0.0 0.0 0.0 1.3 6.6 24.5 35.8 19.2 9.7 2.7 0.2 0.0 0.0
REMARKS
TEMPERATURETIME
(UTC)
MODEL E
FREQUENCIES (%) OF SURFACE TEMPERATURE (SCREEN) IN SPECIFIED RANGES OF 5°C AT THE SPECIFIED TIMES
PERIOD OF RECORD: 2005 - 2013
ELEVATION ABOVE MSL: 650 ftLONGITUDE: 21° 51' 13'' E
The range 5 - 10 comprises the values 5.0 to 9.9 inclusive; Cases when a certain phenomenon is not occurred and
frequency is 0 are shaded white
AERODOROME CLIMATOLOGY LYNI L
RHMSS – www.hidmet.gov.rs 17
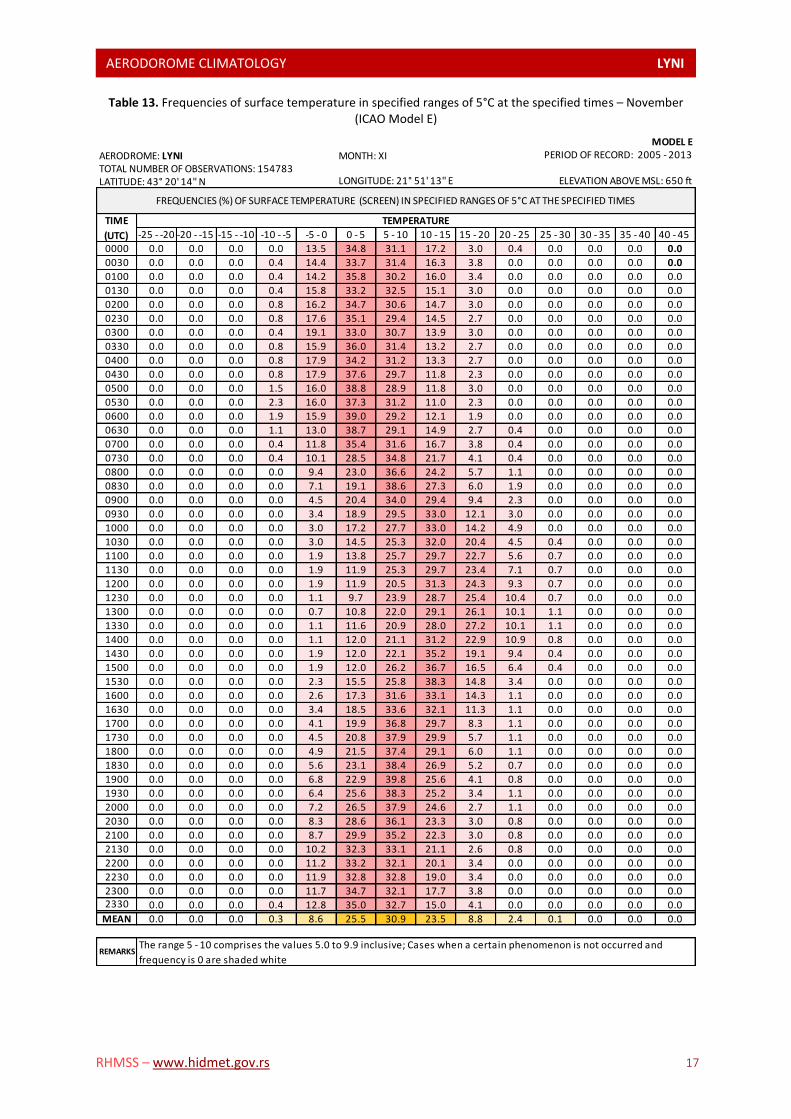
Table 13. Frequencies of surface temperature in specified ranges of 5°C at the specified times – November (ICAO Model E)
AERODROME: LYNI MONTH: XITOTAL NUMBER OF OBSERVATIONS: 154783LATITUDE: 43° 20' 14'' N
-25 - -20 -20 - -15 -15 - -10 -10 - -5 -5 - 0 0 - 5 5 - 10 10 - 15 15 - 20 20 - 25 25 - 30 30 - 35 35 - 40 40 - 45
0000 0.0 0.0 0.0 0.0 13.5 34.8 31.1 17.2 3.0 0.4 0.0 0.0 0.0 0.0
0030 0.0 0.0 0.0 0.4 14.4 33.7 31.4 16.3 3.8 0.0 0.0 0.0 0.0 0.0
0100 0.0 0.0 0.0 0.4 14.2 35.8 30.2 16.0 3.4 0.0 0.0 0.0 0.0 0.0
0130 0.0 0.0 0.0 0.4 15.8 33.2 32.5 15.1 3.0 0.0 0.0 0.0 0.0 0.0
0200 0.0 0.0 0.0 0.8 16.2 34.7 30.6 14.7 3.0 0.0 0.0 0.0 0.0 0.0
0230 0.0 0.0 0.0 0.8 17.6 35.1 29.4 14.5 2.7 0.0 0.0 0.0 0.0 0.0
0300 0.0 0.0 0.0 0.4 19.1 33.0 30.7 13.9 3.0 0.0 0.0 0.0 0.0 0.0
0330 0.0 0.0 0.0 0.8 15.9 36.0 31.4 13.2 2.7 0.0 0.0 0.0 0.0 0.0
0400 0.0 0.0 0.0 0.8 17.9 34.2 31.2 13.3 2.7 0.0 0.0 0.0 0.0 0.0
0430 0.0 0.0 0.0 0.8 17.9 37.6 29.7 11.8 2.3 0.0 0.0 0.0 0.0 0.0
0500 0.0 0.0 0.0 1.5 16.0 38.8 28.9 11.8 3.0 0.0 0.0 0.0 0.0 0.0
0530 0.0 0.0 0.0 2.3 16.0 37.3 31.2 11.0 2.3 0.0 0.0 0.0 0.0 0.0
0600 0.0 0.0 0.0 1.9 15.9 39.0 29.2 12.1 1.9 0.0 0.0 0.0 0.0 0.0
0630 0.0 0.0 0.0 1.1 13.0 38.7 29.1 14.9 2.7 0.4 0.0 0.0 0.0 0.0
0700 0.0 0.0 0.0 0.4 11.8 35.4 31.6 16.7 3.8 0.4 0.0 0.0 0.0 0.0
0730 0.0 0.0 0.0 0.4 10.1 28.5 34.8 21.7 4.1 0.4 0.0 0.0 0.0 0.0
0800 0.0 0.0 0.0 0.0 9.4 23.0 36.6 24.2 5.7 1.1 0.0 0.0 0.0 0.0
0830 0.0 0.0 0.0 0.0 7.1 19.1 38.6 27.3 6.0 1.9 0.0 0.0 0.0 0.0
0900 0.0 0.0 0.0 0.0 4.5 20.4 34.0 29.4 9.4 2.3 0.0 0.0 0.0 0.0
0930 0.0 0.0 0.0 0.0 3.4 18.9 29.5 33.0 12.1 3.0 0.0 0.0 0.0 0.0
1000 0.0 0.0 0.0 0.0 3.0 17.2 27.7 33.0 14.2 4.9 0.0 0.0 0.0 0.0
1030 0.0 0.0 0.0 0.0 3.0 14.5 25.3 32.0 20.4 4.5 0.4 0.0 0.0 0.0
1100 0.0 0.0 0.0 0.0 1.9 13.8 25.7 29.7 22.7 5.6 0.7 0.0 0.0 0.0
1130 0.0 0.0 0.0 0.0 1.9 11.9 25.3 29.7 23.4 7.1 0.7 0.0 0.0 0.0
1200 0.0 0.0 0.0 0.0 1.9 11.9 20.5 31.3 24.3 9.3 0.7 0.0 0.0 0.0
1230 0.0 0.0 0.0 0.0 1.1 9.7 23.9 28.7 25.4 10.4 0.7 0.0 0.0 0.0
1300 0.0 0.0 0.0 0.0 0.7 10.8 22.0 29.1 26.1 10.1 1.1 0.0 0.0 0.0
1330 0.0 0.0 0.0 0.0 1.1 11.6 20.9 28.0 27.2 10.1 1.1 0.0 0.0 0.0
1400 0.0 0.0 0.0 0.0 1.1 12.0 21.1 31.2 22.9 10.9 0.8 0.0 0.0 0.0
1430 0.0 0.0 0.0 0.0 1.9 12.0 22.1 35.2 19.1 9.4 0.4 0.0 0.0 0.0
1500 0.0 0.0 0.0 0.0 1.9 12.0 26.2 36.7 16.5 6.4 0.4 0.0 0.0 0.0
1530 0.0 0.0 0.0 0.0 2.3 15.5 25.8 38.3 14.8 3.4 0.0 0.0 0.0 0.0
1600 0.0 0.0 0.0 0.0 2.6 17.3 31.6 33.1 14.3 1.1 0.0 0.0 0.0 0.0
1630 0.0 0.0 0.0 0.0 3.4 18.5 33.6 32.1 11.3 1.1 0.0 0.0 0.0 0.0
1700 0.0 0.0 0.0 0.0 4.1 19.9 36.8 29.7 8.3 1.1 0.0 0.0 0.0 0.0
1730 0.0 0.0 0.0 0.0 4.5 20.8 37.9 29.9 5.7 1.1 0.0 0.0 0.0 0.0
1800 0.0 0.0 0.0 0.0 4.9 21.5 37.4 29.1 6.0 1.1 0.0 0.0 0.0 0.0
1830 0.0 0.0 0.0 0.0 5.6 23.1 38.4 26.9 5.2 0.7 0.0 0.0 0.0 0.0
1900 0.0 0.0 0.0 0.0 6.8 22.9 39.8 25.6 4.1 0.8 0.0 0.0 0.0 0.0
1930 0.0 0.0 0.0 0.0 6.4 25.6 38.3 25.2 3.4 1.1 0.0 0.0 0.0 0.0
2000 0.0 0.0 0.0 0.0 7.2 26.5 37.9 24.6 2.7 1.1 0.0 0.0 0.0 0.0
2030 0.0 0.0 0.0 0.0 8.3 28.6 36.1 23.3 3.0 0.8 0.0 0.0 0.0 0.0
2100 0.0 0.0 0.0 0.0 8.7 29.9 35.2 22.3 3.0 0.8 0.0 0.0 0.0 0.0
2130 0.0 0.0 0.0 0.0 10.2 32.3 33.1 21.1 2.6 0.8 0.0 0.0 0.0 0.0
2200 0.0 0.0 0.0 0.0 11.2 33.2 32.1 20.1 3.4 0.0 0.0 0.0 0.0 0.0
2230 0.0 0.0 0.0 0.0 11.9 32.8 32.8 19.0 3.4 0.0 0.0 0.0 0.0 0.0
2300 0.0 0.0 0.0 0.0 11.7 34.7 32.1 17.7 3.8 0.0 0.0 0.0 0.0 0.02330 0.0 0.0 0.0 0.4 12.8 35.0 32.7 15.0 4.1 0.0 0.0 0.0 0.0 0.0
MEAN 0.0 0.0 0.0 0.3 8.6 25.5 30.9 23.5 8.8 2.4 0.1 0.0 0.0 0.0
REMARKS
TEMPERATURETIME
(UTC)
MODEL E
FREQUENCIES (%) OF SURFACE TEMPERATURE (SCREEN) IN SPECIFIED RANGES OF 5°C AT THE SPECIFIED TIMES
PERIOD OF RECORD: 2005 - 2013
ELEVATION ABOVE MSL: 650 ftLONGITUDE: 21° 51' 13'' E
The range 5 - 10 comprises the values 5.0 to 9.9 inclusive; Cases when a certain phenomenon is not occurred and
frequency is 0 are shaded white
AERODOROME CLIMATOLOGY LYNI L
RHMSS – www.hidmet.gov.rs 18
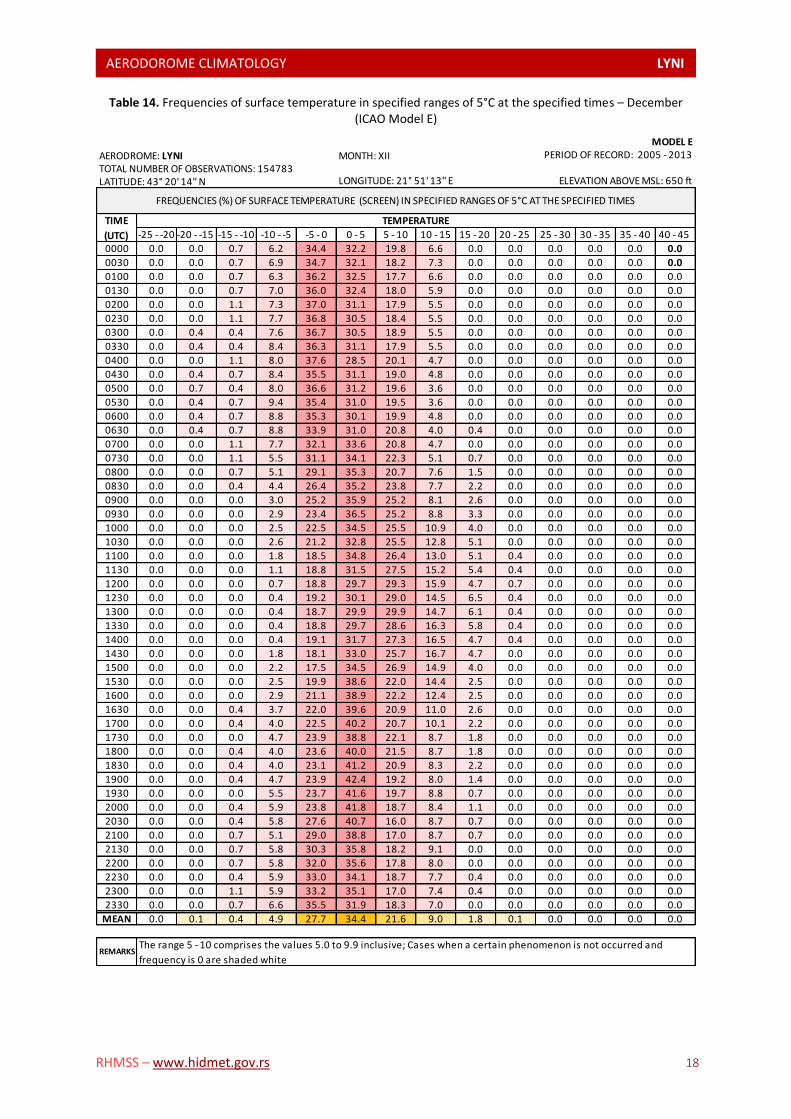
Table 14. Frequencies of surface temperature in specified ranges of 5°C at the specified times – December (ICAO Model E)
AERODROME: LYNI MONTH: XIITOTAL NUMBER OF OBSERVATIONS: 154783LATITUDE: 43° 20' 14'' N
-25 - -20 -20 - -15 -15 - -10 -10 - -5 -5 - 0 0 - 5 5 - 10 10 - 15 15 - 20 20 - 25 25 - 30 30 - 35 35 - 40 40 - 45
0000 0.0 0.0 0.7 6.2 34.4 32.2 19.8 6.6 0.0 0.0 0.0 0.0 0.0 0.0
0030 0.0 0.0 0.7 6.9 34.7 32.1 18.2 7.3 0.0 0.0 0.0 0.0 0.0 0.0
0100 0.0 0.0 0.7 6.3 36.2 32.5 17.7 6.6 0.0 0.0 0.0 0.0 0.0 0.0
0130 0.0 0.0 0.7 7.0 36.0 32.4 18.0 5.9 0.0 0.0 0.0 0.0 0.0 0.0
0200 0.0 0.0 1.1 7.3 37.0 31.1 17.9 5.5 0.0 0.0 0.0 0.0 0.0 0.0
0230 0.0 0.0 1.1 7.7 36.8 30.5 18.4 5.5 0.0 0.0 0.0 0.0 0.0 0.0
0300 0.0 0.4 0.4 7.6 36.7 30.5 18.9 5.5 0.0 0.0 0.0 0.0 0.0 0.0
0330 0.0 0.4 0.4 8.4 36.3 31.1 17.9 5.5 0.0 0.0 0.0 0.0 0.0 0.0
0400 0.0 0.0 1.1 8.0 37.6 28.5 20.1 4.7 0.0 0.0 0.0 0.0 0.0 0.0
0430 0.0 0.4 0.7 8.4 35.5 31.1 19.0 4.8 0.0 0.0 0.0 0.0 0.0 0.0
0500 0.0 0.7 0.4 8.0 36.6 31.2 19.6 3.6 0.0 0.0 0.0 0.0 0.0 0.0
0530 0.0 0.4 0.7 9.4 35.4 31.0 19.5 3.6 0.0 0.0 0.0 0.0 0.0 0.0
0600 0.0 0.4 0.7 8.8 35.3 30.1 19.9 4.8 0.0 0.0 0.0 0.0 0.0 0.0
0630 0.0 0.4 0.7 8.8 33.9 31.0 20.8 4.0 0.4 0.0 0.0 0.0 0.0 0.0
0700 0.0 0.0 1.1 7.7 32.1 33.6 20.8 4.7 0.0 0.0 0.0 0.0 0.0 0.0
0730 0.0 0.0 1.1 5.5 31.1 34.1 22.3 5.1 0.7 0.0 0.0 0.0 0.0 0.0
0800 0.0 0.0 0.7 5.1 29.1 35.3 20.7 7.6 1.5 0.0 0.0 0.0 0.0 0.0
0830 0.0 0.0 0.4 4.4 26.4 35.2 23.8 7.7 2.2 0.0 0.0 0.0 0.0 0.0
0900 0.0 0.0 0.0 3.0 25.2 35.9 25.2 8.1 2.6 0.0 0.0 0.0 0.0 0.0
0930 0.0 0.0 0.0 2.9 23.4 36.5 25.2 8.8 3.3 0.0 0.0 0.0 0.0 0.0
1000 0.0 0.0 0.0 2.5 22.5 34.5 25.5 10.9 4.0 0.0 0.0 0.0 0.0 0.0
1030 0.0 0.0 0.0 2.6 21.2 32.8 25.5 12.8 5.1 0.0 0.0 0.0 0.0 0.0
1100 0.0 0.0 0.0 1.8 18.5 34.8 26.4 13.0 5.1 0.4 0.0 0.0 0.0 0.0
1130 0.0 0.0 0.0 1.1 18.8 31.5 27.5 15.2 5.4 0.4 0.0 0.0 0.0 0.0
1200 0.0 0.0 0.0 0.7 18.8 29.7 29.3 15.9 4.7 0.7 0.0 0.0 0.0 0.0
1230 0.0 0.0 0.0 0.4 19.2 30.1 29.0 14.5 6.5 0.4 0.0 0.0 0.0 0.0
1300 0.0 0.0 0.0 0.4 18.7 29.9 29.9 14.7 6.1 0.4 0.0 0.0 0.0 0.0
1330 0.0 0.0 0.0 0.4 18.8 29.7 28.6 16.3 5.8 0.4 0.0 0.0 0.0 0.0
1400 0.0 0.0 0.0 0.4 19.1 31.7 27.3 16.5 4.7 0.4 0.0 0.0 0.0 0.0
1430 0.0 0.0 0.0 1.8 18.1 33.0 25.7 16.7 4.7 0.0 0.0 0.0 0.0 0.0
1500 0.0 0.0 0.0 2.2 17.5 34.5 26.9 14.9 4.0 0.0 0.0 0.0 0.0 0.0
1530 0.0 0.0 0.0 2.5 19.9 38.6 22.0 14.4 2.5 0.0 0.0 0.0 0.0 0.0
1600 0.0 0.0 0.0 2.9 21.1 38.9 22.2 12.4 2.5 0.0 0.0 0.0 0.0 0.0
1630 0.0 0.0 0.4 3.7 22.0 39.6 20.9 11.0 2.6 0.0 0.0 0.0 0.0 0.0
1700 0.0 0.0 0.4 4.0 22.5 40.2 20.7 10.1 2.2 0.0 0.0 0.0 0.0 0.0
1730 0.0 0.0 0.0 4.7 23.9 38.8 22.1 8.7 1.8 0.0 0.0 0.0 0.0 0.0
1800 0.0 0.0 0.4 4.0 23.6 40.0 21.5 8.7 1.8 0.0 0.0 0.0 0.0 0.0
1830 0.0 0.0 0.4 4.0 23.1 41.2 20.9 8.3 2.2 0.0 0.0 0.0 0.0 0.0
1900 0.0 0.0 0.4 4.7 23.9 42.4 19.2 8.0 1.4 0.0 0.0 0.0 0.0 0.0
1930 0.0 0.0 0.0 5.5 23.7 41.6 19.7 8.8 0.7 0.0 0.0 0.0 0.0 0.0
2000 0.0 0.0 0.4 5.9 23.8 41.8 18.7 8.4 1.1 0.0 0.0 0.0 0.0 0.0
2030 0.0 0.0 0.4 5.8 27.6 40.7 16.0 8.7 0.7 0.0 0.0 0.0 0.0 0.0
2100 0.0 0.0 0.7 5.1 29.0 38.8 17.0 8.7 0.7 0.0 0.0 0.0 0.0 0.0
2130 0.0 0.0 0.7 5.8 30.3 35.8 18.2 9.1 0.0 0.0 0.0 0.0 0.0 0.0
2200 0.0 0.0 0.7 5.8 32.0 35.6 17.8 8.0 0.0 0.0 0.0 0.0 0.0 0.0
2230 0.0 0.0 0.4 5.9 33.0 34.1 18.7 7.7 0.4 0.0 0.0 0.0 0.0 0.0
2300 0.0 0.0 1.1 5.9 33.2 35.1 17.0 7.4 0.4 0.0 0.0 0.0 0.0 0.0
2330 0.0 0.0 0.7 6.6 35.5 31.9 18.3 7.0 0.0 0.0 0.0 0.0 0.0 0.0
MEAN 0.0 0.1 0.4 4.9 27.7 34.4 21.6 9.0 1.8 0.1 0.0 0.0 0.0 0.0
REMARKS
TEMPERATURETIME
(UTC)
MODEL E
FREQUENCIES (%) OF SURFACE TEMPERATURE (SCREEN) IN SPECIFIED RANGES OF 5°C AT THE SPECIFIED TIMES
PERIOD OF RECORD: 2005 - 2013
ELEVATION ABOVE MSL: 650 ftLONGITUDE: 21° 51' 13'' E
The range 5 - 10 comprises the values 5.0 to 9.9 inclusive; Cases when a certain phenomenon is not occurred and
frequency is 0 are shaded white
AERODOROME CLIMATOLOGY LYNI L
RHMSS – www.hidmet.gov.rs 19
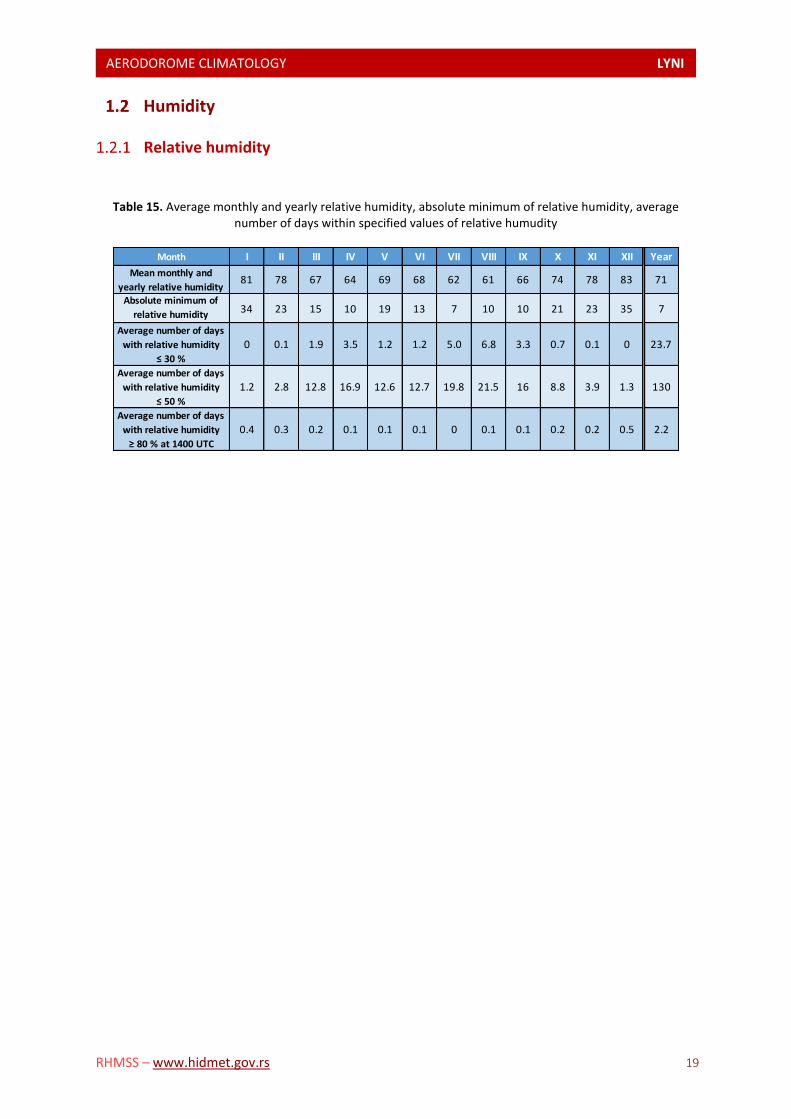
Humidity
Relative humidity
Table 15. Average monthly and yearly relative humidity, absolute minimum of relative humidity, average number of days within specified values of relative humudity
Month I II III IV V VI VII VIII IX X XI XII Year
Mean monthly and
yearly relative humidity81 78 67 64 69 68 62 61 66 74 78 83 71
Absolute minimum of
relative humidity34 23 15 10 19 13 7 10 10 21 23 35 7
Average number of days
with relative humidity
≤ 30 %
0 0.1 1.9 3.5 1.2 1.2 5.0 6.8 3.3 0.7 0.1 0 23.7
Average number of days
with relative humidity
≤ 50 %
1.2 2.8 12.8 16.9 12.6 12.7 19.8 21.5 16 8.8 3.9 1.3 130
Average number of days
with relative humidity
≥ 80 % at 1400 UTC
0.4 0.3 0.2 0.1 0.1 0.1 0 0.1 0.1 0.2 0.2 0.5 2.2
AERODOROME CLIMATOLOGY LYNI L
RHMSS – www.hidmet.gov.rs 20
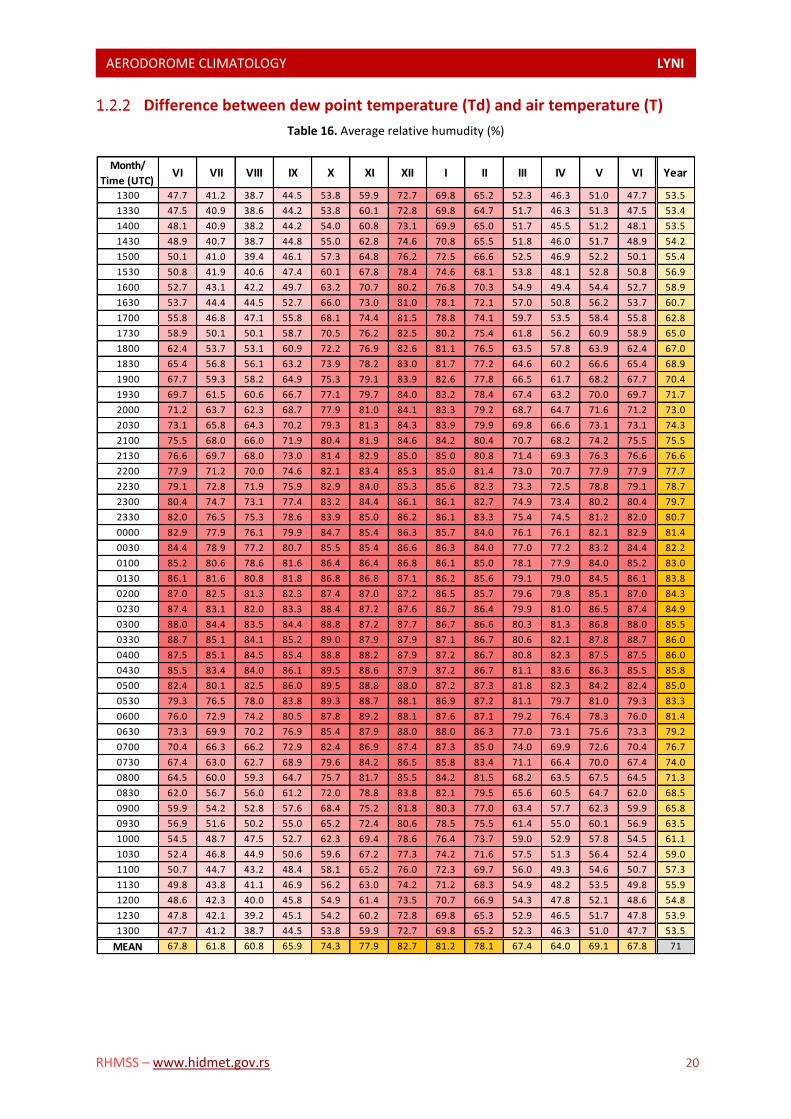
Difference between dew point temperature (Td) and air temperature (T)
Table 16. Average relative humudity (%)
Month/
Time (UTC)VI VII VIII IX X XI XII I II III IV V VI Year
1300 47.7 41.2 38.7 44.5 53.8 59.9 72.7 69.8 65.2 52.3 46.3 51.0 47.7 53.5
1330 47.5 40.9 38.6 44.2 53.8 60.1 72.8 69.8 64.7 51.7 46.3 51.3 47.5 53.4
1400 48.1 40.9 38.2 44.2 54.0 60.8 73.1 69.9 65.0 51.7 45.5 51.2 48.1 53.5
1430 48.9 40.7 38.7 44.8 55.0 62.8 74.6 70.8 65.5 51.8 46.0 51.7 48.9 54.2
1500 50.1 41.0 39.4 46.1 57.3 64.8 76.2 72.5 66.6 52.5 46.9 52.2 50.1 55.4
1530 50.8 41.9 40.6 47.4 60.1 67.8 78.4 74.6 68.1 53.8 48.1 52.8 50.8 56.9
1600 52.7 43.1 42.2 49.7 63.2 70.7 80.2 76.8 70.3 54.9 49.4 54.4 52.7 58.9
1630 53.7 44.4 44.5 52.7 66.0 73.0 81.0 78.1 72.1 57.0 50.8 56.2 53.7 60.7
1700 55.8 46.8 47.1 55.8 68.1 74.4 81.5 78.8 74.1 59.7 53.5 58.4 55.8 62.8
1730 58.9 50.1 50.1 58.7 70.5 76.2 82.5 80.2 75.4 61.8 56.2 60.9 58.9 65.0
1800 62.4 53.7 53.1 60.9 72.2 76.9 82.6 81.1 76.5 63.5 57.8 63.9 62.4 67.0
1830 65.4 56.8 56.1 63.2 73.9 78.2 83.0 81.7 77.2 64.6 60.2 66.6 65.4 68.9
1900 67.7 59.3 58.2 64.9 75.3 79.1 83.9 82.6 77.8 66.5 61.7 68.2 67.7 70.4
1930 69.7 61.5 60.6 66.7 77.1 79.7 84.0 83.2 78.4 67.4 63.2 70.0 69.7 71.7
2000 71.2 63.7 62.3 68.7 77.9 81.0 84.1 83.3 79.2 68.7 64.7 71.6 71.2 73.0
2030 73.1 65.8 64.3 70.2 79.3 81.3 84.3 83.9 79.9 69.8 66.6 73.1 73.1 74.3
2100 75.5 68.0 66.0 71.9 80.4 81.9 84.6 84.2 80.4 70.7 68.2 74.2 75.5 75.5
2130 76.6 69.7 68.0 73.0 81.4 82.9 85.0 85.0 80.8 71.4 69.3 76.3 76.6 76.6
2200 77.9 71.2 70.0 74.6 82.1 83.4 85.3 85.0 81.4 73.0 70.7 77.9 77.9 77.7
2230 79.1 72.8 71.9 75.9 82.9 84.0 85.3 85.6 82.3 73.3 72.5 78.8 79.1 78.7
2300 80.4 74.7 73.1 77.4 83.2 84.4 86.1 86.1 82.7 74.9 73.4 80.2 80.4 79.7
2330 82.0 76.5 75.3 78.6 83.9 85.0 86.2 86.1 83.3 75.4 74.5 81.2 82.0 80.7
0000 82.9 77.9 76.1 79.9 84.7 85.4 86.3 85.7 84.0 76.1 76.1 82.1 82.9 81.4
0030 84.4 78.9 77.2 80.7 85.5 85.4 86.6 86.3 84.0 77.0 77.2 83.2 84.4 82.2
0100 85.2 80.6 78.6 81.6 86.4 86.4 86.8 86.1 85.0 78.1 77.9 84.0 85.2 83.0
0130 86.1 81.6 80.8 81.8 86.8 86.8 87.1 86.2 85.6 79.1 79.0 84.5 86.1 83.8
0200 87.0 82.5 81.3 82.3 87.4 87.0 87.2 86.5 85.7 79.6 79.8 85.1 87.0 84.3
0230 87.4 83.1 82.0 83.3 88.4 87.2 87.6 86.7 86.4 79.9 81.0 86.5 87.4 84.9
0300 88.0 84.4 83.5 84.4 88.8 87.2 87.7 86.7 86.6 80.3 81.3 86.8 88.0 85.5
0330 88.7 85.1 84.1 85.2 89.0 87.9 87.9 87.1 86.7 80.6 82.1 87.8 88.7 86.0
0400 87.5 85.1 84.5 85.4 88.8 88.2 87.9 87.2 86.7 80.8 82.3 87.5 87.5 86.0
0430 85.5 83.4 84.0 86.1 89.5 88.6 87.9 87.2 86.7 81.1 83.6 86.3 85.5 85.8
0500 82.4 80.1 82.5 86.0 89.5 88.8 88.0 87.2 87.3 81.8 82.3 84.2 82.4 85.0
0530 79.3 76.5 78.0 83.8 89.3 88.7 88.1 86.9 87.2 81.1 79.7 81.0 79.3 83.3
0600 76.0 72.9 74.2 80.5 87.8 89.2 88.1 87.6 87.1 79.2 76.4 78.3 76.0 81.4
0630 73.3 69.9 70.2 76.9 85.4 87.9 88.0 88.0 86.3 77.0 73.1 75.6 73.3 79.2
0700 70.4 66.3 66.2 72.9 82.4 86.9 87.4 87.3 85.0 74.0 69.9 72.6 70.4 76.7
0730 67.4 63.0 62.7 68.9 79.6 84.2 86.5 85.8 83.4 71.1 66.4 70.0 67.4 74.0
0800 64.5 60.0 59.3 64.7 75.7 81.7 85.5 84.2 81.5 68.2 63.5 67.5 64.5 71.3
0830 62.0 56.7 56.0 61.2 72.0 78.8 83.8 82.1 79.5 65.6 60.5 64.7 62.0 68.5
0900 59.9 54.2 52.8 57.6 68.4 75.2 81.8 80.3 77.0 63.4 57.7 62.3 59.9 65.8
0930 56.9 51.6 50.2 55.0 65.2 72.4 80.6 78.5 75.5 61.4 55.0 60.1 56.9 63.5
1000 54.5 48.7 47.5 52.7 62.3 69.4 78.6 76.4 73.7 59.0 52.9 57.8 54.5 61.1
1030 52.4 46.8 44.9 50.6 59.6 67.2 77.3 74.2 71.6 57.5 51.3 56.4 52.4 59.0
1100 50.7 44.7 43.2 48.4 58.1 65.2 76.0 72.3 69.7 56.0 49.3 54.6 50.7 57.3
1130 49.8 43.8 41.1 46.9 56.2 63.0 74.2 71.2 68.3 54.9 48.2 53.5 49.8 55.9
1200 48.6 42.3 40.0 45.8 54.9 61.4 73.5 70.7 66.9 54.3 47.8 52.1 48.6 54.8
1230 47.8 42.1 39.2 45.1 54.2 60.2 72.8 69.8 65.3 52.9 46.5 51.7 47.8 53.9
1300 47.7 41.2 38.7 44.5 53.8 59.9 72.7 69.8 65.2 52.3 46.3 51.0 47.7 53.5
MEAN 67.8 61.8 60.8 65.9 74.3 77.9 82.7 81.2 78.1 67.4 64.0 69.1 67.8 71
AERODOROME CLIMATOLOGY LYNI L
RHMSS – www.hidmet.gov.rs 21
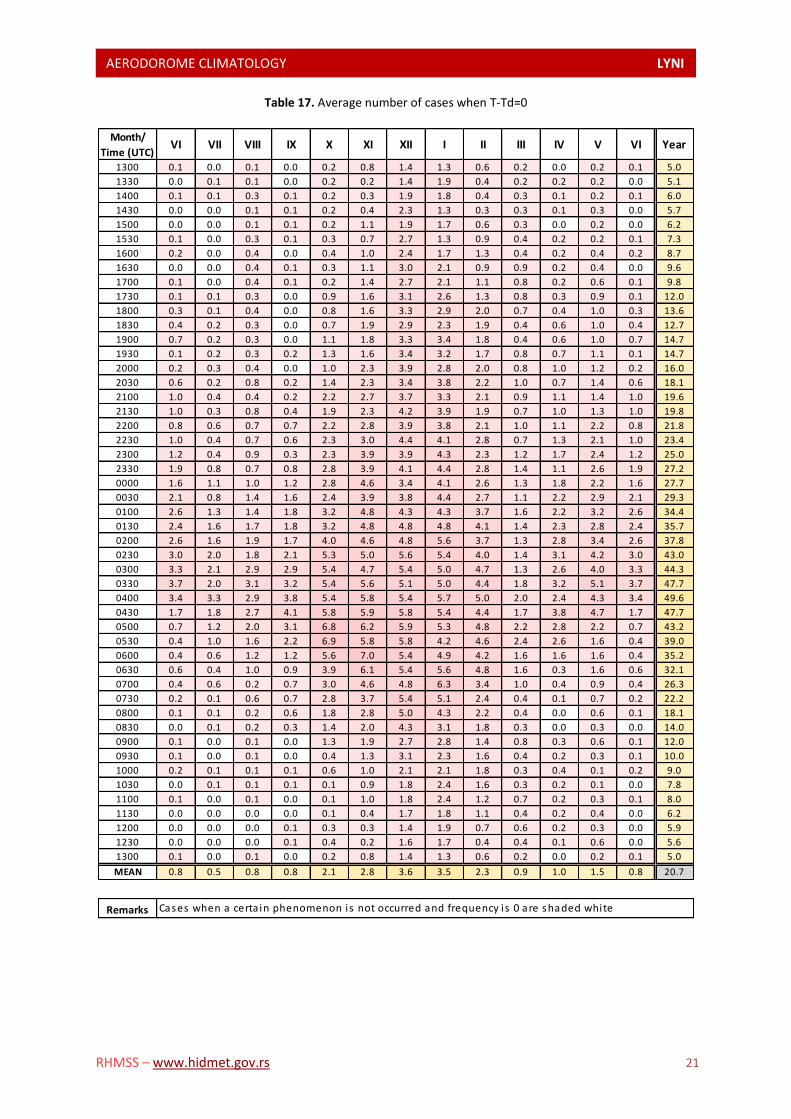
Table 17. Average number of cases when Т-Тd=0
Month/
Time (UTC)VI VII VIII IX X XI XII I II III IV V VI Year
1300 0.1 0.0 0.1 0.0 0.2 0.8 1.4 1.3 0.6 0.2 0.0 0.2 0.1 5.0
1330 0.0 0.1 0.1 0.0 0.2 0.2 1.4 1.9 0.4 0.2 0.2 0.2 0.0 5.1
1400 0.1 0.1 0.3 0.1 0.2 0.3 1.9 1.8 0.4 0.3 0.1 0.2 0.1 6.0
1430 0.0 0.0 0.1 0.1 0.2 0.4 2.3 1.3 0.3 0.3 0.1 0.3 0.0 5.7
1500 0.0 0.0 0.1 0.1 0.2 1.1 1.9 1.7 0.6 0.3 0.0 0.2 0.0 6.2
1530 0.1 0.0 0.3 0.1 0.3 0.7 2.7 1.3 0.9 0.4 0.2 0.2 0.1 7.3
1600 0.2 0.0 0.4 0.0 0.4 1.0 2.4 1.7 1.3 0.4 0.2 0.4 0.2 8.7
1630 0.0 0.0 0.4 0.1 0.3 1.1 3.0 2.1 0.9 0.9 0.2 0.4 0.0 9.6
1700 0.1 0.0 0.4 0.1 0.2 1.4 2.7 2.1 1.1 0.8 0.2 0.6 0.1 9.8
1730 0.1 0.1 0.3 0.0 0.9 1.6 3.1 2.6 1.3 0.8 0.3 0.9 0.1 12.0
1800 0.3 0.1 0.4 0.0 0.8 1.6 3.3 2.9 2.0 0.7 0.4 1.0 0.3 13.6
1830 0.4 0.2 0.3 0.0 0.7 1.9 2.9 2.3 1.9 0.4 0.6 1.0 0.4 12.7
1900 0.7 0.2 0.3 0.0 1.1 1.8 3.3 3.4 1.8 0.4 0.6 1.0 0.7 14.7
1930 0.1 0.2 0.3 0.2 1.3 1.6 3.4 3.2 1.7 0.8 0.7 1.1 0.1 14.7
2000 0.2 0.3 0.4 0.0 1.0 2.3 3.9 2.8 2.0 0.8 1.0 1.2 0.2 16.0
2030 0.6 0.2 0.8 0.2 1.4 2.3 3.4 3.8 2.2 1.0 0.7 1.4 0.6 18.1
2100 1.0 0.4 0.4 0.2 2.2 2.7 3.7 3.3 2.1 0.9 1.1 1.4 1.0 19.6
2130 1.0 0.3 0.8 0.4 1.9 2.3 4.2 3.9 1.9 0.7 1.0 1.3 1.0 19.8
2200 0.8 0.6 0.7 0.7 2.2 2.8 3.9 3.8 2.1 1.0 1.1 2.2 0.8 21.8
2230 1.0 0.4 0.7 0.6 2.3 3.0 4.4 4.1 2.8 0.7 1.3 2.1 1.0 23.4
2300 1.2 0.4 0.9 0.3 2.3 3.9 3.9 4.3 2.3 1.2 1.7 2.4 1.2 25.0
2330 1.9 0.8 0.7 0.8 2.8 3.9 4.1 4.4 2.8 1.4 1.1 2.6 1.9 27.2
0000 1.6 1.1 1.0 1.2 2.8 4.6 3.4 4.1 2.6 1.3 1.8 2.2 1.6 27.7
0030 2.1 0.8 1.4 1.6 2.4 3.9 3.8 4.4 2.7 1.1 2.2 2.9 2.1 29.3
0100 2.6 1.3 1.4 1.8 3.2 4.8 4.3 4.3 3.7 1.6 2.2 3.2 2.6 34.4
0130 2.4 1.6 1.7 1.8 3.2 4.8 4.8 4.8 4.1 1.4 2.3 2.8 2.4 35.7
0200 2.6 1.6 1.9 1.7 4.0 4.6 4.8 5.6 3.7 1.3 2.8 3.4 2.6 37.8
0230 3.0 2.0 1.8 2.1 5.3 5.0 5.6 5.4 4.0 1.4 3.1 4.2 3.0 43.0
0300 3.3 2.1 2.9 2.9 5.4 4.7 5.4 5.0 4.7 1.3 2.6 4.0 3.3 44.3
0330 3.7 2.0 3.1 3.2 5.4 5.6 5.1 5.0 4.4 1.8 3.2 5.1 3.7 47.7
0400 3.4 3.3 2.9 3.8 5.4 5.8 5.4 5.7 5.0 2.0 2.4 4.3 3.4 49.6
0430 1.7 1.8 2.7 4.1 5.8 5.9 5.8 5.4 4.4 1.7 3.8 4.7 1.7 47.7
0500 0.7 1.2 2.0 3.1 6.8 6.2 5.9 5.3 4.8 2.2 2.8 2.2 0.7 43.2
0530 0.4 1.0 1.6 2.2 6.9 5.8 5.8 4.2 4.6 2.4 2.6 1.6 0.4 39.0
0600 0.4 0.6 1.2 1.2 5.6 7.0 5.4 4.9 4.2 1.6 1.6 1.6 0.4 35.2
0630 0.6 0.4 1.0 0.9 3.9 6.1 5.4 5.6 4.8 1.6 0.3 1.6 0.6 32.1
0700 0.4 0.6 0.2 0.7 3.0 4.6 4.8 6.3 3.4 1.0 0.4 0.9 0.4 26.3
0730 0.2 0.1 0.6 0.7 2.8 3.7 5.4 5.1 2.4 0.4 0.1 0.7 0.2 22.2
0800 0.1 0.1 0.2 0.6 1.8 2.8 5.0 4.3 2.2 0.4 0.0 0.6 0.1 18.1
0830 0.0 0.1 0.2 0.3 1.4 2.0 4.3 3.1 1.8 0.3 0.0 0.3 0.0 14.0
0900 0.1 0.0 0.1 0.0 1.3 1.9 2.7 2.8 1.4 0.8 0.3 0.6 0.1 12.0
0930 0.1 0.0 0.1 0.0 0.4 1.3 3.1 2.3 1.6 0.4 0.2 0.3 0.1 10.0
1000 0.2 0.1 0.1 0.1 0.6 1.0 2.1 2.1 1.8 0.3 0.4 0.1 0.2 9.0
1030 0.0 0.1 0.1 0.1 0.1 0.9 1.8 2.4 1.6 0.3 0.2 0.1 0.0 7.8
1100 0.1 0.0 0.1 0.0 0.1 1.0 1.8 2.4 1.2 0.7 0.2 0.3 0.1 8.0
1130 0.0 0.0 0.0 0.0 0.1 0.4 1.7 1.8 1.1 0.4 0.2 0.4 0.0 6.2
1200 0.0 0.0 0.0 0.1 0.3 0.3 1.4 1.9 0.7 0.6 0.2 0.3 0.0 5.9
1230 0.0 0.0 0.0 0.1 0.4 0.2 1.6 1.7 0.4 0.4 0.1 0.6 0.0 5.6
1300 0.1 0.0 0.1 0.0 0.2 0.8 1.4 1.3 0.6 0.2 0.0 0.2 0.1 5.0
MEAN 0.8 0.5 0.8 0.8 2.1 2.8 3.6 3.5 2.3 0.9 1.0 1.5 0.8 20.7
Remarks Cases when a certa in phenomenon is not occurred and frequency i s 0 are shaded white
AERODOROME CLIMATOLOGY LYNI L
RHMSS – www.hidmet.gov.rs 22
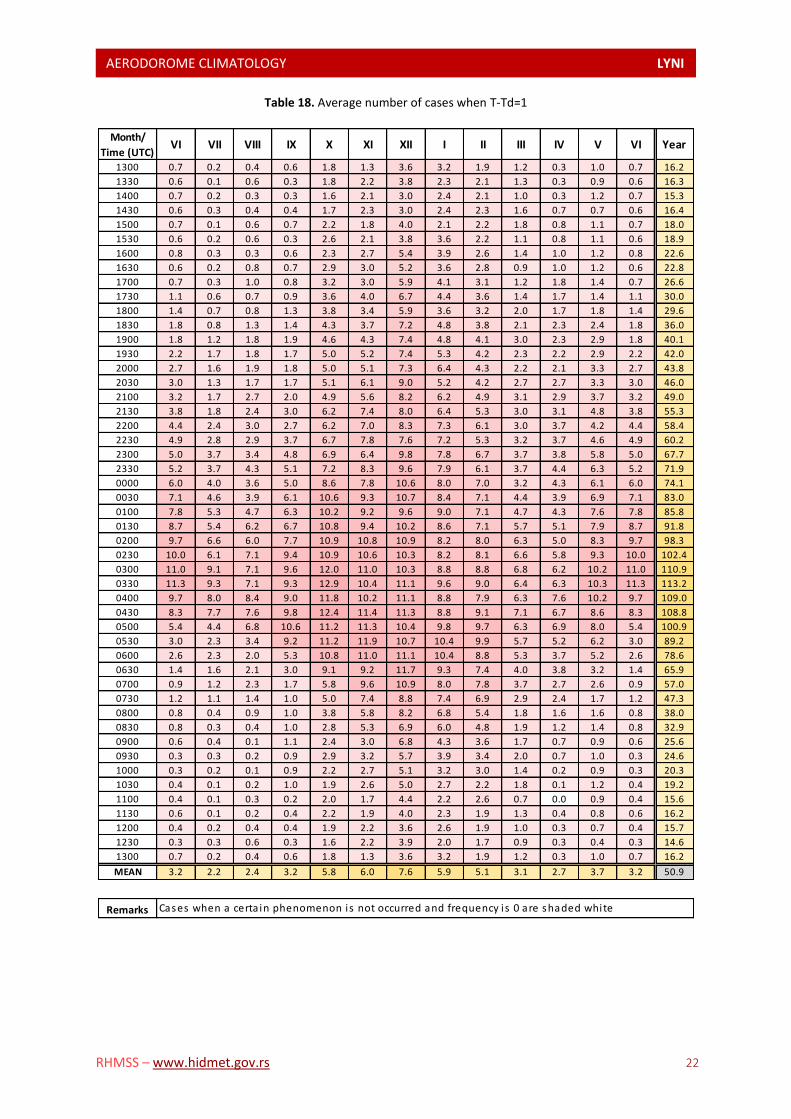
Table 18. Average number of cases when Т-Тd=1
Month/
Time (UTC)VI VII VIII IX X XI XII I II III IV V VI Year
1300 0.7 0.2 0.4 0.6 1.8 1.3 3.6 3.2 1.9 1.2 0.3 1.0 0.7 16.2
1330 0.6 0.1 0.6 0.3 1.8 2.2 3.8 2.3 2.1 1.3 0.3 0.9 0.6 16.3
1400 0.7 0.2 0.3 0.3 1.6 2.1 3.0 2.4 2.1 1.0 0.3 1.2 0.7 15.3
1430 0.6 0.3 0.4 0.4 1.7 2.3 3.0 2.4 2.3 1.6 0.7 0.7 0.6 16.4
1500 0.7 0.1 0.6 0.7 2.2 1.8 4.0 2.1 2.2 1.8 0.8 1.1 0.7 18.0
1530 0.6 0.2 0.6 0.3 2.6 2.1 3.8 3.6 2.2 1.1 0.8 1.1 0.6 18.9
1600 0.8 0.3 0.3 0.6 2.3 2.7 5.4 3.9 2.6 1.4 1.0 1.2 0.8 22.6
1630 0.6 0.2 0.8 0.7 2.9 3.0 5.2 3.6 2.8 0.9 1.0 1.2 0.6 22.8
1700 0.7 0.3 1.0 0.8 3.2 3.0 5.9 4.1 3.1 1.2 1.8 1.4 0.7 26.6
1730 1.1 0.6 0.7 0.9 3.6 4.0 6.7 4.4 3.6 1.4 1.7 1.4 1.1 30.0
1800 1.4 0.7 0.8 1.3 3.8 3.4 5.9 3.6 3.2 2.0 1.7 1.8 1.4 29.6
1830 1.8 0.8 1.3 1.4 4.3 3.7 7.2 4.8 3.8 2.1 2.3 2.4 1.8 36.0
1900 1.8 1.2 1.8 1.9 4.6 4.3 7.4 4.8 4.1 3.0 2.3 2.9 1.8 40.1
1930 2.2 1.7 1.8 1.7 5.0 5.2 7.4 5.3 4.2 2.3 2.2 2.9 2.2 42.0
2000 2.7 1.6 1.9 1.8 5.0 5.1 7.3 6.4 4.3 2.2 2.1 3.3 2.7 43.8
2030 3.0 1.3 1.7 1.7 5.1 6.1 9.0 5.2 4.2 2.7 2.7 3.3 3.0 46.0
2100 3.2 1.7 2.7 2.0 4.9 5.6 8.2 6.2 4.9 3.1 2.9 3.7 3.2 49.0
2130 3.8 1.8 2.4 3.0 6.2 7.4 8.0 6.4 5.3 3.0 3.1 4.8 3.8 55.3
2200 4.4 2.4 3.0 2.7 6.2 7.0 8.3 7.3 6.1 3.0 3.7 4.2 4.4 58.4
2230 4.9 2.8 2.9 3.7 6.7 7.8 7.6 7.2 5.3 3.2 3.7 4.6 4.9 60.2
2300 5.0 3.7 3.4 4.8 6.9 6.4 9.8 7.8 6.7 3.7 3.8 5.8 5.0 67.7
2330 5.2 3.7 4.3 5.1 7.2 8.3 9.6 7.9 6.1 3.7 4.4 6.3 5.2 71.9
0000 6.0 4.0 3.6 5.0 8.6 7.8 10.6 8.0 7.0 3.2 4.3 6.1 6.0 74.1
0030 7.1 4.6 3.9 6.1 10.6 9.3 10.7 8.4 7.1 4.4 3.9 6.9 7.1 83.0
0100 7.8 5.3 4.7 6.3 10.2 9.2 9.6 9.0 7.1 4.7 4.3 7.6 7.8 85.8
0130 8.7 5.4 6.2 6.7 10.8 9.4 10.2 8.6 7.1 5.7 5.1 7.9 8.7 91.8
0200 9.7 6.6 6.0 7.7 10.9 10.8 10.9 8.2 8.0 6.3 5.0 8.3 9.7 98.3
0230 10.0 6.1 7.1 9.4 10.9 10.6 10.3 8.2 8.1 6.6 5.8 9.3 10.0 102.4
0300 11.0 9.1 7.1 9.6 12.0 11.0 10.3 8.8 8.8 6.8 6.2 10.2 11.0 110.9
0330 11.3 9.3 7.1 9.3 12.9 10.4 11.1 9.6 9.0 6.4 6.3 10.3 11.3 113.2
0400 9.7 8.0 8.4 9.0 11.8 10.2 11.1 8.8 7.9 6.3 7.6 10.2 9.7 109.0
0430 8.3 7.7 7.6 9.8 12.4 11.4 11.3 8.8 9.1 7.1 6.7 8.6 8.3 108.8
0500 5.4 4.4 6.8 10.6 11.2 11.3 10.4 9.8 9.7 6.3 6.9 8.0 5.4 100.9
0530 3.0 2.3 3.4 9.2 11.2 11.9 10.7 10.4 9.9 5.7 5.2 6.2 3.0 89.2
0600 2.6 2.3 2.0 5.3 10.8 11.0 11.1 10.4 8.8 5.3 3.7 5.2 2.6 78.6
0630 1.4 1.6 2.1 3.0 9.1 9.2 11.7 9.3 7.4 4.0 3.8 3.2 1.4 65.9
0700 0.9 1.2 2.3 1.7 5.8 9.6 10.9 8.0 7.8 3.7 2.7 2.6 0.9 57.0
0730 1.2 1.1 1.4 1.0 5.0 7.4 8.8 7.4 6.9 2.9 2.4 1.7 1.2 47.3
0800 0.8 0.4 0.9 1.0 3.8 5.8 8.2 6.8 5.4 1.8 1.6 1.6 0.8 38.0
0830 0.8 0.3 0.4 1.0 2.8 5.3 6.9 6.0 4.8 1.9 1.2 1.4 0.8 32.9
0900 0.6 0.4 0.1 1.1 2.4 3.0 6.8 4.3 3.6 1.7 0.7 0.9 0.6 25.6
0930 0.3 0.3 0.2 0.9 2.9 3.2 5.7 3.9 3.4 2.0 0.7 1.0 0.3 24.6
1000 0.3 0.2 0.1 0.9 2.2 2.7 5.1 3.2 3.0 1.4 0.2 0.9 0.3 20.3
1030 0.4 0.1 0.2 1.0 1.9 2.6 5.0 2.7 2.2 1.8 0.1 1.2 0.4 19.2
1100 0.4 0.1 0.3 0.2 2.0 1.7 4.4 2.2 2.6 0.7 0.0 0.9 0.4 15.6
1130 0.6 0.1 0.2 0.4 2.2 1.9 4.0 2.3 1.9 1.3 0.4 0.8 0.6 16.2
1200 0.4 0.2 0.4 0.4 1.9 2.2 3.6 2.6 1.9 1.0 0.3 0.7 0.4 15.7
1230 0.3 0.3 0.6 0.3 1.6 2.2 3.9 2.0 1.7 0.9 0.3 0.4 0.3 14.6
1300 0.7 0.2 0.4 0.6 1.8 1.3 3.6 3.2 1.9 1.2 0.3 1.0 0.7 16.2
MEAN 3.2 2.2 2.4 3.2 5.8 6.0 7.6 5.9 5.1 3.1 2.7 3.7 3.2 50.9
Remarks Cases when a certa in phenomenon is not occurred and frequency i s 0 are shaded white
AERODOROME CLIMATOLOGY LYNI L
RHMSS – www.hidmet.gov.rs 23
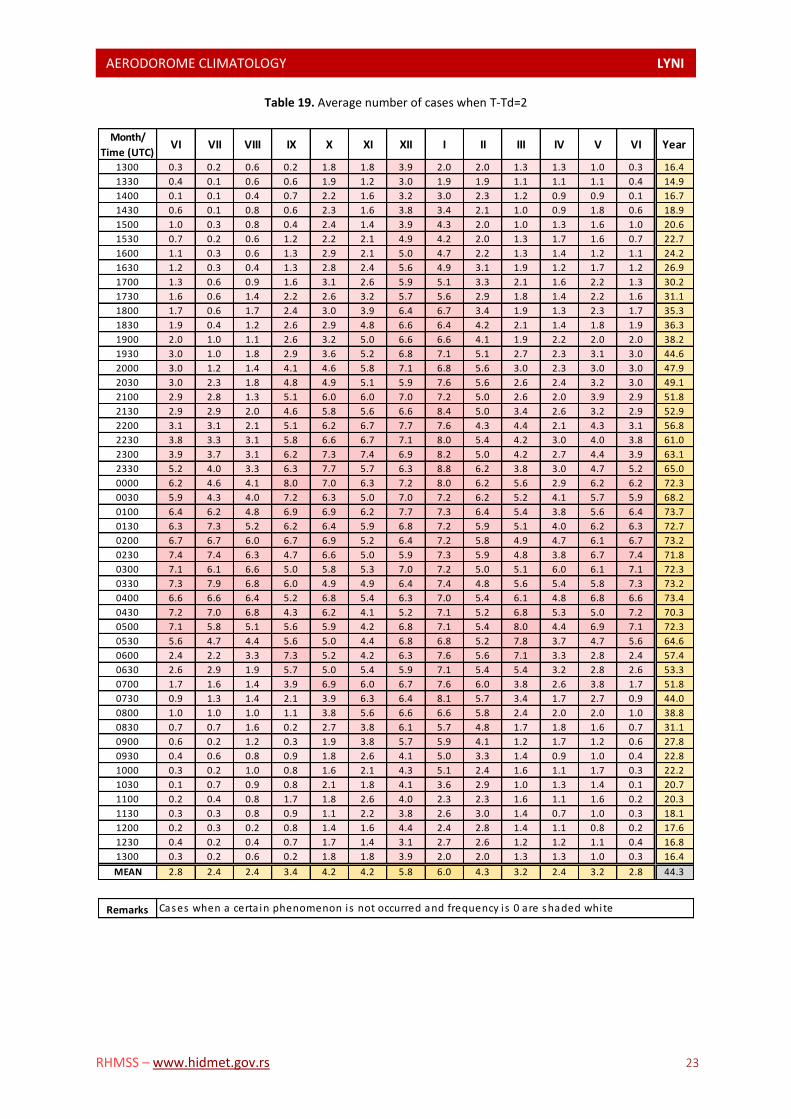
Table 19. Average number of cases when Т-Тd=2
Month/
Time (UTC)VI VII VIII IX X XI XII I II III IV V VI Year
1300 0.3 0.2 0.6 0.2 1.8 1.8 3.9 2.0 2.0 1.3 1.3 1.0 0.3 16.4
1330 0.4 0.1 0.6 0.6 1.9 1.2 3.0 1.9 1.9 1.1 1.1 1.1 0.4 14.9
1400 0.1 0.1 0.4 0.7 2.2 1.6 3.2 3.0 2.3 1.2 0.9 0.9 0.1 16.7
1430 0.6 0.1 0.8 0.6 2.3 1.6 3.8 3.4 2.1 1.0 0.9 1.8 0.6 18.9
1500 1.0 0.3 0.8 0.4 2.4 1.4 3.9 4.3 2.0 1.0 1.3 1.6 1.0 20.6
1530 0.7 0.2 0.6 1.2 2.2 2.1 4.9 4.2 2.0 1.3 1.7 1.6 0.7 22.7
1600 1.1 0.3 0.6 1.3 2.9 2.1 5.0 4.7 2.2 1.3 1.4 1.2 1.1 24.2
1630 1.2 0.3 0.4 1.3 2.8 2.4 5.6 4.9 3.1 1.9 1.2 1.7 1.2 26.9
1700 1.3 0.6 0.9 1.6 3.1 2.6 5.9 5.1 3.3 2.1 1.6 2.2 1.3 30.2
1730 1.6 0.6 1.4 2.2 2.6 3.2 5.7 5.6 2.9 1.8 1.4 2.2 1.6 31.1
1800 1.7 0.6 1.7 2.4 3.0 3.9 6.4 6.7 3.4 1.9 1.3 2.3 1.7 35.3
1830 1.9 0.4 1.2 2.6 2.9 4.8 6.6 6.4 4.2 2.1 1.4 1.8 1.9 36.3
1900 2.0 1.0 1.1 2.6 3.2 5.0 6.6 6.6 4.1 1.9 2.2 2.0 2.0 38.2
1930 3.0 1.0 1.8 2.9 3.6 5.2 6.8 7.1 5.1 2.7 2.3 3.1 3.0 44.6
2000 3.0 1.2 1.4 4.1 4.6 5.8 7.1 6.8 5.6 3.0 2.3 3.0 3.0 47.9
2030 3.0 2.3 1.8 4.8 4.9 5.1 5.9 7.6 5.6 2.6 2.4 3.2 3.0 49.1
2100 2.9 2.8 1.3 5.1 6.0 6.0 7.0 7.2 5.0 2.6 2.0 3.9 2.9 51.8
2130 2.9 2.9 2.0 4.6 5.8 5.6 6.6 8.4 5.0 3.4 2.6 3.2 2.9 52.9
2200 3.1 3.1 2.1 5.1 6.2 6.7 7.7 7.6 4.3 4.4 2.1 4.3 3.1 56.8
2230 3.8 3.3 3.1 5.8 6.6 6.7 7.1 8.0 5.4 4.2 3.0 4.0 3.8 61.0
2300 3.9 3.7 3.1 6.2 7.3 7.4 6.9 8.2 5.0 4.2 2.7 4.4 3.9 63.1
2330 5.2 4.0 3.3 6.3 7.7 5.7 6.3 8.8 6.2 3.8 3.0 4.7 5.2 65.0
0000 6.2 4.6 4.1 8.0 7.0 6.3 7.2 8.0 6.2 5.6 2.9 6.2 6.2 72.3
0030 5.9 4.3 4.0 7.2 6.3 5.0 7.0 7.2 6.2 5.2 4.1 5.7 5.9 68.2
0100 6.4 6.2 4.8 6.9 6.9 6.2 7.7 7.3 6.4 5.4 3.8 5.6 6.4 73.7
0130 6.3 7.3 5.2 6.2 6.4 5.9 6.8 7.2 5.9 5.1 4.0 6.2 6.3 72.7
0200 6.7 6.7 6.0 6.7 6.9 5.2 6.4 7.2 5.8 4.9 4.7 6.1 6.7 73.2
0230 7.4 7.4 6.3 4.7 6.6 5.0 5.9 7.3 5.9 4.8 3.8 6.7 7.4 71.8
0300 7.1 6.1 6.6 5.0 5.8 5.3 7.0 7.2 5.0 5.1 6.0 6.1 7.1 72.3
0330 7.3 7.9 6.8 6.0 4.9 4.9 6.4 7.4 4.8 5.6 5.4 5.8 7.3 73.2
0400 6.6 6.6 6.4 5.2 6.8 5.4 6.3 7.0 5.4 6.1 4.8 6.8 6.6 73.4
0430 7.2 7.0 6.8 4.3 6.2 4.1 5.2 7.1 5.2 6.8 5.3 5.0 7.2 70.3
0500 7.1 5.8 5.1 5.6 5.9 4.2 6.8 7.1 5.4 8.0 4.4 6.9 7.1 72.3
0530 5.6 4.7 4.4 5.6 5.0 4.4 6.8 6.8 5.2 7.8 3.7 4.7 5.6 64.6
0600 2.4 2.2 3.3 7.3 5.2 4.2 6.3 7.6 5.6 7.1 3.3 2.8 2.4 57.4
0630 2.6 2.9 1.9 5.7 5.0 5.4 5.9 7.1 5.4 5.4 3.2 2.8 2.6 53.3
0700 1.7 1.6 1.4 3.9 6.9 6.0 6.7 7.6 6.0 3.8 2.6 3.8 1.7 51.8
0730 0.9 1.3 1.4 2.1 3.9 6.3 6.4 8.1 5.7 3.4 1.7 2.7 0.9 44.0
0800 1.0 1.0 1.0 1.1 3.8 5.6 6.6 6.6 5.8 2.4 2.0 2.0 1.0 38.8
0830 0.7 0.7 1.6 0.2 2.7 3.8 6.1 5.7 4.8 1.7 1.8 1.6 0.7 31.1
0900 0.6 0.2 1.2 0.3 1.9 3.8 5.7 5.9 4.1 1.2 1.7 1.2 0.6 27.8
0930 0.4 0.6 0.8 0.9 1.8 2.6 4.1 5.0 3.3 1.4 0.9 1.0 0.4 22.8
1000 0.3 0.2 1.0 0.8 1.6 2.1 4.3 5.1 2.4 1.6 1.1 1.7 0.3 22.2
1030 0.1 0.7 0.9 0.8 2.1 1.8 4.1 3.6 2.9 1.0 1.3 1.4 0.1 20.7
1100 0.2 0.4 0.8 1.7 1.8 2.6 4.0 2.3 2.3 1.6 1.1 1.6 0.2 20.3
1130 0.3 0.3 0.8 0.9 1.1 2.2 3.8 2.6 3.0 1.4 0.7 1.0 0.3 18.1
1200 0.2 0.3 0.2 0.8 1.4 1.6 4.4 2.4 2.8 1.4 1.1 0.8 0.2 17.6
1230 0.4 0.2 0.4 0.7 1.7 1.4 3.1 2.7 2.6 1.2 1.2 1.1 0.4 16.8
1300 0.3 0.2 0.6 0.2 1.8 1.8 3.9 2.0 2.0 1.3 1.3 1.0 0.3 16.4
MEAN 2.8 2.4 2.4 3.4 4.2 4.2 5.8 6.0 4.3 3.2 2.4 3.2 2.8 44.3
Remarks Cases when a certa in phenomenon is not occurred and frequency i s 0 are shaded white
AERODOROME CLIMATOLOGY LYNI L
RHMSS – www.hidmet.gov.rs 24
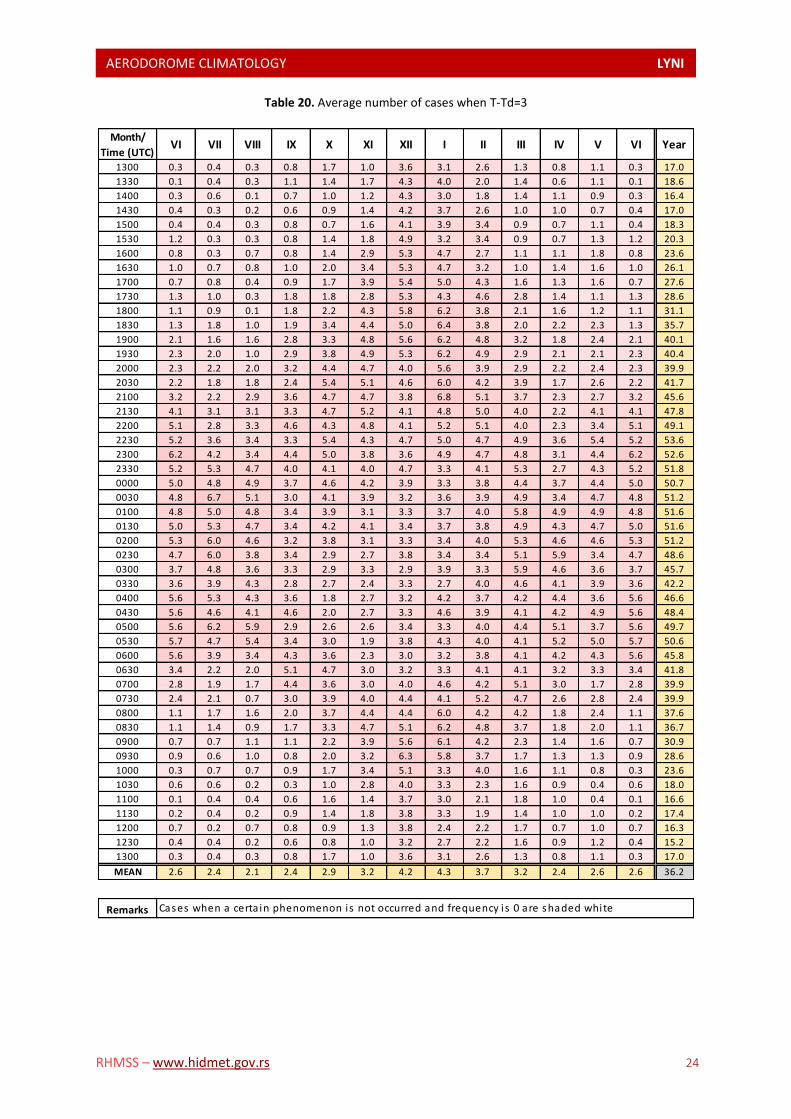
Table 20. Average number of cases when Т-Тd=3
Month/
Time (UTC)VI VII VIII IX X XI XII I II III IV V VI Year
1300 0.3 0.4 0.3 0.8 1.7 1.0 3.6 3.1 2.6 1.3 0.8 1.1 0.3 17.0
1330 0.1 0.4 0.3 1.1 1.4 1.7 4.3 4.0 2.0 1.4 0.6 1.1 0.1 18.6
1400 0.3 0.6 0.1 0.7 1.0 1.2 4.3 3.0 1.8 1.4 1.1 0.9 0.3 16.4
1430 0.4 0.3 0.2 0.6 0.9 1.4 4.2 3.7 2.6 1.0 1.0 0.7 0.4 17.0
1500 0.4 0.4 0.3 0.8 0.7 1.6 4.1 3.9 3.4 0.9 0.7 1.1 0.4 18.3
1530 1.2 0.3 0.3 0.8 1.4 1.8 4.9 3.2 3.4 0.9 0.7 1.3 1.2 20.3
1600 0.8 0.3 0.7 0.8 1.4 2.9 5.3 4.7 2.7 1.1 1.1 1.8 0.8 23.6
1630 1.0 0.7 0.8 1.0 2.0 3.4 5.3 4.7 3.2 1.0 1.4 1.6 1.0 26.1
1700 0.7 0.8 0.4 0.9 1.7 3.9 5.4 5.0 4.3 1.6 1.3 1.6 0.7 27.6
1730 1.3 1.0 0.3 1.8 1.8 2.8 5.3 4.3 4.6 2.8 1.4 1.1 1.3 28.6
1800 1.1 0.9 0.1 1.8 2.2 4.3 5.8 6.2 3.8 2.1 1.6 1.2 1.1 31.1
1830 1.3 1.8 1.0 1.9 3.4 4.4 5.0 6.4 3.8 2.0 2.2 2.3 1.3 35.7
1900 2.1 1.6 1.6 2.8 3.3 4.8 5.6 6.2 4.8 3.2 1.8 2.4 2.1 40.1
1930 2.3 2.0 1.0 2.9 3.8 4.9 5.3 6.2 4.9 2.9 2.1 2.1 2.3 40.4
2000 2.3 2.2 2.0 3.2 4.4 4.7 4.0 5.6 3.9 2.9 2.2 2.4 2.3 39.9
2030 2.2 1.8 1.8 2.4 5.4 5.1 4.6 6.0 4.2 3.9 1.7 2.6 2.2 41.7
2100 3.2 2.2 2.9 3.6 4.7 4.7 3.8 6.8 5.1 3.7 2.3 2.7 3.2 45.6
2130 4.1 3.1 3.1 3.3 4.7 5.2 4.1 4.8 5.0 4.0 2.2 4.1 4.1 47.8
2200 5.1 2.8 3.3 4.6 4.3 4.8 4.1 5.2 5.1 4.0 2.3 3.4 5.1 49.1
2230 5.2 3.6 3.4 3.3 5.4 4.3 4.7 5.0 4.7 4.9 3.6 5.4 5.2 53.6
2300 6.2 4.2 3.4 4.4 5.0 3.8 3.6 4.9 4.7 4.8 3.1 4.4 6.2 52.6
2330 5.2 5.3 4.7 4.0 4.1 4.0 4.7 3.3 4.1 5.3 2.7 4.3 5.2 51.8
0000 5.0 4.8 4.9 3.7 4.6 4.2 3.9 3.3 3.8 4.4 3.7 4.4 5.0 50.7
0030 4.8 6.7 5.1 3.0 4.1 3.9 3.2 3.6 3.9 4.9 3.4 4.7 4.8 51.2
0100 4.8 5.0 4.8 3.4 3.9 3.1 3.3 3.7 4.0 5.8 4.9 4.9 4.8 51.6
0130 5.0 5.3 4.7 3.4 4.2 4.1 3.4 3.7 3.8 4.9 4.3 4.7 5.0 51.6
0200 5.3 6.0 4.6 3.2 3.8 3.1 3.3 3.4 4.0 5.3 4.6 4.6 5.3 51.2
0230 4.7 6.0 3.8 3.4 2.9 2.7 3.8 3.4 3.4 5.1 5.9 3.4 4.7 48.6
0300 3.7 4.8 3.6 3.3 2.9 3.3 2.9 3.9 3.3 5.9 4.6 3.6 3.7 45.7
0330 3.6 3.9 4.3 2.8 2.7 2.4 3.3 2.7 4.0 4.6 4.1 3.9 3.6 42.2
0400 5.6 5.3 4.3 3.6 1.8 2.7 3.2 4.2 3.7 4.2 4.4 3.6 5.6 46.6
0430 5.6 4.6 4.1 4.6 2.0 2.7 3.3 4.6 3.9 4.1 4.2 4.9 5.6 48.4
0500 5.6 6.2 5.9 2.9 2.6 2.6 3.4 3.3 4.0 4.4 5.1 3.7 5.6 49.7
0530 5.7 4.7 5.4 3.4 3.0 1.9 3.8 4.3 4.0 4.1 5.2 5.0 5.7 50.6
0600 5.6 3.9 3.4 4.3 3.6 2.3 3.0 3.2 3.8 4.1 4.2 4.3 5.6 45.8
0630 3.4 2.2 2.0 5.1 4.7 3.0 3.2 3.3 4.1 4.1 3.2 3.3 3.4 41.8
0700 2.8 1.9 1.7 4.4 3.6 3.0 4.0 4.6 4.2 5.1 3.0 1.7 2.8 39.9
0730 2.4 2.1 0.7 3.0 3.9 4.0 4.4 4.1 5.2 4.7 2.6 2.8 2.4 39.9
0800 1.1 1.7 1.6 2.0 3.7 4.4 4.4 6.0 4.2 4.2 1.8 2.4 1.1 37.6
0830 1.1 1.4 0.9 1.7 3.3 4.7 5.1 6.2 4.8 3.7 1.8 2.0 1.1 36.7
0900 0.7 0.7 1.1 1.1 2.2 3.9 5.6 6.1 4.2 2.3 1.4 1.6 0.7 30.9
0930 0.9 0.6 1.0 0.8 2.0 3.2 6.3 5.8 3.7 1.7 1.3 1.3 0.9 28.6
1000 0.3 0.7 0.7 0.9 1.7 3.4 5.1 3.3 4.0 1.6 1.1 0.8 0.3 23.6
1030 0.6 0.6 0.2 0.3 1.0 2.8 4.0 3.3 2.3 1.6 0.9 0.4 0.6 18.0
1100 0.1 0.4 0.4 0.6 1.6 1.4 3.7 3.0 2.1 1.8 1.0 0.4 0.1 16.6
1130 0.2 0.4 0.2 0.9 1.4 1.8 3.8 3.3 1.9 1.4 1.0 1.0 0.2 17.4
1200 0.7 0.2 0.7 0.8 0.9 1.3 3.8 2.4 2.2 1.7 0.7 1.0 0.7 16.3
1230 0.4 0.4 0.2 0.6 0.8 1.0 3.2 2.7 2.2 1.6 0.9 1.2 0.4 15.2
1300 0.3 0.4 0.3 0.8 1.7 1.0 3.6 3.1 2.6 1.3 0.8 1.1 0.3 17.0
MEAN 2.6 2.4 2.1 2.4 2.9 3.2 4.2 4.3 3.7 3.2 2.4 2.6 2.6 36.2
Remarks Cases when a certa in phenomenon is not occurred and frequency i s 0 are shaded white
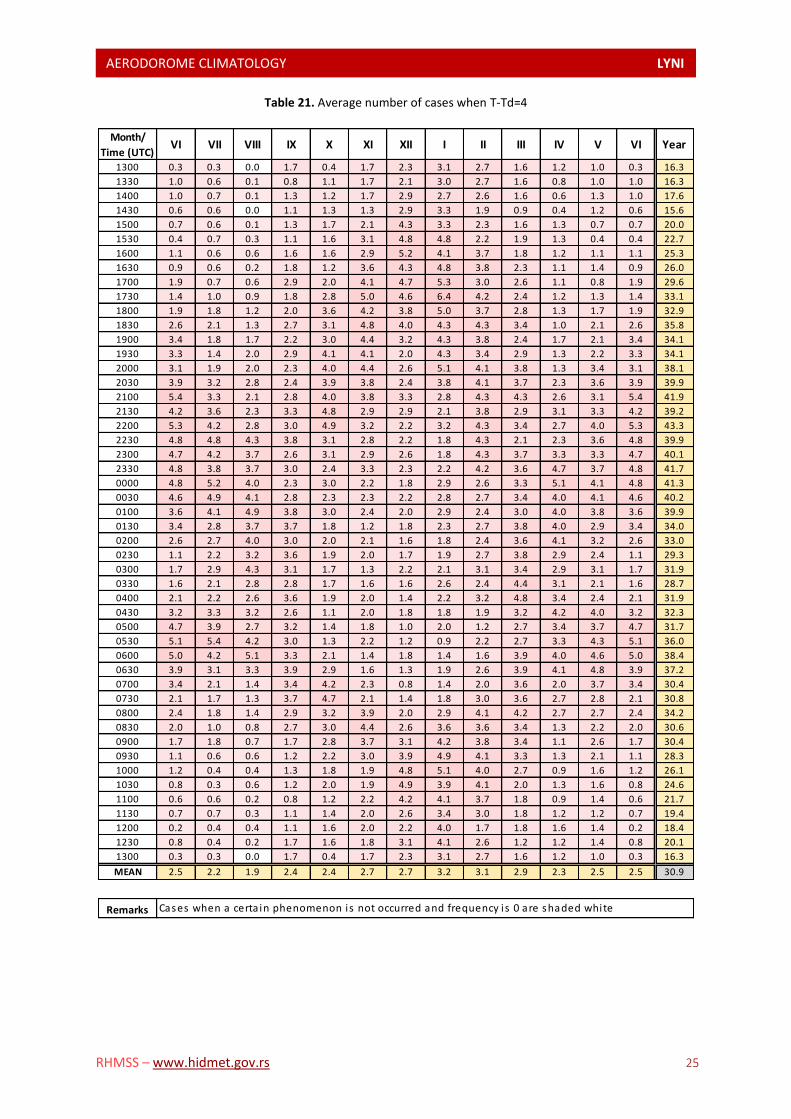
AERODOROME CLIMATOLOGY LYNI L
RHMSS – www.hidmet.gov.rs 25
Table 21. Average number of cases when Т-Тd=4
Month/
Time (UTC)VI VII VIII IX X XI XII I II III IV V VI Year
1300 0.3 0.3 0.0 1.7 0.4 1.7 2.3 3.1 2.7 1.6 1.2 1.0 0.3 16.3
1330 1.0 0.6 0.1 0.8 1.1 1.7 2.1 3.0 2.7 1.6 0.8 1.0 1.0 16.3
1400 1.0 0.7 0.1 1.3 1.2 1.7 2.9 2.7 2.6 1.6 0.6 1.3 1.0 17.6
1430 0.6 0.6 0.0 1.1 1.3 1.3 2.9 3.3 1.9 0.9 0.4 1.2 0.6 15.6
1500 0.7 0.6 0.1 1.3 1.7 2.1 4.3 3.3 2.3 1.6 1.3 0.7 0.7 20.0
1530 0.4 0.7 0.3 1.1 1.6 3.1 4.8 4.8 2.2 1.9 1.3 0.4 0.4 22.7
1600 1.1 0.6 0.6 1.6 1.6 2.9 5.2 4.1 3.7 1.8 1.2 1.1 1.1 25.3
1630 0.9 0.6 0.2 1.8 1.2 3.6 4.3 4.8 3.8 2.3 1.1 1.4 0.9 26.0
1700 1.9 0.7 0.6 2.9 2.0 4.1 4.7 5.3 3.0 2.6 1.1 0.8 1.9 29.6
1730 1.4 1.0 0.9 1.8 2.8 5.0 4.6 6.4 4.2 2.4 1.2 1.3 1.4 33.1
1800 1.9 1.8 1.2 2.0 3.6 4.2 3.8 5.0 3.7 2.8 1.3 1.7 1.9 32.9
1830 2.6 2.1 1.3 2.7 3.1 4.8 4.0 4.3 4.3 3.4 1.0 2.1 2.6 35.8
1900 3.4 1.8 1.7 2.2 3.0 4.4 3.2 4.3 3.8 2.4 1.7 2.1 3.4 34.1
1930 3.3 1.4 2.0 2.9 4.1 4.1 2.0 4.3 3.4 2.9 1.3 2.2 3.3 34.1
2000 3.1 1.9 2.0 2.3 4.0 4.4 2.6 5.1 4.1 3.8 1.3 3.4 3.1 38.1
2030 3.9 3.2 2.8 2.4 3.9 3.8 2.4 3.8 4.1 3.7 2.3 3.6 3.9 39.9
2100 5.4 3.3 2.1 2.8 4.0 3.8 3.3 2.8 4.3 4.3 2.6 3.1 5.4 41.9
2130 4.2 3.6 2.3 3.3 4.8 2.9 2.9 2.1 3.8 2.9 3.1 3.3 4.2 39.2
2200 5.3 4.2 2.8 3.0 4.9 3.2 2.2 3.2 4.3 3.4 2.7 4.0 5.3 43.3
2230 4.8 4.8 4.3 3.8 3.1 2.8 2.2 1.8 4.3 2.1 2.3 3.6 4.8 39.9
2300 4.7 4.2 3.7 2.6 3.1 2.9 2.6 1.8 4.3 3.7 3.3 3.3 4.7 40.1
2330 4.8 3.8 3.7 3.0 2.4 3.3 2.3 2.2 4.2 3.6 4.7 3.7 4.8 41.7
0000 4.8 5.2 4.0 2.3 3.0 2.2 1.8 2.9 2.6 3.3 5.1 4.1 4.8 41.3
0030 4.6 4.9 4.1 2.8 2.3 2.3 2.2 2.8 2.7 3.4 4.0 4.1 4.6 40.2
0100 3.6 4.1 4.9 3.8 3.0 2.4 2.0 2.9 2.4 3.0 4.0 3.8 3.6 39.9
0130 3.4 2.8 3.7 3.7 1.8 1.2 1.8 2.3 2.7 3.8 4.0 2.9 3.4 34.0
0200 2.6 2.7 4.0 3.0 2.0 2.1 1.6 1.8 2.4 3.6 4.1 3.2 2.6 33.0
0230 1.1 2.2 3.2 3.6 1.9 2.0 1.7 1.9 2.7 3.8 2.9 2.4 1.1 29.3
0300 1.7 2.9 4.3 3.1 1.7 1.3 2.2 2.1 3.1 3.4 2.9 3.1 1.7 31.9
0330 1.6 2.1 2.8 2.8 1.7 1.6 1.6 2.6 2.4 4.4 3.1 2.1 1.6 28.7
0400 2.1 2.2 2.6 3.6 1.9 2.0 1.4 2.2 3.2 4.8 3.4 2.4 2.1 31.9
0430 3.2 3.3 3.2 2.6 1.1 2.0 1.8 1.8 1.9 3.2 4.2 4.0 3.2 32.3
0500 4.7 3.9 2.7 3.2 1.4 1.8 1.0 2.0 1.2 2.7 3.4 3.7 4.7 31.7
0530 5.1 5.4 4.2 3.0 1.3 2.2 1.2 0.9 2.2 2.7 3.3 4.3 5.1 36.0
0600 5.0 4.2 5.1 3.3 2.1 1.4 1.8 1.4 1.6 3.9 4.0 4.6 5.0 38.4
0630 3.9 3.1 3.3 3.9 2.9 1.6 1.3 1.9 2.6 3.9 4.1 4.8 3.9 37.2
0700 3.4 2.1 1.4 3.4 4.2 2.3 0.8 1.4 2.0 3.6 2.0 3.7 3.4 30.4
0730 2.1 1.7 1.3 3.7 4.7 2.1 1.4 1.8 3.0 3.6 2.7 2.8 2.1 30.8
0800 2.4 1.8 1.4 2.9 3.2 3.9 2.0 2.9 4.1 4.2 2.7 2.7 2.4 34.2
0830 2.0 1.0 0.8 2.7 3.0 4.4 2.6 3.6 3.6 3.4 1.3 2.2 2.0 30.6
0900 1.7 1.8 0.7 1.7 2.8 3.7 3.1 4.2 3.8 3.4 1.1 2.6 1.7 30.4
0930 1.1 0.6 0.6 1.2 2.2 3.0 3.9 4.9 4.1 3.3 1.3 2.1 1.1 28.3
1000 1.2 0.4 0.4 1.3 1.8 1.9 4.8 5.1 4.0 2.7 0.9 1.6 1.2 26.1
1030 0.8 0.3 0.6 1.2 2.0 1.9 4.9 3.9 4.1 2.0 1.3 1.6 0.8 24.6
1100 0.6 0.6 0.2 0.8 1.2 2.2 4.2 4.1 3.7 1.8 0.9 1.4 0.6 21.7
1130 0.7 0.7 0.3 1.1 1.4 2.0 2.6 3.4 3.0 1.8 1.2 1.2 0.7 19.4
1200 0.2 0.4 0.4 1.1 1.6 2.0 2.2 4.0 1.7 1.8 1.6 1.4 0.2 18.4
1230 0.8 0.4 0.2 1.7 1.6 1.8 3.1 4.1 2.6 1.2 1.2 1.4 0.8 20.1
1300 0.3 0.3 0.0 1.7 0.4 1.7 2.3 3.1 2.7 1.6 1.2 1.0 0.3 16.3
MEAN 2.5 2.2 1.9 2.4 2.4 2.7 2.7 3.2 3.1 2.9 2.3 2.5 2.5 30.9
Remarks Cases when a certa in phenomenon is not occurred and frequency i s 0 are shaded white

AERODOROME CLIMATOLOGY LYNI L
RHMSS – www.hidmet.gov.rs 26
Table 22. Average number of cases when Т-Тd>4
Month/
Time (UTC)VI VII VIII IX X XI XII I II III IV V VI Year
1300 28.1 29.7 29.1 26.2 25.0 23.2 16.1 17.3 17.9 24.3 25.8 26.1 28.1 288.9
1330 27.1 29.3 28.8 26.6 24.4 22.8 16.0 17.2 18.2 24.6 26.1 26.2 27.1 287.3
1400 27.4 28.9 29.3 26.6 24.4 22.7 15.6 17.8 18.4 24.7 26.7 25.9 27.4 288.3
1430 27.1 29.4 29.1 26.7 24.2 22.6 14.3 15.8 18.2 25.3 26.6 25.7 27.1 285.0
1500 26.8 29.2 28.7 26.1 23.6 21.7 12.3 15.2 17.3 25.4 25.4 25.8 26.8 277.6
1530 26.1 29.3 28.9 25.8 22.7 19.4 9.8 13.1 16.3 24.2 24.7 25.8 26.1 266.1
1600 25.6 29.1 28.0 25.2 22.1 18.0 7.1 11.9 15.4 23.7 24.3 25.0 25.6 255.4
1630 25.9 28.8 28.0 24.9 21.4 15.9 6.8 10.1 13.7 23.2 24.4 24.3 25.9 247.4
1700 25.3 28.0 27.0 23.6 20.2 14.6 6.1 9.1 12.9 22.4 23.8 23.7 25.3 236.7
1730 24.2 27.7 26.9 22.7 18.9 12.8 5.3 6.9 10.9 21.2 23.1 23.7 24.2 224.2
1800 23.3 26.9 25.9 22.2 17.6 12.0 5.2 6.0 10.1 20.8 22.9 22.9 23.3 215.8
1830 21.4 25.2 25.3 20.6 16.4 10.2 5.1 5.4 9.7 19.7 21.8 20.8 21.4 201.7
1900 19.8 25.0 24.6 20.4 15.6 9.2 4.6 5.1 9.2 19.6 21.0 20.2 19.8 194.2
1930 18.6 24.6 23.9 19.1 13.0 8.6 5.4 4.2 8.3 18.4 21.1 19.1 18.6 184.3
2000 18.4 23.6 23.1 18.2 11.8 7.0 5.3 3.8 7.7 17.4 20.2 17.0 18.4 173.6
2030 16.9 21.9 21.9 17.3 9.9 7.1 5.2 4.0 7.1 16.8 19.2 16.3 16.9 163.7
2100 13.9 20.2 21.1 15.7 9.0 6.7 4.7 3.9 6.2 16.1 18.9 15.9 13.9 152.2
2130 13.3 18.6 20.0 14.9 7.0 6.1 4.7 4.1 6.0 15.8 17.7 13.4 13.3 141.6
2200 11.2 17.7 18.8 13.7 6.8 5.3 4.3 3.4 5.3 14.3 17.3 12.2 11.2 130.4
2230 10.1 15.9 16.3 12.2 6.2 5.2 4.3 3.7 4.6 14.6 15.9 10.6 10.1 119.6
2300 8.9 14.7 16.0 11.2 5.9 5.0 3.4 3.3 4.2 12.6 15.1 10.2 8.9 110.6
2330 7.3 12.8 13.4 9.9 5.9 4.3 3.2 3.4 4.1 12.3 13.0 8.9 7.3 98.7
0000 6.2 10.8 12.6 9.4 4.6 4.6 3.4 3.3 4.2 11.1 11.2 7.0 6.2 88.4
0030 4.4 8.9 12.0 8.7 4.3 4.9 3.4 2.9 4.1 10.2 10.9 6.0 4.4 80.8
0100 4.4 8.4 9.8 7.3 3.2 4.0 3.1 3.1 3.8 9.7 10.1 5.4 4.4 72.4
0130 3.3 8.1 8.9 7.3 3.3 4.0 3.2 3.2 3.3 8.1 8.9 4.9 3.3 66.7
0200 2.7 6.9 8.4 7.1 3.0 3.7 3.3 3.9 3.1 8.2 8.2 4.7 2.7 63.2
0230 3.4 6.6 8.2 6.1 2.7 3.9 3.0 3.6 2.6 7.9 7.6 4.2 3.4 59.7
0300 2.8 5.6 6.4 5.7 2.7 4.0 2.7 3.0 2.6 7.7 7.3 3.6 2.8 53.9
0330 2.4 5.4 6.3 5.1 2.8 3.8 2.8 3.0 2.6 6.9 7.0 3.1 2.4 51.2
0400 2.7 5.3 6.1 4.3 3.0 3.1 2.9 2.7 2.2 6.4 6.4 3.1 2.7 48.3
0430 3.7 6.4 6.3 4.2 2.7 3.1 2.9 2.4 2.9 7.1 5.0 3.3 3.7 50.1
0500 6.4 9.2 8.1 4.3 2.7 3.1 3.0 3.0 2.9 6.2 6.7 5.7 6.4 61.3
0530 10.0 12.8 11.9 6.2 2.9 3.0 2.6 3.3 2.2 7.8 9.7 8.4 10.0 80.8
0600 13.6 17.4 15.0 8.2 3.4 3.2 2.6 2.9 2.2 8.3 11.8 11.9 13.6 100.6
0630 17.8 20.7 20.2 11.0 4.9 3.7 2.9 2.1 2.6 10.4 14.6 14.3 17.8 125.1
0700 20.4 23.3 23.4 15.7 7.2 3.8 3.3 2.9 4.0 13.2 18.3 17.9 20.4 153.6
0730 23.0 24.7 25.4 19.1 10.3 6.0 3.8 3.9 4.2 15.2 19.8 20.1 23.0 175.6
0800 24.4 25.7 25.8 21.6 14.6 6.9 4.3 4.2 5.7 17.2 21.1 21.2 24.4 192.7
0830 24.7 27.2 26.8 23.8 17.3 9.3 5.3 6.0 7.7 19.6 23.0 23.0 24.7 213.7
0900 25.9 27.3 27.2 25.2 20.2 13.2 6.2 7.3 9.4 21.0 23.7 23.9 25.9 230.7
0930 26.8 28.4 27.9 25.3 21.7 16.0 7.3 8.3 11.4 21.6 24.7 24.6 26.8 244.0
1000 27.2 28.9 28.6 25.4 23.1 18.6 9.1 11.6 12.6 22.6 25.6 25.6 27.2 258.7
1030 27.6 29.1 28.8 25.6 23.8 20.0 10.7 14.1 14.0 23.2 25.4 25.7 27.6 267.9
1100 28.1 28.9 28.9 26.0 23.9 21.0 12.6 15.8 15.9 23.0 26.2 25.9 28.1 276.1
1130 27.7 28.8 29.1 25.6 24.6 21.6 14.9 16.8 16.8 23.8 26.1 26.4 27.7 282.0
1200 27.9 29.6 28.7 26.1 24.6 22.3 15.2 16.7 17.4 23.9 24.7 26.0 27.9 283.0
1230 27.6 29.3 29.4 26.1 24.7 23.1 15.8 16.9 17.2 24.4 25.4 25.9 27.6 285.9
1300 28.1 29.7 29.1 26.2 25.0 23.2 16.1 17.3 17.9 24.3 25.8 26.1 28.1 288.9
MEAN 17.5 20.8 20.9 17.3 13.2 10.7 6.6 7.3 8.7 16.7 18.4 16.9 17.5 175.2
Remarks Cases when a certa in phenomenon is not occurred and frequency i s 0 are shaded white
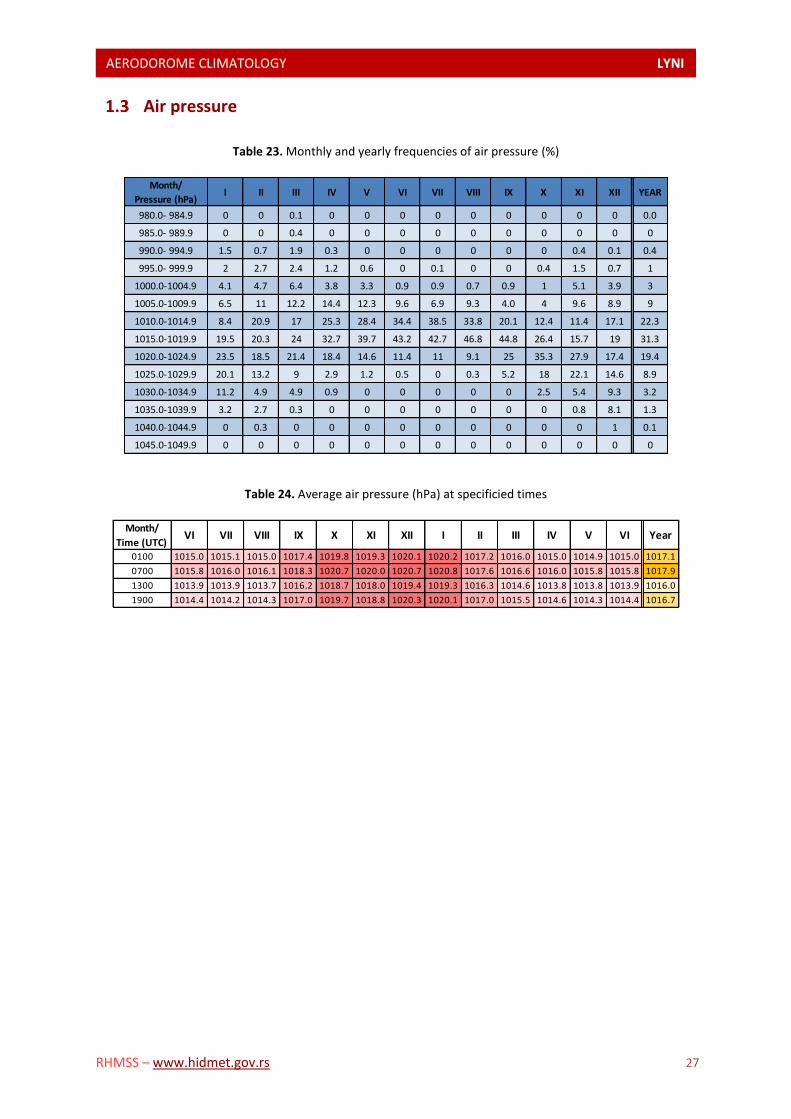
AERODOROME CLIMATOLOGY LYNI L
RHMSS – www.hidmet.gov.rs 27
Air pressure
Table 23. Monthly and yearly frequencies of air pressure (%)
Month/
Pressure (hPa)I II III IV V VI VII VIII IX X XI XII YEAR
980.0- 984.9 0 0 0.1 0 0 0 0 0 0 0 0 0 0.0
985.0- 989.9 0 0 0.4 0 0 0 0 0 0 0 0 0 0
990.0- 994.9 1.5 0.7 1.9 0.3 0 0 0 0 0 0 0.4 0.1 0.4
995.0- 999.9 2 2.7 2.4 1.2 0.6 0 0.1 0 0 0.4 1.5 0.7 1
1000.0-1004.9 4.1 4.7 6.4 3.8 3.3 0.9 0.9 0.7 0.9 1 5.1 3.9 3
1005.0-1009.9 6.5 11 12.2 14.4 12.3 9.6 6.9 9.3 4.0 4 9.6 8.9 9
1010.0-1014.9 8.4 20.9 17 25.3 28.4 34.4 38.5 33.8 20.1 12.4 11.4 17.1 22.3
1015.0-1019.9 19.5 20.3 24 32.7 39.7 43.2 42.7 46.8 44.8 26.4 15.7 19 31.3
1020.0-1024.9 23.5 18.5 21.4 18.4 14.6 11.4 11 9.1 25 35.3 27.9 17.4 19.4
1025.0-1029.9 20.1 13.2 9 2.9 1.2 0.5 0 0.3 5.2 18 22.1 14.6 8.9
1030.0-1034.9 11.2 4.9 4.9 0.9 0 0 0 0 0 2.5 5.4 9.3 3.2
1035.0-1039.9 3.2 2.7 0.3 0 0 0 0 0 0 0 0.8 8.1 1.3
1040.0-1044.9 0 0.3 0 0 0 0 0 0 0 0 0 1 0.1
1045.0-1049.9 0 0 0 0 0 0 0 0 0 0 0 0 0
Table 24. Average air pressure (hPa) at specificied times
Month/
Time (UTC)VI VII VIII IX X XI XII I II III IV V VI Year
0100 1015.0 1015.1 1015.0 1017.4 1019.8 1019.3 1020.1 1020.2 1017.2 1016.0 1015.0 1014.9 1015.0 1017.1
0700 1015.8 1016.0 1016.1 1018.3 1020.7 1020.0 1020.7 1020.8 1017.6 1016.6 1016.0 1015.8 1015.8 1017.9
1300 1013.9 1013.9 1013.7 1016.2 1018.7 1018.0 1019.4 1019.3 1016.3 1014.6 1013.8 1013.8 1013.9 1016.0
1900 1014.4 1014.2 1014.3 1017.0 1019.7 1018.8 1020.3 1020.1 1017.0 1015.5 1014.6 1014.3 1014.4 1016.7

AERODOROME CLIMATOLOGY LYNI L
RHMSS – www.hidmet.gov.rs 28
Table 25. Average air pressure (hPa)
Month/
Time (UTC)VI VII VIII IX X XI XII I II III IV V VI Year
1300 1013.9 1013.9 1013.7 1016.2 1018.7 1018.0 1019.4 1019.3 1016.3 1014.6 1013.8 1013.8 1013.9 1015.8
1330 1013.7 1013.7 1013.5 1016.1 1018.6 1017.9 1019.5 1019.3 1016.1 1014.5 1013.6 1013.6 1013.7 1015.8
1400 1013.6 1013.5 1013.5 1015.9 1018.4 1017.8 1019.5 1019.4 1016.3 1014.4 1013.5 1013.5 1013.6 1015.7
1430 1013.5 1013.4 1013.3 1015.7 1018.4 1017.9 1019.5 1019.3 1016.1 1014.2 1013.4 1013.3 1013.5 1015.6
1500 1013.4 1013.2 1013.2 1015.8 1018.5 1018.0 1019.5 1019.3 1016.0 1014.3 1013.3 1013.3 1013.4 1015.7
1530 1013.4 1013.2 1013.1 1015.8 1018.5 1018.0 1019.6 1019.4 1016.0 1014.2 1013.3 1013.1 1013.4 1015.7
1600 1013.4 1013.2 1013.1 1015.8 1018.6 1018.1 1019.9 1019.6 1016.2 1014.3 1013.3 1013.2 1013.4 1015.8
1630 1013.5 1013.2 1013.2 1015.9 1018.9 1018.2 1019.8 1019.8 1016.3 1014.5 1013.5 1013.3 1013.5 1016.0
1700 1013.6 1013.4 1013.3 1016.1 1019.1 1018.4 1020.0 1020.0 1016.6 1014.7 1013.5 1013.4 1013.6 1016.1
1730 1013.7 1013.5 1013.5 1016.3 1019.2 1018.4 1020.1 1019.9 1016.7 1014.9 1013.7 1013.6 1013.7 1016.3
1800 1013.9 1013.7 1013.7 1016.5 1019.4 1018.6 1020.2 1019.9 1016.9 1015.1 1014.1 1013.7 1013.9 1016.5
1830 1014.0 1013.9 1014.0 1016.8 1019.5 1018.7 1020.1 1020.1 1016.8 1015.3 1014.4 1014.0 1014.0 1016.7
1900 1014.4 1014.2 1014.3 1017.0 1019.7 1018.8 1020.3 1020.1 1017.0 1015.5 1014.6 1014.3 1014.4 1016.8
1930 1014.6 1014.4 1014.5 1017.1 1019.9 1018.9 1020.2 1020.1 1017.0 1015.5 1014.8 1014.5 1014.6 1017.0
2000 1014.8 1014.6 1014.6 1017.2 1019.9 1019.0 1020.4 1020.3 1017.3 1015.9 1014.9 1014.7 1014.8 1017.0
2030 1014.9 1014.7 1014.8 1017.3 1020.0 1019.1 1020.3 1020.3 1017.2 1015.8 1014.8 1014.7 1014.9 1017.1
2100 1015.0 1014.8 1014.9 1017.4 1020.0 1019.1 1020.5 1020.3 1017.1 1015.9 1015.0 1014.8 1015.0 1017.1
2130 1015.1 1015.0 1015.0 1017.5 1020.1 1019.1 1020.3 1020.2 1017.5 1015.8 1015.1 1014.9 1015.1 1017.2
2200 1015.1 1015.1 1015.1 1017.5 1020.0 1019.2 1020.6 1020.3 1017.3 1016.0 1015.1 1014.9 1015.1 1017.2
2230 1015.1 1015.1 1015.1 1017.6 1020.0 1019.2 1020.3 1020.1 1017.5 1016.0 1015.2 1014.9 1015.1 1017.2
2300 1015.2 1015.1 1015.1 1017.5 1020.0 1019.2 1020.4 1020.2 1017.3 1015.9 1015.1 1014.9 1015.2 1017.1
2330 1015.1 1015.1 1015.1 1017.6 1020.0 1019.1 1020.3 1020.0 1017.3 1015.9 1015.0 1014.8 1015.1 1017.1
0000 1015.1 1015.1 1015.1 1017.4 1020.0 1019.1 1020.1 1020.0 1017.5 1016.1 1015.1 1014.9 1015.1 1017.1
0030 1015.0 1015.1 1015.0 1017.5 1019.8 1019.3 1020.1 1020.1 1017.5 1016.0 1015.0 1014.8 1015.0 1017.1
0100 1015.0 1015.1 1015.0 1017.4 1019.8 1019.3 1020.1 1020.2 1017.2 1016.0 1015.0 1014.9 1015.0 1017.0
0130 1014.9 1015.2 1014.9 1017.4 1019.7 1019.2 1020.2 1020.1 1017.0 1016.0 1015.0 1014.7 1014.9 1017.0
0200 1015.0 1015.2 1015.1 1017.4 1019.7 1019.0 1020.1 1020.0 1017.0 1015.9 1015.1 1014.8 1015.0 1017.0
0230 1015.1 1015.3 1015.1 1017.3 1019.8 1018.9 1019.9 1020.0 1016.8 1016.1 1015.0 1014.8 1015.1 1017.0
0300 1015.2 1015.4 1015.2 1017.4 1019.8 1019.0 1019.8 1019.9 1016.9 1015.9 1015.0 1014.9 1015.2 1017.1
0330 1015.3 1015.5 1015.3 1017.4 1019.8 1019.0 1019.9 1019.9 1017.0 1015.8 1015.0 1015.1 1015.3 1017.2
0400 1015.5 1015.7 1015.5 1017.5 1019.8 1019.0 1019.9 1020.0 1016.9 1016.0 1015.2 1015.3 1015.5 1017.3
0430 1015.5 1015.8 1015.7 1017.7 1019.8 1019.0 1019.9 1020.0 1017.1 1016.1 1015.5 1015.4 1015.5 1017.4
0500 1015.7 1015.9 1015.8 1017.9 1020.0 1019.1 1020.0 1020.1 1016.9 1016.1 1015.6 1015.6 1015.7 1017.5
0530 1015.8 1016.0 1015.9 1018.0 1020.2 1019.3 1020.2 1020.2 1017.1 1016.3 1015.7 1015.6 1015.8 1017.7
0600 1015.8 1016.0 1016.0 1018.1 1020.4 1019.7 1020.3 1020.4 1017.3 1016.4 1015.8 1015.8 1015.8 1017.8
0630 1015.8 1016.0 1016.0 1018.2 1020.6 1019.9 1020.5 1020.4 1017.6 1016.6 1015.8 1015.8 1015.8 1017.9
0700 1015.8 1016.0 1016.1 1018.3 1020.7 1020.0 1020.7 1020.8 1017.6 1016.6 1016.0 1015.8 1015.8 1017.8
0730 1015.7 1015.9 1016.0 1018.3 1020.8 1019.9 1020.8 1020.9 1017.7 1016.7 1015.9 1015.6 1015.7 1017.8
0800 1015.6 1015.9 1016.0 1018.2 1020.7 1019.9 1020.9 1020.9 1017.5 1016.6 1015.9 1015.6 1015.6 1017.8
0830 1015.5 1015.7 1015.8 1018.2 1020.6 1019.9 1021.0 1021.0 1017.6 1016.7 1015.8 1015.5 1015.5 1017.7
0900 1015.4 1015.6 1015.8 1018.0 1020.6 1019.8 1021.0 1021.0 1017.8 1016.6 1015.6 1015.4 1015.4 1017.5
0930 1015.3 1015.5 1015.4 1017.8 1020.4 1019.7 1020.8 1020.7 1017.7 1016.4 1015.5 1015.2 1015.3 1017.4
1000 1015.1 1015.3 1015.2 1017.5 1020.2 1019.4 1020.5 1020.8 1017.6 1016.1 1015.2 1015.1 1015.1 1017.1
1030 1014.9 1015.0 1015.0 1017.4 1019.9 1019.1 1020.2 1020.4 1017.2 1016.1 1014.9 1014.9 1014.9 1016.8
1100 1014.7 1014.8 1014.8 1017.1 1019.5 1018.8 1020.1 1020.1 1017.0 1015.7 1014.7 1014.6 1014.7 1016.6
1130 1014.5 1014.6 1014.5 1016.9 1019.3 1018.5 1019.8 1019.7 1016.7 1015.6 1014.6 1014.5 1014.5 1016.4
1200 1014.3 1014.3 1014.3 1016.6 1019.0 1018.3 1019.6 1019.5 1016.6 1015.2 1014.3 1014.2 1014.3 1016.2
1230 1014.0 1014.1 1014.0 1016.5 1018.8 1018.1 1019.5 1019.5 1016.5 1015.0 1014.1 1014.0 1014.0 1016.0
1300 1013.9 1013.9 1013.7 1016.2 1018.7 1018.0 1019.4 1019.3 1016.3 1014.6 1013.8 1013.8 1013.9 1015.8
MEAN 1014.8 1014.8 1014.8 1017.2 1019.7 1018.9 1020.1 1020.1 1017.0 1015.7 1014.8 1014.6 1014.8 1016.9
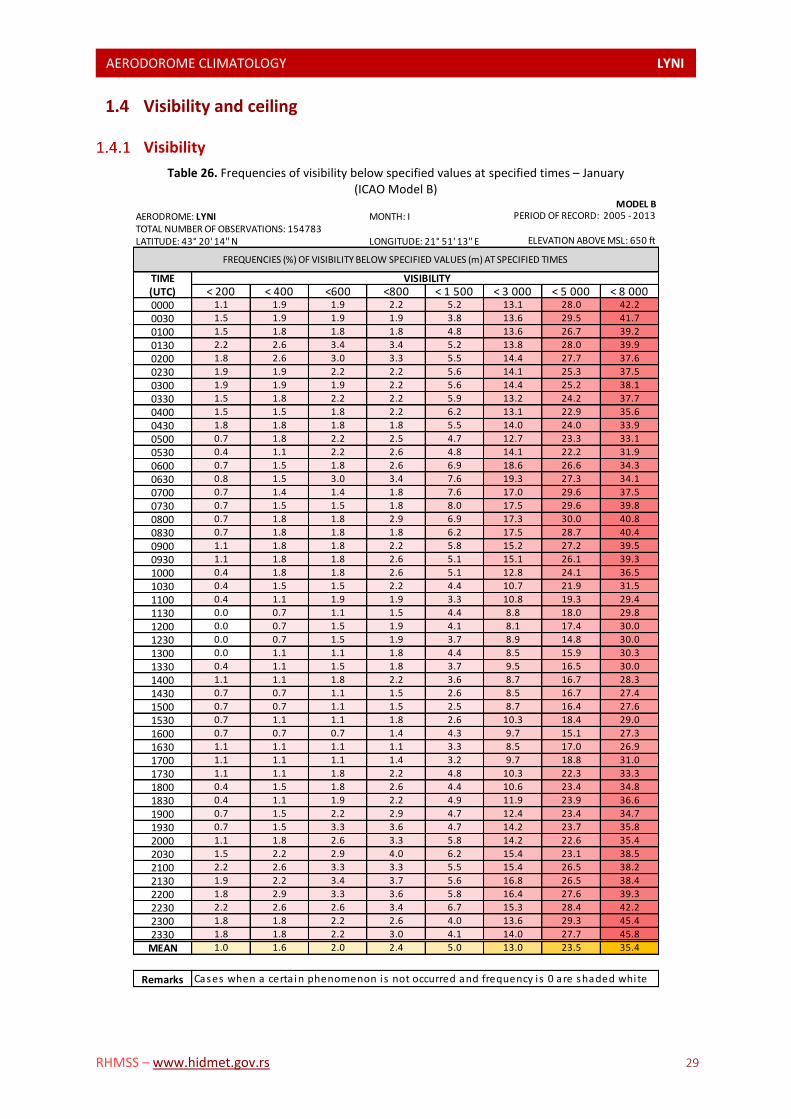
AERODOROME CLIMATOLOGY LYNI L
RHMSS – www.hidmet.gov.rs 29
Visibility and ceiling
Visibility
Table 26. Frequencies of visibility below specified values at specified times – January (ICAO Model B)
MODEL BAERODROME: LYNI MONTH: ITOTAL NUMBER OF OBSERVATIONS: 154783LATITUDE: 43° 20' 14'' N LONGITUDE: 21° 51' 13'' E
TIME(UTC) < 200 < 400 <600 <800 < 1 500 < 3 000 < 5 000 < 8 0000000 1.1 1.9 1.9 2.2 5.2 13.1 28.0 42.2
0030 1.5 1.9 1.9 1.9 3.8 13.6 29.5 41.7
0100 1.5 1.8 1.8 1.8 4.8 13.6 26.7 39.2
0130 2.2 2.6 3.4 3.4 5.2 13.8 28.0 39.9
0200 1.8 2.6 3.0 3.3 5.5 14.4 27.7 37.6
0230 1.9 1.9 2.2 2.2 5.6 14.1 25.3 37.5
0300 1.9 1.9 1.9 2.2 5.6 14.4 25.2 38.1
0330 1.5 1.8 2.2 2.2 5.9 13.2 24.2 37.7
0400 1.5 1.5 1.8 2.2 6.2 13.1 22.9 35.6
0430 1.8 1.8 1.8 1.8 5.5 14.0 24.0 33.9
0500 0.7 1.8 2.2 2.5 4.7 12.7 23.3 33.1
0530 0.4 1.1 2.2 2.6 4.8 14.1 22.2 31.9
0600 0.7 1.5 1.8 2.6 6.9 18.6 26.6 34.3
0630 0.8 1.5 3.0 3.4 7.6 19.3 27.3 34.1
0700 0.7 1.4 1.4 1.8 7.6 17.0 29.6 37.5
0730 0.7 1.5 1.5 1.8 8.0 17.5 29.6 39.8
0800 0.7 1.8 1.8 2.9 6.9 17.3 30.0 40.8
0830 0.7 1.8 1.8 1.8 6.2 17.5 28.7 40.4
0900 1.1 1.8 1.8 2.2 5.8 15.2 27.2 39.5
0930 1.1 1.8 1.8 2.6 5.1 15.1 26.1 39.3
1000 0.4 1.8 1.8 2.6 5.1 12.8 24.1 36.5
1030 0.4 1.5 1.5 2.2 4.4 10.7 21.9 31.5
1100 0.4 1.1 1.9 1.9 3.3 10.8 19.3 29.4
1130 0.0 0.7 1.1 1.5 4.4 8.8 18.0 29.8
1200 0.0 0.7 1.5 1.9 4.1 8.1 17.4 30.0
1230 0.0 0.7 1.5 1.9 3.7 8.9 14.8 30.0
1300 0.0 1.1 1.1 1.8 4.4 8.5 15.9 30.3
1330 0.4 1.1 1.5 1.8 3.7 9.5 16.5 30.0
1400 1.1 1.1 1.8 2.2 3.6 8.7 16.7 28.3
1430 0.7 0.7 1.1 1.5 2.6 8.5 16.7 27.4
1500 0.7 0.7 1.1 1.5 2.5 8.7 16.4 27.6
1530 0.7 1.1 1.1 1.8 2.6 10.3 18.4 29.0
1600 0.7 0.7 0.7 1.4 4.3 9.7 15.1 27.3
1630 1.1 1.1 1.1 1.1 3.3 8.5 17.0 26.9
1700 1.1 1.1 1.1 1.4 3.2 9.7 18.8 31.0
1730 1.1 1.1 1.8 2.2 4.8 10.3 22.3 33.3
1800 0.4 1.5 1.8 2.6 4.4 10.6 23.4 34.8
1830 0.4 1.1 1.9 2.2 4.9 11.9 23.9 36.6
1900 0.7 1.5 2.2 2.9 4.7 12.4 23.4 34.7
1930 0.7 1.5 3.3 3.6 4.7 14.2 23.7 35.8
2000 1.1 1.8 2.6 3.3 5.8 14.2 22.6 35.4
2030 1.5 2.2 2.9 4.0 6.2 15.4 23.1 38.5
2100 2.2 2.6 3.3 3.3 5.5 15.4 26.5 38.2
2130 1.9 2.2 3.4 3.7 5.6 16.8 26.5 38.4
2200 1.8 2.9 3.3 3.6 5.8 16.4 27.6 39.3
2230 2.2 2.6 2.6 3.4 6.7 15.3 28.4 42.2
2300 1.8 1.8 2.2 2.6 4.0 13.6 29.3 45.4
2330 1.8 1.8 2.2 3.0 4.1 14.0 27.7 45.8
MEAN 1.0 1.6 2.0 2.4 5.0 13.0 23.5 35.4
Remarks
PERIOD OF RECORD: 2005 - 2013
FREQUENCIES (%) OF VISIBILITY BELOW SPECIFIED VALUES (m) AT SPECIFIED TIMES
VISIBILITY
ELEVATION ABOVE MSL: 650 ft
Cases when a certa in phenomenon is not occurred and frequency i s 0 are shaded white
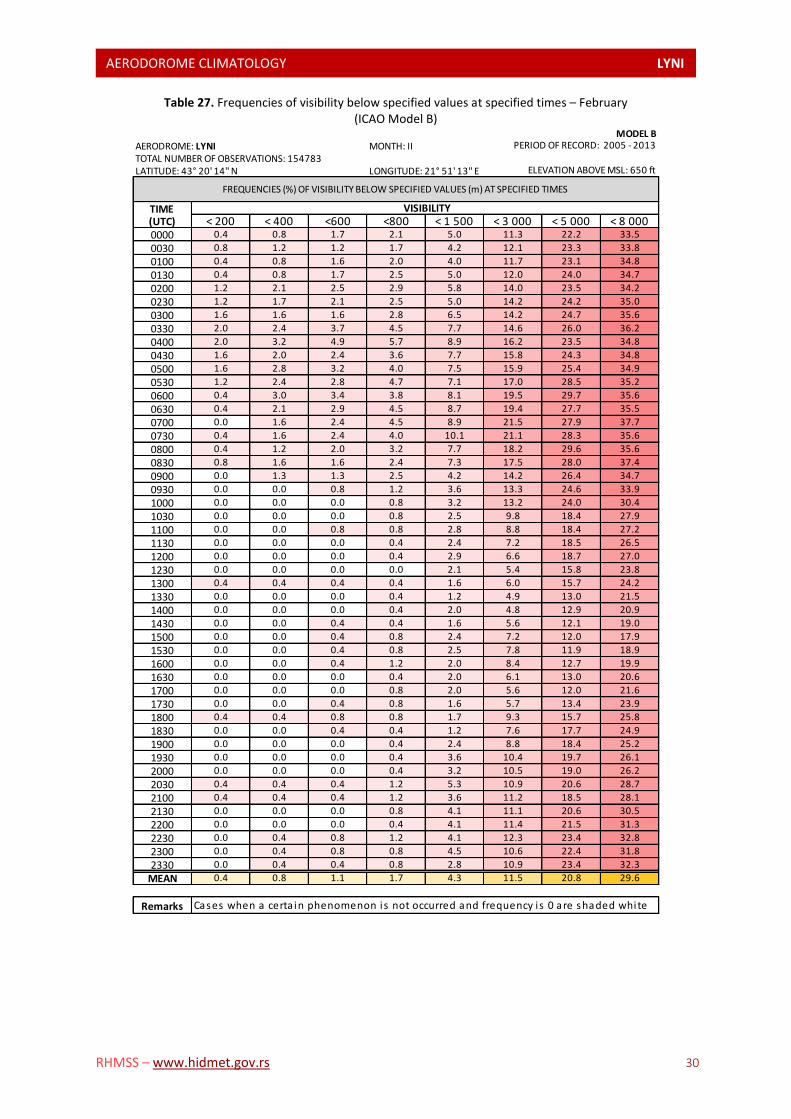
AERODOROME CLIMATOLOGY LYNI L
RHMSS – www.hidmet.gov.rs 30
Table 27. Frequencies of visibility below specified values at specified times – February (ICAO Model B)
MODEL BAERODROME: LYNI MONTH: IITOTAL NUMBER OF OBSERVATIONS: 154783LATITUDE: 43° 20' 14'' N LONGITUDE: 21° 51' 13'' E
TIME(UTC) < 200 < 400 <600 <800 < 1 500 < 3 000 < 5 000 < 8 0000000 0.4 0.8 1.7 2.1 5.0 11.3 22.2 33.5
0030 0.8 1.2 1.2 1.7 4.2 12.1 23.3 33.8
0100 0.4 0.8 1.6 2.0 4.0 11.7 23.1 34.8
0130 0.4 0.8 1.7 2.5 5.0 12.0 24.0 34.7
0200 1.2 2.1 2.5 2.9 5.8 14.0 23.5 34.2
0230 1.2 1.7 2.1 2.5 5.0 14.2 24.2 35.0
0300 1.6 1.6 1.6 2.8 6.5 14.2 24.7 35.6
0330 2.0 2.4 3.7 4.5 7.7 14.6 26.0 36.2
0400 2.0 3.2 4.9 5.7 8.9 16.2 23.5 34.8
0430 1.6 2.0 2.4 3.6 7.7 15.8 24.3 34.8
0500 1.6 2.8 3.2 4.0 7.5 15.9 25.4 34.9
0530 1.2 2.4 2.8 4.7 7.1 17.0 28.5 35.2
0600 0.4 3.0 3.4 3.8 8.1 19.5 29.7 35.6
0630 0.4 2.1 2.9 4.5 8.7 19.4 27.7 35.5
0700 0.0 1.6 2.4 4.5 8.9 21.5 27.9 37.7
0730 0.4 1.6 2.4 4.0 10.1 21.1 28.3 35.6
0800 0.4 1.2 2.0 3.2 7.7 18.2 29.6 35.6
0830 0.8 1.6 1.6 2.4 7.3 17.5 28.0 37.4
0900 0.0 1.3 1.3 2.5 4.2 14.2 26.4 34.7
0930 0.0 0.0 0.8 1.2 3.6 13.3 24.6 33.9
1000 0.0 0.0 0.0 0.8 3.2 13.2 24.0 30.4
1030 0.0 0.0 0.0 0.8 2.5 9.8 18.4 27.9
1100 0.0 0.0 0.8 0.8 2.8 8.8 18.4 27.2
1130 0.0 0.0 0.0 0.4 2.4 7.2 18.5 26.5
1200 0.0 0.0 0.0 0.4 2.9 6.6 18.7 27.0
1230 0.0 0.0 0.0 0.0 2.1 5.4 15.8 23.8
1300 0.4 0.4 0.4 0.4 1.6 6.0 15.7 24.2
1330 0.0 0.0 0.0 0.4 1.2 4.9 13.0 21.5
1400 0.0 0.0 0.0 0.4 2.0 4.8 12.9 20.9
1430 0.0 0.0 0.4 0.4 1.6 5.6 12.1 19.0
1500 0.0 0.0 0.4 0.8 2.4 7.2 12.0 17.9
1530 0.0 0.0 0.4 0.8 2.5 7.8 11.9 18.9
1600 0.0 0.0 0.4 1.2 2.0 8.4 12.7 19.9
1630 0.0 0.0 0.0 0.4 2.0 6.1 13.0 20.6
1700 0.0 0.0 0.0 0.8 2.0 5.6 12.0 21.6
1730 0.0 0.0 0.4 0.8 1.6 5.7 13.4 23.9
1800 0.4 0.4 0.8 0.8 1.7 9.3 15.7 25.8
1830 0.0 0.0 0.4 0.4 1.2 7.6 17.7 24.9
1900 0.0 0.0 0.0 0.4 2.4 8.8 18.4 25.2
1930 0.0 0.0 0.0 0.4 3.6 10.4 19.7 26.1
2000 0.0 0.0 0.0 0.4 3.2 10.5 19.0 26.2
2030 0.4 0.4 0.4 1.2 5.3 10.9 20.6 28.7
2100 0.4 0.4 0.4 1.2 3.6 11.2 18.5 28.1
2130 0.0 0.0 0.0 0.8 4.1 11.1 20.6 30.5
2200 0.0 0.0 0.0 0.4 4.1 11.4 21.5 31.3
2230 0.0 0.4 0.8 1.2 4.1 12.3 23.4 32.8
2300 0.0 0.4 0.8 0.8 4.5 10.6 22.4 31.8
2330 0.0 0.4 0.4 0.8 2.8 10.9 23.4 32.3
MEAN 0.4 0.8 1.1 1.7 4.3 11.5 20.8 29.6
Remarks
PERIOD OF RECORD: 2005 - 2013
VISIBILITY
ELEVATION ABOVE MSL: 650 ft
FREQUENCIES (%) OF VISIBILITY BELOW SPECIFIED VALUES (m) AT SPECIFIED TIMES
Cases when a certa in phenomenon is not occurred and frequency i s 0 are shaded white
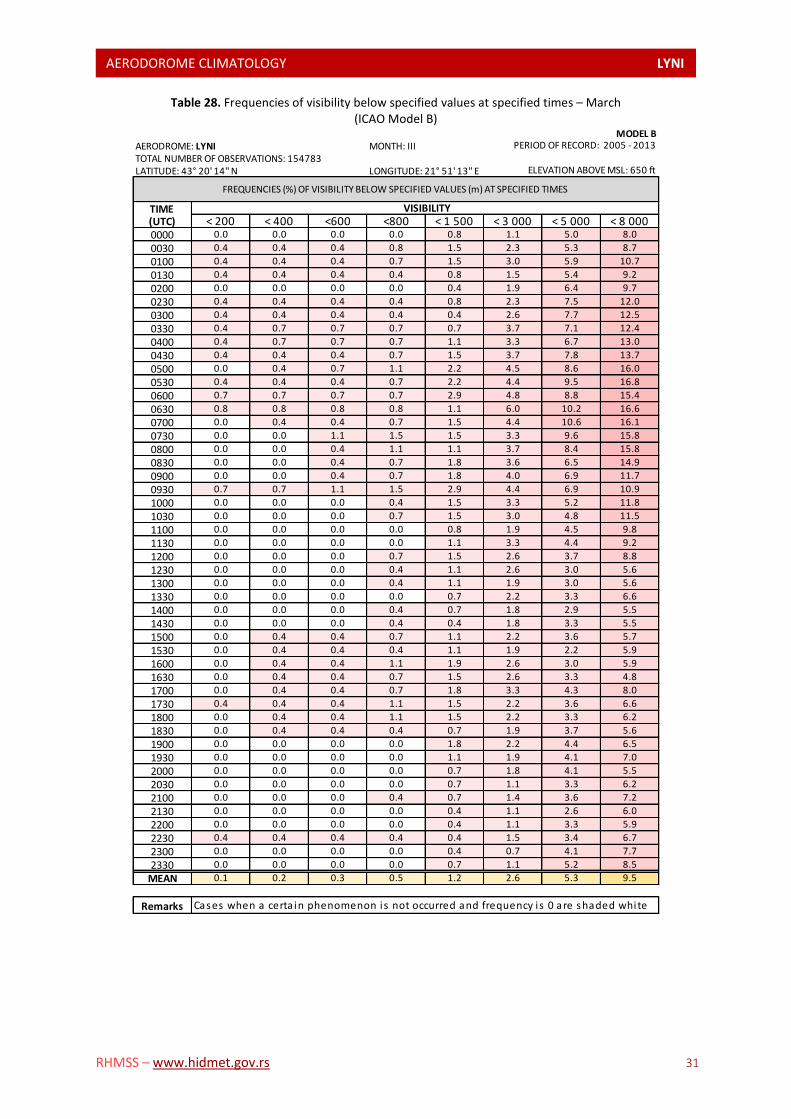
AERODOROME CLIMATOLOGY LYNI L
RHMSS – www.hidmet.gov.rs 31
Table 28. Frequencies of visibility below specified values at specified times – March (ICAO Model B)
MODEL BAERODROME: LYNI MONTH: IIITOTAL NUMBER OF OBSERVATIONS: 154783LATITUDE: 43° 20' 14'' N LONGITUDE: 21° 51' 13'' E
TIME(UTC) < 200 < 400 <600 <800 < 1 500 < 3 000 < 5 000 < 8 0000000 0.0 0.0 0.0 0.0 0.8 1.1 5.0 8.0
0030 0.4 0.4 0.4 0.8 1.5 2.3 5.3 8.7
0100 0.4 0.4 0.4 0.7 1.5 3.0 5.9 10.7
0130 0.4 0.4 0.4 0.4 0.8 1.5 5.4 9.2
0200 0.0 0.0 0.0 0.0 0.4 1.9 6.4 9.7
0230 0.4 0.4 0.4 0.4 0.8 2.3 7.5 12.0
0300 0.4 0.4 0.4 0.4 0.4 2.6 7.7 12.5
0330 0.4 0.7 0.7 0.7 0.7 3.7 7.1 12.4
0400 0.4 0.7 0.7 0.7 1.1 3.3 6.7 13.0
0430 0.4 0.4 0.4 0.7 1.5 3.7 7.8 13.7
0500 0.0 0.4 0.7 1.1 2.2 4.5 8.6 16.0
0530 0.4 0.4 0.4 0.7 2.2 4.4 9.5 16.8
0600 0.7 0.7 0.7 0.7 2.9 4.8 8.8 15.4
0630 0.8 0.8 0.8 0.8 1.1 6.0 10.2 16.6
0700 0.0 0.4 0.4 0.7 1.5 4.4 10.6 16.1
0730 0.0 0.0 1.1 1.5 1.5 3.3 9.6 15.8
0800 0.0 0.0 0.4 1.1 1.1 3.7 8.4 15.8
0830 0.0 0.0 0.4 0.7 1.8 3.6 6.5 14.9
0900 0.0 0.0 0.4 0.7 1.8 4.0 6.9 11.7
0930 0.7 0.7 1.1 1.5 2.9 4.4 6.9 10.9
1000 0.0 0.0 0.0 0.4 1.5 3.3 5.2 11.8
1030 0.0 0.0 0.0 0.7 1.5 3.0 4.8 11.5
1100 0.0 0.0 0.0 0.0 0.8 1.9 4.5 9.8
1130 0.0 0.0 0.0 0.0 1.1 3.3 4.4 9.2
1200 0.0 0.0 0.0 0.7 1.5 2.6 3.7 8.8
1230 0.0 0.0 0.0 0.4 1.1 2.6 3.0 5.6
1300 0.0 0.0 0.0 0.4 1.1 1.9 3.0 5.6
1330 0.0 0.0 0.0 0.0 0.7 2.2 3.3 6.6
1400 0.0 0.0 0.0 0.4 0.7 1.8 2.9 5.5
1430 0.0 0.0 0.0 0.4 0.4 1.8 3.3 5.5
1500 0.0 0.4 0.4 0.7 1.1 2.2 3.6 5.7
1530 0.0 0.4 0.4 0.4 1.1 1.9 2.2 5.9
1600 0.0 0.4 0.4 1.1 1.9 2.6 3.0 5.9
1630 0.0 0.4 0.4 0.7 1.5 2.6 3.3 4.8
1700 0.0 0.4 0.4 0.7 1.8 3.3 4.3 8.0
1730 0.4 0.4 0.4 1.1 1.5 2.2 3.6 6.6
1800 0.0 0.4 0.4 1.1 1.5 2.2 3.3 6.2
1830 0.0 0.4 0.4 0.4 0.7 1.9 3.7 5.6
1900 0.0 0.0 0.0 0.0 1.8 2.2 4.4 6.5
1930 0.0 0.0 0.0 0.0 1.1 1.9 4.1 7.0
2000 0.0 0.0 0.0 0.0 0.7 1.8 4.1 5.5
2030 0.0 0.0 0.0 0.0 0.7 1.1 3.3 6.2
2100 0.0 0.0 0.0 0.4 0.7 1.4 3.6 7.2
2130 0.0 0.0 0.0 0.0 0.4 1.1 2.6 6.0
2200 0.0 0.0 0.0 0.0 0.4 1.1 3.3 5.9
2230 0.4 0.4 0.4 0.4 0.4 1.5 3.4 6.7
2300 0.0 0.0 0.0 0.0 0.4 0.7 4.1 7.7
2330 0.0 0.0 0.0 0.0 0.7 1.1 5.2 8.5
MEAN 0.1 0.2 0.3 0.5 1.2 2.6 5.3 9.5
Remarks
PERIOD OF RECORD: 2005 - 2013
VISIBILITY
ELEVATION ABOVE MSL: 650 ft
FREQUENCIES (%) OF VISIBILITY BELOW SPECIFIED VALUES (m) AT SPECIFIED TIMES
Cases when a certa in phenomenon is not occurred and frequency i s 0 are shaded white
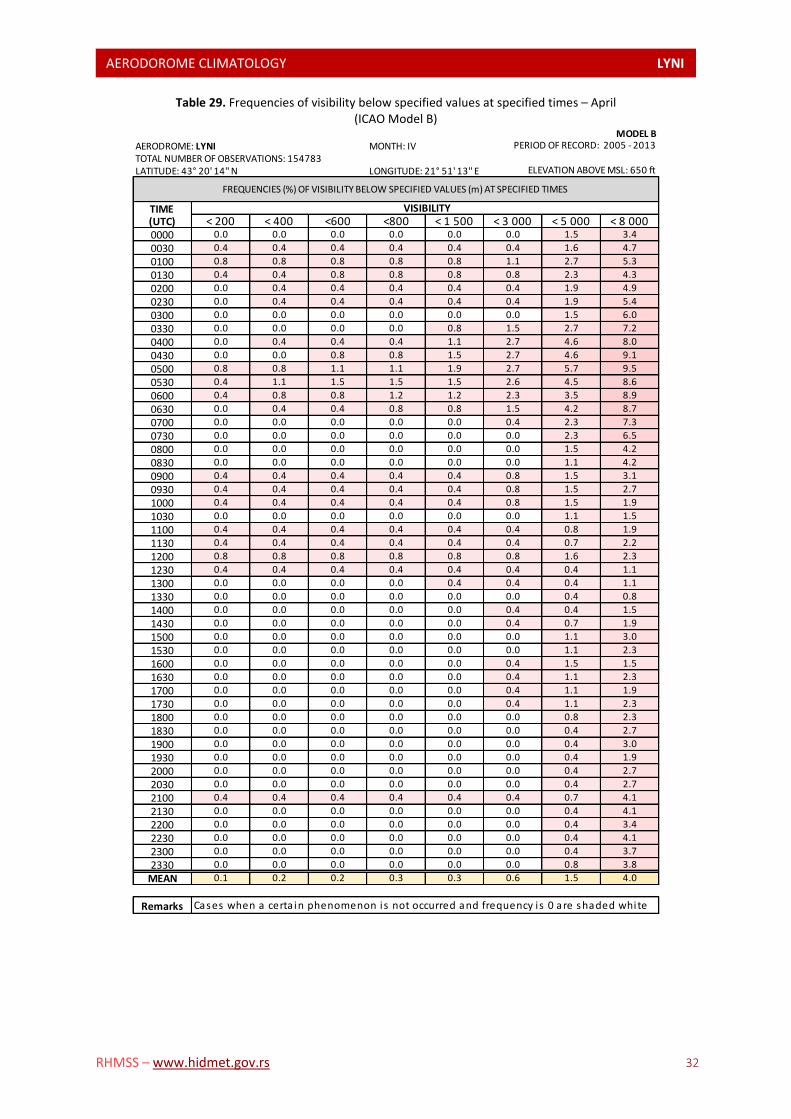
AERODOROME CLIMATOLOGY LYNI L
RHMSS – www.hidmet.gov.rs 32
Table 29. Frequencies of visibility below specified values at specified times – April (ICAO Model B)
MODEL BAERODROME: LYNI MONTH: IVTOTAL NUMBER OF OBSERVATIONS: 154783LATITUDE: 43° 20' 14'' N LONGITUDE: 21° 51' 13'' E
TIME(UTC) < 200 < 400 <600 <800 < 1 500 < 3 000 < 5 000 < 8 0000000 0.0 0.0 0.0 0.0 0.0 0.0 1.5 3.4
0030 0.4 0.4 0.4 0.4 0.4 0.4 1.6 4.7
0100 0.8 0.8 0.8 0.8 0.8 1.1 2.7 5.3
0130 0.4 0.4 0.8 0.8 0.8 0.8 2.3 4.3
0200 0.0 0.4 0.4 0.4 0.4 0.4 1.9 4.9
0230 0.0 0.4 0.4 0.4 0.4 0.4 1.9 5.4
0300 0.0 0.0 0.0 0.0 0.0 0.0 1.5 6.0
0330 0.0 0.0 0.0 0.0 0.8 1.5 2.7 7.2
0400 0.0 0.4 0.4 0.4 1.1 2.7 4.6 8.0
0430 0.0 0.0 0.8 0.8 1.5 2.7 4.6 9.1
0500 0.8 0.8 1.1 1.1 1.9 2.7 5.7 9.5
0530 0.4 1.1 1.5 1.5 1.5 2.6 4.5 8.6
0600 0.4 0.8 0.8 1.2 1.2 2.3 3.5 8.9
0630 0.0 0.4 0.4 0.8 0.8 1.5 4.2 8.7
0700 0.0 0.0 0.0 0.0 0.0 0.4 2.3 7.3
0730 0.0 0.0 0.0 0.0 0.0 0.0 2.3 6.5
0800 0.0 0.0 0.0 0.0 0.0 0.0 1.5 4.2
0830 0.0 0.0 0.0 0.0 0.0 0.0 1.1 4.2
0900 0.4 0.4 0.4 0.4 0.4 0.8 1.5 3.1
0930 0.4 0.4 0.4 0.4 0.4 0.8 1.5 2.7
1000 0.4 0.4 0.4 0.4 0.4 0.8 1.5 1.9
1030 0.0 0.0 0.0 0.0 0.0 0.0 1.1 1.5
1100 0.4 0.4 0.4 0.4 0.4 0.4 0.8 1.9
1130 0.4 0.4 0.4 0.4 0.4 0.4 0.7 2.2
1200 0.8 0.8 0.8 0.8 0.8 0.8 1.6 2.3
1230 0.4 0.4 0.4 0.4 0.4 0.4 0.4 1.1
1300 0.0 0.0 0.0 0.0 0.4 0.4 0.4 1.1
1330 0.0 0.0 0.0 0.0 0.0 0.0 0.4 0.8
1400 0.0 0.0 0.0 0.0 0.0 0.4 0.4 1.5
1430 0.0 0.0 0.0 0.0 0.0 0.4 0.7 1.9
1500 0.0 0.0 0.0 0.0 0.0 0.0 1.1 3.0
1530 0.0 0.0 0.0 0.0 0.0 0.0 1.1 2.3
1600 0.0 0.0 0.0 0.0 0.0 0.4 1.5 1.5
1630 0.0 0.0 0.0 0.0 0.0 0.4 1.1 2.3
1700 0.0 0.0 0.0 0.0 0.0 0.4 1.1 1.9
1730 0.0 0.0 0.0 0.0 0.0 0.4 1.1 2.3
1800 0.0 0.0 0.0 0.0 0.0 0.0 0.8 2.3
1830 0.0 0.0 0.0 0.0 0.0 0.0 0.4 2.7
1900 0.0 0.0 0.0 0.0 0.0 0.0 0.4 3.0
1930 0.0 0.0 0.0 0.0 0.0 0.0 0.4 1.9
2000 0.0 0.0 0.0 0.0 0.0 0.0 0.4 2.7
2030 0.0 0.0 0.0 0.0 0.0 0.0 0.4 2.7
2100 0.4 0.4 0.4 0.4 0.4 0.4 0.7 4.1
2130 0.0 0.0 0.0 0.0 0.0 0.0 0.4 4.1
2200 0.0 0.0 0.0 0.0 0.0 0.0 0.4 3.4
2230 0.0 0.0 0.0 0.0 0.0 0.0 0.4 4.1
2300 0.0 0.0 0.0 0.0 0.0 0.0 0.4 3.7
2330 0.0 0.0 0.0 0.0 0.0 0.0 0.8 3.8
MEAN 0.1 0.2 0.2 0.3 0.3 0.6 1.5 4.0
Remarks
PERIOD OF RECORD: 2005 - 2013
VISIBILITY
ELEVATION ABOVE MSL: 650 ft
FREQUENCIES (%) OF VISIBILITY BELOW SPECIFIED VALUES (m) AT SPECIFIED TIMES
Cases when a certa in phenomenon is not occurred and frequency i s 0 are shaded white
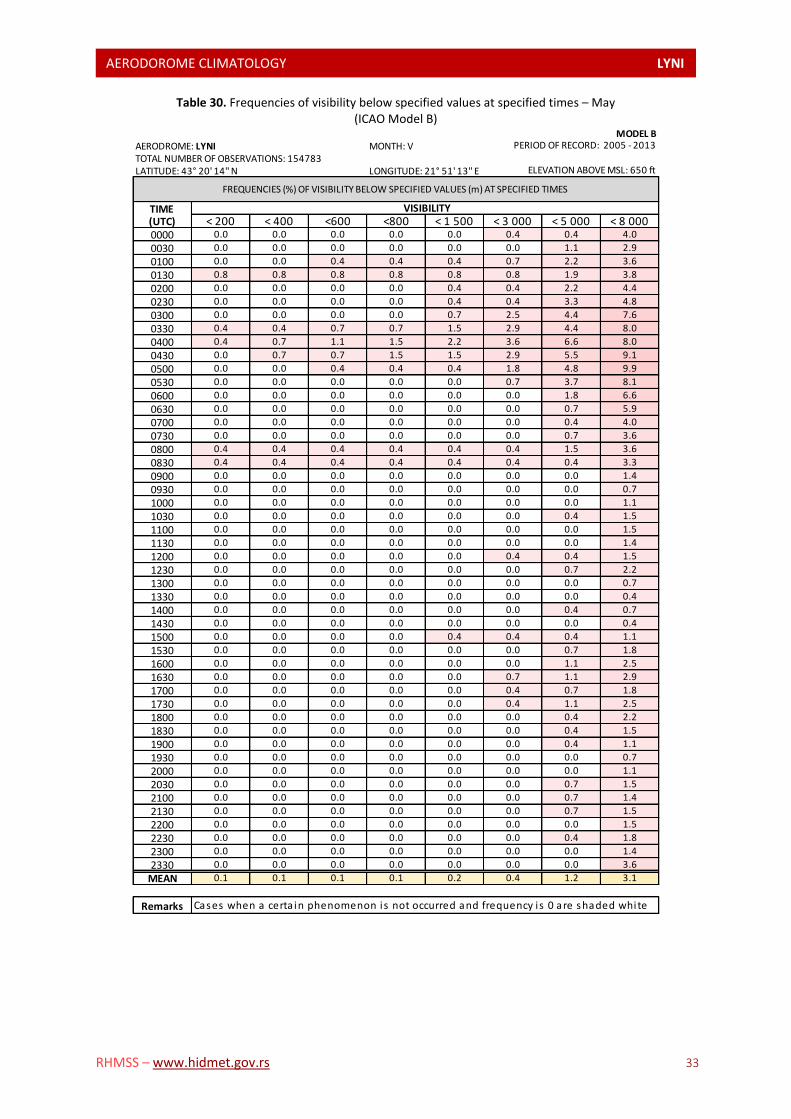
AERODOROME CLIMATOLOGY LYNI L
RHMSS – www.hidmet.gov.rs 33
Table 30. Frequencies of visibility below specified values at specified times – May (ICAO Model B)
MODEL BAERODROME: LYNI MONTH: VTOTAL NUMBER OF OBSERVATIONS: 154783LATITUDE: 43° 20' 14'' N LONGITUDE: 21° 51' 13'' E
TIME(UTC) < 200 < 400 <600 <800 < 1 500 < 3 000 < 5 000 < 8 0000000 0.0 0.0 0.0 0.0 0.0 0.4 0.4 4.0
0030 0.0 0.0 0.0 0.0 0.0 0.0 1.1 2.9
0100 0.0 0.0 0.4 0.4 0.4 0.7 2.2 3.6
0130 0.8 0.8 0.8 0.8 0.8 0.8 1.9 3.8
0200 0.0 0.0 0.0 0.0 0.4 0.4 2.2 4.4
0230 0.0 0.0 0.0 0.0 0.4 0.4 3.3 4.8
0300 0.0 0.0 0.0 0.0 0.7 2.5 4.4 7.6
0330 0.4 0.4 0.7 0.7 1.5 2.9 4.4 8.0
0400 0.4 0.7 1.1 1.5 2.2 3.6 6.6 8.0
0430 0.0 0.7 0.7 1.5 1.5 2.9 5.5 9.1
0500 0.0 0.0 0.4 0.4 0.4 1.8 4.8 9.9
0530 0.0 0.0 0.0 0.0 0.0 0.7 3.7 8.1
0600 0.0 0.0 0.0 0.0 0.0 0.0 1.8 6.6
0630 0.0 0.0 0.0 0.0 0.0 0.0 0.7 5.9
0700 0.0 0.0 0.0 0.0 0.0 0.0 0.4 4.0
0730 0.0 0.0 0.0 0.0 0.0 0.0 0.7 3.6
0800 0.4 0.4 0.4 0.4 0.4 0.4 1.5 3.6
0830 0.4 0.4 0.4 0.4 0.4 0.4 0.4 3.3
0900 0.0 0.0 0.0 0.0 0.0 0.0 0.0 1.4
0930 0.0 0.0 0.0 0.0 0.0 0.0 0.0 0.7
1000 0.0 0.0 0.0 0.0 0.0 0.0 0.0 1.1
1030 0.0 0.0 0.0 0.0 0.0 0.0 0.4 1.5
1100 0.0 0.0 0.0 0.0 0.0 0.0 0.0 1.5
1130 0.0 0.0 0.0 0.0 0.0 0.0 0.0 1.4
1200 0.0 0.0 0.0 0.0 0.0 0.4 0.4 1.5
1230 0.0 0.0 0.0 0.0 0.0 0.0 0.7 2.2
1300 0.0 0.0 0.0 0.0 0.0 0.0 0.0 0.7
1330 0.0 0.0 0.0 0.0 0.0 0.0 0.0 0.4
1400 0.0 0.0 0.0 0.0 0.0 0.0 0.4 0.7
1430 0.0 0.0 0.0 0.0 0.0 0.0 0.0 0.4
1500 0.0 0.0 0.0 0.0 0.4 0.4 0.4 1.1
1530 0.0 0.0 0.0 0.0 0.0 0.0 0.7 1.8
1600 0.0 0.0 0.0 0.0 0.0 0.0 1.1 2.5
1630 0.0 0.0 0.0 0.0 0.0 0.7 1.1 2.9
1700 0.0 0.0 0.0 0.0 0.0 0.4 0.7 1.8
1730 0.0 0.0 0.0 0.0 0.0 0.4 1.1 2.5
1800 0.0 0.0 0.0 0.0 0.0 0.0 0.4 2.2
1830 0.0 0.0 0.0 0.0 0.0 0.0 0.4 1.5
1900 0.0 0.0 0.0 0.0 0.0 0.0 0.4 1.1
1930 0.0 0.0 0.0 0.0 0.0 0.0 0.0 0.7
2000 0.0 0.0 0.0 0.0 0.0 0.0 0.0 1.1
2030 0.0 0.0 0.0 0.0 0.0 0.0 0.7 1.5
2100 0.0 0.0 0.0 0.0 0.0 0.0 0.7 1.4
2130 0.0 0.0 0.0 0.0 0.0 0.0 0.7 1.5
2200 0.0 0.0 0.0 0.0 0.0 0.0 0.0 1.5
2230 0.0 0.0 0.0 0.0 0.0 0.0 0.4 1.8
2300 0.0 0.0 0.0 0.0 0.0 0.0 0.0 1.4
2330 0.0 0.0 0.0 0.0 0.0 0.0 0.0 3.6
MEAN 0.1 0.1 0.1 0.1 0.2 0.4 1.2 3.1
Remarks
PERIOD OF RECORD: 2005 - 2013
VISIBILITY
ELEVATION ABOVE MSL: 650 ft
FREQUENCIES (%) OF VISIBILITY BELOW SPECIFIED VALUES (m) AT SPECIFIED TIMES
Cases when a certa in phenomenon is not occurred and frequency i s 0 are shaded white
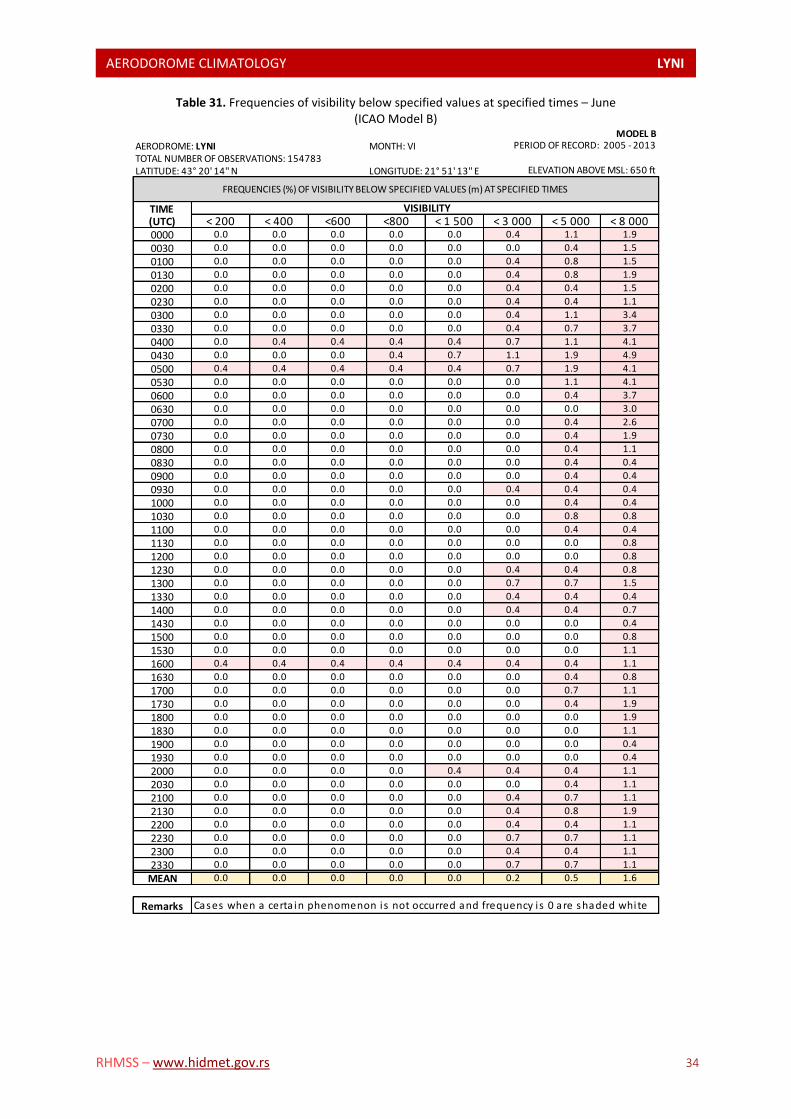
AERODOROME CLIMATOLOGY LYNI L
RHMSS – www.hidmet.gov.rs 34
Table 31. Frequencies of visibility below specified values at specified times – June (ICAO Model B)
MODEL BAERODROME: LYNI MONTH: VITOTAL NUMBER OF OBSERVATIONS: 154783LATITUDE: 43° 20' 14'' N LONGITUDE: 21° 51' 13'' E
TIME(UTC) < 200 < 400 <600 <800 < 1 500 < 3 000 < 5 000 < 8 0000000 0.0 0.0 0.0 0.0 0.0 0.4 1.1 1.9
0030 0.0 0.0 0.0 0.0 0.0 0.0 0.4 1.5
0100 0.0 0.0 0.0 0.0 0.0 0.4 0.8 1.5
0130 0.0 0.0 0.0 0.0 0.0 0.4 0.8 1.9
0200 0.0 0.0 0.0 0.0 0.0 0.4 0.4 1.5
0230 0.0 0.0 0.0 0.0 0.0 0.4 0.4 1.1
0300 0.0 0.0 0.0 0.0 0.0 0.4 1.1 3.4
0330 0.0 0.0 0.0 0.0 0.0 0.4 0.7 3.7
0400 0.0 0.4 0.4 0.4 0.4 0.7 1.1 4.1
0430 0.0 0.0 0.0 0.4 0.7 1.1 1.9 4.9
0500 0.4 0.4 0.4 0.4 0.4 0.7 1.9 4.1
0530 0.0 0.0 0.0 0.0 0.0 0.0 1.1 4.1
0600 0.0 0.0 0.0 0.0 0.0 0.0 0.4 3.7
0630 0.0 0.0 0.0 0.0 0.0 0.0 0.0 3.0
0700 0.0 0.0 0.0 0.0 0.0 0.0 0.4 2.6
0730 0.0 0.0 0.0 0.0 0.0 0.0 0.4 1.9
0800 0.0 0.0 0.0 0.0 0.0 0.0 0.4 1.1
0830 0.0 0.0 0.0 0.0 0.0 0.0 0.4 0.4
0900 0.0 0.0 0.0 0.0 0.0 0.0 0.4 0.4
0930 0.0 0.0 0.0 0.0 0.0 0.4 0.4 0.4
1000 0.0 0.0 0.0 0.0 0.0 0.0 0.4 0.4
1030 0.0 0.0 0.0 0.0 0.0 0.0 0.8 0.8
1100 0.0 0.0 0.0 0.0 0.0 0.0 0.4 0.4
1130 0.0 0.0 0.0 0.0 0.0 0.0 0.0 0.8
1200 0.0 0.0 0.0 0.0 0.0 0.0 0.0 0.8
1230 0.0 0.0 0.0 0.0 0.0 0.4 0.4 0.8
1300 0.0 0.0 0.0 0.0 0.0 0.7 0.7 1.5
1330 0.0 0.0 0.0 0.0 0.0 0.4 0.4 0.4
1400 0.0 0.0 0.0 0.0 0.0 0.4 0.4 0.7
1430 0.0 0.0 0.0 0.0 0.0 0.0 0.0 0.4
1500 0.0 0.0 0.0 0.0 0.0 0.0 0.0 0.8
1530 0.0 0.0 0.0 0.0 0.0 0.0 0.0 1.1
1600 0.4 0.4 0.4 0.4 0.4 0.4 0.4 1.1
1630 0.0 0.0 0.0 0.0 0.0 0.0 0.4 0.8
1700 0.0 0.0 0.0 0.0 0.0 0.0 0.7 1.1
1730 0.0 0.0 0.0 0.0 0.0 0.0 0.4 1.9
1800 0.0 0.0 0.0 0.0 0.0 0.0 0.0 1.9
1830 0.0 0.0 0.0 0.0 0.0 0.0 0.0 1.1
1900 0.0 0.0 0.0 0.0 0.0 0.0 0.0 0.4
1930 0.0 0.0 0.0 0.0 0.0 0.0 0.0 0.4
2000 0.0 0.0 0.0 0.0 0.4 0.4 0.4 1.1
2030 0.0 0.0 0.0 0.0 0.0 0.0 0.4 1.1
2100 0.0 0.0 0.0 0.0 0.0 0.4 0.7 1.1
2130 0.0 0.0 0.0 0.0 0.0 0.4 0.8 1.9
2200 0.0 0.0 0.0 0.0 0.0 0.4 0.4 1.1
2230 0.0 0.0 0.0 0.0 0.0 0.7 0.7 1.1
2300 0.0 0.0 0.0 0.0 0.0 0.4 0.4 1.1
2330 0.0 0.0 0.0 0.0 0.0 0.7 0.7 1.1
MEAN 0.0 0.0 0.0 0.0 0.0 0.2 0.5 1.6
Remarks
PERIOD OF RECORD: 2005 - 2013
VISIBILITY
ELEVATION ABOVE MSL: 650 ft
FREQUENCIES (%) OF VISIBILITY BELOW SPECIFIED VALUES (m) AT SPECIFIED TIMES
Cases when a certa in phenomenon is not occurred and frequency i s 0 are shaded white

AERODOROME CLIMATOLOGY LYNI L
RHMSS – www.hidmet.gov.rs 35
Table 32. Frequencies of visibility below specified values at specified times – July (ICAO Model B)
MODEL BAERODROME: LYNI MONTH: VIITOTAL NUMBER OF OBSERVATIONS: 154783LATITUDE: 43° 20' 14'' N LONGITUDE: 21° 51' 13'' E
TIME(UTC) < 200 < 400 <600 <800 < 1 500 < 3 000 < 5 000 < 8 0000000 0.4 0.4 0.4 0.4 0.4 0.4 0.4 1.8
0030 0.4 0.4 0.4 0.4 0.4 0.4 0.4 2.6
0100 0.4 0.4 0.4 0.4 0.4 0.4 0.4 3.6
0130 0.4 0.4 0.4 0.4 0.4 0.7 1.5 3.3
0200 0.4 0.4 0.4 0.4 0.4 0.7 1.5 3.7
0230 0.7 0.7 0.7 0.7 0.7 1.1 1.8 6.2
0300 0.4 0.4 0.4 0.4 0.4 1.1 2.5 7.3
0330 0.0 0.0 0.0 0.4 0.4 0.7 2.9 7.2
0400 0.4 0.7 1.4 1.4 1.4 1.4 4.3 8.7
0430 0.0 0.0 0.7 0.7 1.4 1.8 4.7 9.4
0500 0.0 0.4 0.7 0.7 0.7 1.8 2.9 9.0
0530 0.0 0.4 0.4 0.4 0.4 1.4 2.9 7.6
0600 0.0 0.4 0.4 0.4 0.7 1.4 3.3 6.9
0630 0.0 0.0 0.0 0.7 0.7 1.1 2.2 5.8
0700 0.0 0.0 0.0 0.0 0.0 0.0 1.8 4.7
0730 0.4 0.4 0.4 0.4 0.4 0.7 1.4 3.6
0800 0.7 0.7 0.7 0.7 0.7 0.7 0.7 2.2
0830 0.0 0.0 0.0 0.0 0.0 0.0 0.4 1.1
0900 0.0 0.0 0.0 0.0 0.7 0.7 0.7 1.8
0930 0.0 0.0 0.0 0.0 0.4 0.4 0.4 1.1
1000 0.0 0.0 0.0 0.0 0.4 0.4 0.4 1.5
1030 0.0 0.0 0.0 0.0 0.4 0.4 0.7 1.1
1100 0.0 0.0 0.0 0.0 0.0 0.0 0.0 0.4
1130 0.0 0.0 0.0 0.0 0.0 0.0 0.0 0.4
1200 0.0 0.0 0.0 0.0 0.0 0.0 0.0 0.4
1230 0.4 0.4 0.4 0.4 0.4 0.4 0.4 0.7
1300 0.0 0.0 0.0 0.0 0.0 0.0 0.0 0.4
1330 0.0 0.0 0.0 0.0 0.0 0.4 0.4 0.7
1400 0.0 0.0 0.0 0.0 0.0 0.0 0.0 0.0
1430 0.0 0.0 0.0 0.0 0.0 0.0 0.4 0.4
1500 0.0 0.0 0.0 0.0 0.0 0.0 0.0 1.1
1530 0.0 0.0 0.0 0.0 0.0 0.0 0.0 0.7
1600 0.0 0.0 0.0 0.0 0.0 0.0 0.7 0.7
1630 0.0 0.0 0.0 0.0 0.0 0.0 0.7 1.1
1700 0.0 0.0 0.0 0.0 0.0 0.0 0.7 0.7
1730 0.0 0.0 0.0 0.0 0.0 0.0 0.7 0.7
1800 0.0 0.0 0.0 0.0 0.0 0.0 0.4 0.7
1830 0.0 0.0 0.0 0.0 0.0 0.0 0.4 1.1
1900 0.4 0.4 0.4 0.4 0.4 0.4 0.7 1.4
1930 0.0 0.0 0.0 0.0 0.0 0.0 0.4 1.1
2000 0.0 0.0 0.0 0.0 0.0 0.0 0.4 0.7
2030 0.0 0.0 0.0 0.0 0.0 0.0 0.4 0.4
2100 0.0 0.0 0.0 0.0 0.0 0.0 0.4 0.7
2130 0.0 0.0 0.0 0.0 0.0 0.0 0.4 0.4
2200 0.0 0.0 0.0 0.0 0.0 0.0 0.4 0.4
2230 0.0 0.0 0.0 0.0 0.0 0.0 0.0 0.7
2300 0.0 0.0 0.0 0.0 0.0 0.0 0.0 1.1
2330 0.0 0.0 0.0 0.0 0.0 0.0 0.0 0.4
MEAN 0.1 0.1 0.2 0.2 0.3 0.4 1.0 2.5
Remarks
PERIOD OF RECORD: 2005 - 2013
VISIBILITY
ELEVATION ABOVE MSL: 650 ft
FREQUENCIES (%) OF VISIBILITY BELOW SPECIFIED VALUES (m) AT SPECIFIED TIMES
Cases when a certa in phenomenon is not occurred and frequency i s 0 are shaded white
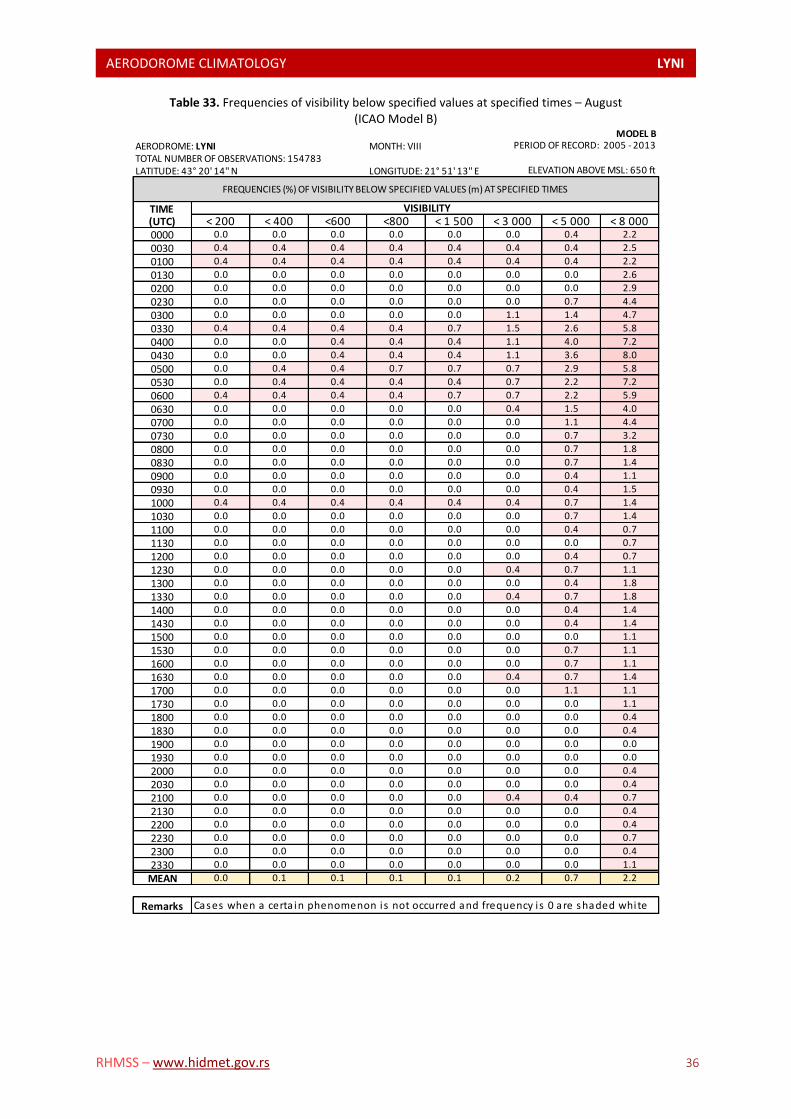
AERODOROME CLIMATOLOGY LYNI L
RHMSS – www.hidmet.gov.rs 36
Table 33. Frequencies of visibility below specified values at specified times – August (ICAO Model B)
MODEL BAERODROME: LYNI MONTH: VIIITOTAL NUMBER OF OBSERVATIONS: 154783LATITUDE: 43° 20' 14'' N LONGITUDE: 21° 51' 13'' E
TIME(UTC) < 200 < 400 <600 <800 < 1 500 < 3 000 < 5 000 < 8 0000000 0.0 0.0 0.0 0.0 0.0 0.0 0.4 2.2
0030 0.4 0.4 0.4 0.4 0.4 0.4 0.4 2.5
0100 0.4 0.4 0.4 0.4 0.4 0.4 0.4 2.2
0130 0.0 0.0 0.0 0.0 0.0 0.0 0.0 2.6
0200 0.0 0.0 0.0 0.0 0.0 0.0 0.0 2.9
0230 0.0 0.0 0.0 0.0 0.0 0.0 0.7 4.4
0300 0.0 0.0 0.0 0.0 0.0 1.1 1.4 4.7
0330 0.4 0.4 0.4 0.4 0.7 1.5 2.6 5.8
0400 0.0 0.0 0.4 0.4 0.4 1.1 4.0 7.2
0430 0.0 0.0 0.4 0.4 0.4 1.1 3.6 8.0
0500 0.0 0.4 0.4 0.7 0.7 0.7 2.9 5.8
0530 0.0 0.4 0.4 0.4 0.4 0.7 2.2 7.2
0600 0.4 0.4 0.4 0.4 0.7 0.7 2.2 5.9
0630 0.0 0.0 0.0 0.0 0.0 0.4 1.5 4.0
0700 0.0 0.0 0.0 0.0 0.0 0.0 1.1 4.4
0730 0.0 0.0 0.0 0.0 0.0 0.0 0.7 3.2
0800 0.0 0.0 0.0 0.0 0.0 0.0 0.7 1.8
0830 0.0 0.0 0.0 0.0 0.0 0.0 0.7 1.4
0900 0.0 0.0 0.0 0.0 0.0 0.0 0.4 1.1
0930 0.0 0.0 0.0 0.0 0.0 0.0 0.4 1.5
1000 0.4 0.4 0.4 0.4 0.4 0.4 0.7 1.4
1030 0.0 0.0 0.0 0.0 0.0 0.0 0.7 1.4
1100 0.0 0.0 0.0 0.0 0.0 0.0 0.4 0.7
1130 0.0 0.0 0.0 0.0 0.0 0.0 0.0 0.7
1200 0.0 0.0 0.0 0.0 0.0 0.0 0.4 0.7
1230 0.0 0.0 0.0 0.0 0.0 0.4 0.7 1.1
1300 0.0 0.0 0.0 0.0 0.0 0.0 0.4 1.8
1330 0.0 0.0 0.0 0.0 0.0 0.4 0.7 1.8
1400 0.0 0.0 0.0 0.0 0.0 0.0 0.4 1.4
1430 0.0 0.0 0.0 0.0 0.0 0.0 0.4 1.4
1500 0.0 0.0 0.0 0.0 0.0 0.0 0.0 1.1
1530 0.0 0.0 0.0 0.0 0.0 0.0 0.7 1.1
1600 0.0 0.0 0.0 0.0 0.0 0.0 0.7 1.1
1630 0.0 0.0 0.0 0.0 0.0 0.4 0.7 1.4
1700 0.0 0.0 0.0 0.0 0.0 0.0 1.1 1.1
1730 0.0 0.0 0.0 0.0 0.0 0.0 0.0 1.1
1800 0.0 0.0 0.0 0.0 0.0 0.0 0.0 0.4
1830 0.0 0.0 0.0 0.0 0.0 0.0 0.0 0.4
1900 0.0 0.0 0.0 0.0 0.0 0.0 0.0 0.0
1930 0.0 0.0 0.0 0.0 0.0 0.0 0.0 0.0
2000 0.0 0.0 0.0 0.0 0.0 0.0 0.0 0.4
2030 0.0 0.0 0.0 0.0 0.0 0.0 0.0 0.4
2100 0.0 0.0 0.0 0.0 0.0 0.4 0.4 0.7
2130 0.0 0.0 0.0 0.0 0.0 0.0 0.0 0.4
2200 0.0 0.0 0.0 0.0 0.0 0.0 0.0 0.4
2230 0.0 0.0 0.0 0.0 0.0 0.0 0.0 0.7
2300 0.0 0.0 0.0 0.0 0.0 0.0 0.0 0.4
2330 0.0 0.0 0.0 0.0 0.0 0.0 0.0 1.1
MEAN 0.0 0.1 0.1 0.1 0.1 0.2 0.7 2.2
Remarks
PERIOD OF RECORD: 2005 - 2013
VISIBILITY
ELEVATION ABOVE MSL: 650 ft
FREQUENCIES (%) OF VISIBILITY BELOW SPECIFIED VALUES (m) AT SPECIFIED TIMES
Cases when a certa in phenomenon is not occurred and frequency i s 0 are shaded white
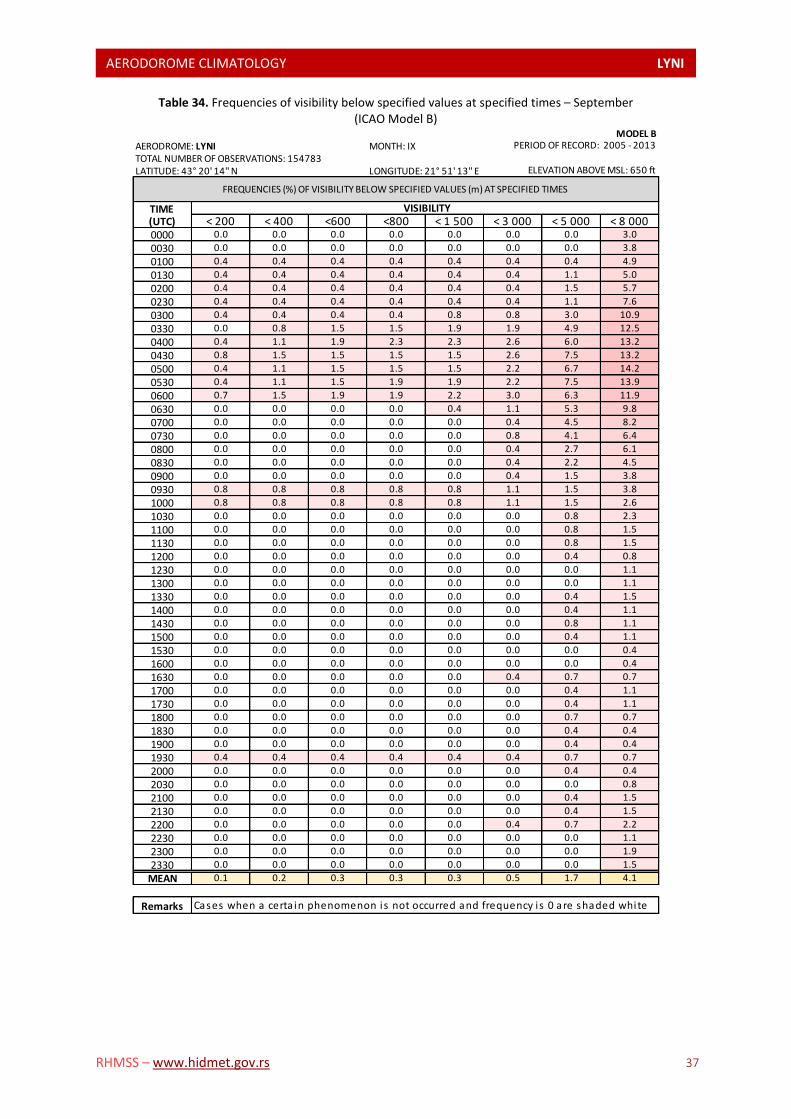
AERODOROME CLIMATOLOGY LYNI L
RHMSS – www.hidmet.gov.rs 37
Table 34. Frequencies of visibility below specified values at specified times – September (ICAO Model B)
MODEL BAERODROME: LYNI MONTH: IXTOTAL NUMBER OF OBSERVATIONS: 154783LATITUDE: 43° 20' 14'' N LONGITUDE: 21° 51' 13'' E
TIME(UTC) < 200 < 400 <600 <800 < 1 500 < 3 000 < 5 000 < 8 0000000 0.0 0.0 0.0 0.0 0.0 0.0 0.0 3.0
0030 0.0 0.0 0.0 0.0 0.0 0.0 0.0 3.8
0100 0.4 0.4 0.4 0.4 0.4 0.4 0.4 4.9
0130 0.4 0.4 0.4 0.4 0.4 0.4 1.1 5.0
0200 0.4 0.4 0.4 0.4 0.4 0.4 1.5 5.7
0230 0.4 0.4 0.4 0.4 0.4 0.4 1.1 7.6
0300 0.4 0.4 0.4 0.4 0.8 0.8 3.0 10.9
0330 0.0 0.8 1.5 1.5 1.9 1.9 4.9 12.5
0400 0.4 1.1 1.9 2.3 2.3 2.6 6.0 13.2
0430 0.8 1.5 1.5 1.5 1.5 2.6 7.5 13.2
0500 0.4 1.1 1.5 1.5 1.5 2.2 6.7 14.2
0530 0.4 1.1 1.5 1.9 1.9 2.2 7.5 13.9
0600 0.7 1.5 1.9 1.9 2.2 3.0 6.3 11.9
0630 0.0 0.0 0.0 0.0 0.4 1.1 5.3 9.8
0700 0.0 0.0 0.0 0.0 0.0 0.4 4.5 8.2
0730 0.0 0.0 0.0 0.0 0.0 0.8 4.1 6.4
0800 0.0 0.0 0.0 0.0 0.0 0.4 2.7 6.1
0830 0.0 0.0 0.0 0.0 0.0 0.4 2.2 4.5
0900 0.0 0.0 0.0 0.0 0.0 0.4 1.5 3.8
0930 0.8 0.8 0.8 0.8 0.8 1.1 1.5 3.8
1000 0.8 0.8 0.8 0.8 0.8 1.1 1.5 2.6
1030 0.0 0.0 0.0 0.0 0.0 0.0 0.8 2.3
1100 0.0 0.0 0.0 0.0 0.0 0.0 0.8 1.5
1130 0.0 0.0 0.0 0.0 0.0 0.0 0.8 1.5
1200 0.0 0.0 0.0 0.0 0.0 0.0 0.4 0.8
1230 0.0 0.0 0.0 0.0 0.0 0.0 0.0 1.1
1300 0.0 0.0 0.0 0.0 0.0 0.0 0.0 1.1
1330 0.0 0.0 0.0 0.0 0.0 0.0 0.4 1.5
1400 0.0 0.0 0.0 0.0 0.0 0.0 0.4 1.1
1430 0.0 0.0 0.0 0.0 0.0 0.0 0.8 1.1
1500 0.0 0.0 0.0 0.0 0.0 0.0 0.4 1.1
1530 0.0 0.0 0.0 0.0 0.0 0.0 0.0 0.4
1600 0.0 0.0 0.0 0.0 0.0 0.0 0.0 0.4
1630 0.0 0.0 0.0 0.0 0.0 0.4 0.7 0.7
1700 0.0 0.0 0.0 0.0 0.0 0.0 0.4 1.1
1730 0.0 0.0 0.0 0.0 0.0 0.0 0.4 1.1
1800 0.0 0.0 0.0 0.0 0.0 0.0 0.7 0.7
1830 0.0 0.0 0.0 0.0 0.0 0.0 0.4 0.4
1900 0.0 0.0 0.0 0.0 0.0 0.0 0.4 0.4
1930 0.4 0.4 0.4 0.4 0.4 0.4 0.7 0.7
2000 0.0 0.0 0.0 0.0 0.0 0.0 0.4 0.4
2030 0.0 0.0 0.0 0.0 0.0 0.0 0.0 0.8
2100 0.0 0.0 0.0 0.0 0.0 0.0 0.4 1.5
2130 0.0 0.0 0.0 0.0 0.0 0.0 0.4 1.5
2200 0.0 0.0 0.0 0.0 0.0 0.4 0.7 2.2
2230 0.0 0.0 0.0 0.0 0.0 0.0 0.0 1.1
2300 0.0 0.0 0.0 0.0 0.0 0.0 0.0 1.9
2330 0.0 0.0 0.0 0.0 0.0 0.0 0.0 1.5
MEAN 0.1 0.2 0.3 0.3 0.3 0.5 1.7 4.1
Remarks
PERIOD OF RECORD: 2005 - 2013
VISIBILITY
ELEVATION ABOVE MSL: 650 ft
FREQUENCIES (%) OF VISIBILITY BELOW SPECIFIED VALUES (m) AT SPECIFIED TIMES
Cases when a certa in phenomenon is not occurred and frequency i s 0 are shaded white
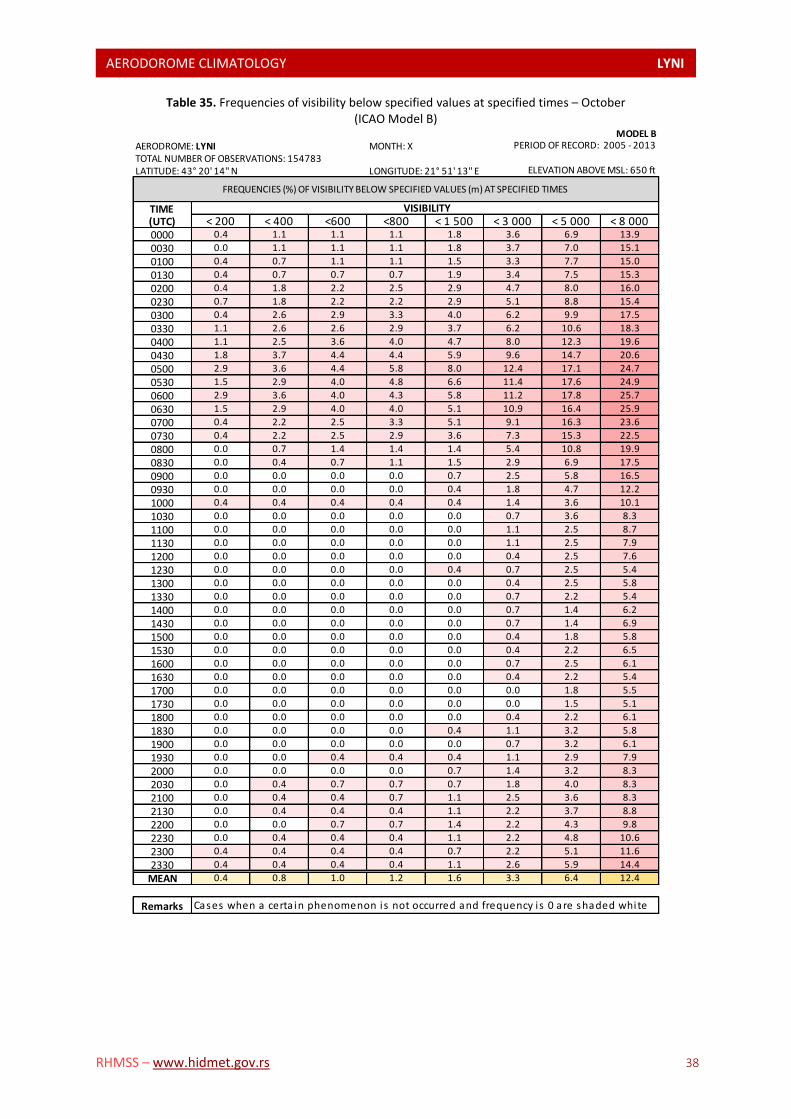
AERODOROME CLIMATOLOGY LYNI L
RHMSS – www.hidmet.gov.rs 38
Table 35. Frequencies of visibility below specified values at specified times – October (ICAO Model B)
MODEL BAERODROME: LYNI MONTH: XTOTAL NUMBER OF OBSERVATIONS: 154783LATITUDE: 43° 20' 14'' N LONGITUDE: 21° 51' 13'' E
TIME(UTC) < 200 < 400 <600 <800 < 1 500 < 3 000 < 5 000 < 8 0000000 0.4 1.1 1.1 1.1 1.8 3.6 6.9 13.9
0030 0.0 1.1 1.1 1.1 1.8 3.7 7.0 15.1
0100 0.4 0.7 1.1 1.1 1.5 3.3 7.7 15.0
0130 0.4 0.7 0.7 0.7 1.9 3.4 7.5 15.3
0200 0.4 1.8 2.2 2.5 2.9 4.7 8.0 16.0
0230 0.7 1.8 2.2 2.2 2.9 5.1 8.8 15.4
0300 0.4 2.6 2.9 3.3 4.0 6.2 9.9 17.5
0330 1.1 2.6 2.6 2.9 3.7 6.2 10.6 18.3
0400 1.1 2.5 3.6 4.0 4.7 8.0 12.3 19.6
0430 1.8 3.7 4.4 4.4 5.9 9.6 14.7 20.6
0500 2.9 3.6 4.4 5.8 8.0 12.4 17.1 24.7
0530 1.5 2.9 4.0 4.8 6.6 11.4 17.6 24.9
0600 2.9 3.6 4.0 4.3 5.8 11.2 17.8 25.7
0630 1.5 2.9 4.0 4.0 5.1 10.9 16.4 25.9
0700 0.4 2.2 2.5 3.3 5.1 9.1 16.3 23.6
0730 0.4 2.2 2.5 2.9 3.6 7.3 15.3 22.5
0800 0.0 0.7 1.4 1.4 1.4 5.4 10.8 19.9
0830 0.0 0.4 0.7 1.1 1.5 2.9 6.9 17.5
0900 0.0 0.0 0.0 0.0 0.7 2.5 5.8 16.5
0930 0.0 0.0 0.0 0.0 0.4 1.8 4.7 12.2
1000 0.4 0.4 0.4 0.4 0.4 1.4 3.6 10.1
1030 0.0 0.0 0.0 0.0 0.0 0.7 3.6 8.3
1100 0.0 0.0 0.0 0.0 0.0 1.1 2.5 8.7
1130 0.0 0.0 0.0 0.0 0.0 1.1 2.5 7.9
1200 0.0 0.0 0.0 0.0 0.0 0.4 2.5 7.6
1230 0.0 0.0 0.0 0.0 0.4 0.7 2.5 5.4
1300 0.0 0.0 0.0 0.0 0.0 0.4 2.5 5.8
1330 0.0 0.0 0.0 0.0 0.0 0.7 2.2 5.4
1400 0.0 0.0 0.0 0.0 0.0 0.7 1.4 6.2
1430 0.0 0.0 0.0 0.0 0.0 0.7 1.4 6.9
1500 0.0 0.0 0.0 0.0 0.0 0.4 1.8 5.8
1530 0.0 0.0 0.0 0.0 0.0 0.4 2.2 6.5
1600 0.0 0.0 0.0 0.0 0.0 0.7 2.5 6.1
1630 0.0 0.0 0.0 0.0 0.0 0.4 2.2 5.4
1700 0.0 0.0 0.0 0.0 0.0 0.0 1.8 5.5
1730 0.0 0.0 0.0 0.0 0.0 0.0 1.5 5.1
1800 0.0 0.0 0.0 0.0 0.0 0.4 2.2 6.1
1830 0.0 0.0 0.0 0.0 0.4 1.1 3.2 5.8
1900 0.0 0.0 0.0 0.0 0.0 0.7 3.2 6.1
1930 0.0 0.0 0.4 0.4 0.4 1.1 2.9 7.9
2000 0.0 0.0 0.0 0.0 0.7 1.4 3.2 8.3
2030 0.0 0.4 0.7 0.7 0.7 1.8 4.0 8.3
2100 0.0 0.4 0.4 0.7 1.1 2.5 3.6 8.3
2130 0.0 0.4 0.4 0.4 1.1 2.2 3.7 8.8
2200 0.0 0.0 0.7 0.7 1.4 2.2 4.3 9.8
2230 0.0 0.4 0.4 0.4 1.1 2.2 4.8 10.6
2300 0.4 0.4 0.4 0.4 0.7 2.2 5.1 11.6
2330 0.4 0.4 0.4 0.4 1.1 2.6 5.9 14.4
MEAN 0.4 0.8 1.0 1.2 1.6 3.3 6.4 12.4
Remarks
PERIOD OF RECORD: 2005 - 2013
VISIBILITY
ELEVATION ABOVE MSL: 650 ft
FREQUENCIES (%) OF VISIBILITY BELOW SPECIFIED VALUES (m) AT SPECIFIED TIMES
Cases when a certa in phenomenon is not occurred and frequency i s 0 are shaded white
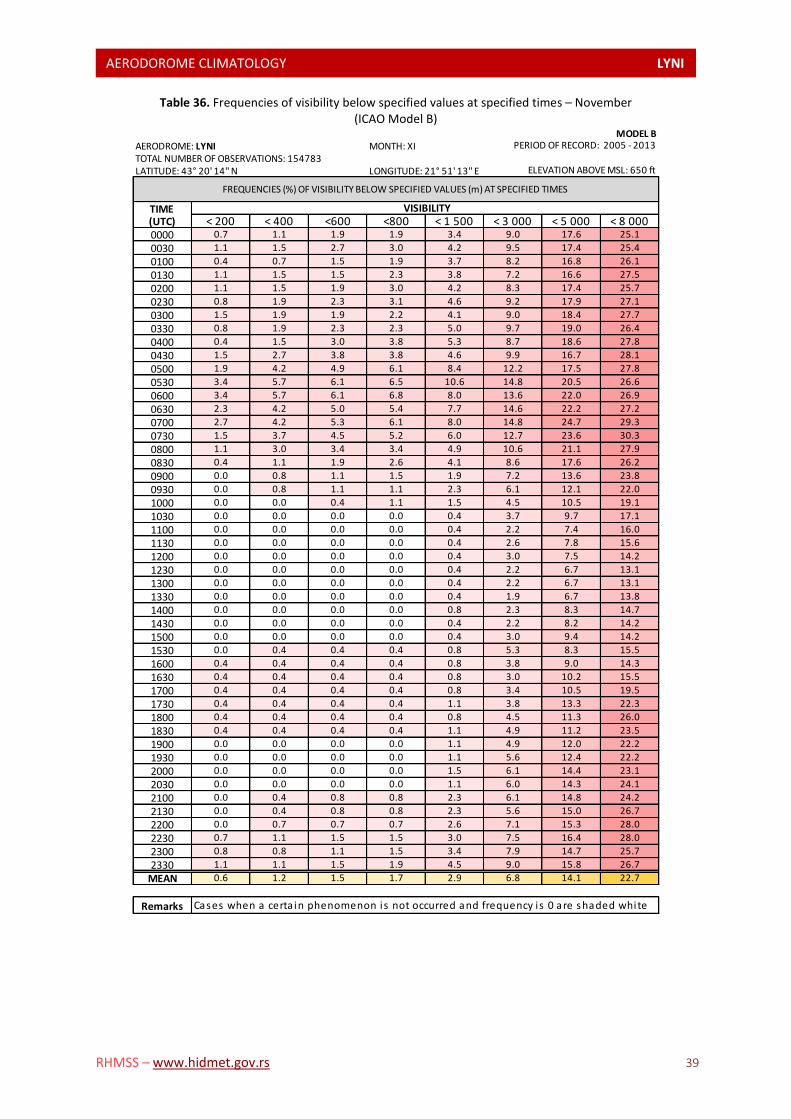
AERODOROME CLIMATOLOGY LYNI L
RHMSS – www.hidmet.gov.rs 39
Table 36. Frequencies of visibility below specified values at specified times – November (ICAO Model B)
MODEL BAERODROME: LYNI MONTH: XITOTAL NUMBER OF OBSERVATIONS: 154783LATITUDE: 43° 20' 14'' N LONGITUDE: 21° 51' 13'' E
TIME(UTC) < 200 < 400 <600 <800 < 1 500 < 3 000 < 5 000 < 8 0000000 0.7 1.1 1.9 1.9 3.4 9.0 17.6 25.1
0030 1.1 1.5 2.7 3.0 4.2 9.5 17.4 25.4
0100 0.4 0.7 1.5 1.9 3.7 8.2 16.8 26.1
0130 1.1 1.5 1.5 2.3 3.8 7.2 16.6 27.5
0200 1.1 1.5 1.9 3.0 4.2 8.3 17.4 25.7
0230 0.8 1.9 2.3 3.1 4.6 9.2 17.9 27.1
0300 1.5 1.9 1.9 2.2 4.1 9.0 18.4 27.7
0330 0.8 1.9 2.3 2.3 5.0 9.7 19.0 26.4
0400 0.4 1.5 3.0 3.8 5.3 8.7 18.6 27.8
0430 1.5 2.7 3.8 3.8 4.6 9.9 16.7 28.1
0500 1.9 4.2 4.9 6.1 8.4 12.2 17.5 27.8
0530 3.4 5.7 6.1 6.5 10.6 14.8 20.5 26.6
0600 3.4 5.7 6.1 6.8 8.0 13.6 22.0 26.9
0630 2.3 4.2 5.0 5.4 7.7 14.6 22.2 27.2
0700 2.7 4.2 5.3 6.1 8.0 14.8 24.7 29.3
0730 1.5 3.7 4.5 5.2 6.0 12.7 23.6 30.3
0800 1.1 3.0 3.4 3.4 4.9 10.6 21.1 27.9
0830 0.4 1.1 1.9 2.6 4.1 8.6 17.6 26.2
0900 0.0 0.8 1.1 1.5 1.9 7.2 13.6 23.8
0930 0.0 0.8 1.1 1.1 2.3 6.1 12.1 22.0
1000 0.0 0.0 0.4 1.1 1.5 4.5 10.5 19.1
1030 0.0 0.0 0.0 0.0 0.4 3.7 9.7 17.1
1100 0.0 0.0 0.0 0.0 0.4 2.2 7.4 16.0
1130 0.0 0.0 0.0 0.0 0.4 2.6 7.8 15.6
1200 0.0 0.0 0.0 0.0 0.4 3.0 7.5 14.2
1230 0.0 0.0 0.0 0.0 0.4 2.2 6.7 13.1
1300 0.0 0.0 0.0 0.0 0.4 2.2 6.7 13.1
1330 0.0 0.0 0.0 0.0 0.4 1.9 6.7 13.8
1400 0.0 0.0 0.0 0.0 0.8 2.3 8.3 14.7
1430 0.0 0.0 0.0 0.0 0.4 2.2 8.2 14.2
1500 0.0 0.0 0.0 0.0 0.4 3.0 9.4 14.2
1530 0.0 0.4 0.4 0.4 0.8 5.3 8.3 15.5
1600 0.4 0.4 0.4 0.4 0.8 3.8 9.0 14.3
1630 0.4 0.4 0.4 0.4 0.8 3.0 10.2 15.5
1700 0.4 0.4 0.4 0.4 0.8 3.4 10.5 19.5
1730 0.4 0.4 0.4 0.4 1.1 3.8 13.3 22.3
1800 0.4 0.4 0.4 0.4 0.8 4.5 11.3 26.0
1830 0.4 0.4 0.4 0.4 1.1 4.9 11.2 23.5
1900 0.0 0.0 0.0 0.0 1.1 4.9 12.0 22.2
1930 0.0 0.0 0.0 0.0 1.1 5.6 12.4 22.2
2000 0.0 0.0 0.0 0.0 1.5 6.1 14.4 23.1
2030 0.0 0.0 0.0 0.0 1.1 6.0 14.3 24.1
2100 0.0 0.4 0.8 0.8 2.3 6.1 14.8 24.2
2130 0.0 0.4 0.8 0.8 2.3 5.6 15.0 26.7
2200 0.0 0.7 0.7 0.7 2.6 7.1 15.3 28.0
2230 0.7 1.1 1.5 1.5 3.0 7.5 16.4 28.0
2300 0.8 0.8 1.1 1.5 3.4 7.9 14.7 25.7
2330 1.1 1.1 1.5 1.9 4.5 9.0 15.8 26.7
MEAN 0.6 1.2 1.5 1.7 2.9 6.8 14.1 22.7
Remarks
PERIOD OF RECORD: 2005 - 2013
VISIBILITY
ELEVATION ABOVE MSL: 650 ft
FREQUENCIES (%) OF VISIBILITY BELOW SPECIFIED VALUES (m) AT SPECIFIED TIMES
Cases when a certa in phenomenon is not occurred and frequency i s 0 are shaded white
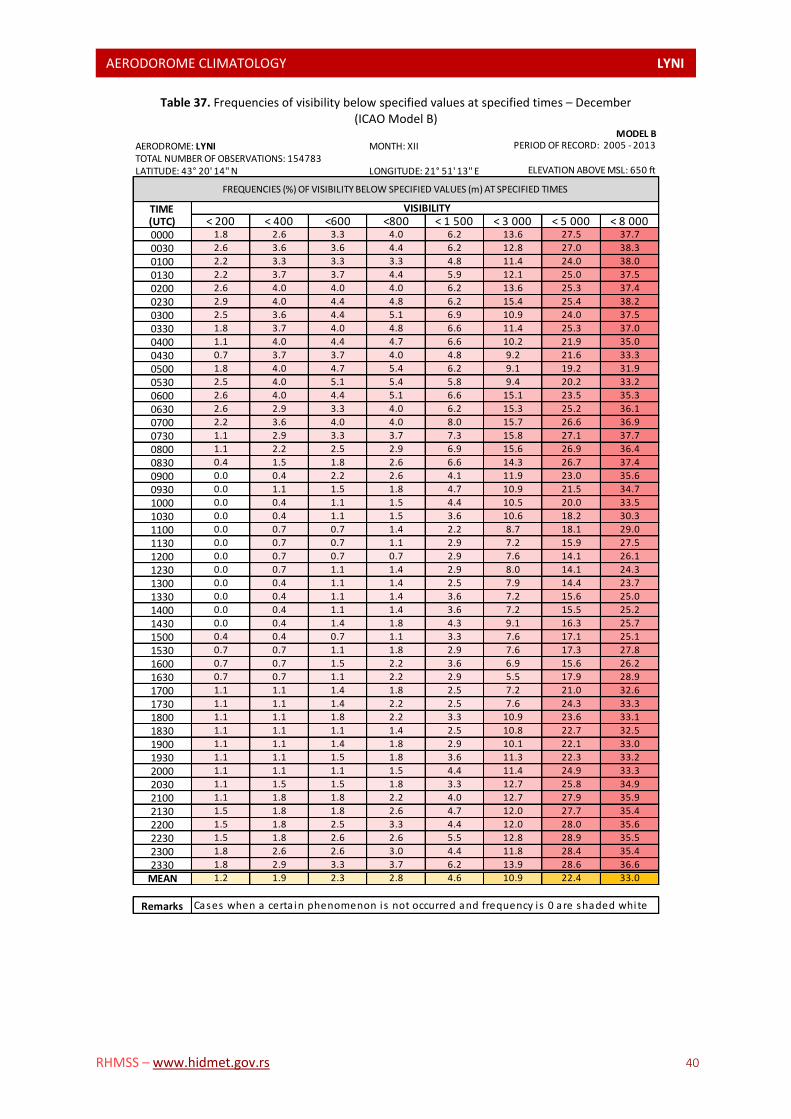
AERODOROME CLIMATOLOGY LYNI L
RHMSS – www.hidmet.gov.rs 40
Table 37. Frequencies of visibility below specified values at specified times – December (ICAO Model B)
MODEL BAERODROME: LYNI MONTH: XIITOTAL NUMBER OF OBSERVATIONS: 154783LATITUDE: 43° 20' 14'' N LONGITUDE: 21° 51' 13'' E
TIME(UTC) < 200 < 400 <600 <800 < 1 500 < 3 000 < 5 000 < 8 0000000 1.8 2.6 3.3 4.0 6.2 13.6 27.5 37.7
0030 2.6 3.6 3.6 4.4 6.2 12.8 27.0 38.3
0100 2.2 3.3 3.3 3.3 4.8 11.4 24.0 38.0
0130 2.2 3.7 3.7 4.4 5.9 12.1 25.0 37.5
0200 2.6 4.0 4.0 4.0 6.2 13.6 25.3 37.4
0230 2.9 4.0 4.4 4.8 6.2 15.4 25.4 38.2
0300 2.5 3.6 4.4 5.1 6.9 10.9 24.0 37.5
0330 1.8 3.7 4.0 4.8 6.6 11.4 25.3 37.0
0400 1.1 4.0 4.4 4.7 6.6 10.2 21.9 35.0
0430 0.7 3.7 3.7 4.0 4.8 9.2 21.6 33.3
0500 1.8 4.0 4.7 5.4 6.2 9.1 19.2 31.9
0530 2.5 4.0 5.1 5.4 5.8 9.4 20.2 33.2
0600 2.6 4.0 4.4 5.1 6.6 15.1 23.5 35.3
0630 2.6 2.9 3.3 4.0 6.2 15.3 25.2 36.1
0700 2.2 3.6 4.0 4.0 8.0 15.7 26.6 36.9
0730 1.1 2.9 3.3 3.7 7.3 15.8 27.1 37.7
0800 1.1 2.2 2.5 2.9 6.9 15.6 26.9 36.4
0830 0.4 1.5 1.8 2.6 6.6 14.3 26.7 37.4
0900 0.0 0.4 2.2 2.6 4.1 11.9 23.0 35.6
0930 0.0 1.1 1.5 1.8 4.7 10.9 21.5 34.7
1000 0.0 0.4 1.1 1.5 4.4 10.5 20.0 33.5
1030 0.0 0.4 1.1 1.5 3.6 10.6 18.2 30.3
1100 0.0 0.7 0.7 1.4 2.2 8.7 18.1 29.0
1130 0.0 0.7 0.7 1.1 2.9 7.2 15.9 27.5
1200 0.0 0.7 0.7 0.7 2.9 7.6 14.1 26.1
1230 0.0 0.7 1.1 1.4 2.9 8.0 14.1 24.3
1300 0.0 0.4 1.1 1.4 2.5 7.9 14.4 23.7
1330 0.0 0.4 1.1 1.4 3.6 7.2 15.6 25.0
1400 0.0 0.4 1.1 1.4 3.6 7.2 15.5 25.2
1430 0.0 0.4 1.4 1.8 4.3 9.1 16.3 25.7
1500 0.4 0.4 0.7 1.1 3.3 7.6 17.1 25.1
1530 0.7 0.7 1.1 1.8 2.9 7.6 17.3 27.8
1600 0.7 0.7 1.5 2.2 3.6 6.9 15.6 26.2
1630 0.7 0.7 1.1 2.2 2.9 5.5 17.9 28.9
1700 1.1 1.1 1.4 1.8 2.5 7.2 21.0 32.6
1730 1.1 1.1 1.4 2.2 2.5 7.6 24.3 33.3
1800 1.1 1.1 1.8 2.2 3.3 10.9 23.6 33.1
1830 1.1 1.1 1.1 1.4 2.5 10.8 22.7 32.5
1900 1.1 1.1 1.4 1.8 2.9 10.1 22.1 33.0
1930 1.1 1.1 1.5 1.8 3.6 11.3 22.3 33.2
2000 1.1 1.1 1.1 1.5 4.4 11.4 24.9 33.3
2030 1.1 1.5 1.5 1.8 3.3 12.7 25.8 34.9
2100 1.1 1.8 1.8 2.2 4.0 12.7 27.9 35.9
2130 1.5 1.8 1.8 2.6 4.7 12.0 27.7 35.4
2200 1.5 1.8 2.5 3.3 4.4 12.0 28.0 35.6
2230 1.5 1.8 2.6 2.6 5.5 12.8 28.9 35.5
2300 1.8 2.6 2.6 3.0 4.4 11.8 28.4 35.4
2330 1.8 2.9 3.3 3.7 6.2 13.9 28.6 36.6
MEAN 1.2 1.9 2.3 2.8 4.6 10.9 22.4 33.0
Remarks
PERIOD OF RECORD: 2005 - 2013
VISIBILITY
ELEVATION ABOVE MSL: 650 ft
FREQUENCIES (%) OF VISIBILITY BELOW SPECIFIED VALUES (m) AT SPECIFIED TIMES
Cases when a certa in phenomenon is not occurred and frequency i s 0 are shaded white

AERODOROME CLIMATOLOGY LYNI L
RHMSS – www.hidmet.gov.rs 41
Table 38. Frequencies of visibility < 200 m (based on ICAO Model B)
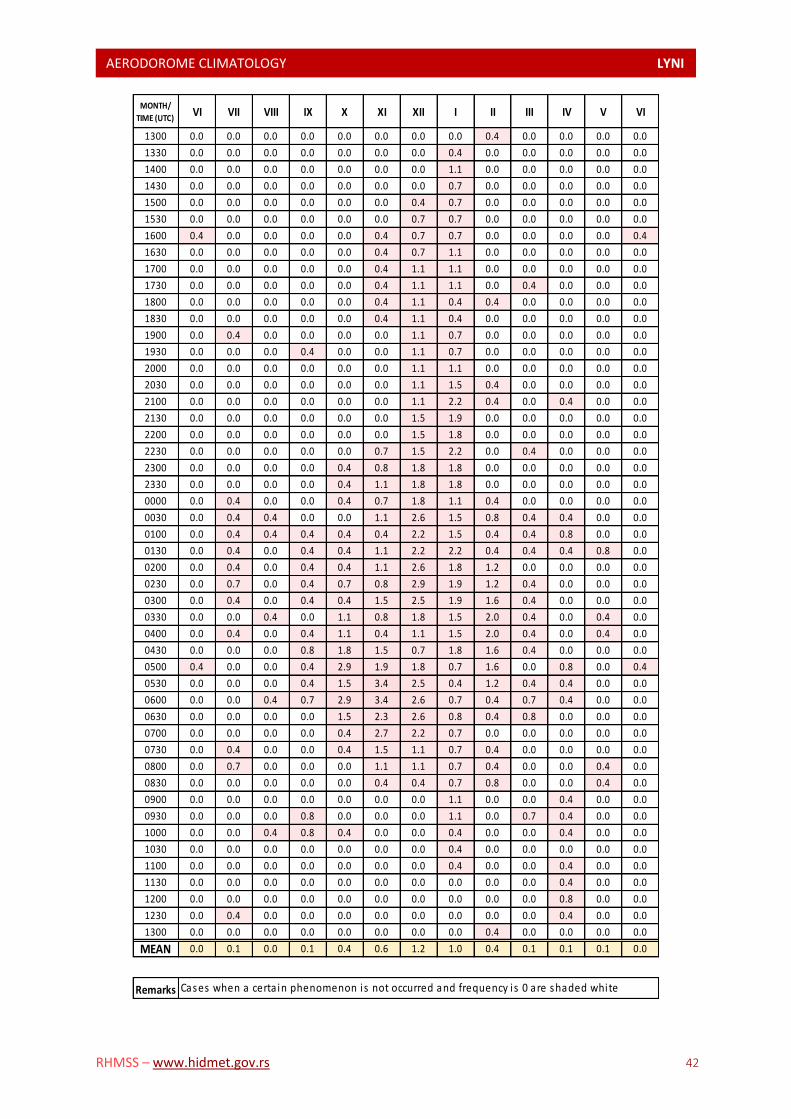
AERODOROME CLIMATOLOGY LYNI L
RHMSS – www.hidmet.gov.rs 42
MONTH/
TIME (UTC)VI VII VIII IX X XI XII I II III IV V VI
1300 0.0 0.0 0.0 0.0 0.0 0.0 0.0 0.0 0.4 0.0 0.0 0.0 0.0
1330 0.0 0.0 0.0 0.0 0.0 0.0 0.0 0.4 0.0 0.0 0.0 0.0 0.0
1400 0.0 0.0 0.0 0.0 0.0 0.0 0.0 1.1 0.0 0.0 0.0 0.0 0.0
1430 0.0 0.0 0.0 0.0 0.0 0.0 0.0 0.7 0.0 0.0 0.0 0.0 0.0
1500 0.0 0.0 0.0 0.0 0.0 0.0 0.4 0.7 0.0 0.0 0.0 0.0 0.0
1530 0.0 0.0 0.0 0.0 0.0 0.0 0.7 0.7 0.0 0.0 0.0 0.0 0.0
1600 0.4 0.0 0.0 0.0 0.0 0.4 0.7 0.7 0.0 0.0 0.0 0.0 0.4
1630 0.0 0.0 0.0 0.0 0.0 0.4 0.7 1.1 0.0 0.0 0.0 0.0 0.0
1700 0.0 0.0 0.0 0.0 0.0 0.4 1.1 1.1 0.0 0.0 0.0 0.0 0.0
1730 0.0 0.0 0.0 0.0 0.0 0.4 1.1 1.1 0.0 0.4 0.0 0.0 0.0
1800 0.0 0.0 0.0 0.0 0.0 0.4 1.1 0.4 0.4 0.0 0.0 0.0 0.0
1830 0.0 0.0 0.0 0.0 0.0 0.4 1.1 0.4 0.0 0.0 0.0 0.0 0.0
1900 0.0 0.4 0.0 0.0 0.0 0.0 1.1 0.7 0.0 0.0 0.0 0.0 0.0
1930 0.0 0.0 0.0 0.4 0.0 0.0 1.1 0.7 0.0 0.0 0.0 0.0 0.0
2000 0.0 0.0 0.0 0.0 0.0 0.0 1.1 1.1 0.0 0.0 0.0 0.0 0.0
2030 0.0 0.0 0.0 0.0 0.0 0.0 1.1 1.5 0.4 0.0 0.0 0.0 0.0
2100 0.0 0.0 0.0 0.0 0.0 0.0 1.1 2.2 0.4 0.0 0.4 0.0 0.0
2130 0.0 0.0 0.0 0.0 0.0 0.0 1.5 1.9 0.0 0.0 0.0 0.0 0.0
2200 0.0 0.0 0.0 0.0 0.0 0.0 1.5 1.8 0.0 0.0 0.0 0.0 0.0
2230 0.0 0.0 0.0 0.0 0.0 0.7 1.5 2.2 0.0 0.4 0.0 0.0 0.0
2300 0.0 0.0 0.0 0.0 0.4 0.8 1.8 1.8 0.0 0.0 0.0 0.0 0.0
2330 0.0 0.0 0.0 0.0 0.4 1.1 1.8 1.8 0.0 0.0 0.0 0.0 0.0
0000 0.0 0.4 0.0 0.0 0.4 0.7 1.8 1.1 0.4 0.0 0.0 0.0 0.0
0030 0.0 0.4 0.4 0.0 0.0 1.1 2.6 1.5 0.8 0.4 0.4 0.0 0.0
0100 0.0 0.4 0.4 0.4 0.4 0.4 2.2 1.5 0.4 0.4 0.8 0.0 0.0
0130 0.0 0.4 0.0 0.4 0.4 1.1 2.2 2.2 0.4 0.4 0.4 0.8 0.0
0200 0.0 0.4 0.0 0.4 0.4 1.1 2.6 1.8 1.2 0.0 0.0 0.0 0.0
0230 0.0 0.7 0.0 0.4 0.7 0.8 2.9 1.9 1.2 0.4 0.0 0.0 0.0
0300 0.0 0.4 0.0 0.4 0.4 1.5 2.5 1.9 1.6 0.4 0.0 0.0 0.0
0330 0.0 0.0 0.4 0.0 1.1 0.8 1.8 1.5 2.0 0.4 0.0 0.4 0.0
0400 0.0 0.4 0.0 0.4 1.1 0.4 1.1 1.5 2.0 0.4 0.0 0.4 0.0
0430 0.0 0.0 0.0 0.8 1.8 1.5 0.7 1.8 1.6 0.4 0.0 0.0 0.0
0500 0.4 0.0 0.0 0.4 2.9 1.9 1.8 0.7 1.6 0.0 0.8 0.0 0.4
0530 0.0 0.0 0.0 0.4 1.5 3.4 2.5 0.4 1.2 0.4 0.4 0.0 0.0
0600 0.0 0.0 0.4 0.7 2.9 3.4 2.6 0.7 0.4 0.7 0.4 0.0 0.0
0630 0.0 0.0 0.0 0.0 1.5 2.3 2.6 0.8 0.4 0.8 0.0 0.0 0.0
0700 0.0 0.0 0.0 0.0 0.4 2.7 2.2 0.7 0.0 0.0 0.0 0.0 0.0
0730 0.0 0.4 0.0 0.0 0.4 1.5 1.1 0.7 0.4 0.0 0.0 0.0 0.0
0800 0.0 0.7 0.0 0.0 0.0 1.1 1.1 0.7 0.4 0.0 0.0 0.4 0.0
0830 0.0 0.0 0.0 0.0 0.0 0.4 0.4 0.7 0.8 0.0 0.0 0.4 0.0
0900 0.0 0.0 0.0 0.0 0.0 0.0 0.0 1.1 0.0 0.0 0.4 0.0 0.0
0930 0.0 0.0 0.0 0.8 0.0 0.0 0.0 1.1 0.0 0.7 0.4 0.0 0.0
1000 0.0 0.0 0.4 0.8 0.4 0.0 0.0 0.4 0.0 0.0 0.4 0.0 0.0
1030 0.0 0.0 0.0 0.0 0.0 0.0 0.0 0.4 0.0 0.0 0.0 0.0 0.0
1100 0.0 0.0 0.0 0.0 0.0 0.0 0.0 0.4 0.0 0.0 0.4 0.0 0.0
1130 0.0 0.0 0.0 0.0 0.0 0.0 0.0 0.0 0.0 0.0 0.4 0.0 0.0
1200 0.0 0.0 0.0 0.0 0.0 0.0 0.0 0.0 0.0 0.0 0.8 0.0 0.0
1230 0.0 0.4 0.0 0.0 0.0 0.0 0.0 0.0 0.0 0.0 0.4 0.0 0.0
1300 0.0 0.0 0.0 0.0 0.0 0.0 0.0 0.0 0.4 0.0 0.0 0.0 0.0
MEAN 0.0 0.1 0.0 0.1 0.4 0.6 1.2 1.0 0.4 0.1 0.1 0.1 0.0
Remarks Cases when a certa in phenomenon is not occurred and frequency i s 0 are shaded white
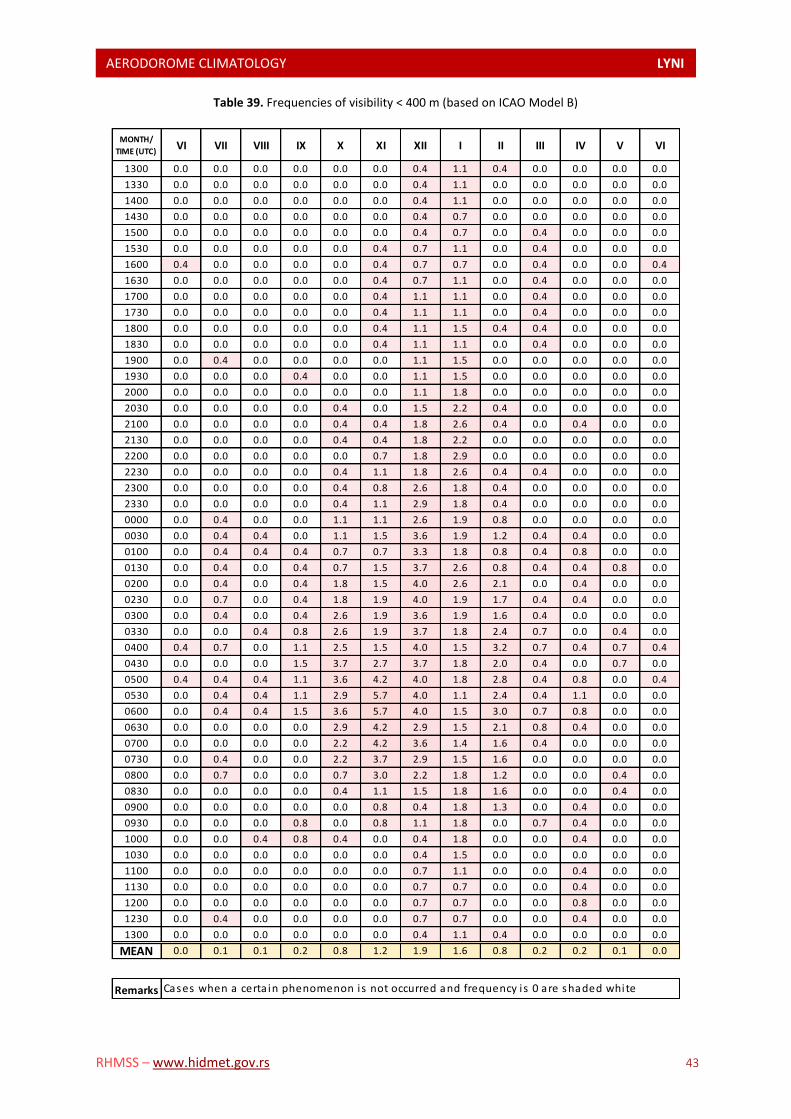
AERODOROME CLIMATOLOGY LYNI L
RHMSS – www.hidmet.gov.rs 43
Table 39. Frequencies of visibility < 400 m (based on ICAO Model B)
MONTH/
TIME (UTC)VI VII VIII IX X XI XII I II III IV V VI
1300 0.0 0.0 0.0 0.0 0.0 0.0 0.4 1.1 0.4 0.0 0.0 0.0 0.0
1330 0.0 0.0 0.0 0.0 0.0 0.0 0.4 1.1 0.0 0.0 0.0 0.0 0.0
1400 0.0 0.0 0.0 0.0 0.0 0.0 0.4 1.1 0.0 0.0 0.0 0.0 0.0
1430 0.0 0.0 0.0 0.0 0.0 0.0 0.4 0.7 0.0 0.0 0.0 0.0 0.0
1500 0.0 0.0 0.0 0.0 0.0 0.0 0.4 0.7 0.0 0.4 0.0 0.0 0.0
1530 0.0 0.0 0.0 0.0 0.0 0.4 0.7 1.1 0.0 0.4 0.0 0.0 0.0
1600 0.4 0.0 0.0 0.0 0.0 0.4 0.7 0.7 0.0 0.4 0.0 0.0 0.4
1630 0.0 0.0 0.0 0.0 0.0 0.4 0.7 1.1 0.0 0.4 0.0 0.0 0.0
1700 0.0 0.0 0.0 0.0 0.0 0.4 1.1 1.1 0.0 0.4 0.0 0.0 0.0
1730 0.0 0.0 0.0 0.0 0.0 0.4 1.1 1.1 0.0 0.4 0.0 0.0 0.0
1800 0.0 0.0 0.0 0.0 0.0 0.4 1.1 1.5 0.4 0.4 0.0 0.0 0.0
1830 0.0 0.0 0.0 0.0 0.0 0.4 1.1 1.1 0.0 0.4 0.0 0.0 0.0
1900 0.0 0.4 0.0 0.0 0.0 0.0 1.1 1.5 0.0 0.0 0.0 0.0 0.0
1930 0.0 0.0 0.0 0.4 0.0 0.0 1.1 1.5 0.0 0.0 0.0 0.0 0.0
2000 0.0 0.0 0.0 0.0 0.0 0.0 1.1 1.8 0.0 0.0 0.0 0.0 0.0
2030 0.0 0.0 0.0 0.0 0.4 0.0 1.5 2.2 0.4 0.0 0.0 0.0 0.0
2100 0.0 0.0 0.0 0.0 0.4 0.4 1.8 2.6 0.4 0.0 0.4 0.0 0.0
2130 0.0 0.0 0.0 0.0 0.4 0.4 1.8 2.2 0.0 0.0 0.0 0.0 0.0
2200 0.0 0.0 0.0 0.0 0.0 0.7 1.8 2.9 0.0 0.0 0.0 0.0 0.0
2230 0.0 0.0 0.0 0.0 0.4 1.1 1.8 2.6 0.4 0.4 0.0 0.0 0.0
2300 0.0 0.0 0.0 0.0 0.4 0.8 2.6 1.8 0.4 0.0 0.0 0.0 0.0
2330 0.0 0.0 0.0 0.0 0.4 1.1 2.9 1.8 0.4 0.0 0.0 0.0 0.0
0000 0.0 0.4 0.0 0.0 1.1 1.1 2.6 1.9 0.8 0.0 0.0 0.0 0.0
0030 0.0 0.4 0.4 0.0 1.1 1.5 3.6 1.9 1.2 0.4 0.4 0.0 0.0
0100 0.0 0.4 0.4 0.4 0.7 0.7 3.3 1.8 0.8 0.4 0.8 0.0 0.0
0130 0.0 0.4 0.0 0.4 0.7 1.5 3.7 2.6 0.8 0.4 0.4 0.8 0.0
0200 0.0 0.4 0.0 0.4 1.8 1.5 4.0 2.6 2.1 0.0 0.4 0.0 0.0
0230 0.0 0.7 0.0 0.4 1.8 1.9 4.0 1.9 1.7 0.4 0.4 0.0 0.0
0300 0.0 0.4 0.0 0.4 2.6 1.9 3.6 1.9 1.6 0.4 0.0 0.0 0.0
0330 0.0 0.0 0.4 0.8 2.6 1.9 3.7 1.8 2.4 0.7 0.0 0.4 0.0
0400 0.4 0.7 0.0 1.1 2.5 1.5 4.0 1.5 3.2 0.7 0.4 0.7 0.4
0430 0.0 0.0 0.0 1.5 3.7 2.7 3.7 1.8 2.0 0.4 0.0 0.7 0.0
0500 0.4 0.4 0.4 1.1 3.6 4.2 4.0 1.8 2.8 0.4 0.8 0.0 0.4
0530 0.0 0.4 0.4 1.1 2.9 5.7 4.0 1.1 2.4 0.4 1.1 0.0 0.0
0600 0.0 0.4 0.4 1.5 3.6 5.7 4.0 1.5 3.0 0.7 0.8 0.0 0.0
0630 0.0 0.0 0.0 0.0 2.9 4.2 2.9 1.5 2.1 0.8 0.4 0.0 0.0
0700 0.0 0.0 0.0 0.0 2.2 4.2 3.6 1.4 1.6 0.4 0.0 0.0 0.0
0730 0.0 0.4 0.0 0.0 2.2 3.7 2.9 1.5 1.6 0.0 0.0 0.0 0.0
0800 0.0 0.7 0.0 0.0 0.7 3.0 2.2 1.8 1.2 0.0 0.0 0.4 0.0
0830 0.0 0.0 0.0 0.0 0.4 1.1 1.5 1.8 1.6 0.0 0.0 0.4 0.0
0900 0.0 0.0 0.0 0.0 0.0 0.8 0.4 1.8 1.3 0.0 0.4 0.0 0.0
0930 0.0 0.0 0.0 0.8 0.0 0.8 1.1 1.8 0.0 0.7 0.4 0.0 0.0
1000 0.0 0.0 0.4 0.8 0.4 0.0 0.4 1.8 0.0 0.0 0.4 0.0 0.0
1030 0.0 0.0 0.0 0.0 0.0 0.0 0.4 1.5 0.0 0.0 0.0 0.0 0.0
1100 0.0 0.0 0.0 0.0 0.0 0.0 0.7 1.1 0.0 0.0 0.4 0.0 0.0
1130 0.0 0.0 0.0 0.0 0.0 0.0 0.7 0.7 0.0 0.0 0.4 0.0 0.0
1200 0.0 0.0 0.0 0.0 0.0 0.0 0.7 0.7 0.0 0.0 0.8 0.0 0.0
1230 0.0 0.4 0.0 0.0 0.0 0.0 0.7 0.7 0.0 0.0 0.4 0.0 0.0
1300 0.0 0.0 0.0 0.0 0.0 0.0 0.4 1.1 0.4 0.0 0.0 0.0 0.0
MEAN 0.0 0.1 0.1 0.2 0.8 1.2 1.9 1.6 0.8 0.2 0.2 0.1 0.0
Remarks Cases when a certa in phenomenon is not occurred and frequency i s 0 are shaded white
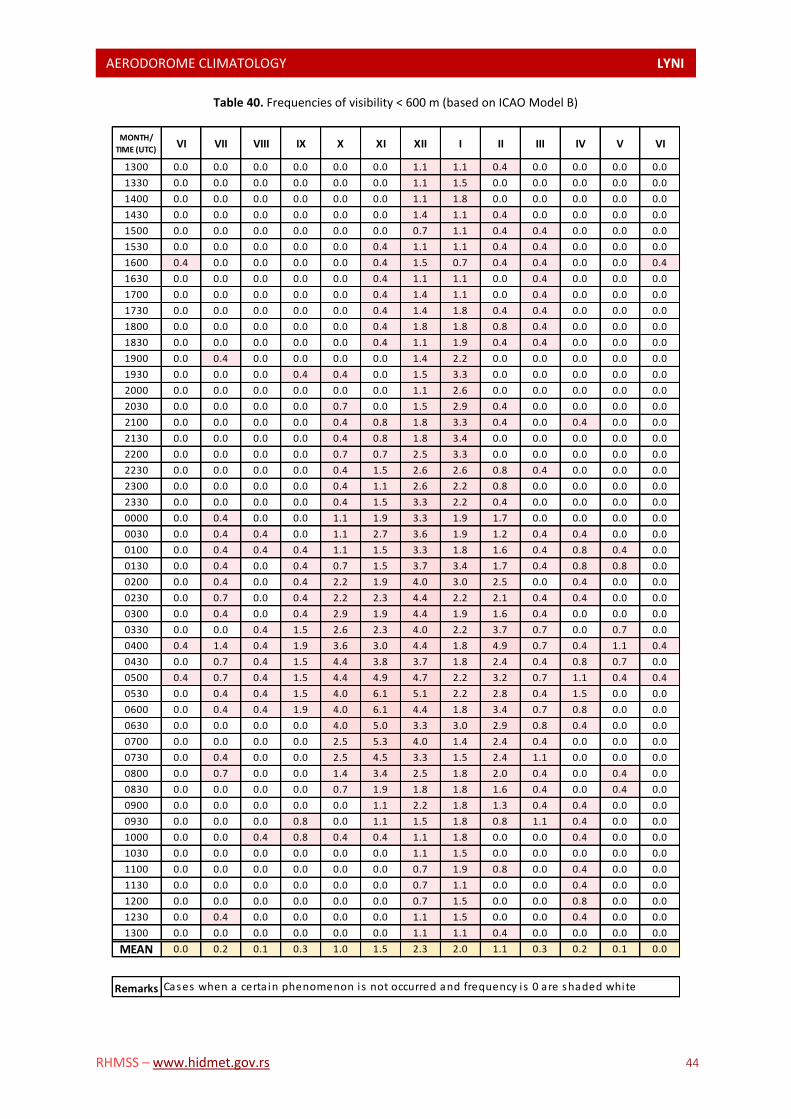
AERODOROME CLIMATOLOGY LYNI L
RHMSS – www.hidmet.gov.rs 44
Table 40. Frequencies of visibility < 600 m (based on ICAO Model B)
MONTH/
TIME (UTC)VI VII VIII IX X XI XII I II III IV V VI
1300 0.0 0.0 0.0 0.0 0.0 0.0 1.1 1.1 0.4 0.0 0.0 0.0 0.0
1330 0.0 0.0 0.0 0.0 0.0 0.0 1.1 1.5 0.0 0.0 0.0 0.0 0.0
1400 0.0 0.0 0.0 0.0 0.0 0.0 1.1 1.8 0.0 0.0 0.0 0.0 0.0
1430 0.0 0.0 0.0 0.0 0.0 0.0 1.4 1.1 0.4 0.0 0.0 0.0 0.0
1500 0.0 0.0 0.0 0.0 0.0 0.0 0.7 1.1 0.4 0.4 0.0 0.0 0.0
1530 0.0 0.0 0.0 0.0 0.0 0.4 1.1 1.1 0.4 0.4 0.0 0.0 0.0
1600 0.4 0.0 0.0 0.0 0.0 0.4 1.5 0.7 0.4 0.4 0.0 0.0 0.4
1630 0.0 0.0 0.0 0.0 0.0 0.4 1.1 1.1 0.0 0.4 0.0 0.0 0.0
1700 0.0 0.0 0.0 0.0 0.0 0.4 1.4 1.1 0.0 0.4 0.0 0.0 0.0
1730 0.0 0.0 0.0 0.0 0.0 0.4 1.4 1.8 0.4 0.4 0.0 0.0 0.0
1800 0.0 0.0 0.0 0.0 0.0 0.4 1.8 1.8 0.8 0.4 0.0 0.0 0.0
1830 0.0 0.0 0.0 0.0 0.0 0.4 1.1 1.9 0.4 0.4 0.0 0.0 0.0
1900 0.0 0.4 0.0 0.0 0.0 0.0 1.4 2.2 0.0 0.0 0.0 0.0 0.0
1930 0.0 0.0 0.0 0.4 0.4 0.0 1.5 3.3 0.0 0.0 0.0 0.0 0.0
2000 0.0 0.0 0.0 0.0 0.0 0.0 1.1 2.6 0.0 0.0 0.0 0.0 0.0
2030 0.0 0.0 0.0 0.0 0.7 0.0 1.5 2.9 0.4 0.0 0.0 0.0 0.0
2100 0.0 0.0 0.0 0.0 0.4 0.8 1.8 3.3 0.4 0.0 0.4 0.0 0.0
2130 0.0 0.0 0.0 0.0 0.4 0.8 1.8 3.4 0.0 0.0 0.0 0.0 0.0
2200 0.0 0.0 0.0 0.0 0.7 0.7 2.5 3.3 0.0 0.0 0.0 0.0 0.0
2230 0.0 0.0 0.0 0.0 0.4 1.5 2.6 2.6 0.8 0.4 0.0 0.0 0.0
2300 0.0 0.0 0.0 0.0 0.4 1.1 2.6 2.2 0.8 0.0 0.0 0.0 0.0
2330 0.0 0.0 0.0 0.0 0.4 1.5 3.3 2.2 0.4 0.0 0.0 0.0 0.0
0000 0.0 0.4 0.0 0.0 1.1 1.9 3.3 1.9 1.7 0.0 0.0 0.0 0.0
0030 0.0 0.4 0.4 0.0 1.1 2.7 3.6 1.9 1.2 0.4 0.4 0.0 0.0
0100 0.0 0.4 0.4 0.4 1.1 1.5 3.3 1.8 1.6 0.4 0.8 0.4 0.0
0130 0.0 0.4 0.0 0.4 0.7 1.5 3.7 3.4 1.7 0.4 0.8 0.8 0.0
0200 0.0 0.4 0.0 0.4 2.2 1.9 4.0 3.0 2.5 0.0 0.4 0.0 0.0
0230 0.0 0.7 0.0 0.4 2.2 2.3 4.4 2.2 2.1 0.4 0.4 0.0 0.0
0300 0.0 0.4 0.0 0.4 2.9 1.9 4.4 1.9 1.6 0.4 0.0 0.0 0.0
0330 0.0 0.0 0.4 1.5 2.6 2.3 4.0 2.2 3.7 0.7 0.0 0.7 0.0
0400 0.4 1.4 0.4 1.9 3.6 3.0 4.4 1.8 4.9 0.7 0.4 1.1 0.4
0430 0.0 0.7 0.4 1.5 4.4 3.8 3.7 1.8 2.4 0.4 0.8 0.7 0.0
0500 0.4 0.7 0.4 1.5 4.4 4.9 4.7 2.2 3.2 0.7 1.1 0.4 0.4
0530 0.0 0.4 0.4 1.5 4.0 6.1 5.1 2.2 2.8 0.4 1.5 0.0 0.0
0600 0.0 0.4 0.4 1.9 4.0 6.1 4.4 1.8 3.4 0.7 0.8 0.0 0.0
0630 0.0 0.0 0.0 0.0 4.0 5.0 3.3 3.0 2.9 0.8 0.4 0.0 0.0
0700 0.0 0.0 0.0 0.0 2.5 5.3 4.0 1.4 2.4 0.4 0.0 0.0 0.0
0730 0.0 0.4 0.0 0.0 2.5 4.5 3.3 1.5 2.4 1.1 0.0 0.0 0.0
0800 0.0 0.7 0.0 0.0 1.4 3.4 2.5 1.8 2.0 0.4 0.0 0.4 0.0
0830 0.0 0.0 0.0 0.0 0.7 1.9 1.8 1.8 1.6 0.4 0.0 0.4 0.0
0900 0.0 0.0 0.0 0.0 0.0 1.1 2.2 1.8 1.3 0.4 0.4 0.0 0.0
0930 0.0 0.0 0.0 0.8 0.0 1.1 1.5 1.8 0.8 1.1 0.4 0.0 0.0
1000 0.0 0.0 0.4 0.8 0.4 0.4 1.1 1.8 0.0 0.0 0.4 0.0 0.0
1030 0.0 0.0 0.0 0.0 0.0 0.0 1.1 1.5 0.0 0.0 0.0 0.0 0.0
1100 0.0 0.0 0.0 0.0 0.0 0.0 0.7 1.9 0.8 0.0 0.4 0.0 0.0
1130 0.0 0.0 0.0 0.0 0.0 0.0 0.7 1.1 0.0 0.0 0.4 0.0 0.0
1200 0.0 0.0 0.0 0.0 0.0 0.0 0.7 1.5 0.0 0.0 0.8 0.0 0.0
1230 0.0 0.4 0.0 0.0 0.0 0.0 1.1 1.5 0.0 0.0 0.4 0.0 0.0
1300 0.0 0.0 0.0 0.0 0.0 0.0 1.1 1.1 0.4 0.0 0.0 0.0 0.0
MEAN 0.0 0.2 0.1 0.3 1.0 1.5 2.3 2.0 1.1 0.3 0.2 0.1 0.0
Remarks Cases when a certa in phenomenon is not occurred and frequency i s 0 are shaded white
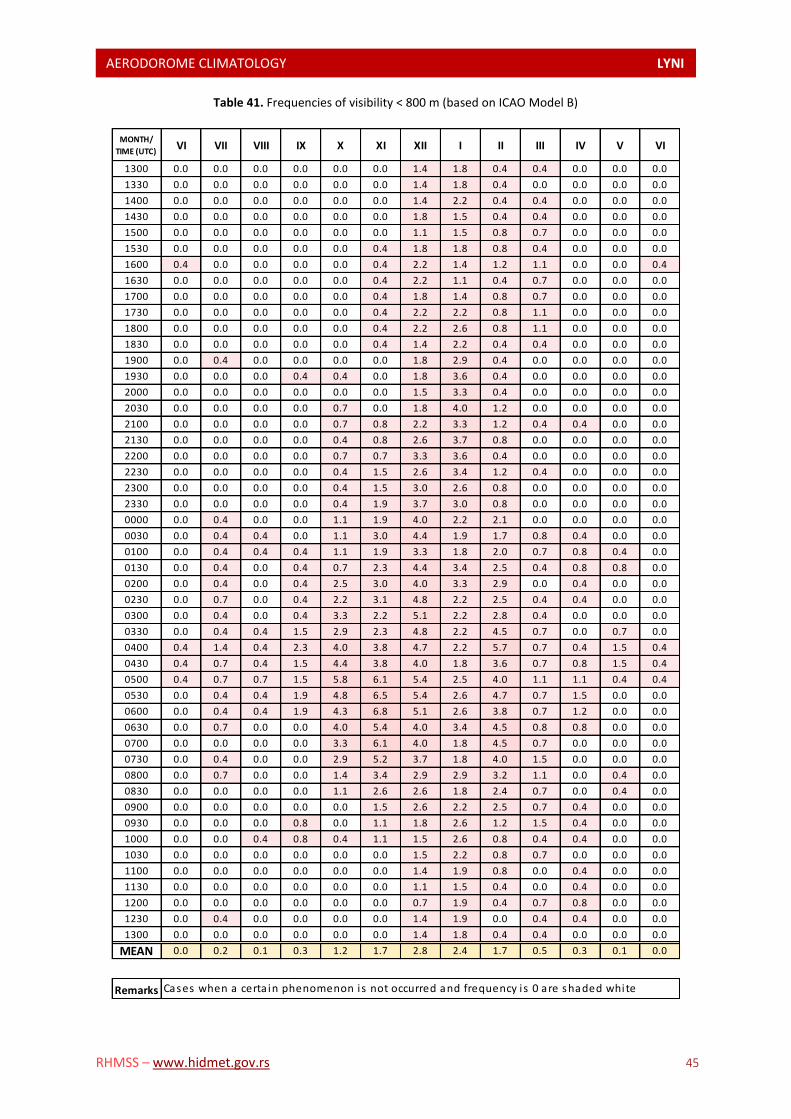
AERODOROME CLIMATOLOGY LYNI L
RHMSS – www.hidmet.gov.rs 45
Table 41. Frequencies of visibility < 800 m (based on ICAO Model B)
MONTH/
TIME (UTC)VI VII VIII IX X XI XII I II III IV V VI
1300 0.0 0.0 0.0 0.0 0.0 0.0 1.4 1.8 0.4 0.4 0.0 0.0 0.0
1330 0.0 0.0 0.0 0.0 0.0 0.0 1.4 1.8 0.4 0.0 0.0 0.0 0.0
1400 0.0 0.0 0.0 0.0 0.0 0.0 1.4 2.2 0.4 0.4 0.0 0.0 0.0
1430 0.0 0.0 0.0 0.0 0.0 0.0 1.8 1.5 0.4 0.4 0.0 0.0 0.0
1500 0.0 0.0 0.0 0.0 0.0 0.0 1.1 1.5 0.8 0.7 0.0 0.0 0.0
1530 0.0 0.0 0.0 0.0 0.0 0.4 1.8 1.8 0.8 0.4 0.0 0.0 0.0
1600 0.4 0.0 0.0 0.0 0.0 0.4 2.2 1.4 1.2 1.1 0.0 0.0 0.4
1630 0.0 0.0 0.0 0.0 0.0 0.4 2.2 1.1 0.4 0.7 0.0 0.0 0.0
1700 0.0 0.0 0.0 0.0 0.0 0.4 1.8 1.4 0.8 0.7 0.0 0.0 0.0
1730 0.0 0.0 0.0 0.0 0.0 0.4 2.2 2.2 0.8 1.1 0.0 0.0 0.0
1800 0.0 0.0 0.0 0.0 0.0 0.4 2.2 2.6 0.8 1.1 0.0 0.0 0.0
1830 0.0 0.0 0.0 0.0 0.0 0.4 1.4 2.2 0.4 0.4 0.0 0.0 0.0
1900 0.0 0.4 0.0 0.0 0.0 0.0 1.8 2.9 0.4 0.0 0.0 0.0 0.0
1930 0.0 0.0 0.0 0.4 0.4 0.0 1.8 3.6 0.4 0.0 0.0 0.0 0.0
2000 0.0 0.0 0.0 0.0 0.0 0.0 1.5 3.3 0.4 0.0 0.0 0.0 0.0
2030 0.0 0.0 0.0 0.0 0.7 0.0 1.8 4.0 1.2 0.0 0.0 0.0 0.0
2100 0.0 0.0 0.0 0.0 0.7 0.8 2.2 3.3 1.2 0.4 0.4 0.0 0.0
2130 0.0 0.0 0.0 0.0 0.4 0.8 2.6 3.7 0.8 0.0 0.0 0.0 0.0
2200 0.0 0.0 0.0 0.0 0.7 0.7 3.3 3.6 0.4 0.0 0.0 0.0 0.0
2230 0.0 0.0 0.0 0.0 0.4 1.5 2.6 3.4 1.2 0.4 0.0 0.0 0.0
2300 0.0 0.0 0.0 0.0 0.4 1.5 3.0 2.6 0.8 0.0 0.0 0.0 0.0
2330 0.0 0.0 0.0 0.0 0.4 1.9 3.7 3.0 0.8 0.0 0.0 0.0 0.0
0000 0.0 0.4 0.0 0.0 1.1 1.9 4.0 2.2 2.1 0.0 0.0 0.0 0.0
0030 0.0 0.4 0.4 0.0 1.1 3.0 4.4 1.9 1.7 0.8 0.4 0.0 0.0
0100 0.0 0.4 0.4 0.4 1.1 1.9 3.3 1.8 2.0 0.7 0.8 0.4 0.0
0130 0.0 0.4 0.0 0.4 0.7 2.3 4.4 3.4 2.5 0.4 0.8 0.8 0.0
0200 0.0 0.4 0.0 0.4 2.5 3.0 4.0 3.3 2.9 0.0 0.4 0.0 0.0
0230 0.0 0.7 0.0 0.4 2.2 3.1 4.8 2.2 2.5 0.4 0.4 0.0 0.0
0300 0.0 0.4 0.0 0.4 3.3 2.2 5.1 2.2 2.8 0.4 0.0 0.0 0.0
0330 0.0 0.4 0.4 1.5 2.9 2.3 4.8 2.2 4.5 0.7 0.0 0.7 0.0
0400 0.4 1.4 0.4 2.3 4.0 3.8 4.7 2.2 5.7 0.7 0.4 1.5 0.4
0430 0.4 0.7 0.4 1.5 4.4 3.8 4.0 1.8 3.6 0.7 0.8 1.5 0.4
0500 0.4 0.7 0.7 1.5 5.8 6.1 5.4 2.5 4.0 1.1 1.1 0.4 0.4
0530 0.0 0.4 0.4 1.9 4.8 6.5 5.4 2.6 4.7 0.7 1.5 0.0 0.0
0600 0.0 0.4 0.4 1.9 4.3 6.8 5.1 2.6 3.8 0.7 1.2 0.0 0.0
0630 0.0 0.7 0.0 0.0 4.0 5.4 4.0 3.4 4.5 0.8 0.8 0.0 0.0
0700 0.0 0.0 0.0 0.0 3.3 6.1 4.0 1.8 4.5 0.7 0.0 0.0 0.0
0730 0.0 0.4 0.0 0.0 2.9 5.2 3.7 1.8 4.0 1.5 0.0 0.0 0.0
0800 0.0 0.7 0.0 0.0 1.4 3.4 2.9 2.9 3.2 1.1 0.0 0.4 0.0
0830 0.0 0.0 0.0 0.0 1.1 2.6 2.6 1.8 2.4 0.7 0.0 0.4 0.0
0900 0.0 0.0 0.0 0.0 0.0 1.5 2.6 2.2 2.5 0.7 0.4 0.0 0.0
0930 0.0 0.0 0.0 0.8 0.0 1.1 1.8 2.6 1.2 1.5 0.4 0.0 0.0
1000 0.0 0.0 0.4 0.8 0.4 1.1 1.5 2.6 0.8 0.4 0.4 0.0 0.0
1030 0.0 0.0 0.0 0.0 0.0 0.0 1.5 2.2 0.8 0.7 0.0 0.0 0.0
1100 0.0 0.0 0.0 0.0 0.0 0.0 1.4 1.9 0.8 0.0 0.4 0.0 0.0
1130 0.0 0.0 0.0 0.0 0.0 0.0 1.1 1.5 0.4 0.0 0.4 0.0 0.0
1200 0.0 0.0 0.0 0.0 0.0 0.0 0.7 1.9 0.4 0.7 0.8 0.0 0.0
1230 0.0 0.4 0.0 0.0 0.0 0.0 1.4 1.9 0.0 0.4 0.4 0.0 0.0
1300 0.0 0.0 0.0 0.0 0.0 0.0 1.4 1.8 0.4 0.4 0.0 0.0 0.0
MEAN 0.0 0.2 0.1 0.3 1.2 1.7 2.8 2.4 1.7 0.5 0.3 0.1 0.0
Remarks Cases when a certa in phenomenon is not occurred and frequency i s 0 are shaded white
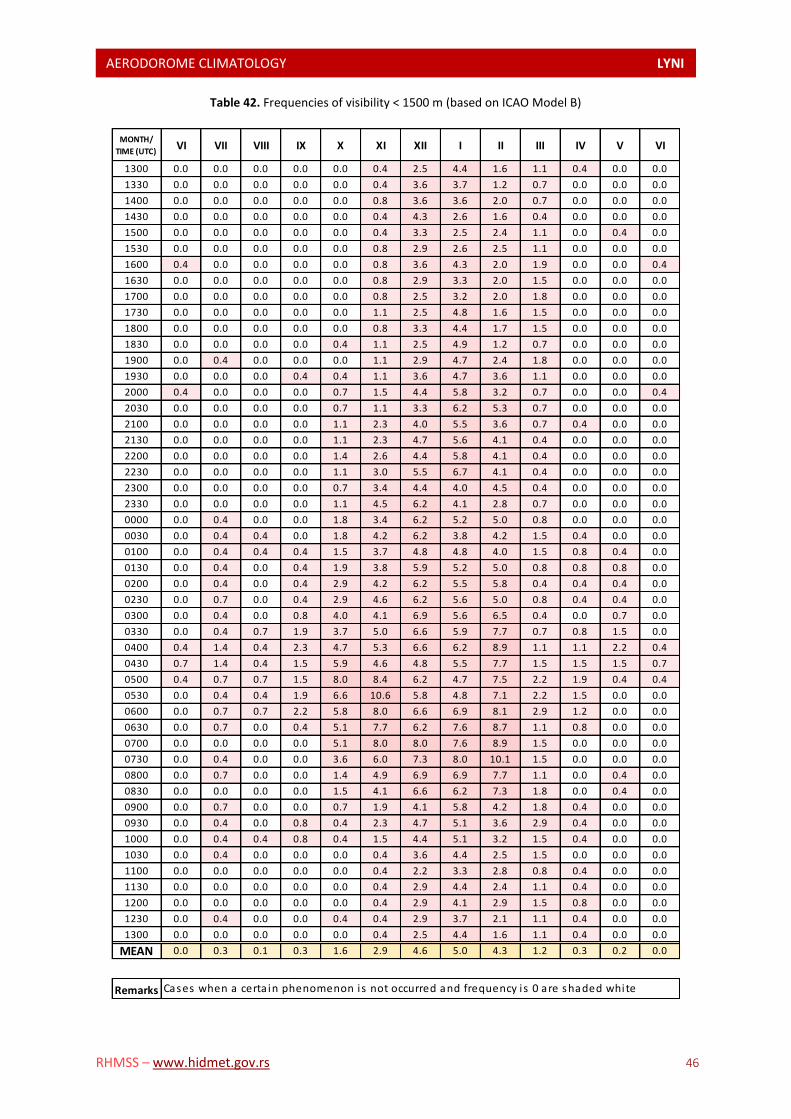
AERODOROME CLIMATOLOGY LYNI L
RHMSS – www.hidmet.gov.rs 46
Table 42. Frequencies of visibility < 1500 m (based on ICAO Model B)
MONTH/
TIME (UTC)VI VII VIII IX X XI XII I II III IV V VI
1300 0.0 0.0 0.0 0.0 0.0 0.4 2.5 4.4 1.6 1.1 0.4 0.0 0.0
1330 0.0 0.0 0.0 0.0 0.0 0.4 3.6 3.7 1.2 0.7 0.0 0.0 0.0
1400 0.0 0.0 0.0 0.0 0.0 0.8 3.6 3.6 2.0 0.7 0.0 0.0 0.0
1430 0.0 0.0 0.0 0.0 0.0 0.4 4.3 2.6 1.6 0.4 0.0 0.0 0.0
1500 0.0 0.0 0.0 0.0 0.0 0.4 3.3 2.5 2.4 1.1 0.0 0.4 0.0
1530 0.0 0.0 0.0 0.0 0.0 0.8 2.9 2.6 2.5 1.1 0.0 0.0 0.0
1600 0.4 0.0 0.0 0.0 0.0 0.8 3.6 4.3 2.0 1.9 0.0 0.0 0.4
1630 0.0 0.0 0.0 0.0 0.0 0.8 2.9 3.3 2.0 1.5 0.0 0.0 0.0
1700 0.0 0.0 0.0 0.0 0.0 0.8 2.5 3.2 2.0 1.8 0.0 0.0 0.0
1730 0.0 0.0 0.0 0.0 0.0 1.1 2.5 4.8 1.6 1.5 0.0 0.0 0.0
1800 0.0 0.0 0.0 0.0 0.0 0.8 3.3 4.4 1.7 1.5 0.0 0.0 0.0
1830 0.0 0.0 0.0 0.0 0.4 1.1 2.5 4.9 1.2 0.7 0.0 0.0 0.0
1900 0.0 0.4 0.0 0.0 0.0 1.1 2.9 4.7 2.4 1.8 0.0 0.0 0.0
1930 0.0 0.0 0.0 0.4 0.4 1.1 3.6 4.7 3.6 1.1 0.0 0.0 0.0
2000 0.4 0.0 0.0 0.0 0.7 1.5 4.4 5.8 3.2 0.7 0.0 0.0 0.4
2030 0.0 0.0 0.0 0.0 0.7 1.1 3.3 6.2 5.3 0.7 0.0 0.0 0.0
2100 0.0 0.0 0.0 0.0 1.1 2.3 4.0 5.5 3.6 0.7 0.4 0.0 0.0
2130 0.0 0.0 0.0 0.0 1.1 2.3 4.7 5.6 4.1 0.4 0.0 0.0 0.0
2200 0.0 0.0 0.0 0.0 1.4 2.6 4.4 5.8 4.1 0.4 0.0 0.0 0.0
2230 0.0 0.0 0.0 0.0 1.1 3.0 5.5 6.7 4.1 0.4 0.0 0.0 0.0
2300 0.0 0.0 0.0 0.0 0.7 3.4 4.4 4.0 4.5 0.4 0.0 0.0 0.0
2330 0.0 0.0 0.0 0.0 1.1 4.5 6.2 4.1 2.8 0.7 0.0 0.0 0.0
0000 0.0 0.4 0.0 0.0 1.8 3.4 6.2 5.2 5.0 0.8 0.0 0.0 0.0
0030 0.0 0.4 0.4 0.0 1.8 4.2 6.2 3.8 4.2 1.5 0.4 0.0 0.0
0100 0.0 0.4 0.4 0.4 1.5 3.7 4.8 4.8 4.0 1.5 0.8 0.4 0.0
0130 0.0 0.4 0.0 0.4 1.9 3.8 5.9 5.2 5.0 0.8 0.8 0.8 0.0
0200 0.0 0.4 0.0 0.4 2.9 4.2 6.2 5.5 5.8 0.4 0.4 0.4 0.0
0230 0.0 0.7 0.0 0.4 2.9 4.6 6.2 5.6 5.0 0.8 0.4 0.4 0.0
0300 0.0 0.4 0.0 0.8 4.0 4.1 6.9 5.6 6.5 0.4 0.0 0.7 0.0
0330 0.0 0.4 0.7 1.9 3.7 5.0 6.6 5.9 7.7 0.7 0.8 1.5 0.0
0400 0.4 1.4 0.4 2.3 4.7 5.3 6.6 6.2 8.9 1.1 1.1 2.2 0.4
0430 0.7 1.4 0.4 1.5 5.9 4.6 4.8 5.5 7.7 1.5 1.5 1.5 0.7
0500 0.4 0.7 0.7 1.5 8.0 8.4 6.2 4.7 7.5 2.2 1.9 0.4 0.4
0530 0.0 0.4 0.4 1.9 6.6 10.6 5.8 4.8 7.1 2.2 1.5 0.0 0.0
0600 0.0 0.7 0.7 2.2 5.8 8.0 6.6 6.9 8.1 2.9 1.2 0.0 0.0
0630 0.0 0.7 0.0 0.4 5.1 7.7 6.2 7.6 8.7 1.1 0.8 0.0 0.0
0700 0.0 0.0 0.0 0.0 5.1 8.0 8.0 7.6 8.9 1.5 0.0 0.0 0.0
0730 0.0 0.4 0.0 0.0 3.6 6.0 7.3 8.0 10.1 1.5 0.0 0.0 0.0
0800 0.0 0.7 0.0 0.0 1.4 4.9 6.9 6.9 7.7 1.1 0.0 0.4 0.0
0830 0.0 0.0 0.0 0.0 1.5 4.1 6.6 6.2 7.3 1.8 0.0 0.4 0.0
0900 0.0 0.7 0.0 0.0 0.7 1.9 4.1 5.8 4.2 1.8 0.4 0.0 0.0
0930 0.0 0.4 0.0 0.8 0.4 2.3 4.7 5.1 3.6 2.9 0.4 0.0 0.0
1000 0.0 0.4 0.4 0.8 0.4 1.5 4.4 5.1 3.2 1.5 0.4 0.0 0.0
1030 0.0 0.4 0.0 0.0 0.0 0.4 3.6 4.4 2.5 1.5 0.0 0.0 0.0
1100 0.0 0.0 0.0 0.0 0.0 0.4 2.2 3.3 2.8 0.8 0.4 0.0 0.0
1130 0.0 0.0 0.0 0.0 0.0 0.4 2.9 4.4 2.4 1.1 0.4 0.0 0.0
1200 0.0 0.0 0.0 0.0 0.0 0.4 2.9 4.1 2.9 1.5 0.8 0.0 0.0
1230 0.0 0.4 0.0 0.0 0.4 0.4 2.9 3.7 2.1 1.1 0.4 0.0 0.0
1300 0.0 0.0 0.0 0.0 0.0 0.4 2.5 4.4 1.6 1.1 0.4 0.0 0.0
MEAN 0.0 0.3 0.1 0.3 1.6 2.9 4.6 5.0 4.3 1.2 0.3 0.2 0.0
Remarks Cases when a certa in phenomenon is not occurred and frequency i s 0 are shaded white
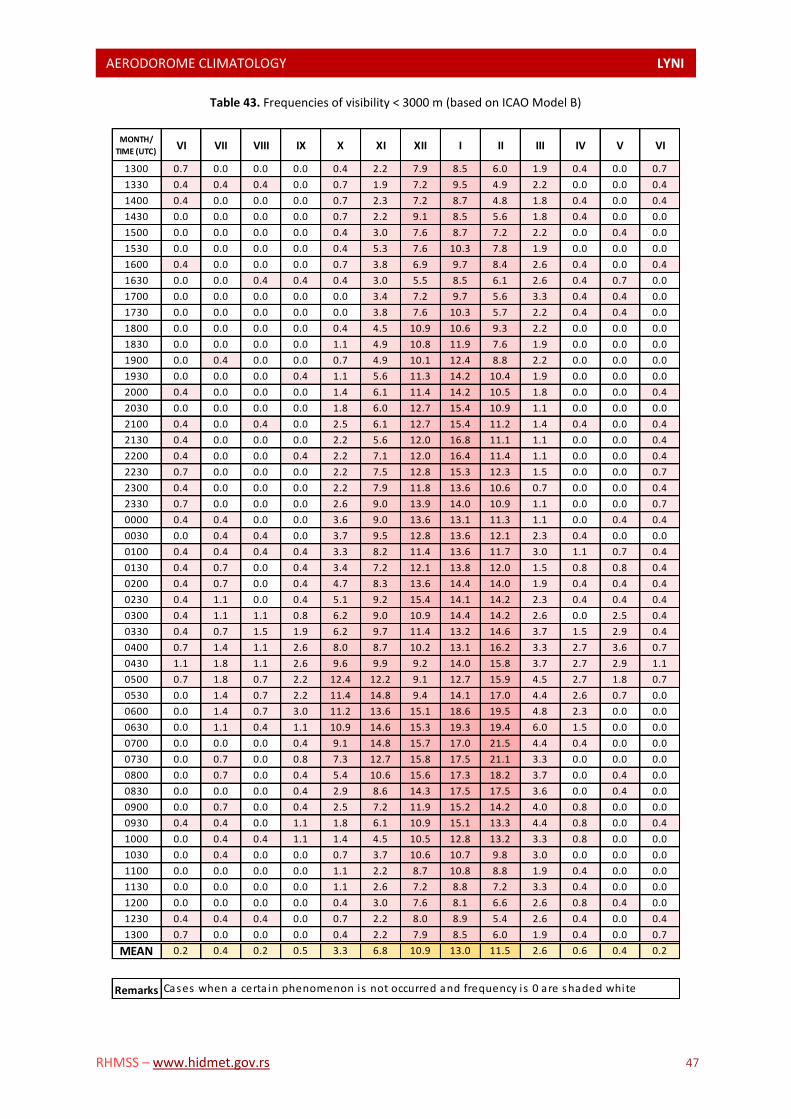
AERODOROME CLIMATOLOGY LYNI L
RHMSS – www.hidmet.gov.rs 47
Table 43. Frequencies of visibility < 3000 m (based on ICAO Model B)
MONTH/
TIME (UTC)VI VII VIII IX X XI XII I II III IV V VI
1300 0.7 0.0 0.0 0.0 0.4 2.2 7.9 8.5 6.0 1.9 0.4 0.0 0.7
1330 0.4 0.4 0.4 0.0 0.7 1.9 7.2 9.5 4.9 2.2 0.0 0.0 0.4
1400 0.4 0.0 0.0 0.0 0.7 2.3 7.2 8.7 4.8 1.8 0.4 0.0 0.4
1430 0.0 0.0 0.0 0.0 0.7 2.2 9.1 8.5 5.6 1.8 0.4 0.0 0.0
1500 0.0 0.0 0.0 0.0 0.4 3.0 7.6 8.7 7.2 2.2 0.0 0.4 0.0
1530 0.0 0.0 0.0 0.0 0.4 5.3 7.6 10.3 7.8 1.9 0.0 0.0 0.0
1600 0.4 0.0 0.0 0.0 0.7 3.8 6.9 9.7 8.4 2.6 0.4 0.0 0.4
1630 0.0 0.0 0.4 0.4 0.4 3.0 5.5 8.5 6.1 2.6 0.4 0.7 0.0
1700 0.0 0.0 0.0 0.0 0.0 3.4 7.2 9.7 5.6 3.3 0.4 0.4 0.0
1730 0.0 0.0 0.0 0.0 0.0 3.8 7.6 10.3 5.7 2.2 0.4 0.4 0.0
1800 0.0 0.0 0.0 0.0 0.4 4.5 10.9 10.6 9.3 2.2 0.0 0.0 0.0
1830 0.0 0.0 0.0 0.0 1.1 4.9 10.8 11.9 7.6 1.9 0.0 0.0 0.0
1900 0.0 0.4 0.0 0.0 0.7 4.9 10.1 12.4 8.8 2.2 0.0 0.0 0.0
1930 0.0 0.0 0.0 0.4 1.1 5.6 11.3 14.2 10.4 1.9 0.0 0.0 0.0
2000 0.4 0.0 0.0 0.0 1.4 6.1 11.4 14.2 10.5 1.8 0.0 0.0 0.4
2030 0.0 0.0 0.0 0.0 1.8 6.0 12.7 15.4 10.9 1.1 0.0 0.0 0.0
2100 0.4 0.0 0.4 0.0 2.5 6.1 12.7 15.4 11.2 1.4 0.4 0.0 0.4
2130 0.4 0.0 0.0 0.0 2.2 5.6 12.0 16.8 11.1 1.1 0.0 0.0 0.4
2200 0.4 0.0 0.0 0.4 2.2 7.1 12.0 16.4 11.4 1.1 0.0 0.0 0.4
2230 0.7 0.0 0.0 0.0 2.2 7.5 12.8 15.3 12.3 1.5 0.0 0.0 0.7
2300 0.4 0.0 0.0 0.0 2.2 7.9 11.8 13.6 10.6 0.7 0.0 0.0 0.4
2330 0.7 0.0 0.0 0.0 2.6 9.0 13.9 14.0 10.9 1.1 0.0 0.0 0.7
0000 0.4 0.4 0.0 0.0 3.6 9.0 13.6 13.1 11.3 1.1 0.0 0.4 0.4
0030 0.0 0.4 0.4 0.0 3.7 9.5 12.8 13.6 12.1 2.3 0.4 0.0 0.0
0100 0.4 0.4 0.4 0.4 3.3 8.2 11.4 13.6 11.7 3.0 1.1 0.7 0.4
0130 0.4 0.7 0.0 0.4 3.4 7.2 12.1 13.8 12.0 1.5 0.8 0.8 0.4
0200 0.4 0.7 0.0 0.4 4.7 8.3 13.6 14.4 14.0 1.9 0.4 0.4 0.4
0230 0.4 1.1 0.0 0.4 5.1 9.2 15.4 14.1 14.2 2.3 0.4 0.4 0.4
0300 0.4 1.1 1.1 0.8 6.2 9.0 10.9 14.4 14.2 2.6 0.0 2.5 0.4
0330 0.4 0.7 1.5 1.9 6.2 9.7 11.4 13.2 14.6 3.7 1.5 2.9 0.4
0400 0.7 1.4 1.1 2.6 8.0 8.7 10.2 13.1 16.2 3.3 2.7 3.6 0.7
0430 1.1 1.8 1.1 2.6 9.6 9.9 9.2 14.0 15.8 3.7 2.7 2.9 1.1
0500 0.7 1.8 0.7 2.2 12.4 12.2 9.1 12.7 15.9 4.5 2.7 1.8 0.7
0530 0.0 1.4 0.7 2.2 11.4 14.8 9.4 14.1 17.0 4.4 2.6 0.7 0.0
0600 0.0 1.4 0.7 3.0 11.2 13.6 15.1 18.6 19.5 4.8 2.3 0.0 0.0
0630 0.0 1.1 0.4 1.1 10.9 14.6 15.3 19.3 19.4 6.0 1.5 0.0 0.0
0700 0.0 0.0 0.0 0.4 9.1 14.8 15.7 17.0 21.5 4.4 0.4 0.0 0.0
0730 0.0 0.7 0.0 0.8 7.3 12.7 15.8 17.5 21.1 3.3 0.0 0.0 0.0
0800 0.0 0.7 0.0 0.4 5.4 10.6 15.6 17.3 18.2 3.7 0.0 0.4 0.0
0830 0.0 0.0 0.0 0.4 2.9 8.6 14.3 17.5 17.5 3.6 0.0 0.4 0.0
0900 0.0 0.7 0.0 0.4 2.5 7.2 11.9 15.2 14.2 4.0 0.8 0.0 0.0
0930 0.4 0.4 0.0 1.1 1.8 6.1 10.9 15.1 13.3 4.4 0.8 0.0 0.4
1000 0.0 0.4 0.4 1.1 1.4 4.5 10.5 12.8 13.2 3.3 0.8 0.0 0.0
1030 0.0 0.4 0.0 0.0 0.7 3.7 10.6 10.7 9.8 3.0 0.0 0.0 0.0
1100 0.0 0.0 0.0 0.0 1.1 2.2 8.7 10.8 8.8 1.9 0.4 0.0 0.0
1130 0.0 0.0 0.0 0.0 1.1 2.6 7.2 8.8 7.2 3.3 0.4 0.0 0.0
1200 0.0 0.0 0.0 0.0 0.4 3.0 7.6 8.1 6.6 2.6 0.8 0.4 0.0
1230 0.4 0.4 0.4 0.0 0.7 2.2 8.0 8.9 5.4 2.6 0.4 0.0 0.4
1300 0.7 0.0 0.0 0.0 0.4 2.2 7.9 8.5 6.0 1.9 0.4 0.0 0.7
MEAN 0.2 0.4 0.2 0.5 3.3 6.8 10.9 13.0 11.5 2.6 0.6 0.4 0.2
Remarks Cases when a certa in phenomenon is not occurred and frequency i s 0 are shaded white
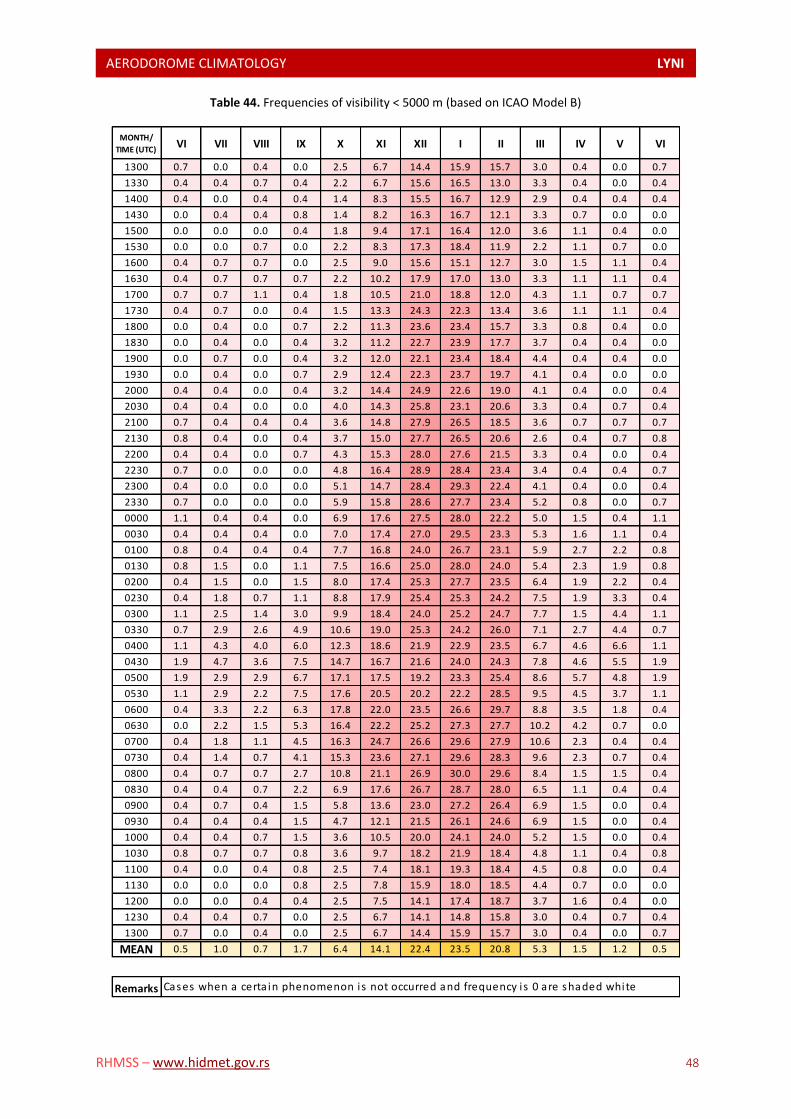
AERODOROME CLIMATOLOGY LYNI L
RHMSS – www.hidmet.gov.rs 48
Table 44. Frequencies of visibility < 5000 m (based on ICAO Model B)
MONTH/
TIME (UTC)VI VII VIII IX X XI XII I II III IV V VI
1300 0.7 0.0 0.4 0.0 2.5 6.7 14.4 15.9 15.7 3.0 0.4 0.0 0.7
1330 0.4 0.4 0.7 0.4 2.2 6.7 15.6 16.5 13.0 3.3 0.4 0.0 0.4
1400 0.4 0.0 0.4 0.4 1.4 8.3 15.5 16.7 12.9 2.9 0.4 0.4 0.4
1430 0.0 0.4 0.4 0.8 1.4 8.2 16.3 16.7 12.1 3.3 0.7 0.0 0.0
1500 0.0 0.0 0.0 0.4 1.8 9.4 17.1 16.4 12.0 3.6 1.1 0.4 0.0
1530 0.0 0.0 0.7 0.0 2.2 8.3 17.3 18.4 11.9 2.2 1.1 0.7 0.0
1600 0.4 0.7 0.7 0.0 2.5 9.0 15.6 15.1 12.7 3.0 1.5 1.1 0.4
1630 0.4 0.7 0.7 0.7 2.2 10.2 17.9 17.0 13.0 3.3 1.1 1.1 0.4
1700 0.7 0.7 1.1 0.4 1.8 10.5 21.0 18.8 12.0 4.3 1.1 0.7 0.7
1730 0.4 0.7 0.0 0.4 1.5 13.3 24.3 22.3 13.4 3.6 1.1 1.1 0.4
1800 0.0 0.4 0.0 0.7 2.2 11.3 23.6 23.4 15.7 3.3 0.8 0.4 0.0
1830 0.0 0.4 0.0 0.4 3.2 11.2 22.7 23.9 17.7 3.7 0.4 0.4 0.0
1900 0.0 0.7 0.0 0.4 3.2 12.0 22.1 23.4 18.4 4.4 0.4 0.4 0.0
1930 0.0 0.4 0.0 0.7 2.9 12.4 22.3 23.7 19.7 4.1 0.4 0.0 0.0
2000 0.4 0.4 0.0 0.4 3.2 14.4 24.9 22.6 19.0 4.1 0.4 0.0 0.4
2030 0.4 0.4 0.0 0.0 4.0 14.3 25.8 23.1 20.6 3.3 0.4 0.7 0.4
2100 0.7 0.4 0.4 0.4 3.6 14.8 27.9 26.5 18.5 3.6 0.7 0.7 0.7
2130 0.8 0.4 0.0 0.4 3.7 15.0 27.7 26.5 20.6 2.6 0.4 0.7 0.8
2200 0.4 0.4 0.0 0.7 4.3 15.3 28.0 27.6 21.5 3.3 0.4 0.0 0.4
2230 0.7 0.0 0.0 0.0 4.8 16.4 28.9 28.4 23.4 3.4 0.4 0.4 0.7
2300 0.4 0.0 0.0 0.0 5.1 14.7 28.4 29.3 22.4 4.1 0.4 0.0 0.4
2330 0.7 0.0 0.0 0.0 5.9 15.8 28.6 27.7 23.4 5.2 0.8 0.0 0.7
0000 1.1 0.4 0.4 0.0 6.9 17.6 27.5 28.0 22.2 5.0 1.5 0.4 1.1
0030 0.4 0.4 0.4 0.0 7.0 17.4 27.0 29.5 23.3 5.3 1.6 1.1 0.4
0100 0.8 0.4 0.4 0.4 7.7 16.8 24.0 26.7 23.1 5.9 2.7 2.2 0.8
0130 0.8 1.5 0.0 1.1 7.5 16.6 25.0 28.0 24.0 5.4 2.3 1.9 0.8
0200 0.4 1.5 0.0 1.5 8.0 17.4 25.3 27.7 23.5 6.4 1.9 2.2 0.4
0230 0.4 1.8 0.7 1.1 8.8 17.9 25.4 25.3 24.2 7.5 1.9 3.3 0.4
0300 1.1 2.5 1.4 3.0 9.9 18.4 24.0 25.2 24.7 7.7 1.5 4.4 1.1
0330 0.7 2.9 2.6 4.9 10.6 19.0 25.3 24.2 26.0 7.1 2.7 4.4 0.7
0400 1.1 4.3 4.0 6.0 12.3 18.6 21.9 22.9 23.5 6.7 4.6 6.6 1.1
0430 1.9 4.7 3.6 7.5 14.7 16.7 21.6 24.0 24.3 7.8 4.6 5.5 1.9
0500 1.9 2.9 2.9 6.7 17.1 17.5 19.2 23.3 25.4 8.6 5.7 4.8 1.9
0530 1.1 2.9 2.2 7.5 17.6 20.5 20.2 22.2 28.5 9.5 4.5 3.7 1.1
0600 0.4 3.3 2.2 6.3 17.8 22.0 23.5 26.6 29.7 8.8 3.5 1.8 0.4
0630 0.0 2.2 1.5 5.3 16.4 22.2 25.2 27.3 27.7 10.2 4.2 0.7 0.0
0700 0.4 1.8 1.1 4.5 16.3 24.7 26.6 29.6 27.9 10.6 2.3 0.4 0.4
0730 0.4 1.4 0.7 4.1 15.3 23.6 27.1 29.6 28.3 9.6 2.3 0.7 0.4
0800 0.4 0.7 0.7 2.7 10.8 21.1 26.9 30.0 29.6 8.4 1.5 1.5 0.4
0830 0.4 0.4 0.7 2.2 6.9 17.6 26.7 28.7 28.0 6.5 1.1 0.4 0.4
0900 0.4 0.7 0.4 1.5 5.8 13.6 23.0 27.2 26.4 6.9 1.5 0.0 0.4
0930 0.4 0.4 0.4 1.5 4.7 12.1 21.5 26.1 24.6 6.9 1.5 0.0 0.4
1000 0.4 0.4 0.7 1.5 3.6 10.5 20.0 24.1 24.0 5.2 1.5 0.0 0.4
1030 0.8 0.7 0.7 0.8 3.6 9.7 18.2 21.9 18.4 4.8 1.1 0.4 0.8
1100 0.4 0.0 0.4 0.8 2.5 7.4 18.1 19.3 18.4 4.5 0.8 0.0 0.4
1130 0.0 0.0 0.0 0.8 2.5 7.8 15.9 18.0 18.5 4.4 0.7 0.0 0.0
1200 0.0 0.0 0.4 0.4 2.5 7.5 14.1 17.4 18.7 3.7 1.6 0.4 0.0
1230 0.4 0.4 0.7 0.0 2.5 6.7 14.1 14.8 15.8 3.0 0.4 0.7 0.4
1300 0.7 0.0 0.4 0.0 2.5 6.7 14.4 15.9 15.7 3.0 0.4 0.0 0.7
MEAN 0.5 1.0 0.7 1.7 6.4 14.1 22.4 23.5 20.8 5.3 1.5 1.2 0.5
Remarks Cases when a certa in phenomenon is not occurred and frequency i s 0 are shaded white
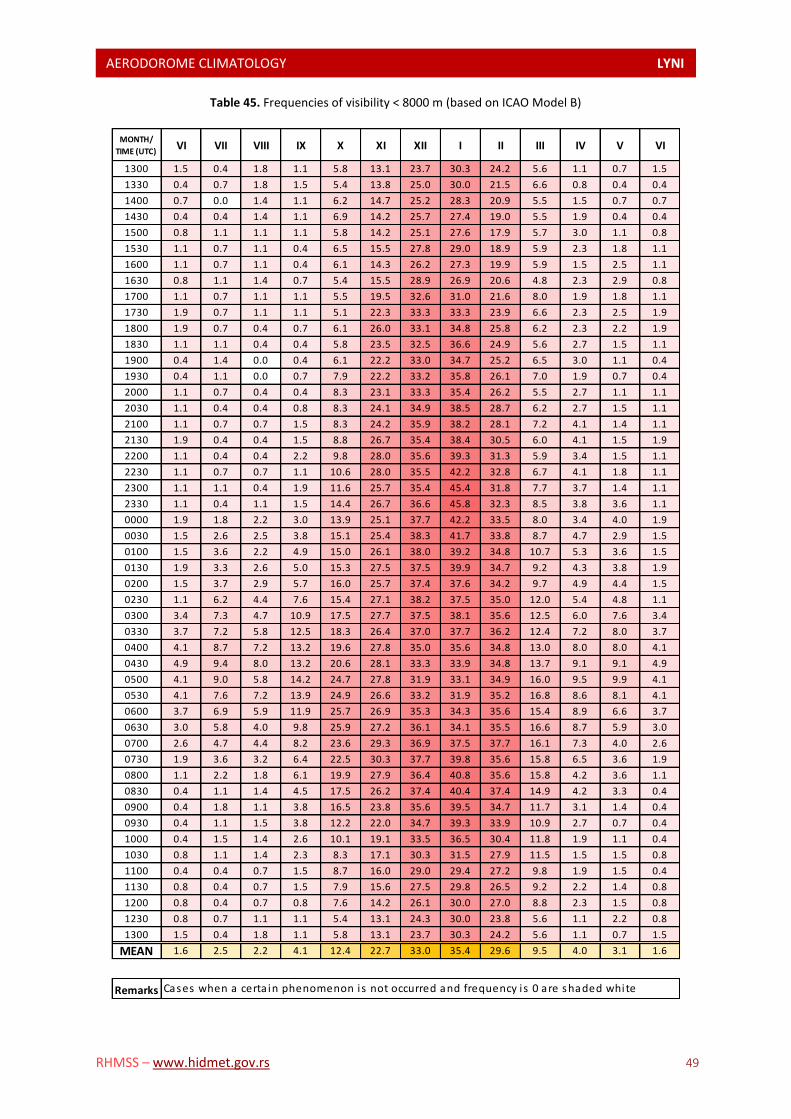
AERODOROME CLIMATOLOGY LYNI L
RHMSS – www.hidmet.gov.rs 49
Table 45. Frequencies of visibility < 8000 m (based on ICAO Model B)
MONTH/
TIME (UTC)VI VII VIII IX X XI XII I II III IV V VI
1300 1.5 0.4 1.8 1.1 5.8 13.1 23.7 30.3 24.2 5.6 1.1 0.7 1.5
1330 0.4 0.7 1.8 1.5 5.4 13.8 25.0 30.0 21.5 6.6 0.8 0.4 0.4
1400 0.7 0.0 1.4 1.1 6.2 14.7 25.2 28.3 20.9 5.5 1.5 0.7 0.7
1430 0.4 0.4 1.4 1.1 6.9 14.2 25.7 27.4 19.0 5.5 1.9 0.4 0.4
1500 0.8 1.1 1.1 1.1 5.8 14.2 25.1 27.6 17.9 5.7 3.0 1.1 0.8
1530 1.1 0.7 1.1 0.4 6.5 15.5 27.8 29.0 18.9 5.9 2.3 1.8 1.1
1600 1.1 0.7 1.1 0.4 6.1 14.3 26.2 27.3 19.9 5.9 1.5 2.5 1.1
1630 0.8 1.1 1.4 0.7 5.4 15.5 28.9 26.9 20.6 4.8 2.3 2.9 0.8
1700 1.1 0.7 1.1 1.1 5.5 19.5 32.6 31.0 21.6 8.0 1.9 1.8 1.1
1730 1.9 0.7 1.1 1.1 5.1 22.3 33.3 33.3 23.9 6.6 2.3 2.5 1.9
1800 1.9 0.7 0.4 0.7 6.1 26.0 33.1 34.8 25.8 6.2 2.3 2.2 1.9
1830 1.1 1.1 0.4 0.4 5.8 23.5 32.5 36.6 24.9 5.6 2.7 1.5 1.1
1900 0.4 1.4 0.0 0.4 6.1 22.2 33.0 34.7 25.2 6.5 3.0 1.1 0.4
1930 0.4 1.1 0.0 0.7 7.9 22.2 33.2 35.8 26.1 7.0 1.9 0.7 0.4
2000 1.1 0.7 0.4 0.4 8.3 23.1 33.3 35.4 26.2 5.5 2.7 1.1 1.1
2030 1.1 0.4 0.4 0.8 8.3 24.1 34.9 38.5 28.7 6.2 2.7 1.5 1.1
2100 1.1 0.7 0.7 1.5 8.3 24.2 35.9 38.2 28.1 7.2 4.1 1.4 1.1
2130 1.9 0.4 0.4 1.5 8.8 26.7 35.4 38.4 30.5 6.0 4.1 1.5 1.9
2200 1.1 0.4 0.4 2.2 9.8 28.0 35.6 39.3 31.3 5.9 3.4 1.5 1.1
2230 1.1 0.7 0.7 1.1 10.6 28.0 35.5 42.2 32.8 6.7 4.1 1.8 1.1
2300 1.1 1.1 0.4 1.9 11.6 25.7 35.4 45.4 31.8 7.7 3.7 1.4 1.1
2330 1.1 0.4 1.1 1.5 14.4 26.7 36.6 45.8 32.3 8.5 3.8 3.6 1.1
0000 1.9 1.8 2.2 3.0 13.9 25.1 37.7 42.2 33.5 8.0 3.4 4.0 1.9
0030 1.5 2.6 2.5 3.8 15.1 25.4 38.3 41.7 33.8 8.7 4.7 2.9 1.5
0100 1.5 3.6 2.2 4.9 15.0 26.1 38.0 39.2 34.8 10.7 5.3 3.6 1.5
0130 1.9 3.3 2.6 5.0 15.3 27.5 37.5 39.9 34.7 9.2 4.3 3.8 1.9
0200 1.5 3.7 2.9 5.7 16.0 25.7 37.4 37.6 34.2 9.7 4.9 4.4 1.5
0230 1.1 6.2 4.4 7.6 15.4 27.1 38.2 37.5 35.0 12.0 5.4 4.8 1.1
0300 3.4 7.3 4.7 10.9 17.5 27.7 37.5 38.1 35.6 12.5 6.0 7.6 3.4
0330 3.7 7.2 5.8 12.5 18.3 26.4 37.0 37.7 36.2 12.4 7.2 8.0 3.7
0400 4.1 8.7 7.2 13.2 19.6 27.8 35.0 35.6 34.8 13.0 8.0 8.0 4.1
0430 4.9 9.4 8.0 13.2 20.6 28.1 33.3 33.9 34.8 13.7 9.1 9.1 4.9
0500 4.1 9.0 5.8 14.2 24.7 27.8 31.9 33.1 34.9 16.0 9.5 9.9 4.1
0530 4.1 7.6 7.2 13.9 24.9 26.6 33.2 31.9 35.2 16.8 8.6 8.1 4.1
0600 3.7 6.9 5.9 11.9 25.7 26.9 35.3 34.3 35.6 15.4 8.9 6.6 3.7
0630 3.0 5.8 4.0 9.8 25.9 27.2 36.1 34.1 35.5 16.6 8.7 5.9 3.0
0700 2.6 4.7 4.4 8.2 23.6 29.3 36.9 37.5 37.7 16.1 7.3 4.0 2.6
0730 1.9 3.6 3.2 6.4 22.5 30.3 37.7 39.8 35.6 15.8 6.5 3.6 1.9
0800 1.1 2.2 1.8 6.1 19.9 27.9 36.4 40.8 35.6 15.8 4.2 3.6 1.1
0830 0.4 1.1 1.4 4.5 17.5 26.2 37.4 40.4 37.4 14.9 4.2 3.3 0.4
0900 0.4 1.8 1.1 3.8 16.5 23.8 35.6 39.5 34.7 11.7 3.1 1.4 0.4
0930 0.4 1.1 1.5 3.8 12.2 22.0 34.7 39.3 33.9 10.9 2.7 0.7 0.4
1000 0.4 1.5 1.4 2.6 10.1 19.1 33.5 36.5 30.4 11.8 1.9 1.1 0.4
1030 0.8 1.1 1.4 2.3 8.3 17.1 30.3 31.5 27.9 11.5 1.5 1.5 0.8
1100 0.4 0.4 0.7 1.5 8.7 16.0 29.0 29.4 27.2 9.8 1.9 1.5 0.4
1130 0.8 0.4 0.7 1.5 7.9 15.6 27.5 29.8 26.5 9.2 2.2 1.4 0.8
1200 0.8 0.4 0.7 0.8 7.6 14.2 26.1 30.0 27.0 8.8 2.3 1.5 0.8
1230 0.8 0.7 1.1 1.1 5.4 13.1 24.3 30.0 23.8 5.6 1.1 2.2 0.8
1300 1.5 0.4 1.8 1.1 5.8 13.1 23.7 30.3 24.2 5.6 1.1 0.7 1.5
MEAN 1.6 2.5 2.2 4.1 12.4 22.7 33.0 35.4 29.6 9.5 4.0 3.1 1.6
Remarks Cases when a certa in phenomenon is not occurred and frequency i s 0 are shaded white
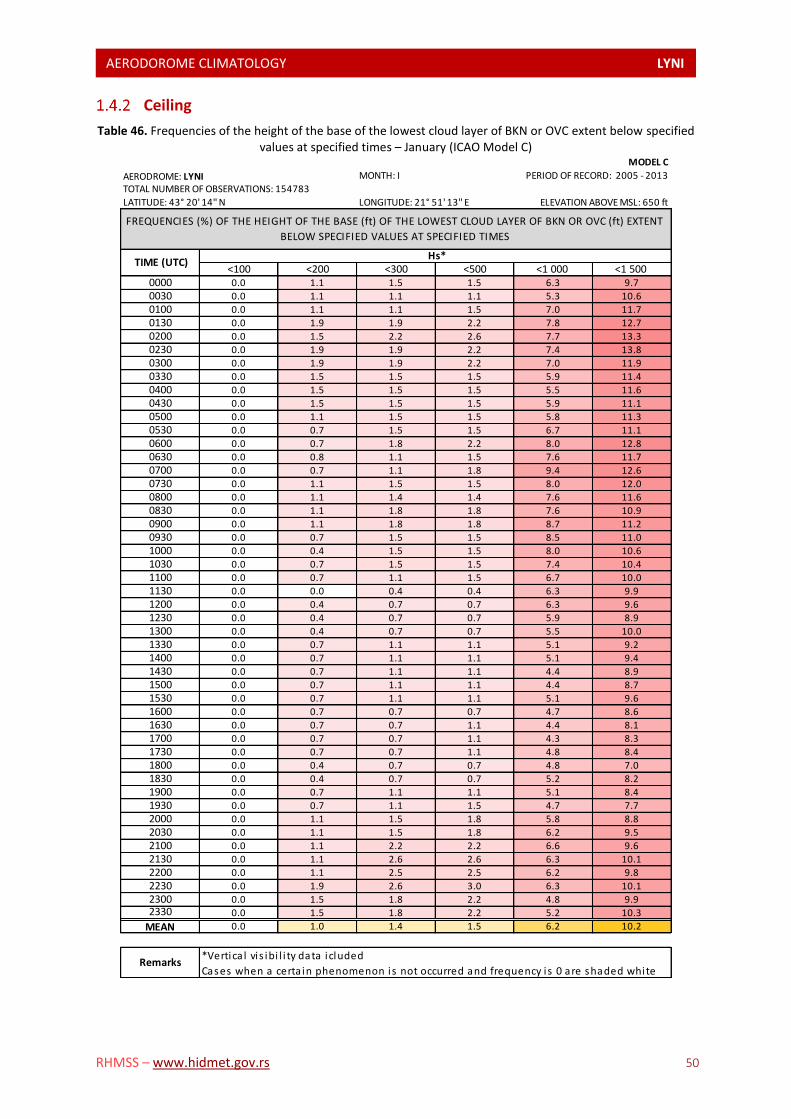
AERODOROME CLIMATOLOGY LYNI L
RHMSS – www.hidmet.gov.rs 50
Ceiling
Table 46. Frequencies of the height of the base of the lowest cloud layer of BKN or OVC extent below specified values at specified times – January (ICAO Model C)
MODEL C
AERODROME: LYNI MONTH: I
TOTAL NUMBER OF OBSERVATIONS: 154783
LATITUDE: 43° 20' 14'' N LONGITUDE: 21° 51' 13'' E
<100 <200 <300 <500 <1 000 <1 500 0000 0.0 1.1 1.5 1.5 6.3 9.7
0030 0.0 1.1 1.1 1.1 5.3 10.6
0100 0.0 1.1 1.1 1.5 7.0 11.7
0130 0.0 1.9 1.9 2.2 7.8 12.7
0200 0.0 1.5 2.2 2.6 7.7 13.3
0230 0.0 1.9 1.9 2.2 7.4 13.8
0300 0.0 1.9 1.9 2.2 7.0 11.9
0330 0.0 1.5 1.5 1.5 5.9 11.4
0400 0.0 1.5 1.5 1.5 5.5 11.6
0430 0.0 1.5 1.5 1.5 5.9 11.1
0500 0.0 1.1 1.5 1.5 5.8 11.3
0530 0.0 0.7 1.5 1.5 6.7 11.1
0600 0.0 0.7 1.8 2.2 8.0 12.8
0630 0.0 0.8 1.1 1.5 7.6 11.7
0700 0.0 0.7 1.1 1.8 9.4 12.6
0730 0.0 1.1 1.5 1.5 8.0 12.0
0800 0.0 1.1 1.4 1.4 7.6 11.6
0830 0.0 1.1 1.8 1.8 7.6 10.9
0900 0.0 1.1 1.8 1.8 8.7 11.2
0930 0.0 0.7 1.5 1.5 8.5 11.0
1000 0.0 0.4 1.5 1.5 8.0 10.6
1030 0.0 0.7 1.5 1.5 7.4 10.4
1100 0.0 0.7 1.1 1.5 6.7 10.0
1130 0.0 0.0 0.4 0.4 6.3 9.9
1200 0.0 0.4 0.7 0.7 6.3 9.6
1230 0.0 0.4 0.7 0.7 5.9 8.9
1300 0.0 0.4 0.7 0.7 5.5 10.0
1330 0.0 0.7 1.1 1.1 5.1 9.2
1400 0.0 0.7 1.1 1.1 5.1 9.4
1430 0.0 0.7 1.1 1.1 4.4 8.9
1500 0.0 0.7 1.1 1.1 4.4 8.7
1530 0.0 0.7 1.1 1.1 5.1 9.6
1600 0.0 0.7 0.7 0.7 4.7 8.6
1630 0.0 0.7 0.7 1.1 4.4 8.1
1700 0.0 0.7 0.7 1.1 4.3 8.3
1730 0.0 0.7 0.7 1.1 4.8 8.4
1800 0.0 0.4 0.7 0.7 4.8 7.0
1830 0.0 0.4 0.7 0.7 5.2 8.2
1900 0.0 0.7 1.1 1.1 5.1 8.4
1930 0.0 0.7 1.1 1.5 4.7 7.7
2000 0.0 1.1 1.5 1.8 5.8 8.8
2030 0.0 1.1 1.5 1.8 6.2 9.5
2100 0.0 1.1 2.2 2.2 6.6 9.6
2130 0.0 1.1 2.6 2.6 6.3 10.1
2200 0.0 1.1 2.5 2.5 6.2 9.8
2230 0.0 1.9 2.6 3.0 6.3 10.1
2300 0.0 1.5 1.8 2.2 4.8 9.92330 0.0 1.5 1.8 2.2 5.2 10.3
MEAN 0.0 1.0 1.4 1.5 6.2 10.2
Remarks*Vertica l vis ibi l i ty data icluded
Cases when a certa in phenomenon is not occurred and frequency i s 0 are shaded white
PERIOD OF RECORD: 2005 - 2013
ELEVATION ABOVE MSL: 650 ft
Hs*
FREQUENCIES (%) OF THE HEIGHT OF THE BASE (ft) OF THE LOWEST CLOUD LAYER OF BKN OR OVC (ft) EXTENT
BELOW SPECIFIED VALUES AT SPECIFIED TIMES
TIME (UTC)
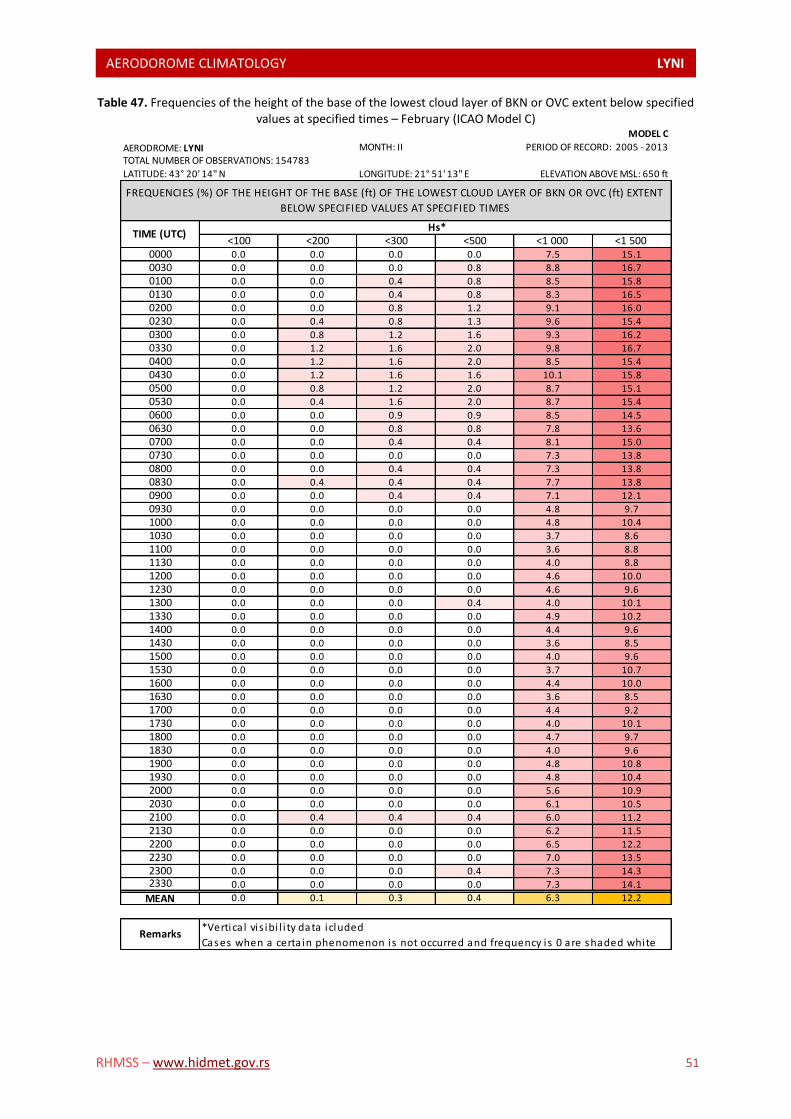
AERODOROME CLIMATOLOGY LYNI L
RHMSS – www.hidmet.gov.rs 51
Table 47. Frequencies of the height of the base of the lowest cloud layer of BKN or OVC extent below specified values at specified times – February (ICAO Model C)
MODEL C
AERODROME: LYNI MONTH: II
TOTAL NUMBER OF OBSERVATIONS: 154783
LATITUDE: 43° 20' 14'' N LONGITUDE: 21° 51' 13'' E
<100 <200 <300 <500 <1 000 <1 500 0000 0.0 0.0 0.0 0.0 7.5 15.1
0030 0.0 0.0 0.0 0.8 8.8 16.7
0100 0.0 0.0 0.4 0.8 8.5 15.8
0130 0.0 0.0 0.4 0.8 8.3 16.5
0200 0.0 0.0 0.8 1.2 9.1 16.0
0230 0.0 0.4 0.8 1.3 9.6 15.4
0300 0.0 0.8 1.2 1.6 9.3 16.2
0330 0.0 1.2 1.6 2.0 9.8 16.7
0400 0.0 1.2 1.6 2.0 8.5 15.4
0430 0.0 1.2 1.6 1.6 10.1 15.8
0500 0.0 0.8 1.2 2.0 8.7 15.1
0530 0.0 0.4 1.6 2.0 8.7 15.4
0600 0.0 0.0 0.9 0.9 8.5 14.5
0630 0.0 0.0 0.8 0.8 7.8 13.6
0700 0.0 0.0 0.4 0.4 8.1 15.0
0730 0.0 0.0 0.0 0.0 7.3 13.8
0800 0.0 0.0 0.4 0.4 7.3 13.8
0830 0.0 0.4 0.4 0.4 7.7 13.8
0900 0.0 0.0 0.4 0.4 7.1 12.1
0930 0.0 0.0 0.0 0.0 4.8 9.7
1000 0.0 0.0 0.0 0.0 4.8 10.4
1030 0.0 0.0 0.0 0.0 3.7 8.6
1100 0.0 0.0 0.0 0.0 3.6 8.8
1130 0.0 0.0 0.0 0.0 4.0 8.8
1200 0.0 0.0 0.0 0.0 4.6 10.0
1230 0.0 0.0 0.0 0.0 4.6 9.6
1300 0.0 0.0 0.0 0.4 4.0 10.1
1330 0.0 0.0 0.0 0.0 4.9 10.2
1400 0.0 0.0 0.0 0.0 4.4 9.6
1430 0.0 0.0 0.0 0.0 3.6 8.5
1500 0.0 0.0 0.0 0.0 4.0 9.6
1530 0.0 0.0 0.0 0.0 3.7 10.7
1600 0.0 0.0 0.0 0.0 4.4 10.0
1630 0.0 0.0 0.0 0.0 3.6 8.5
1700 0.0 0.0 0.0 0.0 4.4 9.2
1730 0.0 0.0 0.0 0.0 4.0 10.1
1800 0.0 0.0 0.0 0.0 4.7 9.7
1830 0.0 0.0 0.0 0.0 4.0 9.6
1900 0.0 0.0 0.0 0.0 4.8 10.8
1930 0.0 0.0 0.0 0.0 4.8 10.4
2000 0.0 0.0 0.0 0.0 5.6 10.9
2030 0.0 0.0 0.0 0.0 6.1 10.5
2100 0.0 0.4 0.4 0.4 6.0 11.2
2130 0.0 0.0 0.0 0.0 6.2 11.5
2200 0.0 0.0 0.0 0.0 6.5 12.2
2230 0.0 0.0 0.0 0.0 7.0 13.5
2300 0.0 0.0 0.0 0.4 7.3 14.32330 0.0 0.0 0.0 0.0 7.3 14.1
MEAN 0.0 0.1 0.3 0.4 6.3 12.2
Remarks*Vertica l vis ibi l i ty data icluded
Cases when a certa in phenomenon is not occurred and frequency i s 0 are shaded white
PERIOD OF RECORD: 2005 - 2013
ELEVATION ABOVE MSL: 650 ft
TIME (UTC) Hs*
FREQUENCIES (%) OF THE HEIGHT OF THE BASE (ft) OF THE LOWEST CLOUD LAYER OF BKN OR OVC (ft) EXTENT
BELOW SPECIFIED VALUES AT SPECIFIED TIMES
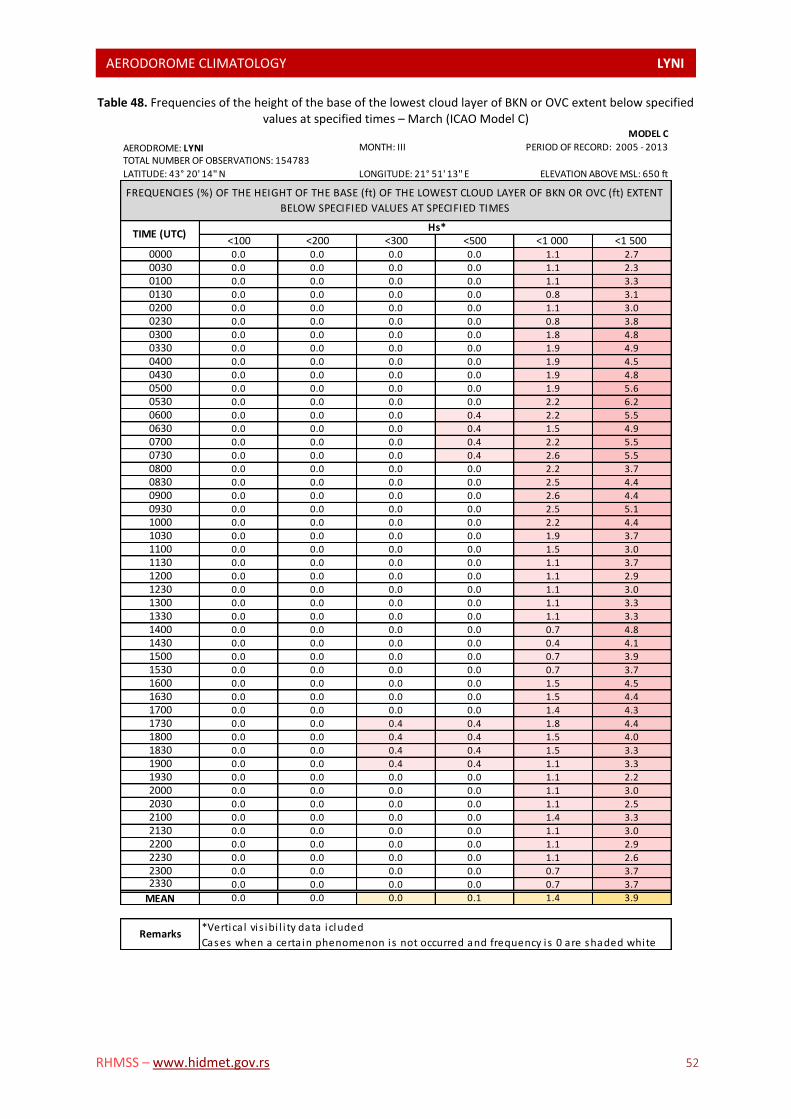
AERODOROME CLIMATOLOGY LYNI L
RHMSS – www.hidmet.gov.rs 52
Table 48. Frequencies of the height of the base of the lowest cloud layer of BKN or OVC extent below specified values at specified times – March (ICAO Model C)
MODEL C
AERODROME: LYNI MONTH: III
TOTAL NUMBER OF OBSERVATIONS: 154783
LATITUDE: 43° 20' 14'' N LONGITUDE: 21° 51' 13'' E
<100 <200 <300 <500 <1 000 <1 500 0000 0.0 0.0 0.0 0.0 1.1 2.7
0030 0.0 0.0 0.0 0.0 1.1 2.3
0100 0.0 0.0 0.0 0.0 1.1 3.3
0130 0.0 0.0 0.0 0.0 0.8 3.1
0200 0.0 0.0 0.0 0.0 1.1 3.0
0230 0.0 0.0 0.0 0.0 0.8 3.8
0300 0.0 0.0 0.0 0.0 1.8 4.8
0330 0.0 0.0 0.0 0.0 1.9 4.9
0400 0.0 0.0 0.0 0.0 1.9 4.5
0430 0.0 0.0 0.0 0.0 1.9 4.8
0500 0.0 0.0 0.0 0.0 1.9 5.6
0530 0.0 0.0 0.0 0.0 2.2 6.2
0600 0.0 0.0 0.0 0.4 2.2 5.5
0630 0.0 0.0 0.0 0.4 1.5 4.9
0700 0.0 0.0 0.0 0.4 2.2 5.5
0730 0.0 0.0 0.0 0.4 2.6 5.5
0800 0.0 0.0 0.0 0.0 2.2 3.7
0830 0.0 0.0 0.0 0.0 2.5 4.4
0900 0.0 0.0 0.0 0.0 2.6 4.4
0930 0.0 0.0 0.0 0.0 2.5 5.1
1000 0.0 0.0 0.0 0.0 2.2 4.4
1030 0.0 0.0 0.0 0.0 1.9 3.7
1100 0.0 0.0 0.0 0.0 1.5 3.0
1130 0.0 0.0 0.0 0.0 1.1 3.7
1200 0.0 0.0 0.0 0.0 1.1 2.9
1230 0.0 0.0 0.0 0.0 1.1 3.0
1300 0.0 0.0 0.0 0.0 1.1 3.3
1330 0.0 0.0 0.0 0.0 1.1 3.3
1400 0.0 0.0 0.0 0.0 0.7 4.8
1430 0.0 0.0 0.0 0.0 0.4 4.1
1500 0.0 0.0 0.0 0.0 0.7 3.9
1530 0.0 0.0 0.0 0.0 0.7 3.7
1600 0.0 0.0 0.0 0.0 1.5 4.5
1630 0.0 0.0 0.0 0.0 1.5 4.4
1700 0.0 0.0 0.0 0.0 1.4 4.3
1730 0.0 0.0 0.4 0.4 1.8 4.4
1800 0.0 0.0 0.4 0.4 1.5 4.0
1830 0.0 0.0 0.4 0.4 1.5 3.3
1900 0.0 0.0 0.4 0.4 1.1 3.3
1930 0.0 0.0 0.0 0.0 1.1 2.2
2000 0.0 0.0 0.0 0.0 1.1 3.0
2030 0.0 0.0 0.0 0.0 1.1 2.5
2100 0.0 0.0 0.0 0.0 1.4 3.3
2130 0.0 0.0 0.0 0.0 1.1 3.0
2200 0.0 0.0 0.0 0.0 1.1 2.9
2230 0.0 0.0 0.0 0.0 1.1 2.6
2300 0.0 0.0 0.0 0.0 0.7 3.72330 0.0 0.0 0.0 0.0 0.7 3.7
MEAN 0.0 0.0 0.0 0.1 1.4 3.9
Remarks*Vertica l vis ibi l i ty data icluded
Cases when a certa in phenomenon is not occurred and frequency i s 0 are shaded white
PERIOD OF RECORD: 2005 - 2013
ELEVATION ABOVE MSL: 650 ft
TIME (UTC) Hs*
FREQUENCIES (%) OF THE HEIGHT OF THE BASE (ft) OF THE LOWEST CLOUD LAYER OF BKN OR OVC (ft) EXTENT
BELOW SPECIFIED VALUES AT SPECIFIED TIMES

AERODOROME CLIMATOLOGY LYNI L
RHMSS – www.hidmet.gov.rs 53
Table 49. Frequencies of the height of the base of the lowest cloud layer of BKN or OVC extent below specified values at specified times – April (ICAO Model C)
MODEL C
AERODROME: LYNI MONTH: IV
TOTAL NUMBER OF OBSERVATIONS: 154783
LATITUDE: 43° 20' 14'' N LONGITUDE: 21° 51' 13'' E
<100 <200 <300 <500 <1 000 <1 500 0000 0.0 0.0 0.0 0.0 0.4 1.5
0030 0.0 0.0 0.0 0.0 0.4 1.6
0100 0.0 0.0 0.0 0.0 0.4 1.5
0130 0.0 0.0 0.0 0.0 0.8 1.2
0200 0.0 0.0 0.0 0.0 0.8 1.1
0230 0.0 0.0 0.0 0.0 0.8 1.1
0300 0.0 0.0 0.0 0.0 0.4 1.5
0330 0.0 0.0 0.0 0.0 0.4 1.5
0400 0.0 0.0 0.0 0.0 1.1 1.9
0430 0.0 0.0 0.0 0.0 0.4 1.1
0500 0.0 0.0 0.0 0.0 1.1 2.3
0530 0.0 0.0 0.0 0.0 0.7 1.5
0600 0.0 0.4 0.4 0.4 0.8 1.9
0630 0.0 0.0 0.0 0.0 0.4 1.5
0700 0.0 0.0 0.0 0.0 0.4 1.9
0730 0.0 0.0 0.0 0.0 0.0 1.5
0800 0.0 0.0 0.0 0.0 0.0 1.1
0830 0.0 0.0 0.0 0.0 0.0 0.8
0900 0.0 0.0 0.0 0.0 0.4 0.8
0930 0.0 0.0 0.0 0.0 0.4 0.8
1000 0.0 0.0 0.0 0.0 0.8 0.8
1030 0.0 0.0 0.0 0.0 0.4 0.4
1100 0.0 0.0 0.0 0.0 0.4 0.4
1130 0.0 0.0 0.0 0.0 0.7 0.7
1200 0.0 0.0 0.0 0.0 0.4 0.4
1230 0.0 0.0 0.0 0.0 0.4 0.4
1300 0.0 0.0 0.0 0.0 0.4 0.4
1330 0.0 0.0 0.0 0.0 0.0 0.0
1400 0.0 0.0 0.0 0.0 0.0 0.4
1430 0.0 0.0 0.0 0.0 0.0 0.7
1500 0.0 0.0 0.0 0.0 0.0 0.8
1530 0.0 0.0 0.0 0.0 0.0 0.4
1600 0.0 0.0 0.0 0.0 0.4 0.8
1630 0.0 0.0 0.0 0.0 0.4 0.8
1700 0.0 0.0 0.0 0.0 0.4 1.1
1730 0.0 0.0 0.0 0.0 0.4 1.1
1800 0.0 0.0 0.0 0.0 0.8 1.1
1830 0.0 0.0 0.0 0.0 0.8 1.1
1900 0.0 0.0 0.0 0.0 0.4 0.4
1930 0.0 0.0 0.0 0.0 0.4 0.4
2000 0.0 0.0 0.0 0.0 0.4 0.4
2030 0.0 0.0 0.0 0.0 0.4 0.4
2100 0.0 0.0 0.0 0.0 0.4 1.1
2130 0.0 0.0 0.0 0.0 0.4 1.1
2200 0.0 0.0 0.0 0.0 0.8 1.5
2230 0.0 0.0 0.0 0.0 0.7 1.5
2300 0.0 0.0 0.0 0.0 0.4 1.52330 0.0 0.0 0.0 0.0 0.4 1.5
MEAN 0.0 0.0 0.0 0.0 0.4 1.0
Remarks*Vertica l vis ibi l i ty data icluded
Cases when a certa in phenomenon is not occurred and frequency i s 0 are shaded white
PERIOD OF RECORD: 2005 - 2013
ELEVATION ABOVE MSL: 650 ft
TIME (UTC) Hs*
FREQUENCIES (%) OF THE HEIGHT OF THE BASE (ft) OF THE LOWEST CLOUD LAYER OF BKN OR OVC (ft) EXTENT
BELOW SPECIFIED VALUES AT SPECIFIED TIMES
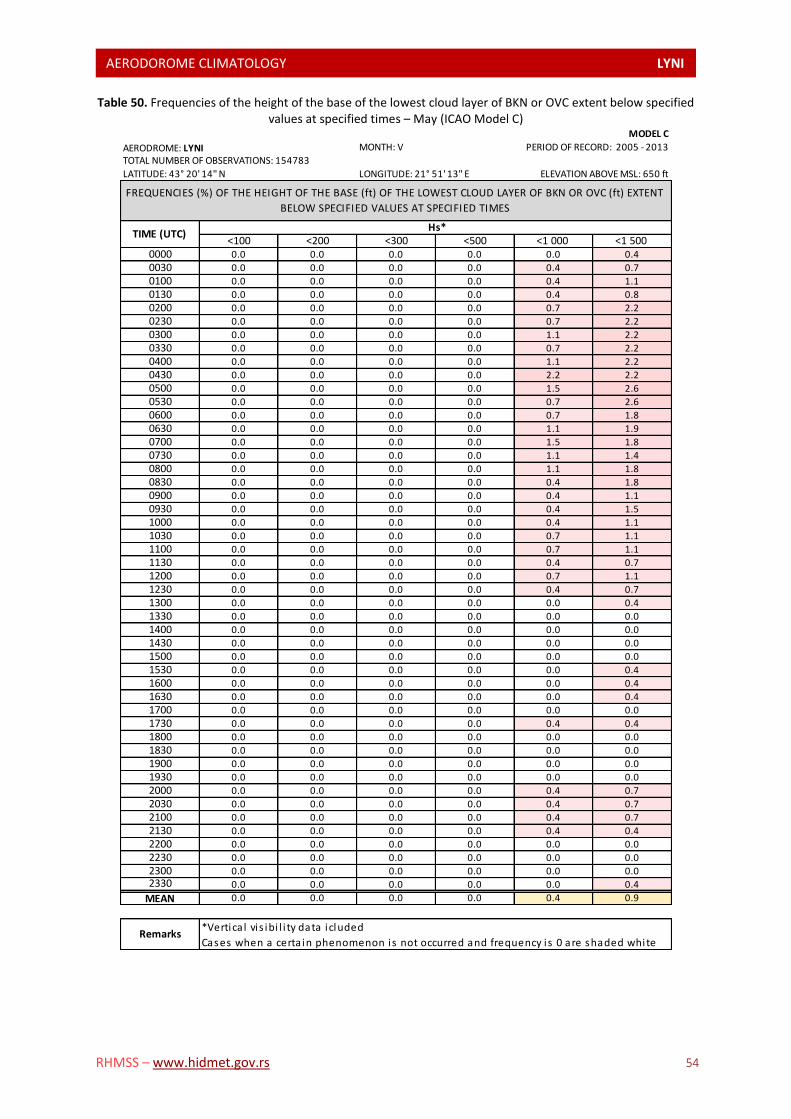
AERODOROME CLIMATOLOGY LYNI L
RHMSS – www.hidmet.gov.rs 54
Table 50. Frequencies of the height of the base of the lowest cloud layer of BKN or OVC extent below specified values at specified times – May (ICAO Model C)
MODEL C
AERODROME: LYNI MONTH: V
TOTAL NUMBER OF OBSERVATIONS: 154783
LATITUDE: 43° 20' 14'' N LONGITUDE: 21° 51' 13'' E
<100 <200 <300 <500 <1 000 <1 500 0000 0.0 0.0 0.0 0.0 0.0 0.4
0030 0.0 0.0 0.0 0.0 0.4 0.7
0100 0.0 0.0 0.0 0.0 0.4 1.1
0130 0.0 0.0 0.0 0.0 0.4 0.8
0200 0.0 0.0 0.0 0.0 0.7 2.2
0230 0.0 0.0 0.0 0.0 0.7 2.2
0300 0.0 0.0 0.0 0.0 1.1 2.2
0330 0.0 0.0 0.0 0.0 0.7 2.2
0400 0.0 0.0 0.0 0.0 1.1 2.2
0430 0.0 0.0 0.0 0.0 2.2 2.2
0500 0.0 0.0 0.0 0.0 1.5 2.6
0530 0.0 0.0 0.0 0.0 0.7 2.6
0600 0.0 0.0 0.0 0.0 0.7 1.8
0630 0.0 0.0 0.0 0.0 1.1 1.9
0700 0.0 0.0 0.0 0.0 1.5 1.8
0730 0.0 0.0 0.0 0.0 1.1 1.4
0800 0.0 0.0 0.0 0.0 1.1 1.8
0830 0.0 0.0 0.0 0.0 0.4 1.8
0900 0.0 0.0 0.0 0.0 0.4 1.1
0930 0.0 0.0 0.0 0.0 0.4 1.5
1000 0.0 0.0 0.0 0.0 0.4 1.1
1030 0.0 0.0 0.0 0.0 0.7 1.1
1100 0.0 0.0 0.0 0.0 0.7 1.1
1130 0.0 0.0 0.0 0.0 0.4 0.7
1200 0.0 0.0 0.0 0.0 0.7 1.1
1230 0.0 0.0 0.0 0.0 0.4 0.7
1300 0.0 0.0 0.0 0.0 0.0 0.4
1330 0.0 0.0 0.0 0.0 0.0 0.0
1400 0.0 0.0 0.0 0.0 0.0 0.0
1430 0.0 0.0 0.0 0.0 0.0 0.0
1500 0.0 0.0 0.0 0.0 0.0 0.0
1530 0.0 0.0 0.0 0.0 0.0 0.4
1600 0.0 0.0 0.0 0.0 0.0 0.4
1630 0.0 0.0 0.0 0.0 0.0 0.4
1700 0.0 0.0 0.0 0.0 0.0 0.0
1730 0.0 0.0 0.0 0.0 0.4 0.4
1800 0.0 0.0 0.0 0.0 0.0 0.0
1830 0.0 0.0 0.0 0.0 0.0 0.0
1900 0.0 0.0 0.0 0.0 0.0 0.0
1930 0.0 0.0 0.0 0.0 0.0 0.0
2000 0.0 0.0 0.0 0.0 0.4 0.7
2030 0.0 0.0 0.0 0.0 0.4 0.7
2100 0.0 0.0 0.0 0.0 0.4 0.7
2130 0.0 0.0 0.0 0.0 0.4 0.4
2200 0.0 0.0 0.0 0.0 0.0 0.0
2230 0.0 0.0 0.0 0.0 0.0 0.0
2300 0.0 0.0 0.0 0.0 0.0 0.02330 0.0 0.0 0.0 0.0 0.0 0.4
MEAN 0.0 0.0 0.0 0.0 0.4 0.9
Remarks*Vertica l vis ibi l i ty data icluded
Cases when a certa in phenomenon is not occurred and frequency i s 0 are shaded white
PERIOD OF RECORD: 2005 - 2013
ELEVATION ABOVE MSL: 650 ft
TIME (UTC) Hs*
FREQUENCIES (%) OF THE HEIGHT OF THE BASE (ft) OF THE LOWEST CLOUD LAYER OF BKN OR OVC (ft) EXTENT
BELOW SPECIFIED VALUES AT SPECIFIED TIMES
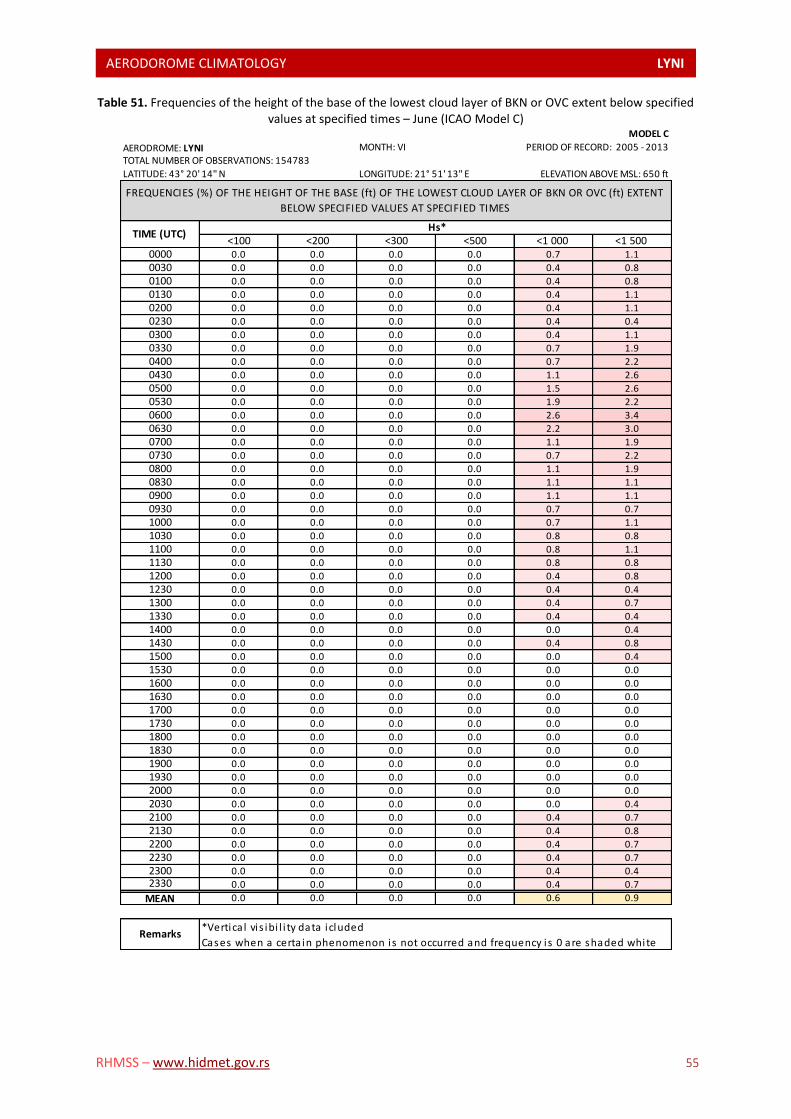
AERODOROME CLIMATOLOGY LYNI L
RHMSS – www.hidmet.gov.rs 55
Table 51. Frequencies of the height of the base of the lowest cloud layer of BKN or OVC extent below specified values at specified times – June (ICAO Model C)
MODEL C
AERODROME: LYNI MONTH: VI
TOTAL NUMBER OF OBSERVATIONS: 154783
LATITUDE: 43° 20' 14'' N LONGITUDE: 21° 51' 13'' E
<100 <200 <300 <500 <1 000 <1 500 0000 0.0 0.0 0.0 0.0 0.7 1.1
0030 0.0 0.0 0.0 0.0 0.4 0.8
0100 0.0 0.0 0.0 0.0 0.4 0.8
0130 0.0 0.0 0.0 0.0 0.4 1.1
0200 0.0 0.0 0.0 0.0 0.4 1.1
0230 0.0 0.0 0.0 0.0 0.4 0.4
0300 0.0 0.0 0.0 0.0 0.4 1.1
0330 0.0 0.0 0.0 0.0 0.7 1.9
0400 0.0 0.0 0.0 0.0 0.7 2.2
0430 0.0 0.0 0.0 0.0 1.1 2.6
0500 0.0 0.0 0.0 0.0 1.5 2.6
0530 0.0 0.0 0.0 0.0 1.9 2.2
0600 0.0 0.0 0.0 0.0 2.6 3.4
0630 0.0 0.0 0.0 0.0 2.2 3.0
0700 0.0 0.0 0.0 0.0 1.1 1.9
0730 0.0 0.0 0.0 0.0 0.7 2.2
0800 0.0 0.0 0.0 0.0 1.1 1.9
0830 0.0 0.0 0.0 0.0 1.1 1.1
0900 0.0 0.0 0.0 0.0 1.1 1.1
0930 0.0 0.0 0.0 0.0 0.7 0.7
1000 0.0 0.0 0.0 0.0 0.7 1.1
1030 0.0 0.0 0.0 0.0 0.8 0.8
1100 0.0 0.0 0.0 0.0 0.8 1.1
1130 0.0 0.0 0.0 0.0 0.8 0.8
1200 0.0 0.0 0.0 0.0 0.4 0.8
1230 0.0 0.0 0.0 0.0 0.4 0.4
1300 0.0 0.0 0.0 0.0 0.4 0.7
1330 0.0 0.0 0.0 0.0 0.4 0.4
1400 0.0 0.0 0.0 0.0 0.0 0.4
1430 0.0 0.0 0.0 0.0 0.4 0.8
1500 0.0 0.0 0.0 0.0 0.0 0.4
1530 0.0 0.0 0.0 0.0 0.0 0.0
1600 0.0 0.0 0.0 0.0 0.0 0.0
1630 0.0 0.0 0.0 0.0 0.0 0.0
1700 0.0 0.0 0.0 0.0 0.0 0.0
1730 0.0 0.0 0.0 0.0 0.0 0.0
1800 0.0 0.0 0.0 0.0 0.0 0.0
1830 0.0 0.0 0.0 0.0 0.0 0.0
1900 0.0 0.0 0.0 0.0 0.0 0.0
1930 0.0 0.0 0.0 0.0 0.0 0.0
2000 0.0 0.0 0.0 0.0 0.0 0.0
2030 0.0 0.0 0.0 0.0 0.0 0.4
2100 0.0 0.0 0.0 0.0 0.4 0.7
2130 0.0 0.0 0.0 0.0 0.4 0.8
2200 0.0 0.0 0.0 0.0 0.4 0.7
2230 0.0 0.0 0.0 0.0 0.4 0.7
2300 0.0 0.0 0.0 0.0 0.4 0.42330 0.0 0.0 0.0 0.0 0.4 0.7
MEAN 0.0 0.0 0.0 0.0 0.6 0.9
Remarks*Vertica l vis ibi l i ty data icluded
Cases when a certa in phenomenon is not occurred and frequency i s 0 are shaded white
PERIOD OF RECORD: 2005 - 2013
ELEVATION ABOVE MSL: 650 ft
TIME (UTC) Hs*
FREQUENCIES (%) OF THE HEIGHT OF THE BASE (ft) OF THE LOWEST CLOUD LAYER OF BKN OR OVC (ft) EXTENT
BELOW SPECIFIED VALUES AT SPECIFIED TIMES
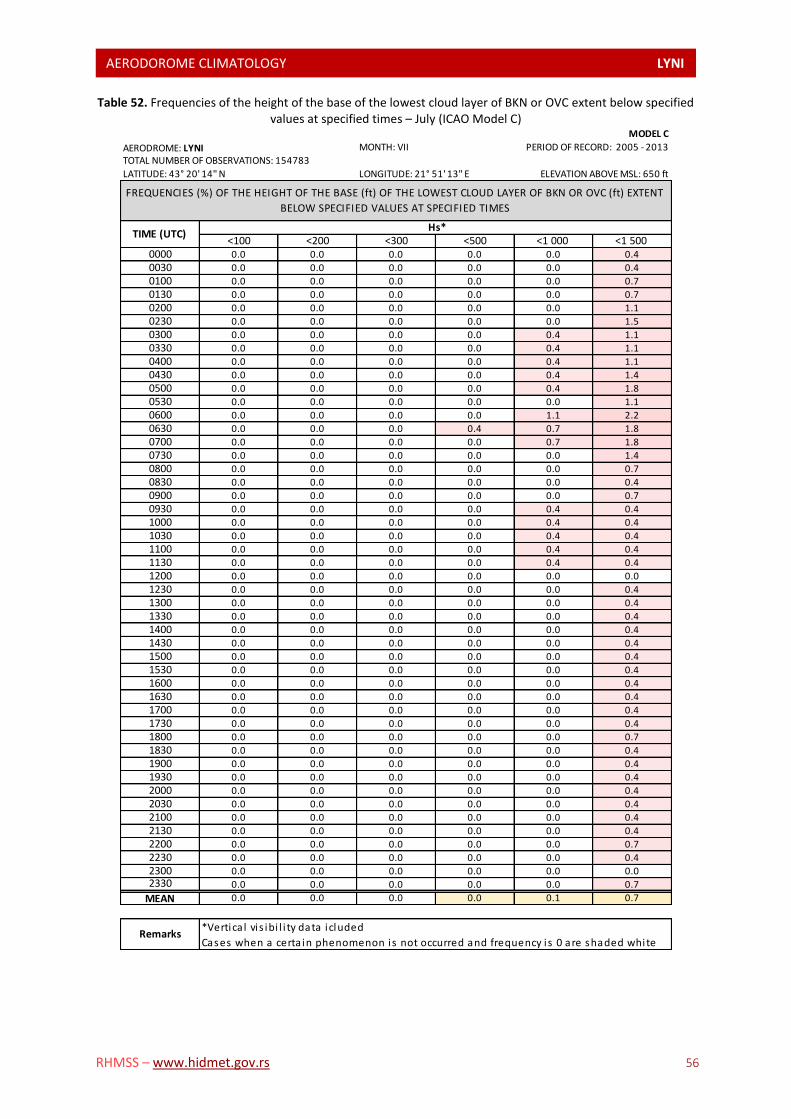
AERODOROME CLIMATOLOGY LYNI L
RHMSS – www.hidmet.gov.rs 56
Table 52. Frequencies of the height of the base of the lowest cloud layer of BKN or OVC extent below specified values at specified times – July (ICAO Model C)
MODEL C
AERODROME: LYNI MONTH: VII
TOTAL NUMBER OF OBSERVATIONS: 154783
LATITUDE: 43° 20' 14'' N LONGITUDE: 21° 51' 13'' E
<100 <200 <300 <500 <1 000 <1 500 0000 0.0 0.0 0.0 0.0 0.0 0.4
0030 0.0 0.0 0.0 0.0 0.0 0.4
0100 0.0 0.0 0.0 0.0 0.0 0.7
0130 0.0 0.0 0.0 0.0 0.0 0.7
0200 0.0 0.0 0.0 0.0 0.0 1.1
0230 0.0 0.0 0.0 0.0 0.0 1.5
0300 0.0 0.0 0.0 0.0 0.4 1.1
0330 0.0 0.0 0.0 0.0 0.4 1.1
0400 0.0 0.0 0.0 0.0 0.4 1.1
0430 0.0 0.0 0.0 0.0 0.4 1.4
0500 0.0 0.0 0.0 0.0 0.4 1.8
0530 0.0 0.0 0.0 0.0 0.0 1.1
0600 0.0 0.0 0.0 0.0 1.1 2.2
0630 0.0 0.0 0.0 0.4 0.7 1.8
0700 0.0 0.0 0.0 0.0 0.7 1.8
0730 0.0 0.0 0.0 0.0 0.0 1.4
0800 0.0 0.0 0.0 0.0 0.0 0.7
0830 0.0 0.0 0.0 0.0 0.0 0.4
0900 0.0 0.0 0.0 0.0 0.0 0.7
0930 0.0 0.0 0.0 0.0 0.4 0.4
1000 0.0 0.0 0.0 0.0 0.4 0.4
1030 0.0 0.0 0.0 0.0 0.4 0.4
1100 0.0 0.0 0.0 0.0 0.4 0.4
1130 0.0 0.0 0.0 0.0 0.4 0.4
1200 0.0 0.0 0.0 0.0 0.0 0.0
1230 0.0 0.0 0.0 0.0 0.0 0.4
1300 0.0 0.0 0.0 0.0 0.0 0.4
1330 0.0 0.0 0.0 0.0 0.0 0.4
1400 0.0 0.0 0.0 0.0 0.0 0.4
1430 0.0 0.0 0.0 0.0 0.0 0.4
1500 0.0 0.0 0.0 0.0 0.0 0.4
1530 0.0 0.0 0.0 0.0 0.0 0.4
1600 0.0 0.0 0.0 0.0 0.0 0.4
1630 0.0 0.0 0.0 0.0 0.0 0.4
1700 0.0 0.0 0.0 0.0 0.0 0.4
1730 0.0 0.0 0.0 0.0 0.0 0.4
1800 0.0 0.0 0.0 0.0 0.0 0.7
1830 0.0 0.0 0.0 0.0 0.0 0.4
1900 0.0 0.0 0.0 0.0 0.0 0.4
1930 0.0 0.0 0.0 0.0 0.0 0.4
2000 0.0 0.0 0.0 0.0 0.0 0.4
2030 0.0 0.0 0.0 0.0 0.0 0.4
2100 0.0 0.0 0.0 0.0 0.0 0.4
2130 0.0 0.0 0.0 0.0 0.0 0.4
2200 0.0 0.0 0.0 0.0 0.0 0.7
2230 0.0 0.0 0.0 0.0 0.0 0.4
2300 0.0 0.0 0.0 0.0 0.0 0.02330 0.0 0.0 0.0 0.0 0.0 0.7
MEAN 0.0 0.0 0.0 0.0 0.1 0.7
Remarks*Vertica l vis ibi l i ty data icluded
Cases when a certa in phenomenon is not occurred and frequency i s 0 are shaded white
PERIOD OF RECORD: 2005 - 2013
ELEVATION ABOVE MSL: 650 ft
TIME (UTC) Hs*
FREQUENCIES (%) OF THE HEIGHT OF THE BASE (ft) OF THE LOWEST CLOUD LAYER OF BKN OR OVC (ft) EXTENT
BELOW SPECIFIED VALUES AT SPECIFIED TIMES

AERODOROME CLIMATOLOGY LYNI L
RHMSS – www.hidmet.gov.rs 57
Table 53. Frequencies of the height of the base of the lowest cloud layer of BKN or OVC extent below specified values at specified times – August (ICAO Model C)
MODEL C
AERODROME: LYNI MONTH: VIII
TOTAL NUMBER OF OBSERVATIONS: 154783
LATITUDE: 43° 20' 14'' N LONGITUDE: 21° 51' 13'' E
<100 <200 <300 <500 <1 000 <1 500 0000 0.0 0.0 0.0 0.0 0.0 0.4
0030 0.0 0.0 0.0 0.0 0.4 1.1
0100 0.0 0.0 0.0 0.0 0.4 0.4
0130 0.0 0.0 0.0 0.0 0.4 0.4
0200 0.0 0.0 0.0 0.0 0.4 0.4
0230 0.0 0.0 0.0 0.0 0.4 0.7
0300 0.0 0.0 0.0 0.0 0.0 0.4
0330 0.0 0.0 0.0 0.0 0.0 0.4
0400 0.0 0.0 0.0 0.4 0.7 0.7
0430 0.0 0.0 0.0 0.4 0.7 1.1
0500 0.0 0.0 0.0 0.4 1.5 1.8
0530 0.0 0.0 0.0 0.4 1.1 1.4
0600 0.0 0.0 0.0 0.0 0.7 1.5
0630 0.0 0.0 0.0 0.0 0.7 1.1
0700 0.0 0.0 0.0 0.0 0.7 1.1
0730 0.0 0.0 0.0 0.0 0.4 0.7
0800 0.0 0.0 0.0 0.0 0.4 0.7
0830 0.0 0.0 0.0 0.0 0.4 0.7
0900 0.0 0.0 0.0 0.0 0.4 0.7
0930 0.0 0.0 0.0 0.0 0.4 0.7
1000 0.0 0.0 0.0 0.0 0.0 0.0
1030 0.0 0.0 0.0 0.0 0.0 0.0
1100 0.0 0.0 0.0 0.0 0.0 0.0
1130 0.0 0.0 0.0 0.0 0.0 0.0
1200 0.0 0.0 0.0 0.0 0.0 0.0
1230 0.0 0.0 0.0 0.0 0.4 0.4
1300 0.0 0.0 0.0 0.0 0.4 0.4
1330 0.0 0.0 0.0 0.0 0.4 0.4
1400 0.0 0.0 0.0 0.0 0.4 0.4
1430 0.0 0.0 0.0 0.0 0.4 0.4
1500 0.0 0.0 0.0 0.0 0.0 0.0
1530 0.0 0.0 0.0 0.0 0.0 0.0
1600 0.0 0.0 0.0 0.0 0.0 0.0
1630 0.0 0.0 0.0 0.0 0.0 0.0
1700 0.0 0.0 0.0 0.0 0.0 0.7
1730 0.0 0.0 0.0 0.0 0.0 0.7
1800 0.0 0.0 0.0 0.0 0.0 0.4
1830 0.0 0.0 0.0 0.0 0.0 0.4
1900 0.0 0.0 0.0 0.0 0.0 0.4
1930 0.0 0.0 0.0 0.0 0.0 0.4
2000 0.0 0.0 0.0 0.0 0.0 0.4
2030 0.0 0.0 0.0 0.0 0.0 0.4
2100 0.0 0.0 0.0 0.0 0.0 0.4
2130 0.0 0.0 0.0 0.0 0.0 0.0
2200 0.0 0.0 0.0 0.0 0.0 0.0
2230 0.0 0.0 0.0 0.0 0.0 0.0
2300 0.0 0.0 0.0 0.0 0.0 0.42330 0.0 0.0 0.0 0.0 0.0 0.4
MEAN 0.0 0.0 0.0 0.0 0.2 0.5
Remarks*Vertica l vis ibi l i ty data icluded
Cases when a certa in phenomenon is not occurred and frequency i s 0 are shaded white
PERIOD OF RECORD: 2005 - 2013
ELEVATION ABOVE MSL: 650 ft
TIME (UTC) Hs*
FREQUENCIES (%) OF THE HEIGHT OF THE BASE (ft) OF THE LOWEST CLOUD LAYER OF BKN OR OVC (ft) EXTENT
BELOW SPECIFIED VALUES AT SPECIFIED TIMES
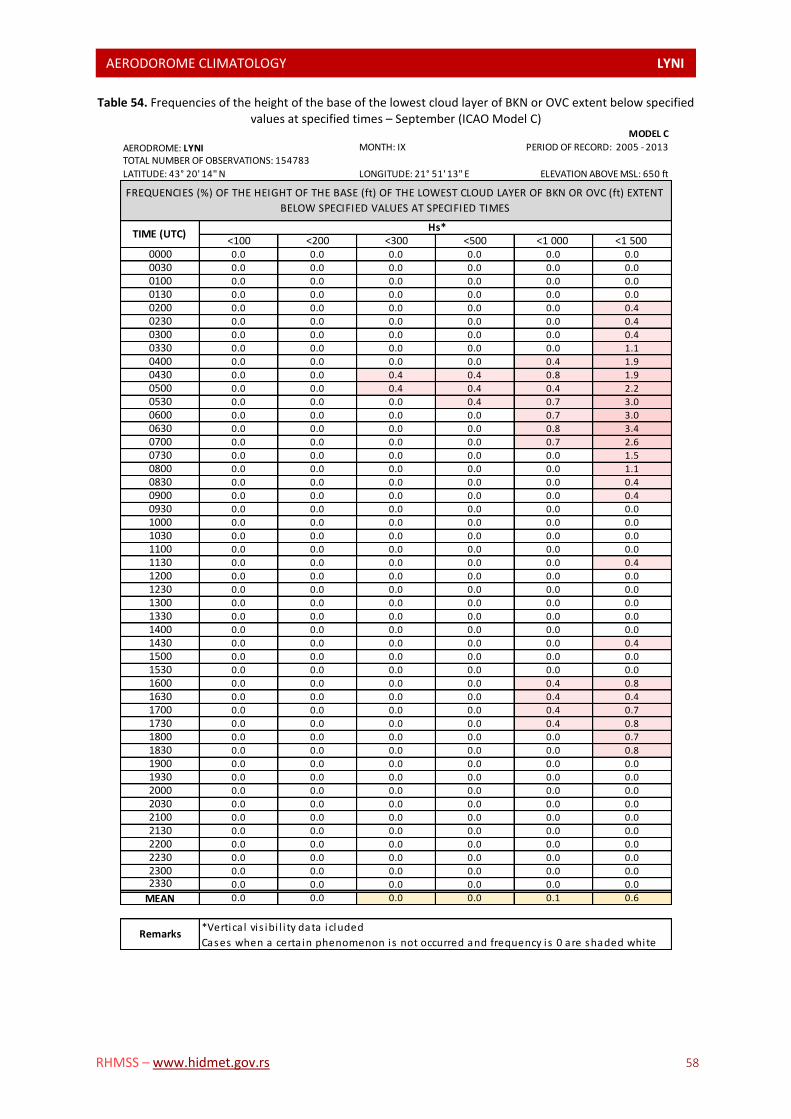
AERODOROME CLIMATOLOGY LYNI L
RHMSS – www.hidmet.gov.rs 58
Table 54. Frequencies of the height of the base of the lowest cloud layer of BKN or OVC extent below specified values at specified times – September (ICAO Model C)
MODEL C
AERODROME: LYNI MONTH: IX
TOTAL NUMBER OF OBSERVATIONS: 154783
LATITUDE: 43° 20' 14'' N LONGITUDE: 21° 51' 13'' E
<100 <200 <300 <500 <1 000 <1 500 0000 0.0 0.0 0.0 0.0 0.0 0.0
0030 0.0 0.0 0.0 0.0 0.0 0.0
0100 0.0 0.0 0.0 0.0 0.0 0.0
0130 0.0 0.0 0.0 0.0 0.0 0.0
0200 0.0 0.0 0.0 0.0 0.0 0.4
0230 0.0 0.0 0.0 0.0 0.0 0.4
0300 0.0 0.0 0.0 0.0 0.0 0.4
0330 0.0 0.0 0.0 0.0 0.0 1.1
0400 0.0 0.0 0.0 0.0 0.4 1.9
0430 0.0 0.0 0.4 0.4 0.8 1.9
0500 0.0 0.0 0.4 0.4 0.4 2.2
0530 0.0 0.0 0.0 0.4 0.7 3.0
0600 0.0 0.0 0.0 0.0 0.7 3.0
0630 0.0 0.0 0.0 0.0 0.8 3.4
0700 0.0 0.0 0.0 0.0 0.7 2.6
0730 0.0 0.0 0.0 0.0 0.0 1.5
0800 0.0 0.0 0.0 0.0 0.0 1.1
0830 0.0 0.0 0.0 0.0 0.0 0.4
0900 0.0 0.0 0.0 0.0 0.0 0.4
0930 0.0 0.0 0.0 0.0 0.0 0.0
1000 0.0 0.0 0.0 0.0 0.0 0.0
1030 0.0 0.0 0.0 0.0 0.0 0.0
1100 0.0 0.0 0.0 0.0 0.0 0.0
1130 0.0 0.0 0.0 0.0 0.0 0.4
1200 0.0 0.0 0.0 0.0 0.0 0.0
1230 0.0 0.0 0.0 0.0 0.0 0.0
1300 0.0 0.0 0.0 0.0 0.0 0.0
1330 0.0 0.0 0.0 0.0 0.0 0.0
1400 0.0 0.0 0.0 0.0 0.0 0.0
1430 0.0 0.0 0.0 0.0 0.0 0.4
1500 0.0 0.0 0.0 0.0 0.0 0.0
1530 0.0 0.0 0.0 0.0 0.0 0.0
1600 0.0 0.0 0.0 0.0 0.4 0.8
1630 0.0 0.0 0.0 0.0 0.4 0.4
1700 0.0 0.0 0.0 0.0 0.4 0.7
1730 0.0 0.0 0.0 0.0 0.4 0.8
1800 0.0 0.0 0.0 0.0 0.0 0.7
1830 0.0 0.0 0.0 0.0 0.0 0.8
1900 0.0 0.0 0.0 0.0 0.0 0.0
1930 0.0 0.0 0.0 0.0 0.0 0.0
2000 0.0 0.0 0.0 0.0 0.0 0.0
2030 0.0 0.0 0.0 0.0 0.0 0.0
2100 0.0 0.0 0.0 0.0 0.0 0.0
2130 0.0 0.0 0.0 0.0 0.0 0.0
2200 0.0 0.0 0.0 0.0 0.0 0.0
2230 0.0 0.0 0.0 0.0 0.0 0.0
2300 0.0 0.0 0.0 0.0 0.0 0.02330 0.0 0.0 0.0 0.0 0.0 0.0
MEAN 0.0 0.0 0.0 0.0 0.1 0.6
Remarks*Vertica l vis ibi l i ty data icluded
Cases when a certa in phenomenon is not occurred and frequency i s 0 are shaded white
PERIOD OF RECORD: 2005 - 2013
ELEVATION ABOVE MSL: 650 ft
TIME (UTC) Hs*
FREQUENCIES (%) OF THE HEIGHT OF THE BASE (ft) OF THE LOWEST CLOUD LAYER OF BKN OR OVC (ft) EXTENT
BELOW SPECIFIED VALUES AT SPECIFIED TIMES
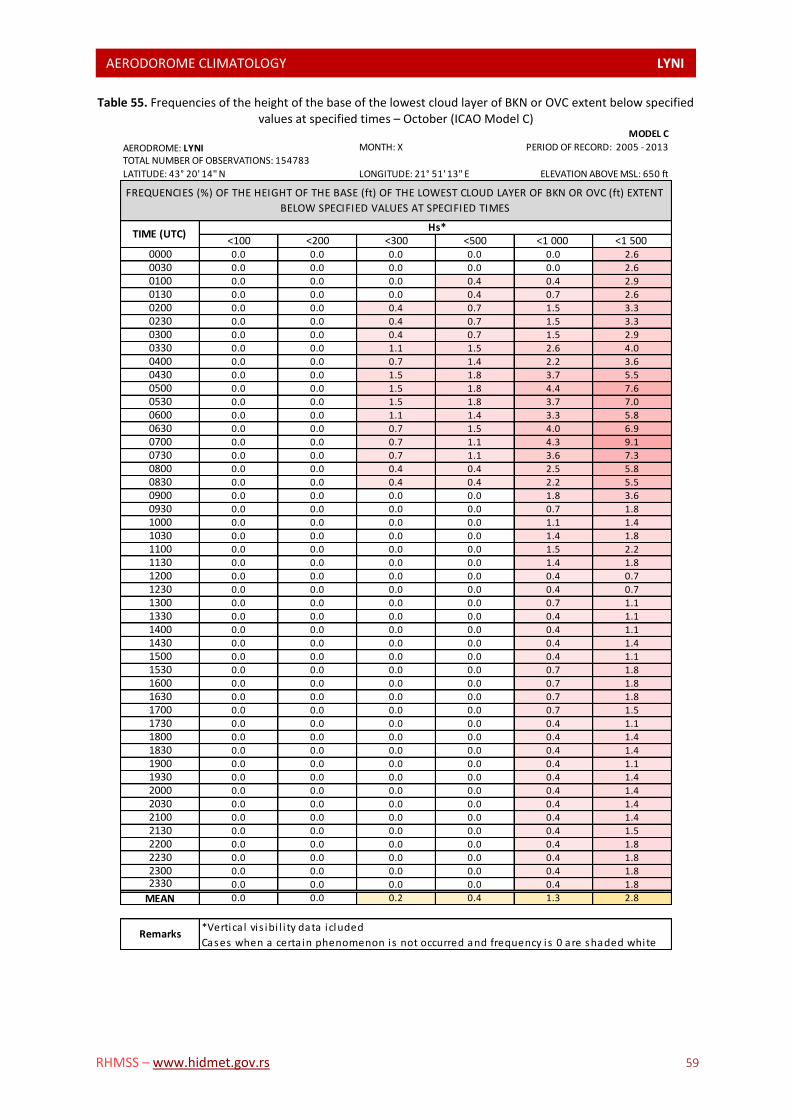
AERODOROME CLIMATOLOGY LYNI L
RHMSS – www.hidmet.gov.rs 59
Table 55. Frequencies of the height of the base of the lowest cloud layer of BKN or OVC extent below specified values at specified times – October (ICAO Model C)
MODEL C
AERODROME: LYNI MONTH: X
TOTAL NUMBER OF OBSERVATIONS: 154783
LATITUDE: 43° 20' 14'' N LONGITUDE: 21° 51' 13'' E
<100 <200 <300 <500 <1 000 <1 500 0000 0.0 0.0 0.0 0.0 0.0 2.6
0030 0.0 0.0 0.0 0.0 0.0 2.6
0100 0.0 0.0 0.0 0.4 0.4 2.9
0130 0.0 0.0 0.0 0.4 0.7 2.6
0200 0.0 0.0 0.4 0.7 1.5 3.3
0230 0.0 0.0 0.4 0.7 1.5 3.3
0300 0.0 0.0 0.4 0.7 1.5 2.9
0330 0.0 0.0 1.1 1.5 2.6 4.0
0400 0.0 0.0 0.7 1.4 2.2 3.6
0430 0.0 0.0 1.5 1.8 3.7 5.5
0500 0.0 0.0 1.5 1.8 4.4 7.6
0530 0.0 0.0 1.5 1.8 3.7 7.0
0600 0.0 0.0 1.1 1.4 3.3 5.8
0630 0.0 0.0 0.7 1.5 4.0 6.9
0700 0.0 0.0 0.7 1.1 4.3 9.1
0730 0.0 0.0 0.7 1.1 3.6 7.3
0800 0.0 0.0 0.4 0.4 2.5 5.8
0830 0.0 0.0 0.4 0.4 2.2 5.5
0900 0.0 0.0 0.0 0.0 1.8 3.6
0930 0.0 0.0 0.0 0.0 0.7 1.8
1000 0.0 0.0 0.0 0.0 1.1 1.4
1030 0.0 0.0 0.0 0.0 1.4 1.8
1100 0.0 0.0 0.0 0.0 1.5 2.2
1130 0.0 0.0 0.0 0.0 1.4 1.8
1200 0.0 0.0 0.0 0.0 0.4 0.7
1230 0.0 0.0 0.0 0.0 0.4 0.7
1300 0.0 0.0 0.0 0.0 0.7 1.1
1330 0.0 0.0 0.0 0.0 0.4 1.1
1400 0.0 0.0 0.0 0.0 0.4 1.1
1430 0.0 0.0 0.0 0.0 0.4 1.4
1500 0.0 0.0 0.0 0.0 0.4 1.1
1530 0.0 0.0 0.0 0.0 0.7 1.8
1600 0.0 0.0 0.0 0.0 0.7 1.8
1630 0.0 0.0 0.0 0.0 0.7 1.8
1700 0.0 0.0 0.0 0.0 0.7 1.5
1730 0.0 0.0 0.0 0.0 0.4 1.1
1800 0.0 0.0 0.0 0.0 0.4 1.4
1830 0.0 0.0 0.0 0.0 0.4 1.4
1900 0.0 0.0 0.0 0.0 0.4 1.1
1930 0.0 0.0 0.0 0.0 0.4 1.4
2000 0.0 0.0 0.0 0.0 0.4 1.4
2030 0.0 0.0 0.0 0.0 0.4 1.4
2100 0.0 0.0 0.0 0.0 0.4 1.4
2130 0.0 0.0 0.0 0.0 0.4 1.5
2200 0.0 0.0 0.0 0.0 0.4 1.8
2230 0.0 0.0 0.0 0.0 0.4 1.8
2300 0.0 0.0 0.0 0.0 0.4 1.82330 0.0 0.0 0.0 0.0 0.4 1.8
MEAN 0.0 0.0 0.2 0.4 1.3 2.8
Remarks*Vertica l vis ibi l i ty data icluded
Cases when a certa in phenomenon is not occurred and frequency i s 0 are shaded white
PERIOD OF RECORD: 2005 - 2013
ELEVATION ABOVE MSL: 650 ft
TIME (UTC) Hs*
FREQUENCIES (%) OF THE HEIGHT OF THE BASE (ft) OF THE LOWEST CLOUD LAYER OF BKN OR OVC (ft) EXTENT
BELOW SPECIFIED VALUES AT SPECIFIED TIMES
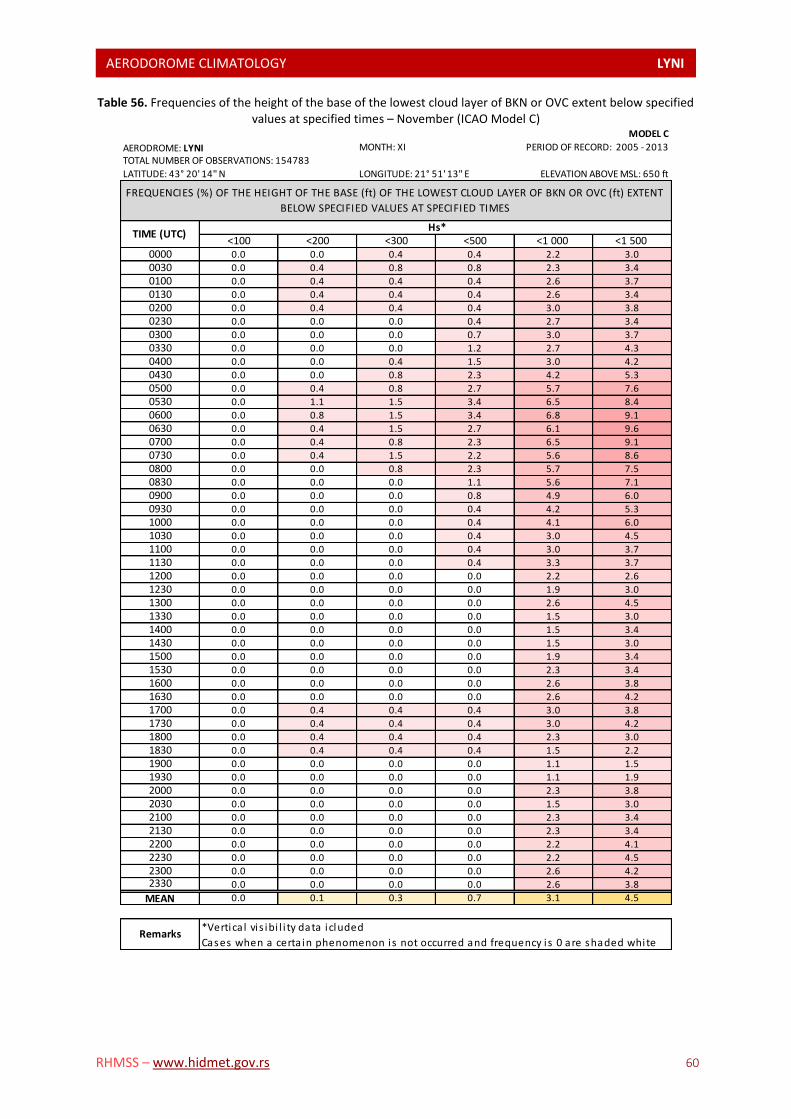
AERODOROME CLIMATOLOGY LYNI L
RHMSS – www.hidmet.gov.rs 60
Table 56. Frequencies of the height of the base of the lowest cloud layer of BKN or OVC extent below specified values at specified times – November (ICAO Model C)
MODEL C
AERODROME: LYNI MONTH: XI
TOTAL NUMBER OF OBSERVATIONS: 154783
LATITUDE: 43° 20' 14'' N LONGITUDE: 21° 51' 13'' E
<100 <200 <300 <500 <1 000 <1 500 0000 0.0 0.0 0.4 0.4 2.2 3.0
0030 0.0 0.4 0.8 0.8 2.3 3.4
0100 0.0 0.4 0.4 0.4 2.6 3.7
0130 0.0 0.4 0.4 0.4 2.6 3.4
0200 0.0 0.4 0.4 0.4 3.0 3.8
0230 0.0 0.0 0.0 0.4 2.7 3.4
0300 0.0 0.0 0.0 0.7 3.0 3.7
0330 0.0 0.0 0.0 1.2 2.7 4.3
0400 0.0 0.0 0.4 1.5 3.0 4.2
0430 0.0 0.0 0.8 2.3 4.2 5.3
0500 0.0 0.4 0.8 2.7 5.7 7.6
0530 0.0 1.1 1.5 3.4 6.5 8.4
0600 0.0 0.8 1.5 3.4 6.8 9.1
0630 0.0 0.4 1.5 2.7 6.1 9.6
0700 0.0 0.4 0.8 2.3 6.5 9.1
0730 0.0 0.4 1.5 2.2 5.6 8.6
0800 0.0 0.0 0.8 2.3 5.7 7.5
0830 0.0 0.0 0.0 1.1 5.6 7.1
0900 0.0 0.0 0.0 0.8 4.9 6.0
0930 0.0 0.0 0.0 0.4 4.2 5.3
1000 0.0 0.0 0.0 0.4 4.1 6.0
1030 0.0 0.0 0.0 0.4 3.0 4.5
1100 0.0 0.0 0.0 0.4 3.0 3.7
1130 0.0 0.0 0.0 0.4 3.3 3.7
1200 0.0 0.0 0.0 0.0 2.2 2.6
1230 0.0 0.0 0.0 0.0 1.9 3.0
1300 0.0 0.0 0.0 0.0 2.6 4.5
1330 0.0 0.0 0.0 0.0 1.5 3.0
1400 0.0 0.0 0.0 0.0 1.5 3.4
1430 0.0 0.0 0.0 0.0 1.5 3.0
1500 0.0 0.0 0.0 0.0 1.9 3.4
1530 0.0 0.0 0.0 0.0 2.3 3.4
1600 0.0 0.0 0.0 0.0 2.6 3.8
1630 0.0 0.0 0.0 0.0 2.6 4.2
1700 0.0 0.4 0.4 0.4 3.0 3.8
1730 0.0 0.4 0.4 0.4 3.0 4.2
1800 0.0 0.4 0.4 0.4 2.3 3.0
1830 0.0 0.4 0.4 0.4 1.5 2.2
1900 0.0 0.0 0.0 0.0 1.1 1.5
1930 0.0 0.0 0.0 0.0 1.1 1.9
2000 0.0 0.0 0.0 0.0 2.3 3.8
2030 0.0 0.0 0.0 0.0 1.5 3.0
2100 0.0 0.0 0.0 0.0 2.3 3.4
2130 0.0 0.0 0.0 0.0 2.3 3.4
2200 0.0 0.0 0.0 0.0 2.2 4.1
2230 0.0 0.0 0.0 0.0 2.2 4.5
2300 0.0 0.0 0.0 0.0 2.6 4.22330 0.0 0.0 0.0 0.0 2.6 3.8
MEAN 0.0 0.1 0.3 0.7 3.1 4.5
Remarks*Vertica l vis ibi l i ty data icluded
Cases when a certa in phenomenon is not occurred and frequency i s 0 are shaded white
PERIOD OF RECORD: 2005 - 2013
ELEVATION ABOVE MSL: 650 ft
TIME (UTC) Hs*
FREQUENCIES (%) OF THE HEIGHT OF THE BASE (ft) OF THE LOWEST CLOUD LAYER OF BKN OR OVC (ft) EXTENT
BELOW SPECIFIED VALUES AT SPECIFIED TIMES

AERODOROME CLIMATOLOGY LYNI L
RHMSS – www.hidmet.gov.rs 61
Table 57. Frequencies of the height of the base of the lowest cloud layer of BKN or OVC extent below specified values at specified times – December (ICAO Model C)
MODEL C
AERODROME: LYNI MONTH: XII
TOTAL NUMBER OF OBSERVATIONS: 154783
LATITUDE: 43° 20' 14'' N LONGITUDE: 21° 51' 13'' E
<100 <200 <300 <500 <1 000 <1 500 0000 0.0 1.1 1.5 1.8 7.0 13.6
0030 0.0 1.5 1.8 2.2 7.3 13.5
0100 0.0 1.1 1.5 1.8 6.3 13.3
0130 0.0 1.1 2.2 2.9 7.4 14.3
0200 0.0 1.5 1.8 2.6 7.0 14.3
0230 0.0 1.5 1.8 2.9 8.1 15.4
0300 0.0 1.5 1.8 2.5 8.0 15.6
0330 0.0 1.5 2.2 2.6 8.8 16.5
0400 0.0 1.5 1.8 3.3 9.5 16.4
0430 0.0 0.7 1.5 2.6 8.8 15.8
0500 0.0 1.1 1.4 2.2 9.4 18.1
0530 0.0 1.4 2.2 3.2 9.7 17.3
0600 0.0 1.1 1.8 2.9 9.2 14.3
0630 0.0 1.1 1.8 2.6 9.9 16.4
0700 0.0 1.1 1.8 2.2 9.9 16.1
0730 0.0 0.7 1.5 2.2 8.8 14.7
0800 0.0 0.7 1.5 1.8 9.5 14.9
0830 0.0 0.4 0.7 1.5 8.8 15.0
0900 0.0 0.0 0.4 1.9 7.0 12.6
0930 0.0 0.0 0.4 1.5 7.3 13.1
1000 0.0 0.0 0.4 1.5 6.9 12.0
1030 0.0 0.0 0.0 1.8 6.9 10.9
1100 0.0 0.0 0.0 1.4 5.1 8.0
1130 0.0 0.0 0.0 1.4 4.7 8.3
1200 0.0 0.0 0.0 1.1 4.3 8.3
1230 0.0 0.0 0.0 0.7 3.6 8.7
1300 0.0 0.0 0.0 0.7 3.2 8.6
1330 0.0 0.0 0.0 0.7 4.3 8.0
1400 0.0 0.0 0.0 0.4 5.0 7.9
1430 0.0 0.0 0.0 0.7 4.7 7.6
1500 0.0 0.0 0.4 0.7 4.7 8.0
1530 0.0 0.7 0.7 1.1 4.7 8.3
1600 0.0 0.7 0.7 1.1 4.4 8.7
1630 0.0 0.7 0.7 1.1 4.0 9.2
1700 0.0 0.7 1.1 1.4 3.6 9.1
1730 0.0 1.1 1.1 1.1 3.6 9.1
1800 0.0 1.1 1.1 1.1 3.6 8.0
1830 0.0 1.1 1.1 1.1 4.0 7.9
1900 0.0 1.1 1.1 1.1 4.0 7.6
1930 0.0 1.1 1.1 1.5 4.0 7.3
2000 0.0 1.1 1.1 1.5 3.7 7.3
2030 0.0 1.1 1.1 1.5 4.0 8.0
2100 0.0 1.1 1.1 1.1 4.0 9.4
2130 0.0 1.1 1.1 1.1 3.6 9.9
2200 0.0 1.1 1.1 1.1 4.4 12.4
2230 0.0 1.1 1.1 1.1 3.7 12.1
2300 0.0 1.1 1.5 1.5 4.4 12.52330 0.0 1.1 1.5 1.5 4.4 12.5
MEAN 0.0 0.8 1.0 1.6 6.0 11.6
Remarks*Vertica l vis ibi l i ty data icluded
Cases when a certa in phenomenon is not occurred and frequency i s 0 are shaded white
PERIOD OF RECORD: 2005 - 2013
ELEVATION ABOVE MSL: 650 ft
TIME (UTC) Hs*
FREQUENCIES (%) OF THE HEIGHT OF THE BASE (ft) OF THE LOWEST CLOUD LAYER OF BKN OR OVC (ft) EXTENT
BELOW SPECIFIED VALUES AT SPECIFIED TIMES

AERODOROME CLIMATOLOGY LYNI L
RHMSS – www.hidmet.gov.rs 62
Table 58. Frequencies of the height of the base of the lowest cloud layer of BKN or OVC < 100 ft (based on ICAO Model C)
MONTH/
TIME (UTC)VI VII VIII IX X XI XII I II III IV V VI
1300 0.0 0.0 0.0 0.0 0.0 0.0 0.0 0.0 0.0 0.0 0.0 0.0 0.0
1330 0.0 0.0 0.0 0.0 0.0 0.0 0.0 0.0 0.0 0.0 0.0 0.0 0.0
1400 0.0 0.0 0.0 0.0 0.0 0.0 0.0 0.0 0.0 0.0 0.0 0.0 0.0
1430 0.0 0.0 0.0 0.0 0.0 0.0 0.0 0.0 0.0 0.0 0.0 0.0 0.0
1500 0.0 0.0 0.0 0.0 0.0 0.0 0.0 0.0 0.0 0.0 0.0 0.0 0.0
1530 0.0 0.0 0.0 0.0 0.0 0.0 0.0 0.0 0.0 0.0 0.0 0.0 0.0
1600 0.0 0.0 0.0 0.0 0.0 0.0 0.0 0.0 0.0 0.0 0.0 0.0 0.0
1630 0.0 0.0 0.0 0.0 0.0 0.0 0.0 0.0 0.0 0.0 0.0 0.0 0.0
1700 0.0 0.0 0.0 0.0 0.0 0.0 0.0 0.0 0.0 0.0 0.0 0.0 0.0
1730 0.0 0.0 0.0 0.0 0.0 0.0 0.0 0.0 0.0 0.0 0.0 0.0 0.0
1800 0.0 0.0 0.0 0.0 0.0 0.0 0.0 0.0 0.0 0.0 0.0 0.0 0.0
1830 0.0 0.0 0.0 0.0 0.0 0.0 0.0 0.0 0.0 0.0 0.0 0.0 0.0
1900 0.0 0.0 0.0 0.0 0.0 0.0 0.0 0.0 0.0 0.0 0.0 0.0 0.0
1930 0.0 0.0 0.0 0.0 0.0 0.0 0.0 0.0 0.0 0.0 0.0 0.0 0.0
2000 0.0 0.0 0.0 0.0 0.0 0.0 0.0 0.0 0.0 0.0 0.0 0.0 0.0
2030 0.0 0.0 0.0 0.0 0.0 0.0 0.0 0.0 0.0 0.0 0.0 0.0 0.0
2100 0.0 0.0 0.0 0.0 0.0 0.0 0.0 0.0 0.0 0.0 0.0 0.0 0.0
2130 0.0 0.0 0.0 0.0 0.0 0.0 0.0 0.0 0.0 0.0 0.0 0.0 0.0
2200 0.0 0.0 0.0 0.0 0.0 0.0 0.0 0.0 0.0 0.0 0.0 0.0 0.0
2230 0.0 0.0 0.0 0.0 0.0 0.0 0.0 0.0 0.0 0.0 0.0 0.0 0.0
2300 0.0 0.0 0.0 0.0 0.0 0.0 0.0 0.0 0.0 0.0 0.0 0.0 0.0
2330 0.0 0.0 0.0 0.0 0.0 0.0 0.0 0.0 0.0 0.0 0.0 0.0 0.0
0000 0.0 0.0 0.0 0.0 0.0 0.0 0.0 0.0 0.0 0.0 0.0 0.0 0.0
0030 0.0 0.0 0.0 0.0 0.0 0.0 0.0 0.0 0.0 0.0 0.0 0.0 0.0
0100 0.0 0.0 0.0 0.0 0.0 0.0 0.0 0.0 0.0 0.0 0.0 0.0 0.0
0130 0.0 0.0 0.0 0.0 0.0 0.0 0.0 0.0 0.0 0.0 0.0 0.0 0.0
0200 0.0 0.0 0.0 0.0 0.0 0.0 0.0 0.0 0.0 0.0 0.0 0.0 0.0
0230 0.0 0.0 0.0 0.0 0.0 0.0 0.0 0.0 0.0 0.0 0.0 0.0 0.0
0300 0.0 0.0 0.0 0.0 0.0 0.0 0.0 0.0 0.0 0.0 0.0 0.0 0.0
0330 0.0 0.0 0.0 0.0 0.0 0.0 0.0 0.0 0.0 0.0 0.0 0.0 0.0
0400 0.0 0.0 0.0 0.0 0.0 0.0 0.0 0.0 0.0 0.0 0.0 0.0 0.0
0430 0.0 0.0 0.0 0.0 0.0 0.0 0.0 0.0 0.0 0.0 0.0 0.0 0.0
0500 0.0 0.0 0.0 0.0 0.0 0.0 0.0 0.0 0.0 0.0 0.0 0.0 0.0
0530 0.0 0.0 0.0 0.0 0.0 0.0 0.0 0.0 0.0 0.0 0.0 0.0 0.0
0600 0.0 0.0 0.0 0.0 0.0 0.0 0.0 0.0 0.0 0.0 0.0 0.0 0.0
0630 0.0 0.0 0.0 0.0 0.0 0.0 0.0 0.0 0.0 0.0 0.0 0.0 0.0
0700 0.0 0.0 0.0 0.0 0.0 0.0 0.0 0.0 0.0 0.0 0.0 0.0 0.0
0730 0.0 0.0 0.0 0.0 0.0 0.0 0.0 0.0 0.0 0.0 0.0 0.0 0.0
0800 0.0 0.0 0.0 0.0 0.0 0.0 0.0 0.0 0.0 0.0 0.0 0.0 0.0
0830 0.0 0.0 0.0 0.0 0.0 0.0 0.0 0.0 0.0 0.0 0.0 0.0 0.0
0900 0.0 0.0 0.0 0.0 0.0 0.0 0.0 0.0 0.0 0.0 0.0 0.0 0.0
0930 0.0 0.0 0.0 0.0 0.0 0.0 0.0 0.0 0.0 0.0 0.0 0.0 0.0
1000 0.0 0.0 0.0 0.0 0.0 0.0 0.0 0.0 0.0 0.0 0.0 0.0 0.0
1030 0.0 0.0 0.0 0.0 0.0 0.0 0.0 0.0 0.0 0.0 0.0 0.0 0.0
1100 0.0 0.0 0.0 0.0 0.0 0.0 0.0 0.0 0.0 0.0 0.0 0.0 0.0
1130 0.0 0.0 0.0 0.0 0.0 0.0 0.0 0.0 0.0 0.0 0.0 0.0 0.0
1200 0.0 0.0 0.0 0.0 0.0 0.0 0.0 0.0 0.0 0.0 0.0 0.0 0.0
1230 0.0 0.0 0.0 0.0 0.0 0.0 0.0 0.0 0.0 0.0 0.0 0.0 0.0
1300 0.0 0.0 0.0 0.0 0.0 0.0 0.0 0.0 0.0 0.0 0.0 0.0 0.0
MEAN 0.0 0.0 0.0 0.0 0.0 0.0 0.0 0.0 0.0 0.0 0.0 0.0 0.0
Remarks Cases when a certa in phenomenon is not occurred and frequency i s 0 are shaded white
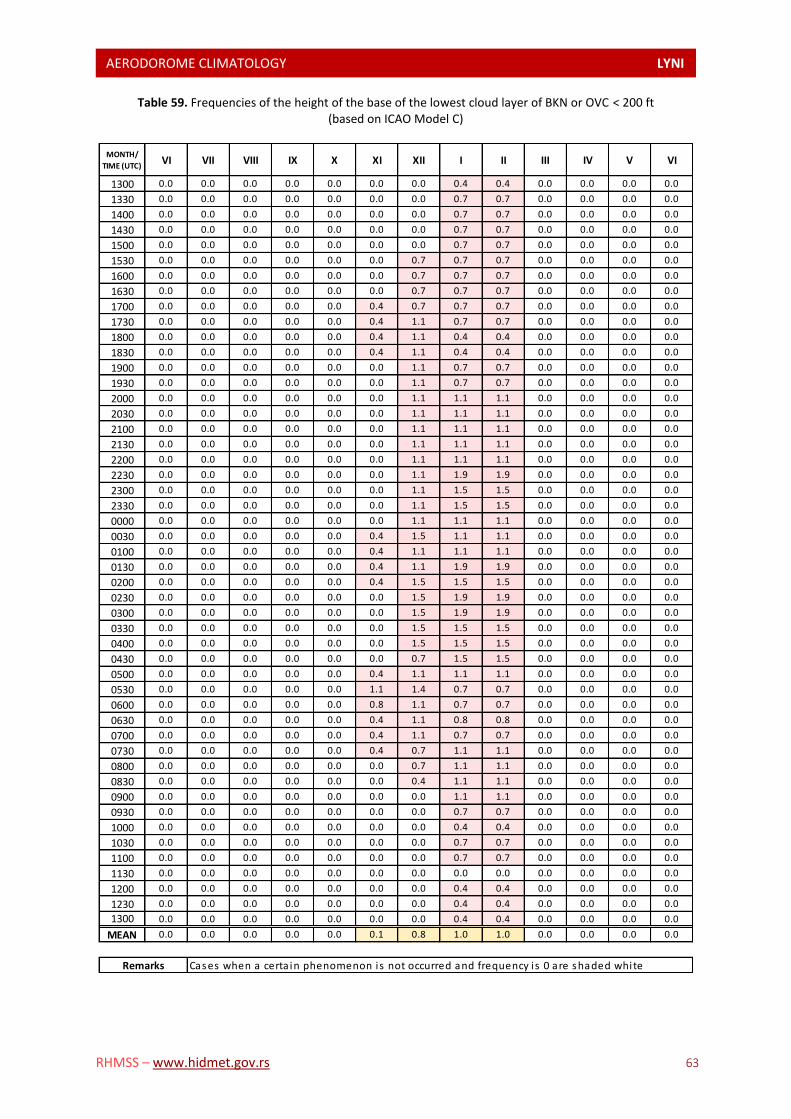
AERODOROME CLIMATOLOGY LYNI L
RHMSS – www.hidmet.gov.rs 63
Table 59. Frequencies of the height of the base of the lowest cloud layer of BKN or OVC < 200 ft (based on ICAO Model C)
MONTH/
TIME (UTC)VI VII VIII IX X XI XII I II III IV V VI
1300 0.0 0.0 0.0 0.0 0.0 0.0 0.0 0.4 0.4 0.0 0.0 0.0 0.0
1330 0.0 0.0 0.0 0.0 0.0 0.0 0.0 0.7 0.7 0.0 0.0 0.0 0.0
1400 0.0 0.0 0.0 0.0 0.0 0.0 0.0 0.7 0.7 0.0 0.0 0.0 0.0
1430 0.0 0.0 0.0 0.0 0.0 0.0 0.0 0.7 0.7 0.0 0.0 0.0 0.0
1500 0.0 0.0 0.0 0.0 0.0 0.0 0.0 0.7 0.7 0.0 0.0 0.0 0.0
1530 0.0 0.0 0.0 0.0 0.0 0.0 0.7 0.7 0.7 0.0 0.0 0.0 0.0
1600 0.0 0.0 0.0 0.0 0.0 0.0 0.7 0.7 0.7 0.0 0.0 0.0 0.0
1630 0.0 0.0 0.0 0.0 0.0 0.0 0.7 0.7 0.7 0.0 0.0 0.0 0.0
1700 0.0 0.0 0.0 0.0 0.0 0.4 0.7 0.7 0.7 0.0 0.0 0.0 0.0
1730 0.0 0.0 0.0 0.0 0.0 0.4 1.1 0.7 0.7 0.0 0.0 0.0 0.0
1800 0.0 0.0 0.0 0.0 0.0 0.4 1.1 0.4 0.4 0.0 0.0 0.0 0.0
1830 0.0 0.0 0.0 0.0 0.0 0.4 1.1 0.4 0.4 0.0 0.0 0.0 0.0
1900 0.0 0.0 0.0 0.0 0.0 0.0 1.1 0.7 0.7 0.0 0.0 0.0 0.0
1930 0.0 0.0 0.0 0.0 0.0 0.0 1.1 0.7 0.7 0.0 0.0 0.0 0.0
2000 0.0 0.0 0.0 0.0 0.0 0.0 1.1 1.1 1.1 0.0 0.0 0.0 0.0
2030 0.0 0.0 0.0 0.0 0.0 0.0 1.1 1.1 1.1 0.0 0.0 0.0 0.0
2100 0.0 0.0 0.0 0.0 0.0 0.0 1.1 1.1 1.1 0.0 0.0 0.0 0.0
2130 0.0 0.0 0.0 0.0 0.0 0.0 1.1 1.1 1.1 0.0 0.0 0.0 0.0
2200 0.0 0.0 0.0 0.0 0.0 0.0 1.1 1.1 1.1 0.0 0.0 0.0 0.0
2230 0.0 0.0 0.0 0.0 0.0 0.0 1.1 1.9 1.9 0.0 0.0 0.0 0.0
2300 0.0 0.0 0.0 0.0 0.0 0.0 1.1 1.5 1.5 0.0 0.0 0.0 0.0
2330 0.0 0.0 0.0 0.0 0.0 0.0 1.1 1.5 1.5 0.0 0.0 0.0 0.0
0000 0.0 0.0 0.0 0.0 0.0 0.0 1.1 1.1 1.1 0.0 0.0 0.0 0.0
0030 0.0 0.0 0.0 0.0 0.0 0.4 1.5 1.1 1.1 0.0 0.0 0.0 0.0
0100 0.0 0.0 0.0 0.0 0.0 0.4 1.1 1.1 1.1 0.0 0.0 0.0 0.0
0130 0.0 0.0 0.0 0.0 0.0 0.4 1.1 1.9 1.9 0.0 0.0 0.0 0.0
0200 0.0 0.0 0.0 0.0 0.0 0.4 1.5 1.5 1.5 0.0 0.0 0.0 0.0
0230 0.0 0.0 0.0 0.0 0.0 0.0 1.5 1.9 1.9 0.0 0.0 0.0 0.0
0300 0.0 0.0 0.0 0.0 0.0 0.0 1.5 1.9 1.9 0.0 0.0 0.0 0.0
0330 0.0 0.0 0.0 0.0 0.0 0.0 1.5 1.5 1.5 0.0 0.0 0.0 0.0
0400 0.0 0.0 0.0 0.0 0.0 0.0 1.5 1.5 1.5 0.0 0.0 0.0 0.0
0430 0.0 0.0 0.0 0.0 0.0 0.0 0.7 1.5 1.5 0.0 0.0 0.0 0.0
0500 0.0 0.0 0.0 0.0 0.0 0.4 1.1 1.1 1.1 0.0 0.0 0.0 0.0
0530 0.0 0.0 0.0 0.0 0.0 1.1 1.4 0.7 0.7 0.0 0.0 0.0 0.0
0600 0.0 0.0 0.0 0.0 0.0 0.8 1.1 0.7 0.7 0.0 0.0 0.0 0.0
0630 0.0 0.0 0.0 0.0 0.0 0.4 1.1 0.8 0.8 0.0 0.0 0.0 0.0
0700 0.0 0.0 0.0 0.0 0.0 0.4 1.1 0.7 0.7 0.0 0.0 0.0 0.0
0730 0.0 0.0 0.0 0.0 0.0 0.4 0.7 1.1 1.1 0.0 0.0 0.0 0.0
0800 0.0 0.0 0.0 0.0 0.0 0.0 0.7 1.1 1.1 0.0 0.0 0.0 0.0
0830 0.0 0.0 0.0 0.0 0.0 0.0 0.4 1.1 1.1 0.0 0.0 0.0 0.0
0900 0.0 0.0 0.0 0.0 0.0 0.0 0.0 1.1 1.1 0.0 0.0 0.0 0.0
0930 0.0 0.0 0.0 0.0 0.0 0.0 0.0 0.7 0.7 0.0 0.0 0.0 0.0
1000 0.0 0.0 0.0 0.0 0.0 0.0 0.0 0.4 0.4 0.0 0.0 0.0 0.0
1030 0.0 0.0 0.0 0.0 0.0 0.0 0.0 0.7 0.7 0.0 0.0 0.0 0.0
1100 0.0 0.0 0.0 0.0 0.0 0.0 0.0 0.7 0.7 0.0 0.0 0.0 0.0
1130 0.0 0.0 0.0 0.0 0.0 0.0 0.0 0.0 0.0 0.0 0.0 0.0 0.0
1200 0.0 0.0 0.0 0.0 0.0 0.0 0.0 0.4 0.4 0.0 0.0 0.0 0.0
1230 0.0 0.0 0.0 0.0 0.0 0.0 0.0 0.4 0.4 0.0 0.0 0.0 0.0
1300 0.0 0.0 0.0 0.0 0.0 0.0 0.0 0.4 0.4 0.0 0.0 0.0 0.0
MEAN 0.0 0.0 0.0 0.0 0.0 0.1 0.8 1.0 1.0 0.0 0.0 0.0 0.0
Remarks Cases when a certa in phenomenon is not occurred and frequency i s 0 are shaded white
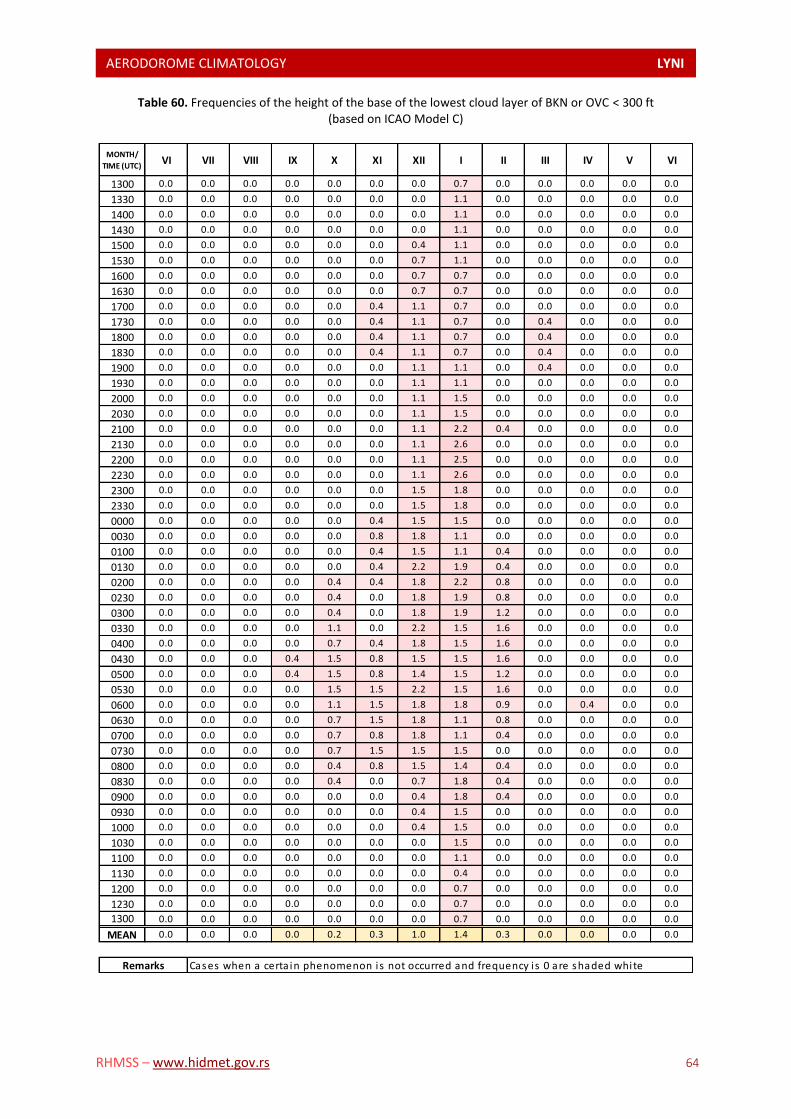
AERODOROME CLIMATOLOGY LYNI L
RHMSS – www.hidmet.gov.rs 64
Table 60. Frequencies of the height of the base of the lowest cloud layer of BKN or OVC < 300 ft (based on ICAO Model C)
MONTH/
TIME (UTC)VI VII VIII IX X XI XII I II III IV V VI
1300 0.0 0.0 0.0 0.0 0.0 0.0 0.0 0.7 0.0 0.0 0.0 0.0 0.0
1330 0.0 0.0 0.0 0.0 0.0 0.0 0.0 1.1 0.0 0.0 0.0 0.0 0.0
1400 0.0 0.0 0.0 0.0 0.0 0.0 0.0 1.1 0.0 0.0 0.0 0.0 0.0
1430 0.0 0.0 0.0 0.0 0.0 0.0 0.0 1.1 0.0 0.0 0.0 0.0 0.0
1500 0.0 0.0 0.0 0.0 0.0 0.0 0.4 1.1 0.0 0.0 0.0 0.0 0.0
1530 0.0 0.0 0.0 0.0 0.0 0.0 0.7 1.1 0.0 0.0 0.0 0.0 0.0
1600 0.0 0.0 0.0 0.0 0.0 0.0 0.7 0.7 0.0 0.0 0.0 0.0 0.0
1630 0.0 0.0 0.0 0.0 0.0 0.0 0.7 0.7 0.0 0.0 0.0 0.0 0.0
1700 0.0 0.0 0.0 0.0 0.0 0.4 1.1 0.7 0.0 0.0 0.0 0.0 0.0
1730 0.0 0.0 0.0 0.0 0.0 0.4 1.1 0.7 0.0 0.4 0.0 0.0 0.0
1800 0.0 0.0 0.0 0.0 0.0 0.4 1.1 0.7 0.0 0.4 0.0 0.0 0.0
1830 0.0 0.0 0.0 0.0 0.0 0.4 1.1 0.7 0.0 0.4 0.0 0.0 0.0
1900 0.0 0.0 0.0 0.0 0.0 0.0 1.1 1.1 0.0 0.4 0.0 0.0 0.0
1930 0.0 0.0 0.0 0.0 0.0 0.0 1.1 1.1 0.0 0.0 0.0 0.0 0.0
2000 0.0 0.0 0.0 0.0 0.0 0.0 1.1 1.5 0.0 0.0 0.0 0.0 0.0
2030 0.0 0.0 0.0 0.0 0.0 0.0 1.1 1.5 0.0 0.0 0.0 0.0 0.0
2100 0.0 0.0 0.0 0.0 0.0 0.0 1.1 2.2 0.4 0.0 0.0 0.0 0.0
2130 0.0 0.0 0.0 0.0 0.0 0.0 1.1 2.6 0.0 0.0 0.0 0.0 0.0
2200 0.0 0.0 0.0 0.0 0.0 0.0 1.1 2.5 0.0 0.0 0.0 0.0 0.0
2230 0.0 0.0 0.0 0.0 0.0 0.0 1.1 2.6 0.0 0.0 0.0 0.0 0.0
2300 0.0 0.0 0.0 0.0 0.0 0.0 1.5 1.8 0.0 0.0 0.0 0.0 0.0
2330 0.0 0.0 0.0 0.0 0.0 0.0 1.5 1.8 0.0 0.0 0.0 0.0 0.0
0000 0.0 0.0 0.0 0.0 0.0 0.4 1.5 1.5 0.0 0.0 0.0 0.0 0.0
0030 0.0 0.0 0.0 0.0 0.0 0.8 1.8 1.1 0.0 0.0 0.0 0.0 0.0
0100 0.0 0.0 0.0 0.0 0.0 0.4 1.5 1.1 0.4 0.0 0.0 0.0 0.0
0130 0.0 0.0 0.0 0.0 0.0 0.4 2.2 1.9 0.4 0.0 0.0 0.0 0.0
0200 0.0 0.0 0.0 0.0 0.4 0.4 1.8 2.2 0.8 0.0 0.0 0.0 0.0
0230 0.0 0.0 0.0 0.0 0.4 0.0 1.8 1.9 0.8 0.0 0.0 0.0 0.0
0300 0.0 0.0 0.0 0.0 0.4 0.0 1.8 1.9 1.2 0.0 0.0 0.0 0.0
0330 0.0 0.0 0.0 0.0 1.1 0.0 2.2 1.5 1.6 0.0 0.0 0.0 0.0
0400 0.0 0.0 0.0 0.0 0.7 0.4 1.8 1.5 1.6 0.0 0.0 0.0 0.0
0430 0.0 0.0 0.0 0.4 1.5 0.8 1.5 1.5 1.6 0.0 0.0 0.0 0.0
0500 0.0 0.0 0.0 0.4 1.5 0.8 1.4 1.5 1.2 0.0 0.0 0.0 0.0
0530 0.0 0.0 0.0 0.0 1.5 1.5 2.2 1.5 1.6 0.0 0.0 0.0 0.0
0600 0.0 0.0 0.0 0.0 1.1 1.5 1.8 1.8 0.9 0.0 0.4 0.0 0.0
0630 0.0 0.0 0.0 0.0 0.7 1.5 1.8 1.1 0.8 0.0 0.0 0.0 0.0
0700 0.0 0.0 0.0 0.0 0.7 0.8 1.8 1.1 0.4 0.0 0.0 0.0 0.0
0730 0.0 0.0 0.0 0.0 0.7 1.5 1.5 1.5 0.0 0.0 0.0 0.0 0.0
0800 0.0 0.0 0.0 0.0 0.4 0.8 1.5 1.4 0.4 0.0 0.0 0.0 0.0
0830 0.0 0.0 0.0 0.0 0.4 0.0 0.7 1.8 0.4 0.0 0.0 0.0 0.0
0900 0.0 0.0 0.0 0.0 0.0 0.0 0.4 1.8 0.4 0.0 0.0 0.0 0.0
0930 0.0 0.0 0.0 0.0 0.0 0.0 0.4 1.5 0.0 0.0 0.0 0.0 0.0
1000 0.0 0.0 0.0 0.0 0.0 0.0 0.4 1.5 0.0 0.0 0.0 0.0 0.0
1030 0.0 0.0 0.0 0.0 0.0 0.0 0.0 1.5 0.0 0.0 0.0 0.0 0.0
1100 0.0 0.0 0.0 0.0 0.0 0.0 0.0 1.1 0.0 0.0 0.0 0.0 0.0
1130 0.0 0.0 0.0 0.0 0.0 0.0 0.0 0.4 0.0 0.0 0.0 0.0 0.0
1200 0.0 0.0 0.0 0.0 0.0 0.0 0.0 0.7 0.0 0.0 0.0 0.0 0.0
1230 0.0 0.0 0.0 0.0 0.0 0.0 0.0 0.7 0.0 0.0 0.0 0.0 0.0
1300 0.0 0.0 0.0 0.0 0.0 0.0 0.0 0.7 0.0 0.0 0.0 0.0 0.0
MEAN 0.0 0.0 0.0 0.0 0.2 0.3 1.0 1.4 0.3 0.0 0.0 0.0 0.0
Remarks Cases when a certa in phenomenon is not occurred and frequency i s 0 are shaded white
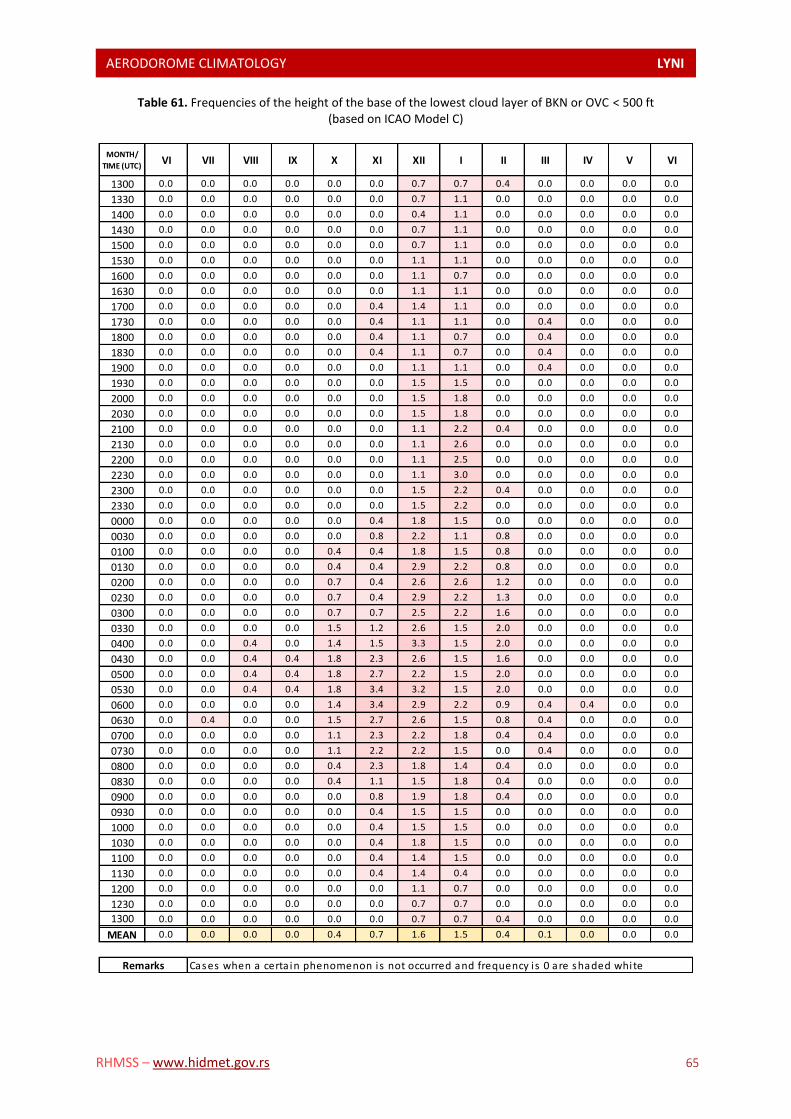
AERODOROME CLIMATOLOGY LYNI L
RHMSS – www.hidmet.gov.rs 65
Table 61. Frequencies of the height of the base of the lowest cloud layer of BKN or OVC < 500 ft (based on ICAO Model C)
MONTH/
TIME (UTC)VI VII VIII IX X XI XII I II III IV V VI
1300 0.0 0.0 0.0 0.0 0.0 0.0 0.7 0.7 0.4 0.0 0.0 0.0 0.0
1330 0.0 0.0 0.0 0.0 0.0 0.0 0.7 1.1 0.0 0.0 0.0 0.0 0.0
1400 0.0 0.0 0.0 0.0 0.0 0.0 0.4 1.1 0.0 0.0 0.0 0.0 0.0
1430 0.0 0.0 0.0 0.0 0.0 0.0 0.7 1.1 0.0 0.0 0.0 0.0 0.0
1500 0.0 0.0 0.0 0.0 0.0 0.0 0.7 1.1 0.0 0.0 0.0 0.0 0.0
1530 0.0 0.0 0.0 0.0 0.0 0.0 1.1 1.1 0.0 0.0 0.0 0.0 0.0
1600 0.0 0.0 0.0 0.0 0.0 0.0 1.1 0.7 0.0 0.0 0.0 0.0 0.0
1630 0.0 0.0 0.0 0.0 0.0 0.0 1.1 1.1 0.0 0.0 0.0 0.0 0.0
1700 0.0 0.0 0.0 0.0 0.0 0.4 1.4 1.1 0.0 0.0 0.0 0.0 0.0
1730 0.0 0.0 0.0 0.0 0.0 0.4 1.1 1.1 0.0 0.4 0.0 0.0 0.0
1800 0.0 0.0 0.0 0.0 0.0 0.4 1.1 0.7 0.0 0.4 0.0 0.0 0.0
1830 0.0 0.0 0.0 0.0 0.0 0.4 1.1 0.7 0.0 0.4 0.0 0.0 0.0
1900 0.0 0.0 0.0 0.0 0.0 0.0 1.1 1.1 0.0 0.4 0.0 0.0 0.0
1930 0.0 0.0 0.0 0.0 0.0 0.0 1.5 1.5 0.0 0.0 0.0 0.0 0.0
2000 0.0 0.0 0.0 0.0 0.0 0.0 1.5 1.8 0.0 0.0 0.0 0.0 0.0
2030 0.0 0.0 0.0 0.0 0.0 0.0 1.5 1.8 0.0 0.0 0.0 0.0 0.0
2100 0.0 0.0 0.0 0.0 0.0 0.0 1.1 2.2 0.4 0.0 0.0 0.0 0.0
2130 0.0 0.0 0.0 0.0 0.0 0.0 1.1 2.6 0.0 0.0 0.0 0.0 0.0
2200 0.0 0.0 0.0 0.0 0.0 0.0 1.1 2.5 0.0 0.0 0.0 0.0 0.0
2230 0.0 0.0 0.0 0.0 0.0 0.0 1.1 3.0 0.0 0.0 0.0 0.0 0.0
2300 0.0 0.0 0.0 0.0 0.0 0.0 1.5 2.2 0.4 0.0 0.0 0.0 0.0
2330 0.0 0.0 0.0 0.0 0.0 0.0 1.5 2.2 0.0 0.0 0.0 0.0 0.0
0000 0.0 0.0 0.0 0.0 0.0 0.4 1.8 1.5 0.0 0.0 0.0 0.0 0.0
0030 0.0 0.0 0.0 0.0 0.0 0.8 2.2 1.1 0.8 0.0 0.0 0.0 0.0
0100 0.0 0.0 0.0 0.0 0.4 0.4 1.8 1.5 0.8 0.0 0.0 0.0 0.0
0130 0.0 0.0 0.0 0.0 0.4 0.4 2.9 2.2 0.8 0.0 0.0 0.0 0.0
0200 0.0 0.0 0.0 0.0 0.7 0.4 2.6 2.6 1.2 0.0 0.0 0.0 0.0
0230 0.0 0.0 0.0 0.0 0.7 0.4 2.9 2.2 1.3 0.0 0.0 0.0 0.0
0300 0.0 0.0 0.0 0.0 0.7 0.7 2.5 2.2 1.6 0.0 0.0 0.0 0.0
0330 0.0 0.0 0.0 0.0 1.5 1.2 2.6 1.5 2.0 0.0 0.0 0.0 0.0
0400 0.0 0.0 0.4 0.0 1.4 1.5 3.3 1.5 2.0 0.0 0.0 0.0 0.0
0430 0.0 0.0 0.4 0.4 1.8 2.3 2.6 1.5 1.6 0.0 0.0 0.0 0.0
0500 0.0 0.0 0.4 0.4 1.8 2.7 2.2 1.5 2.0 0.0 0.0 0.0 0.0
0530 0.0 0.0 0.4 0.4 1.8 3.4 3.2 1.5 2.0 0.0 0.0 0.0 0.0
0600 0.0 0.0 0.0 0.0 1.4 3.4 2.9 2.2 0.9 0.4 0.4 0.0 0.0
0630 0.0 0.4 0.0 0.0 1.5 2.7 2.6 1.5 0.8 0.4 0.0 0.0 0.0
0700 0.0 0.0 0.0 0.0 1.1 2.3 2.2 1.8 0.4 0.4 0.0 0.0 0.0
0730 0.0 0.0 0.0 0.0 1.1 2.2 2.2 1.5 0.0 0.4 0.0 0.0 0.0
0800 0.0 0.0 0.0 0.0 0.4 2.3 1.8 1.4 0.4 0.0 0.0 0.0 0.0
0830 0.0 0.0 0.0 0.0 0.4 1.1 1.5 1.8 0.4 0.0 0.0 0.0 0.0
0900 0.0 0.0 0.0 0.0 0.0 0.8 1.9 1.8 0.4 0.0 0.0 0.0 0.0
0930 0.0 0.0 0.0 0.0 0.0 0.4 1.5 1.5 0.0 0.0 0.0 0.0 0.0
1000 0.0 0.0 0.0 0.0 0.0 0.4 1.5 1.5 0.0 0.0 0.0 0.0 0.0
1030 0.0 0.0 0.0 0.0 0.0 0.4 1.8 1.5 0.0 0.0 0.0 0.0 0.0
1100 0.0 0.0 0.0 0.0 0.0 0.4 1.4 1.5 0.0 0.0 0.0 0.0 0.0
1130 0.0 0.0 0.0 0.0 0.0 0.4 1.4 0.4 0.0 0.0 0.0 0.0 0.0
1200 0.0 0.0 0.0 0.0 0.0 0.0 1.1 0.7 0.0 0.0 0.0 0.0 0.0
1230 0.0 0.0 0.0 0.0 0.0 0.0 0.7 0.7 0.0 0.0 0.0 0.0 0.0
1300 0.0 0.0 0.0 0.0 0.0 0.0 0.7 0.7 0.4 0.0 0.0 0.0 0.0
MEAN 0.0 0.0 0.0 0.0 0.4 0.7 1.6 1.5 0.4 0.1 0.0 0.0 0.0
Remarks Cases when a certa in phenomenon is not occurred and frequency i s 0 are shaded white
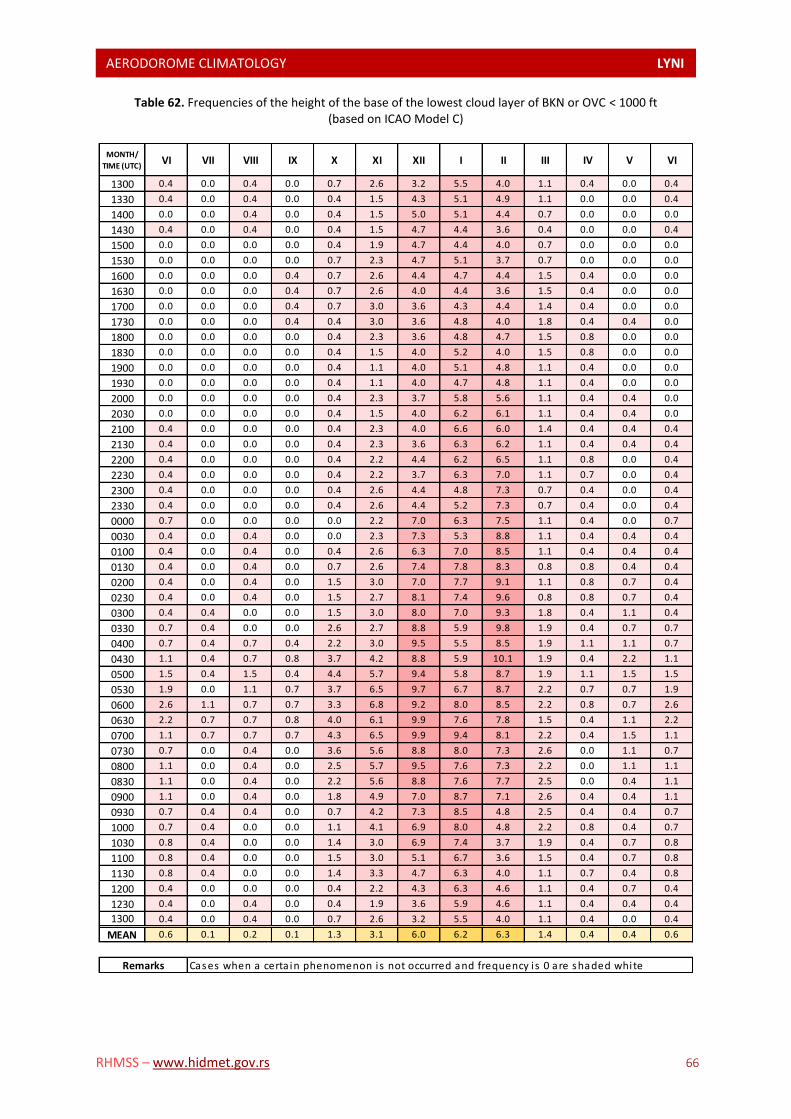
AERODOROME CLIMATOLOGY LYNI L
RHMSS – www.hidmet.gov.rs 66
Table 62. Frequencies of the height of the base of the lowest cloud layer of BKN or OVC < 1000 ft (based on ICAO Model C)
MONTH/
TIME (UTC)VI VII VIII IX X XI XII I II III IV V VI
1300 0.4 0.0 0.4 0.0 0.7 2.6 3.2 5.5 4.0 1.1 0.4 0.0 0.4
1330 0.4 0.0 0.4 0.0 0.4 1.5 4.3 5.1 4.9 1.1 0.0 0.0 0.4
1400 0.0 0.0 0.4 0.0 0.4 1.5 5.0 5.1 4.4 0.7 0.0 0.0 0.0
1430 0.4 0.0 0.4 0.0 0.4 1.5 4.7 4.4 3.6 0.4 0.0 0.0 0.4
1500 0.0 0.0 0.0 0.0 0.4 1.9 4.7 4.4 4.0 0.7 0.0 0.0 0.0
1530 0.0 0.0 0.0 0.0 0.7 2.3 4.7 5.1 3.7 0.7 0.0 0.0 0.0
1600 0.0 0.0 0.0 0.4 0.7 2.6 4.4 4.7 4.4 1.5 0.4 0.0 0.0
1630 0.0 0.0 0.0 0.4 0.7 2.6 4.0 4.4 3.6 1.5 0.4 0.0 0.0
1700 0.0 0.0 0.0 0.4 0.7 3.0 3.6 4.3 4.4 1.4 0.4 0.0 0.0
1730 0.0 0.0 0.0 0.4 0.4 3.0 3.6 4.8 4.0 1.8 0.4 0.4 0.0
1800 0.0 0.0 0.0 0.0 0.4 2.3 3.6 4.8 4.7 1.5 0.8 0.0 0.0
1830 0.0 0.0 0.0 0.0 0.4 1.5 4.0 5.2 4.0 1.5 0.8 0.0 0.0
1900 0.0 0.0 0.0 0.0 0.4 1.1 4.0 5.1 4.8 1.1 0.4 0.0 0.0
1930 0.0 0.0 0.0 0.0 0.4 1.1 4.0 4.7 4.8 1.1 0.4 0.0 0.0
2000 0.0 0.0 0.0 0.0 0.4 2.3 3.7 5.8 5.6 1.1 0.4 0.4 0.0
2030 0.0 0.0 0.0 0.0 0.4 1.5 4.0 6.2 6.1 1.1 0.4 0.4 0.0
2100 0.4 0.0 0.0 0.0 0.4 2.3 4.0 6.6 6.0 1.4 0.4 0.4 0.4
2130 0.4 0.0 0.0 0.0 0.4 2.3 3.6 6.3 6.2 1.1 0.4 0.4 0.4
2200 0.4 0.0 0.0 0.0 0.4 2.2 4.4 6.2 6.5 1.1 0.8 0.0 0.4
2230 0.4 0.0 0.0 0.0 0.4 2.2 3.7 6.3 7.0 1.1 0.7 0.0 0.4
2300 0.4 0.0 0.0 0.0 0.4 2.6 4.4 4.8 7.3 0.7 0.4 0.0 0.4
2330 0.4 0.0 0.0 0.0 0.4 2.6 4.4 5.2 7.3 0.7 0.4 0.0 0.4
0000 0.7 0.0 0.0 0.0 0.0 2.2 7.0 6.3 7.5 1.1 0.4 0.0 0.7
0030 0.4 0.0 0.4 0.0 0.0 2.3 7.3 5.3 8.8 1.1 0.4 0.4 0.4
0100 0.4 0.0 0.4 0.0 0.4 2.6 6.3 7.0 8.5 1.1 0.4 0.4 0.4
0130 0.4 0.0 0.4 0.0 0.7 2.6 7.4 7.8 8.3 0.8 0.8 0.4 0.4
0200 0.4 0.0 0.4 0.0 1.5 3.0 7.0 7.7 9.1 1.1 0.8 0.7 0.4
0230 0.4 0.0 0.4 0.0 1.5 2.7 8.1 7.4 9.6 0.8 0.8 0.7 0.4
0300 0.4 0.4 0.0 0.0 1.5 3.0 8.0 7.0 9.3 1.8 0.4 1.1 0.4
0330 0.7 0.4 0.0 0.0 2.6 2.7 8.8 5.9 9.8 1.9 0.4 0.7 0.7
0400 0.7 0.4 0.7 0.4 2.2 3.0 9.5 5.5 8.5 1.9 1.1 1.1 0.7
0430 1.1 0.4 0.7 0.8 3.7 4.2 8.8 5.9 10.1 1.9 0.4 2.2 1.1
0500 1.5 0.4 1.5 0.4 4.4 5.7 9.4 5.8 8.7 1.9 1.1 1.5 1.5
0530 1.9 0.0 1.1 0.7 3.7 6.5 9.7 6.7 8.7 2.2 0.7 0.7 1.9
0600 2.6 1.1 0.7 0.7 3.3 6.8 9.2 8.0 8.5 2.2 0.8 0.7 2.6
0630 2.2 0.7 0.7 0.8 4.0 6.1 9.9 7.6 7.8 1.5 0.4 1.1 2.2
0700 1.1 0.7 0.7 0.7 4.3 6.5 9.9 9.4 8.1 2.2 0.4 1.5 1.1
0730 0.7 0.0 0.4 0.0 3.6 5.6 8.8 8.0 7.3 2.6 0.0 1.1 0.7
0800 1.1 0.0 0.4 0.0 2.5 5.7 9.5 7.6 7.3 2.2 0.0 1.1 1.1
0830 1.1 0.0 0.4 0.0 2.2 5.6 8.8 7.6 7.7 2.5 0.0 0.4 1.1
0900 1.1 0.0 0.4 0.0 1.8 4.9 7.0 8.7 7.1 2.6 0.4 0.4 1.1
0930 0.7 0.4 0.4 0.0 0.7 4.2 7.3 8.5 4.8 2.5 0.4 0.4 0.7
1000 0.7 0.4 0.0 0.0 1.1 4.1 6.9 8.0 4.8 2.2 0.8 0.4 0.7
1030 0.8 0.4 0.0 0.0 1.4 3.0 6.9 7.4 3.7 1.9 0.4 0.7 0.8
1100 0.8 0.4 0.0 0.0 1.5 3.0 5.1 6.7 3.6 1.5 0.4 0.7 0.8
1130 0.8 0.4 0.0 0.0 1.4 3.3 4.7 6.3 4.0 1.1 0.7 0.4 0.8
1200 0.4 0.0 0.0 0.0 0.4 2.2 4.3 6.3 4.6 1.1 0.4 0.7 0.4
1230 0.4 0.0 0.4 0.0 0.4 1.9 3.6 5.9 4.6 1.1 0.4 0.4 0.4
1300 0.4 0.0 0.4 0.0 0.7 2.6 3.2 5.5 4.0 1.1 0.4 0.0 0.4
MEAN 0.6 0.1 0.2 0.1 1.3 3.1 6.0 6.2 6.3 1.4 0.4 0.4 0.6
Remarks Cases when a certa in phenomenon is not occurred and frequency i s 0 are shaded white

AERODOROME CLIMATOLOGY LYNI L
RHMSS – www.hidmet.gov.rs 67
Table 63. Frequencies of the height of the base of the lowest cloud layer of BKN or OVC < 1500 ft (based on ICAO Model C)
MONTH/
TIME (UTC)VI VII VIII IX X XI XII I II III IV V VI
1300 0.7 0.4 0.4 0.0 1.1 4.5 8.6 10.0 10.1 3.3 0.4 0.4 0.7
1330 0.4 0.4 0.4 0.0 1.1 3.0 8.0 9.2 10.2 3.3 0.0 0.0 0.4
1400 0.4 0.4 0.4 0.0 1.1 3.4 7.9 9.4 9.6 4.8 0.4 0.0 0.4
1430 0.8 0.4 0.4 0.4 1.4 3.0 7.6 8.9 8.5 4.1 0.7 0.0 0.8
1500 0.4 0.4 0.0 0.0 1.1 3.4 8.0 8.7 9.6 3.9 0.8 0.0 0.4
1530 0.0 0.4 0.0 0.0 1.8 3.4 8.3 9.6 10.7 3.7 0.4 0.4 0.0
1600 0.0 0.4 0.0 0.8 1.8 3.8 8.7 8.6 10.0 4.5 0.8 0.4 0.0
1630 0.0 0.4 0.0 0.4 1.8 4.2 9.2 8.1 8.5 4.4 0.8 0.4 0.0
1700 0.0 0.4 0.7 0.7 1.5 3.8 9.1 8.3 9.2 4.3 1.1 0.0 0.0
1730 0.0 0.4 0.7 0.8 1.1 4.2 9.1 8.4 10.1 4.4 1.1 0.4 0.0
1800 0.0 0.7 0.4 0.7 1.4 3.0 8.0 7.0 9.7 4.0 1.1 0.0 0.0
1830 0.0 0.4 0.4 0.8 1.4 2.2 7.9 8.2 9.6 3.3 1.1 0.0 0.0
1900 0.0 0.4 0.4 0.0 1.1 1.5 7.6 8.4 10.8 3.3 0.4 0.0 0.0
1930 0.0 0.4 0.4 0.0 1.4 1.9 7.3 7.7 10.4 2.2 0.4 0.0 0.0
2000 0.0 0.4 0.4 0.0 1.4 3.8 7.3 8.8 10.9 3.0 0.4 0.7 0.0
2030 0.4 0.4 0.4 0.0 1.4 3.0 8.0 9.5 10.5 2.5 0.4 0.7 0.4
2100 0.7 0.4 0.4 0.0 1.4 3.4 9.4 9.6 11.2 3.3 1.1 0.7 0.7
2130 0.8 0.4 0.0 0.0 1.5 3.4 9.9 10.1 11.5 3.0 1.1 0.4 0.8
2200 0.7 0.7 0.0 0.0 1.8 4.1 12.4 9.8 12.2 2.9 1.5 0.0 0.7
2230 0.7 0.4 0.0 0.0 1.8 4.5 12.1 10.1 13.5 2.6 1.5 0.0 0.7
2300 0.4 0.0 0.4 0.0 1.8 4.2 12.5 9.9 14.3 3.7 1.5 0.0 0.4
2330 0.7 0.7 0.4 0.0 1.8 3.8 12.5 10.3 14.1 3.7 1.5 0.4 0.7
0000 1.1 0.4 0.4 0.0 2.6 3.0 13.6 9.7 15.1 2.7 1.5 0.4 1.1
0030 0.8 0.4 1.1 0.0 2.6 3.4 13.5 10.6 16.7 2.3 1.6 0.7 0.8
0100 0.8 0.7 0.4 0.0 2.9 3.7 13.3 11.7 15.8 3.3 1.5 1.1 0.8
0130 1.1 0.7 0.4 0.0 2.6 3.4 14.3 12.7 16.5 3.1 1.2 0.8 1.1
0200 1.1 1.1 0.4 0.4 3.3 3.8 14.3 13.3 16.0 3.0 1.1 2.2 1.1
0230 0.4 1.5 0.7 0.4 3.3 3.4 15.4 13.8 15.4 3.8 1.1 2.2 0.4
0300 1.1 1.1 0.4 0.4 2.9 3.7 15.6 11.9 16.2 4.8 1.5 2.2 1.1
0330 1.9 1.1 0.4 1.1 4.0 4.3 16.5 11.4 16.7 4.9 1.5 2.2 1.9
0400 2.2 1.1 0.7 1.9 3.6 4.2 16.4 11.6 15.4 4.5 1.9 2.2 2.2
0430 2.6 1.4 1.1 1.9 5.5 5.3 15.8 11.1 15.8 4.8 1.1 2.2 2.6
0500 2.6 1.8 1.8 2.2 7.6 7.6 18.1 11.3 15.1 5.6 2.3 2.6 2.6
0530 2.2 1.1 1.4 3.0 7.0 8.4 17.3 11.1 15.4 6.2 1.5 2.6 2.2
0600 3.4 2.2 1.5 3.0 5.8 9.1 14.3 12.8 14.5 5.5 1.9 1.8 3.4
0630 3.0 1.8 1.1 3.4 6.9 9.6 16.4 11.7 13.6 4.9 1.5 1.9 3.0
0700 1.9 1.8 1.1 2.6 9.1 9.1 16.1 12.6 15.0 5.5 1.9 1.8 1.9
0730 2.2 1.4 0.7 1.5 7.3 8.6 14.7 12.0 13.8 5.5 1.5 1.4 2.2
0800 1.9 0.7 0.7 1.1 5.8 7.5 14.9 11.6 13.8 3.7 1.1 1.8 1.9
0830 1.1 0.4 0.7 0.4 5.5 7.1 15.0 10.9 13.8 4.4 0.8 1.8 1.1
0900 1.1 0.7 0.7 0.4 3.6 6.0 12.6 11.2 12.1 4.4 0.8 1.1 1.1
0930 0.7 0.4 0.7 0.0 1.8 5.3 13.1 11.0 9.7 5.1 0.8 1.5 0.7
1000 1.1 0.4 0.0 0.0 1.4 6.0 12.0 10.6 10.4 4.4 0.8 1.1 1.1
1030 0.8 0.4 0.0 0.0 1.8 4.5 10.9 10.4 8.6 3.7 0.4 1.1 0.8
1100 1.1 0.4 0.0 0.0 2.2 3.7 8.0 10.0 8.8 3.0 0.4 1.1 1.1
1130 0.8 0.4 0.0 0.4 1.8 3.7 8.3 9.9 8.8 3.7 0.7 0.7 0.8
1200 0.8 0.0 0.0 0.0 0.7 2.6 8.3 9.6 10.0 2.9 0.4 1.1 0.8
1230 0.4 0.4 0.4 0.0 0.7 3.0 8.7 8.9 9.6 3.0 0.4 0.7 0.4
1300 0.7 0.4 0.4 0.0 1.1 4.5 8.6 10.0 10.1 3.3 0.4 0.4 0.7
MEAN 0.9 0.7 0.5 0.6 2.8 4.5 11.6 10.2 12.2 3.9 1.0 0.9 0.9
Remarks Cases when a certa in phenomenon is not occurred and frequency i s 0 are shaded white
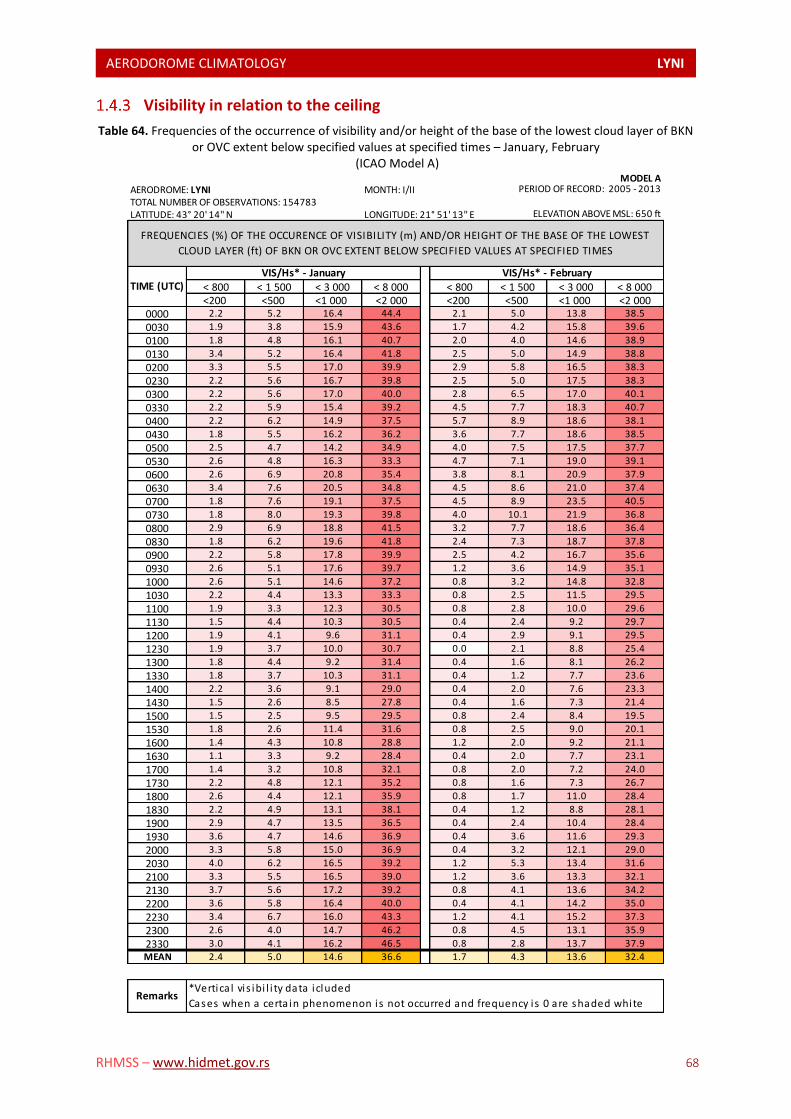
AERODOROME CLIMATOLOGY LYNI L
RHMSS – www.hidmet.gov.rs 68
Visibility in relation to the ceiling
Table 64. Frequencies of the occurrence of visibility and/or height of the base of the lowest cloud layer of BKN or OVC extent below specified values at specified times – January, February
(ICAO Model A) MODEL A
AERODROME: LYNI MONTH: I/IITOTAL NUMBER OF OBSERVATIONS: 154783LATITUDE: 43° 20' 14'' N LONGITUDE: 21° 51' 13'' E
< 800 < 1 500 < 3 000 < 8 000 < 800 < 1 500 < 3 000 < 8 000<200 <500 <1 000 <2 000 <200 <500 <1 000 <2 000
0000 2.2 5.2 16.4 44.4 2.1 5.0 13.8 38.5
0030 1.9 3.8 15.9 43.6 1.7 4.2 15.8 39.6
0100 1.8 4.8 16.1 40.7 2.0 4.0 14.6 38.9
0130 3.4 5.2 16.4 41.8 2.5 5.0 14.9 38.8
0200 3.3 5.5 17.0 39.9 2.9 5.8 16.5 38.3
0230 2.2 5.6 16.7 39.8 2.5 5.0 17.5 38.3
0300 2.2 5.6 17.0 40.0 2.8 6.5 17.0 40.1
0330 2.2 5.9 15.4 39.2 4.5 7.7 18.3 40.7
0400 2.2 6.2 14.9 37.5 5.7 8.9 18.6 38.1
0430 1.8 5.5 16.2 36.2 3.6 7.7 18.6 38.5
0500 2.5 4.7 14.2 34.9 4.0 7.5 17.5 37.7
0530 2.6 4.8 16.3 33.3 4.7 7.1 19.0 39.1
0600 2.6 6.9 20.8 35.4 3.8 8.1 20.9 37.9
0630 3.4 7.6 20.5 34.8 4.5 8.6 21.0 37.4
0700 1.8 7.6 19.1 37.5 4.5 8.9 23.5 40.5
0730 1.8 8.0 19.3 39.8 4.0 10.1 21.9 36.8
0800 2.9 6.9 18.8 41.5 3.2 7.7 18.6 36.4
0830 1.8 6.2 19.6 41.8 2.4 7.3 18.7 37.8
0900 2.2 5.8 17.8 39.9 2.5 4.2 16.7 35.6
0930 2.6 5.1 17.6 39.7 1.2 3.6 14.9 35.1
1000 2.6 5.1 14.6 37.2 0.8 3.2 14.8 32.8
1030 2.2 4.4 13.3 33.3 0.8 2.5 11.5 29.5
1100 1.9 3.3 12.3 30.5 0.8 2.8 10.0 29.6
1130 1.5 4.4 10.3 30.5 0.4 2.4 9.2 29.7
1200 1.9 4.1 9.6 31.1 0.4 2.9 9.1 29.5
1230 1.9 3.7 10.0 30.7 0.0 2.1 8.8 25.4
1300 1.8 4.4 9.2 31.4 0.4 1.6 8.1 26.2
1330 1.8 3.7 10.3 31.1 0.4 1.2 7.7 23.6
1400 2.2 3.6 9.1 29.0 0.4 2.0 7.6 23.3
1430 1.5 2.6 8.5 27.8 0.4 1.6 7.3 21.4
1500 1.5 2.5 9.5 29.5 0.8 2.4 8.4 19.5
1530 1.8 2.6 11.4 31.6 0.8 2.5 9.0 20.1
1600 1.4 4.3 10.8 28.8 1.2 2.0 9.2 21.1
1630 1.1 3.3 9.2 28.4 0.4 2.0 7.7 23.1
1700 1.4 3.2 10.8 32.1 0.8 2.0 7.2 24.0
1730 2.2 4.8 12.1 35.2 0.8 1.6 7.3 26.7
1800 2.6 4.4 12.1 35.9 0.8 1.7 11.0 28.4
1830 2.2 4.9 13.1 38.1 0.4 1.2 8.8 28.1
1900 2.9 4.7 13.5 36.5 0.4 2.4 10.4 28.4
1930 3.6 4.7 14.6 36.9 0.4 3.6 11.6 29.3
2000 3.3 5.8 15.0 36.9 0.4 3.2 12.1 29.0
2030 4.0 6.2 16.5 39.2 1.2 5.3 13.4 31.6
2100 3.3 5.5 16.5 39.0 1.2 3.6 13.3 32.1
2130 3.7 5.6 17.2 39.2 0.8 4.1 13.6 34.2
2200 3.6 5.8 16.4 40.0 0.4 4.1 14.2 35.0
2230 3.4 6.7 16.0 43.3 1.2 4.1 15.2 37.3
2300 2.6 4.0 14.7 46.2 0.8 4.5 13.1 35.9
2330 3.0 4.1 16.2 46.5 0.8 2.8 13.7 37.9
MEAN 2.4 5.0 14.6 36.6 1.7 4.3 13.6 32.4
FREQUENCIES (%) OF THE OCCURENCE OF VISIBILITY (m) AND/OR HEIGHT OF THE BASE OF THE LOWEST
CLOUD LAYER (ft) OF BKN OR OVC EXTENT BELOW SPECIFIED VALUES AT SPECIFIED TIMES
PERIOD OF RECORD: 2005 - 2013
ELEVATION ABOVE MSL: 650 ft
Remarks*Vertica l vis ibi l i ty data icluded
Cases when a certa in phenomenon is not occurred and frequency i s 0 are shaded white
TIME (UTC)VIS/Hs* - January VIS/Hs* - February

AERODOROME CLIMATOLOGY LYNI L
RHMSS – www.hidmet.gov.rs 69
Table 65. Frequencies of the occurrence of visibility and/or height of the base of the lowest cloud layer of BKN or OVC extent below specified values at specified times – March, April
(ICAO Model A) MODEL A
AERODROME: LYNI MONTH: III/IVTOTAL NUMBER OF OBSERVATIONS: 154783LATITUDE: 43° 20' 14'' N LONGITUDE: 21° 51' 13'' E
< 800 < 1 500 < 3 000 < 8 000 < 800 < 1 500 < 3 000 < 8 000<200 <500 <1 000 <2 000 <200 <500 <1 000 <2 000
0000 0.0 0.8 1.5 8.8 0.0 0.0 0.4 4.60030 0.8 1.5 2.7 9.5 0.4 0.4 0.8 5.80100 0.7 1.5 3.0 12.5 0.8 0.8 1.5 6.10130 0.4 0.8 1.9 11.5 0.8 0.8 1.2 5.00200 0.0 0.4 2.2 11.6 0.4 0.4 0.8 5.30230 0.4 0.8 2.6 13.2 0.4 0.4 0.8 5.70300 0.4 0.4 3.3 14.0 0.0 0.0 0.4 6.80330 0.7 0.7 4.5 13.9 0.0 0.8 1.9 8.00400 0.7 1.1 4.5 13.8 0.4 1.1 3.8 9.20430 0.7 1.5 4.8 15.2 0.8 1.5 3.0 9.50500 1.1 2.2 5.6 17.5 1.1 1.9 3.0 10.20530 0.7 2.2 5.1 18.2 1.5 1.5 3.0 9.00600 0.7 2.9 5.5 16.5 1.2 1.2 2.3 9.30630 0.8 1.1 6.4 18.1 0.8 0.8 1.5 9.10700 0.7 1.5 5.1 17.6 0.0 0.0 0.8 7.70730 1.5 1.5 4.4 16.5 0.0 0.0 0.0 6.80800 1.1 1.1 4.4 15.8 0.0 0.0 0.0 4.60830 0.7 1.8 4.4 15.3 0.0 0.0 0.0 4.20900 0.7 1.8 4.7 12.4 0.4 0.4 1.2 3.10930 1.5 2.9 5.1 12.0 0.4 0.4 1.1 2.71000 0.4 1.5 4.1 12.9 0.4 0.4 1.1 1.91030 0.7 1.5 3.7 12.3 0.0 0.0 0.4 1.51100 0.0 0.8 2.6 10.2 0.4 0.4 0.8 1.91130 0.0 1.1 3.3 10.3 0.4 0.4 1.1 2.61200 0.7 1.5 2.6 9.5 0.8 0.8 1.2 2.31230 0.4 1.1 2.6 6.3 0.4 0.4 0.8 1.51300 0.4 1.1 1.9 6.7 0.0 0.4 0.8 1.51330 0.0 0.7 2.2 7.4 0.0 0.0 0.0 0.81400 0.4 0.7 1.8 6.6 0.0 0.0 0.4 1.51430 0.4 0.4 1.8 7.0 0.0 0.0 0.4 1.91500 0.7 1.1 2.2 7.2 0.0 0.0 0.0 3.01530 0.4 1.1 1.9 7.1 0.0 0.0 0.0 2.31600 1.1 1.9 2.6 6.7 0.0 0.0 0.8 1.91630 0.7 1.5 2.6 5.9 0.0 0.0 0.8 2.61700 0.7 1.8 3.3 9.1 0.0 0.0 0.7 2.21730 1.1 1.5 2.2 8.4 0.0 0.0 0.8 2.71800 1.1 1.5 2.2 7.7 0.0 0.0 0.8 3.41830 0.4 0.7 2.2 6.3 0.0 0.0 0.8 3.81900 0.0 1.8 2.2 7.3 0.0 0.0 0.4 3.81930 0.0 1.1 2.2 8.1 0.0 0.0 0.4 2.62000 0.0 0.7 2.6 7.0 0.0 0.0 0.4 3.42030 0.0 0.7 1.8 8.0 0.0 0.0 0.4 3.42100 0.4 0.7 2.2 9.4 0.4 0.4 0.7 5.22130 0.0 0.4 1.9 8.2 0.0 0.0 0.4 5.22200 0.0 0.4 2.2 8.8 0.0 0.0 0.8 5.32230 0.4 0.4 2.6 9.4 0.0 0.0 0.7 5.62300 0.0 0.4 1.5 10.3 0.0 0.0 0.4 4.92330 0.0 0.7 1.5 10.3 0.0 0.0 0.4 5.0MEAN 0.5 1.2 3.1 10.8 0.2 0.3 0.9 4.5
FREQUENCIES (%) OF THE OCCURENCE OF VISIBILITY (m) AND/OR HEIGHT OF THE BASE OF THE LOWEST
CLOUD LAYER (ft) OF BKN OR OVC EXTENT BELOW SPECIFIED VALUES AT SPECIFIED TIMES
PERIOD OF RECORD: 2005 - 2013
ELEVATION ABOVE MSL: 650 ft
Remarks*Vertica l vis ibi l i ty data icluded
Cases when a certa in phenomenon is not occurred and frequency i s 0 are shaded white
TIME (UTC)VIS/Hs* - January VIS/Hs* - February
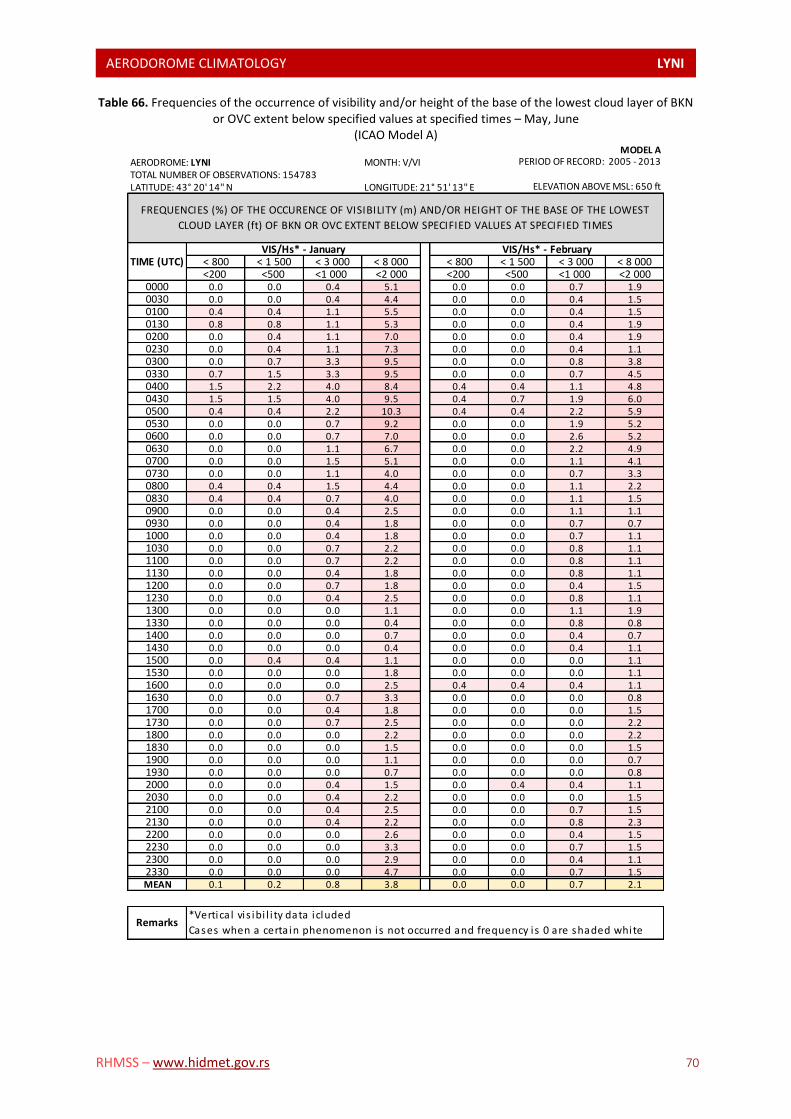
AERODOROME CLIMATOLOGY LYNI L
RHMSS – www.hidmet.gov.rs 70
Table 66. Frequencies of the occurrence of visibility and/or height of the base of the lowest cloud layer of BKN or OVC extent below specified values at specified times – May, June
(ICAO Model A) MODEL A
AERODROME: LYNI MONTH: V/VITOTAL NUMBER OF OBSERVATIONS: 154783LATITUDE: 43° 20' 14'' N LONGITUDE: 21° 51' 13'' E
< 800 < 1 500 < 3 000 < 8 000 < 800 < 1 500 < 3 000 < 8 000<200 <500 <1 000 <2 000 <200 <500 <1 000 <2 000
0000 0.0 0.0 0.4 5.1 0.0 0.0 0.7 1.90030 0.0 0.0 0.4 4.4 0.0 0.0 0.4 1.50100 0.4 0.4 1.1 5.5 0.0 0.0 0.4 1.50130 0.8 0.8 1.1 5.3 0.0 0.0 0.4 1.90200 0.0 0.4 1.1 7.0 0.0 0.0 0.4 1.90230 0.0 0.4 1.1 7.3 0.0 0.0 0.4 1.10300 0.0 0.7 3.3 9.5 0.0 0.0 0.8 3.80330 0.7 1.5 3.3 9.5 0.0 0.0 0.7 4.50400 1.5 2.2 4.0 8.4 0.4 0.4 1.1 4.80430 1.5 1.5 4.0 9.5 0.4 0.7 1.9 6.00500 0.4 0.4 2.2 10.3 0.4 0.4 2.2 5.90530 0.0 0.0 0.7 9.2 0.0 0.0 1.9 5.20600 0.0 0.0 0.7 7.0 0.0 0.0 2.6 5.20630 0.0 0.0 1.1 6.7 0.0 0.0 2.2 4.90700 0.0 0.0 1.5 5.1 0.0 0.0 1.1 4.10730 0.0 0.0 1.1 4.0 0.0 0.0 0.7 3.30800 0.4 0.4 1.5 4.4 0.0 0.0 1.1 2.20830 0.4 0.4 0.7 4.0 0.0 0.0 1.1 1.50900 0.0 0.0 0.4 2.5 0.0 0.0 1.1 1.10930 0.0 0.0 0.4 1.8 0.0 0.0 0.7 0.71000 0.0 0.0 0.4 1.8 0.0 0.0 0.7 1.11030 0.0 0.0 0.7 2.2 0.0 0.0 0.8 1.11100 0.0 0.0 0.7 2.2 0.0 0.0 0.8 1.11130 0.0 0.0 0.4 1.8 0.0 0.0 0.8 1.11200 0.0 0.0 0.7 1.8 0.0 0.0 0.4 1.51230 0.0 0.0 0.4 2.5 0.0 0.0 0.8 1.11300 0.0 0.0 0.0 1.1 0.0 0.0 1.1 1.91330 0.0 0.0 0.0 0.4 0.0 0.0 0.8 0.81400 0.0 0.0 0.0 0.7 0.0 0.0 0.4 0.71430 0.0 0.0 0.0 0.4 0.0 0.0 0.4 1.11500 0.0 0.4 0.4 1.1 0.0 0.0 0.0 1.11530 0.0 0.0 0.0 1.8 0.0 0.0 0.0 1.11600 0.0 0.0 0.0 2.5 0.4 0.4 0.4 1.11630 0.0 0.0 0.7 3.3 0.0 0.0 0.0 0.81700 0.0 0.0 0.4 1.8 0.0 0.0 0.0 1.51730 0.0 0.0 0.7 2.5 0.0 0.0 0.0 2.21800 0.0 0.0 0.0 2.2 0.0 0.0 0.0 2.21830 0.0 0.0 0.0 1.5 0.0 0.0 0.0 1.51900 0.0 0.0 0.0 1.1 0.0 0.0 0.0 0.71930 0.0 0.0 0.0 0.7 0.0 0.0 0.0 0.82000 0.0 0.0 0.4 1.5 0.0 0.4 0.4 1.12030 0.0 0.0 0.4 2.2 0.0 0.0 0.0 1.52100 0.0 0.0 0.4 2.5 0.0 0.0 0.7 1.52130 0.0 0.0 0.4 2.2 0.0 0.0 0.8 2.32200 0.0 0.0 0.0 2.6 0.0 0.0 0.4 1.52230 0.0 0.0 0.0 3.3 0.0 0.0 0.7 1.52300 0.0 0.0 0.0 2.9 0.0 0.0 0.4 1.12330 0.0 0.0 0.0 4.7 0.0 0.0 0.7 1.5MEAN 0.1 0.2 0.8 3.8 0.0 0.0 0.7 2.1
FREQUENCIES (%) OF THE OCCURENCE OF VISIBILITY (m) AND/OR HEIGHT OF THE BASE OF THE LOWEST
CLOUD LAYER (ft) OF BKN OR OVC EXTENT BELOW SPECIFIED VALUES AT SPECIFIED TIMES
PERIOD OF RECORD: 2005 - 2013
ELEVATION ABOVE MSL: 650 ft
Remarks*Vertica l vis ibi l i ty data icluded
Cases when a certa in phenomenon is not occurred and frequency i s 0 are shaded white
TIME (UTC)VIS/Hs* - January VIS/Hs* - February
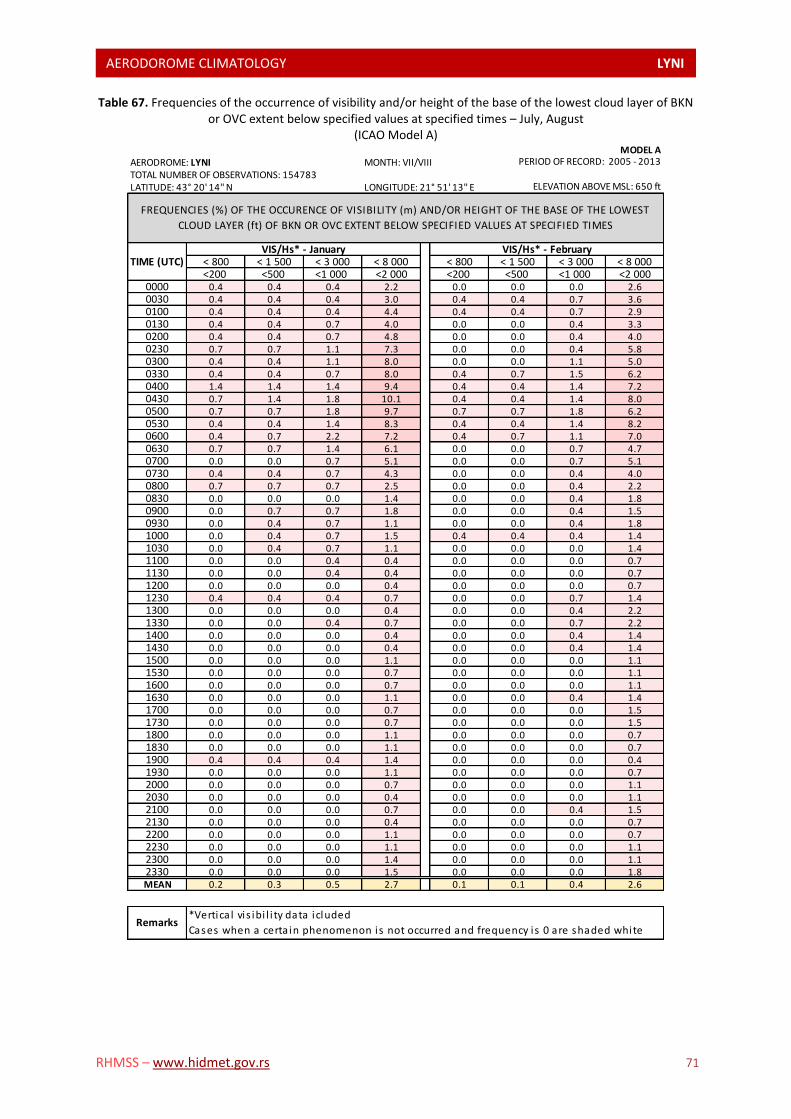
AERODOROME CLIMATOLOGY LYNI L
RHMSS – www.hidmet.gov.rs 71
Table 67. Frequencies of the occurrence of visibility and/or height of the base of the lowest cloud layer of BKN or OVC extent below specified values at specified times – July, August
(ICAO Model A) MODEL A
AERODROME: LYNI MONTH: VII/VIIITOTAL NUMBER OF OBSERVATIONS: 154783LATITUDE: 43° 20' 14'' N LONGITUDE: 21° 51' 13'' E
< 800 < 1 500 < 3 000 < 8 000 < 800 < 1 500 < 3 000 < 8 000<200 <500 <1 000 <2 000 <200 <500 <1 000 <2 000
0000 0.4 0.4 0.4 2.2 0.0 0.0 0.0 2.60030 0.4 0.4 0.4 3.0 0.4 0.4 0.7 3.60100 0.4 0.4 0.4 4.4 0.4 0.4 0.7 2.90130 0.4 0.4 0.7 4.0 0.0 0.0 0.4 3.30200 0.4 0.4 0.7 4.8 0.0 0.0 0.4 4.00230 0.7 0.7 1.1 7.3 0.0 0.0 0.4 5.80300 0.4 0.4 1.1 8.0 0.0 0.0 1.1 5.00330 0.4 0.4 0.7 8.0 0.4 0.7 1.5 6.20400 1.4 1.4 1.4 9.4 0.4 0.4 1.4 7.20430 0.7 1.4 1.8 10.1 0.4 0.4 1.4 8.00500 0.7 0.7 1.8 9.7 0.7 0.7 1.8 6.20530 0.4 0.4 1.4 8.3 0.4 0.4 1.4 8.20600 0.4 0.7 2.2 7.2 0.4 0.7 1.1 7.00630 0.7 0.7 1.4 6.1 0.0 0.0 0.7 4.70700 0.0 0.0 0.7 5.1 0.0 0.0 0.7 5.10730 0.4 0.4 0.7 4.3 0.0 0.0 0.4 4.00800 0.7 0.7 0.7 2.5 0.0 0.0 0.4 2.20830 0.0 0.0 0.0 1.4 0.0 0.0 0.4 1.80900 0.0 0.7 0.7 1.8 0.0 0.0 0.4 1.50930 0.0 0.4 0.7 1.1 0.0 0.0 0.4 1.81000 0.0 0.4 0.7 1.5 0.4 0.4 0.4 1.41030 0.0 0.4 0.7 1.1 0.0 0.0 0.0 1.41100 0.0 0.0 0.4 0.4 0.0 0.0 0.0 0.71130 0.0 0.0 0.4 0.4 0.0 0.0 0.0 0.71200 0.0 0.0 0.0 0.4 0.0 0.0 0.0 0.71230 0.4 0.4 0.4 0.7 0.0 0.0 0.7 1.41300 0.0 0.0 0.0 0.4 0.0 0.0 0.4 2.21330 0.0 0.0 0.4 0.7 0.0 0.0 0.7 2.21400 0.0 0.0 0.0 0.4 0.0 0.0 0.4 1.41430 0.0 0.0 0.0 0.4 0.0 0.0 0.4 1.41500 0.0 0.0 0.0 1.1 0.0 0.0 0.0 1.11530 0.0 0.0 0.0 0.7 0.0 0.0 0.0 1.11600 0.0 0.0 0.0 0.7 0.0 0.0 0.0 1.11630 0.0 0.0 0.0 1.1 0.0 0.0 0.4 1.41700 0.0 0.0 0.0 0.7 0.0 0.0 0.0 1.51730 0.0 0.0 0.0 0.7 0.0 0.0 0.0 1.51800 0.0 0.0 0.0 1.1 0.0 0.0 0.0 0.71830 0.0 0.0 0.0 1.1 0.0 0.0 0.0 0.71900 0.4 0.4 0.4 1.4 0.0 0.0 0.0 0.41930 0.0 0.0 0.0 1.1 0.0 0.0 0.0 0.72000 0.0 0.0 0.0 0.7 0.0 0.0 0.0 1.12030 0.0 0.0 0.0 0.4 0.0 0.0 0.0 1.12100 0.0 0.0 0.0 0.7 0.0 0.0 0.4 1.52130 0.0 0.0 0.0 0.4 0.0 0.0 0.0 0.72200 0.0 0.0 0.0 1.1 0.0 0.0 0.0 0.72230 0.0 0.0 0.0 1.1 0.0 0.0 0.0 1.12300 0.0 0.0 0.0 1.4 0.0 0.0 0.0 1.12330 0.0 0.0 0.0 1.5 0.0 0.0 0.0 1.8MEAN 0.2 0.3 0.5 2.7 0.1 0.1 0.4 2.6
FREQUENCIES (%) OF THE OCCURENCE OF VISIBILITY (m) AND/OR HEIGHT OF THE BASE OF THE LOWEST
CLOUD LAYER (ft) OF BKN OR OVC EXTENT BELOW SPECIFIED VALUES AT SPECIFIED TIMES
PERIOD OF RECORD: 2005 - 2013
ELEVATION ABOVE MSL: 650 ft
Remarks*Vertica l vis ibi l i ty data icluded
Cases when a certa in phenomenon is not occurred and frequency i s 0 are shaded white
TIME (UTC)VIS/Hs* - January VIS/Hs* - February

AERODOROME CLIMATOLOGY LYNI L
RHMSS – www.hidmet.gov.rs 72
Table 68. Frequencies of the occurrence of visibility and/or height of the base of the lowest cloud layer of BKN or OVC extent below specified values at specified times – September, October
(ICAO Model A) MODEL A
AERODROME: LYNI MONTH: IX/XTOTAL NUMBER OF OBSERVATIONS: 154783LATITUDE: 43° 20' 14'' N LONGITUDE: 21° 51' 13'' E
< 800 < 1 500 < 3 000 < 8 000 < 800 < 1 500 < 3 000 < 8 000<200 <500 <1 000 <2 000 <200 <500 <1 000 <2 000
0000 0.0 0.0 0.0 3.0 1.1 1.8 3.6 15.30030 0.0 0.0 0.0 3.8 1.1 1.8 3.7 16.60100 0.4 0.4 0.4 4.9 1.1 1.5 3.3 16.40130 0.4 0.4 0.4 5.0 0.7 1.9 3.4 16.40200 0.4 0.4 0.4 6.1 2.5 2.9 5.1 16.70230 0.4 0.4 0.4 8.0 2.2 2.9 5.5 16.20300 0.4 0.8 0.8 11.3 3.3 4.0 6.6 18.20330 1.5 1.9 1.9 13.7 2.9 3.7 7.0 18.70400 2.3 2.3 2.6 13.6 4.0 4.7 8.3 20.30430 1.5 1.5 2.6 13.9 4.4 5.9 10.3 21.30500 1.5 1.5 2.2 15.4 5.8 8.0 13.1 25.10530 1.9 1.9 2.2 15.0 4.8 6.6 12.5 25.60600 1.9 2.2 3.0 13.1 4.3 5.8 12.0 26.40630 0.0 0.4 1.5 11.3 4.0 5.1 12.4 26.60700 0.0 0.0 0.7 8.6 3.3 5.1 10.9 24.60730 0.0 0.0 0.8 6.8 2.9 3.6 8.7 23.60800 0.0 0.0 0.4 6.9 1.4 1.4 6.5 20.60830 0.0 0.0 0.4 5.6 1.1 1.5 4.0 18.50900 0.0 0.0 0.4 4.1 0.0 0.7 3.2 17.60930 0.8 0.8 1.1 3.8 0.0 0.4 2.5 12.91000 0.8 0.8 1.1 2.6 0.4 0.4 2.5 11.21030 0.0 0.0 0.0 2.3 0.0 0.0 2.2 9.71100 0.0 0.0 0.0 1.5 0.0 0.0 2.5 10.21130 0.0 0.0 0.0 1.9 0.0 0.0 2.5 9.41200 0.0 0.0 0.0 0.8 0.0 0.0 0.7 8.31230 0.0 0.0 0.0 1.1 0.0 0.4 1.1 6.21300 0.0 0.0 0.0 1.1 0.0 0.0 1.1 6.81330 0.0 0.0 0.0 1.5 0.0 0.0 1.1 6.51400 0.0 0.0 0.0 1.1 0.0 0.0 1.1 7.61430 0.0 0.0 0.0 1.5 0.0 0.0 1.1 8.01500 0.0 0.0 0.0 1.1 0.0 0.0 0.7 6.91530 0.0 0.0 0.0 0.4 0.0 0.0 1.1 7.61600 0.0 0.0 0.4 1.5 0.0 0.0 1.4 7.21630 0.0 0.0 0.7 1.1 0.0 0.0 1.1 6.51700 0.0 0.0 0.4 1.9 0.0 0.0 0.7 6.61730 0.0 0.0 0.4 1.5 0.0 0.0 0.4 6.21800 0.0 0.0 0.0 1.1 0.0 0.0 0.7 7.21830 0.0 0.0 0.0 1.1 0.0 0.4 1.4 6.81900 0.0 0.0 0.0 0.4 0.0 0.0 1.1 7.21930 0.4 0.4 0.4 0.7 0.4 0.4 1.4 9.42000 0.0 0.0 0.0 0.4 0.0 0.7 1.8 9.72030 0.0 0.0 0.0 0.8 0.7 0.7 2.2 9.82100 0.0 0.0 0.0 1.5 0.7 1.1 2.9 9.72130 0.0 0.0 0.0 1.5 0.4 1.1 2.6 10.32200 0.0 0.0 0.4 2.2 0.7 1.4 2.5 11.22230 0.0 0.0 0.0 1.1 0.4 1.1 2.6 12.12300 0.0 0.0 0.0 1.9 0.4 0.7 2.5 13.12330 0.0 0.0 0.0 1.5 0.4 1.1 3.0 15.9MEAN 0.3 0.3 0.5 4.4 1.2 1.6 3.9 13.4
FREQUENCIES (%) OF THE OCCURENCE OF VISIBILITY (m) AND/OR HEIGHT OF THE BASE OF THE LOWEST
CLOUD LAYER (ft) OF BKN OR OVC EXTENT BELOW SPECIFIED VALUES AT SPECIFIED TIMES
PERIOD OF RECORD: 2005 - 2013
ELEVATION ABOVE MSL: 650 ft
Remarks*Vertica l vis ibi l i ty data icluded
Cases when a certa in phenomenon is not occurred and frequency i s 0 are shaded white
TIME (UTC)VIS/Hs* - January VIS/Hs* - February
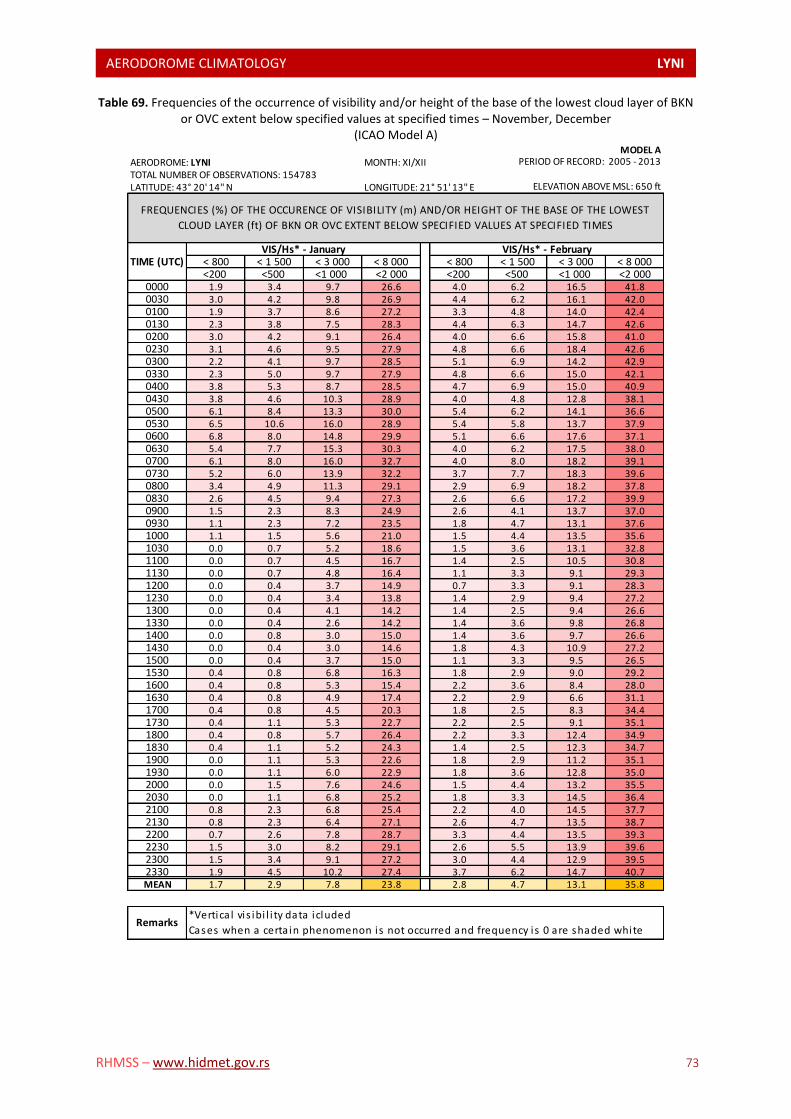
AERODOROME CLIMATOLOGY LYNI L
RHMSS – www.hidmet.gov.rs 73
Table 69. Frequencies of the occurrence of visibility and/or height of the base of the lowest cloud layer of BKN or OVC extent below specified values at specified times – November, December
(ICAO Model A) MODEL A
AERODROME: LYNI MONTH: XI/XIITOTAL NUMBER OF OBSERVATIONS: 154783LATITUDE: 43° 20' 14'' N LONGITUDE: 21° 51' 13'' E
< 800 < 1 500 < 3 000 < 8 000 < 800 < 1 500 < 3 000 < 8 000<200 <500 <1 000 <2 000 <200 <500 <1 000 <2 000
0000 1.9 3.4 9.7 26.6 4.0 6.2 16.5 41.80030 3.0 4.2 9.8 26.9 4.4 6.2 16.1 42.00100 1.9 3.7 8.6 27.2 3.3 4.8 14.0 42.40130 2.3 3.8 7.5 28.3 4.4 6.3 14.7 42.60200 3.0 4.2 9.1 26.4 4.0 6.6 15.8 41.00230 3.1 4.6 9.5 27.9 4.8 6.6 18.4 42.60300 2.2 4.1 9.7 28.5 5.1 6.9 14.2 42.90330 2.3 5.0 9.7 27.9 4.8 6.6 15.0 42.10400 3.8 5.3 8.7 28.5 4.7 6.9 15.0 40.90430 3.8 4.6 10.3 28.9 4.0 4.8 12.8 38.10500 6.1 8.4 13.3 30.0 5.4 6.2 14.1 36.60530 6.5 10.6 16.0 28.9 5.4 5.8 13.7 37.90600 6.8 8.0 14.8 29.9 5.1 6.6 17.6 37.10630 5.4 7.7 15.3 30.3 4.0 6.2 17.5 38.00700 6.1 8.0 16.0 32.7 4.0 8.0 18.2 39.10730 5.2 6.0 13.9 32.2 3.7 7.7 18.3 39.60800 3.4 4.9 11.3 29.1 2.9 6.9 18.2 37.80830 2.6 4.5 9.4 27.3 2.6 6.6 17.2 39.90900 1.5 2.3 8.3 24.9 2.6 4.1 13.7 37.00930 1.1 2.3 7.2 23.5 1.8 4.7 13.1 37.61000 1.1 1.5 5.6 21.0 1.5 4.4 13.5 35.61030 0.0 0.7 5.2 18.6 1.5 3.6 13.1 32.81100 0.0 0.7 4.5 16.7 1.4 2.5 10.5 30.81130 0.0 0.7 4.8 16.4 1.1 3.3 9.1 29.31200 0.0 0.4 3.7 14.9 0.7 3.3 9.1 28.31230 0.0 0.4 3.4 13.8 1.4 2.9 9.4 27.21300 0.0 0.4 4.1 14.2 1.4 2.5 9.4 26.61330 0.0 0.4 2.6 14.2 1.4 3.6 9.8 26.81400 0.0 0.8 3.0 15.0 1.4 3.6 9.7 26.61430 0.0 0.4 3.0 14.6 1.8 4.3 10.9 27.21500 0.0 0.4 3.7 15.0 1.1 3.3 9.5 26.51530 0.4 0.8 6.8 16.3 1.8 2.9 9.0 29.21600 0.4 0.8 5.3 15.4 2.2 3.6 8.4 28.01630 0.4 0.8 4.9 17.4 2.2 2.9 6.6 31.11700 0.4 0.8 4.5 20.3 1.8 2.5 8.3 34.41730 0.4 1.1 5.3 22.7 2.2 2.5 9.1 35.11800 0.4 0.8 5.7 26.4 2.2 3.3 12.4 34.91830 0.4 1.1 5.2 24.3 1.4 2.5 12.3 34.71900 0.0 1.1 5.3 22.6 1.8 2.9 11.2 35.11930 0.0 1.1 6.0 22.9 1.8 3.6 12.8 35.02000 0.0 1.5 7.6 24.6 1.5 4.4 13.2 35.52030 0.0 1.1 6.8 25.2 1.8 3.3 14.5 36.42100 0.8 2.3 6.8 25.4 2.2 4.0 14.5 37.72130 0.8 2.3 6.4 27.1 2.6 4.7 13.5 38.72200 0.7 2.6 7.8 28.7 3.3 4.4 13.5 39.32230 1.5 3.0 8.2 29.1 2.6 5.5 13.9 39.62300 1.5 3.4 9.1 27.2 3.0 4.4 12.9 39.52330 1.9 4.5 10.2 27.4 3.7 6.2 14.7 40.7MEAN 1.7 2.9 7.8 23.8 2.8 4.7 13.1 35.8
FREQUENCIES (%) OF THE OCCURENCE OF VISIBILITY (m) AND/OR HEIGHT OF THE BASE OF THE LOWEST
CLOUD LAYER (ft) OF BKN OR OVC EXTENT BELOW SPECIFIED VALUES AT SPECIFIED TIMES
PERIOD OF RECORD: 2005 - 2013
ELEVATION ABOVE MSL: 650 ft
Remarks*Vertica l vis ibi l i ty data icluded
Cases when a certa in phenomenon is not occurred and frequency i s 0 are shaded white
TIME (UTC)VIS/Hs* - January VIS/Hs* - February

AERODOROME CLIMATOLOGY LYNI L
RHMSS – www.hidmet.gov.rs 74
Wind Figure 4. Wind polygon – January, February
0.0 %
0.5 %
1.0 %
1.5 %
2.0 %
2.5 %
3.0 %
3.5 %
4.0 %
4.5 %
5.0 %
36010
20
30
40
50
60
70
80
90
100
110
120
130
140
150
160170
180190
200
210
220
230
240
250
260
270
280
290
300
310
320
330
340350
January
Wind speed (kt)
1-5
6-10
11-15
16-25
26-40
Calm: 4.3 %Variable: 22.0 %
0.0 %
0.5 %
1.0 %
1.5 %
2.0 %
2.5 %
3.0 %
3.5 %
4.0 %
4.5 %
5.0 %
36010
20
30
40
50
60
70
80
90
100
110
120
130
140
150
160170
180190
200
210
220
230
240
250
260
270
280
290
300
310
320
330
340350
February
Wind speed (kt)
1-5
6-10
11-15
16-25
26-40
Calm: 4.0 %Variable: 20.1 %

AERODOROME CLIMATOLOGY LYNI L
RHMSS – www.hidmet.gov.rs 75
Figure 5. Wind polygon – March, April
0.0 %
0.5 %
1.0 %
1.5 %
2.0 %
2.5 %
3.0 %
3.5 %
4.0 %
4.5 %
5.0 %
36010
20
30
40
50
60
70
80
90
100
110
120
130
140
150
160170
180190
200
210
220
230
240
250
260
270
280
290
300
310
320
330
340350
March
Wind speed (kt)
1-5
6-10
11-15
16-25
26-40
Calm: 2.9 %Variable: 18.8 %
0.0 %
0.5 %
1.0 %
1.5 %
2.0 %
2.5 %
3.0 %
3.5 %
4.0 %
4.5 %
5.0 %
36010
20
30
40
50
60
70
80
90
100
110
120
130
140
150
160170
180190
200
210
220
230
240
250
260
270
280
290
300
310
320
330
340350
April
Wind speed (kt)
1-5
6-10
11-15
16-25
26-40
Calm: 2.7 %Variable: 21.6 %
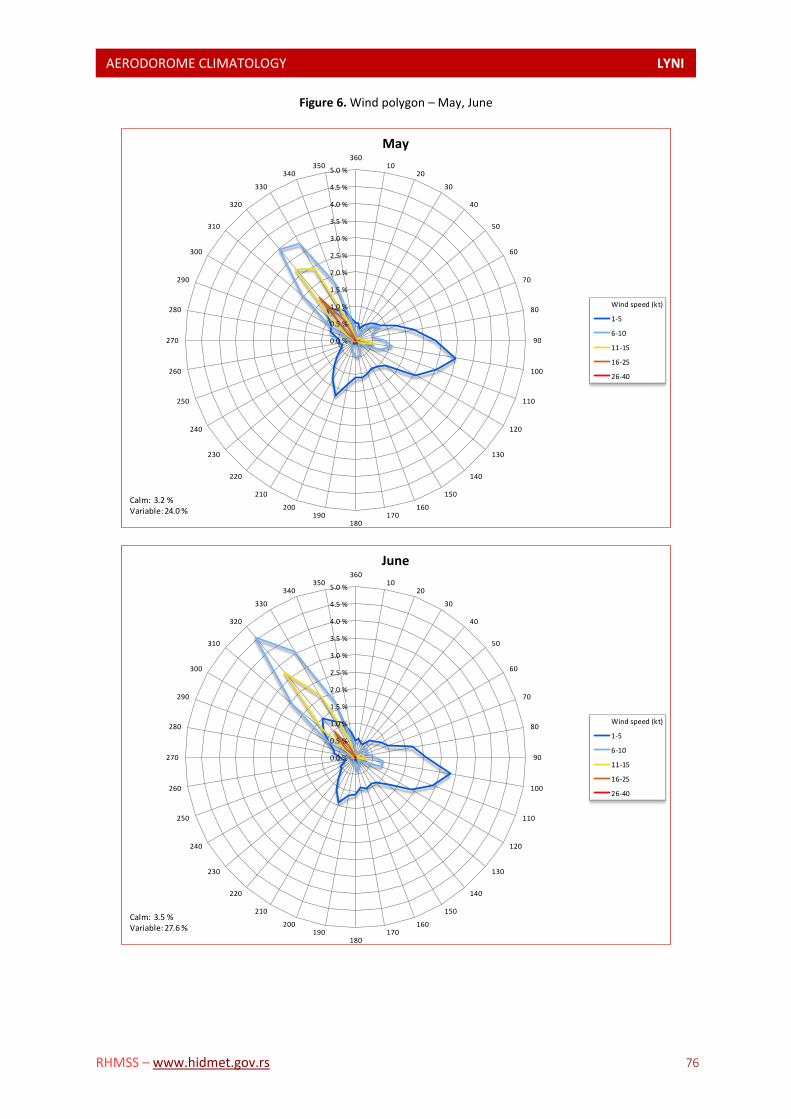
AERODOROME CLIMATOLOGY LYNI L
RHMSS – www.hidmet.gov.rs 76
Figure 6. Wind polygon – May, June
0.0 %
0.5 %
1.0 %
1.5 %
2.0 %
2.5 %
3.0 %
3.5 %
4.0 %
4.5 %
5.0 %
36010
20
30
40
50
60
70
80
90
100
110
120
130
140
150
160170
180190
200
210
220
230
240
250
260
270
280
290
300
310
320
330
340350
May
Wind speed (kt)
1-5
6-10
11-15
16-25
26-40
Calm: 3.2 %Variable: 24.0 %
0.0 %
0.5 %
1.0 %
1.5 %
2.0 %
2.5 %
3.0 %
3.5 %
4.0 %
4.5 %
5.0 %
36010
20
30
40
50
60
70
80
90
100
110
120
130
140
150
160170
180190
200
210
220
230
240
250
260
270
280
290
300
310
320
330
340350
June
Wind speed (kt)
1-5
6-10
11-15
16-25
26-40
Calm: 3.5 %Variable: 27.6 %
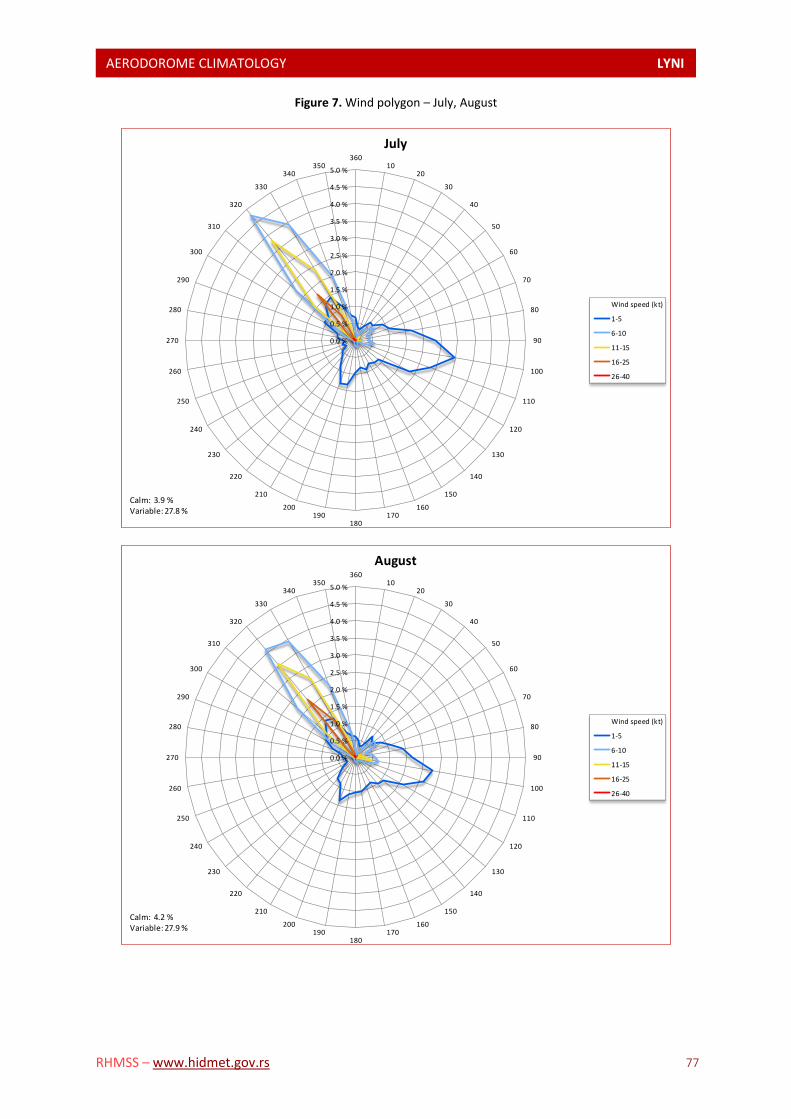
AERODOROME CLIMATOLOGY LYNI L
RHMSS – www.hidmet.gov.rs 77
Figure 7. Wind polygon – July, August
0.0 %
0.5 %
1.0 %
1.5 %
2.0 %
2.5 %
3.0 %
3.5 %
4.0 %
4.5 %
5.0 %
36010
20
30
40
50
60
70
80
90
100
110
120
130
140
150
160170
180190
200
210
220
230
240
250
260
270
280
290
300
310
320
330
340350
July
Wind speed (kt)
1-5
6-10
11-15
16-25
26-40
Calm: 3.9 %Variable: 27.8 %
0.0 %
0.5 %
1.0 %
1.5 %
2.0 %
2.5 %
3.0 %
3.5 %
4.0 %
4.5 %
5.0 %
36010
20
30
40
50
60
70
80
90
100
110
120
130
140
150
160170
180190
200
210
220
230
240
250
260
270
280
290
300
310
320
330
340350
August
Wind speed (kt)
1-5
6-10
11-15
16-25
26-40
Calm: 4.2 %Variable: 27.9 %
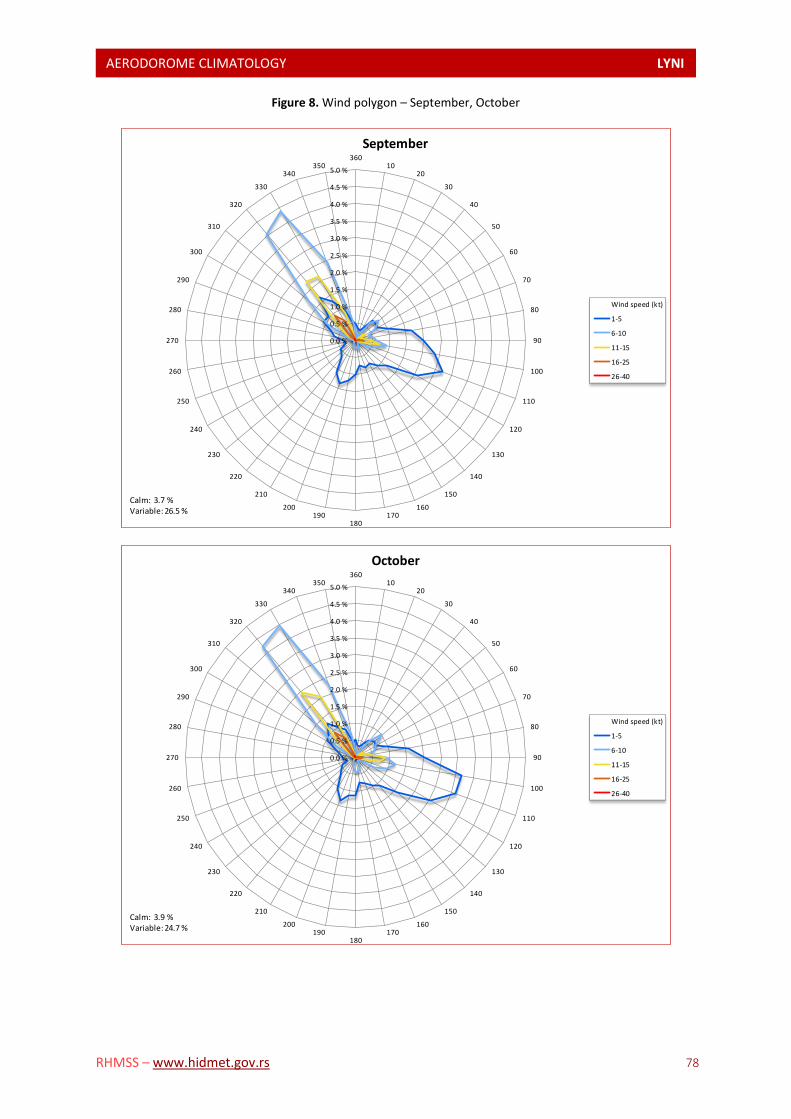
AERODOROME CLIMATOLOGY LYNI L
RHMSS – www.hidmet.gov.rs 78
Figure 8. Wind polygon – September, October
0.0 %
0.5 %
1.0 %
1.5 %
2.0 %
2.5 %
3.0 %
3.5 %
4.0 %
4.5 %
5.0 %
36010
20
30
40
50
60
70
80
90
100
110
120
130
140
150
160170
180190
200
210
220
230
240
250
260
270
280
290
300
310
320
330
340350
September
Wind speed (kt)
1-5
6-10
11-15
16-25
26-40
Calm: 3.7 %Variable: 26.5 %
0.0 %
0.5 %
1.0 %
1.5 %
2.0 %
2.5 %
3.0 %
3.5 %
4.0 %
4.5 %
5.0 %
36010
20
30
40
50
60
70
80
90
100
110
120
130
140
150
160170
180190
200
210
220
230
240
250
260
270
280
290
300
310
320
330
340350
October
Wind speed (kt)
1-5
6-10
11-15
16-25
26-40
Calm: 3.9 %Variable: 24.7 %
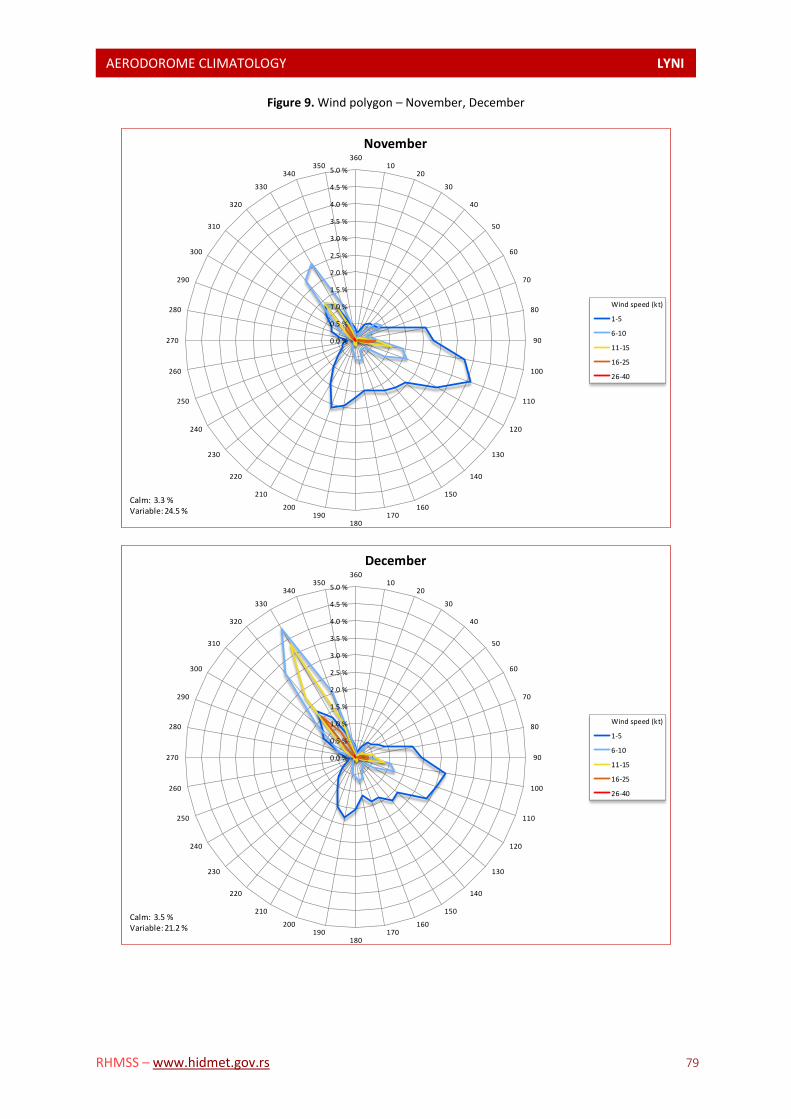
AERODOROME CLIMATOLOGY LYNI L
RHMSS – www.hidmet.gov.rs 79
Figure 9. Wind polygon – November, December
0.0 %
0.5 %
1.0 %
1.5 %
2.0 %
2.5 %
3.0 %
3.5 %
4.0 %
4.5 %
5.0 %
36010
20
30
40
50
60
70
80
90
100
110
120
130
140
150
160170
180190
200
210
220
230
240
250
260
270
280
290
300
310
320
330
340350
November
Wind speed (kt)
1-5
6-10
11-15
16-25
26-40
Calm: 3.3 %Variable: 24.5 %
0.0 %
0.5 %
1.0 %
1.5 %
2.0 %
2.5 %
3.0 %
3.5 %
4.0 %
4.5 %
5.0 %
36010
20
30
40
50
60
70
80
90
100
110
120
130
140
150
160170
180190
200
210
220
230
240
250
260
270
280
290
300
310
320
330
340350
December
Wind speed (kt)
1-5
6-10
11-15
16-25
26-40
Calm: 3.5 %Variable: 21.2 %
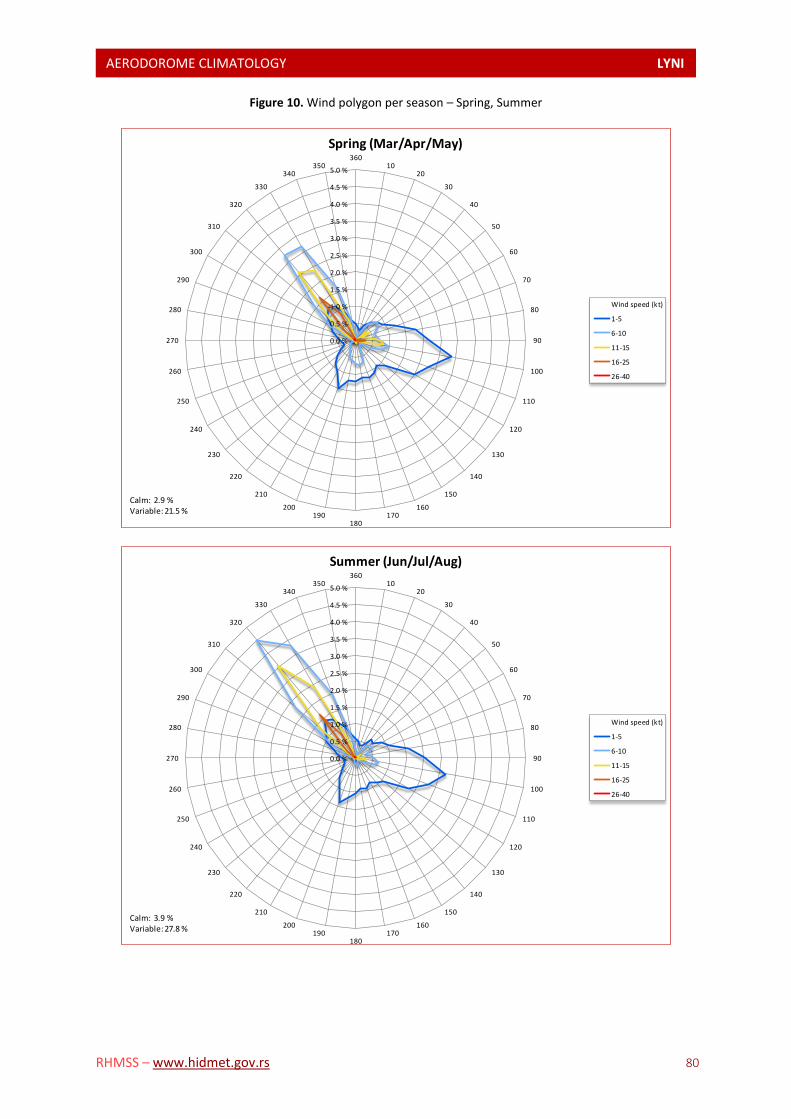
AERODOROME CLIMATOLOGY LYNI L
RHMSS – www.hidmet.gov.rs 80
Figure 10. Wind polygon per season – Spring, Summer
0.0 %
0.5 %
1.0 %
1.5 %
2.0 %
2.5 %
3.0 %
3.5 %
4.0 %
4.5 %
5.0 %
36010
20
30
40
50
60
70
80
90
100
110
120
130
140
150
160170
180190
200
210
220
230
240
250
260
270
280
290
300
310
320
330
340350
Spring (Mar/Apr/May)
Wind speed (kt)
1-5
6-10
11-15
16-25
26-40
Calm: 2.9 %Variable: 21.5 %
0.0 %
0.5 %
1.0 %
1.5 %
2.0 %
2.5 %
3.0 %
3.5 %
4.0 %
4.5 %
5.0 %
36010
20
30
40
50
60
70
80
90
100
110
120
130
140
150
160170
180190
200
210
220
230
240
250
260
270
280
290
300
310
320
330
340350
Summer (Jun/Jul/Aug)
Wind speed (kt)
1-5
6-10
11-15
16-25
26-40
Calm: 3.9 %Variable: 27.8 %
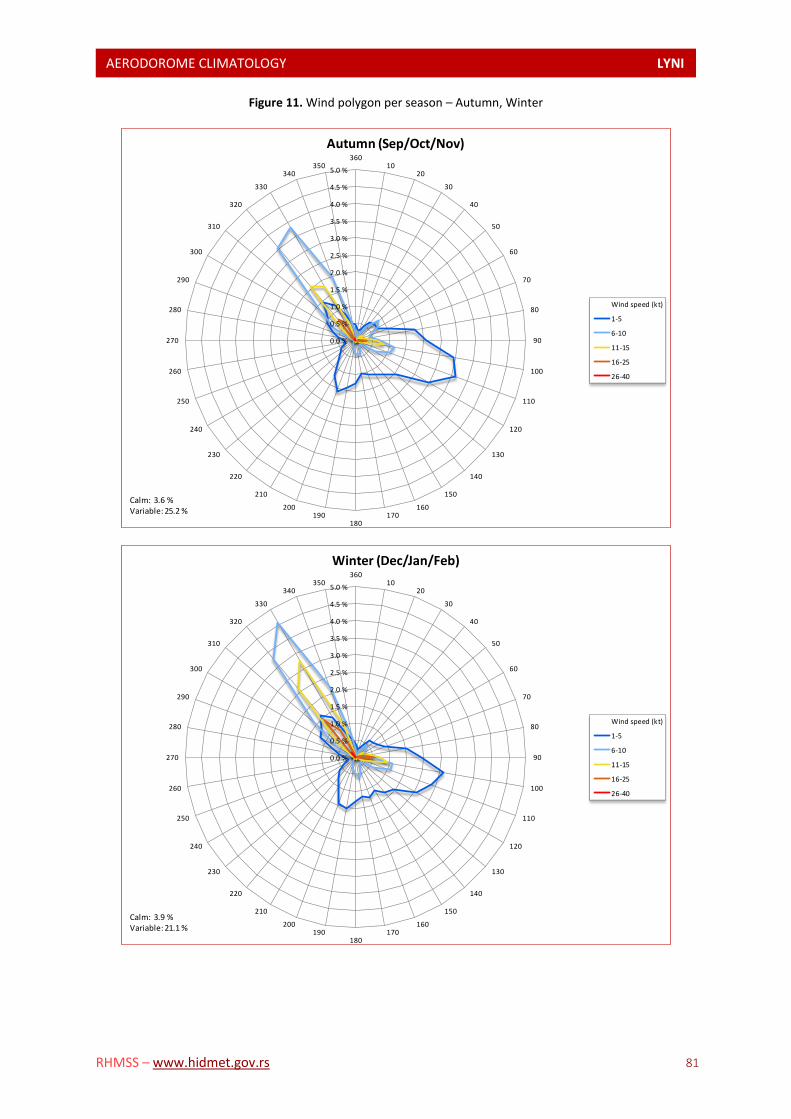
AERODOROME CLIMATOLOGY LYNI L
RHMSS – www.hidmet.gov.rs 81
Figure 11. Wind polygon per season – Autumn, Winter
0.0 %
0.5 %
1.0 %
1.5 %
2.0 %
2.5 %
3.0 %
3.5 %
4.0 %
4.5 %
5.0 %
36010
20
30
40
50
60
70
80
90
100
110
120
130
140
150
160170
180190
200
210
220
230
240
250
260
270
280
290
300
310
320
330
340350
Autumn (Sep/Oct/Nov)
Wind speed (kt)
1-5
6-10
11-15
16-25
26-40
Calm: 3.6 %Variable: 25.2 %
0.0 %
0.5 %
1.0 %
1.5 %
2.0 %
2.5 %
3.0 %
3.5 %
4.0 %
4.5 %
5.0 %
36010
20
30
40
50
60
70
80
90
100
110
120
130
140
150
160170
180190
200
210
220
230
240
250
260
270
280
290
300
310
320
330
340350
Winter (Dec/Jan/Feb)
Wind speed (kt)
1-5
6-10
11-15
16-25
26-40
Calm: 3.9 %Variable: 21.1 %
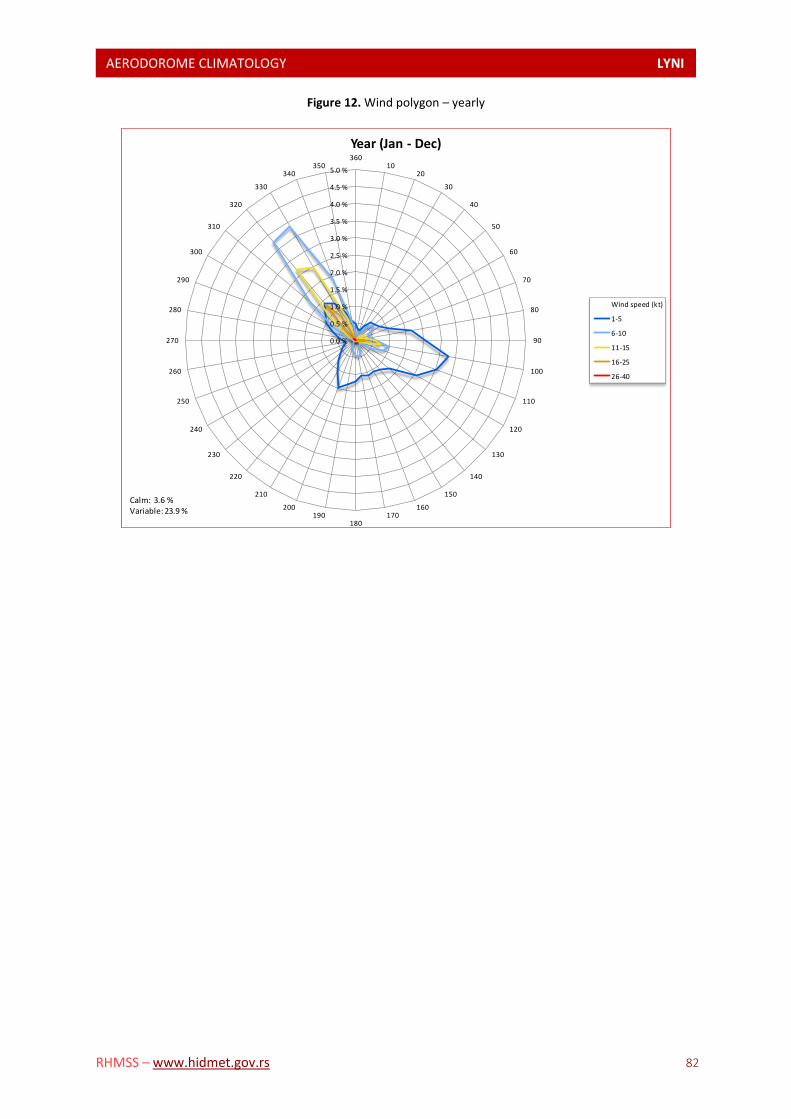
AERODOROME CLIMATOLOGY LYNI L
RHMSS – www.hidmet.gov.rs 82
Figure 12. Wind polygon – yearly
0.0 %
0.5 %
1.0 %
1.5 %
2.0 %
2.5 %
3.0 %
3.5 %
4.0 %
4.5 %
5.0 %
36010
20
30
40
50
60
70
80
90
100
110
120
130
140
150
160170
180190
200
210
220
230
240
250
260
270
280
290
300
310
320
330
340350
Year (Jan - Dec)
Wind speed (kt)
1-5
6-10
11-15
16-25
26-40
Calm: 3.6 %Variable: 23.9 %

AERODOROME CLIMATOLOGY LYNI L
RHMSS – www.hidmet.gov.rs 83
Table 70. Frequencies of occurrence of wind directions within specified speed ranges – January
Speed(kt)/
Direction (º)1-5 6-10 11-15 16-25 26-40
10 0.3 0.1 0.0 0.0 0.0
20 0.2 0.0 0.0 0.0 0.0
30 0.3 0.1 0.0 0.0 0.0
40 0.8 0.4 0.0 0.0 0.0
50 0.7 0.4 0.1 0.0 0.0
60 0.7 0.2 0.1 0.0 0.0
70 1.0 0.1 0.1 0.0 0.0
80 1.7 0.2 0.2 0.0 0.0
90 2.3 0.5 0.4 0.1 0.0
100 3.0 1.4 0.9 0.1 0.0
110 2.8 1.1 0.3 0.1 0.0
120 2.3 0.8 0.1 0.0 0.0
130 1.5 0.2 0.0 0.0 0.0
140 1.4 0.1 0.0 0.0 0.0
150 1.1 0.1 0.0 0.0 0.0
160 1.3 0.2 0.1 0.0 0.0
170 1.2 0.3 0.0 0.0 0.0
180 1.2 0.4 0.0 0.0 0.0
190 1.4 0.3 0.0 0.0 0.0
200 1.5 0.2 0.0 0.0 0.0
210 1.0 0.1 0.0 0.0 0.0
220 0.8 0.1 0.0 0.0 0.0
230 0.6 0.0 0.0 0.0 0.0
240 0.3 0.0 0.0 0.0 0.0
250 0.2 0.0 0.0 0.0 0.0
260 0.3 0.0 0.0 0.0 0.0
270 0.4 0.0 0.0 0.0 0.0
280 0.5 0.1 0.0 0.0 0.0
290 0.8 0.3 0.0 0.0 0.0
300 1.3 0.6 0.2 0.1 0.0
310 1.3 1.7 0.8 0.2 0.0
320 1.4 4.2 2.5 1.1 0.3
330 1.3 4.4 2.7 0.7 0.0
340 0.7 2.3 1.1 0.1 0.0
350 0.5 0.9 0.2 0.0 0.0
360 0.4 0.3 0.1 0.0 0.0
REMARKSCases when a certain phenomenon is not occurred and
frequency is 0 are shaded white

AERODOROME CLIMATOLOGY LYNI L
RHMSS – www.hidmet.gov.rs 84
Table 71. Frequencies of occurrence of wind directions within specified speed ranges – February
Speed(kt)/
Direction (º)1-5 6-10 11-15 16-25 26-40
10 0.3 0.1 0.0 0.0 0.0
20 0.3 0.1 0.0 0.0 0.0
30 0.6 0.1 0.0 0.0 0.0
40 0.6 0.6 0.0 0.0 0.0
50 0.7 0.7 0.4 0.0 0.0
60 0.8 0.5 0.5 0.1 0.0
70 0.8 0.2 0.3 0.2 0.0
80 1.2 0.3 0.6 0.6 0.0
90 1.5 0.4 1.3 1.3 0.0
100 2.1 0.9 1.1 0.5 0.0
110 1.7 0.9 0.2 0.0 0.0
120 1.4 0.4 0.0 0.0 0.0
130 1.3 0.1 0.0 0.0 0.0
140 0.9 0.1 0.0 0.0 0.0
150 0.9 0.3 0.0 0.0 0.0
160 1.1 0.6 0.0 0.0 0.0
170 1.2 0.7 0.0 0.0 0.0
180 1.1 0.5 0.0 0.0 0.0
190 1.4 0.4 0.0 0.0 0.0
200 1.4 0.3 0.0 0.0 0.0
210 1.0 0.2 0.0 0.0 0.0
220 0.8 0.0 0.0 0.0 0.0
230 0.8 0.1 0.0 0.0 0.0
240 0.5 0.0 0.0 0.0 0.0
250 0.2 0.0 0.0 0.0 0.0
260 0.3 0.0 0.0 0.0 0.0
270 0.3 0.0 0.0 0.0 0.0
280 0.5 0.1 0.0 0.0 0.0
290 0.8 0.3 0.2 0.0 0.0
300 1.1 0.6 0.2 0.0 0.0
310 1.4 1.6 0.7 0.4 0.0
320 1.6 3.9 3.1 1.7 0.2
330 1.3 5.0 3.3 1.1 0.0
340 0.9 2.2 0.8 0.2 0.0
350 0.6 0.6 0.1 0.0 0.0
360 0.4 0.3 0.0 0.0 0.0
REMARKSCases when a certain phenomenon is not occurred and
frequency is 0 are shaded white

AERODOROME CLIMATOLOGY LYNI L
RHMSS – www.hidmet.gov.rs 85
Table 72. Frequencies of occurrence of wind directions within specified speed ranges – March
Speed(kt)/
Direction (º)1-5 6-10 11-15 16-25 26-40
10 0.4 0.1 0.0 0.0 0.0
20 0.3 0.1 0.0 0.0 0.0
30 0.4 0.1 0.0 0.0 0.0
40 0.6 0.6 0.0 0.0 0.0
50 0.7 0.7 0.3 0.1 0.0
60 0.8 0.5 0.6 0.1 0.0
70 1.2 0.5 0.3 0.0 0.0
80 1.6 0.5 0.6 0.2 0.0
90 2.0 0.6 0.9 0.6 0.0
100 2.9 0.8 0.9 0.1 0.0
110 2.1 1.0 0.2 0.0 0.0
120 2.0 0.5 0.0 0.0 0.0
130 1.1 0.2 0.0 0.0 0.0
140 0.8 0.3 0.0 0.0 0.0
150 1.1 0.4 0.0 0.0 0.0
160 1.3 0.8 0.1 0.0 0.0
170 1.2 0.9 0.2 0.0 0.0
180 1.2 1.0 0.1 0.0 0.0
190 1.1 0.8 0.1 0.0 0.0
200 1.3 0.7 0.1 0.0 0.0
210 0.9 0.4 0.1 0.0 0.0
220 0.7 0.3 0.1 0.0 0.0
230 0.6 0.2 0.1 0.0 0.0
240 0.5 0.2 0.0 0.0 0.0
250 0.3 0.1 0.0 0.0 0.0
260 0.3 0.1 0.0 0.0 0.0
270 0.4 0.1 0.0 0.0 0.0
280 0.5 0.2 0.0 0.0 0.0
290 0.7 0.4 0.2 0.1 0.0
300 0.7 0.9 0.5 0.1 0.0
310 1.0 1.4 1.1 0.4 0.0
320 1.3 3.4 2.6 1.8 0.1
330 1.3 3.6 2.8 1.2 0.0
340 0.8 1.6 0.9 0.1 0.0
350 0.6 0.6 0.2 0.0 0.0
360 0.5 0.3 0.1 0.0 0.0
REMARKSCases when a certain phenomenon is not occurred and
frequency is 0 are shaded white

AERODOROME CLIMATOLOGY LYNI L
RHMSS – www.hidmet.gov.rs 86
Table 73. Frequencies of occurrence of wind directions within specified speed ranges – April
Speed(kt)/
Direction (º)1-5 6-10 11-15 16-25 26-40
10 0.3 0.1 0.0 0.0 0.0
20 0.3 0.1 0.0 0.0 0.0
30 0.6 0.2 0.0 0.0 0.0
40 0.8 0.8 0.0 0.0 0.0
50 1.1 1.1 0.7 0.0 0.0
60 1.0 0.9 0.7 0.0 0.0
70 1.3 0.7 0.3 0.0 0.0
80 2.0 0.8 0.5 0.1 0.0
90 2.1 0.8 1.0 0.3 0.0
100 2.6 1.0 1.0 0.2 0.0
110 2.2 0.7 0.2 0.0 0.0
120 1.9 0.4 0.0 0.0 0.0
130 1.2 0.1 0.0 0.0 0.0
140 1.0 0.1 0.0 0.0 0.0
150 1.2 0.3 0.0 0.0 0.0
160 1.2 0.7 0.1 0.0 0.0
170 1.1 0.8 0.1 0.0 0.0
180 1.3 0.7 0.1 0.0 0.0
190 1.2 0.6 0.0 0.0 0.0
200 1.5 0.6 0.0 0.0 0.0
210 1.1 0.3 0.0 0.0 0.0
220 1.0 0.2 0.0 0.0 0.0
230 0.8 0.2 0.0 0.0 0.0
240 0.5 0.1 0.0 0.0 0.0
250 0.3 0.1 0.0 0.0 0.0
260 0.4 0.0 0.0 0.0 0.0
270 0.5 0.0 0.0 0.0 0.0
280 0.5 0.2 0.0 0.0 0.0
290 0.7 0.3 0.1 0.0 0.0
300 0.9 0.8 0.4 0.1 0.0
310 1.2 1.5 0.9 0.5 0.0
320 1.2 2.9 2.4 1.5 0.0
330 1.1 2.7 1.9 0.8 0.0
340 0.8 1.5 0.5 0.1 0.0
350 0.6 0.3 0.1 0.0 0.0
360 0.4 0.2 0.0 0.0 0.0
REMARKSCases when a certain phenomenon is not occurred and
frequency is 0 are shaded white
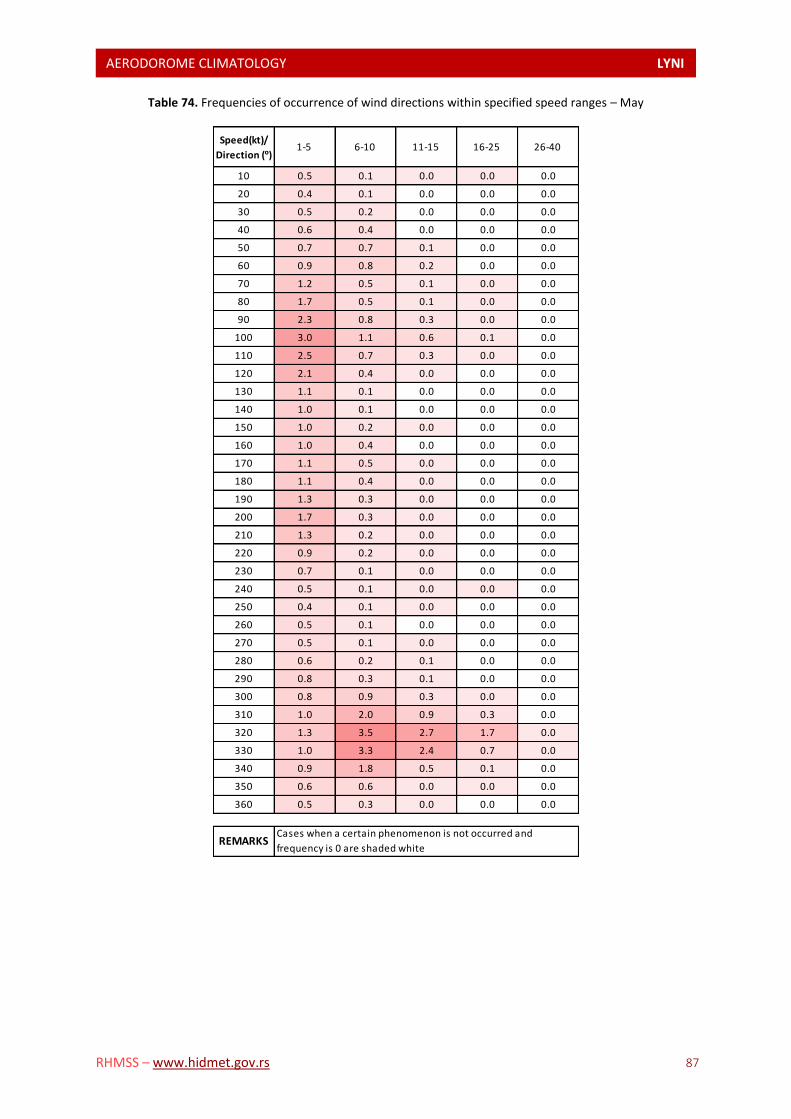
AERODOROME CLIMATOLOGY LYNI L
RHMSS – www.hidmet.gov.rs 87
Table 74. Frequencies of occurrence of wind directions within specified speed ranges – May
Speed(kt)/
Direction (º)1-5 6-10 11-15 16-25 26-40
10 0.5 0.1 0.0 0.0 0.0
20 0.4 0.1 0.0 0.0 0.0
30 0.5 0.2 0.0 0.0 0.0
40 0.6 0.4 0.0 0.0 0.0
50 0.7 0.7 0.1 0.0 0.0
60 0.9 0.8 0.2 0.0 0.0
70 1.2 0.5 0.1 0.0 0.0
80 1.7 0.5 0.1 0.0 0.0
90 2.3 0.8 0.3 0.0 0.0
100 3.0 1.1 0.6 0.1 0.0
110 2.5 0.7 0.3 0.0 0.0
120 2.1 0.4 0.0 0.0 0.0
130 1.1 0.1 0.0 0.0 0.0
140 1.0 0.1 0.0 0.0 0.0
150 1.0 0.2 0.0 0.0 0.0
160 1.0 0.4 0.0 0.0 0.0
170 1.1 0.5 0.0 0.0 0.0
180 1.1 0.4 0.0 0.0 0.0
190 1.3 0.3 0.0 0.0 0.0
200 1.7 0.3 0.0 0.0 0.0
210 1.3 0.2 0.0 0.0 0.0
220 0.9 0.2 0.0 0.0 0.0
230 0.7 0.1 0.0 0.0 0.0
240 0.5 0.1 0.0 0.0 0.0
250 0.4 0.1 0.0 0.0 0.0
260 0.5 0.1 0.0 0.0 0.0
270 0.5 0.1 0.0 0.0 0.0
280 0.6 0.2 0.1 0.0 0.0
290 0.8 0.3 0.1 0.0 0.0
300 0.8 0.9 0.3 0.0 0.0
310 1.0 2.0 0.9 0.3 0.0
320 1.3 3.5 2.7 1.7 0.0
330 1.0 3.3 2.4 0.7 0.0
340 0.9 1.8 0.5 0.1 0.0
350 0.6 0.6 0.0 0.0 0.0
360 0.5 0.3 0.0 0.0 0.0
REMARKSCases when a certain phenomenon is not occurred and
frequency is 0 are shaded white

AERODOROME CLIMATOLOGY LYNI L
RHMSS – www.hidmet.gov.rs 88
Table 75. Frequencies of occurrence of wind directions within specified speed ranges – June
Speed(kt)/
Direction (º)1-5 6-10 11-15 16-25 26-40
10 0.6 0.0 0.0 0.0 0.0
20 0.5 0.0 0.0 0.0 0.0
30 0.4 0.1 0.0 0.0 0.0
40 0.6 0.3 0.0 0.0 0.0
50 0.7 0.4 0.0 0.0 0.0
60 0.9 0.4 0.2 0.0 0.0
70 1.0 0.3 0.0 0.0 0.0
80 1.7 0.4 0.0 0.0 0.0
90 2.1 0.6 0.2 0.0 0.0
100 2.8 0.8 0.4 0.0 0.0
110 2.4 0.8 0.1 0.0 0.0
120 1.9 0.4 0.0 0.0 0.0
130 1.3 0.1 0.0 0.0 0.0
140 1.0 0.1 0.0 0.0 0.0
150 0.9 0.2 0.0 0.0 0.0
160 1.0 0.3 0.0 0.0 0.0
170 0.9 0.4 0.0 0.0 0.0
180 1.1 0.3 0.0 0.0 0.0
190 1.1 0.2 0.0 0.0 0.0
200 1.4 0.1 0.0 0.0 0.0
210 1.1 0.1 0.0 0.0 0.0
220 0.8 0.1 0.0 0.0 0.0
230 0.5 0.1 0.0 0.0 0.0
240 0.5 0.1 0.0 0.0 0.0
250 0.3 0.1 0.0 0.0 0.0
260 0.4 0.0 0.0 0.0 0.0
270 0.5 0.1 0.0 0.0 0.0
280 0.6 0.1 0.0 0.0 0.0
290 0.7 0.4 0.1 0.0 0.0
300 0.9 1.0 0.2 0.0 0.0
310 1.2 2.4 1.3 0.4 0.0
320 1.5 4.6 3.2 1.0 0.0
330 1.2 3.6 2.1 0.4 0.0
340 1.1 1.7 0.6 0.0 0.0
350 0.7 0.6 0.1 0.0 0.0
360 0.5 0.3 0.0 0.0 0.0
REMARKSCases when a certain phenomenon is not occurred and
frequency is 0 are shaded white

AERODOROME CLIMATOLOGY LYNI L
RHMSS – www.hidmet.gov.rs 89
Table 76. Frequencies of occurrence of wind directions within specified speed ranges – July
Speed(kt)/
Direction (º)1-5 6-10 11-15 16-25 26-40
10 0.4 0.1 0.0 0.0 0.0
20 0.3 0.1 0.0 0.0 0.0
30 0.4 0.1 0.0 0.0 0.0
40 0.7 0.4 0.0 0.0 0.0
50 0.7 0.5 0.2 0.0 0.0
60 0.9 0.7 0.2 0.0 0.0
70 1.1 0.4 0.0 0.0 0.0
80 1.7 0.5 0.0 0.0 0.0
90 2.3 0.4 0.1 0.0 0.0
100 3.0 0.6 0.1 0.0 0.0
110 2.3 0.4 0.1 0.0 0.0
120 1.8 0.2 0.0 0.0 0.0
130 0.9 0.1 0.0 0.0 0.0
140 0.8 0.1 0.0 0.0 0.0
150 0.8 0.1 0.0 0.0 0.0
160 0.9 0.2 0.0 0.0 0.0
170 0.8 0.2 0.0 0.0 0.0
180 1.0 0.2 0.0 0.0 0.0
190 1.3 0.1 0.0 0.0 0.0
200 1.4 0.1 0.0 0.0 0.0
210 0.9 0.1 0.0 0.0 0.0
220 0.6 0.0 0.0 0.0 0.0
230 0.5 0.1 0.0 0.0 0.0
240 0.3 0.0 0.0 0.0 0.0
250 0.4 0.1 0.0 0.0 0.0
260 0.3 0.1 0.0 0.0 0.0
270 0.4 0.0 0.0 0.0 0.0
280 0.6 0.1 0.0 0.0 0.0
290 0.6 0.3 0.0 0.0 0.0
300 1.1 0.7 0.2 0.0 0.0
310 1.0 2.2 1.6 0.3 0.0
320 1.4 4.8 3.8 1.7 0.1
330 1.5 3.9 2.4 0.8 0.0
340 1.1 2.0 0.5 0.0 0.0
350 0.7 0.6 0.1 0.0 0.0
360 0.7 0.3 0.0 0.0 0.0
REMARKSCases when a certain phenomenon is not occurred and
frequency is 0 are shaded white
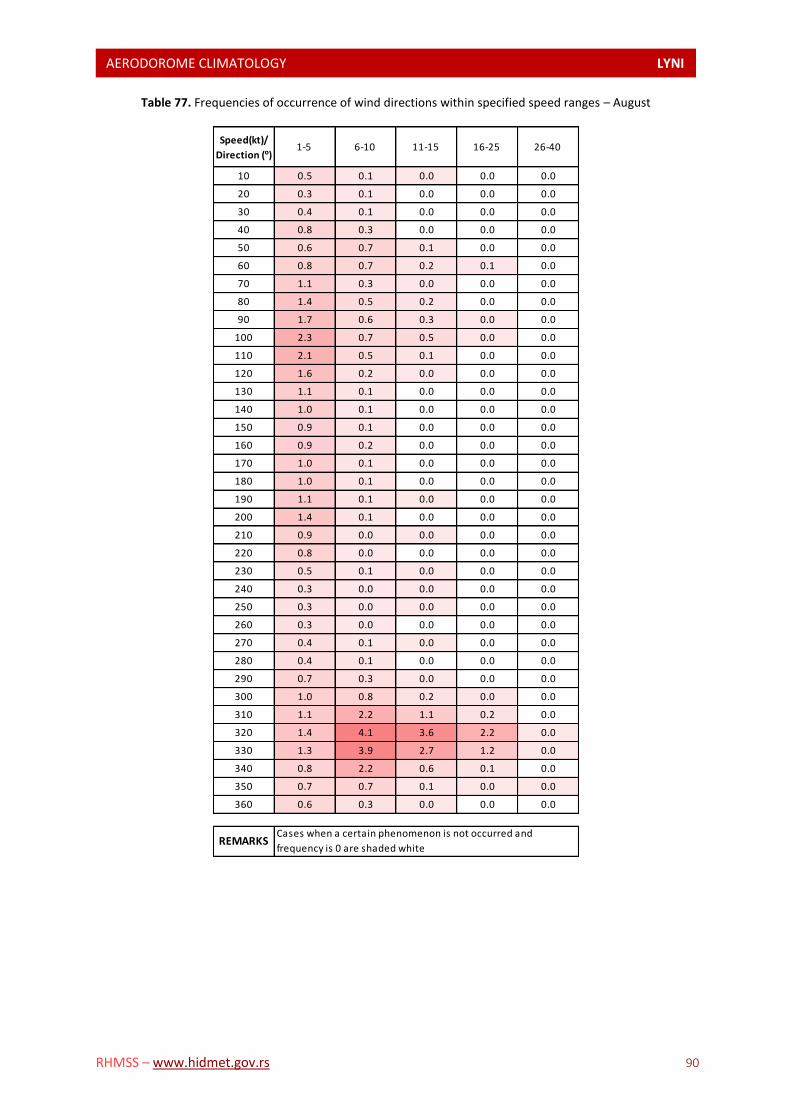
AERODOROME CLIMATOLOGY LYNI L
RHMSS – www.hidmet.gov.rs 90
Table 77. Frequencies of occurrence of wind directions within specified speed ranges – August
Speed(kt)/
Direction (º)1-5 6-10 11-15 16-25 26-40
10 0.5 0.1 0.0 0.0 0.0
20 0.3 0.1 0.0 0.0 0.0
30 0.4 0.1 0.0 0.0 0.0
40 0.8 0.3 0.0 0.0 0.0
50 0.6 0.7 0.1 0.0 0.0
60 0.8 0.7 0.2 0.1 0.0
70 1.1 0.3 0.0 0.0 0.0
80 1.4 0.5 0.2 0.0 0.0
90 1.7 0.6 0.3 0.0 0.0
100 2.3 0.7 0.5 0.0 0.0
110 2.1 0.5 0.1 0.0 0.0
120 1.6 0.2 0.0 0.0 0.0
130 1.1 0.1 0.0 0.0 0.0
140 1.0 0.1 0.0 0.0 0.0
150 0.9 0.1 0.0 0.0 0.0
160 0.9 0.2 0.0 0.0 0.0
170 1.0 0.1 0.0 0.0 0.0
180 1.0 0.1 0.0 0.0 0.0
190 1.1 0.1 0.0 0.0 0.0
200 1.4 0.1 0.0 0.0 0.0
210 0.9 0.0 0.0 0.0 0.0
220 0.8 0.0 0.0 0.0 0.0
230 0.5 0.1 0.0 0.0 0.0
240 0.3 0.0 0.0 0.0 0.0
250 0.3 0.0 0.0 0.0 0.0
260 0.3 0.0 0.0 0.0 0.0
270 0.4 0.1 0.0 0.0 0.0
280 0.4 0.1 0.0 0.0 0.0
290 0.7 0.3 0.0 0.0 0.0
300 1.0 0.8 0.2 0.0 0.0
310 1.1 2.2 1.1 0.2 0.0
320 1.4 4.1 3.6 2.2 0.0
330 1.3 3.9 2.7 1.2 0.0
340 0.8 2.2 0.6 0.1 0.0
350 0.7 0.7 0.1 0.0 0.0
360 0.6 0.3 0.0 0.0 0.0
REMARKSCases when a certain phenomenon is not occurred and
frequency is 0 are shaded white
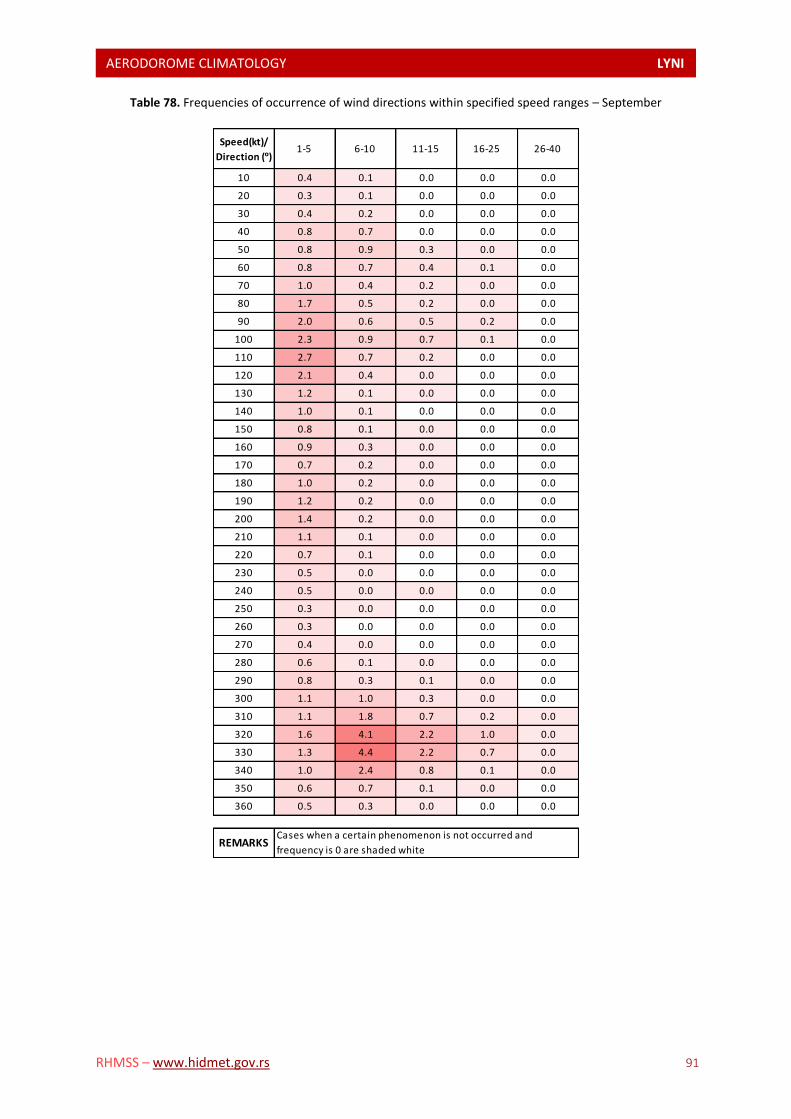
AERODOROME CLIMATOLOGY LYNI L
RHMSS – www.hidmet.gov.rs 91
Table 78. Frequencies of occurrence of wind directions within specified speed ranges – September
Speed(kt)/
Direction (º)1-5 6-10 11-15 16-25 26-40
10 0.4 0.1 0.0 0.0 0.0
20 0.3 0.1 0.0 0.0 0.0
30 0.4 0.2 0.0 0.0 0.0
40 0.8 0.7 0.0 0.0 0.0
50 0.8 0.9 0.3 0.0 0.0
60 0.8 0.7 0.4 0.1 0.0
70 1.0 0.4 0.2 0.0 0.0
80 1.7 0.5 0.2 0.0 0.0
90 2.0 0.6 0.5 0.2 0.0
100 2.3 0.9 0.7 0.1 0.0
110 2.7 0.7 0.2 0.0 0.0
120 2.1 0.4 0.0 0.0 0.0
130 1.2 0.1 0.0 0.0 0.0
140 1.0 0.1 0.0 0.0 0.0
150 0.8 0.1 0.0 0.0 0.0
160 0.9 0.3 0.0 0.0 0.0
170 0.7 0.2 0.0 0.0 0.0
180 1.0 0.2 0.0 0.0 0.0
190 1.2 0.2 0.0 0.0 0.0
200 1.4 0.2 0.0 0.0 0.0
210 1.1 0.1 0.0 0.0 0.0
220 0.7 0.1 0.0 0.0 0.0
230 0.5 0.0 0.0 0.0 0.0
240 0.5 0.0 0.0 0.0 0.0
250 0.3 0.0 0.0 0.0 0.0
260 0.3 0.0 0.0 0.0 0.0
270 0.4 0.0 0.0 0.0 0.0
280 0.6 0.1 0.0 0.0 0.0
290 0.8 0.3 0.1 0.0 0.0
300 1.1 1.0 0.3 0.0 0.0
310 1.1 1.8 0.7 0.2 0.0
320 1.6 4.1 2.2 1.0 0.0
330 1.3 4.4 2.2 0.7 0.0
340 1.0 2.4 0.8 0.1 0.0
350 0.6 0.7 0.1 0.0 0.0
360 0.5 0.3 0.0 0.0 0.0
REMARKSCases when a certain phenomenon is not occurred and
frequency is 0 are shaded white

AERODOROME CLIMATOLOGY LYNI L
RHMSS – www.hidmet.gov.rs 92
Table 79. Frequencies of occurrence of wind directions within specified speed ranges – October
Speed(kt)/
Direction (º)1-5 6-10 11-15 16-25 26-40
10 0.3 0.1 0.0 0.0 0.0
20 0.3 0.0 0.0 0.0 0.0
30 0.4 0.2 0.0 0.0 0.0
40 0.6 0.6 0.0 0.0 0.0
50 0.7 1.0 0.2 0.0 0.0
60 0.7 0.7 0.3 0.0 0.0
70 1.0 0.6 0.1 0.0 0.0
80 1.6 0.4 0.4 0.1 0.0
90 2.0 0.9 0.9 0.2 0.0
100 3.1 1.2 0.7 0.2 0.0
110 3.1 1.0 0.1 0.0 0.0
120 2.5 0.6 0.0 0.0 0.0
130 1.6 0.1 0.0 0.0 0.0
140 1.1 0.1 0.0 0.0 0.0
150 1.0 0.2 0.0 0.0 0.0
160 0.8 0.4 0.0 0.0 0.0
170 0.7 0.5 0.0 0.0 0.0
180 1.1 0.4 0.0 0.0 0.0
190 1.2 0.3 0.0 0.0 0.0
200 1.4 0.2 0.0 0.0 0.0
210 1.0 0.1 0.0 0.0 0.0
220 0.7 0.1 0.0 0.0 0.0
230 0.5 0.0 0.0 0.0 0.0
240 0.5 0.0 0.0 0.0 0.0
250 0.2 0.0 0.0 0.0 0.0
260 0.4 0.0 0.0 0.0 0.0
270 0.4 0.0 0.0 0.0 0.0
280 0.4 0.1 0.1 0.0 0.0
290 0.6 0.2 0.1 0.0 0.0
300 1.0 0.6 0.2 0.0 0.0
310 1.0 1.5 0.6 0.1 0.0
320 1.3 4.2 2.5 1.0 0.0
330 1.0 4.5 2.1 0.7 0.0
340 0.9 2.3 0.4 0.0 0.0
350 0.4 0.6 0.0 0.0 0.0
360 0.5 0.2 0.0 0.0 0.0
REMARKSCases when a certain phenomenon is not occurred and
frequency is 0 are shaded white
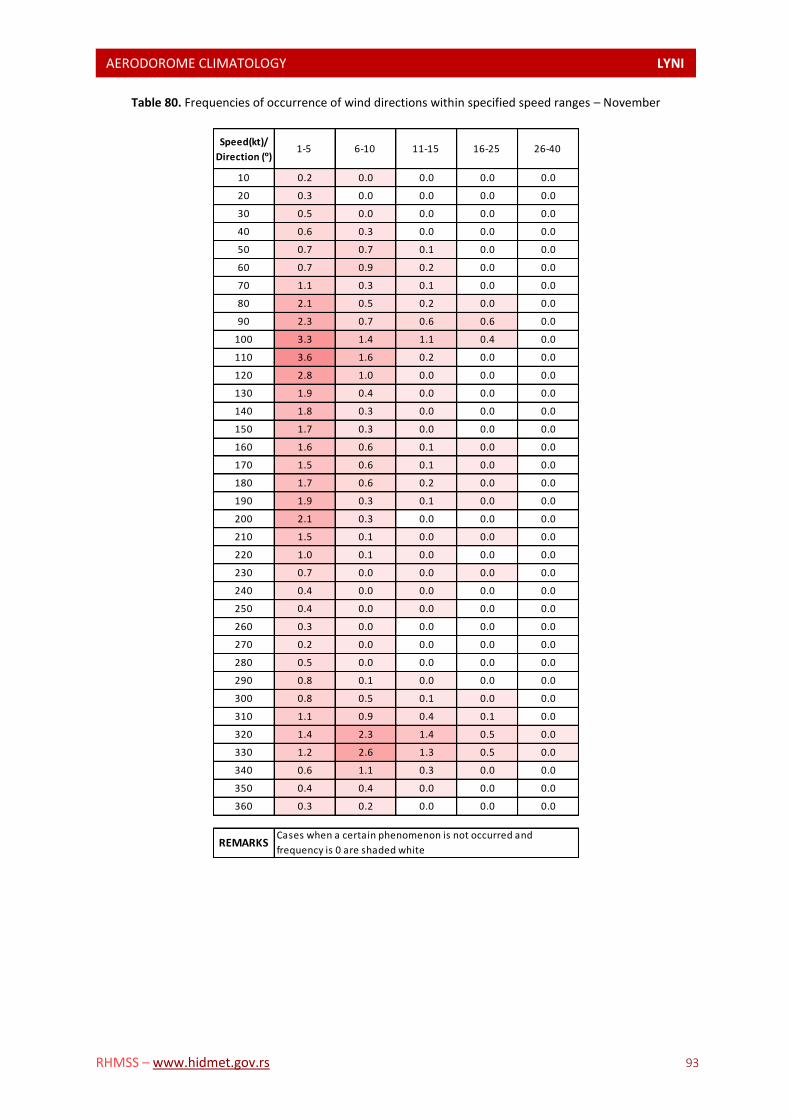
AERODOROME CLIMATOLOGY LYNI L
RHMSS – www.hidmet.gov.rs 93
Table 80. Frequencies of occurrence of wind directions within specified speed ranges – November
Speed(kt)/
Direction (º)1-5 6-10 11-15 16-25 26-40
10 0.2 0.0 0.0 0.0 0.0
20 0.3 0.0 0.0 0.0 0.0
30 0.5 0.0 0.0 0.0 0.0
40 0.6 0.3 0.0 0.0 0.0
50 0.7 0.7 0.1 0.0 0.0
60 0.7 0.9 0.2 0.0 0.0
70 1.1 0.3 0.1 0.0 0.0
80 2.1 0.5 0.2 0.0 0.0
90 2.3 0.7 0.6 0.6 0.0
100 3.3 1.4 1.1 0.4 0.0
110 3.6 1.6 0.2 0.0 0.0
120 2.8 1.0 0.0 0.0 0.0
130 1.9 0.4 0.0 0.0 0.0
140 1.8 0.3 0.0 0.0 0.0
150 1.7 0.3 0.0 0.0 0.0
160 1.6 0.6 0.1 0.0 0.0
170 1.5 0.6 0.1 0.0 0.0
180 1.7 0.6 0.2 0.0 0.0
190 1.9 0.3 0.1 0.0 0.0
200 2.1 0.3 0.0 0.0 0.0
210 1.5 0.1 0.0 0.0 0.0
220 1.0 0.1 0.0 0.0 0.0
230 0.7 0.0 0.0 0.0 0.0
240 0.4 0.0 0.0 0.0 0.0
250 0.4 0.0 0.0 0.0 0.0
260 0.3 0.0 0.0 0.0 0.0
270 0.2 0.0 0.0 0.0 0.0
280 0.5 0.0 0.0 0.0 0.0
290 0.8 0.1 0.0 0.0 0.0
300 0.8 0.5 0.1 0.0 0.0
310 1.1 0.9 0.4 0.1 0.0
320 1.4 2.3 1.4 0.5 0.0
330 1.2 2.6 1.3 0.5 0.0
340 0.6 1.1 0.3 0.0 0.0
350 0.4 0.4 0.0 0.0 0.0
360 0.3 0.2 0.0 0.0 0.0
REMARKSCases when a certain phenomenon is not occurred and
frequency is 0 are shaded white
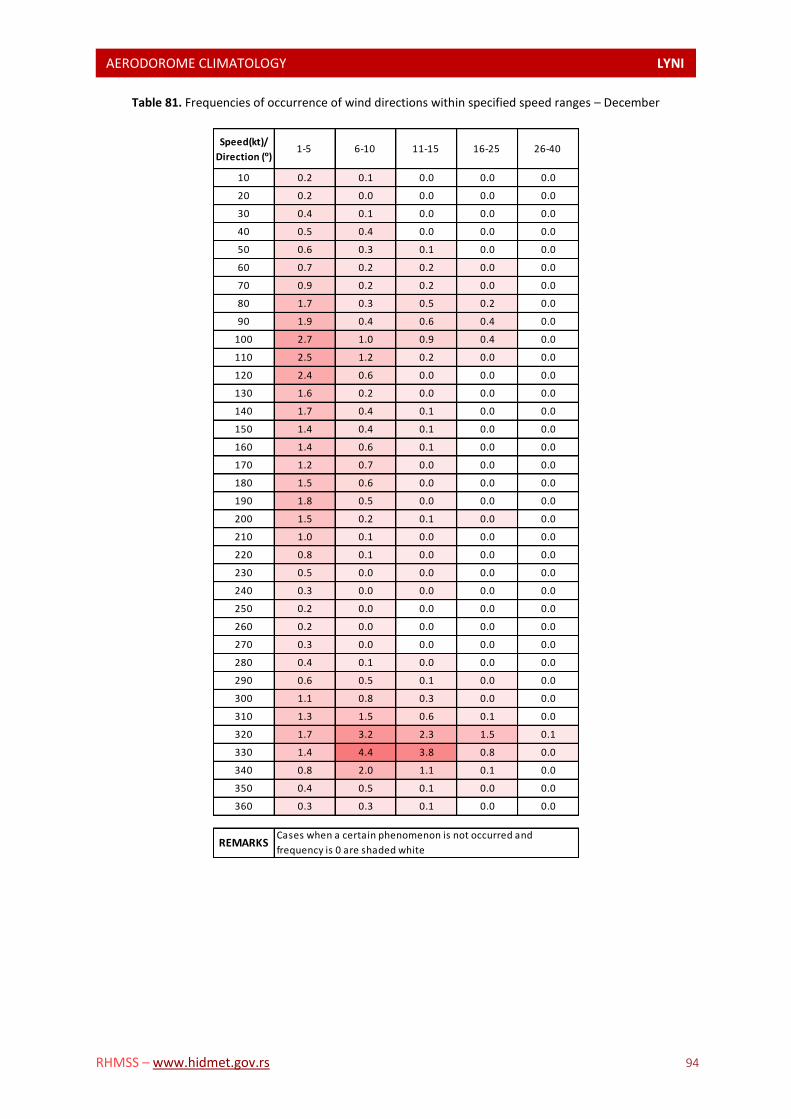
AERODOROME CLIMATOLOGY LYNI L
RHMSS – www.hidmet.gov.rs 94
Table 81. Frequencies of occurrence of wind directions within specified speed ranges – December
Speed(kt)/
Direction (º)1-5 6-10 11-15 16-25 26-40
10 0.2 0.1 0.0 0.0 0.0
20 0.2 0.0 0.0 0.0 0.0
30 0.4 0.1 0.0 0.0 0.0
40 0.5 0.4 0.0 0.0 0.0
50 0.6 0.3 0.1 0.0 0.0
60 0.7 0.2 0.2 0.0 0.0
70 0.9 0.2 0.2 0.0 0.0
80 1.7 0.3 0.5 0.2 0.0
90 1.9 0.4 0.6 0.4 0.0
100 2.7 1.0 0.9 0.4 0.0
110 2.5 1.2 0.2 0.0 0.0
120 2.4 0.6 0.0 0.0 0.0
130 1.6 0.2 0.0 0.0 0.0
140 1.7 0.4 0.1 0.0 0.0
150 1.4 0.4 0.1 0.0 0.0
160 1.4 0.6 0.1 0.0 0.0
170 1.2 0.7 0.0 0.0 0.0
180 1.5 0.6 0.0 0.0 0.0
190 1.8 0.5 0.0 0.0 0.0
200 1.5 0.2 0.1 0.0 0.0
210 1.0 0.1 0.0 0.0 0.0
220 0.8 0.1 0.0 0.0 0.0
230 0.5 0.0 0.0 0.0 0.0
240 0.3 0.0 0.0 0.0 0.0
250 0.2 0.0 0.0 0.0 0.0
260 0.2 0.0 0.0 0.0 0.0
270 0.3 0.0 0.0 0.0 0.0
280 0.4 0.1 0.0 0.0 0.0
290 0.6 0.5 0.1 0.0 0.0
300 1.1 0.8 0.3 0.0 0.0
310 1.3 1.5 0.6 0.1 0.0
320 1.7 3.2 2.3 1.5 0.1
330 1.4 4.4 3.8 0.8 0.0
340 0.8 2.0 1.1 0.1 0.0
350 0.4 0.5 0.1 0.0 0.0
360 0.3 0.3 0.1 0.0 0.0
REMARKSCases when a certain phenomenon is not occurred and
frequency is 0 are shaded white
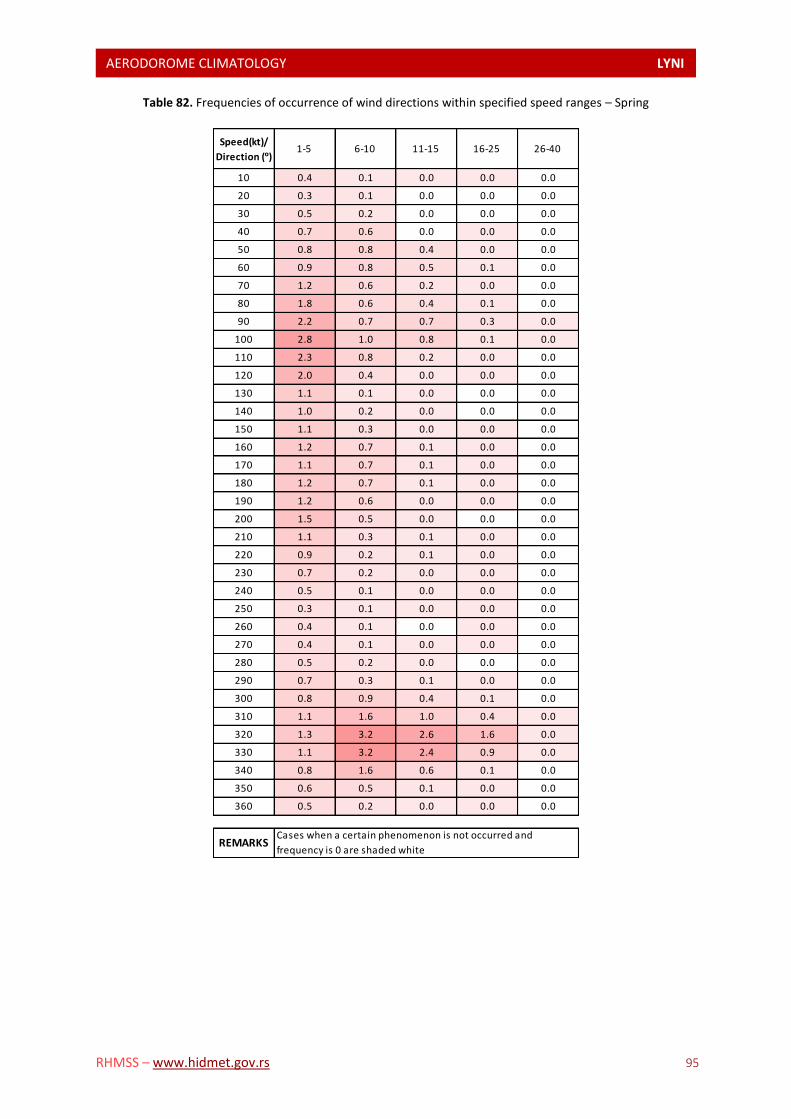
AERODOROME CLIMATOLOGY LYNI L
RHMSS – www.hidmet.gov.rs 95
Table 82. Frequencies of occurrence of wind directions within specified speed ranges – Spring
Speed(kt)/
Direction (º)1-5 6-10 11-15 16-25 26-40
10 0.4 0.1 0.0 0.0 0.0
20 0.3 0.1 0.0 0.0 0.0
30 0.5 0.2 0.0 0.0 0.0
40 0.7 0.6 0.0 0.0 0.0
50 0.8 0.8 0.4 0.0 0.0
60 0.9 0.8 0.5 0.1 0.0
70 1.2 0.6 0.2 0.0 0.0
80 1.8 0.6 0.4 0.1 0.0
90 2.2 0.7 0.7 0.3 0.0
100 2.8 1.0 0.8 0.1 0.0
110 2.3 0.8 0.2 0.0 0.0
120 2.0 0.4 0.0 0.0 0.0
130 1.1 0.1 0.0 0.0 0.0
140 1.0 0.2 0.0 0.0 0.0
150 1.1 0.3 0.0 0.0 0.0
160 1.2 0.7 0.1 0.0 0.0
170 1.1 0.7 0.1 0.0 0.0
180 1.2 0.7 0.1 0.0 0.0
190 1.2 0.6 0.0 0.0 0.0
200 1.5 0.5 0.0 0.0 0.0
210 1.1 0.3 0.1 0.0 0.0
220 0.9 0.2 0.1 0.0 0.0
230 0.7 0.2 0.0 0.0 0.0
240 0.5 0.1 0.0 0.0 0.0
250 0.3 0.1 0.0 0.0 0.0
260 0.4 0.1 0.0 0.0 0.0
270 0.4 0.1 0.0 0.0 0.0
280 0.5 0.2 0.0 0.0 0.0
290 0.7 0.3 0.1 0.0 0.0
300 0.8 0.9 0.4 0.1 0.0
310 1.1 1.6 1.0 0.4 0.0
320 1.3 3.2 2.6 1.6 0.0
330 1.1 3.2 2.4 0.9 0.0
340 0.8 1.6 0.6 0.1 0.0
350 0.6 0.5 0.1 0.0 0.0
360 0.5 0.2 0.0 0.0 0.0
REMARKSCases when a certain phenomenon is not occurred and
frequency is 0 are shaded white

AERODOROME CLIMATOLOGY LYNI L
RHMSS – www.hidmet.gov.rs 96
Table 83. Frequencies of occurrence of wind directions within specified speed ranges – Summer
Speed(kt)/
Direction (º)1-5 6-10 11-15 16-25 26-40
10 0.5 0.1 0.0 0.0 0.0
20 0.4 0.0 0.0 0.0 0.0
30 0.4 0.1 0.0 0.0 0.0
40 0.7 0.3 0.0 0.0 0.0
50 0.7 0.5 0.1 0.0 0.0
60 0.9 0.6 0.2 0.0 0.0
70 1.0 0.3 0.0 0.0 0.0
80 1.6 0.4 0.1 0.0 0.0
90 2.0 0.5 0.2 0.0 0.0
100 2.7 0.7 0.3 0.0 0.0
110 2.3 0.6 0.1 0.0 0.0
120 1.8 0.3 0.0 0.0 0.0
130 1.1 0.1 0.0 0.0 0.0
140 0.9 0.1 0.0 0.0 0.0
150 0.9 0.1 0.0 0.0 0.0
160 0.9 0.2 0.0 0.0 0.0
170 0.9 0.2 0.0 0.0 0.0
180 1.0 0.2 0.0 0.0 0.0
190 1.2 0.1 0.0 0.0 0.0
200 1.4 0.1 0.0 0.0 0.0
210 1.0 0.1 0.0 0.0 0.0
220 0.7 0.1 0.0 0.0 0.0
230 0.5 0.1 0.0 0.0 0.0
240 0.4 0.0 0.0 0.0 0.0
250 0.3 0.1 0.0 0.0 0.0
260 0.3 0.0 0.0 0.0 0.0
270 0.4 0.0 0.0 0.0 0.0
280 0.5 0.1 0.0 0.0 0.0
290 0.7 0.3 0.0 0.0 0.0
300 1.0 0.9 0.2 0.0 0.0
310 1.1 2.3 1.3 0.3 0.0
320 1.4 4.5 3.5 1.6 0.0
330 1.3 3.8 2.4 0.8 0.0
340 1.0 2.0 0.6 0.1 0.0
350 0.7 0.7 0.1 0.0 0.0
360 0.6 0.3 0.0 0.0 0.0
REMARKSCases when a certain phenomenon is not occurred and
frequency is 0 are shaded white

AERODOROME CLIMATOLOGY LYNI L
RHMSS – www.hidmet.gov.rs 97
Table 84. Frequencies of occurrence of wind directions within specified speed ranges – Autmn
Speed(kt)/
Direction (º)1-5 6-10 11-15 16-25 26-40
10 0.3 0.1 0.0 0.0 0.0
20 0.3 0.0 0.0 0.0 0.0
30 0.5 0.1 0.0 0.0 0.0
40 0.7 0.5 0.0 0.0 0.0
50 0.7 0.9 0.2 0.0 0.0
60 0.7 0.7 0.3 0.0 0.0
70 1.0 0.4 0.1 0.0 0.0
80 1.8 0.5 0.3 0.0 0.0
90 2.1 0.7 0.7 0.3 0.0
100 2.9 1.2 0.8 0.2 0.0
110 3.1 1.1 0.2 0.0 0.0
120 2.5 0.7 0.0 0.0 0.0
130 1.6 0.2 0.0 0.0 0.0
140 1.3 0.2 0.0 0.0 0.0
150 1.2 0.2 0.0 0.0 0.0
160 1.1 0.4 0.0 0.0 0.0
170 1.0 0.4 0.1 0.0 0.0
180 1.3 0.4 0.1 0.0 0.0
190 1.4 0.3 0.0 0.0 0.0
200 1.6 0.2 0.0 0.0 0.0
210 1.2 0.1 0.0 0.0 0.0
220 0.8 0.1 0.0 0.0 0.0
230 0.6 0.0 0.0 0.0 0.0
240 0.5 0.0 0.0 0.0 0.0
250 0.3 0.0 0.0 0.0 0.0
260 0.3 0.0 0.0 0.0 0.0
270 0.3 0.0 0.0 0.0 0.0
280 0.5 0.1 0.0 0.0 0.0
290 0.7 0.2 0.1 0.0 0.0
300 1.0 0.7 0.2 0.0 0.0
310 1.1 1.4 0.6 0.1 0.0
320 1.4 3.5 2.0 0.8 0.0
330 1.2 3.8 1.8 0.6 0.0
340 0.8 1.9 0.5 0.1 0.0
350 0.5 0.6 0.0 0.0 0.0
360 0.4 0.2 0.0 0.0 0.0
REMARKSCases when a certain phenomenon is not occurred and
frequency is 0 are shaded white

AERODOROME CLIMATOLOGY LYNI L
RHMSS – www.hidmet.gov.rs 98
Table 85. Frequencies of occurrence of wind directions within specified speed ranges – Winter
Speed(kt)/
Direction (º)1-5 6-10 11-15 16-25 26-40
10 0.3 0.1 0.0 0.0 0.0
20 0.2 0.0 0.0 0.0 0.0
30 0.4 0.1 0.0 0.0 0.0
40 0.6 0.4 0.0 0.0 0.0
50 0.7 0.5 0.2 0.0 0.0
60 0.7 0.3 0.3 0.0 0.0
70 0.9 0.2 0.2 0.1 0.0
80 1.5 0.2 0.4 0.3 0.0
90 1.9 0.4 0.7 0.6 0.0
100 2.6 1.1 0.9 0.3 0.0
110 2.4 1.1 0.2 0.0 0.0
120 2.1 0.6 0.0 0.0 0.0
130 1.5 0.2 0.0 0.0 0.0
140 1.3 0.2 0.0 0.0 0.0
150 1.1 0.3 0.0 0.0 0.0
160 1.2 0.5 0.1 0.0 0.0
170 1.2 0.6 0.0 0.0 0.0
180 1.3 0.5 0.0 0.0 0.0
190 1.5 0.4 0.0 0.0 0.0
200 1.5 0.3 0.0 0.0 0.0
210 1.0 0.1 0.0 0.0 0.0
220 0.8 0.1 0.0 0.0 0.0
230 0.6 0.0 0.0 0.0 0.0
240 0.4 0.0 0.0 0.0 0.0
250 0.2 0.0 0.0 0.0 0.0
260 0.2 0.0 0.0 0.0 0.0
270 0.3 0.0 0.0 0.0 0.0
280 0.5 0.1 0.0 0.0 0.0
290 0.7 0.4 0.1 0.0 0.0
300 1.2 0.7 0.3 0.0 0.0
310 1.3 1.6 0.7 0.2 0.0
320 1.6 3.8 2.6 1.4 0.2
330 1.3 4.6 3.3 0.9 0.0
340 0.8 2.2 1.0 0.1 0.0
350 0.5 0.6 0.1 0.0 0.0
360 0.4 0.3 0.1 0.0 0.0
REMARKSCases when a certain phenomenon is not occurred and
frequency is 0 are shaded white
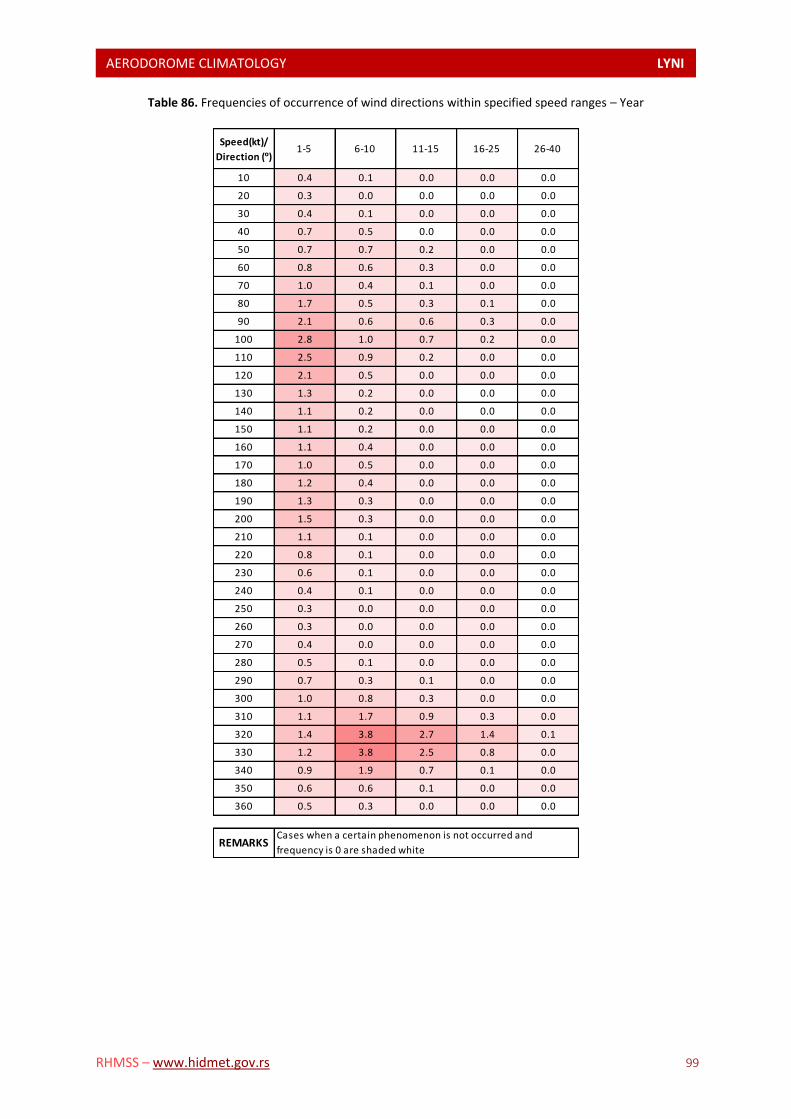
AERODOROME CLIMATOLOGY LYNI L
RHMSS – www.hidmet.gov.rs 99
Table 86. Frequencies of occurrence of wind directions within specified speed ranges – Year
Speed(kt)/
Direction (º)1-5 6-10 11-15 16-25 26-40
10 0.4 0.1 0.0 0.0 0.0
20 0.3 0.0 0.0 0.0 0.0
30 0.4 0.1 0.0 0.0 0.0
40 0.7 0.5 0.0 0.0 0.0
50 0.7 0.7 0.2 0.0 0.0
60 0.8 0.6 0.3 0.0 0.0
70 1.0 0.4 0.1 0.0 0.0
80 1.7 0.5 0.3 0.1 0.0
90 2.1 0.6 0.6 0.3 0.0
100 2.8 1.0 0.7 0.2 0.0
110 2.5 0.9 0.2 0.0 0.0
120 2.1 0.5 0.0 0.0 0.0
130 1.3 0.2 0.0 0.0 0.0
140 1.1 0.2 0.0 0.0 0.0
150 1.1 0.2 0.0 0.0 0.0
160 1.1 0.4 0.0 0.0 0.0
170 1.0 0.5 0.0 0.0 0.0
180 1.2 0.4 0.0 0.0 0.0
190 1.3 0.3 0.0 0.0 0.0
200 1.5 0.3 0.0 0.0 0.0
210 1.1 0.1 0.0 0.0 0.0
220 0.8 0.1 0.0 0.0 0.0
230 0.6 0.1 0.0 0.0 0.0
240 0.4 0.1 0.0 0.0 0.0
250 0.3 0.0 0.0 0.0 0.0
260 0.3 0.0 0.0 0.0 0.0
270 0.4 0.0 0.0 0.0 0.0
280 0.5 0.1 0.0 0.0 0.0
290 0.7 0.3 0.1 0.0 0.0
300 1.0 0.8 0.3 0.0 0.0
310 1.1 1.7 0.9 0.3 0.0
320 1.4 3.8 2.7 1.4 0.1
330 1.2 3.8 2.5 0.8 0.0
340 0.9 1.9 0.7 0.1 0.0
350 0.6 0.6 0.1 0.0 0.0
360 0.5 0.3 0.0 0.0 0.0
REMARKSCases when a certain phenomenon is not occurred and
frequency is 0 are shaded white
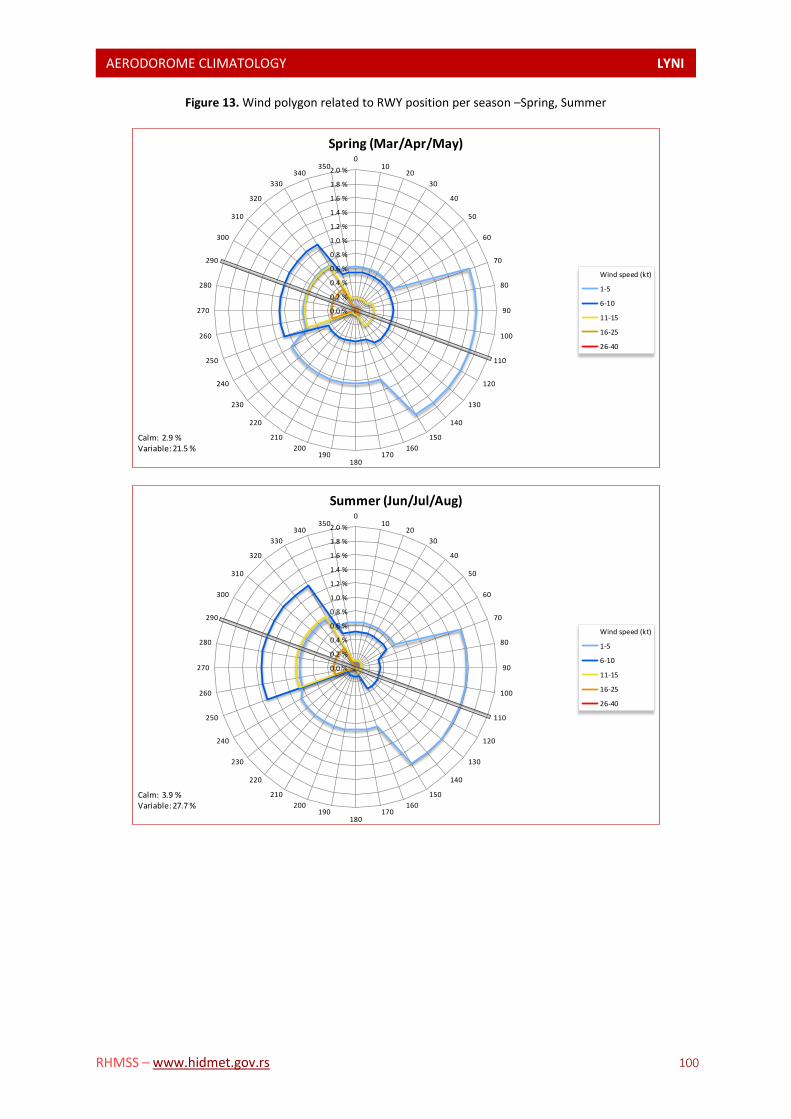
AERODOROME CLIMATOLOGY LYNI L
RHMSS – www.hidmet.gov.rs 100
Figure 13. Wind polygon related to RWY position per season –Spring, Summer
0.0 %
0.2 %
0.4 %
0.6 %
0.8 %
1.0 %
1.2 %
1.4 %
1.6 %
1.8 %
2.0 %
010
20
30
40
50
60
70
80
90
100
110
120
130
140
150
160170
180190
200
210
220
230
240
250
260
270
280
290
300
310
320
330
340350
Spring (Mar/Apr/May)
Wind speed (kt)
1-5
6-10
11-15
16-25
26-40
Calm: 2.9 %Variable: 21.5 %
0.0 %
0.2 %
0.4 %
0.6 %
0.8 %
1.0 %
1.2 %
1.4 %
1.6 %
1.8 %
2.0 %
010
20
30
40
50
60
70
80
90
100
110
120
130
140
150
160170
180190
200
210
220
230
240
250
260
270
280
290
300
310
320
330
340350
Summer (Jun/Jul/Aug)
Wind speed (kt)
1-5
6-10
11-15
16-25
26-40
Calm: 3.9 %Variable: 27.7 %

AERODOROME CLIMATOLOGY LYNI L
RHMSS – www.hidmet.gov.rs 101
Figure 14. Wind polygon related to RWY position per season –Autumn, Winter
0.0 %
0.2 %
0.4 %
0.6 %
0.8 %
1.0 %
1.2 %
1.4 %
1.6 %
1.8 %
2.0 %
010
20
30
40
50
60
70
80
90
100
110
120
130
140
150
160170
180190
200
210
220
230
240
250
260
270
280
290
300
310
320
330
340350
Autmn (Sep/Okt/Nov)
Wind speed (kt)
1-5
6-10
11-15
16-25
26-40
Calm: 3.6 %Variable: 25.2 %
0.0 %
0.2 %
0.4 %
0.6 %
0.8 %
1.0 %
1.2 %
1.4 %
1.6 %
1.8 %
2.0 %
010
20
30
40
50
60
70
80
90
100
110
120
130
140
150
160170
180190
200
210
220
230
240
250
260
270
280
290
300
310
340
330
340350
Winter (Dec/Јan/Feb)
Wind speed (kt)
1-5
6-10
11-15
16-25
26-40
Calm: 3.9 %Variable: 21.1 %
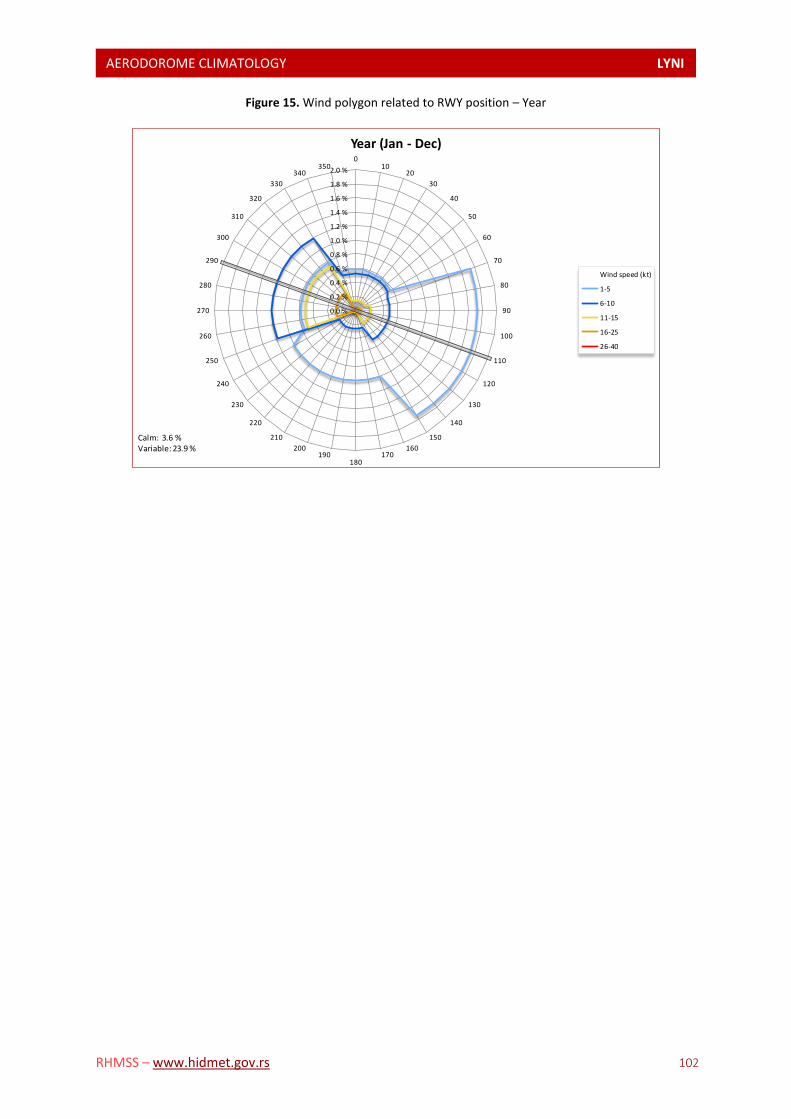
AERODOROME CLIMATOLOGY LYNI L
RHMSS – www.hidmet.gov.rs 102
Figure 15. Wind polygon related to RWY position – Year
0.0 %
0.2 %
0.4 %
0.6 %
0.8 %
1.0 %
1.2 %
1.4 %
1.6 %
1.8 %
2.0 %
010
20
30
40
50
60
70
80
90
100
110
120
130
140
150
160170
180190
200
210
220
230
240
250
260
270
280
290
300
310
320
330
340350
Year (Jan - Dec)
Wind speed (kt)
1-5
6-10
11-15
16-25
26-40
Calm: 3.6 %Variable: 23.9 %
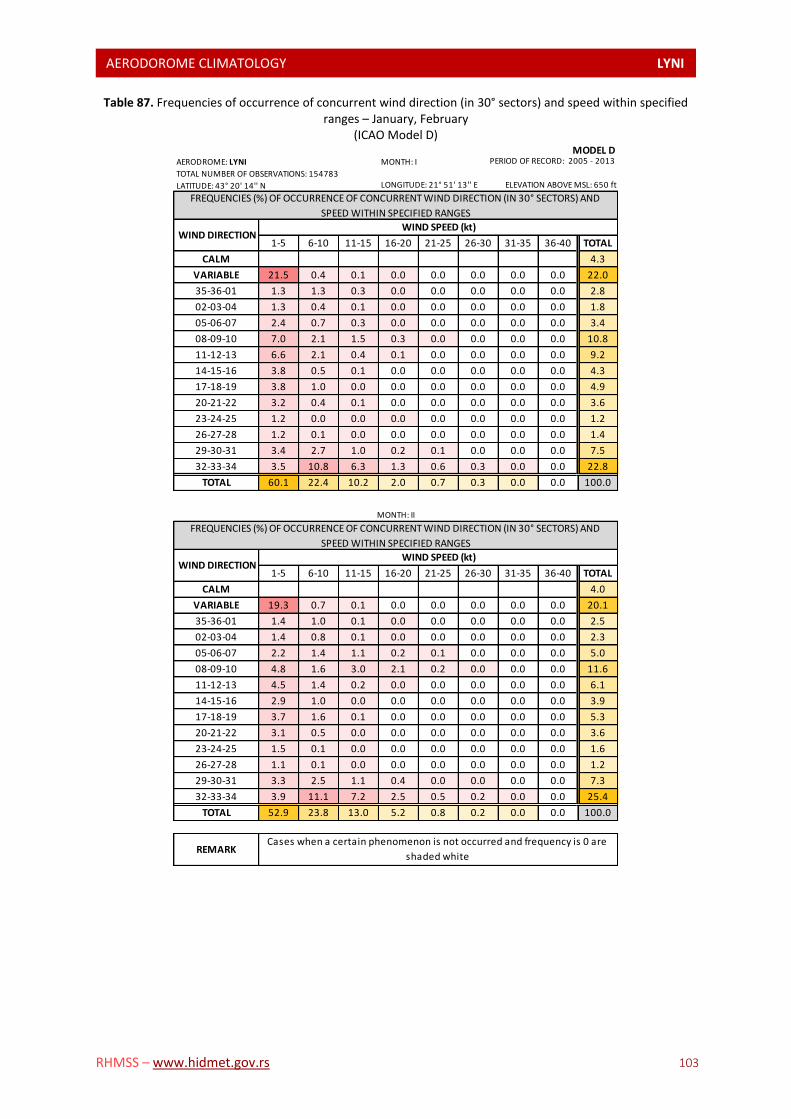
AERODOROME CLIMATOLOGY LYNI L
RHMSS – www.hidmet.gov.rs 103
Table 87. Frequencies of occurrence of concurrent wind direction (in 30° sectors) and speed within specified ranges – January, February
(ICAO Model D) MODEL D
AERODROME: LYNI MONTH: I
TOTAL NUMBER OF OBSERVATIONS: 154783
LATITUDE: 43° 20' 14'' N
1-5 6-10 11-15 16-20 21-25 26-30 31-35 36-40 TOTAL
CALM 4.3
VARIABLE 21.5 0.4 0.1 0.0 0.0 0.0 0.0 0.0 22.0
35-36-01 1.3 1.3 0.3 0.0 0.0 0.0 0.0 0.0 2.8
02-03-04 1.3 0.4 0.1 0.0 0.0 0.0 0.0 0.0 1.8
05-06-07 2.4 0.7 0.3 0.0 0.0 0.0 0.0 0.0 3.4
08-09-10 7.0 2.1 1.5 0.3 0.0 0.0 0.0 0.0 10.8
11-12-13 6.6 2.1 0.4 0.1 0.0 0.0 0.0 0.0 9.2
14-15-16 3.8 0.5 0.1 0.0 0.0 0.0 0.0 0.0 4.3
17-18-19 3.8 1.0 0.0 0.0 0.0 0.0 0.0 0.0 4.9
20-21-22 3.2 0.4 0.1 0.0 0.0 0.0 0.0 0.0 3.6
23-24-25 1.2 0.0 0.0 0.0 0.0 0.0 0.0 0.0 1.2
26-27-28 1.2 0.1 0.0 0.0 0.0 0.0 0.0 0.0 1.4
29-30-31 3.4 2.7 1.0 0.2 0.1 0.0 0.0 0.0 7.5
32-33-34 3.5 10.8 6.3 1.3 0.6 0.3 0.0 0.0 22.8
TOTAL 60.1 22.4 10.2 2.0 0.7 0.3 0.0 0.0 100.0
1-5 6-10 11-15 16-20 21-25 26-30 31-35 36-40 TOTAL
CALM 4.0
VARIABLE 19.3 0.7 0.1 0.0 0.0 0.0 0.0 0.0 20.1
35-36-01 1.4 1.0 0.1 0.0 0.0 0.0 0.0 0.0 2.5
02-03-04 1.4 0.8 0.1 0.0 0.0 0.0 0.0 0.0 2.3
05-06-07 2.2 1.4 1.1 0.2 0.1 0.0 0.0 0.0 5.0
08-09-10 4.8 1.6 3.0 2.1 0.2 0.0 0.0 0.0 11.6
11-12-13 4.5 1.4 0.2 0.0 0.0 0.0 0.0 0.0 6.1
14-15-16 2.9 1.0 0.0 0.0 0.0 0.0 0.0 0.0 3.9
17-18-19 3.7 1.6 0.1 0.0 0.0 0.0 0.0 0.0 5.3
20-21-22 3.1 0.5 0.0 0.0 0.0 0.0 0.0 0.0 3.6
23-24-25 1.5 0.1 0.0 0.0 0.0 0.0 0.0 0.0 1.6
26-27-28 1.1 0.1 0.0 0.0 0.0 0.0 0.0 0.0 1.2
29-30-31 3.3 2.5 1.1 0.4 0.0 0.0 0.0 0.0 7.3
32-33-34 3.9 11.1 7.2 2.5 0.5 0.2 0.0 0.0 25.4
TOTAL 52.9 23.8 13.0 5.2 0.8 0.2 0.0 0.0 100.0
PERIOD OF RECORD: 2005 - 2013
WIND DIRECTIONWIND SPEED (kt)
FREQUENCIES (%) OF OCCURRENCE OF CONCURRENT WIND DIRECTION (IN 30° SECTORS) AND
SPEED WITHIN SPECIFIED RANGES
LONGITUDE: 21° 51' 13'' E ELEVATION ABOVE MSL: 650 ft
MONTH: II
FREQUENCIES (%) OF OCCURRENCE OF CONCURRENT WIND DIRECTION (IN 30° SECTORS) AND
SPEED WITHIN SPECIFIED RANGES
WIND DIRECTIONWIND SPEED (kt)
REMARKCases when a certain phenomenon is not occurred and frequency is 0 are
shaded white
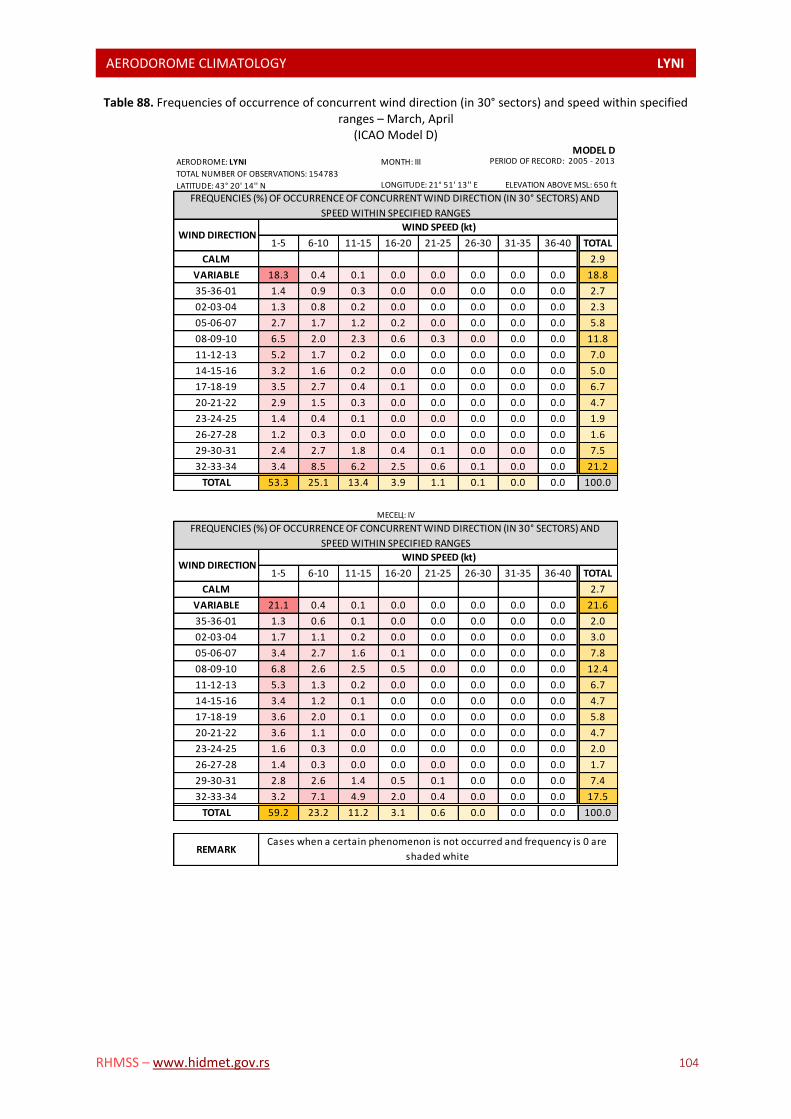
AERODOROME CLIMATOLOGY LYNI L
RHMSS – www.hidmet.gov.rs 104
Table 88. Frequencies of occurrence of concurrent wind direction (in 30° sectors) and speed within specified ranges – March, April
(ICAO Model D) MODEL D
AERODROME: LYNI MONTH: III
TOTAL NUMBER OF OBSERVATIONS: 154783
LATITUDE: 43° 20' 14'' N
1-5 6-10 11-15 16-20 21-25 26-30 31-35 36-40 TOTAL
CALM 2.9
VARIABLE 18.3 0.4 0.1 0.0 0.0 0.0 0.0 0.0 18.8
35-36-01 1.4 0.9 0.3 0.0 0.0 0.0 0.0 0.0 2.7
02-03-04 1.3 0.8 0.2 0.0 0.0 0.0 0.0 0.0 2.3
05-06-07 2.7 1.7 1.2 0.2 0.0 0.0 0.0 0.0 5.8
08-09-10 6.5 2.0 2.3 0.6 0.3 0.0 0.0 0.0 11.8
11-12-13 5.2 1.7 0.2 0.0 0.0 0.0 0.0 0.0 7.0
14-15-16 3.2 1.6 0.2 0.0 0.0 0.0 0.0 0.0 5.0
17-18-19 3.5 2.7 0.4 0.1 0.0 0.0 0.0 0.0 6.7
20-21-22 2.9 1.5 0.3 0.0 0.0 0.0 0.0 0.0 4.7
23-24-25 1.4 0.4 0.1 0.0 0.0 0.0 0.0 0.0 1.9
26-27-28 1.2 0.3 0.0 0.0 0.0 0.0 0.0 0.0 1.6
29-30-31 2.4 2.7 1.8 0.4 0.1 0.0 0.0 0.0 7.5
32-33-34 3.4 8.5 6.2 2.5 0.6 0.1 0.0 0.0 21.2
TOTAL 53.3 25.1 13.4 3.9 1.1 0.1 0.0 0.0 100.0
1-5 6-10 11-15 16-20 21-25 26-30 31-35 36-40 TOTAL
CALM 2.7
VARIABLE 21.1 0.4 0.1 0.0 0.0 0.0 0.0 0.0 21.6
35-36-01 1.3 0.6 0.1 0.0 0.0 0.0 0.0 0.0 2.0
02-03-04 1.7 1.1 0.2 0.0 0.0 0.0 0.0 0.0 3.0
05-06-07 3.4 2.7 1.6 0.1 0.0 0.0 0.0 0.0 7.8
08-09-10 6.8 2.6 2.5 0.5 0.0 0.0 0.0 0.0 12.4
11-12-13 5.3 1.3 0.2 0.0 0.0 0.0 0.0 0.0 6.7
14-15-16 3.4 1.2 0.1 0.0 0.0 0.0 0.0 0.0 4.7
17-18-19 3.6 2.0 0.1 0.0 0.0 0.0 0.0 0.0 5.8
20-21-22 3.6 1.1 0.0 0.0 0.0 0.0 0.0 0.0 4.7
23-24-25 1.6 0.3 0.0 0.0 0.0 0.0 0.0 0.0 2.0
26-27-28 1.4 0.3 0.0 0.0 0.0 0.0 0.0 0.0 1.7
29-30-31 2.8 2.6 1.4 0.5 0.1 0.0 0.0 0.0 7.4
32-33-34 3.2 7.1 4.9 2.0 0.4 0.0 0.0 0.0 17.5
TOTAL 59.2 23.2 11.2 3.1 0.6 0.0 0.0 0.0 100.0
PERIOD OF RECORD: 2005 - 2013
WIND DIRECTIONWIND SPEED (kt)
FREQUENCIES (%) OF OCCURRENCE OF CONCURRENT WIND DIRECTION (IN 30° SECTORS) AND
SPEED WITHIN SPECIFIED RANGES
LONGITUDE: 21° 51' 13'' E ELEVATION ABOVE MSL: 650 ft
МЕСЕЦ: IV
FREQUENCIES (%) OF OCCURRENCE OF CONCURRENT WIND DIRECTION (IN 30° SECTORS) AND
SPEED WITHIN SPECIFIED RANGES
WIND DIRECTIONWIND SPEED (kt)
REMARKCases when a certain phenomenon is not occurred and frequency is 0 are
shaded white

AERODOROME CLIMATOLOGY LYNI L
RHMSS – www.hidmet.gov.rs 105
Table 89. Frequencies of occurrence of concurrent wind direction (in 30° sectors) and speed within specified ranges – May, June
(ICAO Model D) MODEL D
AERODROME: LYNI MONTH: V
TOTAL NUMBER OF OBSERVATIONS: 154783
LATITUDE: 43° 20' 14'' N
1-5 6-10 11-15 16-20 21-25 26-30 31-35 36-40 TOTAL
CALM 3.2
VARIABLE 23.4 0.5 0.1 0.0 0.0 0.0 0.0 0.0 24.0
35-36-01 1.7 0.9 0.1 0.0 0.0 0.0 0.0 0.0 2.6
02-03-04 1.5 0.7 0.0 0.0 0.0 0.0 0.0 0.0 2.2
05-06-07 2.8 2.0 0.3 0.0 0.0 0.0 0.0 0.0 5.2
08-09-10 7.0 2.5 1.0 0.2 0.0 0.0 0.0 0.0 10.6
11-12-13 5.7 1.3 0.3 0.0 0.0 0.0 0.0 0.0 7.3
14-15-16 3.0 0.8 0.0 0.0 0.0 0.0 0.0 0.0 3.8
17-18-19 3.6 1.3 0.1 0.0 0.0 0.0 0.0 0.0 4.9
20-21-22 4.0 0.7 0.1 0.0 0.0 0.0 0.0 0.0 4.7
23-24-25 1.5 0.3 0.1 0.0 0.0 0.0 0.0 0.0 2.0
26-27-28 1.5 0.5 0.1 0.0 0.0 0.0 0.0 0.0 2.1
29-30-31 2.7 3.3 1.3 0.3 0.1 0.0 0.0 0.0 7.5
32-33-34 3.2 8.5 5.7 2.0 0.4 0.1 0.0 0.0 19.8
TOTAL 61.6 23.1 9.0 2.5 0.5 0.1 0.0 0.0 100.0
1-5 6-10 11-15 16-20 21-25 26-30 31-35 36-40 TOTAL
CALM 3.5
VARIABLE 26.9 0.5 0.1 0.0 0.0 0.0 0.0 0.0 27.6
35-36-01 1.8 0.8 0.1 0.0 0.0 0.0 0.0 0.0 2.7
02-03-04 1.5 0.4 0.0 0.0 0.0 0.0 0.0 0.0 1.9
05-06-07 2.6 1.1 0.3 0.0 0.0 0.0 0.0 0.0 3.9
08-09-10 6.6 1.8 0.6 0.0 0.0 0.0 0.0 0.0 9.0
11-12-13 5.5 1.3 0.1 0.0 0.0 0.0 0.0 0.0 7.0
14-15-16 2.9 0.6 0.0 0.0 0.0 0.0 0.0 0.0 3.5
17-18-19 3.1 0.8 0.0 0.0 0.0 0.0 0.0 0.0 4.0
20-21-22 3.3 0.4 0.1 0.0 0.0 0.0 0.0 0.0 3.8
23-24-25 1.4 0.3 0.0 0.0 0.0 0.0 0.0 0.0 1.7
26-27-28 1.5 0.2 0.1 0.0 0.0 0.0 0.0 0.0 1.7
29-30-31 2.8 3.8 1.6 0.4 0.0 0.0 0.0 0.0 8.7
32-33-34 3.8 9.9 5.9 1.2 0.2 0.0 0.0 0.0 21.0
TOTAL 63.6 22.0 8.9 1.7 0.2 0.0 0.0 0.0 100.0
PERIOD OF RECORD: 2005 - 2013
WIND DIRECTIONWIND SPEED (kt)
FREQUENCIES (%) OF OCCURRENCE OF CONCURRENT WIND DIRECTION (IN 30° SECTORS) AND
SPEED WITHIN SPECIFIED RANGES
LONGITUDE: 21° 51' 13'' E ELEVATION ABOVE MSL: 650 ft
МЕСЕЦ: VI
FREQUENCIES (%) OF OCCURRENCE OF CONCURRENT WIND DIRECTION (IN 30° SECTORS) AND
SPEED WITHIN SPECIFIED RANGES
WIND DIRECTIONWIND SPEED (kt)
REMARKCases when a certain phenomenon is not occurred and frequency is 0 are
shaded white
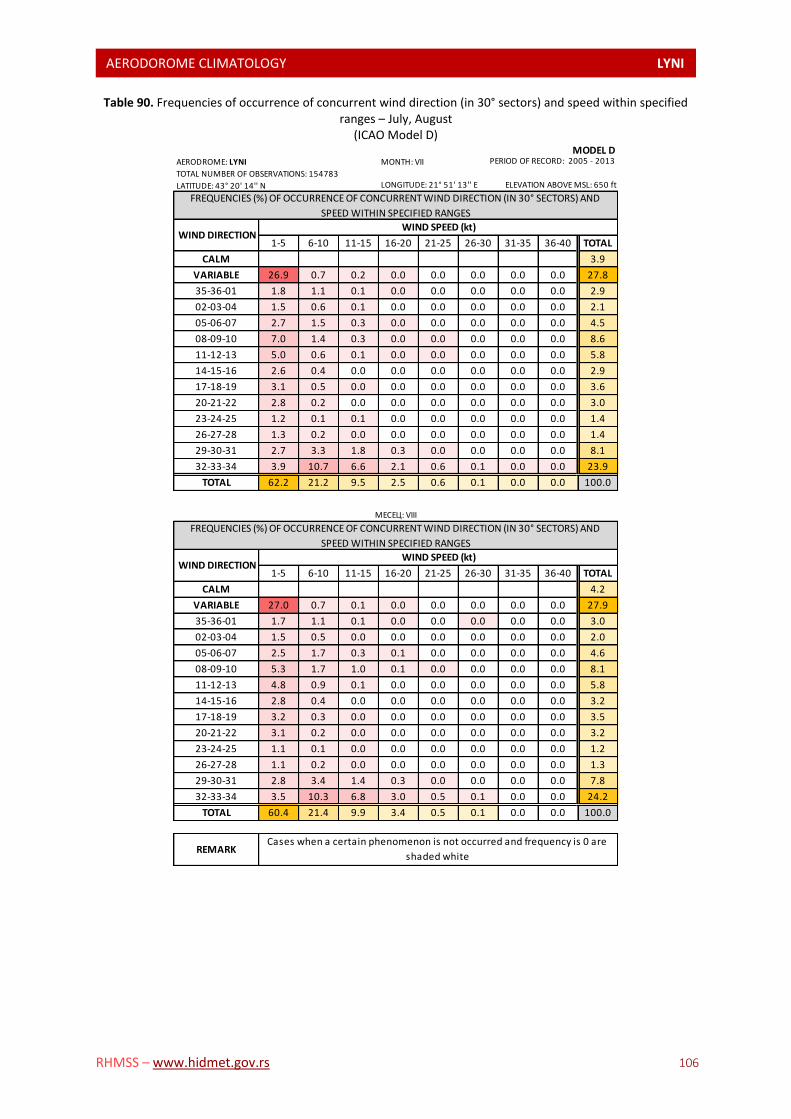
AERODOROME CLIMATOLOGY LYNI L
RHMSS – www.hidmet.gov.rs 106
Table 90. Frequencies of occurrence of concurrent wind direction (in 30° sectors) and speed within specified ranges – July, August
(ICAO Model D) MODEL D
AERODROME: LYNI MONTH: VII
TOTAL NUMBER OF OBSERVATIONS: 154783
LATITUDE: 43° 20' 14'' N
1-5 6-10 11-15 16-20 21-25 26-30 31-35 36-40 TOTAL
CALM 3.9
VARIABLE 26.9 0.7 0.2 0.0 0.0 0.0 0.0 0.0 27.8
35-36-01 1.8 1.1 0.1 0.0 0.0 0.0 0.0 0.0 2.9
02-03-04 1.5 0.6 0.1 0.0 0.0 0.0 0.0 0.0 2.1
05-06-07 2.7 1.5 0.3 0.0 0.0 0.0 0.0 0.0 4.5
08-09-10 7.0 1.4 0.3 0.0 0.0 0.0 0.0 0.0 8.6
11-12-13 5.0 0.6 0.1 0.0 0.0 0.0 0.0 0.0 5.8
14-15-16 2.6 0.4 0.0 0.0 0.0 0.0 0.0 0.0 2.9
17-18-19 3.1 0.5 0.0 0.0 0.0 0.0 0.0 0.0 3.6
20-21-22 2.8 0.2 0.0 0.0 0.0 0.0 0.0 0.0 3.0
23-24-25 1.2 0.1 0.1 0.0 0.0 0.0 0.0 0.0 1.4
26-27-28 1.3 0.2 0.0 0.0 0.0 0.0 0.0 0.0 1.4
29-30-31 2.7 3.3 1.8 0.3 0.0 0.0 0.0 0.0 8.1
32-33-34 3.9 10.7 6.6 2.1 0.6 0.1 0.0 0.0 23.9
TOTAL 62.2 21.2 9.5 2.5 0.6 0.1 0.0 0.0 100.0
1-5 6-10 11-15 16-20 21-25 26-30 31-35 36-40 TOTAL
CALM 4.2
VARIABLE 27.0 0.7 0.1 0.0 0.0 0.0 0.0 0.0 27.9
35-36-01 1.7 1.1 0.1 0.0 0.0 0.0 0.0 0.0 3.0
02-03-04 1.5 0.5 0.0 0.0 0.0 0.0 0.0 0.0 2.0
05-06-07 2.5 1.7 0.3 0.1 0.0 0.0 0.0 0.0 4.6
08-09-10 5.3 1.7 1.0 0.1 0.0 0.0 0.0 0.0 8.1
11-12-13 4.8 0.9 0.1 0.0 0.0 0.0 0.0 0.0 5.8
14-15-16 2.8 0.4 0.0 0.0 0.0 0.0 0.0 0.0 3.2
17-18-19 3.2 0.3 0.0 0.0 0.0 0.0 0.0 0.0 3.5
20-21-22 3.1 0.2 0.0 0.0 0.0 0.0 0.0 0.0 3.2
23-24-25 1.1 0.1 0.0 0.0 0.0 0.0 0.0 0.0 1.2
26-27-28 1.1 0.2 0.0 0.0 0.0 0.0 0.0 0.0 1.3
29-30-31 2.8 3.4 1.4 0.3 0.0 0.0 0.0 0.0 7.8
32-33-34 3.5 10.3 6.8 3.0 0.5 0.1 0.0 0.0 24.2
TOTAL 60.4 21.4 9.9 3.4 0.5 0.1 0.0 0.0 100.0
PERIOD OF RECORD: 2005 - 2013
WIND DIRECTIONWIND SPEED (kt)
FREQUENCIES (%) OF OCCURRENCE OF CONCURRENT WIND DIRECTION (IN 30° SECTORS) AND
SPEED WITHIN SPECIFIED RANGES
LONGITUDE: 21° 51' 13'' E ELEVATION ABOVE MSL: 650 ft
МЕСЕЦ: VIII
FREQUENCIES (%) OF OCCURRENCE OF CONCURRENT WIND DIRECTION (IN 30° SECTORS) AND
SPEED WITHIN SPECIFIED RANGES
WIND DIRECTIONWIND SPEED (kt)
REMARKCases when a certain phenomenon is not occurred and frequency is 0 are
shaded white

AERODOROME CLIMATOLOGY LYNI L
RHMSS – www.hidmet.gov.rs 107
Table 91. Frequencies of occurrence of concurrent wind direction (in 30° sectors) and speed within specified ranges – September, October
(ICAO Model D) MODEL D
AERODROME: LYNI MONTH: IX
TOTAL NUMBER OF OBSERVATIONS: 154783
LATITUDE: 43° 20' 14'' N
1-5 6-10 11-15 16-20 21-25 26-30 31-35 36-40 TOTAL
CALM 3.7
VARIABLE 25.7 0.6 0.2 0.0 0.0 0.0 0.0 0.0 26.5
35-36-01 1.5 1.1 0.1 0.0 0.0 0.0 0.0 0.0 2.7
02-03-04 1.5 0.9 0.1 0.0 0.0 0.0 0.0 0.0 2.4
05-06-07 2.5 1.9 0.8 0.1 0.0 0.0 0.0 0.0 5.3
08-09-10 6.0 2.1 1.4 0.3 0.0 0.0 0.0 0.0 9.7
11-12-13 6.0 1.2 0.2 0.0 0.0 0.0 0.0 0.0 7.4
14-15-16 2.6 0.5 0.0 0.0 0.0 0.0 0.0 0.0 3.2
17-18-19 2.9 0.6 0.0 0.0 0.0 0.0 0.0 0.0 3.6
20-21-22 3.1 0.3 0.0 0.0 0.0 0.0 0.0 0.0 3.5
23-24-25 1.3 0.1 0.0 0.0 0.0 0.0 0.0 0.0 1.5
26-27-28 1.3 0.2 0.0 0.0 0.0 0.0 0.0 0.0 1.5
29-30-31 2.9 3.1 1.1 0.2 0.0 0.0 0.0 0.0 7.3
32-33-34 3.9 10.9 5.2 1.4 0.3 0.0 0.0 0.0 21.7
TOTAL 61.3 23.4 9.2 2.0 0.3 0.1 0.0 0.0 100.0
1-5 6-10 11-15 16-20 21-25 26-30 31-35 36-40 TOTAL
CALM 3.9
VARIABLE 24.0 0.6 0.1 0.0 0.0 0.0 0.0 0.0 24.7
35-36-01 1.3 0.9 0.0 0.0 0.0 0.0 0.0 0.0 2.2
02-03-04 1.4 0.8 0.0 0.0 0.0 0.0 0.0 0.0 2.2
05-06-07 2.3 2.3 0.6 0.0 0.0 0.0 0.0 0.0 5.2
08-09-10 6.7 2.5 2.0 0.4 0.0 0.0 0.0 0.0 11.7
11-12-13 7.3 1.7 0.1 0.0 0.0 0.0 0.0 0.0 9.1
14-15-16 2.9 0.7 0.0 0.0 0.0 0.0 0.0 0.0 3.6
17-18-19 3.0 1.2 0.0 0.0 0.0 0.0 0.0 0.0 4.3
20-21-22 3.1 0.4 0.0 0.0 0.0 0.0 0.0 0.0 3.5
23-24-25 1.2 0.0 0.0 0.0 0.0 0.0 0.0 0.0 1.2
26-27-28 1.2 0.2 0.1 0.0 0.0 0.0 0.0 0.0 1.4
29-30-31 2.6 2.4 1.0 0.2 0.0 0.0 0.0 0.0 6.2
32-33-34 3.2 11.0 4.9 1.3 0.4 0.1 0.0 0.0 20.8
TOTAL 60.2 24.7 8.8 1.9 0.4 0.1 0.0 0.0 100.0
PERIOD OF RECORD: 2005 - 2013
WIND DIRECTIONWIND SPEED (kt)
FREQUENCIES (%) OF OCCURRENCE OF CONCURRENT WIND DIRECTION (IN 30° SECTORS) AND
SPEED WITHIN SPECIFIED RANGES
LONGITUDE: 21° 51' 13'' E ELEVATION ABOVE MSL: 650 ft
МЕСЕЦ: X
FREQUENCIES (%) OF OCCURRENCE OF CONCURRENT WIND DIRECTION (IN 30° SECTORS) AND
SPEED WITHIN SPECIFIED RANGES
WIND DIRECTIONWIND SPEED (kt)
REMARKCases when a certain phenomenon is not occurred and frequency is 0 are
shaded white
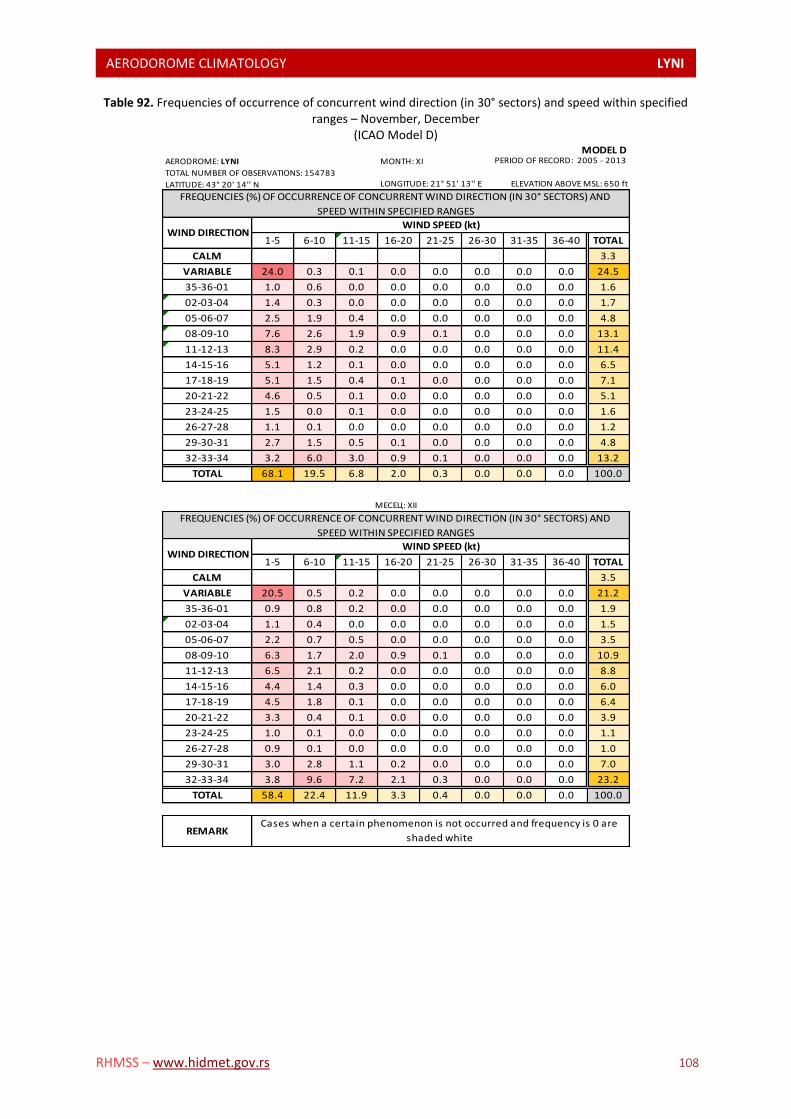
AERODOROME CLIMATOLOGY LYNI L
RHMSS – www.hidmet.gov.rs 108
Table 92. Frequencies of occurrence of concurrent wind direction (in 30° sectors) and speed within specified ranges – November, December
(ICAO Model D) MODEL D
AERODROME: LYNI MONTH: XI
TOTAL NUMBER OF OBSERVATIONS: 154783
LATITUDE: 43° 20' 14'' N
1-5 6-10 11-15 16-20 21-25 26-30 31-35 36-40 TOTAL
CALM 3.3
VARIABLE 24.0 0.3 0.1 0.0 0.0 0.0 0.0 0.0 24.5
35-36-01 1.0 0.6 0.0 0.0 0.0 0.0 0.0 0.0 1.6
02-03-04 1.4 0.3 0.0 0.0 0.0 0.0 0.0 0.0 1.7
05-06-07 2.5 1.9 0.4 0.0 0.0 0.0 0.0 0.0 4.8
08-09-10 7.6 2.6 1.9 0.9 0.1 0.0 0.0 0.0 13.1
11-12-13 8.3 2.9 0.2 0.0 0.0 0.0 0.0 0.0 11.4
14-15-16 5.1 1.2 0.1 0.0 0.0 0.0 0.0 0.0 6.5
17-18-19 5.1 1.5 0.4 0.1 0.0 0.0 0.0 0.0 7.1
20-21-22 4.6 0.5 0.1 0.0 0.0 0.0 0.0 0.0 5.1
23-24-25 1.5 0.0 0.1 0.0 0.0 0.0 0.0 0.0 1.6
26-27-28 1.1 0.1 0.0 0.0 0.0 0.0 0.0 0.0 1.2
29-30-31 2.7 1.5 0.5 0.1 0.0 0.0 0.0 0.0 4.8
32-33-34 3.2 6.0 3.0 0.9 0.1 0.0 0.0 0.0 13.2
TOTAL 68.1 19.5 6.8 2.0 0.3 0.0 0.0 0.0 100.0
1-5 6-10 11-15 16-20 21-25 26-30 31-35 36-40 TOTAL
CALM 3.5
VARIABLE 20.5 0.5 0.2 0.0 0.0 0.0 0.0 0.0 21.2
35-36-01 0.9 0.8 0.2 0.0 0.0 0.0 0.0 0.0 1.9
02-03-04 1.1 0.4 0.0 0.0 0.0 0.0 0.0 0.0 1.5
05-06-07 2.2 0.7 0.5 0.0 0.0 0.0 0.0 0.0 3.5
08-09-10 6.3 1.7 2.0 0.9 0.1 0.0 0.0 0.0 10.9
11-12-13 6.5 2.1 0.2 0.0 0.0 0.0 0.0 0.0 8.8
14-15-16 4.4 1.4 0.3 0.0 0.0 0.0 0.0 0.0 6.0
17-18-19 4.5 1.8 0.1 0.0 0.0 0.0 0.0 0.0 6.4
20-21-22 3.3 0.4 0.1 0.0 0.0 0.0 0.0 0.0 3.9
23-24-25 1.0 0.1 0.0 0.0 0.0 0.0 0.0 0.0 1.1
26-27-28 0.9 0.1 0.0 0.0 0.0 0.0 0.0 0.0 1.0
29-30-31 3.0 2.8 1.1 0.2 0.0 0.0 0.0 0.0 7.0
32-33-34 3.8 9.6 7.2 2.1 0.3 0.0 0.0 0.0 23.2
TOTAL 58.4 22.4 11.9 3.3 0.4 0.0 0.0 0.0 100.0
PERIOD OF RECORD: 2005 - 2013
WIND DIRECTIONWIND SPEED (kt)
FREQUENCIES (%) OF OCCURRENCE OF CONCURRENT WIND DIRECTION (IN 30° SECTORS) AND
SPEED WITHIN SPECIFIED RANGES
LONGITUDE: 21° 51' 13'' E ELEVATION ABOVE MSL: 650 ft
МЕСЕЦ: XII
FREQUENCIES (%) OF OCCURRENCE OF CONCURRENT WIND DIRECTION (IN 30° SECTORS) AND
SPEED WITHIN SPECIFIED RANGES
WIND DIRECTIONWIND SPEED (kt)
REMARKCases when a certain phenomenon is not occurred and frequency is 0 are
shaded white
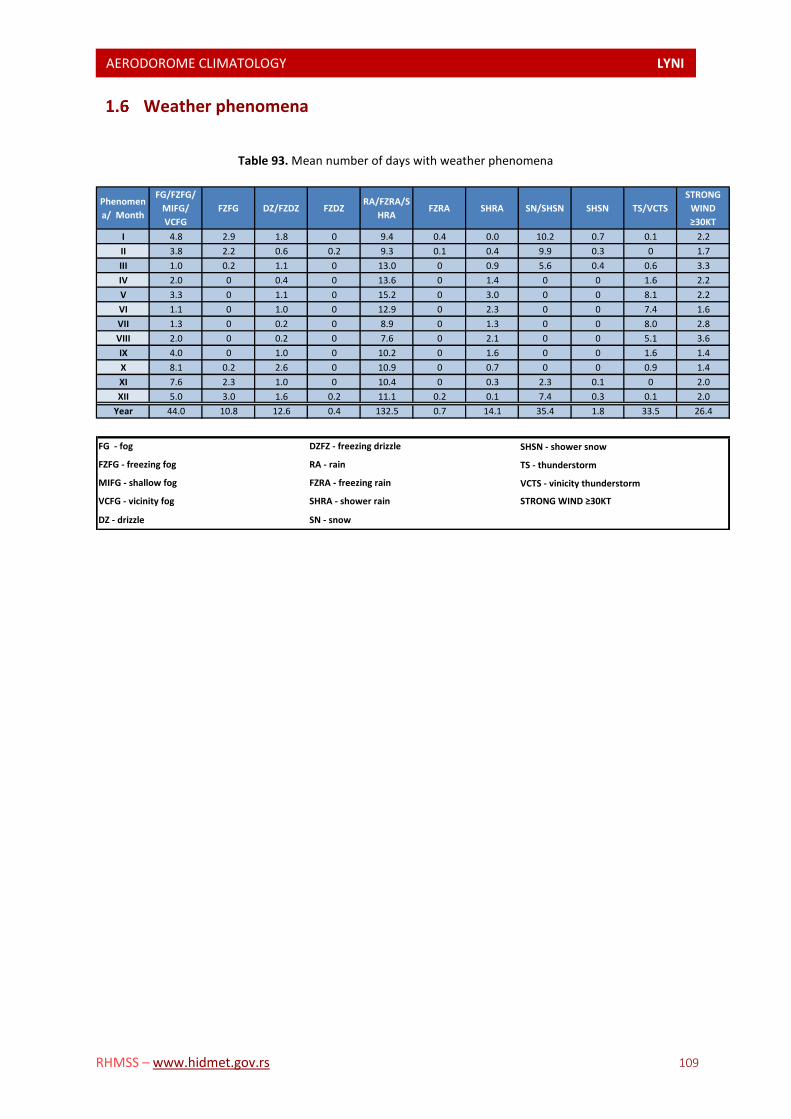
AERODOROME CLIMATOLOGY LYNI L
RHMSS – www.hidmet.gov.rs 109
Weather phenomena
Table 93. Mean number of days with weather phenomena
Phenomen
a/ Month
FG/FZFG/
MIFG/
VCFG
FZFG DZ/FZDZ FZDZRA/FZRA/S
HRAFZRA SHRA SN/SHSN SHSN TS/VCTS
STRONG
WIND
≥30KT
I 4.8 2.9 1.8 0 9.4 0.4 0.0 10.2 0.7 0.1 2.2
II 3.8 2.2 0.6 0.2 9.3 0.1 0.4 9.9 0.3 0 1.7
III 1.0 0.2 1.1 0 13.0 0 0.9 5.6 0.4 0.6 3.3
IV 2.0 0 0.4 0 13.6 0 1.4 0 0 1.6 2.2
V 3.3 0 1.1 0 15.2 0 3.0 0 0 8.1 2.2
VI 1.1 0 1.0 0 12.9 0 2.3 0 0 7.4 1.6
VII 1.3 0 0.2 0 8.9 0 1.3 0 0 8.0 2.8
VIII 2.0 0 0.2 0 7.6 0 2.1 0 0 5.1 3.6
IX 4.0 0 1.0 0 10.2 0 1.6 0 0 1.6 1.4
X 8.1 0.2 2.6 0 10.9 0 0.7 0 0 0.9 1.4
XI 7.6 2.3 1.0 0 10.4 0 0.3 2.3 0.1 0 2.0
XII 5.0 3.0 1.6 0.2 11.1 0.2 0.1 7.4 0.3 0.1 2.0
Year 44.0 10.8 12.6 0.4 132.5 0.7 14.1 35.4 1.8 33.5 26.4
SHSN - shower snow
TS - thunderstorm
VCTS - vinicity thunderstorm
FG - fog DZFZ - freezing drizzle
FZFG - freezing fog RA - rain
MIFG - shallow fog FZRA - freezing rain
VCFG - vicinity fog SHRA - shower rain STRONG WIND ≥30KT
DZ - drizzle SN - snow

AERODOROME CLIMATOLOGY LYNI L
RHMSS – www.hidmet.gov.rs 110
Table 94. Average number of consecutive terms with fog
Month/
Number of
consecutive
terms
VI VII VIII IX X XI XII I II III IV V VI Year
1 0.4 0.7 0.6 1.3 2.7 3.4 1.0 2.2 0.9 0.3 0.6 1.3 0.4 15.4
2 0.4 0.2 0.9 1.6 1.8 2.9 0.7 1.6 1.0 0.8 0.6 1.4 0.4 13.8
3 0.1 0.1 0.4 0.9 1.8 0.9 1.2 0.2 0.4 0.2 0.6 0.6 0.1 7.4
4 0.1 0.2 0.0 0.4 0.9 0.7 0.7 0.2 0.2 0.0 0.3 0.3 0.1 4.1
5 0.0 0.0 0.1 0.2 0.6 0.8 0.3 0.6 0.6 0.1 0.1 0.1 0.0 3.4
6 0.0 0.0 0.0 0.0 0.2 0.2 0.7 0.3 0.0 0.0 0.2 0.1 0.0 1.8
7 0.0 0.1 0.0 0.1 0.1 0.2 0.2 0.0 0.3 0.0 0.0 0.0 0.0 1.1
8 0.0 0.0 0.0 0.0 0.1 0.1 0.0 0.1 0.0 0.0 0.0 0.0 0.0 0.3
9 0.0 0.0 0.0 0.0 0.1 0.1 0.2 0.0 0.0 0.1 0.0 0.0 0.0 0.6
10 0.0 0.0 0.0 0.0 0.1 0.4 0.0 0.1 0.1 0.0 0.0 0.0 0.0 0.8
11 0.0 0.0 0.0 0.0 0.2 0.2 0.2 0.0 0.0 0.0 0.0 0.0 0.0 0.7
12 0.0 0.0 0.0 0.0 0.2 0.1 0.1 0.1 0.2 0.0 0.0 0.0 0.0 0.8
13 0.0 0.0 0.0 0.0 0.0 0.2 0.0 0.1 0.1 0.0 0.0 0.0 0.0 0.4
14 0.0 0.0 0.0 0.0 0.0 0.0 0.0 0.0 0.0 0.0 0.0 0.0 0.0 0.0
15 0.0 0.0 0.0 0.0 0.2 0.1 0.1 0.1 0.1 0.0 0.0 0.0 0.0 0.7
16 0.0 0.0 0.0 0.0 0.0 0.0 0.0 0.0 0.1 0.0 0.0 0.0 0.0 0.1
17 0.0 0.0 0.0 0.0 0.1 0.1 0.0 0.0 0.0 0.0 0.0 0.0 0.0 0.2
18 0.0 0.0 0.0 0.0 0.0 0.0 0.1 0.0 0.0 0.0 0.0 0.0 0.0 0.1
19 0.0 0.0 0.0 0.0 0.0 0.0 0.0 0.0 0.1 0.0 0.0 0.0 0.0 0.1
20 0.0 0.0 0.0 0.0 0.1 0.0 0.0 0.0 0.0 0.0 0.0 0.0 0.0 0.1
21 0.0 0.0 0.0 0.0 0.0 0.0 0.0 0.0 0.0 0.0 0.0 0.0 0.0 0.0
22 0.0 0.0 0.0 0.0 0.0 0.1 0.1 0.1 0.0 0.0 0.0 0.0 0.0 0.3
23 0.0 0.0 0.0 0.0 0.0 0.0 0.0 0.0 0.1 0.0 0.0 0.0 0.0 0.1
24 0.0 0.0 0.0 0.0 0.0 0.0 0.1 0.0 0.0 0.0 0.0 0.0 0.0 0.1
25 0.0 0.0 0.0 0.0 0.0 0.0 0.1 0.0 0.0 0.0 0.0 0.0 0.0 0.1
26 0.0 0.0 0.0 0.0 0.0 0.0 0.1 0.1 0.0 0.0 0.0 0.0 0.0 0.2
27 0.0 0.0 0.0 0.0 0.0 0.0 0.0 0.0 0.0 0.0 0.0 0.0 0.0 0.0
28 0.0 0.0 0.0 0.0 0.0 0.0 0.1 0.0 0.0 0.0 0.0 0.0 0.0 0.1
29 0.0 0.0 0.0 0.0 0.0 0.0 0.0 0.0 0.0 0.0 0.0 0.0 0.0 0.0
30 0.0 0.0 0.0 0.0 0.0 0.0 0.0 0.0 0.0 0.0 0.0 0.0 0.0 0.0
31 0.0 0.0 0.0 0.0 0.0 0.0 0.0 0.0 0.0 0.0 0.0 0.0 0.0 0.0
32 0.0 0.0 0.0 0.0 0.0 0.0 0.0 0.0 0.0 0.0 0.0 0.0 0.0 0.0
33 0.0 0.0 0.0 0.0 0.0 0.0 0.0 0.0 0.0 0.0 0.0 0.0 0.0 0.0
34 0.0 0.0 0.0 0.0 0.0 0.0 0.1 0.0 0.0 0.0 0.0 0.0 0.0 0.1
35 0.0 0.0 0.0 0.0 0.0 0.0 0.0 0.0 0.0 0.0 0.0 0.0 0.0 0.0
36 0.0 0.0 0.0 0.0 0.0 0.0 0.0 0.0 0.0 0.0 0.0 0.0 0.0 0.0
37 0.0 0.0 0.0 0.0 0.0 0.0 0.0 0.0 0.0 0.0 0.0 0.0 0.0 0.0
38 0.0 0.0 0.0 0.0 0.0 0.0 0.1 0.0 0.0 0.0 0.0 0.0 0.0 0.1
39 0.0 0.0 0.0 0.0 0.0 0.0 0.1 0.1 0.0 0.0 0.0 0.0 0.0 0.2
40 0.0 0.0 0.0 0.0 0.0 0.0 0.0 0.0 0.0 0.0 0.0 0.0 0.0 0.0
41 0.0 0.0 0.0 0.0 0.0 0.0 0.0 0.0 0.0 0.0 0.0 0.0 0.0 0.0
42 0.0 0.0 0.0 0.0 0.0 0.0 0.0 0.0 0.0 0.0 0.0 0.0 0.0 0.0
43 0.0 0.0 0.0 0.0 0.0 0.0 0.0 0.0 0.0 0.0 0.0 0.0 0.0 0.0
44 0.0 0.0 0.0 0.0 0.0 0.0 0.0 0.0 0.0 0.0 0.0 0.0 0.0 0.0
45 0.0 0.0 0.0 0.0 0.0 0.0 0.0 0.1 0.0 0.0 0.0 0.0 0.0 0.1
46 0.0 0.0 0.0 0.0 0.0 0.0 0.0 0.0 0.0 0.0 0.0 0.0 0.0 0.0
47 0.0 0.0 0.0 0.0 0.0 0.0 0.0 0.0 0.0 0.0 0.0 0.0 0.0 0.0
48 0.0 0.0 0.0 0.0 0.0 0.0 0.0 0.0 0.0 0.0 0.0 0.0 0.0 0.0
≥49 0.0 0.0 0.0 0.0 0.0 0.0 0.0 0.1 0.0 0.0 0.0 0.0 0.0 0.1
REMARKIncluding: FG, FZFG, MIFG, BCFG I PRFG. Terms are each 30 minutes; Cases when a certain phenomenon is not
occurred and frequency is 0 are shaded white
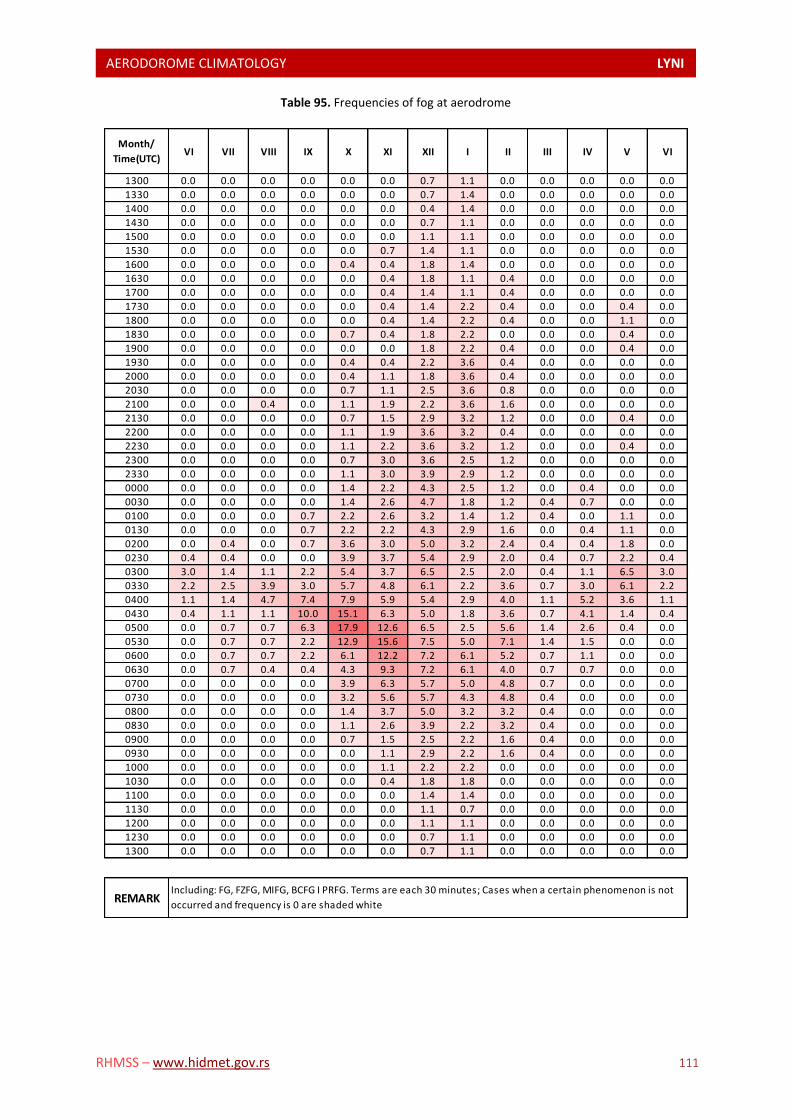
AERODOROME CLIMATOLOGY LYNI L
RHMSS – www.hidmet.gov.rs 111
Table 95. Frequencies of fog at aerodrome
Month/
Time(UTC)VI VII VIII IX X XI XII I II III IV V VI
1300 0.0 0.0 0.0 0.0 0.0 0.0 0.7 1.1 0.0 0.0 0.0 0.0 0.0
1330 0.0 0.0 0.0 0.0 0.0 0.0 0.7 1.4 0.0 0.0 0.0 0.0 0.0
1400 0.0 0.0 0.0 0.0 0.0 0.0 0.4 1.4 0.0 0.0 0.0 0.0 0.0
1430 0.0 0.0 0.0 0.0 0.0 0.0 0.7 1.1 0.0 0.0 0.0 0.0 0.0
1500 0.0 0.0 0.0 0.0 0.0 0.0 1.1 1.1 0.0 0.0 0.0 0.0 0.0
1530 0.0 0.0 0.0 0.0 0.0 0.7 1.4 1.1 0.0 0.0 0.0 0.0 0.0
1600 0.0 0.0 0.0 0.0 0.4 0.4 1.8 1.4 0.0 0.0 0.0 0.0 0.0
1630 0.0 0.0 0.0 0.0 0.0 0.4 1.8 1.1 0.4 0.0 0.0 0.0 0.0
1700 0.0 0.0 0.0 0.0 0.0 0.4 1.4 1.1 0.4 0.0 0.0 0.0 0.0
1730 0.0 0.0 0.0 0.0 0.0 0.4 1.4 2.2 0.4 0.0 0.0 0.4 0.0
1800 0.0 0.0 0.0 0.0 0.0 0.4 1.4 2.2 0.4 0.0 0.0 1.1 0.0
1830 0.0 0.0 0.0 0.0 0.7 0.4 1.8 2.2 0.0 0.0 0.0 0.4 0.0
1900 0.0 0.0 0.0 0.0 0.0 0.0 1.8 2.2 0.4 0.0 0.0 0.4 0.0
1930 0.0 0.0 0.0 0.0 0.4 0.4 2.2 3.6 0.4 0.0 0.0 0.0 0.0
2000 0.0 0.0 0.0 0.0 0.4 1.1 1.8 3.6 0.4 0.0 0.0 0.0 0.0
2030 0.0 0.0 0.0 0.0 0.7 1.1 2.5 3.6 0.8 0.0 0.0 0.0 0.0
2100 0.0 0.0 0.4 0.0 1.1 1.9 2.2 3.6 1.6 0.0 0.0 0.0 0.0
2130 0.0 0.0 0.0 0.0 0.7 1.5 2.9 3.2 1.2 0.0 0.0 0.4 0.0
2200 0.0 0.0 0.0 0.0 1.1 1.9 3.6 3.2 0.4 0.0 0.0 0.0 0.0
2230 0.0 0.0 0.0 0.0 1.1 2.2 3.6 3.2 1.2 0.0 0.0 0.4 0.0
2300 0.0 0.0 0.0 0.0 0.7 3.0 3.6 2.5 1.2 0.0 0.0 0.0 0.0
2330 0.0 0.0 0.0 0.0 1.1 3.0 3.9 2.9 1.2 0.0 0.0 0.0 0.0
0000 0.0 0.0 0.0 0.0 1.4 2.2 4.3 2.5 1.2 0.0 0.4 0.0 0.0
0030 0.0 0.0 0.0 0.0 1.4 2.6 4.7 1.8 1.2 0.4 0.7 0.0 0.0
0100 0.0 0.0 0.0 0.7 2.2 2.6 3.2 1.4 1.2 0.4 0.0 1.1 0.0
0130 0.0 0.0 0.0 0.7 2.2 2.2 4.3 2.9 1.6 0.0 0.4 1.1 0.0
0200 0.0 0.4 0.0 0.7 3.6 3.0 5.0 3.2 2.4 0.4 0.4 1.8 0.0
0230 0.4 0.4 0.0 0.0 3.9 3.7 5.4 2.9 2.0 0.4 0.7 2.2 0.4
0300 3.0 1.4 1.1 2.2 5.4 3.7 6.5 2.5 2.0 0.4 1.1 6.5 3.0
0330 2.2 2.5 3.9 3.0 5.7 4.8 6.1 2.2 3.6 0.7 3.0 6.1 2.2
0400 1.1 1.4 4.7 7.4 7.9 5.9 5.4 2.9 4.0 1.1 5.2 3.6 1.1
0430 0.4 1.1 1.1 10.0 15.1 6.3 5.0 1.8 3.6 0.7 4.1 1.4 0.4
0500 0.0 0.7 0.7 6.3 17.9 12.6 6.5 2.5 5.6 1.4 2.6 0.4 0.0
0530 0.0 0.7 0.7 2.2 12.9 15.6 7.5 5.0 7.1 1.4 1.5 0.0 0.0
0600 0.0 0.7 0.7 2.2 6.1 12.2 7.2 6.1 5.2 0.7 1.1 0.0 0.0
0630 0.0 0.7 0.4 0.4 4.3 9.3 7.2 6.1 4.0 0.7 0.7 0.0 0.0
0700 0.0 0.0 0.0 0.0 3.9 6.3 5.7 5.0 4.8 0.7 0.0 0.0 0.0
0730 0.0 0.0 0.0 0.0 3.2 5.6 5.7 4.3 4.8 0.4 0.0 0.0 0.0
0800 0.0 0.0 0.0 0.0 1.4 3.7 5.0 3.2 3.2 0.4 0.0 0.0 0.0
0830 0.0 0.0 0.0 0.0 1.1 2.6 3.9 2.2 3.2 0.4 0.0 0.0 0.0
0900 0.0 0.0 0.0 0.0 0.7 1.5 2.5 2.2 1.6 0.4 0.0 0.0 0.0
0930 0.0 0.0 0.0 0.0 0.0 1.1 2.9 2.2 1.6 0.4 0.0 0.0 0.0
1000 0.0 0.0 0.0 0.0 0.0 1.1 2.2 2.2 0.0 0.0 0.0 0.0 0.0
1030 0.0 0.0 0.0 0.0 0.0 0.4 1.8 1.8 0.0 0.0 0.0 0.0 0.0
1100 0.0 0.0 0.0 0.0 0.0 0.0 1.4 1.4 0.0 0.0 0.0 0.0 0.0
1130 0.0 0.0 0.0 0.0 0.0 0.0 1.1 0.7 0.0 0.0 0.0 0.0 0.0
1200 0.0 0.0 0.0 0.0 0.0 0.0 1.1 1.1 0.0 0.0 0.0 0.0 0.0
1230 0.0 0.0 0.0 0.0 0.0 0.0 0.7 1.1 0.0 0.0 0.0 0.0 0.0
1300 0.0 0.0 0.0 0.0 0.0 0.0 0.7 1.1 0.0 0.0 0.0 0.0 0.0
REMARKIncluding: FG, FZFG, MIFG, BCFG I PRFG. Terms are each 30 minutes; Cases when a certain phenomenon is not
occurred and frequency is 0 are shaded white
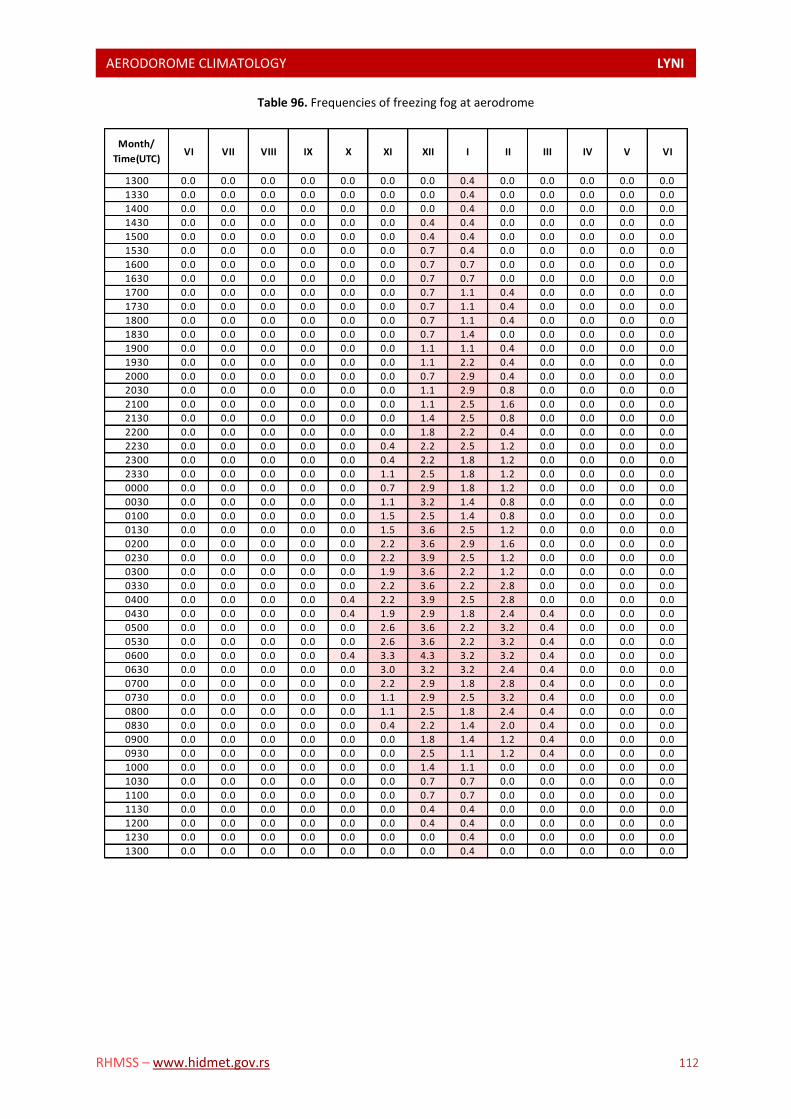
AERODOROME CLIMATOLOGY LYNI L
RHMSS – www.hidmet.gov.rs 112
Table 96. Frequencies of freezing fog at aerodrome
Month/
Time(UTC)VI VII VIII IX X XI XII I II III IV V VI
1300 0.0 0.0 0.0 0.0 0.0 0.0 0.0 0.4 0.0 0.0 0.0 0.0 0.0
1330 0.0 0.0 0.0 0.0 0.0 0.0 0.0 0.4 0.0 0.0 0.0 0.0 0.0
1400 0.0 0.0 0.0 0.0 0.0 0.0 0.0 0.4 0.0 0.0 0.0 0.0 0.0
1430 0.0 0.0 0.0 0.0 0.0 0.0 0.4 0.4 0.0 0.0 0.0 0.0 0.0
1500 0.0 0.0 0.0 0.0 0.0 0.0 0.4 0.4 0.0 0.0 0.0 0.0 0.0
1530 0.0 0.0 0.0 0.0 0.0 0.0 0.7 0.4 0.0 0.0 0.0 0.0 0.0
1600 0.0 0.0 0.0 0.0 0.0 0.0 0.7 0.7 0.0 0.0 0.0 0.0 0.0
1630 0.0 0.0 0.0 0.0 0.0 0.0 0.7 0.7 0.0 0.0 0.0 0.0 0.0
1700 0.0 0.0 0.0 0.0 0.0 0.0 0.7 1.1 0.4 0.0 0.0 0.0 0.0
1730 0.0 0.0 0.0 0.0 0.0 0.0 0.7 1.1 0.4 0.0 0.0 0.0 0.0
1800 0.0 0.0 0.0 0.0 0.0 0.0 0.7 1.1 0.4 0.0 0.0 0.0 0.0
1830 0.0 0.0 0.0 0.0 0.0 0.0 0.7 1.4 0.0 0.0 0.0 0.0 0.0
1900 0.0 0.0 0.0 0.0 0.0 0.0 1.1 1.1 0.4 0.0 0.0 0.0 0.0
1930 0.0 0.0 0.0 0.0 0.0 0.0 1.1 2.2 0.4 0.0 0.0 0.0 0.0
2000 0.0 0.0 0.0 0.0 0.0 0.0 0.7 2.9 0.4 0.0 0.0 0.0 0.0
2030 0.0 0.0 0.0 0.0 0.0 0.0 1.1 2.9 0.8 0.0 0.0 0.0 0.0
2100 0.0 0.0 0.0 0.0 0.0 0.0 1.1 2.5 1.6 0.0 0.0 0.0 0.0
2130 0.0 0.0 0.0 0.0 0.0 0.0 1.4 2.5 0.8 0.0 0.0 0.0 0.0
2200 0.0 0.0 0.0 0.0 0.0 0.0 1.8 2.2 0.4 0.0 0.0 0.0 0.0
2230 0.0 0.0 0.0 0.0 0.0 0.4 2.2 2.5 1.2 0.0 0.0 0.0 0.0
2300 0.0 0.0 0.0 0.0 0.0 0.4 2.2 1.8 1.2 0.0 0.0 0.0 0.0
2330 0.0 0.0 0.0 0.0 0.0 1.1 2.5 1.8 1.2 0.0 0.0 0.0 0.0
0000 0.0 0.0 0.0 0.0 0.0 0.7 2.9 1.8 1.2 0.0 0.0 0.0 0.0
0030 0.0 0.0 0.0 0.0 0.0 1.1 3.2 1.4 0.8 0.0 0.0 0.0 0.0
0100 0.0 0.0 0.0 0.0 0.0 1.5 2.5 1.4 0.8 0.0 0.0 0.0 0.0
0130 0.0 0.0 0.0 0.0 0.0 1.5 3.6 2.5 1.2 0.0 0.0 0.0 0.0
0200 0.0 0.0 0.0 0.0 0.0 2.2 3.6 2.9 1.6 0.0 0.0 0.0 0.0
0230 0.0 0.0 0.0 0.0 0.0 2.2 3.9 2.5 1.2 0.0 0.0 0.0 0.0
0300 0.0 0.0 0.0 0.0 0.0 1.9 3.6 2.2 1.2 0.0 0.0 0.0 0.0
0330 0.0 0.0 0.0 0.0 0.0 2.2 3.6 2.2 2.8 0.0 0.0 0.0 0.0
0400 0.0 0.0 0.0 0.0 0.4 2.2 3.9 2.5 2.8 0.0 0.0 0.0 0.0
0430 0.0 0.0 0.0 0.0 0.4 1.9 2.9 1.8 2.4 0.4 0.0 0.0 0.0
0500 0.0 0.0 0.0 0.0 0.0 2.6 3.6 2.2 3.2 0.4 0.0 0.0 0.0
0530 0.0 0.0 0.0 0.0 0.0 2.6 3.6 2.2 3.2 0.4 0.0 0.0 0.0
0600 0.0 0.0 0.0 0.0 0.4 3.3 4.3 3.2 3.2 0.4 0.0 0.0 0.0
0630 0.0 0.0 0.0 0.0 0.0 3.0 3.2 3.2 2.4 0.4 0.0 0.0 0.0
0700 0.0 0.0 0.0 0.0 0.0 2.2 2.9 1.8 2.8 0.4 0.0 0.0 0.0
0730 0.0 0.0 0.0 0.0 0.0 1.1 2.9 2.5 3.2 0.4 0.0 0.0 0.0
0800 0.0 0.0 0.0 0.0 0.0 1.1 2.5 1.8 2.4 0.4 0.0 0.0 0.0
0830 0.0 0.0 0.0 0.0 0.0 0.4 2.2 1.4 2.0 0.4 0.0 0.0 0.0
0900 0.0 0.0 0.0 0.0 0.0 0.0 1.8 1.4 1.2 0.4 0.0 0.0 0.0
0930 0.0 0.0 0.0 0.0 0.0 0.0 2.5 1.1 1.2 0.4 0.0 0.0 0.0
1000 0.0 0.0 0.0 0.0 0.0 0.0 1.4 1.1 0.0 0.0 0.0 0.0 0.0
1030 0.0 0.0 0.0 0.0 0.0 0.0 0.7 0.7 0.0 0.0 0.0 0.0 0.0
1100 0.0 0.0 0.0 0.0 0.0 0.0 0.7 0.7 0.0 0.0 0.0 0.0 0.0
1130 0.0 0.0 0.0 0.0 0.0 0.0 0.4 0.4 0.0 0.0 0.0 0.0 0.0
1200 0.0 0.0 0.0 0.0 0.0 0.0 0.4 0.4 0.0 0.0 0.0 0.0 0.0
1230 0.0 0.0 0.0 0.0 0.0 0.0 0.0 0.4 0.0 0.0 0.0 0.0 0.0
1300 0.0 0.0 0.0 0.0 0.0 0.0 0.0 0.4 0.0 0.0 0.0 0.0 0.0
AERODOROME CLIMATOLOGY LYNI L
RHMSS – www.hidmet.gov.rs 113
LIST OF FIGURE
Figure 1. An example of the chart showing relative frequency of the observed parameter .... 4
Figure 2. An example of the chart showing average number of days of the event occurrence4
Figure 3. An example of the chart showing average value of the observed parameter ........... 4
Figure 4. Wind polygon – January, February ........................................................................... 74
Figure 5. Wind polygon – March, April .................................................................................... 75
Figure 6. Wind polygon – May, June ........................................................................................ 76
Figure 7. Wind polygon – July, August ..................................................................................... 77
Figure 8. Wind polygon – September, October ....................................................................... 78
Figure 9. Wind polygon – November, December .................................................................... 79
Figure 10. Wind polygon per season – Spring, Summer .......................................................... 80
Figure 11. Wind polygon per season – Autumn, Winter ......................................................... 81
Figure 12. Wind polygon – yearly ............................................................................................ 82
Figure 13. Wind polygon related to RWY position per season –Spring, Summer ................. 100
Figure 14. Wind polygon related to RWY position per season –Autumn, Winter................. 101
Figure 15. Wind polygon related to RWY position – Year ..................................................... 102
AERODOROME CLIMATOLOGY LYNI L
RHMSS – www.hidmet.gov.rs 114
LIST OF TABLE
Table 1. Average monthly and yearly air temperature, air temperature exstremes, average
number of days within specified values of air temperature ..................................................... 5
Table 2. Average air temperature per month and for year ....................................................... 6
Table 3. Frequencies of surface temperature in specified ranges of 5°C at the specified times
– January .................................................................................................................................... 7
Table 4. Frequencies of surface temperature in specified ranges of 5°C at the specified times
– February (ICAO Model E) ....................................................................................................... 8
Table 5. Frequencies of surface temperature in specified ranges of 5°C at the specified times
– March (ICAO Model E) ............................................................................................................ 9
Table 6. Frequencies of surface temperature in specified ranges of 5°C at the specified times
– April (ICAO Model E) ............................................................................................................ 10
Table 7. Frequencies of surface temperature in specified ranges of 5°C at the specified times
– May (ICAO Model E) ............................................................................................................. 11
Table 8. Frequencies of surface temperature in specified ranges of 5°C at the specified times
– June (ICAO Model E)............................................................................................................. 12
Table 9. Frequencies of surface temperature in specified ranges of 5°C at the specified times
– July......................................................................................................................................... 13
Table 10. Frequencies of surface temperature in specified ranges of 5°C at the specified
times – August (ICAO Model E) ............................................................................................... 14
Table 11. Frequencies of surface temperature in specified ranges of 5°C at the specified
times – September (ICAO Model E) ......................................................................................... 15
Table 12. Frequencies of surface temperature in specified ranges of 5°C at the specified
times – October (ICAO Model E) ............................................................................................. 16
Table 13. Frequencies of surface temperature in specified ranges of 5°C at the specified
times – November (ICAO Model E) .......................................................................................... 17
Table 14. Frequencies of surface temperature in specified ranges of 5°C at the specified
times – December (ICAO Model E) .......................................................................................... 18
Table 15. Average monthly and yearly relative humidity, absolute minimum of relative
humidity, average number of days within specified values of relative humudity .................. 19
Table 16. Average relative humudity (%)................................................................................. 20
AERODOROME CLIMATOLOGY LYNI L
RHMSS – www.hidmet.gov.rs 115
Table 17. Average number of cases when Т-Тd=0 ................................................................... 21
Table 18. Average number of cases when Т-Тd=1 ................................................................... 22
Table 19. Average number of cases when Т-Тd=2 ................................................................... 23
Table 20. Average number of cases when Т-Тd=3 ................................................................... 24
Table 21. Average number of cases when Т-Тd=4 ................................................................... 25
Table 22. Average number of cases when Т-Тd>4 ................................................................... 26
Table 23. Monthly and yearly frequencies of air pressure (%) ................................................ 27
Table 24. Average air pressure (hPa) at specificied times ....................................................... 27
Table 25. Average air pressure (hPa) ....................................................................................... 28
Table 26. Frequencies of visibility below specified values at specified times – January ........ 29
Table 27. Frequencies of visibility below specified values at specified times – February (ICAO
Model B) ................................................................................................................................... 30
Table 28. Frequencies of visibility below specified values at specified times – March (ICAO
Model B) ................................................................................................................................... 31
Table 29. Frequencies of visibility below specified values at specified times – April (ICAO
Model B) ................................................................................................................................... 32
Table 30. Frequencies of visibility below specified values at specified times – May (ICAO
Model B) ................................................................................................................................... 33
Table 31. Frequencies of visibility below specified values at specified times – June (ICAO
Model B) ................................................................................................................................... 34
Table 32. Frequencies of visibility below specified values at specified times – July (ICAO
Model B) ................................................................................................................................... 35
Table 33. Frequencies of visibility below specified values at specified times – August (ICAO
Model B) ................................................................................................................................... 36
Table 34. Frequencies of visibility below specified values at specified times – September
(ICAO Model B) ........................................................................................................................ 37
Table 35. Frequencies of visibility below specified values at specified times – October (ICAO
Model B) ................................................................................................................................... 38
Table 36. Frequencies of visibility below specified values at specified times – November
(ICAO Model B) ........................................................................................................................ 39
AERODOROME CLIMATOLOGY LYNI L
RHMSS – www.hidmet.gov.rs 116
Table 37. Frequencies of visibility below specified values at specified times – December
(ICAO Model B) ........................................................................................................................ 40
Table 38. Frequencies of visibility < 200 m (based on ICAO Model B) .................................... 41
Table 39. Frequencies of visibility < 400 m (based on ICAO Model B) .................................... 43
Table 40. Frequencies of visibility < 600 m (based on ICAO Model B) .................................... 44
Table 41. Frequencies of visibility < 800 m (based on ICAO Model B) .................................... 45
Table 42. Frequencies of visibility < 1500 m (based on ICAO Model B) .................................. 46
Table 43. Frequencies of visibility < 3000 m (based on ICAO Model B) .................................. 47
Table 44. Frequencies of visibility < 5000 m (based on ICAO Model B) .................................. 48
Table 45. Frequencies of visibility < 8000 m (based on ICAO Model B) .................................. 49
Table 46. Frequencies of the height of the base of the lowest cloud layer of BKN or OVC
extent below specified values at specified times – January (ICAO Model C) .......................... 50
Table 47. Frequencies of the height of the base of the lowest cloud layer of BKN or OVC
extent below specified values at specified times – February (ICAO Model C) ........................ 51
Table 48. Frequencies of the height of the base of the lowest cloud layer of BKN or OVC
extent below specified values at specified times – March (ICAO Model C) ............................ 52
Table 49. Frequencies of the height of the base of the lowest cloud layer of BKN or OVC
extent below specified values at specified times – April (ICAO Model C) ............................... 53
Table 50. Frequencies of the height of the base of the lowest cloud layer of BKN or OVC
extent below specified values at specified times – May (ICAO Model C) ............................... 54
Table 51. Frequencies of the height of the base of the lowest cloud layer of BKN or OVC
extent below specified values at specified times – June (ICAO Model C) ............................... 55
Table 52. Frequencies of the height of the base of the lowest cloud layer of BKN or OVC
extent below specified values at specified times – July (ICAO Model C) ................................ 56
Table 53. Frequencies of the height of the base of the lowest cloud layer of BKN or OVC
extent below specified values at specified times – August (ICAO Model C) ........................... 57
Table 54. Frequencies of the height of the base of the lowest cloud layer of BKN or OVC
extent below specified values at specified times – September (ICAO Model C) .................... 58
Table 55. Frequencies of the height of the base of the lowest cloud layer of BKN or OVC
extent below specified values at specified times – October (ICAO Model C) ......................... 59
AERODOROME CLIMATOLOGY LYNI L
RHMSS – www.hidmet.gov.rs 117
Table 56. Frequencies of the height of the base of the lowest cloud layer of BKN or OVC
extent below specified values at specified times – November (ICAO Model C) ..................... 60
Table 57. Frequencies of the height of the base of the lowest cloud layer of BKN or OVC
extent below specified values at specified times – December (ICAO Model C)...................... 61
Table 58. Frequencies of the height of the base of the lowest cloud layer of BKN or OVC <
100 ft (based on ICAO Model C) ............................................................................................. 62
Table 59. Frequencies of the height of the base of the lowest cloud layer of BKN or OVC <
200 ft (based on ICAO Model C) ............................................................................................. 63
Table 60. Frequencies of the height of the base of the lowest cloud layer of BKN or OVC <
300 ft (based on ICAO Model C) ............................................................................................. 64
Table 61. Frequencies of the height of the base of the lowest cloud layer of BKN or OVC <
500 ft (based on ICAO Model C) ............................................................................................. 65
Table 62. Frequencies of the height of the base of the lowest cloud layer of BKN or OVC <
1000 ft (based on ICAO Model C) ........................................................................................... 66
Table 63. Frequencies of the height of the base of the lowest cloud layer of BKN or OVC <
1500 ft (based on ICAO Model C) ........................................................................................... 67
Table 64. Frequencies of the occurrence of visibility and/or height of the base of the lowest
cloud layer of BKN or OVC extent below specified values at specified times – January,
February (ICAO Model A) ........................................................................................................ 68
Table 66. Frequencies of the occurrence of visibility and/or height of the base of the lowest
cloud layer of BKN or OVC extent below specified values at specified times – May, June
(ICAO Model A) ........................................................................................................................ 70
Table 67. Frequencies of the occurrence of visibility and/or height of the base of the lowest
cloud layer of BKN or OVC extent below specified values at specified times – July, August
(ICAO Model A) ........................................................................................................................ 71
Table 68. Frequencies of the occurrence of visibility and/or height of the base of the lowest
cloud layer of BKN or OVC extent below specified values at specified times – September,
October (ICAO Model A) ......................................................................................................... 72
Table 69. Frequencies of the occurrence of visibility and/or height of the base of the lowest
cloud layer of BKN or OVC extent below specified values at specified times – November,
December (ICAO Model A) ...................................................................................................... 73
Table 70. Frequencies of occurrence of wind directions within specified speed ranges –
January ..................................................................................................................................... 83

AERODOROME CLIMATOLOGY LYNI L
RHMSS – www.hidmet.gov.rs 118
Table 71. Frequencies of occurrence of wind directions within specified speed ranges –
February ................................................................................................................................... 84
Table 72. Frequencies of occurrence of wind directions within specified speed ranges –
March ....................................................................................................................................... 85
Table 73. Frequencies of occurrence of wind directions within specified speed ranges – April
.................................................................................................................................................. 86
Table 74. Frequencies of occurrence of wind directions within specified speed ranges – May
.................................................................................................................................................. 87
Table 75. Frequencies of occurrence of wind directions within specified speed ranges – June
.................................................................................................................................................. 88
Table 76. Frequencies of occurrence of wind directions within specified speed ranges – July
.................................................................................................................................................. 89
Table 77. Frequencies of occurrence of wind directions within specified speed ranges –
August ...................................................................................................................................... 90
Table 78. Frequencies of occurrence of wind directions within specified speed ranges –
September ................................................................................................................................ 91
Table 79. Frequencies of occurrence of wind directions within specified speed ranges –
October .................................................................................................................................... 92
Table 80. Frequencies of occurrence of wind directions within specified speed ranges –
November ................................................................................................................................ 93
Table 81. Frequencies of occurrence of wind directions within specified speed ranges –
December ................................................................................................................................. 94
Table 82. Frequencies of occurrence of wind directions within specified speed ranges –
Spring ....................................................................................................................................... 95
Table 83. Frequencies of occurrence of wind directions within specified speed ranges –
Summer .................................................................................................................................... 96
Table 84. Frequencies of occurrence of wind directions within specified speed ranges –
Autmn ...................................................................................................................................... 97
Table 85. Frequencies of occurrence of wind directions within specified speed ranges –
Winter ...................................................................................................................................... 98
Table 86. Frequencies of occurrence of wind directions within specified speed ranges – Year
.................................................................................................................................................. 99
AERODOROME CLIMATOLOGY LYNI L
RHMSS – www.hidmet.gov.rs 119
Table 87. Frequencies of occurrence of concurrent wind direction (in 30° sectors) and speed
within specified ranges – January, February (ICAO Model D) .............................................. 103
Table 88. Frequencies of occurrence of concurrent wind direction (in 30° sectors) and speed
within specified ranges – March, April (ICAO Model D) ....................................................... 104
Table 89. Frequencies of occurrence of concurrent wind direction (in 30° sectors) and speed
within specified ranges – May, June (ICAO Model D) ........................................................... 105
Table 90. Frequencies of occurrence of concurrent wind direction (in 30° sectors) and speed
within specified ranges – July, August (ICAO Model D) ........................................................ 106
Table 91. Frequencies of occurrence of concurrent wind direction (in 30° sectors) and speed
within specified ranges – September, October (ICAO Model D) .......................................... 107
Table 92. Frequencies of occurrence of concurrent wind direction (in 30° sectors) and speed
within specified ranges – November, December (ICAO Model D) ....................................... 108
Table 93. Mean number of days with weather phenomena ................................................. 109
Table 94. Average number of consecutive terms with fog .................................................... 110
Table 95. Frequencies of fog at aerodrome .......................................................................... 111
Table 96. Frequencies of freezing fog at aerodrome ............................................................ 112