baseline climatology - gasgovernance.co.uk
TRANSCRIPT

ADD PRESENTATION TITLE HERE (GO TO: VIEW / MASTER / SLIDE MASTER TO AMEND)ADD PRESENTER’S NAME HERE / ADD DATE HERE
© Copyright EDF Energy. All rights reserved.
BaselineClimatology
Dave Parker
Climatology DESC presentation– Dave Parker
© Copyright EDF Energy plc. (including slides © Met Office) 2
Introduction
• What is climatology?
• How has it traditionally been calculated?
• Why the need for change?
• A research-led solution
Acknowledgement:
Parts of this presentation have been adapted from a presentation by Richard Graham, Climate Applications Development, Hadley Centre, © The Met Office, used with permission.
Climatology DESC presentation– Dave Parker
© Copyright EDF Energy plc. (including slides © Met Office) 3
What is climatology?
• Climatology is effectively an attempt to forecast ‘normal’ weather
• If the climate is stationary over time, the use of average historical data alone can be used as a ‘forecast’ of current climate norms.
• If climate is non-stationary, average historical data will be a poor (and biased) predictor of current climate norms.
Climatology DESC presentation– Dave Parker
© Copyright EDF Energy plc. (including slides © Met Office) 4
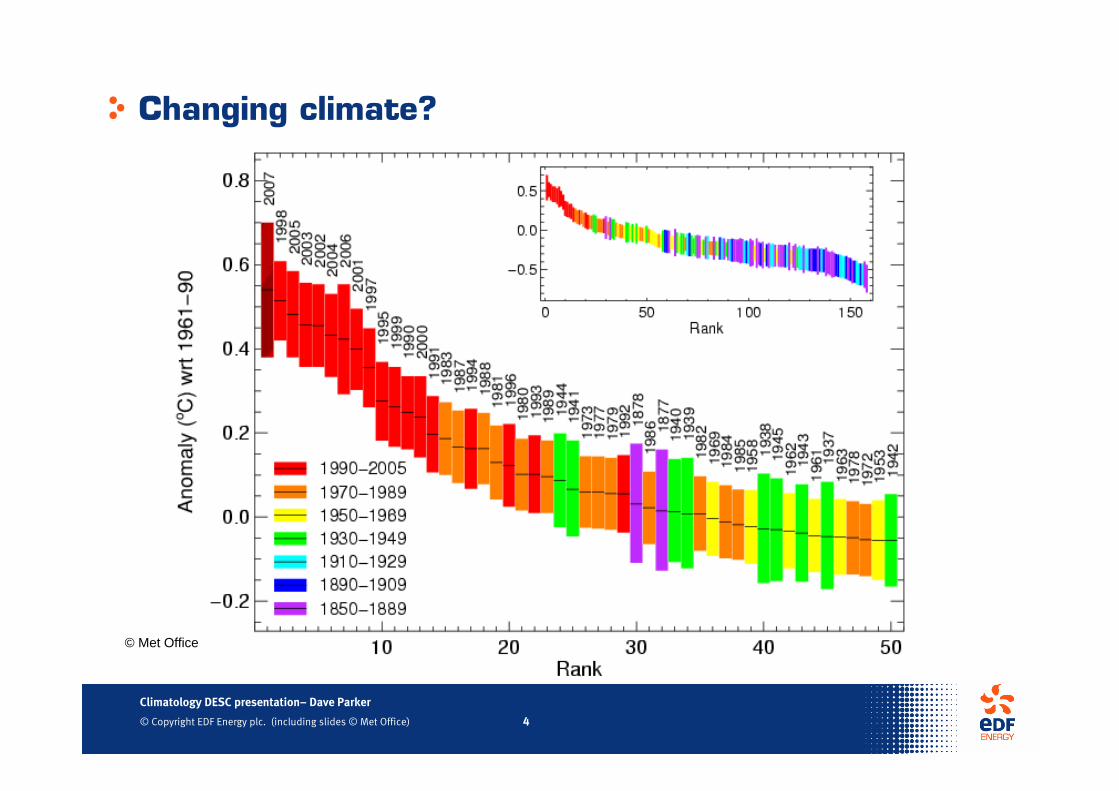
Changing climate?
© Met Office
Climatology DESC presentation– Dave Parker
© Copyright EDF Energy plc. (including slides © Met Office) 5
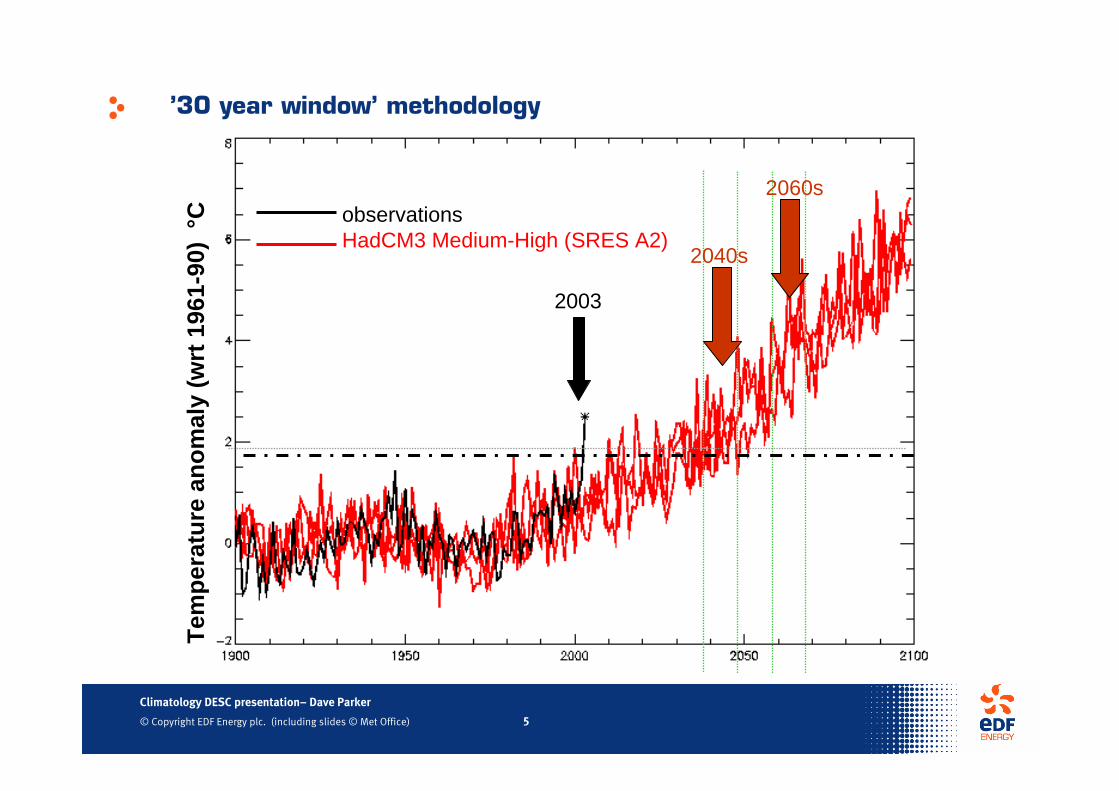
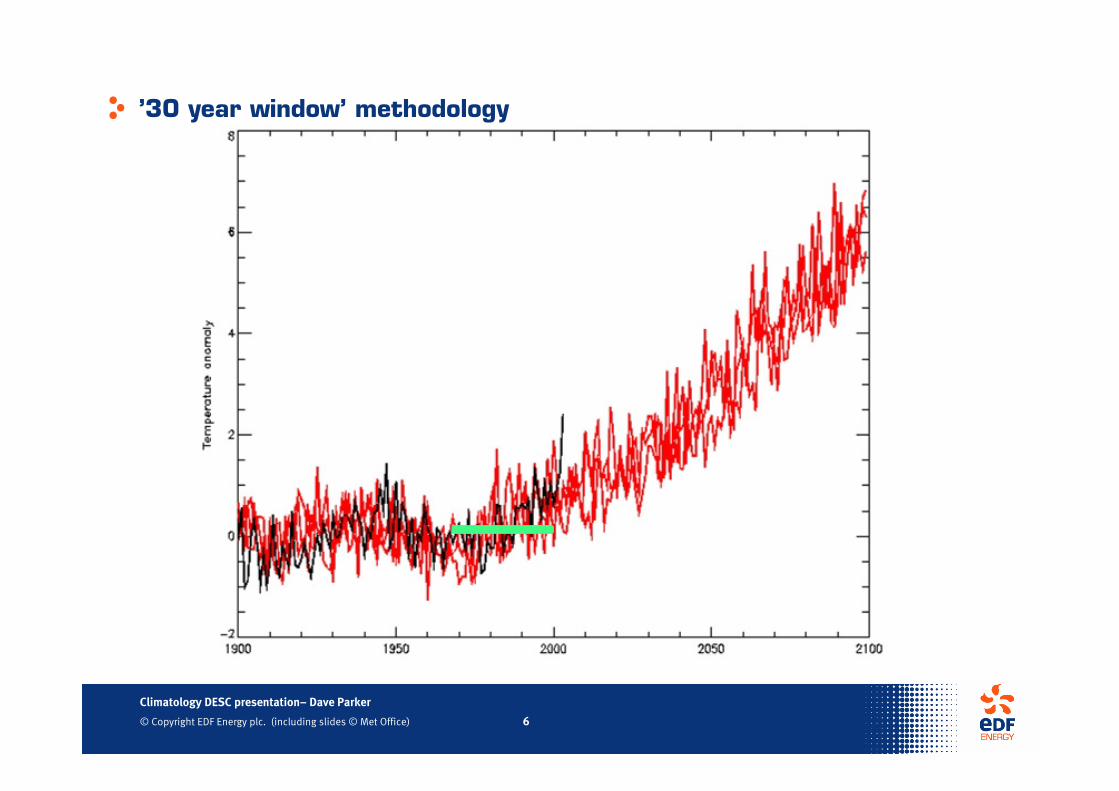
observationsHadCM3 Medium-High (SRES A2)
2003
2040s
2060sTe
mpe
ratu
re a
nom
aly
(wrt
196
1-90
) °C
’30 year window’ methodology
Climatology DESC presentation– Dave Parker
© Copyright EDF Energy plc. (including slides © Met Office) 6
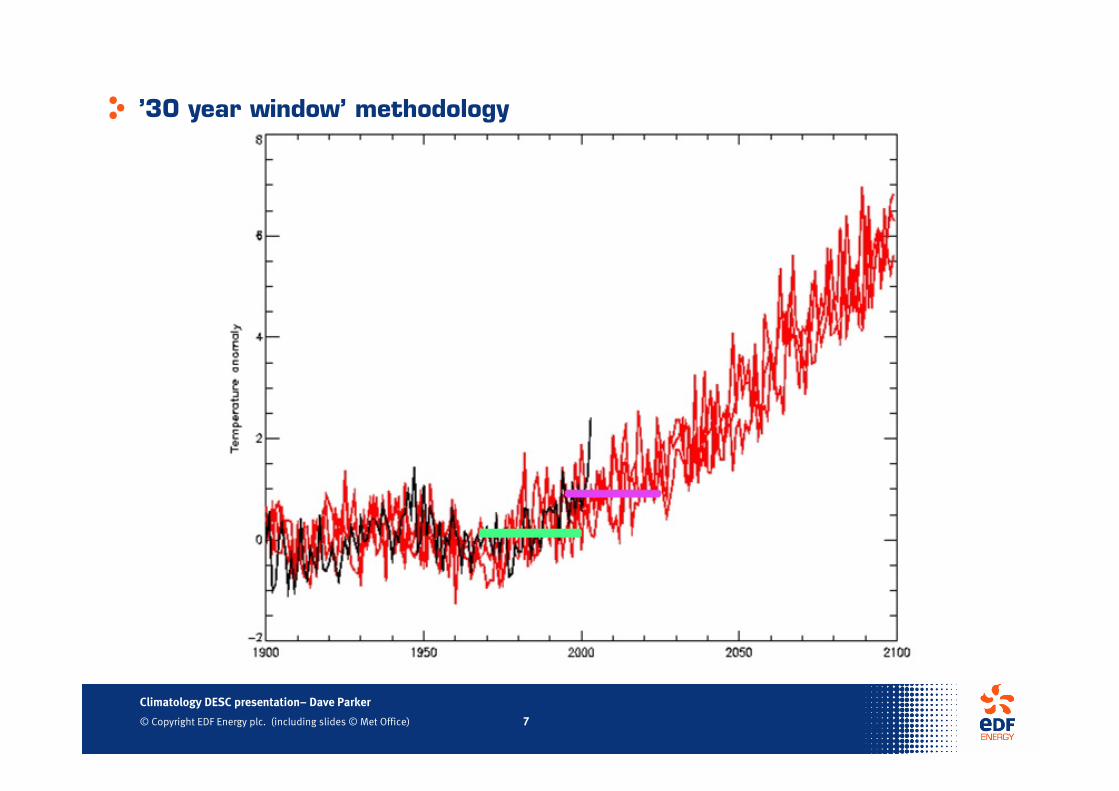
’30 year window’ methodology
Climatology DESC presentation– Dave Parker
© Copyright EDF Energy plc. (including slides © Met Office) 7
’30 year window’ methodology
Climatology DESC presentation– Dave Parker
© Copyright EDF Energy plc. (including slides © Met Office) 8
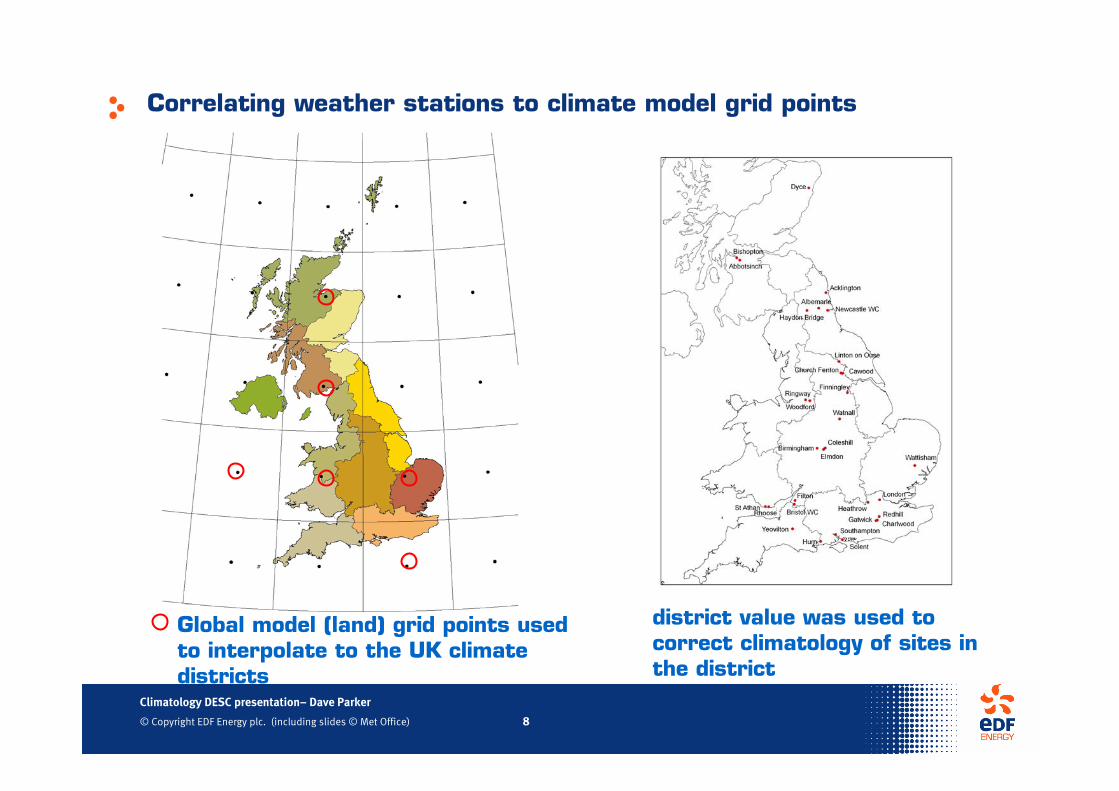
Correlating weather stations to climate model grid points
Global model (land) grid points used to interpolate to the UK climate districts
district value was used to correct climatology of sites in the district
Climatology DESC presentation– Dave Parker
© Copyright EDF Energy plc. (including slides © Met Office) 9
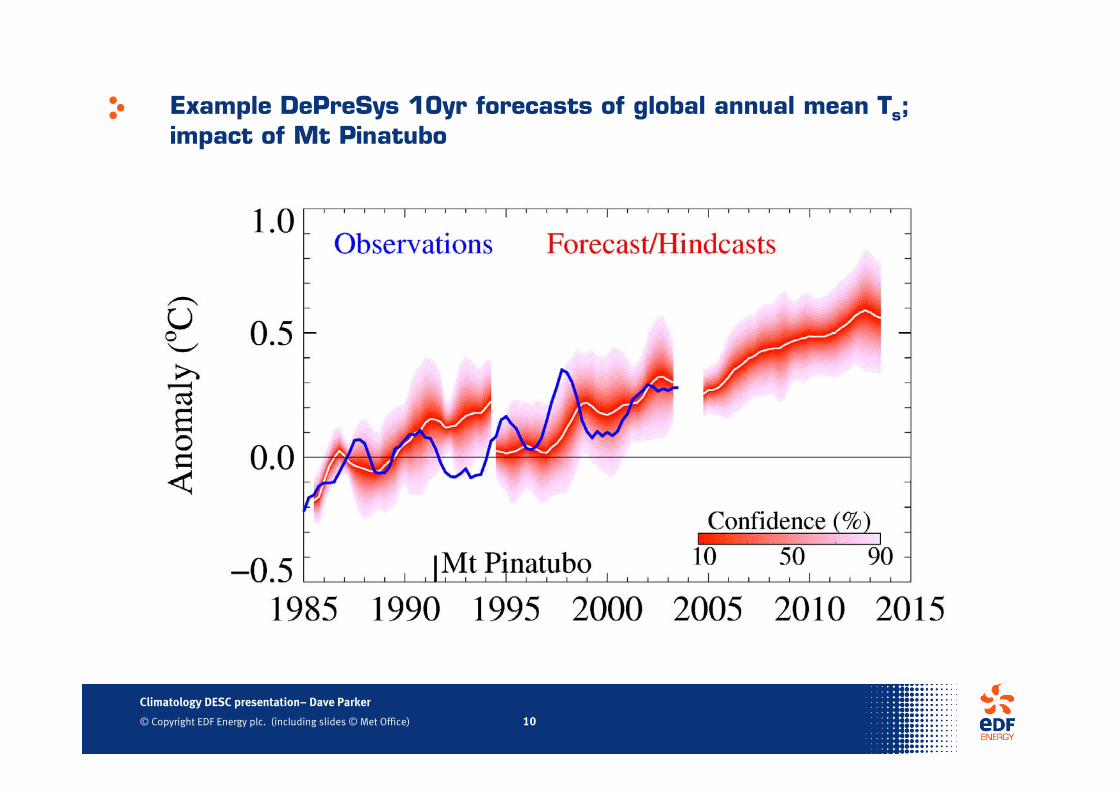
The Met Office Decadal Prediction System (DePreSys)
HadCM3 (coupled global climate model)• includes changes in greenhouse gases and sulphate aerosols (SRES B2 scenario – intermediate changes)
Repeats previous 11-year solar cycle in forecasts
Decay volcanic aerosol from the start of a forecast
Includes initial condition information:• atmospheric winds, temperature and surface pressure
• ocean temperature e.g. El Niño, salinity
Forecasts to 10+ years ahead• in 10-member ensemble, allows assessment of uncertainties
Climatology DESC presentation– Dave Parker
© Copyright EDF Energy plc. (including slides © Met Office) 10
Example DePreSys 10yr forecasts of global annual mean Ts; impact of Mt Pinatubo
Climatology DESC presentation– Dave Parker
© Copyright EDF Energy plc. (including slides © Met Office) 11
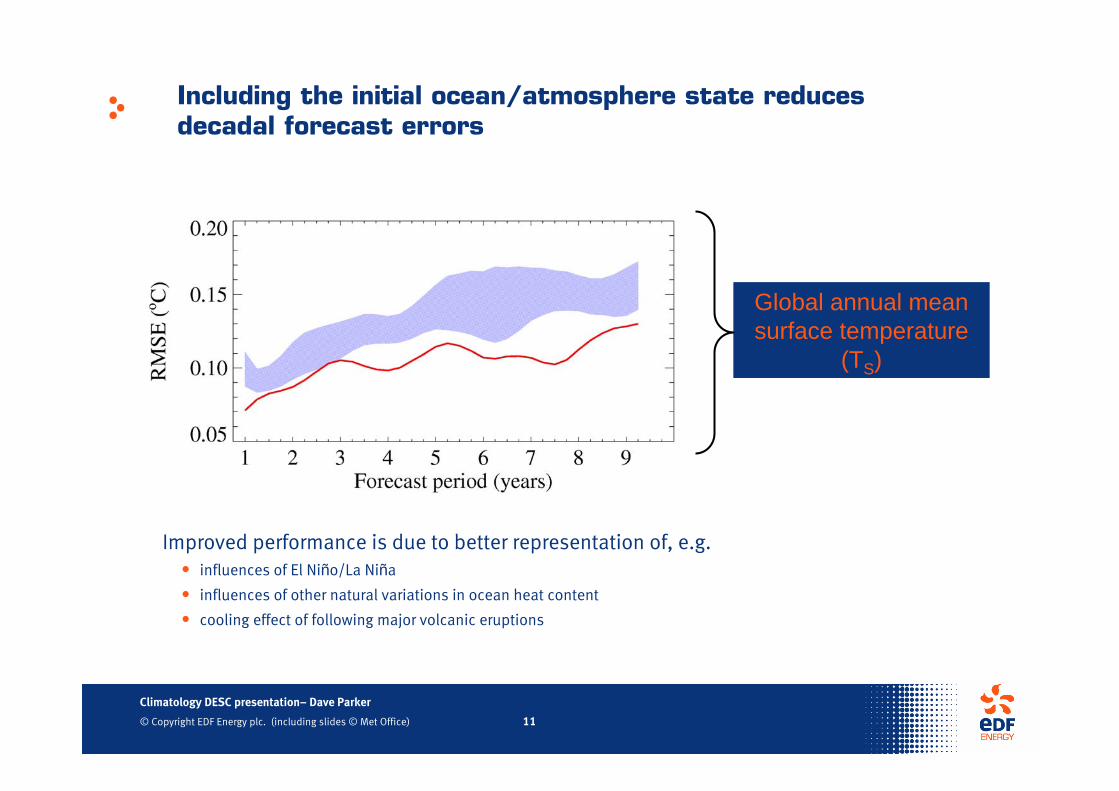
Including the initial ocean/atmosphere state reduces decadal forecast errors
Global annual mean surface temperature
(TS)
Improved performance is due to better representation of, e.g.• influences of El Niño/La Niña
• influences of other natural variations in ocean heat content
• cooling effect of following major volcanic eruptions
Climatology DESC presentation– Dave Parker
© Copyright EDF Energy plc. (including slides © Met Office) 12
Summary
• Uses 15 historical years and 15 forecast years based on DePreSys• Copes with non-stationary climate!• Adapts to either grid points or traditional weather stations (e.g. Heathrow)• Is based on historical data (15 years) and future predictions (15 years) so is in
line with modification requirements.
Climatology DESC presentation– Dave Parker
© Copyright EDF Energy plc. (including slides © Met Office) 13
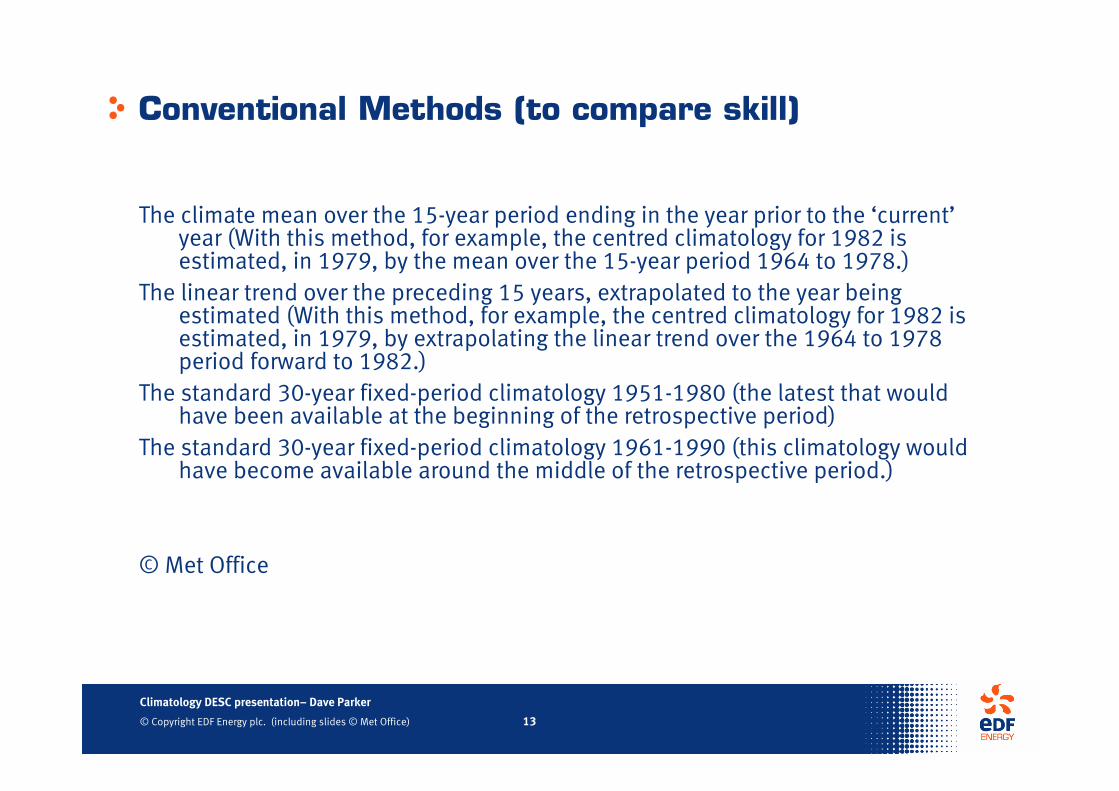
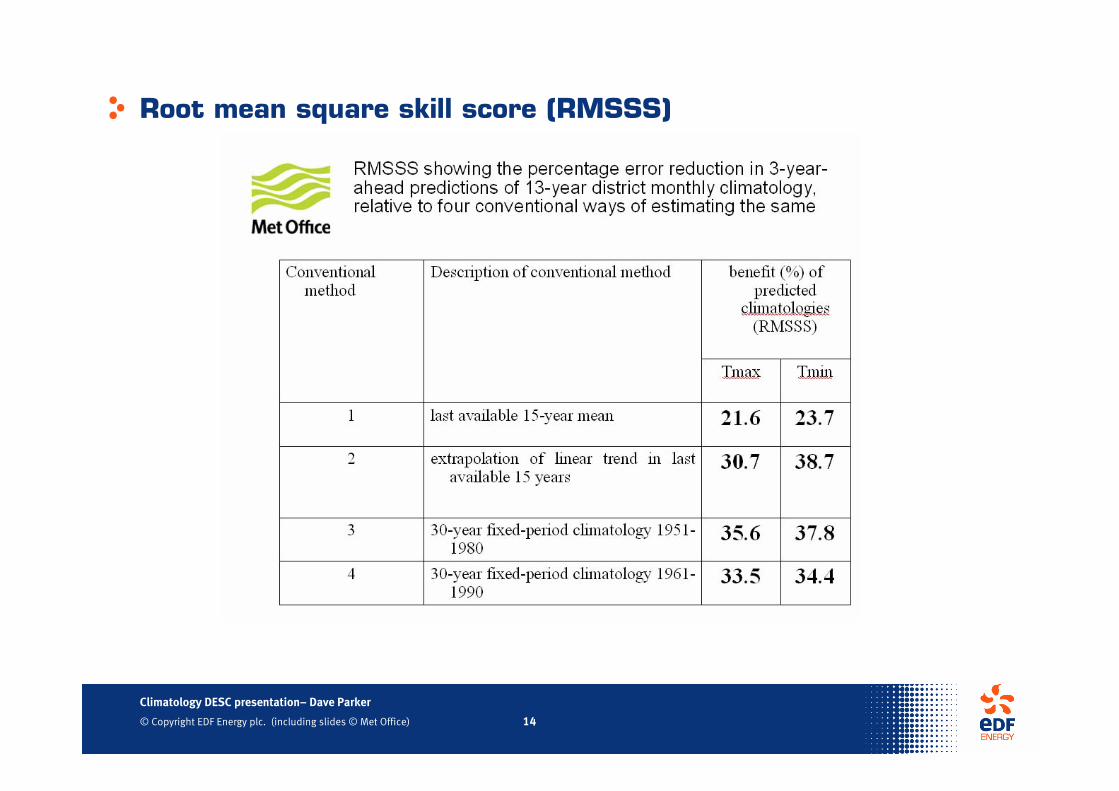
Conventional Methods (to compare skill)
The climate mean over the 15-year period ending in the year prior to the ‘current’year (With this method, for example, the centred climatology for 1982 is estimated, in 1979, by the mean over the 15-year period 1964 to 1978.)
The linear trend over the preceding 15 years, extrapolated to the year being estimated (With this method, for example, the centred climatology for 1982 is estimated, in 1979, by extrapolating the linear trend over the 1964 to 1978 period forward to 1982.)
The standard 30-year fixed-period climatology 1951-1980 (the latest that would have been available at the beginning of the retrospective period)
The standard 30-year fixed-period climatology 1961-1990 (this climatology would have become available around the middle of the retrospective period.)
© Met Office
Climatology DESC presentation– Dave Parker
© Copyright EDF Energy plc. (including slides © Met Office) 14
Root mean square skill score (RMSSS)
Climatology DESC presentation– Dave Parker
© Copyright EDF Energy plc. (including slides © Met Office) 15
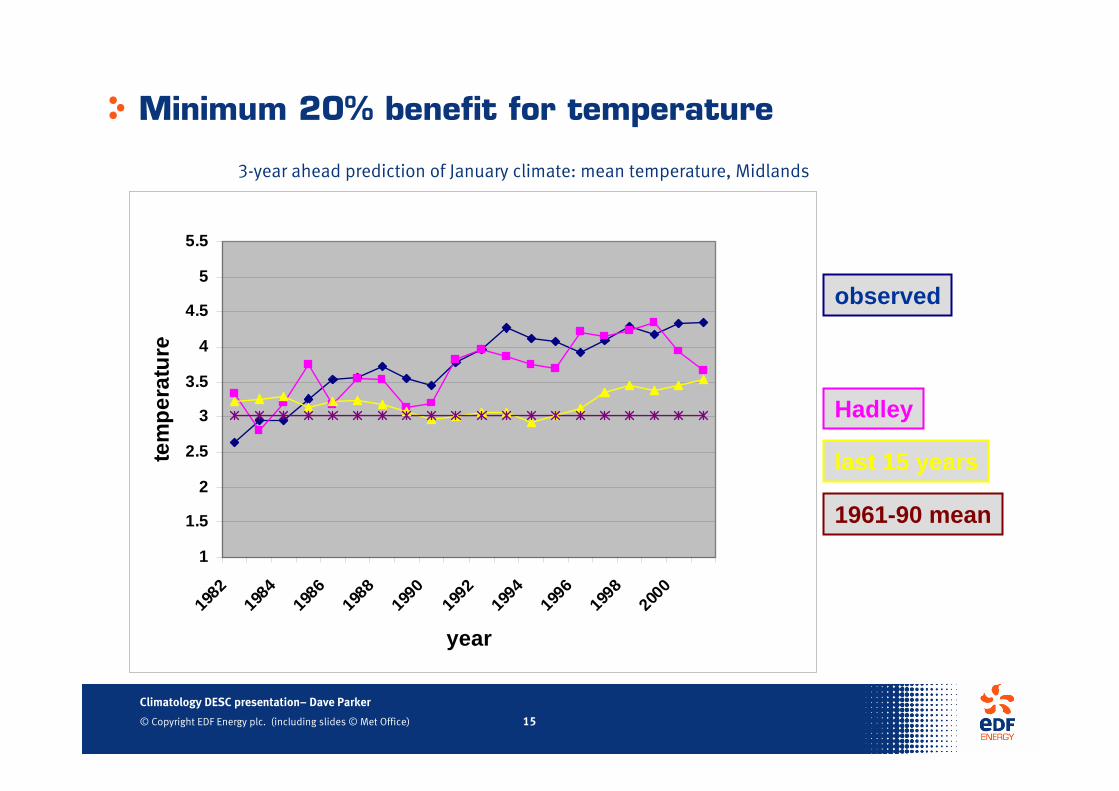
Minimum 20% benefit for temperature
1
1.5
2
2.5
3
3.5
4
4.5
5
5.5
1982
1984
1986
1988
1990
1992
1994
1996
1998
2000
year
tem
pera
ture
observed
Hadley
last 15 years
1961-90 mean
( ºC
)3-year ahead prediction of January climate: mean temperature, Midlands
Climatology DESC presentation– Dave Parker
© Copyright EDF Energy plc. (including slides © Met Office) 16
Summary
• Uses 15 historical years and 15 forecast years based on DePreSys• Adapts to either grid points or traditional weather stations (e.g. Heathrow)• Copes with non-stationary climate!• Can be shown to have greater skill (measured by RMS) than competing
methodologies (including using latest 15 years)
Climatology DESC presentation– Dave Parker
© Copyright EDF Energy plc. (including slides © Met Office) 17
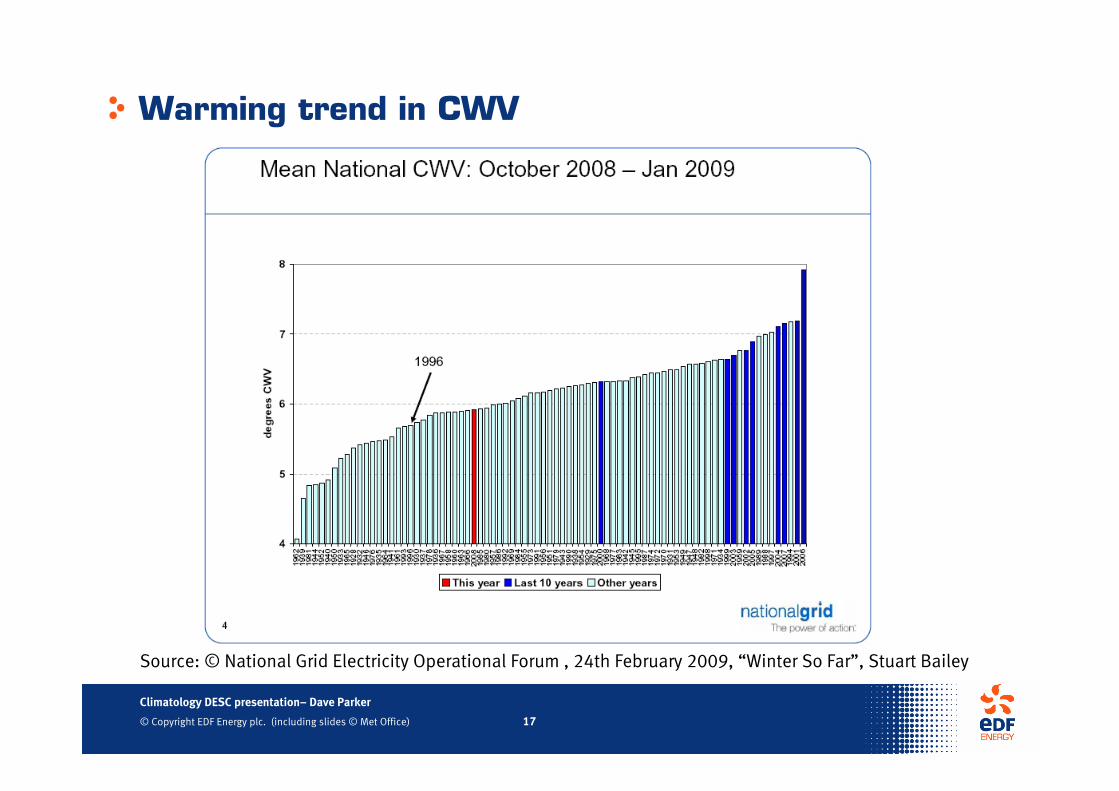
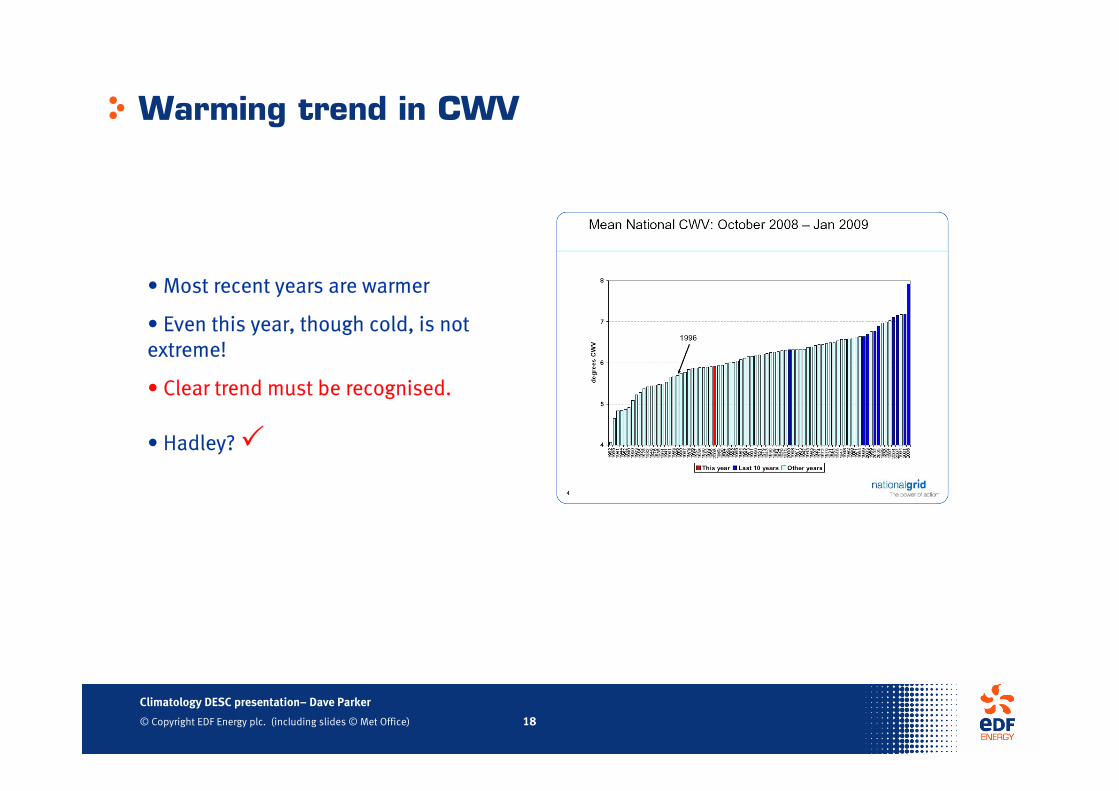
Warming trend in CWV
Source: © National Grid Electricity Operational Forum , 24th February 2009, “Winter So Far”, Stuart Bailey
Climatology DESC presentation– Dave Parker
© Copyright EDF Energy plc. (including slides © Met Office) 18
Warming trend in CWV
• Most recent years are warmer
• Even this year, though cold, is not extreme!
• Clear trend must be recognised.
• Hadley?
Climatology DESC presentation– Dave Parker
© Copyright EDF Energy plc. (including slides © Met Office) 19
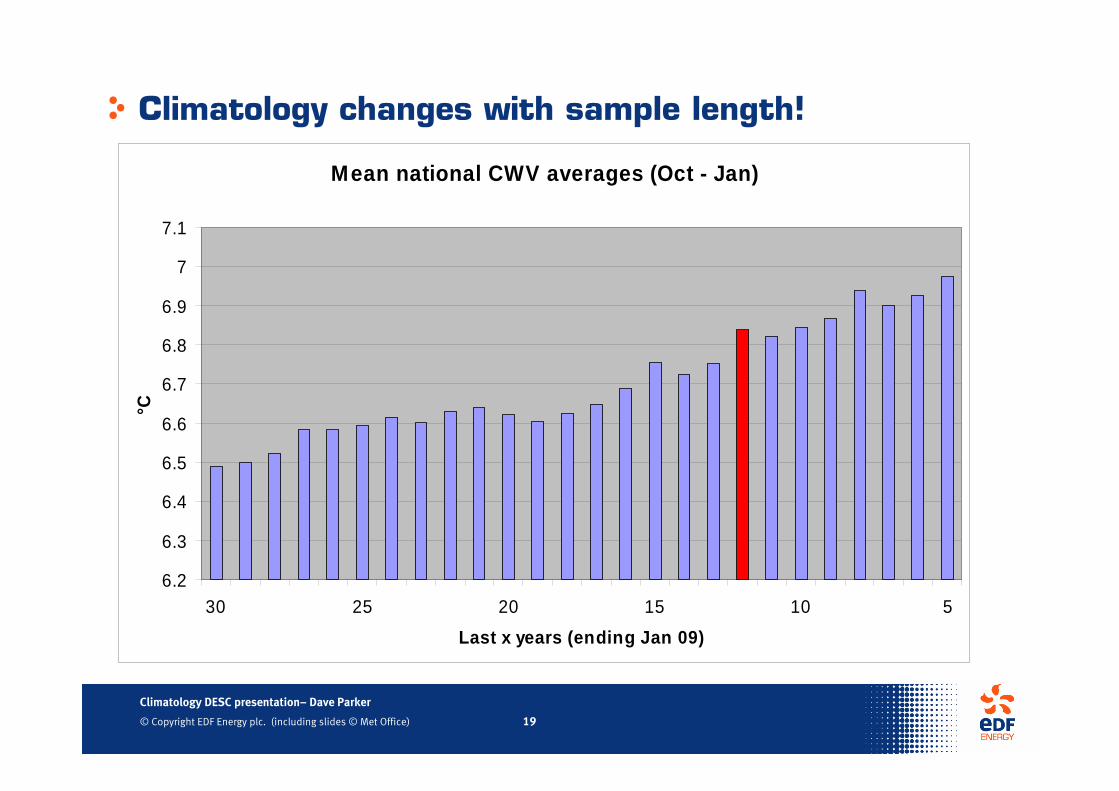
Climatology changes with sample length!
Mean national CWV averages (Oct - Jan)
6.2
6.3
6.4
6.5
6.6
6.7
6.8
6.9
7
7.1
30 25 20 15 10 5
Last x years (ending Jan 09)
°C
Climatology DESC presentation– Dave Parker
© Copyright EDF Energy plc. (including slides © Met Office) 20
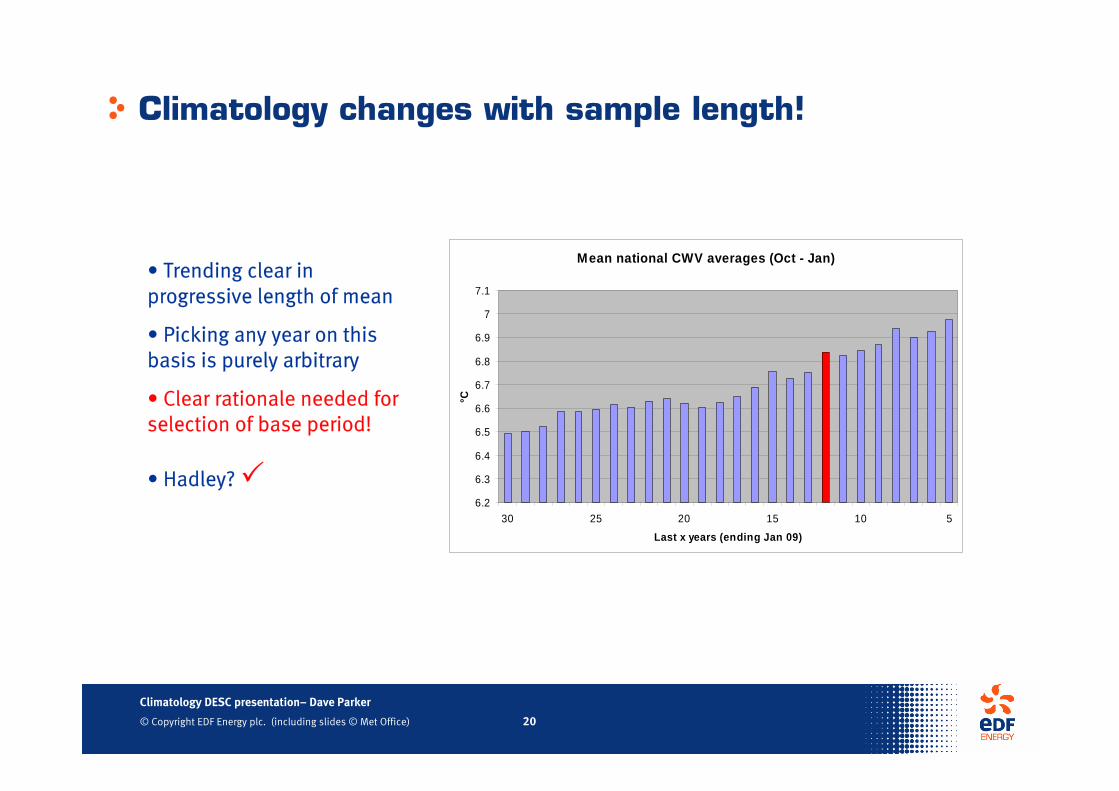
Climatology changes with sample length!
• Trending clear in progressive length of mean
• Picking any year on this basis is purely arbitrary
• Clear rationale needed for selection of base period!
• Hadley?
Mean national CWV averages (Oct - Jan)
6.2
6.3
6.4
6.5
6.6
6.7
6.8
6.9
7
7.1
30 25 20 15 10 5
Last x years (ending Jan 09)
°C
Climatology DESC presentation– Dave Parker
© Copyright EDF Energy plc. (including slides © Met Office) 21
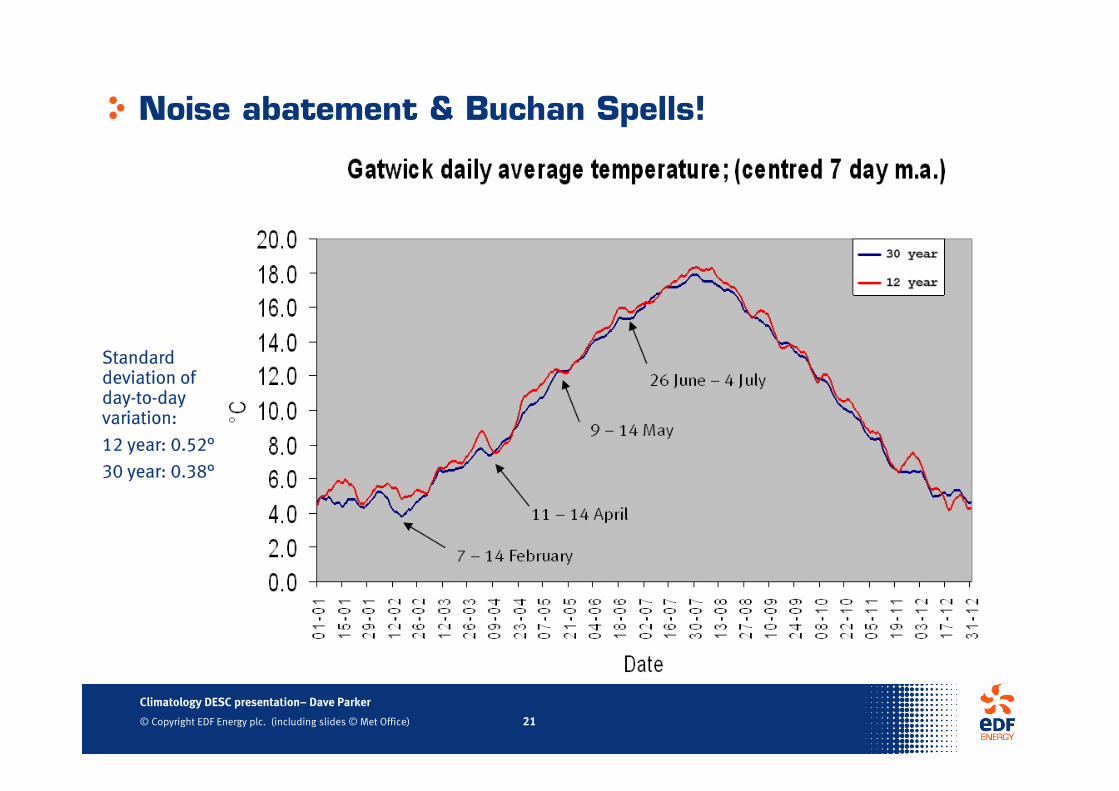
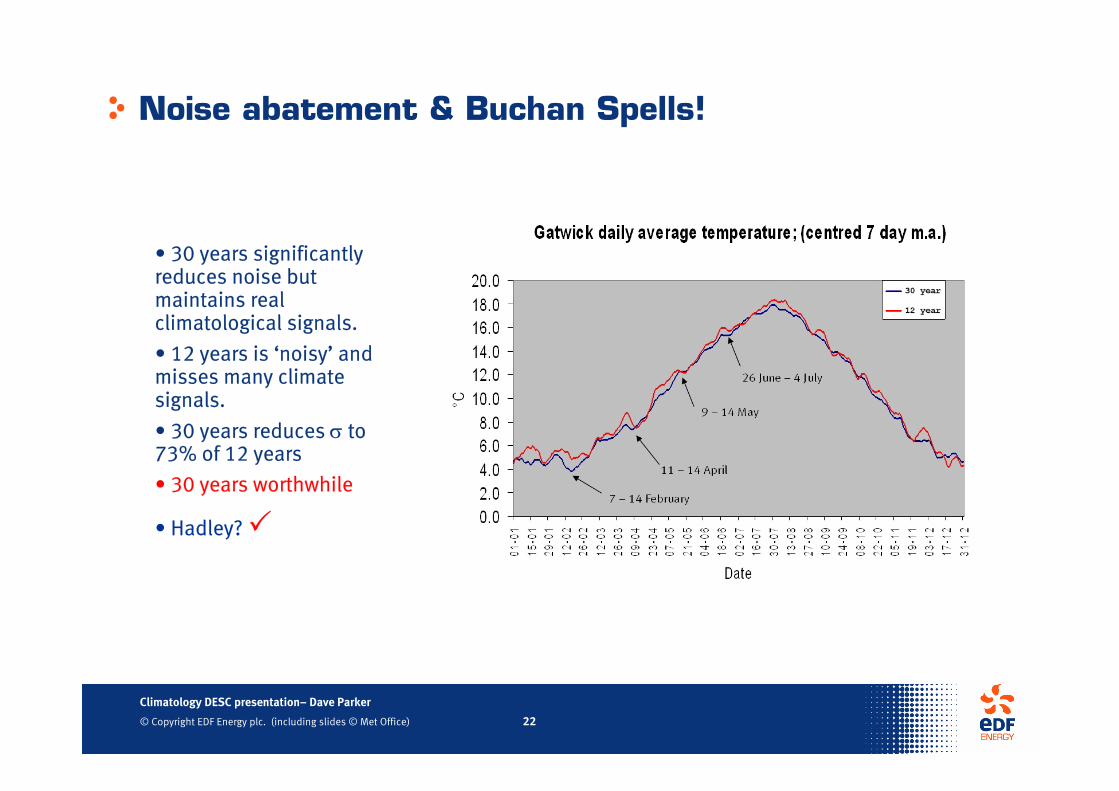
Noise abatement & Buchan Spells!
Standard deviation of day-to-day variation:
12 year: 0.52°
30 year: 0.38°
Climatology DESC presentation– Dave Parker
© Copyright EDF Energy plc. (including slides © Met Office) 22
Noise abatement & Buchan Spells!
• 30 years significantly reduces noise but maintains real climatological signals.
• 12 years is ‘noisy’ and misses many climate signals.
• 30 years reduces σ to 73% of 12 years
• 30 years worthwhile
• Hadley?
Climatology DESC presentation– Dave Parker
© Copyright EDF Energy plc. (including slides © Met Office) 23
Common approach?
• Desirable for industry to agree on methodology!
•Hadley?
Climatology DESC presentation– Dave Parker
© Copyright EDF Energy plc. (including slides © Met Office) 24
Final summary
• Uses 15 historical years and 15 forecast years based on DePreSys
• Adapts to either grid points or traditional weather stations (e.g. Heathrow)
• Copes with non-stationary climate!
• Can be shown to have greater skill (measured by RMS) than other methodologies
• Retains benefits of using 30 years data (reduced ‘noise’ and retained climate signals)
• Significant energy industry support – accepted & understood; avoids multiple versions of the climate!
• Non-arbitrary, science-based solution
• Fully meets Mod 218 requirements – combines historical and forecast data

Climatology DESC presentation– Dave Parker
© Copyright EDF Energy plc. (including slides © Met Office) 25
THANK YOU
QUESTIONS ?
Climatology DESC presentation– Dave Parker
© Copyright EDF Energy plc. (including slides © Met Office) 26
The Met Office’s Hadley Centre
Met Office work on climate changeThe Met Office Hadley Centre was opened in the early 1990s and is a world-leading climate centre. It has over 150 world-renowned climate experts who draw from the expertise of the supercomputer modellers at the Met Office.It is the UK’s official centre for climate change research — partly funded by Defra (the Department for Environment Food and Rural Affairs) and MOD — which provides in-depth information and advice to the Government on climate change issues.It undertakes studies of the global climate using similar, though more extensive, models of the atmosphere used for the prediction of weather conditions.It informs the work of the Intergovernmental Panel on Climate Change (IPCC) and was the leading UK contributor to the Fourth Assessment Review published in February 2007. It assembled much of the scientific basis of the Stern Review on the Economics of Climate Change (pub. October 2006). Its research also informs the UK Climate Impacts Programme on how climate change will impact at regional and national levels in the UK.It advises businesses and governments on the science of climate change and strategies for mitigation and adaptation.
Climatology DESC presentation– Dave Parker
© Copyright EDF Energy plc. (including slides © Met Office) 27
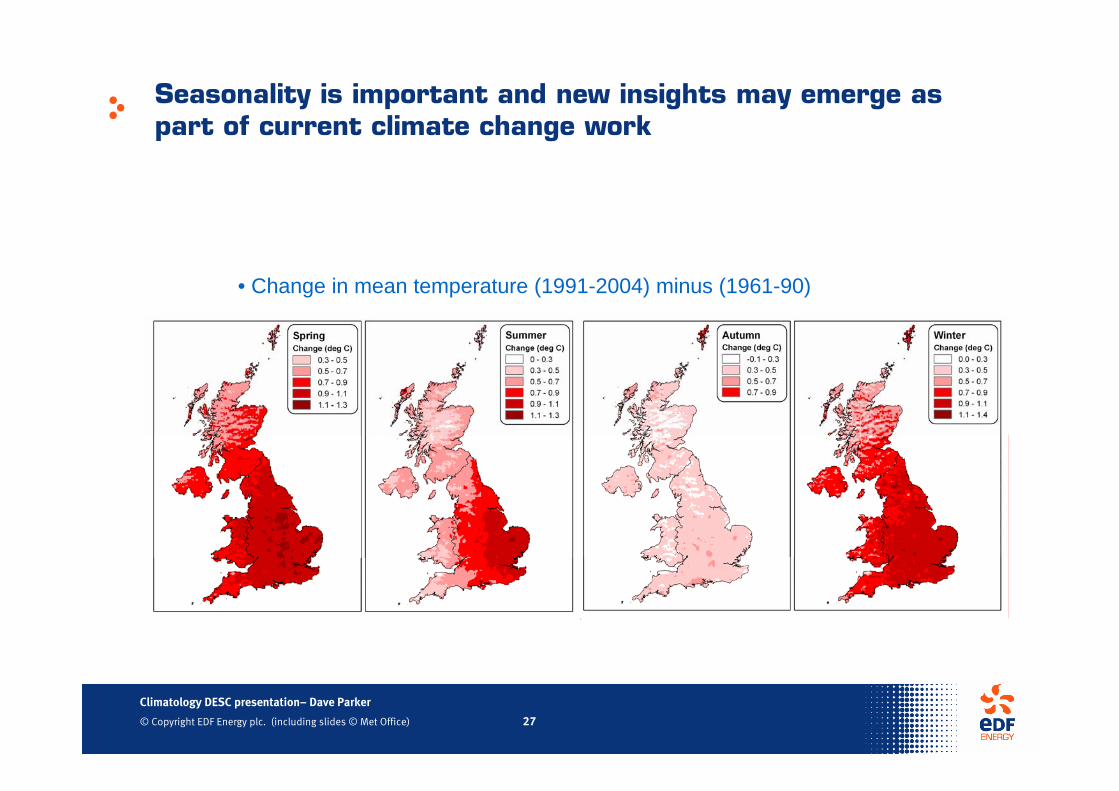
Seasonality is important and new insights may emerge as part of current climate change work
• Change in mean temperature (1991-2004) minus (1961-90)
Climatology DESC presentation– Dave Parker
© Copyright EDF Energy plc. (including slides © Met Office) 28
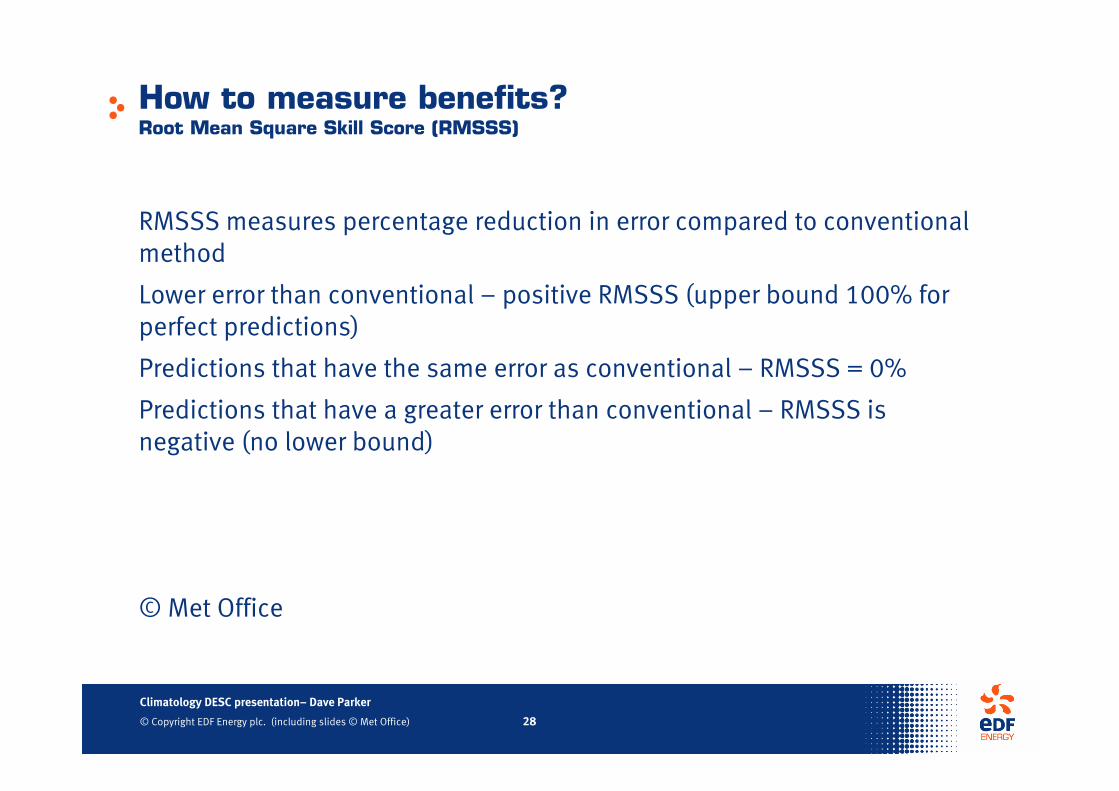
How to measure benefits?Root Mean Square Skill Score (RMSSS)
RMSSS measures percentage reduction in error compared to conventional method
Lower error than conventional – positive RMSSS (upper bound 100% for perfect predictions)
Predictions that have the same error as conventional – RMSSS = 0%
Predictions that have a greater error than conventional – RMSSS is negative (no lower bound)
© Met Office
Climatology DESC presentation– Dave Parker
© Copyright EDF Energy plc. (including slides © Met Office) 29
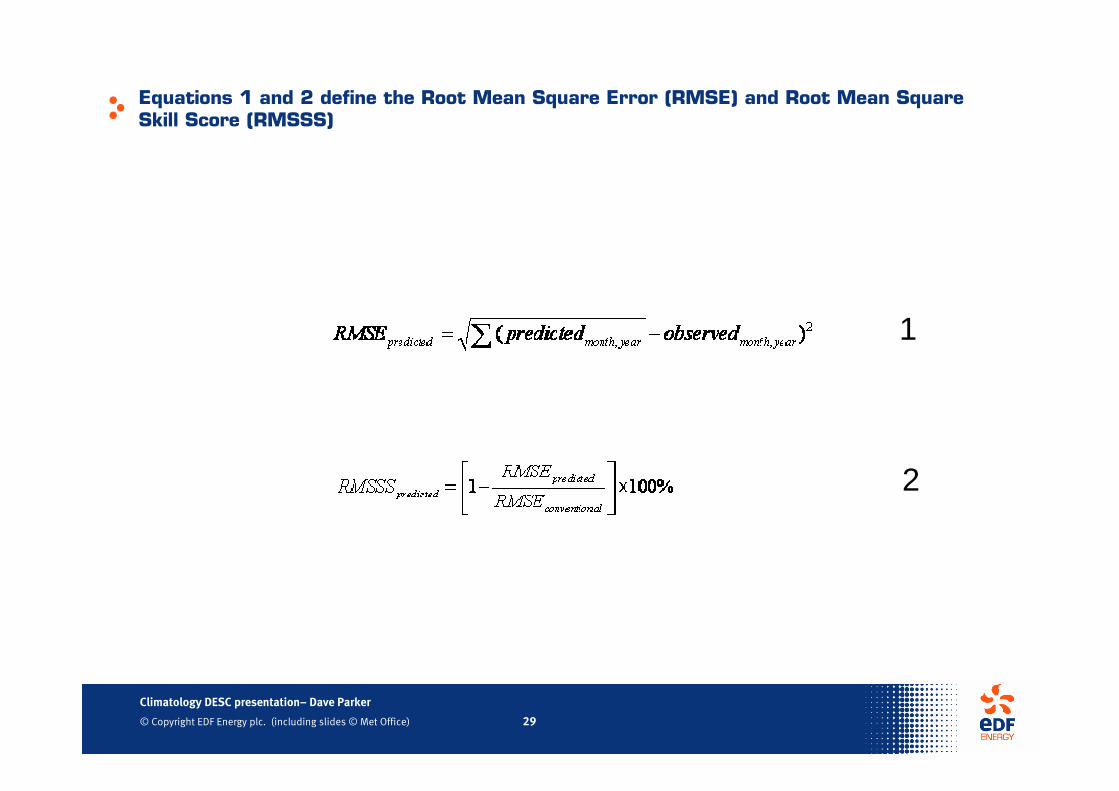
Equations 1 and 2 define the Root Mean Square Error (RMSE) and Root Mean Square Skill Score (RMSSS)
1
2