quarterly webinar: the utility of process data...challenge for a healthier louisiana grant program ....
TRANSCRIPT

CHALLENGE FOR A HEALTHIER LOUISIANA Grant Program
Quarterly Webinar: The Utility of Process Data
Audio is available via conference call only: 1-866-390-1828; Access Code: 778 3033 Please mute your telephone when not speaking. Thank you!

Agenda
1. Evaluation plan review
a) What and why b) Collecting and organizing the process data c) Using process data
2. Examples from grantees
Audio is available via conference call only: 1-866-390-1828; Access Code: 778 3033
Please mute your telephone when not speaking. Thank you!
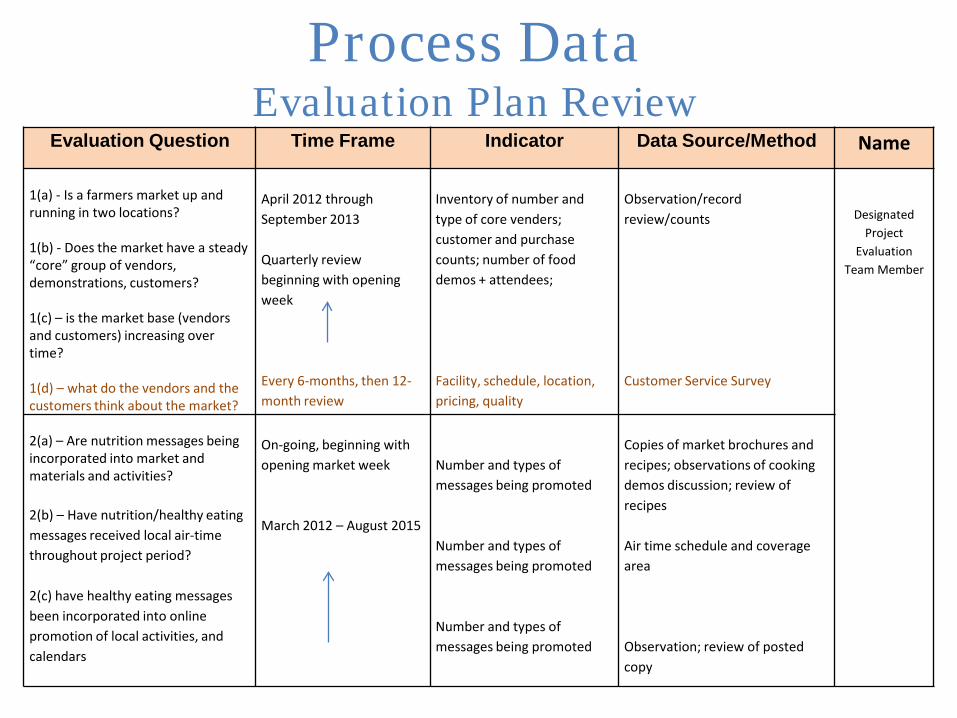
Process Data Evaluation Plan Review
Evaluation Question Time Frame Indicator Data Source/Method Name 1(a) - Is a farmers market up and running in two locations? 1(b) - Does the market have a steady “core” group of vendors, demonstrations, customers? 1(c) – is the market base (vendors and customers) increasing over time? 1(d) – what do the vendors and the customers think about the market?
April 2012 through September 2013 Quarterly review beginning with opening week Every 6-months, then 12-month review
Inventory of number and type of core venders; customer and purchase counts; number of food demos + attendees; Facility, schedule, location, pricing, quality
Observation/record review/counts Customer Service Survey
Designated Project
Evaluation Team Member
2(a) – Are nutrition messages being incorporated into market and materials and activities? 2(b) – Have nutrition/healthy eating messages received local air-time throughout project period? 2(c) have healthy eating messages been incorporated into online promotion of local activities, and calendars
On-going, beginning with opening market week March 2012 – August 2015
Number and types of messages being promoted Number and types of messages being promoted Number and types of messages being promoted
Copies of market brochures and recipes; observations of cooking demos discussion; review of recipes Air time schedule and coverage area Observation; review of posted copy

Process Data Evaluation Question
Time Frame Indicator Data Source/Method
Resp. Party
1(a) - Is a farmers market up and running in two locations? 1(b) - Does the market have a steady “core” group of vendors, demonstrations, customers? 1(c) – is the market base (vendors and customers) increasing over time? 1(d) – what do the vendors and the customers think about the market?
April 2012 Quarterly review beginning with opening week a 6-month, 12-month, then annual review
Inventory of number and type of core venders; customer and purchase counts; number of food demos + attendees Facility, schedule, location, pricing, quality
Observation/record review/counts Customer Service Survey
Farmer’s Market Team Lead

Process Data
Organizing Collectors of Date 4/6/2014_________
Location ________________ Hours ________________
ABC Farmer’s Market Vendor Sheet
Vendor Name Vendor Type Sales Vendor Comments
ABC FM Comments: Due 4/12

Process Data Organizing & Using
Site Time Date Vendors Food Craft $ales
Demonstration V F R W
Customers < 18 18-64 > 65
Notes
FM #1 John Rd.
8-12 4/6 7 9 3,000 1 100 100 20 Customer Satisfaction Survey-Demos
FM#1 Jim Rd.
9-2 6/8 8 3 2,000 1 1 50 200 100 Scheduled w/ Balloon Fest
FM #1 Joy Rd.
9-2 10/5 9 2 6,000 1 1 1 1 100 500 200 Added demonstrations
FM #1 Joy Rd.
8-12 1/4 7 4 500 1 25 100 100 Increased press releases
FM #1 Tom Rd.
7-11 4/5 6 12 2,000 25 50 50 Rain
FM #2
CHALLENGE FOR A HEALTHIER LOUISIANA Grant Program
Examples from Grantees
Audio is available via conference call only: 1-866-390-1828; Access Code: 778 3033 Please mute your telephone when not speaking. Thank you!

Andy Allen and Lyndsi Lambert
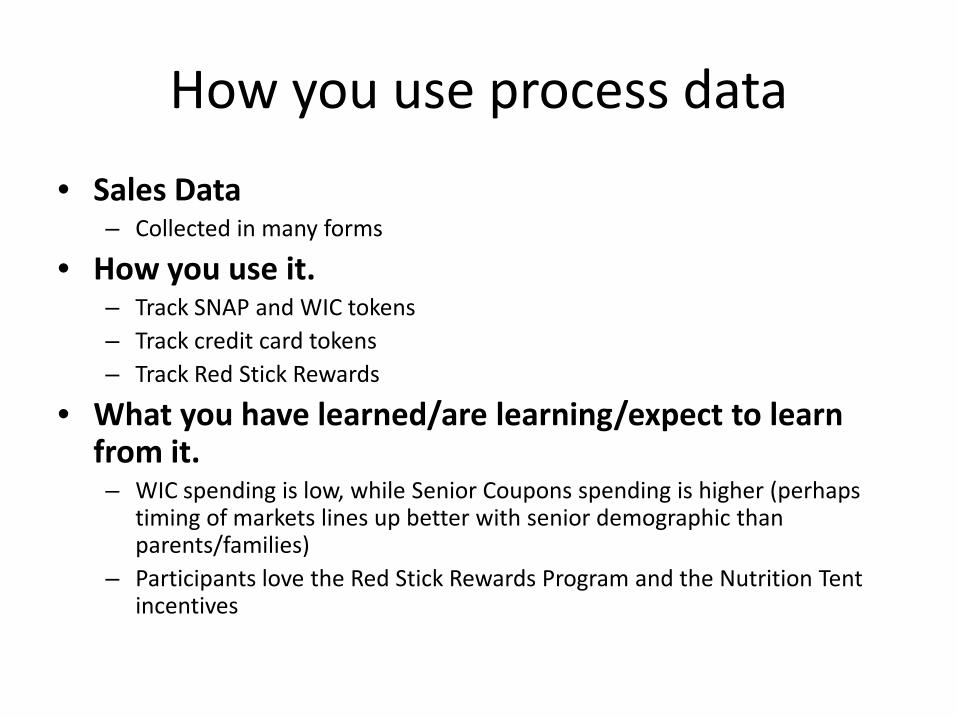
How you use process data • Sales Data
– Collected in many forms
• How you use it. – Track SNAP and WIC tokens – Track credit card tokens – Track Red Stick Rewards
• What you have learned/are learning/expect to learn from it. – WIC spending is low, while Senior Coupons spending is higher (perhaps
timing of markets lines up better with senior demographic than parents/families)
– Participants love the Red Stick Rewards Program and the Nutrition Tent incentives

Red Stick Farmers Market
(Tues-Thurs-Sat)
Mobile Farmers Market
Nutrition Tent
Tokens • #Credit tokens issued • #SNAP tokens issued • # RSR tokens issued
Other • #Fresh from the Market tokens issued
Income • POS (credit/debit, EBT) • Check • Cash ($1 fee, tokens) • Coffee/donations • Merchandise/promotional items (total)
Tokens • # Credit tokens issued • # SNAP tokens issued • # RSR tokens issued
Produce • Amount and type of products purchased from
farmers [MFM manager will track]
Total Sales • POS (Credit &SNAP tokens, credit card
produce sales) • Total sales (including farmers)
Activities • # Events with community partners
Dot Survey Data • Are you satisfied with the location, quality,
schedule, etc. of the market?
Quarterly Scanning Tool • # of customers • transportation • gender • # children
Rewards Card Program • # New Reward members • # Reward cards redeemed
Reward Member Survey Data Sign-up Survey: • Name & “best” contact info
(email/phone/address) • Zip code 1. How many fruits and vegetables do you eat
per week? 2. How many meals do you prepare at home? 3. How many times a week do you exercise?
Follow-up Survey: (end of market season) 1. How many fruits and vegetables do you eat
per week? 2. How many meals do you prepare at home? 3. How many times a week do you exercise? 4. What has been the most beneficial part of the
nutrition tent? (Rank: recipe cards, demos, activities, etc.)
5. Has shopping at the market changed your attitude about healthy eating? How?
Educational Materials • # Recipe Cards distributed • # Other nutrition materials distributed
Activities • # Events with community partners • # Fitness events at market • # Incentive classes for Reward members
Collected: Per Market
Monthly Seasonally Annually
Collected: Per Market Day
Monthly Seasonally Annually

Central Louisiana Local Foods Initiative
Central Louisiana Economic Development Alliance
Melissa Flurry

Process Data – Farm Entrepreneurship Coaching
• Tool: Web Portal and Database • How we use it.
– Coaches log-in online and enter coaching notes and sales information for each client coached
– Track client progress via sales growth versus prior period and coaching notes – Track client representation geographically – Look for common training needs to develop workshops or coaching/consultant
expertise
• Lessons learned – In reviewing the notes, we saw that most farm clients lacked more business skills
than anticipated – As a result, we have adapted our first steps with them. For example, rather than
starting with Quickbooks, we’re helping them start keeping a paper, farm log first. – We are also helping them develop crop plans for their farms.

BAS Database Coaching Notes

Growing LA
Marianne Cufone

How you use process data
• Type of tool. – Brief expectations survey
• How you use it. Examples: – Measure participants understanding – Measure participant interests – Identify ways to improve
• What you have learned/are learning/expect to learn from it. This could be in progress or anticipated. Examples: – Appropriateness of presenters. – Participants feel materials was useful and appropriate – What people would like to see in the future.


Presented by Brett Wallace, Landscape Architect
Cap i t al Area Pat hw ays Pro j ect

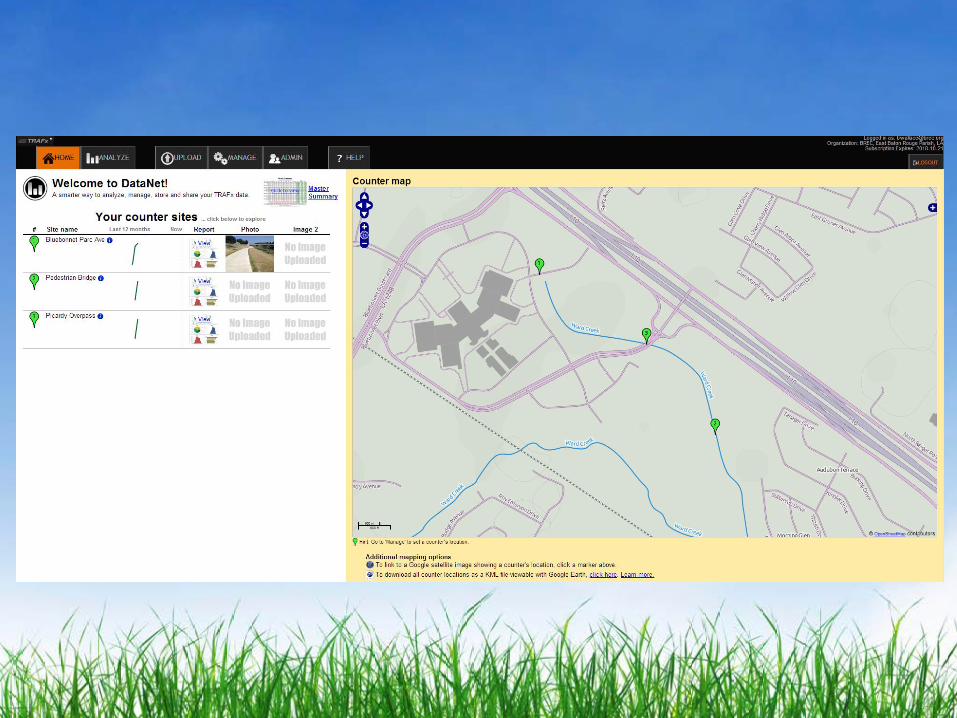
How you use process data • Type of tool.
– Infrared trail use counter by TRAFX– Three placed strategically along the trail.
• How will we use it? – Track the number of Uses of the trail. – Time stamps each use count. – Will allow us to track peak use for the following: hour of the day, day of
the week, seasonal usage, etc… • What do we expect to learn from it?
– What time of year sees the most use on the trail? – What days and times of day see the most use on the trail? – How do outside factors (Weather, Holidays, Special events, Etc…)effect
usage rates? – This data will help us to plan special events and help with the planning
and fundraising process for future segments of the trail.


Name of Project
Name of grantee/presenter
OUACHITA WELL Pam Barton: Project Director

The Evaluation Plan is Cornerstone

Mid Year Report Reflects the Evaluation Plan

Data Collection Continues the Reflection

Easy online tool

Generates a Random List

08: Healthy Living Club
Joan B Landry
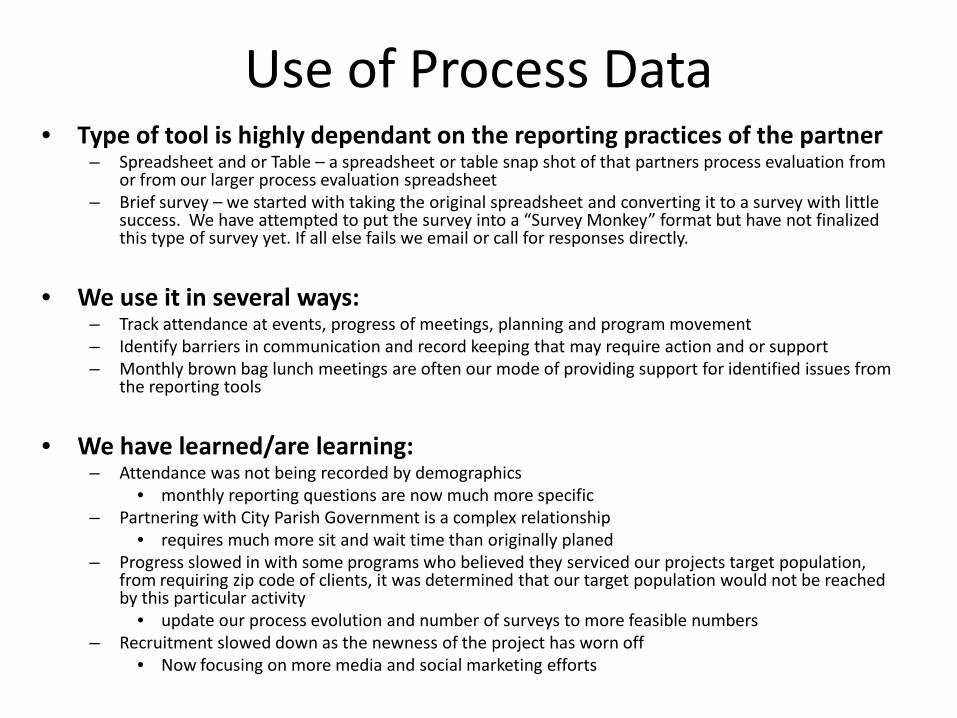
Use of Process Data • Type of tool is highly dependant on the reporting practices of the partner
– Spreadsheet and or Table – a spreadsheet or table snap shot of that partners process evaluation from or from our larger process evaluation spreadsheet
– Brief survey – we started with taking the original spreadsheet and converting it to a survey with little success. We have attempted to put the survey into a “Survey Monkey” format but have not finalized this type of survey yet. If all else fails we email or call for responses directly.
• We use it in several ways:
– Track attendance at events, progress of meetings, planning and program movement – Identify barriers in communication and record keeping that may require action and or support – Monthly brown bag lunch meetings are often our mode of providing support for identified issues from
the reporting tools
• We have learned/are learning:
– Attendance was not being recorded by demographics • monthly reporting questions are now much more specific
– Partnering with City Parish Government is a complex relationship • requires much more sit and wait time than originally planed
– Progress slowed in with some programs who believed they serviced our projects target population, from requiring zip code of clients, it was determined that our target population would not be reached by this particular activity
• update our process evolution and number of surveys to more feasible numbers – Recruitment slowed down as the newness of the project has worn off
• Now focusing on more media and social marketing efforts

Sample Excel/Table version This is what we started with and asked that each month they respond to each question (4b, etc.)
IV. Breastfeeding Coalition (#9)
4(a) - Train Lactation Consultants to Lead Mother/Baby Get-Togethers 4(b) - Host Mother/Baby Get-Togethers to provide education to mothers lead by Lactation Consultants. 4(c) - Purchase Breastfeeding Pumps for area Hospitals for use by NICU mothers while they await WIC 4(d) - Purchase Tent/Banner to provide place for breastfeeding mothers at public events 4(e) - Develop and print Signage, Billboard, and Brochures to educate the public on health benefits of breastfeeding.
4(a) - Lactation consultants trained to lead Mother/Baby Get-togethers 4(b) - Secured site for Mother/Baby get-togethers 4(c) - Local hospitals have Breastfeeding pumps available for NICU mothers awaiting WIC 4(d) - Tent/Banner displayed at public events for designated breastfeeding areas. 4(e) - Community is provided with information on the health benefits of breastfeeding for mother and baby
Mother/Baby Get-Togethers hosted in the community to provide education to breastfeeding mothers. NICU mothers receiving WIC have earlier access to Breastfeeding pumps Designated areas at public events for breastfeeding mothers Education to the community on the health benefits of breastfeeding to mother and baby

Project 10 GRoW
Kyle Hucke PhD

How we use process data
• Type of tool. – Fidelity Monitoring Form
• How you use it. – Assure quality classes at GRoW – Engage College age volunteers – Provide feedback to our providers
• What you have learned/are learning/expect to learn from it. – We will use it to track our promotion of the healthy challenges – We will track trends in class usage (gender or age) – We have learned that by keeping the form simple we can get new
volunteers started right away with minimal training

Write In Instructor Name: Activity Description:
No. Males __ No. Females ___
Age Group Number < 10 ______ >=10 ______
Was the dietary healthy challenge mentioned during this activity? (Tally each instance)
Was the physical activity healthy challenge mentioned during this activity? (Tally each instance)
Describe Physical Activity Exercise Eg. Slow to Mod. SMPA or Mod to Vigor. MVPA
Time Record: If a physical activity, record start, end, total Time. If healthy eating activity record start, end, and total time of nutrition instruction
Was the facilitator Prepared? Did they coordinate lessons? Have materials needed.
Were youth engaged?
Activity 1
M: ____ F: _____ Total: _____
< 10 ______ >=10 ______
B: E: Total:
GRoW Fidelity Monitoring Tool

How we use process data
• Type of tool. – Parent Survey – Focus Groups
• How you use it. – Identify Activity Preferences – Engage Community Members – Provide feedback to our providers
• What you have learned/are learning/expect to learn from it. – Identify topics for our parent seminars/classes – Choose activities for the kids – Identify barriers to participation

Louisiana Public Health Institute Erin Fitzgerald

How Fit NOLA uses Process Data • Park Programming
Attendance Sheets • Usage:
– Track attendance and demographics at park programming
• What you have learned/are learning/expect to learn from it: – Determining which classes and
class times are most popular – Getting a good idea of who is
attending the classes. – Will help with next iteration of
schedule – Compare with SOPARC data
• Process Evaluation Spreadsheet
• Usage: – Identify progress on project goals
and objectives
• What you have learned/are learning/expect to learn from it: – Helping us keep on track and
make sure that we are consistently addressing each objective and goal.
– Good communication tool – Helps us to adjust goals
(example: smoking and alcohol ban)

Programming Attendance Sheets

Process Monitor Chart

Questions?
Audio is available via conference call only: 1-866-390-1828; Access Code: 778 3033 Please mute your telephone when not speaking. Thank you!