ies webinar: utility bill data: ap secrets for success
TRANSCRIPT
Utility Bill Data: AP Secrets For SuccessJuly 30, 2015
Presenters: Jami Marler, Product Management Director and Sheila Johnston, Product Manager Data and Analytics, both with Ecova

A Bill Unlike Any Other
Not PO based
Require manual GL mapping
Vary greatly across providers
– Bill systems
– Bill periods
– Bill level detail
Ripe with savings opportunity

Agenda
How to unlock the savings
Common billing errors unique to utility bills
3 steps for collecting and reviewing utility data
Best practices for accurate, defensible utility budgets
Above and beyond

Are Both Your Cost AND Usage Data Getting Captured? Complexity breeds error and opportunity
– Missed bills
– Late fees and shut-offs
– Overpayment
Data collection and analysis provides visibility
– Spot overlapping services dates
– Billing and meter errors
– Spikes in consumption and demand
– Usage anomalies
lab
or
mat
eria
ls u
tilit
ies

Overlaps in Billing Period
Previous Bill Current Bill
CLIENT, INCPO BOXUNITED STATES
CLIENT, INCPO BOXUNITED STATES

Cost Increase from Prior Bill
Previous Bill Current Bill

One Time Charges

Deposit and Initiative Fee

Meter Number Anomaly
Previous Bill Current Bill
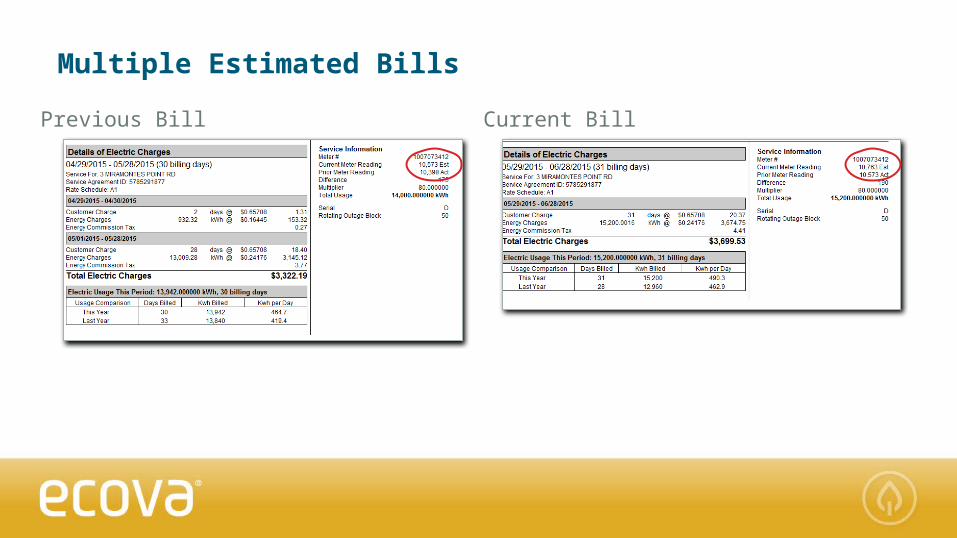
Multiple Estimated Bills
Previous Bill Current Bill

Unit Cost Increase
Previous Bill Current Bill

How Data Can Go Wrong
3Steps to Collect and Review Data

1Capture down to the line item across all utility bills

2 Conduct pre-payment audits

3Segment Avg
Avg kWh/Sqft
Square Footage Range 890 to 59,500 SqftElectric Sites Annual kWh/Sqft – Mercantile (Retail) – Medium Box (407 sites)
50
40
30
20
10
Create a baseline to support trend analysis

Best Practices for Accurate, Defensible Utility Budgets
How to use good data to create budgets: Begin with specific baselines
Track accruals against budget
Track variances by both cost and use
Use variance analysis to “manage down”
$(600,000) $(400,000) $(200,000)
$- $200,000 $400,000 $600,000 $800,000
Feb Mar Apr May J un J ul Aug Sep Oct Nov Dec J an
Electric Variance Drivers
Use Driver
UC Driver
Variance
Electric Variance Drivers
Electric vs Natural Gas as a Percentage of Annual Spend by Month

Above and Beyond
“GOOD DATA builds confidence, creates strategic insights and delivers bottom-line savings.”

Summary
Inaccurate or improperly managed bill data can hinder results
Reliable data is key
Best practice approaches can provide visibility
Join Ecova’s Solution demo August 6th!

Upcoming Webinars
SOLUTIONS
Experience a Simpler Workday with Ecova’s Bill Processing and Analysis Solution – LIVE DEMO August 6th, 11A PST

Q&A
