protelindo - ptsmn.co.id · these materials have been prepared by pt sarana menara nusantara, tbk....
TRANSCRIPT

PROTELINDOPT. SARANA MENARA NUSANTARA, TBK. (TOWR)
Indonesia’s Premier Tower Company4Q 2015 Results Presentation

These materials have been prepared by PT Sarana Menara Nusantara, Tbk. (the “Company”) and have not been independently
verified. No representation or warranty, expressed or implied, is made and no reliance should be placed on the accuracy, fairness or
completeness of the information presented or contained in these materials. Neither the Company nor any of its affiliates, advisers or
representatives accepts any liability whatsoever for any loss arising from any information presented or contained in these materials.
The information presented or contained in these materials is subject to change without notice and its accuracy is not guaranteed.
These materials contain statements that constitute forward-looking statements. These statements include descriptions regarding the
intent, belief or current expectations of the Company or its officers with respect to the consolidated results of operations and
financial condition of the Company. These statements can be recognized by the use of words such as “expects,” “plan,” “will,”
“estimates,” “projects,” “intends,” “outlook” or words of similar meaning. Such forward-looking statements are not guarantees of
future performance and involve risks and uncertainties, and actual results may differ from those in the forward-looking statements as
a result of various factors and assumptions. The Company has no obligation and does not undertake to revise forward-looking
statements to reflect future events or circumstances.
These materials are for information purposes only and do not constitute or form part of an offer, solicitation or invitation to buy or
subscribe for any securities of the Company in any jurisdiction, nor should these materials or any part of them form the basis of, or be
relied upon in any connection with, any contract, commitment or investment decision whatsoever.
Disclaimer
1

Agenda
2
Financial Results
Operational Performance
2015 Guidance and Results
Achievements and Subsequent Events
Change in Accounting Policy
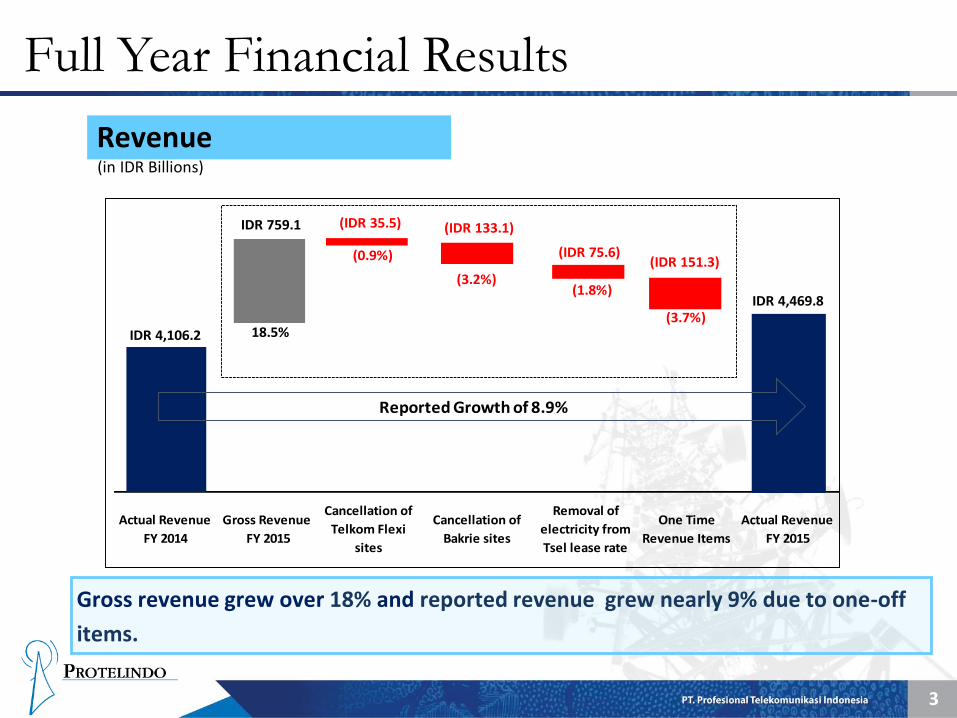
Full Year Financial Results
Revenue(in IDR Billions)
3
Actual Revenue
FY 2015
Removal of
electricity from
Tsel lease rate
Actual Revenue
FY 2014
Gross Revenue
FY 2015
Cancellation of
Bakrie sites
Cancellation of
Telkom Flexi
sites
One Time
Revenue Items
IDR 4,106.2
IDR 4,469.8
Reported Growth of 8.9%
(IDR 133.1)
(IDR 75.6)
IDR 759.1
18.5%
(3.2%)(1.8%)
(IDR 35.5)
(0.9%) (IDR 151.3)
(3.7%)
Gross revenue grew over 18% and reported revenue grew nearly 9% due to one-off
items.

Full Year Financial Results
EBITDA(in IDR Billions)
4
Actual EBITDA
FY 2015
Removal of
electricity from
Tsel lease rate
Actual EBITDA
FY 2014
Gross EBITDA
FY 2015
Cancellation of
Bakrie sites
Cancellation of
Telkom Flexi
sites
One Time
Revenue Items
IDR 3,418.4
IDR 3,775.7
Reported Growth of 10.5%
6(IDR 112.4)
(IDR 14.1)
IDR 641.5
18.8%
(3.3%) (0.4%)
(IDR 30.0)
(0.9%)
(3.7%)
(IDR 127.7)
Gross EBITDA grew 18.8% and reported EBITDA grew 10.5%.

4Q 2015 Financial Results
Revenue(in IDR Billions)
5
Actual Revenue
4Q 2015
Actual Revenue
4Q 2014
Gross Revenue
4Q 2015
Cancellation of
Telkom Flexi
sites
One Time 4Q15
Revenue Items
IDR 1,031.3
IDR 1,196.0
Reported Growth of 16.0%
IDR 230.9
22.4%
(IDR 7.0)
(0.7%)
(IDR 59.2)
(5.7%)
Reported revenue growth has accelerated to 16.0% as one-off items
roll-off from Year-on-Year comparison.

4Q 2015 Financial Results
EBITDA(in IDR Billions)
6
Actual EBITDA
4Q 2015
Actual EBITDA
4Q 2014
Gross EBITDA
4Q 2015
Cancellation of
Telkom Flexi
sites
One Time 4Q15
Revenue Items
IDR 878.3
IDR 1,031.1
Reported Growth of 17.4%
6 IDR 209.1
23.8%
(IDR 6.1)
(0.7%)
(5.7%)
(IDR 50.2)
Reported EBITDA growth has accelerated to 17.4% as one-off items
roll-off from Year-on-Year comparison.

Tower and Tenant Growth
Towers
7
Additional
Towers
Dismantled
Sites
Actual Towers
FY 2014
Actual Towers
FY 2015
11,595
12,237
Reported Growth of 5.5%
(36)678
5.8%
(0.3%)
• Nearly 700 tower additions year-on-year.
• Surpassed the 12,000 tower milestone.

Tower and Tenant Growth
Tenants
8
• Tenant additions grew over 5%.
• Does not include 1,142 additional revenue generating leases for additional equipment.
Cancellation of
Telkom Flexi sites
Actual Tenants
FY 2015
Gross Tenant
Additions
Actual Tenants
FY 2014
20,138
21,038
Reported Growth of 4.5%
(185)1,085
5.4%
(0.9%)

9
2015 Guidance and Results
Guidance Results
Revenue * 4,311 – 4,599 4,470
EBITDA * 3,589 – 3,829 3,776
* In IDR Billions

Debt Profile: Long Tenors, Low Margins
Structure Maturity Date Currency ⁽¹⁾Amount Outstanding Amount Outstanding
(in Original Currency) (in USD Millions)
7-Yr Amortizing Dec 2018 IDR 720.2 52.2
7-Yr Amortizing Dec 2019 IDR 918.5 66.6
3-Yr Bonds Feb 2017 IDR 1000.0 72.5
1-Yr Bullet Aug 2016 IDR 181.0 13.1
10-Yr Bonds Nov 2024 USD 138.4 138.4
5-Yr Bullet Nov 2019 USD 340.0 340.0
5-Yr Bullet Nov 2019 EUR 40.0 43.7
10-Yr Bullet Nov 2022 EUR 14.7 16.0
TOTAL 742.5
Average interest rate climbed to 5.15% at the end of FY 2015 from 5.00% at the end of FY 2014 due to increases in Jibor and Libor.
10
⁽¹⁾ IDR in billions; EUR/USD in millions

Achievements and Subsequent Events
Acquisition:
iForte: Acquired over 500 micro-cell towers, 7 BTS hotels and 750 kilometersof fiber optic network
XL Axiata Towers
• Signed Purchase Agreement to acquire 2,500 Towers with 3,750 Tenants
• Top 3 Tenants: XL, Hutch and Telkomsel
• Projected Total Towers at Close: Protelindo will own over 14,700 towers
• Projected Total Tenants at Close: Protelindo will have over 24,700 tenants
• Purchase Price: IDR 3,568 Billion
• Financed primarily with debt (IDR 3,000 Billion) and cash (IDR 568 Billion)
• Projected Net Debt to RR EBITDA at Close: ~2.0x
11

Achievements and Subsequent Events
Change in Credit Ratings:
S&P Rating upgraded twice from BB to BB+ to BBB-
• One of only three companies rated Investment Grade in Indonesia(Protelindo, Telkomsel, Astra)
• Currently rated higher than Crown Castle and SBA
Moody's Rating upgraded from Ba2 to Ba1
• Same rating as Crown Castle; one notch higher than SBA
Fitch Rating International upgraded from BB to BB+
Fitch Rating Indonesia upgraded from AA- to AA+
12

Regulator-Driven Change in Accounting Policy
13
• Until 2015, Protelindo/SMN used the Fixed Asset Accounting Policy (PSAK 16) whereby companies:
1. Depreciated tower assets and
2. Performed required revaluations every 2 years through a specific equity account separate from Retained Earnings.
• All other publicly traded tower companies in Indonesia use the Investment Property Accounting Policy (PSAK 13) whereby companies:
1. Do not depreciate tower assets and
2. Perform annual revaluations of towers through the Profit and Loss Statement.

Regulator Driven Change in Accounting Policy
14
• OJK (Indonesia’s Financial Services Authority) ruled in September 2015 that all publicly traded tower companies should use PSAK 13.
• In line with the new regulation SMN has used PSAK 13 for 2015 accounts, and restated 2014 results and 2013 ending balances.
• The main impact is to increase net Income and retained earnings.
• This accounting policy applies only to SMN’s commercial books, not its tax books. While deferred taxes will increase, there will be no impact on cash taxes paid.

Impact of Accounting Changes
Net Profit After Tax(in IDR Billions)
15
NPAT 2015
Investment
Property
NPAT 2015
Fixed Asset
Depreciation
2015
Gain on
Revaluation
2015
Deferred Tax
adjusted
IDR 1,111.7
IDR 2,958.4
Reported Growth of 166.1%
IDR 830.6
IDR 1,631.7 (IDR 615.6)
Net Profit After Tax 2015 increased 166.1% reflecting tower revaluation and
no depreciation.

Impact of Accounting Changes
Retained Earnings(in IDR Billions)
16
RE 2015
Investment
Property
RE 2014
Fixed Asset
NPAT 2015
Fixed Asset
Gain on
Revaluation
previous years
Deferred Tax
adjusted
Depreciation
and Goodwill
adjusted 2015
Gain on
Revaluation
2015
IDR 1,858.3
IDR 7,161.0
Reported Growth of 285.4%
IDR 1,111.7
IDR 2,297.9
(IDR 615.6)
IDR 877.0
IDR 1,631.7
Retained Earnings 2015 increased 285.4% reflecting tower revaluation and no depreciation.