11 februari, 2019 · hariyanto wijaya cfa, cpa (aust), cmt ... (towr) pertimbangkan sumber...
TRANSCRIPT

To subscribe to our Daily Focus, please contact us at [email protected]
Mirae Asset Sekuritas Indonesia
11 Februari, 2019
Market Index
Last Trade Chg (%) MoM YoY
JCI 6,521.7 -0.2 2.8 0.5
MSCI Indonesia 26.9 -1.1 2.0 -4.8
MSCI EM 1,036.0 -0.6 4.1 -8.8
HANG SENG 27,946.3 -0.2 5.0 -5.1
KOSPI 2,177.1 0.0 4.9 -7.9
FTSE 7,071.2 0 2.5 0.0
DJIA 25,106.3 -0.3 4.9 4.0
NASDAQ 7,298.2 0.1 4.5 6.0
Valuation
2018F P/E (x) P/B (x) ROE (%)
JCI 15.7 2.3 17.6
Key Rates
Last Trade Chg (bps) MoM YoY
BI 7-Day RR 6.00 0 25 -100
3yr 7.36 4 -48 162
10yr 7.88 6 -10 150
FX
Last Trade Chg (%) MoM YoY
USD/IDR 13,955 -0.1 -1.2 2.7
USD/KRW 1,124 0.0 0.7 3.6
USD/JPY 110 -0.1 1.2 1.0
USD/CNY 7 -0.2 -2.6 6.4
Commodities
Last Trade Chg (%) MoM YoY
WTI 52.7 0.2 2.2 0.6
Gold 1,316.6 0.5 2.0 -0.5
Coal 97.2 -0.6 -0.6 -3.7
Palm Oil 2,190.0 -1.2 4.1 -12.2
Rubber 132.1 0.0 4.7 3.4
Nickel 12,570.0 -3.2 11.7 -3.1
Copper 6,246.0 -0.5 5.8 -8.8
Tin 21,050.0 0.5 5.1 -1.8
JCI Index VS MSCI Emerging Markets
Market commentary
Hariyanto Wijaya CFA, CPA (Aust), CMT ([email protected])
IHSG ditutup lebih rendah -0,2% pada hari Jumat di balik CAD 4Q18 yang lebih
tinggi dari perkiraan (CAD 4Q18 -3,57% dari PDB; CAD FY18 -2,98% dari PDB,
yang hampir melampaui CAD FY yang diijinkan 3,0%). Kami memperkirakan IHSG
akan trade mixed hari ini. Pertamina menerapkan harga yang lebih rendah untuk
sebagian besar bahan bakar non-subsidi efektif 10 Februari 2019 setelah crude oil
prices turun dan rupiah yang lebih kuat membuat impor lebih murah. Menurut
kami harga bahan bakar yang lebih rendah positif untuk konsumen Indonesia.
Menurut kami, Ramayana (RALS IJ, BUY, TP: IDR1.800), Ace Hardware (ACES IJ,
BUY, TP: IDR1.900), Gudang Garam (GGRM IJ, BUY, TP: IDR101.000) dan HM
Sampoerna (HMSP IJ, BELI, TP: IDR4.300) seharusnya menjadi good counter
untuk bahan bakar yang lebih rendah.
Indeks AS ditutup bervariasi pada hari Jumat di balik kekhawatiran AS dan Cina
mungkin tidak dapat menyelesaikan sengketa perdagangan pahit mereka
sebelum batas waktu 1 Maret, sebagaimana dilaporkan Wall Street Journal pada
hari Jumat bahwa AS dan China jauh dari kesepakatan sebelum putaran
pembicaraan perdagangan berikutnya di Beijing minggu ini. Dow turun 0,25%,
S&P 500 naik 0,07%, sedangkan Nasdaq naik 0,14%.
Macro update – 4Q18 GDP Review: Ability to preserve stability
Mangesti Diah Sulistiani ([email protected])
- Pertumbuhan PDB 4Q18 Indonesia yang lebih baik dari perkiraan sebesar
5,18% YoY (vs konsensus 5,10% YoY); FY2018 pertumbuhan PDB 5,17% YoY (vs
konsensus 5,15% YoY).
- Konsumsi rumah tangga (+5,1% YoY): secara luas tetap stabil karena stabil-
nya kenaikan dalam pendapatan rumah tangga, inflasi yang sangat rendah,
indikator terkait konsumsi yang stabil, kontrol pemerintah terhadap harga listrik
dan BBM, serta distribusi cash.
- Pengeluaran pemerintah (+4,6% YoY): run rate pengeluaran anggaran negara
untuk target setahun penuh berada di 99,2% pada Desember 2018 (vs 94,1%
pada Desember 2017) –laju tercepat selama empat tahun terakhir yang kita
amati. Kami sangat yakin bahwa program amnesti pajak tahun 2016-2017 mulai
membuahkan hasil.
- Investasi (+6,0% YoY): Kami mengaitkan pertumbuhan investasi yang
melambat dengan pembatasan impor barang modal. Kami perkirakan tren
pertumbuhan investasi yang soft menjelang pemilihan presiden (17 April).
- Trade (ekspor +4,3%, impor +7,1% YoY): Trade war yang sedang berlangsung
antara AS dan Cina kemungkinan akan menjaga ketatnya perdagangan global.
Selain itu, pertumbuhan ekonomi China yang moderat telah memberikan
tekanan pada harga komoditas global.
- Kami tetap konstruktif pada fundamental ekonomi Indonesia yang didukung
oleh ketahanan domestik yang kuat. Kami sangat yakin perekonomian Indonesia
relatif terisolasi dari guncangan eksternal. Karena itu, kami memperkirakan
ketahanan ekonomi Indonesia untuk mendapatkan perhatian investor, ke depan.
550
800
1,050
1,300
1,550
4,000
5,000
6,000
7,000
01/16 07/16 01/17 07/17 01/18 07/18 01/19
JCI MSCI EM (pt) (pt)

11 Februari, 2019
2
Embun Pagi
Mirae Asset Sekuritas Indonesia
Mirae Asset Sekuritas Indonesia cartoon
11 Februari, 2019
3
Embun Pagi
Mirae Asset Sekuritas Indonesia
Local flashes
TOWR: Sarana Menara Nusantara (TOWR) pertimbangkan sumber pendanaan lain selain
perbankan. PT Sarana Menara Nusantara Tbk (TOWR) berhasil memperoleh fasilitas
pinjaman dari Sumitomo Mitsui Banking Corporation (SMBC) Cabang Singapura senilai 5,67
miliar yen atau sekitar Rp 721,03 miliar. Saat ini Sarana Menara Nusantara masih bertumpu
pada sumber pendanaan berupa fasilitas pinjaman dari perbankan lantaran fleksibilitasnya
yang unggul dibandingkan sumber pendanaan lainnya seperti obligasi dan penerbitan saham
baru. “Ke depannya mungkin ada lagi pemberian fasilitas pinjaman perbankan kepada kami,
tapi belum ada yang konkrit untuk disampaikan saat ini,” ungkap Adam. Wakil Direktur
Utama Sarana Menara Nusantara (Kontan)
UNVR: Unilever Indonesia (UNVR) keluarkan produk terbaru untuk genjot penjualan.
Terbaru UNVR mengeluarkan produk perawatan tubuh khusus pria dengan brand AXE Men’s
Grooming. Produk ini merupakan rangkaian produk perawatan tubuh khusus pria yang
terdiri dari body spray, deodorant, body wash, facial wash, dan produk hairstyling. Senior
Brand Manager AXE Raditya Beer mengatakan, peluncuran rangkaian produk AXE Men's
Grooming ini merupakan upaya Unilever Indonesia merespon tingginya permintaan akan
produk perawatan tubuh khusus pria di Indonesia. dengan diluncurkannya rangkaian produk
AXE Man’s Grooming tentu pihaknya menargetkan adanya peningkatan kontribusi brand
AXE terhadap pendapatan Unilever Indonesia di tahun 2019. (Kontan)
BIRD: Taksi listrik Blue Bird antusias tunggu Perpres kendaraan listrik. Peraturan Presiden
(Perpres) mengenai kendaraan listrik yang diharapkan selesai pada akhir Januari 2019
nyatanya hingga awal Februari 2019 belum juga jadi. PT Blue Bird Tbk (BIRD) sebagai salah
satu perusahaan dibidang transportasi juga tengah menunggu Perpres tersebut. Blue Bird
juga dikabarkan akan meluncurkan taksi listrik jika nantinya Perpres tersebut ketok palu.
Head of Investor Relation PT Blue Bird Michael Tene mengungkapkan bahwa pihaknya
tengah menunggu Perpres Kendaraan Listrik. (Kontan)
WOOD: Pabrik baru WOOD bakal beroperasi di kuartal II-2019 ini. Produsen mebel, PT
Integra Indocabinet Tbk (WOOD) diketahui sedang menambah menambah fasilitas produksi
untuk pembuatan produk baru, seperti tirai kayu atau wooden window blind hingga furnitur
kayu dengan kombinasi metal. Untuk itulah WOOD kembali membangun fasilitas pabrik baru
dengan memanfaatkan lahan yang telah dibeli dari hasil IPO pada 2017 lalu. Wang Sutrisno,
Direktur Keuangan WOOD mengatakan pabrik tersebut bakal rampung tahun ini. "Untuk
wooden blind realisasinya kuartal dua tahun 2019 ini beroperasi," (Kontan)
GHON: GHON optimistis pasca diakuisisi TBIG bisnisnya tumbuh positif. Proses
pengambilalihan PT Gihon Telekomunikasi Indonesia Tbk (GHON) oleh PT Tower Bersama
Infrastructure Tbk (TBIG) akhirnya rampung, lewat proses penawaran tender wajib. TBIG
menjadi pengendali mayoritas dengan total kepemilikan saham 50,43% atau sebanyak
277,34 juta. Selanjutnya, sebanyak 198,39 juta saham GHON atau 36,07% dimiliki Rudolf
Parningotan Nainggolan yang juga Direktur Utama GHON. Rudolf mengatakan TBIG sebagai
pengendali, pihaknya optimis dengan pertumbuhan bisnisnya. Menurutnya, manajemen TBIG
sangat bijaksana menerapkan standar manajemen secara terukur. "Sehingga target pasti
akan tercapai di tahun 2019 ini (Kontan)
BBNI: DPLK BNI targetkan pertumbuhan dana kelolaan 15% pada 2019. Dana pensiun
lembaga keuangan (DPLK) Bank Negara Indonesia (BNI) menargetkan dana kelolaannya naik
minimal 15% secara year on year (yoy) pada 2019. Sebelumnya, per 2018, dana kelolaan
DPLK BNI adalah sebesar Rp 21,44 triliun, naik 4,18% dibanding dana kelolaan per 2017 yang
sebesar Rp 20,45 triliun. Untuk mencapai target tersebut, Pemimpin Unit DPLK BNI
Saktimaya Murti mengatakan, pihaknya telah merancang dua strategi utama. Pertama,
pendalaman pasar melalui literasi berkelanjutan. Kedua, perluasan cakupan pemasaran untuk
memudahkan masyarakat mengakses layanan DPLK BNI. (Kontan)
11 Februari, 2019
4
Embun Pagi
Mirae Asset Sekuritas Indonesia
Technical analysis
Tasrul +62-21-515-1140 [email protected]
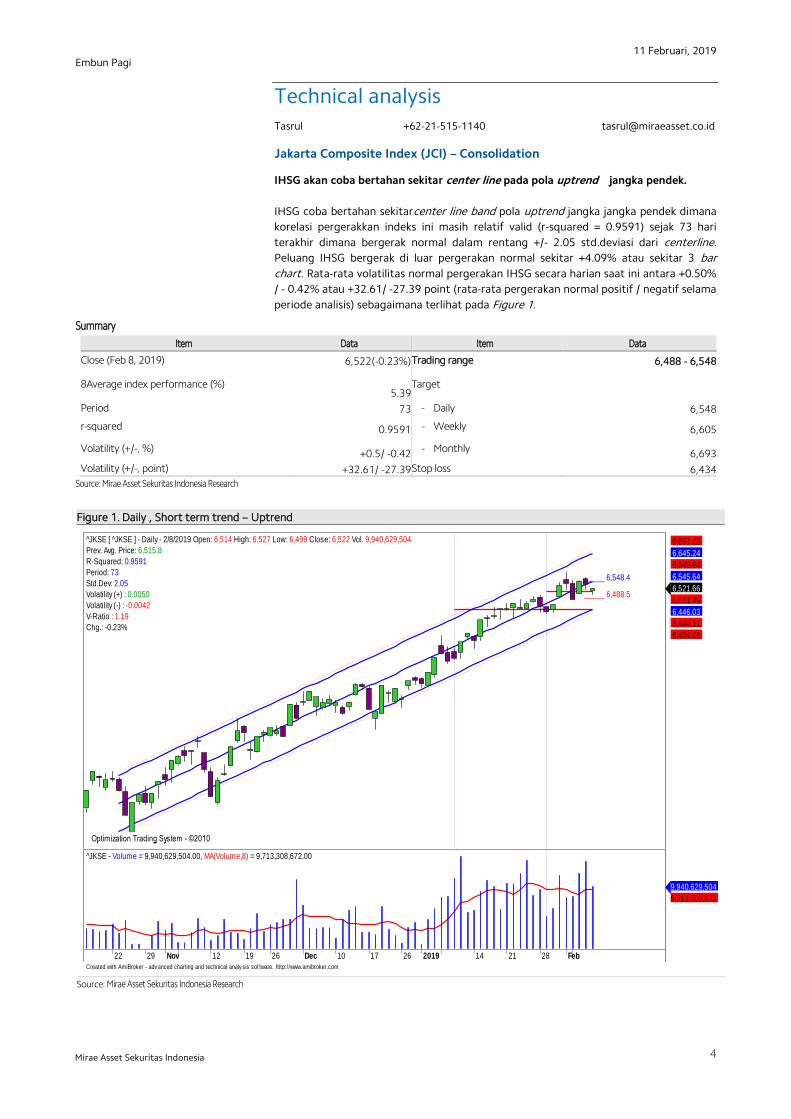
Jakarta Composite Index (JCI) – Consolidation
IHSG akan coba bertahan sekitar center line pada pola uptrend jangka pendek.
IHSG coba bertahan sekitarcenter line band pola uptrend jangka jangka pendek dimana
korelasi pergerakkan indeks ini masih relatif valid (r-squared = 0.9591) sejak 73 hari
terakhir dimana bergerak normal dalam rentang +/- 2.05 std.deviasi dari centerline.
Peluang IHSG bergerak di luar pergerakan normal sekitar +4.09% atau sekitar 3 bar
chart. Rata-rata volatilitas normal pergerakan IHSG secara harian saat ini antara +0.50%
/ - 0.42% atau +32.61/ -27.39 point (rata-rata pergerakan normal positif / negatif selama
periode analisis) sebagaimana terlihat pada Figure 1.
Summary
Item Data Item Data
Close (Feb 8, 2019) 6,522(-0.23%) Trading range 6,488 - 6,548
8Average index performance (%)
5.39 Target
Period 73 - Daily 6,548
r-squared 0.9591 - Weekly 6,605
Volatility (+/-, %) +0.5/ -0.42 - Monthly 6,693
Volatility (+/-, point) +32.61/ -27.39 Stop loss 6,434
Source: Mirae Asset Sekuritas Indonesia Research
Figure 1. Daily , Short term trend – Uptrend
4 - 6,161 Source: Mirae Asset Sekuritas Indonesia Research
Created with AmiBroker - adv anced charting and technical analy sis sof tware. http://www.amibroker.com
_____ 6,548.4
_____ 6,488.5
Optimization Trading System - ©2010 Optimization Trading System - ©2010 Optimization Trading System - ©2010 Optimization Trading System - ©2010
^JKSE [ ^JKSE ] - Daily - 2/8/2019 Open: 6,514 High: 6,527 Low: 6,499 Close: 6,522 Vol. 9,940,629,504
Prev. Avg. Price: 6,515.8
R-Squared: 0.9591
Period: 73
Std.Dev: 2.05
Volatility (+) : 0.0050
Volatility (-) : -0.0042
V-Ratio : 1.19
Chg.: -0.23%
6,521.66
6,511.49
6,446.03
6,444.11
6,434.05
6,545.64
6,545.64
6,645.24
6,657.22
22 29 Nov 12 19 26 Dec 10 17 26 2019 14 21 28 Feb
^JKSE - Volume = 9,940,629,504.00, MA(Volume,8) = 9,713,308,672.00
9,940,629,504
9,713,308,672

11 Februari, 2019
5
Embun Pagi
Mirae Asset Sekuritas Indonesia
Aliran dana keluar dan volatilitas indeks turun mulai terlihat.
Pada Figure 2, terlihat dari hasil optimalisasi terakhir pada periode daily indikator MFI
optimized dan indikator W%R optimized cenderung turun. Pada periode
weekly ,indikator MFI optimized, indikator RSI optimized sudah berada di overbought
area dengan indikator MACD optimized akan menguji resistance trendline. Daily
resistance terdekat di 6,548 dan support di 6,488. Cut loss level di 6,434.
Figure 2. Daily, Short term trend, MFI optimized & W%R optimized
X` x`x`
Source: Mirae Asset Sekuritas Indonesia Research
Created with AmiBroker - adv anced charting and technical analy sis sof tware. http://www.amibroker.com
^JKSE - MFI Smoothed = 67.68
67.681
^JKSE - Will%R Smoothed = -55.80
-55.7991
_____ 6,548.7_____ 6,488.7
Optimization Trading System - ©2010 Optimization Trading System - ©2010
^JKSE [ ^JKSE ] - Daily - 2/8/2019 Open: 6,514 High: 6,527 Low: 6,499 Close: 6,522 Vol. 9,940,629,504
Prev. Avg. Price: 6,515.8
R-Squared: 0.9591
Period: 73
Std.Dev: 2.05
Volatility (+) : 0.0050
Volatility (-) : -0.0042
V-Ratio : 1.21
Chg.: -0.23%
6,521.66
6,511.49
6,444.11
Oct Nov Dec 2019 Feb
^JKSE - Volume = 9,940,629,504.00, MA(Volume,7) = 10,027,898,880.00
9,940,629,504
10,027,898,880

11 Februari, 2019
6
Embun Pagi
Mirae Asset Sekuritas Indonesia
Figure 3. Weekly Trend – Uptrend, MFI optimized, RSI optimized & MACD optimized
A
Source: Mirae Asset Sekuritas Indonesia Research
IHSG akan coba bertahan diatas level 6,516
Pada pergerakkan daily, rata-rata koreksi normal sekitar -0.42%, saat ini di -0.23%.
Sementara itu pada pergerakan weekly koreksi rata-rata sekitar -1.32%, sementara saat
ini di level -0.26%. Pada pergerakan monthly saat ini di level -0.17%, normal koreksi di -
2.94% dengan demikian potensi koreksi masih terlihat secara umum namun mulai
terbatas. Pada Figure 4,5 dan 6 terlihat perkiraan normal trading range untuk masing-
masig periode.
Figure 4. Daily : 6,488– 6,548 Figure 5. Weekly : 6,435 – 6,605 Figure 6. Monthly : 6,335 – 6,693
x
x x`
Source: Mirae Asset Sekuritas Indonesia Research
Source: Mirae Asset Sekuritas Indonesia Research
Source: Mirae Asset Sekuritas Indonesia Research
Created with AmiBroker - adv anced charting and technical analy sis sof tware. http://www.amibroker.com
^JKSE - MFI Smoothed = 97.03 97.0347
^JKSE - RSI Smoothed = 92.51 92.5082
^JKSE - MACD = 326.38, Trigger = 151.22, Histogram = 175.16
326.384
151.222
Optimization Trading System - ©2010 Optimization Trading System - ©2010 Optimization Trading System - ©2010
^JKSE [ ^JKSE ] - Weekly - 2/8/2019 Open: 6,541 High: 6,564 Low: 6,479 Close: 6,522 Vol. 42,130,857,984
Prev. Avg. Price: 6,521.6
R-Squared: 0.8303
Period: 182
Std.Dev: 1.38
Volatility (+) : 0.0128
Volatility (-) : -0.0132
V-Ratio : 0.97
Chg.: -0.26%
6,521.66
6,493.95
6,493.95
6,414.28
6,134.48
5,787.46
6,853.42
7,200.44
Oct 2016 Apr Jul Oct 2017 Apr Jul Oct 2018 Apr Jul Oct 2019
^JKSE - Volume = 42,130,857,984.00, MA(Volume,17) = 35,372,048,384.00
42,130,857,984
35,372,048,384
Created with AmiBroker - adv anced charting and technical analy sis sof tware. http://www.amibroker.com
_____ 6,548.4
_____ 6,488.5
6,515.8
^JKSE [ ^JKSE ] - Daily - 2/8/2019 Open:
Prev. Avg. Price: 6,515.8
R-Squared: 0.9591
Period: 73
Std.Dev: 2.05
Volatility (+) : 0.0050
Volatility (-) : -0.0042
V-Ratio : 1.19
Chg.: -0.23%
6,521.66
30 Feb 6 7 8
^JKSE - Volume = 9,940,629,504.00
9,940,629,504
Created with AmiBroker - adv anced charting and technical analy sis sof tware. http://www.amibroker.com
_____ 6,605.0
_____ 6,435.6
6,521.6
^JKSE [ ^JKSE ] - Weekly - 2/8/2019 Open:
Prev. Avg. Price: 6,521.6
R-Squared: 0.8303
Period: 182
Std.Dev: 1.38
Volatility (+) : 0.0128
Volatility (-) : -0.0132
V-Ratio : 0.97
Chg.: -0.26%
6,521.66
2019 Feb
^JKSE - Volume = 42,130,857,984.00
42,130,857,984
Created with AmiBroker - adv anced charting and technical analy sis sof tware. http://www.amibroker.com
_____ 6,692.8
_____ 6,335.3
6,527.5
^JKSE [ ^JKSE ] - Monthly - 2/8/2019 Open:
Prev. Avg. Price: 6,527.5
R-Squared: 0.8431
Period: 44
Std.Dev: 1.42
Volatility (+) : 0.0253
Volatility (-) : -0.0294
V-Ratio : 0.86
Chg.: -0.17%
6,521.66
Oct 2019
^JKSE - Volume = 51,162,513,408.00
51,162,513,408

11 Februari, 2019
7
Embun Pagi
Mirae Asset Sekuritas Indonesia
Stocks on our focus list
Ramayana Lestari Sentosa (RALS) – Daily , Trading Buy
Harga akan coba bertahan diatas normal lower band pada uptrend channel
Secara umum harga saham masih berada dalam pola uptrend channel dimana korelasi
pergerakkan harga masih relatif valid (r-squared = 0.931) selama 45 hari terakhir yang
bergerak normal dalam rentang +/- 1.82 std.deviasi dari center line. Peluang harga
keluar dari pergerakan normal sekitar +6.89 % (sekitar 3 bar chart ). Rata-rata
volatilitas normal pergerakan harga saat ini antara +2.72%/-1.51% atau +45.56
rupiah/ -25.29 rupiah (rata-rata pergerakan normal ,positif / negatif, selama periode
analisis) sebagaimana terlihat pada Figure 7.
Summary
Item Data Item Data
Close (Feb 8, 2019) 1,675 (+2.45%) Trading range 1,640 - 1,710
Relative Avg. Price performance to JCI (%) 18.53 Target
β (beta) 0.22 - Daily 1,710
Corelation 0.93 - Weekly 1,780
Period 45 - Monthly 1,880
r-squared 0.931 Stop loss 1,590
Volatility (+/-, %) +2.72/ -1.51
Volatility (+/-, Rp.) +45.56/-25.29
Source: Mirae Asset Sekuritas Indonesia Research
Figure 7. Daily trend – Uptrend
ource: Mirae Asset Sekuritas Indonesia Research
Created with AmiBroker - adv anced charting and technical analy sis sof tware. http://www.amibroker.com
_____ 1,706.0
_____ 1,635.4
Optimization Trading System - ©2010 Optimization Trading System - ©2010 Optimization Trading System - ©2010 Optimization Trading System - ©2010 Optimization Trading System - ©2010
Ramayana Lestari Sentosa Tbk [ RALS.JK ] - Daily - 2/8/2019 Open: 1,635 High: 1,695 Low: 1,615 Close: 1,675 Vol. 16,632,100
Prev. Avg. Price: 1,661.7
R-Squared: 0.9311
Period: 45
Std.Dev: 1.82
Volatility (+) : 0.0267
Volatility (-) : -0.0158
V-Ratio : 1.69
Chg.: 2.45%
1,675
1,660.84
1,620.43
1,592.25
1,591.52
1,513.82
1,681.63
1,681.63
1,742.82
1,771.74
12 19 26 Dec 10 17 26 2019 7 14 21 28 Feb
RALS.JK - Volume = 16,632,100.00, MA(Volume,10) = 6,293,650.00
16,632,100
6,293,650

11 Februari, 2019
8
Embun Pagi
Mirae Asset Sekuritas Indonesia
Aliran dana masuk dan volatilitas harga naik masih terlihat.
Pada Figure 8, terlihat dari hasil optimasi pada indikator MFI optimized masih dan
W%R optimized akan cenderung naik . Daily support 1,610 dan resistance di 1,710.
Cut loss level di 1,590.
Figure 8. Daily, MFI optimized & RSI optimized
X`Source: Mirae Asset Sekuritas Indonesia Research
Created with AmiBroker - adv anced charting and technical analy sis sof tware. http://www.amibroker.com
RALS.JK - MFI Smoothed = 67.19
67.1908
RALS.JK - RSI Smoothed = 67.41
67.4148
_____ 1,706.9
_____ 1,636.6
Optimization Trading System - ©2010 Optimization Trading System - ©2010 Optimization Trading System - ©2010
Ramayana Lestari Sentosa Tbk [ RALS.JK ] - Daily - 2/8/2019 Open: 1,635 High: 1,695 Low: 1,615 Close: 1,675 Vol. 16,632,100
Prev. Avg. Price: 1,661.7
R-Squared: 0.9311
Period: 45
Std.Dev: 1.82
Volatility (+) : 0.0272
Volatility (-) : -0.0151
V-Ratio : 1.80
Chg.: 2.45%
1,675
1,660.84
1,592.25
1,513.82
Oct Nov Dec 2019 Feb
RALS.JK - Volume = 16,632,100.00, MA(Volume,10) = 6,293,650.00
16,632,100
6,293,650

11 Februari, 2019
9
Embun Pagi
Mirae Asset Sekuritas Indonesia
Harga akan coba naik dan bertahan diatas rata-rata pada masing-masing periode.
Untuk mampu naik lebih lanjut, harga saham saat ini harus mampu minimal bertahan
diatas rata-rata masing-masing periode (positive area). Pada pergerakkan daily harga
saat ini di level +2.45%, normal kenaikkan sekitar +1.51% . Pada pergerakkan weekly di
level -1.47%, normal koreksi -4.42%. Sementara itu pada pergerakan monthly saat ini di
+6.69 % dan normal kenaikkan +8.63%. Dengan demikian potensi kenaikkan secara
umum masih terlihat pada pergerakkan monthly. Pada Figure 9,10 dan 11 terlihat
perkiraan normal trading range untuk masing-masing periode.
Figure 9. Daily : 1,640 – 1,710 Figure 10. Weekly : 1,620 – 1,780 Figure 11. Monthly : 1,540 – 1,880
x`x`
Source: Mirae Asset Sekuritas Indonesia Research
Source: Mirae Asset Sekuritas Indonesia Research
Source: Mirae Asset Sekuritas Indonesia Research
Created with AmiBroker - adv anced charting and technical analy sis sof tware. http://www.amibroker.com
_____ 1,706.9
_____ 1,636.61,661.7
Ramayana Lestari Sentosa Tbk [ RALS.JK
Prev. Avg. Price: 1,661.7
R-Squared: 0.9311
Period: 45
Std.Dev: 1.82
Volatility (+) : 0.0272
Volatility (-) : -0.0151
V-Ratio : 1.80
Chg.: 2.45%
1,675
30 Feb 6 7 8
RALS.JK - Volume = 16,632,100.00 16,632,100
Created with AmiBroker - adv anced charting and technical analy sis sof tware. http://www.amibroker.com
_____ 1,780.5
_____ 1,621.7
1,696.7
Ramayana Lestari Sentosa Tbk [ RALS.JK
Prev. Avg. Price: 1,696.7
R-Squared: 0.6572
Period: 81
Std.Dev: 0.94
Volatility (+) : 0.0494
Volatility (-) : -0.0442
V-Ratio : 1.12
Chg.: -1.47%
1,675
2019 Feb
RALS.JK - Volume = 34,895,000.00 34,895,000
Created with AmiBroker - adv anced charting and technical analy sis sof tware. http://www.amibroker.com
_____ 1,875.8
_____ 1,536.6
1,681.7
Ramayana Lestari Sentosa Tbk [ RALS.JK
Prev. Avg. Price: 1,681.7
R-Squared: 0.6729
Period: 49
Std.Dev: 0.97
Volatility (+) : 0.1155
Volatility (-) : -0.0863
V-Ratio : 1.34
Chg.: 6.69%
1,675
Oct 2019
RALS.JK - Volume = 42,580,800.00
42,580,800

11 Februari, 2019
10
Embun Pagi
Mirae Asset Sekuritas Indonesia
Gudang Garam (GGRM) – Daily, Buy on Weakness
Harga akan coba naik mendekati normal lower band pada uptrend channel
Secara umum harga saham ini masih berada dalam pola uptrend channel dimana
korelasi pergerakkan harga masih relatif valid (r-squared = 0.864) selama 176 hari
terakhir dan bergerak normal dalam rentang +/-1.50 std.deviasi dari center line.
Peluang harga keluar dari pergerakan normal sekitar +13.58% (sekitar 23 bar chart ).
Rata-rata volatilitas normal pergerakan harga saat ini antara +1.3% /+1.17% atau
+1,051 rupiah / -946.53 rupiah (rata-rata pergerakan normal positif / negatif, selama
periode analisis) sebaaimana sebagaimana terlihat pada Figure 12.
Summary
Item Data Item Data
Close (Feb 8, 2019) 80,900 (-0.49%) Trading range 79,850 - 81,850
Relative Avg. Price performance to JCI (%) 0.70 Target
β (beta) 1.17 - Daily 81,850
Corelation 0.78 - Weekly 83,500
Period 176 - Monthly 86,800
r-squared 0.864 Stop loss 79,000
Volatility (+/-, %) +1.3/ -1.17
Volatility (+/-, Rp.) +1,051.70/ -946.53
Source: Mirae Asset Sekuritas Indonesia Research
Figure 12. Daily – Uptrend
x`
Source: Mirae Asset Sekuritas Indonesia Research
,
Created with AmiBroker - adv anced charting and technical analy sis sof tware. http://www.amibroker.com
_____ 81,840.6
_____ 79,843.9
Optimization Trading System - ©2010 Optimization Trading System - ©2010 Optimization Trading System - ©2010 Optimization Trading System - ©2010
Gudang Garam Tbk [ GGRM.JK ] - Daily - 2/8/2019 Open: 81,300 High: 81,300 Low: 80,175 Close: 80,900 Vol. 716,000
Prev. Avg. Price: 80,791.7
R-Squared: 0.8650
Period: 175
Std.Dev: 1.50
Volatility (+) : 0.0130
Volatility (-) : -0.0117
V-Ratio : 1.11
Chg.: -0.49%
80,900
79,005
81,190
81,233.2
83,240
84,175.9
84,175.9
87,118.5
89,346.8
Jun Jul Aug Sep Oct Nov Dec 2019 Feb
GGRM.JK - Volume = 716,000.00, MA(Volume,9) = 1,147,766.63
716,000
1,147,767

11 Februari, 2019
11
Embun Pagi
Mirae Asset Sekuritas Indonesia
Aliran dana masuk masih terlihat dan volatilitas harga turun mulai terbatas.
Pada Figure 13, terlihat dari hasil optimalisasi indikator MFI optimized dan W%R
optimized akan menguji support trendline. Daily resistance di 81,850. Sementara itu
daily support di 79,850.Cut loss level di 79,000.
Figure 13. Daily , MFI optimized & W%R optimized
,
Source: Mirae Asset Sekuritas Indonesia Research
Created with AmiBroker - adv anced charting and technical analy sis sof tware. http://www.amibroker.com
GGRM.JK - MFI Smoothed = 16.86
16.8581
GGRM.JK - Will%R Smoothed = -90.37
-90.3651
_____ 81,840.6
_____ 79,843.9
Optimization Trading System - ©2010 Optimization Trading System - ©2010 Optimization Trading System - ©2010
Gudang Garam Tbk [ GGRM.JK ] - Daily - 2/8/2019 Open: 81,300 High: 81,300 Low: 80,175 Close: 80,900 Vol. 716,000
Prev. Avg. Price: 80,791.7
R-Squared: 0.8650
Period: 175
Std.Dev: 1.50
Volatility (+) : 0.0130
Volatility (-) : -0.0117
V-Ratio : 1.11
Chg.: -0.49%
80,900
79,787.4
81,190
83,240
Sep Oct Nov Dec 2019 Feb
GGRM.JK - Volume = 716,000.00, MA(Volume,19) = 949,615.81
716,000
949,616

11 Februari, 2019
12
Embun Pagi
Mirae Asset Sekuritas Indonesia
Harga saat ini akan coba naik dan bertahan diatas rata-rata pada masing-masing
periode.
Untuk mampu naik lebih lanjut, harga saham saat ini harus mampu minimal bertahan
diatas rata-rata masing-masing periode (positive area) . Lebih lanjut potensi koreksi
normal harga pada pergerakkan daily sekitar -1.17% saat ini di level -0.49%. Sementara
itu pada pergerakkan weekly koreksi normal sekitar -2.75% saat ini harga di level -2.53%.
Pada pergerakan monthly koreksi normal sekitar -5.28% saat ini di -3.29%. Dengan
demikian diperkirakan potensi koreksi masih terlihat namun terbatas.Pada Figure 14,15
dan 16 terlihat perkiraan normal trading range untuk masing-masing periode.
Figure 14. Daily : 79,850 – 81,850 Figure 15. Weekly : 79,000 – 83,500 Figure 16. Monthly : 77, 300 – 86,800
x`
x
Source: Mirae Asset Sekuritas Indonesia Research
Source: Mirae Asset Sekuritas Indonesia Research
Source: Mirae Asset Sekuritas Indonesia Research
Created with AmiBroker - adv anced charting and technical analy sis sof tware. http://www.amibroker.com
_____ 81,840.6
_____ 79,843.9
Gudang Garam Tbk [ GGRM.JK ] - Daily -
Prev. Avg. Price: 80,791.7
R-Squared: 0.8650
Period: 175
Std.Dev: 1.50
Volatility (+) : 0.0130
Volatility (-) : -0.0117
V-Ratio : 1.11
Chg.: -0.49%
80,900
30 Feb 6 7 8
GGRM.JK - Volume = 716,000.00
716,000
Created with AmiBroker - adv anced charting and technical analy sis sof tware. http://www.amibroker.com
_____ 83,497.4
_____ 79,017.9
Gudang Garam Tbk [ GGRM.JK ] - Weekly
Prev. Avg. Price: 81,250.0
R-Squared: 0.8826
Period: 41
Std.Dev: 1.57
Volatility (+) : 0.0277
Volatility (-) : -0.0275
V-Ratio : 1.01
Chg.: -2.53%
80,900
2019 Feb
GGRM.JK - Volume = 3,196,700.00
3,196,700
Created with AmiBroker - adv anced charting and technical analy sis sof tware. http://www.amibroker.com
_____ 86,818.9
_____ 77,313.4
81,625.0
Gudang Garam Tbk [ GGRM.JK ] - Monthly
Prev. Avg. Price: 81,625.0
R-Squared: 0.7327
Period: 49
Std.Dev: 1.10
Volatility (+) : 0.0636
Volatility (-) : -0.0528
V-Ratio : 1.20
Chg.: -3.29%
80,900
Oct 2019
GGRM.JK - Volume = 4,268,500.00
4,268,500

11 Februari, 2019
13
Embun Pagi
Mirae Asset Sekuritas Indonesia
Malindo Feedmill (MAIN) – Daily , Buy on Weakeness
Harga akan coba bertahan diatas normal lower band pada uptrend channel.
Secara umum harga saham ini masih dalam pola uptrend channel dimana korelasi
pergerakkan harga masih relatif valid (r-squared = 0.85) selama 36 hari terakhir dan
bergerak normal dalam rentang +/-1.57 std.deviasi dari centerline. Peluang harga
keluar dari pergerakan normalnya sekitar +11.84% (sekitar 4 bar chart ). Rata-rata
volatilitas normal pergerakan harga saat ini antara +2.89%/ -2.5% atau +47.69 rupiah /
-41.25 rupiah (rata-rata pergerakan normal positif / negatif, selama periode analisis)
sebagaimana terlihat pada Figure 17.
Summary
Item Data Item Data
Close (Feb 8, 2019) 1,650(-3.51%) Normal trading range 1,620 - 1,710
Relative Avg. Price performance to JCI (%) 15.59 Target
β (beta) 1.20 - Daily 1,710
Corelation 0.85 - Weekly 1,850
Period 36 - Monthly 1,920
r-squared 0.882 Stop loss 1,620
Volatility (+/-, %) +2.89/ -2.5
Volatility (+/-, Rp.) 47.69/ -41.25
Source: Mirae Asset Sekuritas Indonesia Research
Figure 17. Daily Trend – Uptrend
Source: Mirae Asset Sekuritas Indonesia Research
,
Created with AmiBroker - adv anced charting and technical analy sis sof tware. http://www.amibroker.com
_____ 1,713.1
_____ 1,623.3
Optimization Trading System - ©2010 Optimization Trading System - ©2010 Optimization Trading System - ©2010 Optimization Trading System - ©2010 Optimization Trading System - ©2010
Malindo Feedmill Tbk [ MAIN.JK ] - Daily - 2/8/2019 Open: 1,705 High: 1,710 Low: 1,635 Close: 1,650 Vol. 13,407,400
Prev. Avg. Price: 1,665.0
R-Squared: 0.8816
Period: 36
Std.Dev: 1.57
Volatility (+) : 0.0289
Volatility (-) : -0.0250
V-Ratio : 1.15
Chg.: -3.51% 1,650
1,626.77
1,624.53
1,542.88
1,688.91
1,733.96
1,785.23
1,785.23
1,881.54
1,945.92
12 19 26 Dec 10 17 26 2019 7 14 21 28 Feb
MAIN.JK - Volume = 13,407,400.00, MA(Volume,4) = 7,247,650.00
13,407,400
7,247,650

11 Februari, 2019
14
Embun Pagi
Mirae Asset Sekuritas Indonesia
Aliran dana keluar dan volatilitas harga turun masih terlihat.
Pada Figure 18, terlihat dari hasil optimalisasi. Indikator MFI optimized dan indkator
W%R optimized masih cenderung turun. Dengan demikian diperkirakan potensi
koreksi masih terlihat namun mulai terbatas. Perkiraan daily support di 1,620 dan daily
resistance di 1,710. Cut loss level di 1,620.
Figure 18. Daily ,MFI optimized & W%R optimized
Source: Mirae Asset Sekuritas Indonesia Research
Created with AmiBroker - adv anced charting and technical analy sis sof tware. http://www.amibroker.com
MAIN.JK - MFI Smoothed = 14.71
14.7058
MAIN.JK - Will%R Smoothed = -83.97
-83.9693
_____ 1,713.1
_____ 1,623.3
Optimization Trading System - ©2010 Optimization Trading System - ©2010 Optimization Trading System - ©2010
Malindo Feedmill Tbk [ MAIN.JK ] - Daily - 2/8/2019 Open: 1,705 High: 1,710 Low: 1,635 Close: 1,650 Vol. 13,407,400
Prev. Avg. Price: 1,665.0
R-Squared: 0.8816
Period: 36
Std.Dev: 1.57
Volatility (+) : 0.0289
Volatility (-) : -0.0250
V-Ratio : 1.15
Chg.: -3.51%
1,650
1,626.77
1,542.88
1,733.96
Oct Nov Dec 2019 Feb
MAIN.JK - Volume = 13,407,400.00, MA(Volume,4) = 7,247,650.00
13,407,400
7,247,650

11 Februari, 2019
15
Embun Pagi
Mirae Asset Sekuritas Indonesia
Harga akan coba bertahan diatas rata-rata pada masing-masing periode.
Untuk mampu naik lebih lanjut, harga saham saat ini harus mampu minimal bertahan
diatas rata-rata masing-masing periode (positive area) . Jika dilihat lebih lanjut potensi
koreksi normal pada pergerakkan daily sekitar -2.50%, saat ini di level -3.51%. Pada
pergerakkan weekly koreksi normal sekitar -5.25%, saat ini di level -6.78% dan pada
pergerakkan monthly saat ini level -6.25% sementara koreksi normal di -9.36%. Dengan
demikian potensi koreksi mulai terbatas. Pada Figure 19,20 dan 21 terlihat perkiraan
normal trading range untuk masing-masing periode.
Figure 19. Daily : 1,620 – 1,710 Figure 20. Weekly : 1,630 – 1,850 Figure 21. Monthly : 1,570 – 1,920
,,
x` x,
Source: Mirae Asset Sekuritas Indonesia Research
Source: Mirae Asset Sekuritas Indonesia Research
Source: Mirae Asset Sekuritas Indonesia Research
analyzed by : Tasrul, [email protected], +62-21- 5151140
Relative Avg.Price Performance to JCI (%) : Persentase kenaikan harga saham dari rata-rata sejak IHSG memulai uptrend-nya β (beta) : Indikator sensitivitas harga saham terhadap IHSG, beta diatas 1 berarti harga makin sensitif terhadap pergerakan IHSG dan sebaliknya Correlation : Ukuran kuat hubungan (korelasi) pergerakan harga saham dibanding dengan pergerakan IHSG selama periode analisis. Period : Periode uptrend / downtrend yang valid dari pergerakan harga saham. r-squared : Koefisien determinasi, menunjukkan persentase gerakan yang dapat dijelaskan dengan regresi linier.Nilai R2 terletak antara 0 – 1, dan kecocokan model dikatakan lebih baik kalau R2 semakin mendekati 1 (validitas uptrend atau downtrend makin valid) Volatility (+/-%) : Besaran volatilitas normal positif/negatif dari pergerakan harga harian selama harga saham bergerak normal pada trend channel dalam persentase. Volatility (+/- point or Rp) : Besaran volatilitas normal positifl/negatif dari pergerakan harga harian selama harga saham bergerak dalam periode analisis.
Created with AmiBroker - adv anced charting and technical analy sis sof tware. http://www.amibroker.com
_____ 1,713.1
_____ 1,623.3
1,665.0
Malindo Feedmill Tbk [ MAIN.JK ] - Daily
Prev. Avg. Price: 1,665.0
R-Squared: 0.8816
Period: 36
Std.Dev: 1.57
Volatility (+) : 0.0289
Volatility (-) : -0.0250
V-Ratio : 1.15
Chg.: -3.51%
1,650
30 Feb 6 7 8
MAIN.JK - Volume = 13,407,400.00
13,407,400
Created with AmiBroker - adv anced charting and technical analy sis sof tware. http://www.amibroker.com
_____ 1,846.9
_____ 1,629.8
1,720.0
Malindo Feedmill Tbk [ MAIN.JK ] - Weekly
Prev. Avg. Price: 1,720.0
R-Squared: 0.8070
Period: 52
Std.Dev: 1.30
Volatility (+) : 0.0738
Volatility (-) : -0.0525
V-Ratio : 1.41
Chg.: -6.78%
1,650
2019 Feb
MAIN.JK - Volume = 28,990,600.00
28,990,600
Created with AmiBroker - adv anced charting and technical analy sis sof tware. http://www.amibroker.com
_____ 1,923.1
_____ 1,572.5
1,735.0
Malindo Feedmill Tbk [ MAIN.JK ] - Monthly
Prev. Avg. Price: 1,735.0
R-Squared: 0.2450
Period: 49
Std.Dev:
Volatility (+) : 0.1084
Volatility (-) : -0.0936
V-Ratio : 1.16
Chg.: -6.25%
1,650
Oct 2019
MAIN.JK - Volume = 43,656,000.00
43,656,000

11 Februari, 2019
16
Embun Pagi
Mirae Asset Sekuritas Indonesia
Chart 22. JCI Vs. USD/IDR Chart 23. JCI performance (absolute vs. relative)
Source: Bloomberg, Mirae Asset Sekuritas Indonesia
Note: Relative to MSCI EM Index
Source: Bloomberg, Mirae Asset Sekuritas Indonesia
Chart 24. Foreigner’s net purchase (EM) Chart 25. Energy price
V
Note: The latest figure for India are Feb 7th, 2019
Source: Bloomberg, Mirae Asset Sekuritas Indonesia
Source: Bloomberg, Mirae Asset Sekuritas Indonesia
Chart 26. Non-ferrous metal price Chart 27. Precious metal price
Source: Bloomberg, Mirae Asset Sekuritas Indonesia Source: Bloomberg, Mirae Asset Sekuritas Indonesia
13,800
14,200
14,600
15,000
15,400
5,400
5,800
6,200
6,600
11/12 12/10 1/7 2/4
(IDR) (pt) JCI (L) USD/IDR (R)
-0.2 -0.2
2.5
0.2 0.3 1.2
-1.0
9.6
-4
0
4
8
12
1D 1W 1M 1Y
Absolute Relative(%, %p)
-50
127
-15 -21
5
56
607 567
34 7
74
353
-100
0
100
200
300
400
500
600
700
Korea Taiwan Indonesia Thailand Philippines India
1 Day 5 Days (USDmn) (USDmn)
80
90
100
110
6/27 7/25 8/22 9/19
CPO WTI Coal(D-3M=100) (D-3M=100)
50
60
70
80
90
100
110
120
130
11/12 12/10 1/7 2/4
CPO WTI Coal(D-3M=100) (D-3M=100) (D-3M=100) (D-3M=100)
80
90
100
110
120
11/18 12/18 01/19 02/19
(D-3M=100) Copper Nickel Tin
85
90
95
100
105
110
115
11/18 12/18 01/19 02/19
(D-3M=100) Silver Gold Platinum

11 Februari, 2019
17
Embun Pagi
Mirae Asset Sekuritas Indonesia
Table. Key valuation metrics
Company Name Ticker Price Market Cap Price Performance (%) P/E(X)* P/B(X)* ROE(%)*
(IDR) (IDRbn) 1D 1W 1M 1Y FY18 FY19 FY18 FY19 FY18 FY19
Jakarta Composite Index JCI 6,522 7,434,701 -0.2 -0.2 2.5 0.2 15.7 14.0 2.3 2.1 17.6 2.0
FINANCIALS
Bank Central Asia BBCA 27,600 680,478 -0.2 -2.0 5.1 17.1 26.5 23.2 4.5 4.0 18.2 18.2
Bank Mandiri Persero BMRI 7,575 353,500 0.3 1.7 -1.6 -7.9 13.8 14.7 1.9 2.0 14.4 13.9
Bank Rakyat Indonesia Persero BBRI 3,890 479,815 -1.0 1.0 4.3 4.9 13.8 14.8 2.4 2.6 18.5 18.4
Bank Negara Indonesia Persero BBNI 8,975 167,372 -1.1 -1.1 0.6 -4.8 10.9 10.9 1.5 1.5 14.5 14.6
Bank Tabungan Negara Persero BBTN 2,700 28,593 -0.7 -1.5 -1.1 -25.0 21.1 18.5 2.1 2.0 10.5 11.3
CONSUMER
HM Sampoerna HMSP 3,750 436,193 1.1 -2.1 -2.6 -22.5 33.1 29.4 12.5 11.7 38.1 40.9
Gudang Garam GGRM 80,900 155,659 -0.5 -3.3 -2.9 -0.4 19.0 16.3 3.4 3.1 18.6 19.5
Indofood CBP Sukses Makmur ICBP 10,600 123,616 0.7 -1.6 4.4 18.8 28.2 25.9 5.6 5.1 20.8 20.5
Indofood Sukses Makmur INDF 7,700 67,609 1.3 -0.6 3.0 -0.6 16.5 14.9 2.0 1.9 12.1 12.4
Kalbe Farma KLBF 1,595 74,766 -0.9 -0.3 -1.5 -3.0 30.4 28.9 5.1 4.7 17.7 17.0
Unilever Indonesia UNVR 49,825 380,165 0.2 -0.4 2.8 -10.1 38.0 47.6 45.7 60.2 142.9 139.8
AGRICULTURAL
Astra Agro Lestari AALI 13,725 26,416 0.7 -2.0 10.5 6.4 17.4 14.9 1.4 1.3 7.6 8.6
PP London Sumatera Indonesia LSIP 1,445 9,859 0.0 -1.7 7.0 12.0 19.2 15.8 1.2 1.1 5.8 7.1
Sawit Sumbermas Sarana SSMS 1,170 11,144 -0.8 -1.3 -3.7 -20.1 19.8 33.4 2.6 2.4 12.8 7.3
INFRASTRUCTURE
XL Axiata EXCL 2,180 23,300 0.5 0.5 -0.9 -23.8 607.1 46.1 1.1 1.1 0.3 2.4
Jasa Marga JSMR 5,025 36,471 -1.5 2.1 1.9 -11.8 16.2 17.7 2.1 1.9 12.4 10.7
Perusahaan Gas Negara PGAS 2,500 60,604 1.6 -2.7 8.7 6.8 17.9 16.3 1.4 1.2 8.2 8.2
Tower Bersama Infrastructure TBIG 4,610 20,890 -4.0 -6.3 2.4 -20.5 22.9 19.8 6.5 5.9 27.8 30.1
Telekomunikasi Indonesia TLKM 3,850 381,390 -0.3 -1.3 -0.3 -1.6 19.5 17.1 3.9 3.6 19.4 20.7
Soechi Lines SOCI 169 1,193 0.0 0.6 9.7 -35.0 N/A N/A N/A N/A N/A N/A
Garuda Indonesia GIAA 492 12,736 -0.8 8.4 52.8 60.8 N/A N/A 1.5 1.7 -11.7 -13.2
BASIC-INDUSTRIES
Semen Indonesia SMGR 12,500 74,144 -2.3 -1.4 8.0 22.5 30.0 26.4 2.4 2.3 8.2 8.9
Charoen Pokphand Indonesia CPIN 7,650 125,445 -1.9 3.4 -4.1 139.1 27.8 25.9 6.5 5.6 25.2 22.8
Indocement Tunggal Prakarsa INTP 19,000 69,943 -2.1 -1.2 5.3 -12.8 65.6 48.6 3.1 3.1 5.2 6.8
Japfa Comfeed Indonesia JPFA 2,740 32,131 -2.8 -6.5 23.4 87.0 13.5 12.3 3.0 2.5 22.1 21.1
MINING
Indo Tambangraya Megah ITMG 21,875 24,717 -1.4 -4.1 -2.9 -22.7 6.7 6.7 1.8 1.7 27.0 26.1
Adaro Energy ADRO 1,305 41,742 -3.0 -6.1 -7.1 -43.8 6.7 6.7 0.8 0.7 12.0 10.9
Aneka Tambang ANTM 1,025 24,632 -3.3 6.2 29.7 23.5 31.1 21.0 1.3 1.3 3.9 6.2
Vale Indonesia INCO 3,740 37,162 -3.1 -2.9 8.7 6.9 36.8 38.3 1.2 1.4 3.3 4.0
Tambang Batubara Bukit Asam PTBA 4,300 49,539 -0.2 -0.2 -0.7 41.0 9.3 9.1 2.9 2.6 35.5 30.0
TRADE
United Tractors UNTR 25,725 95,958 -2.9 0.0 -7.5 -33.4 8.8 8.0 1.8 1.6 21.9 21.0
AKR Corporindo AKRA 5,350 21,479 -0.5 1.9 18.9 -5.7 24.2 21.0 2.6 2.4 13.1 12.4
Global Mediacom BMTR 374 5,614 1.1 1.6 18.4 -39.2 N/A N/A N/A N/A N/A N/A
Matahari Department Store LPPF 6,700 19,550 1.9 -4.3 11.7 -34.3 11.5 9.5 6.0 4.9 65.7 62.0
Media Nusantara Citra MNCN 875 12,492 1.7 3.6 15.1 -41.7 8.7 7.5 1.2 1.1 14.9 15.5
Matahari Putra Prima MPPA 260 1,958 -4.4 42.9 50.3 -41.2 N/A N/A N/A N/A N/A N/A
Surya Citra Media SCMA 1,820 26,611 0.0 -3.4 -6.7 -32.6 17.5 16.1 5.5 5.0 34.2 32.5
Siloam International Hospital SILO 3,330 5,414 2.1 3.4 -4.3 -61.3 111.6 95.0 0.8 0.8 0.8 1.0
PROPERTY
Bumi Serpong Damai BSDE 1,400 26,945 -0.7 5.3 -5.4 -20.5 14.6 11.8 1.0 0.9 7.0 8.0
Adhi Karya ADHI 1,680 5,982 0.0 3.1 -2.9 -27.9 7.8 6.2 0.9 0.8 11.7 12.8
Alam Sutera Relaty ASRI 360 7,074 -2.7 1.1 3.4 -4.3 6.3 5.2 0.7 0.6 11.1 12.5
Ciputra Development CTRA 945 17,539 -0.5 -3.1 -10.8 -24.1 17.2 16.2 1.2 1.1 6.9 6.9
Lippo Karawaci LPKR 308 7,111 2.7 10.0 16.7 -39.6 6.2 8.2 0.3 0.3 5.6 4.9
Pembangunan Perumahan PTPP 2,300 14,260 0.4 -1.7 7.5 -22.8 9.0 7.7 1.1 1.0 12.5 13.2
Pakuwon Jati PWON 670 32,267 -2.9 3.1 -0.7 1.5 14.3 13.1 2.6 2.2 19.1 17.5
Summarecon Agung SMRA 975 14,066 2.6 -5.8 -4.4 -14.1 39.3 34.7 2.0 1.9 5.4 5.8
Wijaya Karya WIKA 1,865 16,729 1.1 -1.6 0.3 -5.8 10.8 9.1 1.1 1.0 10.8 11.7
Waskita Karya WSKT 2,010 27,284 0.5 1.8 2.6 -30.2 6.1 6.3 1.2 1.0 20.7 16.7
MISCELLANEOUS
Astra International ASII 8,150 329,941 -0.6 -3.6 -1.8 -0.6 14.8 13.5 2.4 2.2 16.5 16.3
Source: Bloomberg, Mirae Asset Sekuritas Indonesia
*Note: Valuation metrics based on Bloomberg consensus estimates

11 Februari, 2019
18
Embun Pagi
Mirae Asset Sekuritas Indonesia
Sector performance Top 10 market cap performance
Name Index Chg (%) Ticker Price Market Cap (IDRbn) Chg (%)
Agricultural 1,636.7 0.0 TSPC IJ 1800 8,100 16.13
Mining 1,892.3 -1.5
FREN IJ 212 36,276 14.0
Basic-Industry 902.0 -1.7 AGRO IJ 372 7,940 10.7
Miscellaneous Industry 1,412.9 -0.4 TRIO IJ 254 6,606 6.72
Consumer Goods 2,637.8 0.5 BCAP IJ 163 6,281 5.16
Property & Construction 472.5 0.0
BTPN IJ 3900 31,775 4.28
Infrastructure 1,185.6 0.4 DLTA IJ 6600 5,284 3.53
Finance 1,245.7 -0.2 JRPT IJ 620 8,525 3.33
Trade 811.3 -0.1 SHID IJ 4950 5,541 3.13
Composite 6,521.7 -0.2 MSKY IJ 1000 9,065 3.09 Source: Bloomberg
Top 5 leading movers Top 5 lagging movers
Name Chg (%) Close Name Chg (%) Close
HMSP IJ 1.1 3,750 BBRI IJ -1.0 3,890
FREN IJ 14.0 212 UNTR IJ -2.9 25,725
BNGA IJ 7.8 1,250 CPIN IJ -1.9 7,650
BTPN IJ 4.3 3,900 ASII IJ -0.6 8,150
BMRI IJ 0.3 7,575 TKIM IJ -4.6 12,850 Source: Bloomberg
Economic Calendar
Time Currency Detail Forecast Previous
All Day JPY Bank Holiday
2:30pm CHF CPI m/m -0.2% -0.3%
4:30pm GBP GDP m/m 0.0% 0.2%
4:30pm GBP Manufacturing Production m/m 0.2% -0.3%
4:30pm GBP Prelim GDP q/q 0.3% 0.6%
4:30pm GBP Prelim Business Investment q/q -1.3% -1.1%
4:30pm GBP Construction Output m/m 0.2% 0.6%
4:30pm GBP Goods Trade Balance -12.0B -12.0B
4:30pm GBP Index of Services 3m/3m 0.3% 0.3%
4:30pm GBP Industrial Production m/m 0.1% -0.4%
All Day EUR Eurogroup Meetings
Tentative GBP NIESR GDP Estimate 0.3%
11:15pm USD FOMC Member Bowman Speaks
Note: Time is based on Indonesian local time
Source: Forex Factory
Disclaimers
This report is prepared strictly for private circulation only to clients of PT Mirae Asset Sekuritas Indonesia (MASI). It is purposed only to person having
professional experience in matters relating to investments. The information contained in this report has been taken from sources which we deem reliable. No
warranty (express or implied) is made to the accuracy or completeness of the information. All opinions and estimates included in this report constitute our
judgments as of this date, without regards to its fairness, and are subject to change without notice. However, none of MASI and/or its affiliated companies
and/or their respective employees and/or agents makes any representation or warranty (express or implied) or accepts any responsibility or liability as to, or
in relation to, the accuracy or completeness of the information and opinions contained in this report or as to any information contained in this report or any
other such information or opinions remaining unchanged after the issue thereof. We expressly disclaim any responsibility or liability (express or implied) of
MASI, its affiliated companies and their respective employees and agents whatsoever and howsoever arising (including, without limitation for any claims,
proceedings, action, suits, losses, expenses, damages or costs) which may be brought against or suffered by any person as a results of acting in reliance upon
the whole or any part of the contents of this report and neither MASI, its affiliated companies or their respective employees or agents accepts liability for any
errors, omissions or misstatements, negligent or otherwise, in the report and any liability in respect of the report or any inaccuracy therein or omission there
from which might otherwise arise is hereby expresses disclaimed.
This document is not an offer to sell or a solicitation to buy any securities. This firms and its affiliates and their officers and employees may have a position,
make markets, act as principal or engage in transaction in securities or related investments of any company mentioned herein, may perform services for or
solicit business from any company mentioned herein, and may have acted upon or used any of the recommendations herein before they have been provided
to you. © PT Mirae Asset Sekuritas Indonesia 2016.