promoting efficient and competitive intra-asean shipping
TRANSCRIPT

The views expressed in this report are those of the authors, and not necessarily those of the ASEAN Secretariat and/or the Australian Government.
Promoting Efficient and Competitive Intra-ASEAN Shipping Services REPSF Project No. 04/001 Authors: PDP Australia Pty Ltd/Meyrick and Associates Final Report March 2005

Promoting Efficient and Competitive Intra-ASEAN Shipping Services
REPSF Project 04/001: Final Main Report i
ABSTRACT
This Final Report documents the findings of the study into Promoting Efficient and Competitive Intra-ASEAN Shipping Services. This project is primarily concerned with identifying measures that could be initiated by ASEAN country governments to improve the efficiency and competitiveness of shipping services between ASEAN ports.
The reports draws on three research streams: desk research, documented in the Inception Report of the project; extensive field research, documented originally in the Interim Report and which is now presented, in a refined and extended form, in the Country Reports that accompany this report; and some modelling work undertaken to probe some of the hypotheses that emerged from the field research.
The Report attempts to do three things. First, it documents the current status of intra-ASEAN shipping: the scope of the cargo task; the policy environment; the shipping fleet and the way shipping services are structured; and infrastructure and performance of the ports on which it depends. Secondly, it assesses the performance of the system, using both quantitative and qualitative information. Thirdly, it identifies and articulates what can and should be done to further improve system performance.

Promoting Efficient and Competitive Intra-ASEAN Shipping Services
REPSF Project 04/001: Final Main Report ii
CONTENTS
ABSTRACT i CONTENTS ii LIST OF TABLES vii LIST OF FIGURES viii ABBREVIATIONS ix GLOSSARY x ACKNOWLEDGEMENTS xi EXECUTIVE SUMMARY xii I. INTRODUCTION 1
A. BACKGROUND 1 B. APPROACH TAKEN 1
1. Desk Research .....................................................................................................1 2. The fieldwork program ........................................................................................2
Objectives and Approach 2 The country reports 5
3. Analysis ................................................................................................................6 Are the costs of intra-ASEAN shipping excessive? 6 What are the problems in intra-ASEAN shipping and where do they lie? 6 What are the reasons for these deficiencies? 6
4. Strategy development .........................................................................................7 II. INTRA-ASEAN MARITIME TRADE 9
A. ECONOMIC PROFILES 9 B. ASEAN DIVERSITY 9 C. TRADE VOLUME AND DISTRIBUTION 10 D. INTRA-ASIAN TRADE 11 E. TRADING LINKAGES 11 F. TRADE COMPOSITION 11
III. ASEAN SHIPPING AND THE PRIORITY SECTORS 15 A. FRAMEWORK AGREEMENT FOR INTEGRATION OF PRIORITY SECTORS 15 B. THE PRIORITY SECTORS AND INTRA-ASEAN TRADE 16 C. SECTOR ROADMAPS 16 D. PRIORITY SECTORS AND MARITIME TRANSPORT REQUIREMENTS 17
1. Agro-based products ........................................................................................17 2. Fisheries products.............................................................................................17 3. Health care products .........................................................................................18 4. Rubber-based products ....................................................................................18 5. Wood-based products.......................................................................................18 6. Textiles and garments.......................................................................................19 7. Electronics and ICT ...........................................................................................19 8. Automotive .........................................................................................................19

Promoting Efficient and Competitive Intra-ASEAN Shipping Services
REPSF Project 04/001: Final Main Report iii
IV. OVERVIEW OF SHIPPING POLICIES 21 A. GENERAL SHIPPING POLICY 21 B. NATIONAL FLAG ADMINISTRATION 22 C. COMPETITION POLICY WITH RESPECT TO LINER SHIPPING 23 D. SUBSIDIES, GRANTS AND TAX INCENTIVES 24 E. CARGO RESERVATION POLICIES 27 F. CABOTAGE 28 G. MANNING ISSUES 29 H. SUMMARY 30
V. THE ASEAN SHIPPING SYSTEM 31 A. ASEAN SHIPPING FLEETS 31
1. Defining the Regional Fleet ..............................................................................31 2. Composition of the Registered Fleet ...............................................................31 3. Composition of the Owned Fleet......................................................................33
B. INTRA-ASEAN SHIPPING SERVICES 33 1. Overview.............................................................................................................33 2. Container shipping services.............................................................................33 3. Bulk and liquid bulk...........................................................................................34 4. General cargo.....................................................................................................35
C. DOMESTIC SHIPPING 35 D. LANDSIDE & INTERMODAL 37 E. THE ASEAN PORT SYSTEM 37
VI. STRENGTHS AND WEAKNESSES OF INTRA-ASEAN SHIPPING 39 A. ASEAN SHIP OPERATING COSTS 39
1. Preliminary Remarks .........................................................................................39 2. Components of Ship Operating Costs.............................................................39
Capital costs 40 Fuel 41 Crewing costs 41 Other costs 43
Insurance .......................................................................................................43 Repairs and maintenance..............................................................................43 Stores and lubes ............................................................................................43 Administration ................................................................................................44
B. NETWORK OPERATING COSTS 44 1. Hub-and-spoke versus direct services............................................................45 2. Cost of transhipment versus direct shipment ................................................45 3. Evolving route patterns.....................................................................................48 4. Intra-ASEAN Freight Rates ...............................................................................51
C. CABOTAGE 53 1. Freight Rate Comparison..................................................................................53 2. Interaction with International Shipping ...........................................................54
D. INSIGHTS FROM THE INTERVIEW PROGRAM 55 1. Shipping rates and availability .........................................................................55

Promoting Efficient and Competitive Intra-ASEAN Shipping Services
REPSF Project 04/001: Final Main Report iv
2. Ship crewing ......................................................................................................56 3. Ship finance .......................................................................................................56 4. ASEAN shipping in a global context................................................................56 5. Shipping trends .................................................................................................56 6. Informal charges................................................................................................56 7. Lagging port infrastructure in minor ports .....................................................57 8. Lack of provision for breakbulk operators......................................................57 9. Planning and regulation....................................................................................57 10. Information deficiencies ...................................................................................57 11. Port productivity and charges..........................................................................58 12. Trade imbalances ..............................................................................................58 13. Similarities between ASEAN countries ...........................................................58 14. Partnerships.......................................................................................................58
E. SUMMARY 59 VII. THE WAY FORWARD 61
A. KEY CONSIDERATIONS 61 1. Building on a strong foundation ......................................................................61 2. An ASEAN Approach.........................................................................................61 3. Balancing different values ................................................................................62 4. Intra-ASEAN Shipping and the Global Maritime System ...............................63
B. RECOMMENDED POLICY INITIATIVES 64 1. Overview of the Way Forward ..........................................................................64 2. A Single ASEAN Voice ......................................................................................66 3. Infrastructure .....................................................................................................67
Discussion 67 Towards Implementation 68
Definition ........................................................................................................68 Evaluation ......................................................................................................68 Project Development......................................................................................69 Project Implementation ..................................................................................69
4. Integration ..........................................................................................................70 5. Harmonisation....................................................................................................71
Fiscal Regimes 71 Registration practices 72 Port charging practices 73 Customs Immigration and Quarantine Services 73
6. Human resources and capacity development ................................................74 Training of Seafarers 74 Creation on an integrated ASEAN labour market for seafarers 74 Capacity building for maritime transport operators 75 Logistics skills development 75
C. IMPLEMENTATION 77 D. DRAFT ROAD MAP FOR INTEGRATION OF ASEAN MARITIME TRANSPORT SECTOR 79
1. Objective.............................................................................................................79 2. Measures ............................................................................................................79 3. Coverage ............................................................................................................79 4. Specific Measures and Timing .........................................................................80
REFERENCES 83

Promoting Efficient and Competitive Intra-ASEAN Shipping Services
REPSF Project 04/001: Final Main Report v
APPENDIXES 91 APPENDIX 1: PERSONS AND ORGANISATIONS CONSULTED 91 APPENDIX 2: DETAILS OF INTRA-ASEAN CARGO FLOWS 93
1. Agro-based industries.......................................................................................93 Growth 93 Trade Structure 94 Commodities 94
2. Fisheries .............................................................................................................96 Growth 96 Trade Structure 96 Commodities 97
3. Health Care Products ........................................................................................98 Growth 98 Trade Structure 98 Commodities 99
4. Rubber-based products ..................................................................................101 Growth 101 Trade Structure 102 Commodities 102
5. Wood-based products.....................................................................................104 Growth 104 Trade Structure 105 Commodities 106
6. Textiles and garments.....................................................................................108 Growth 108 Trade Structure 109 Commodities 109
7. Electronics .......................................................................................................110 Growth 110 Trade Structure 111 Commodities 112
8. Information and Communications Technology ............................................113 Growth 113 Trade Structure 114 Commodities 115
9. Automotive .......................................................................................................116 Growth 116 Trade Structure 117 Commodities 117
10. Container Trade ...............................................................................................118 Growth 118 Trade Structure 119
APPENDIX 3: DRAFT SPECIFICATION OF DATABASE CONTENTS 121 APPENDIX 4: BREAKDOWN OF GENERAL CARGO CLASSIFICATION 123 APPENDIX 5: INTEGRATION – THE MODEL OF THE EUROPEAN COMMUNITY 127
1. Background......................................................................................................127 2. The Beginnings of a Common Maritime Policy.............................................127 3. Phase One: The 1986 Package .......................................................................127

Promoting Efficient and Competitive Intra-ASEAN Shipping Services
REPSF Project 04/001: Final Main Report vi
4. Phase Two: Cabotage .....................................................................................128 5. The Implementation of Council Regulation 3577/92.....................................129
APPENDIX 6: ABOUT THE AUTHORS 131
Individual Country Reports have also been completed for all ten ASEAN countries and have been provided as separate documents.

Promoting Efficient and Competitive Intra-ASEAN Shipping Services
REPSF Project 04/001: Final Main Report vii
LIST OF TABLES
Table 1: Target Organisations for Interviews............................................................................4 Table 2: Shares of Intra-ASEAN Merchandise Trade Values (2002) .....................................13 Table 3: Summary of ASEAN Registered Shipping Fleets.....................................................32 Table 4: Beneficially Owned Fleets of Leading ASEAN Ship Owning Nations.......................33 Table 5: Analysis of Liner Services Offering Between ASEAN Nations .................................34 Table 6: ASEAN Ports’ Roles and Connectivity .....................................................................38 Table 7: Wage cost comparison ($US per month served)......................................................42 Table 8: Results from Case Study 1: Tanjung Priok-Vietnam Services .................................47 Table 9: Results from Case Study 3: Pontianak-Kota Kinabulu Service ................................48 Table 10: Results from Case Study 3: Tanjung Perak – Thailand Service.............................49 Table 11: Schematic Representation of Regional Container Lines’ ‘RPX’ service.................50 Table 12: Indonesia: International and Domestic Freight Rates.............................................53 Table 13: Philippines: International and Domestic Freight Rates (1999) ...............................54 Table 14: Cargo Volumes used in Modelling of Hybrid International/Domestic Service
(tonnes) ..................................................................................................................54 Table 15: Overview of The Way Forward ...............................................................................65 Table 16: Extract from ASEAN Transport Plan of Action .......................................................75 Table 17: Geographical Structure of Intra-ASEAN Agro-Based Products Trade ...................94 Table 18: Commodity structure of Intra-ASEAN Agro-Based Products Trade .......................95 Table 19: Geographical Structure of Intra-ASEAN Fisheries Products Trade........................97 Table 20: Commodity Structure of Intra-ASEAN Fisheries Products Trade ...........................97 Table 21: Geographical Structure of Intra-ASEAN Health Care Products Trade ...................99 Table 22: Commodity Structure of Intra-ASEAN Health Care Products Trade ....................100 Table 23: Geographical Structure of Intra-ASEAN Rubber-Based Products Trade .............102 Table 24: Commodity Structure of Intra-ASEAN Rubber-Based Products Trade ................103 Table 25: Geographical Structure of Intra-ASEAN Wood-Based Products Trade................105 Table 26: Commodity Structure of Intra-ASEAN Wood-Based Products Trade...................106 Table 27: Geographical Structure of Intra-ASEAN Textiles and Garments Trade ...............109 Table 28: Commodity Structure of Intra-ASEAN Textiles and Garments Trade...................110 Table 29: Geographical Structure of Intra-ASEAN Electronics ............................................112 Table 30: Commodity Structure of Intra-ASEAN Electronics................................................112 Table 31: Geographical Structure of Intra-ASEAN Trade in ICT Products...........................114 Table 32: Commodity Structure of Intra-ASEAN Trade in ICT Equipment ...........................115 Table 33: Geographical Structure of Intra-ASEAN Trade in the Automotive Sector ............117 Table 34: Commodity Structure of Intra-ASEAN Trade in Automobiles and Related
Products ...............................................................................................................118 Table 35: Breakdown of Movement General Cargo Commodities within ASEAN by SITC
Rev 3 Classification - $US, 2001..........................................................................123 Table 36: Phasing of the Removal of Cabotage Restrictions In The European Union.........129

Promoting Efficient and Competitive Intra-ASEAN Shipping Services
REPSF Project 04/001: Final Main Report viii
LIST OF FIGURES
Figure 1: Fieldwork Program ....................................................................................................3 Figure 2: ASEAN’s Trade with the World ...............................................................................10 Figure 3: Growth of Intra-ASEAN Trade.................................................................................12 Figure 4: Commodity Composition of Intra-ASEAN Trade (000 tonnes, 2002) ......................14 Figure 5: Intra-ASEAN Trade in Priority Sectors (% of Total Intra-ASEAN Exports)..............16 Figure 6: Comparison of Bunker Prices (heavy fuel oil) .........................................................41 Figure 7: Economies of Scale in Container Ship Operation (US$/TEU/day at sea) ...............45 Figure 8: Comparison of Intra-European with Intra-ASEAN Freight Rates ............................52 Figure 9: Comparison of Intra-European with Intra-ASEAN Freight Rates ............................52 Figure 10: Indicative Timetable for Implementation of Proposed Strategy.............................78 Figure 11: Development of Intra-ASEAN Trade in Agro-Based Commodities .......................93 Figure 12: Development of Intra-ASEAN Trade in Fisheries Products...................................96 Figure 13: Development of Intra-ASEAN Trade in Health Care Products ..............................98 Figure 14: Development of Intra-ASEAN Trade in Rubber-Based Products ........................101 Figure 15: Development of Intra-ASEAN Trade in Wood-Based Products ..........................104 Figure 16: Development of Intra-ASEAN Trade in Textiles and Garments ..........................108 Figure 17: Development of Intra-ASEAN Trade in Electronics.............................................110 Figure 18: Development of Intra-ASEAN Trade in ICT Products .........................................113 Figure 19: Development of Intra-ASEAN Trade in Automotive Products .............................116 Figure 20: Development of Intra-ASEAN Container Trade...................................................118 Figure 21: Geographical Structure of Intra-ASEAN General Cargo Trade...........................119 Figure 22: Geographical Structure of Intra-ASEAN General Cargo Trade...........................120

Promoting Efficient and Competitive Intra-ASEAN Shipping Services
REPSF Project 04/001: Final Main Report ix
ABBREVIATIONS ACD Above Chart Datum (see Glossary) AFTA ASEAN Free Trade Area APEC Asia-Pacific Economic Cooperation ASEAN Association of Southeast Asian Nations ASEAN-6 Malaysia, Indonesia, Thailand, Philippines, Singapore, Brunei Darussalam BIMP-EAGA Brunei Indonesia Malaysia Philippines East Asia Growth Area CLMV Cambodia, Laos, Myanmar and Viet Nam, DWT Deadweight ton: a measure of the carrying capacity of a ship EC European Community EU European Union GT Gross ton: a measure of the enclosed volume of a ship, frequently used as
a basis of charging GDP Gross domestic product: a widely-used indicator of the size of a national
economy GMS Greater Mekong Subregion GRT Gross registered ton: an earlier measure of the enclosed volume of a ship,
using somewhat different conventions of measurement than gross ton (q.v.)
IMO International Maritime Organisation IMT-GT Indonesia Malaysia Thailand Growth Triangle ISPS International Ship and Port Facility Security (IMO Code) KMI Korea Maritime Institute n.m. nautical mile OECD Organization for Economic Cooperation and Development. A grouping of
advanced industrialised countries T tonne (metric ton) TEU Twenty Foot Equivalent Unit: the standard measure of capacity and trade
volume in the container trades UNCTAD United Nations Conference on Trade and Development UNESCAP United Nations Economic and Social Commission for Asia and the Pacific Other abbreviations, mostly of the names of organisations, are explained in the text.

Promoting Efficient and Competitive Intra-ASEAN Shipping Services
REPSF Project 04/001: Final Main Report x
GLOSSARY
Break-bulk Solid cargoes that are stowed in place on a ship, often in cartons, on pallets or in strapped bundles, but not in shipping containers
Chart Datum A reference point for depth measurement: usually includes a margin below the lowest water level likely to be encountered on any tide
Coastal Trade The component of domestic trade that is carried between two points on the same land mass, and consequently could at least in principle be carried by land transport.
Domestic Trade Cargo which has its origin and destination within the same country
Dry Bulk Solid cargoes that are carried in loose form in the hold of a ship
General Cargo A term sometimes used as a synonym for break-bulk cargo (as in this report), but sometimes used to include both break-bulk and containerised cargo
Handymax A medium sized bulk carrier, usually around 40000 dwt
Inter-Island Trade The component of domestic trade that moves between points on separate land masses, and consequently could be carried only by sea (or in some cases air) transport
Liquid bulk Liquid cargoes carried in bulk form on specialised vessels known as tankers
Liner shipping Ships following fixed routes on a regular schedule and offering space to a number of customers on a single sailing
Panamax A vessel of the largest size that can transit the Panama Canal: usually around 60000-70000 dwt
Reefer Cargo Cargoes requiring controlled refrigeration during transit
TEU Twenty-foot equivalent unit – the standard measure of volume in the container trades

Promoting Efficient and Competitive Intra-ASEAN Shipping Services
REPSF Project 04/001: Final Main Report xi
ACKNOWLEDGEMENTS
PDP Australia Pty Ltd and Meyrick & Associates would like to thank the ASEAN Secretariat, AusAID, and the Regional Economic Policy Support Facility (REPSF) under the ASEAN-Australia Development Cooperation Program for making this study possible.
Thank you also to the many survey participants, and those who participated in the seminar held in Jakarta on 24 January 2005, who provided valuable feedback and advice.
This report was prepared by the Study Team comprising Stephen Meyrick, Keith Trace, John Lee, Jose Tongzon, Jeremy Brown and Richard Filmer.

Promoting Efficient and Competitive Intra-ASEAN Shipping Services
REPSF Project 04/001: Final Main Report xii
EXECUTIVE SUMMARY
Maritime transport is crucial to the economic growth and welfare of ASEAN member countries. Efficient and competitive intra-ASEAN shipping services will play an important role in helping to realise the commitment made by ASEAN leaders at the 2003 Bali summit to establishing an ASEAN economic community by 2020. This study is intended to contribute to this goal.
After describing the intra-ASEAN shipping system, its task, and the conditions under which it operates, the reports documents an assessment of the current performance of the system, drawing on some quantitative analysis as well as information and insights obtained during our extensive field work program.
An introductory chapter to the Report introduces the study, describing its background and purpose, and outlining the approach that we adopted in undertaking it. This is complemented by a list of persons consulted during the fieldwork phase of the study, which is presented in Appendix 1 of the report.
Chapter II of the Report addresses the features of intra-ASEAN maritime trade, discussing the economic profiles of member countries, their trade volume and distribution. This is followed by an analysis of intra-ASEAN trade in terms of trading linkages and trade composition. Further details of the growth and composition of the intra-ASEAN trade are presented in Appendixes 2 and 3 to the report. Chapter III outlines the eleven priority sectors and the subsequent maritime transport requirements.
Chapter IV provides an overview of shipping policies; general shipping policy: national flag administration; competition policy with respect to liner shipping; subsidies; grants and tax incentives; and cargo reservation policies: cabotage and crewing issues. The main conclusion of this review is that the policy environment in which intra-ASEAN shipping operates is relatively liberal. In general, ASEAN countries have moved successfully to open their economies, relax regulations, encourage private investment, expand public infrastructure and encourage trade. There are some limitations on the ability of ASEAN shipping companies to respond to market opportunities – for example in ship financing and management skills – and local shipping associations resent the intrusion of foreigners into their markets, but services do tend to emerge where there is a demand. The principal market distortion is cabotage: the reservation of domestic cargoes to national carriers.
Chapter V addresses the ASEAN shipping system. The ASEAN regional shipping fleets are defined, the features of the registered fleet and the owned fleet are reviewed. Intra-ASEAN shipping services are outlined in overview. This review notes that, although container shipping services now play the dominant role in the shipping of intra-ASEAN general cargoes, conventional break-bulk ships still play an important role, especially in the provision of services to remote regions. The advanced age and relatively small scale of the fleets of some of the ASEAN member countries suggests difficulty in mobilising finance for shipping operations.
Chapter VI contains an assessment of the efficiency and competitiveness of intra-ASEAN shipping. An analysis of both the costs of individual ship operations and network structures suggests that intra-ASEAN shipping is reasonably efficient, and further evidence for this can be found in a comparison of intra-ASEAN freight rates with the rates for intra-European short sea services. Domestic freight rates, however, appear to be high, and a plausible case can be made for cabotage restrictions also, in some cases, adding to the cost of international shipping.
In addition to cabotage issues, the field work program identified a number of concerns that inhibit the ability of ASEAN shipping to serve as a catalyst and facilitator for ASEAN economic integration. These included:

Promoting Efficient and Competitive Intra-ASEAN Shipping Services
REPSF Project 04/001: Final Main Report xiii
• shortcomings in port infrastructure and equipment, particularly in the lesser ports serving ASEAN trades
• the tendency for break-bulk/general cargo traffic, still important in intra-ASEAN trades, to have been neglected by ports in the push for containerisation
• a growing shortage of skilled seafarers in several countries, raising the possibility of initiating an ASEAN-certified pool of seafarers
• lack of adequate data on cargo flows and the intra-ASEAN shipping system, especially smaller scale operations within ASEAN
• the need for improved access to ship finance
• concerns about trends in international shipping and ASEAN’s feeling of powerlessness in strengthening its role when many shipping decisions are made by external shippers, customers and their logistics agents located outside the region
• related concerns about the domination of international liner services through regional hubs and the tendency for ASEAN shipping services to be pushed down the distribution chain
• trade imbalances and their impacts on vessel and equipment utilisation and import/export shipping rates
• the similarities between ASEAN countries’ economies and the desirability of adopting measures to encourage diversification and strengthen complementarity
• ASEAN’s slow pace (except in Singapore, Malaysia and Thailand) in developing cooperative logistics relationships between customers, transport service providers and governments
• the culture of informal charges and corrupt practices that continues to pervade port and terminal services
• the tendency for ASEAN governments to centralise planning and decision-making and to hesitate in granting business units greater autonomy in responding to users’ needs under a consistent regulatory regime designed to promote open markets and transparent competition
• low levels of port productivity and a structure of port charges that often does not reflect costs.
Some of these concerns relate to the behaviour of international shipping markets or the economic structure of the ASEAN community: these matters are clearly beyond the control of ASEAN governments. However, others can be addressed by appropriate policies.
The final chapter of the report, Chapter VII, is concerned with developing a program for implementing such policies. It recommends an integrated approach that pursues five core themes. The Chapter proposes a draft Roadmap for integration of the ASEAN maritime sector. This Draft Road Map is modelled on the Road Maps already endorsed for accelerated liberalisation of the eleven priority sectors, and in particular on the Roadmap for Integration of the Air Travel Sector. The Draft Road Map is reproduced in full below.

Promoting Efficient and Competitive Intra-ASEAN Shipping Services
REPSF Project 04/001: Final Main Report xiv
Draft Road Map for Integration of ASEAN Maritime Transport Sector
Objective The objective of this initiative is to advance full liberalisation of maritime transport
services in ASEAN. The liberalisation of transport services is consistent with and supportive of the commitment of the ASEAN Leader’s commitment, recorded in the Bali Concord of October 2003, to the development of ASEAN as a single market and production base. Specifically, it furthers the goal of the leaders to institute new mechanisms and measures to strengthen the implementation of its existing economic initiatives, including the 1995 ASEAN Framework Agreement on Services (AFAS), and supports the goals and strategies enunciated in the Transport Sectoral Action plan 2005-2010.
Measures The Draft Roadmap provides a timebound action plan for concrete actions that ASEAN
member countries shall pursue in order to achieve a more open, efficient and competitive ASEAM maritime transport system. In keeping with the Bali Concord, the Road Map includes both liberalization and cooperation measures. These measures are grouped around five key themes.
Developing a single ASEAN voice
Developing the capacity of ASEAN to express a single coherent policy position on maritime matters of common interest to ASEAN countries
Infrastructure
Ensuring that the transport infrastructure exists to support the effective and efficient operation on intra-ASEAN shipping services.
Integration
The development of a single integrated ASEAN shipping market in which all ASEAN operators can operate without restriction
Harmonisation Ensuring that the single ASEAN shipping market is effective by ensuring that competition takes place on equitable terms and conditions
Human resources and capacity development
Developing and spreading throughout ASEAN the management capacity and technologies required to manage shipping and port operations safely, efficiently and in an environmentally acceptable manner.
In the implementation, two or more ASEAN Member Countries who are ready can
negotiate, conclude and sign implementing agreements/arrangements in line with the ASEAN-X Formula, on a plurilateral, multilateral or sub-regional basis. The other Member Countries could join in the implementation when they are ready.
ASEAN Member Countries shall be provided flexibility with regard to the implementation of the proposed timeline for the specific measures.
Coverage The measures will cover the movement/carriage of both passengers and cargo or freight
by maritime transport, and the provisions of the port and related services necessary for the safe, efficient and reliable operation of maritime transport services.

Promoting Efficient and Competitive Intra-ASEAN Shipping Services
REPSF Project 04/001: Final Main Report xv
Specific measures and timing
No MEASURES IMPLEMENTING BODY
TARGET DATE
I. Developing a single ASEAN voice
1 Establish and agree general principles and framework for a common shipping policy Dec 2006
2 Develop of fully articulated common shipping policy Dec 2006
3
Establish structure for the coordination of ASEAN responses to emerging maritime policy issues and actions by non-member countries or organizations that are contrary to the interests of ASEAN
Senior Transport Officials Meeting (STOM) through the Maritime Transport Working Group (MTWG) Dec 2007
II. Infrastructure
4 Review list of ports in the ASEAN transport network to ensure that all ports of regional significance are included. Dec 2005
5 Develop a comprehensive database of maritime trade to from and within ASEAN. Dec 2007
6 Develop a forecasting process and produce forecasts of future maritime trade flows to from and within ASEAN June 2008
7
Compile an full and comprehensive database on ASEAN network ports, including inventory of the facilities available, shipping services, port tariffs and key performance indicators
Dec 2007
8 Identify shortfalls in ASEAN network port performance and capacity
ASEAN Secretariat under the guidance of STOM through the MTWG
Dec 2008
9 Define agreed criteria and guidelines for assessing port development priorities, including the definition of acceptable performance criteria for ASEAN network ports.
Dec 2008
10 Develop project priorities for bridging performance and capacity gaps in ASEAN network ports
Senior Transport Officials Meeting (STOM) through the Maritime Transport Working Group (MTWG) Dec 2010
11 Negotiate funding mechanisms to support the implementation of identified projects in the ports of less developed ASEAN nations
ASEAN Leaders Dec 2012
12 Ensure that all ASEAN network ports meet defined minimum performance criteria. Member countries Dec 2015

Promoting Efficient and Competitive Intra-ASEAN Shipping Services
REPSF Project 04/001: Final Main Report xvi
No MEASURES IMPLEMENTING BODY
TARGET DATE
III. Integration
13 Formally confirm the principal of open access to the international maritime trade of all ASEAN countries. Dec 2005
14 Provision of the right to ASEAN shipowners or ship’s agencies to establish a ship’s agency in any member country, and of freedom to select the agent of choice
Dec 2006
15
Grant ships of all ASEAN countries national treatment with respect to the carriage of any cargoes that remain subject to reservations or national preference arrangements (for instance, cargoes carried on behalf of government agencies).
Dec 2006
16
Relax cabotage restrictions to allow ship of all ASEAN nations to carry international cargoes between the port or origin and a transhipment port where these two ports are in the same country.
Dec 2007
17
Allow ASEAN ships primarily engaged in international trade but making a number of port calls in another ASEAN country to carry domestic cargos between those ports of call.
Dec 2008
18
Allow ships that are registered in ASEAN nations and crewed by ASEAN nationals, and are conducting services wholly within designated growth areas, to carry domestic cargoes of any participating nations between points within the growth area.
Dec 2007
19
Further relax cabotage operations by allowing all ASEAN-flagged ASEAN-crewed vessels to carry dry bulk and general cargo on coastwise1 operations on routes wholly within all ASEAN member countries.
Dec 2010
20 Liberalise coastwise movement in liquid bulk cargoes in the manner proposed in 19 above. Dec 2011
21 Liberalise the carriage of domestic inter-island bulk trades in the way proposed in 19 above. Dec 2013
22 Liberalise domestic inter-island general cargo trades in the way proposed in 19 above. Dec 2014
23 Liberalise domestic passenger trades in the way proposed in 19 above.
Senior Transport Officials Meeting (STOM) through the Maritime Transport Working Group (MTWG)
Dec 2015
1 ‘Coastwise operations’ means shipping operations along a single contiguous coastline: that is, the provision of
shipping services on routes where land transport could, at least in principle, provide an alternative to shipping services. These are distinguished from inter-island operations, where geography prohibits the use of land transport.

Promoting Efficient and Competitive Intra-ASEAN Shipping Services
REPSF Project 04/001: Final Main Report xvii
No MEASURES IMPLEMENTING BODY
TARGET DATE
IV. Harmonisation
24 Develop and apply common rules on acceptable practices in the provision of fiscal support for shipping operations
Dec 2007
25 Harmonise ship registration practices Dec 2009
26 Allow free movement of ASEAN vessels between the registries of ASEAN countries
Dec 2015
27 Develop and implement guidelines for structure of port tariffs to be applied in ASEAN transport network ports.
Senior Transport Officials Meeting (STOM) through the Maritime Transport Working Group (MTWG)
Dec 2008
28 Complete the harmonization of customs and quarantine procedures
ASEAN Directors General of Customs
Dec 2010
V. Human resources and capacity development
29 Investigate skill enhancement requirements for ASEAN maritime operators and develop detailed training and development strategy
Dec 2006
30 Define training delivery mechanisms and implement training strategy
Dec 2008
31 Establish centres of logistics excellence at selected tertiary institutions within ASEAN.
Dec 2007
32 Develop strategy for enhanced shipboard placements including
Dec 2006
33
Establish regional centres of maritime excellence to provide advanced training in high technology aspects of maritime operations and specialized courses in areas such as port and shipboard security
Dec 2009
34 Implement single labour market for seafarers
Senior Transport Officials Meeting (STOM) through the Maritime Transport Working Group (MTWG)
Dec 2013

Promoting Efficient and Competitive Intra-ASEAN Shipping Services
REPSF Project 04/001: Final Main Report 1
I. INTRODUCTION A. BACKGROUND
At the 2003 Bali summit, ASEAN leaders made a commitment to establish the ASEAN economic community by 2020. Due to the pivotal role that maritime transport plays in the economic life of ASEAN, effective implementation of this commitment will require the development of efficient and competitive intra-ASEAN shipping services. This study is designed to contribute to this goal.
Realising this goal is made more complex by the fact that ASEAN countries are at different stages in their economic development. While Singapore enjoys a per capita income in line with OECD standards, income levels in Lao PDR, Cambodia, Vietnam and Myanmar are much lower. Practical strategies for improving the efficiency of intra-ASEAN shipping must recognise and accommodate this diversity.
There are also significant differences in government policy objectives, the level of maritime activity and the extent of government involvement in maritime transport. Singapore and Malaysia are established players on the global maritime scene while other countries like Cambodia and Lao PDR have only limited involvement. Cambodia, Laos, Vietnam and Myanmar are undergoing the transition from centrally-planned to more market-oriented economies. And the archipelagic countries of Indonesia and the Philippines face a unique set of geographic challenges in ensuring that adequate and efficient shipping services are available to their widely-dispersed communities.
B. APPROACH TAKEN
1. Desk Research The initial phase of the project, documented in the Inception Report submitted in July,
involved intensive and extensive desk research. This included a review of available information on the status of maritime policies in ASEAN member countries; an analysis of the structure of ASEAN maritime trade; an analysis of ASEAN shipping fleets; an assessment of the nature and structure of intra-ASEAN shipping services; and a review of the traffic handled and facilities available at the main ports serving intra-ASEAN trade.
At the Inception Meeting, it was agreed that an additional output from the study would be the following more detailed information on cargo flows:
• a time-series analysis of ASEAN trade, in volume terms, for each of the commodity groupings presented in the inception report
• a breakdown of the general cargo component. This task has proven to be much more difficult and time-consuming than anticipated. Volumetric data in a consistent form is available for only a small proportion of the relevant commodities, and it has been necessary to rely principally on value data for these series
• origin-destination flows by commodity group for intra-ASEAN trade. Available sources allowed this to be undertaken systematically only at the country level.

Promoting Efficient and Competitive Intra-ASEAN Shipping Services
REPSF Project 04/001: Final Main Report 2
2. The fieldwork program Objectives and Approach
A large number of factors have a bearing on the efficiency and competitiveness of maritime transport services:
• government policies, including those relating to competition, foreign investment, trade, customs and entry restrictions, industry regulation, government ownership and participation, pricing and taxation, and development of intermodal transport;
• the structure and characteristics of the shipping industry itself, including competition, ownership, entrepreneurship, management, and access to finance and technology;
• landside characteristics, including port infrastructure and port management, the port/land interface and the quality and efficiency of land transport services; and
• numerous exogenous factors such as economic and technological trends, the changing composition of trade, competition between regional suppliers and market developments elsewhere in the world that have an impact on the region.
The fieldwork program was aimed mainly at identifying the relative importance of each of these factors and the manner in which they interact. But it was also intended to assemble attitudinal as well as factual data: this, it was felt, would give extra insight into the driving factors and help ensure that the action plan resulting from the project reflected the realistic views of stakeholders about what could and should be done.
Initially the survey program was to bring together the views of all possible players in the transport chain, but at a meeting at the ASEAN Secretariat on 13th August 2004 it was decided that an earlier ALMEC study2 had adequately addressed broader issues of port management, the land transport interface, customs, immigration and quarantine arrangements, and that the present study should therefore focus on the factors affecting shipping services themselves. It was also agreed that there should as far as practical, be a special focus on smaller-scale intra-regional and domestic operations, since this was felt to be the area where inefficiencies are most likely to be found. The emphasis was to be on assembling information on the structure of shipping services, including second-level liner and non-liner services, and the factors affecting freight rates, availability and demand-responsiveness.
This meant that the fieldwork had to concentrate more on the views of government policy-making bodies, regulators, shipping lines and their agents, and individual shippers and their associations, including those in regional areas; of lesser concern were the views of land transport operators, customs officials and other transport chain participants.
The fieldwork involved an intensive program of interviews with a broad cross-section of ASEAN maritime interests, carried out in 10 countries over 5½ weeks (Figure 1). This interview program was designed to expose the interests, views and suggestions for improvement of representatives of the types of organisations listed in the Appendix 1 to this Report.
2 ASEAN Maritime Transport Development Study, ALMEC Corporation, November 2002.

Promoting Efficient and Competitive Intra-ASEAN Shipping Services
REPSF Project 04/001: Final Main Report 3
Figure 1: Fieldwork Program
23 24 25 26 27 28 29 30 31 1 2 3 4 5 6 7 8 9 10 11 12 13 14 15 16 17 18 19 20 21 22 23 24 25 26 27 28 29 30 1 2 3 4 5 6 7 8Pilot Study Malaysia ThailandRefinement of Instruments
Singapore Brunei Myanmar LaosTeam 2 Indonesia Cambodia Vietnam The Philippines
Main Round of fieldwork Team 1
OctoberAugust September

Promoting Efficient and Competitive Intra-ASEAN Shipping Services
REPSF Project 04/001: Final Main Report 4
Table 1: Target Organisations for Interviews
Sector Organisation Issues discussed
Port Port authority/corporation Terminal company Depot operator Stevedore (bulk/break-bulk)Major shipper (bulk/break-bulk)
Infrastructure: container/bulk/break-bulk Port structure Management/labour skills Industrial climate; labour availability Performance; trends & issues Inter-port competition Pricing structure/regulation
Marine Ship owner Ship operator/line/ consortium manager Shipping agent
Infrastructure: container/bulk/break-bulk Port performance; trends & issues Inter-port competition Pricing structure/regulation Access to shipping industry (trade/non-trade barriers) Cabotage Cargo reservation etc. Special treatment (government, owners, consortia etc.)
Inland transport
Transport operator (road/rail) Freight forwarder Depot operator
Road/rail connectivity to port/depots Intermodal structure Access to industry (trade/non-trade barriers) Access to infrastructure (e.g., rail, land) Costs Pricing structure/regulation
Cargo interests
Chamber of Commerce Shipper/consignee Shipper bodies
Infrastructure: container/bulk/break-bulk Port performance; trends & issues Inter-port competition Road/rail connectivity to port/depots Costs Access to industry (trade/non-trade barriers) Customs regulations Special treatment (cargo reservation; discounts for selected trades etc.) Pricing of port and shipping services – structure/regulation
Government Ministries with responsibility for: Transport Trade Competition /fair-trading Customs; border control Security
Access to industry (trade/non-trade barriers) Access to infrastructure (e.g., rail, land) Pricing structure/regulation Customs regulations Special treatment (cargo reservation; discounts for selected trades etc.) Tax breaks on capex, revenue etc. Security; special treatment; costs; action on restraining
As shown in Figure 1, the interviews were carried out by two teams each
consisting of two persons. It was conducted in two stages, over a seven-week period from mid-August, through to mid-October. The first stage, during which the approach that we intended to adopt was piloted in Thailand and Malaysia, commenced in mid-August. Following the initial pilot surveys the interview tools and techniques were refined, and the main part of the interview program commenced in mid-September. The key topics covered with different stakeholder groups are shown in Table 1.
In all, over 160 people were interviewed during the program. They had been identified and contacted in several ways: a contact-point in each country, nominated by the ASEAN Secretariat3, had been asked to suggest a list of potential interviewees and to make initial contact; the consultants’ own industry contacts in each country
3 In one or two instances ASEAN Secretariat was unable to nominate a contact point. Contacts were
established by the interview teams themselves before and during their visits to the countries in question.

Promoting Efficient and Competitive Intra-ASEAN Shipping Services
REPSF Project 04/001: Final Main Report 5
were also asked to suggest suitable government and industry representatives; websites were scanned; ASEAN, maritime industry association and telephone and business directories were also used. Despite some difficulties in making contact with some government policy-makers early in each country visit, it is generally felt that coverage was excellent and that a substantial cross-section of views has been assembled.
The field research played a major role in identifying needs and opportunities for sector reform.
The country reports Comprehensive notes were taken during each interview by each of the two
members of each team. Later, a consolidated set of notes was prepared by each of the two team leaders. Based on these notes, the information and insights obtained from the field work were subsequently included in the draft Country Reports that were submitted as part of our Interim Report. The Country Reports have been further refined and expanded following the submission of the Interim Report.
These Country Reports are the main outputs from the fieldwork stage, though the individual interview notes remain important primary sources. A template had been developed following the Singapore/Malaysia pilot surveys, covering the following areas:
• national shipping policies, including the structure of maritime administration and policies governing the shipping industry, ship registration, safety and environmental protection;
• ship registration, including nationality requirements, crewing restrictions on national flag shipping, second-register operations and differences from the primary register, and coverage (e.g. minimum vessel size) of the national register;
• regulation of competition in shipping, for both international and domestic shipping, including liner shipping policy, cargo reservation, preferences for government cargoes, cabotage and route licensing;
• subsidies, grants and tax incentives, including depreciation rules, corporate taxation concessions, ship financing schemes, capital grants and operating subsidies
• key trading relationships – the main commodities shipped in intra-ASEAN trades, the principal trading partners by commodity, and the main ports of shipment and partner ports for each major commodity;
• the national fleet – the size, age and type distribution of the fleet under the national flag;
• ports, including the structure of port administration and physical details of intra-ASEAN ports, private participation in port ownership and operation, data on port performance, tariffs and their application, port handling performance, and the main port development projects in the planning pipeline;
• the main intra-ASEAN shipping routes and their characteristics, including bulk and general cargo trades, with details of the size of vessel typically used, ownership structures, competition, indicative freight rates, the role of container cargo services, route structures, shipping line/s active on each route, transit times etc.;
• security – security protocols (ISPS etc.), any specific imposts to cover compliance costs, and shipper/industry view on their impacts; and
• any additional material, covering such matters as crewing levels, crewing costs, fuel prices at bunkering locations and insurance costs.

Promoting Efficient and Competitive Intra-ASEAN Shipping Services
REPSF Project 04/001: Final Main Report 6
As far as possible we attempt to provide, and to present in a consistent manner, information for each country on each of these topics. However, it proved extremely difficult to obtain consistent and comprehensive data: in some instances, therefore, the coverage is incomplete.
In addition, the Country Reports were to contain observations and comments on the main insights gained by the field research team into how efficient intra-ASEAN shipping appears to be, the main causes of any inefficiencies that exist, and what might be done about these.
3. Analysis The analysis phase of the project focused on providing answers to the following key
questions:
Are the costs of intra-ASEAN shipping excessive? In making this assessment we adopted three perspectives:
• A ship perspective: the various components of shipping costs were identified and an assessment made of which if any of these factors were high for ASEAN shipowners
• A network perspective: the way in which intra-ASEAN shipping services are structured was examined, and an attempt made to assess whether the structural features of the network are likely to lead to excessive costs
• A user perspective: inefficiencies arising from either of the above causes will ultimately be manifest in high freight rates. We therefore examine the rates paid for intra-ASEAN shipping, and compare these rates with rates on selected European short-sea services
What are the problems in intra-ASEAN shipping and where do they lie? In this assessment, we draw on both the cost analysis noted in the previous
section and the qualitative insights of the interview program. The premise of this assessment is that it is likely that few valid broad generalisations can be made about ASEAN shipping – the problems that exist are likely to be specific to certain sectors or locations.
What are the reasons for these deficiencies? Differences in maritime transport efficiency can result from a wide range of
factors. Some of these are directly amenable to changes in policy; some can be indirectly influenced by policy changes; and some must just be accepted as givens in a particular trading environment. Our focus is on locating those factors that can be changed, and identifying who has the ability to change them.

Promoting Efficient and Competitive Intra-ASEAN Shipping Services
REPSF Project 04/001: Final Main Report 7
4. Strategy development The final chapter of the report, Chapter VII, is concerned with developing a program
for implementing such policies. It recommends an integrated approach that pursues five core themes:
• A single ASEAN voice.
• Infrastructure
• Integration
• Harmonisation
• Human resources and capacity development

Promoting Efficient and Competitive Intra-ASEAN Shipping Services
REPSF Project 04/001: Final Main Report 8
This page has intentionally been left blank.

Promoting Efficient and Competitive Intra-ASEAN Shipping Services
REPSF Project 04/001: Final Main Report 9
II. INTRA-ASEAN MARITIME TRADE A. ECONOMIC PROFILES
Countries throughout Asia have experienced rapid expansion since the end of the Second World War. Growth was led by Japan’s industrialisation, expanding from its heavy industry base into consumer items such as cars, and thence into the high tech industries of electronics, telecommunications and computer equipment. Increasing labour costs encouraged Japan to in its neighbours, already enjoying strong investment from the USA and Europe. In the late 1970s and into the 1980s many new projects started in North East Asia, in South Korea, Taiwan, and, notably, in the nations of the ASEAN grouping. The new industrialised Tigers, as they were termed, became a powerful influence in both world and intra-regional trade; the economies of countries such as ASEAN member nations Malaysia and Thailand growing rapidly on the back of manufacturing and assembling goods for the consumers of Europe, North America and Japan. The process has developed strongly in recent times with the so called ‘hollowing out’ process, that has seen much of Japan’s manufacturing base shift off shore in search of cheaper labour and operating costs.
In more recent times, China has grown rapidly as the base for manufacturing and the current trends in trade growth and shipping volumes exemplified by container flows, are being driven strongly by the flows into and out of Asia, which are dominated by China’s exports to Europe and the United States. The concentration of foreign direct investment in China has seen capital drift away from other Asian nations, diversifying trade links and overall growth in intra-Asian regional volumes, as nations become part of the supply chains for the manufacturing and assembly processes. Further impetus in growth in the volume of cargo moving has come from the increasing status of South East Asian ports as transhipment hubs, particularly the ports of Singapore and Malaysia (Port Klang and, more recently, Tanjung Pelepas).
Whilst these trends have benefited many of the ASEAN members, the benefits have not been evenly distributed, and shipping services, driven by trade growth, have tended to develop where the economies have been performing most strongly: notably Malaysia, Singapore and Thailand. Development of services to The Philippines, Indonesia and Vietnam has been more erratic, but still strong, while Cambodia, Myanmar and Lao PDR make only marginal contributions to ASEAN trade – as due to its small size, does Brunei Darussalam.
B. ASEAN DIVERSITY ASEAN countries have many similarities but some notable differences. Features in
common include relatively open economic policies and a strong reliance on export-led external trade, and low levels of tariff protection. However, the differences between the countries are also marked4. In terms of population, tiny Brunei (0.35 million in 2002) is dwarfed by Indonesia (212 million). Singapore’s Gross National Income (GNI) per head of US$ 20,690 is far higher than Malaysia’s US$ 3,540, the Philippines’ US$ 1,020 and Indonesia’s US$ 710. The quality and sophistication of infrastructure and financial and economic services also reflect these differences in per capita income.
4 All statistics are for 2002 unless otherwise stated.

Promoting Efficient and Competitive Intra-ASEAN Shipping Services
REPSF Project 04/001: Final Main Report 10
C. TRADE VOLUME AND DISTRIBUTION The key developments in ASEAN trade that will affect the future of intra-ASEAN shipping
include the following:
• Rapid rise in trade volumes. Under the impact of trade liberalisation measures, there has been a worldwide tenancy for the volume of goods traded internationally to increase far more rapidly than national income. This is especially true of the open economies of East Asia, including the ASEAN countries.
• Changes in the geography of trade. There has been a significant increase in intra-Asian trade, particularly with the trade between ASEAN and China. Trade between ASEAN member countries has also increased.
The value of ASEAN’s external trade amounted to US$ 688 billion in 2001 and US$ 733 billion in 2002. Between 1993 and 2002, it grew at an average rate of 6.1 % per annum (p.a.). The US (15.8 % of ASEAN trade in 2001), Japan (14.8 %) and the EU (14.0 %) remain the main trading partners, but their share has fallen while that of China has been growing rapidly (Figure 2); in 2001 China accounted for 8.1 % of ASEAN trade, up from only 2.1 % eight years earlier.
ASEAN’s internal cross-border trade has also increased, although the trend has been complicated by the 1997 financial crisis. In 1992, intra-ASEAN exports amounted to $US39 million, or approximately 21% of total ASEAN exports. This share rose to around 25% of ASEAN exports by the middle of the decade, before falling back sharply under the impact of the crisis. By 2002, the intra-ASEAN export share had returned to 24% of total exports. The trend in intra-ASEAN imports has been more stable, with the share of total ASEAN imports coming from other ASEAN members increasing steadily from 18% in 1992 to nearly 24% in 2002.
Figure 2: ASEAN’s Trade with the World5
0%
10%
20%
30%
40%
50%
60%
70%
80%
90%
100%
1993 1995 1997 1999 2001
% S
hare
of A
SE
AN
Tra
de OtherEUUSCERIndiaKoreaJapanChina
5 Source: ASEAN Secretariat.

Promoting Efficient and Competitive Intra-ASEAN Shipping Services
REPSF Project 04/001: Final Main Report 11
D. INTRA-ASIAN TRADE Regional trade in Asia has been estimated at approximately 16 million TEU per year,
excluding feeder cargo. Of this, approximately 3 million TEU is attributed to domestic traffic, with Indonesia and The Philippines figuring strongly in this sector. Over 70% of the total trade is generated by import and export traffic relating to North and East Asia – Japan, Korea, Taiwan and China/Hong Kong.
Intra-Asian trade is forecast to grow by at least 27.5% over the next two to three years, expected to account, by the end of this period for up to 23% of total global liner activity. China is the fastest growing market in the region, its role increasing as more manufacturing capacity develops.
To some extent it is overshadowing the ASEAN grouping, however, recent growth of the major ASEAN economies has been strong, and , if supported by closer economic integration, should be sustainable. In addition, the potential of the smaller ASEAN economies such as Vietnam, Cambodia and Lao PDR should not be underestimated. A glance at liner shipping services in the region (see Figure 5), however, shows that the heavy emphasis on the so-called Asian Tigers, plus development of transhipment cargo hubbing, has left some nations with little in the way of direct liner services. Although connection with Singapore and Malaysian ports provides transhipment links, there is no doubt that the international services by-pass many ASEAN members.
E. TRADING LINKAGES Table 2 summarises the relative importance of individual pairwise elements in the total
intra-ASEAN trade. The figures reported in the table reflect the share of the total value of intra-ASEAN trade represented by each component.
The dominance of trade to and from Singapore and Malaysia is clearly seen in the table. However, it should be borne in mind that much of the very large Singapore-Malaysia trade does not all move by maritime transport. The same is true for trade between Thailand and Malaysia. From the point of view of maritime transport, the most significant linkages are those between Thailand, Indonesia and Malaysia on the one hand, and Singapore on the other.
Also notable are the very small flows between non-contiguous less developed countries within ASEAN.
F. TRADE COMPOSITION The commodity composition of intra-ASEAN trade is shown in Figure 4. (Unlike Table 2,
this data is the estimated physical volume of trade). The recent growth history and geographical distribution of each of the major components of the trade are given in more detail in Appendix 2.
The figure illustrates the importance of energy-related commodities (crude oil, coal and coke and refined petroleum products) and general cargo in the overall commodity mix. Other relatively high volume commodities – particularly timber – are mainly land transport movements between contiguous countries.
Because of the nature of the cargoes, the international liquid bulk sector tends to be dominated by major companies operating under sophisticated quality assurance systems, commonly operating to and from dedicated oil terminals. Our survey of the literature and previous experience in the region suggests few problems or issues associated with this element of the maritime transport task. For this reason the bulk of the research effort has focused on the general cargo sector.

Promoting Efficient and Competitive Intra-ASEAN Shipping Services
REPSF Project 04/001: Final Main Report 12
Figure 3: Growth of Intra-ASEAN Trade
0
50
100
150
200
250
300
350
400
450
USD
Bill
ion
Extra-exports 147 165 197 239 254 265 258 279 325 296 308 Intra-exports 39 47 65 82 87 88 72 80 103 90 97
1992 1993 1994 1995 1996 1997 1998 1999 2000 2001 2002
0
50
100
150
200
250
300
350
400
USD
Bill
ion
Extra-imports 164 187 226 288 303 297 216 232 281 260 270 Intra-imports 37 44 55 67 74 75 63 68 87 77 83
1992 1993 1994 1995 1996 1997 1998 1999 2000 2001 2002

Promoting Efficient and Competitive Intra-ASEAN Shipping Services
REPSF Project 04/001: Final Main Report 13
Table 2: Shares of Intra-ASEAN Merchandise Trade Values (2002)
To
From Brunei Cambodia Indonesia Lao PDR. Malaysia Myanmar Philippines Singapore Thailand Viet Nam Grand Total
Brunei Darussalam 0.00% 0.00% 0.04% 0.00% 0.01% 0.00% 0.88% 0.00% 3.31% 0.00% 4.25%
Cambodia 0.00% 0.00% 0.00% 0.00% 0.02% 0.00% 0.00% 0.06% 0.01% 0.02% 0.12%
Indonesia 0.02% 0.08% 0.00% 0.00% 1.91% 0.07% 0.88% 5.77% 1.14% 0.35% 10.23%
Lao PDR 0.00% 0.00% 0.00% 0.00% 0.00% 0.00% 0.00% 0.00% 0.10% 0.07% 0.17%
Malaysia 0.29% 0.06% 1.68% 0.00% 0.00% 0.21% 1.39% 16.05% 3.62% 0.51% 23.82%
Myanmar 0.00% 0.00% 0.02% 0.00% 0.08% 0.00% 0.00% 0.12% 0.87% 0.00% 1.10%
Philippines 0.00% 0.00% 0.14% 0.00% 1.20% 0.01% 0.00% 2.48% 1.46% 0.07% 5.37%
Singapore 0.44% 0.40% 3.39% 0.03% 22.73% 0.46% 3.32% 0.00% 5.70% 2.27% 38.73%
Thailand 0.04% 0.50% 1.47% 0.44% 2.93% 0.38% 1.25% 5.69% 0.00% 0.86% 13.56%
Viet Nam 0.00% 0.16% 0.18% 0.07% 0.36% 0.01% 0.40% 1.12% 0.35% 0.00% 2.65%
Grand Total 0.80% 1.20% 6.93% 0.54% 29.25% 1.14% 8.11% 31.31% 16.56% 4.15% 100.00%
Source: Study estimates, based on analysis of COMMTRADE database.
Note: Wherever possible, trade values as reported by exporting country have been used in constructing this table. However, where the exporting country has not reported the information, information provided by the importing country has, if available, been used to fill the gap. This is the case for exports from Brunei, Cambodia, Lao PDR and Myanmar to all ASEAN countries. Singapore’s exports to Indonesia and Vietnam are also based on reports from the importing country.

Promoting Efficient and Competitive Intra-ASEAN Shipping Services
REPSF Project 04/001: Final Main Report 14
Figure 4: Commodity Composition of Intra-ASEAN Trade (000 tonnes, 2002)
- 5,000 10,000 15,000 20,000 25,000 30,000 35,000 40,000
Chemicals
Coal and Coke
Crude Petr
Fertliser
Iron and Steel
Live Animals
LNG
LPG
Minor Bulk
Motor Vehicles
Nonferrous Metals
Nontransport
Other Grain
Project Cargo
Pulp & Paper
Reefer
Refined Petroeum
Rice
Scrap Metal
Sugar Molasses & Honey
Timber
General Cargo
Source: Study estimates, based on analysis of COMMTRADE data
Note: Excludes 82 million tonne of gravel and sand reported to move between Indonesia and Singapore. This appears either to be an error in the COMMTRADE data, or to reflect local cross-border movements of land fill.

Promoting Efficient and Competitive Intra-ASEAN Shipping Services
REPSF Project 04/001: Final Main Report 15
III. ASEAN SHIPPING AND THE PRIORITY SECTORS A. FRAMEWORK AGREEMENT FOR INTEGRATION OF PRIORITY SECTORS
During the leaders' summit of the Association of South East Asia in Bali in October 2003, it was agreed to accelerate liberalization in the Eleven priority sectors. Eight of these sectors involve trade in physical goods, while three relate to trade in services. In 2003, these sectors accounted for more than 50% of intra-ASEAN trade, while in value terms, they contributed US$48.4 billion and US$43.4 billion of intra-ASEAN exports and imports.6 The priority sectors are:
• agro-based products;
• air travel;
• automotives;
• e-ASEAN;
• electronics;
• fisheries;
• healthcare;
• rubber-based products;
• textiles and apparels;
• tourism;
• wood-based products
The commitment to the accelerated liberalisation of these priority sectors was more fully articulated in the ASEAN Framework Agreement for the Integration of Priority Sectors.7 Two elements of this agreement are particularly relevant to this report:
• The framework agreement specifically provides for future expansion of the list of priority sectors through the inclusion of ‘such other sectors as may be identified by the Ministers responsible for ASEAN economic integration’. Article 20 of the framework specifically provides for Ministers to review the framework to ‘for the purpose of considering further measures and/or other sectors for priority integration’. This provision, together with the inclusion of air transport8 in the framework, encourages consideration of the possibility of including maritime transport as a priority sector in the future.
• This is further encouraged by Article 10 (Logistic Services) of the Agreement. The inclusion of this Article in the Framework Agreement is a clear recognition of the crucial role that high quality logistics services will play in supporting the integration of the other priority sectors. Amongst other things, the article makes a clear commitment to supporting transport sector liberalisation by ‘strengthening intra-ASEAN maritime and shipping transport services, and by achieving ‘better inter-connectivity, inter-operability and inter-modality with the national, regional and international maritime and air transport gateways’.
6 Gallacher, 2004. 7 ASEAN, http://www.aseansec.org/16656.htm 8 Item 2 (1) (c) of the agreement expressly states that ‘Air travel shall be deemed to refer to air
transport’

Promoting Efficient and Competitive Intra-ASEAN Shipping Services
REPSF Project 04/001: Final Main Report 16
B. THE PRIORITY SECTORS AND INTRA-ASEAN TRADE Figure 5: Intra-ASEAN Trade in Priority Sectors (% of Total Intra-ASEAN Exports)
Source: Based on data provided in Austria (2004)
Figure 5 shows intra-ASEAN exports of goods in the priority sectors as a proportion of total intra-ASEAN trade in goods in 2001. Collectively, goods in these sectors account for approximately 44% by value of total intra-ASEAN exports. By far the largest share of this comes from ICT exports, which alone accounts for nearly 28% by value of total intra-ASEAN exports. Agro-based exports account for a little over 5%, while electronic goods (other than IT components and equipment) account for nearly 4%.
Unfortunately, volume data for these trade flows – which is more directly relevant from the perspective of shipping requirements – is not available at present. It is likely that, given the relatively low unit value of most agro-based products, the proportion of total trade volume contributed by this sector is considerably higher than comparative value figures would indicate. This is probably true also, although to a lesser extent, for wood-based products.
C. SECTOR ROADMAPS Sector roadmaps have been prepared for the each of these priority sectors. According to
these roadmaps, import duties for products under the priority sectors will be fully eliminated by 2007 for ASEAN-6 and 2012 for the new members of ASEAN or 3 years earlier than the original target under the ASEAN Free Trade Area (AFTA). Approximately 4,000 tariff lines or about 40% of total tariff lines in ASEAN are included in the fast track integration.
The roadmaps include:
• For ASEAN-6, the elimination of import duties on priority sector products by 2007
• For CLMV, elimination of import duties on priority sector products by 2012
• Acceleration of the harmonisation of product standards and technical regulations
• Mutual recognition of test reports and certification
Non-priority55.8%
Fisheries0.6%
Rubber-based0.7%
Healthcare0.8%
Automotive1.3%
Wood-based1.7%
Textiles and Garments2.2%
Electronics3.7%
ICT27.8%
Agro-based5.4%

Promoting Efficient and Competitive Intra-ASEAN Shipping Services
REPSF Project 04/001: Final Main Report 17
• Measures facilitating the movement of business persons and professionals
• Measures to facilitate the electronic processing of trade documentation.9
D. PRIORITY SECTORS AND MARITIME TRANSPORT REQUIREMENTS Recent growth, geographical distribution and commodity composition of each of the nine
priority sectors that involve the movement of physical products are reviewed in Appendix 2.
No authoritative forecasts are at present available for future intra-ASEAN trade flows in the priority sectors. The comments and judgments below must therefore be taken as indicative only, based on the brief analysis of trade patterns in these commodity grouping that was possible within the context of this study.
1. Agro-based products Agro-based products cover a wide range of products. Although representing only a
small proportion of the total value of intra-ASEAN trade in this sector, trade in cereals – and in particular rice and maize – takes place in large volumes, and therefore has an importance to the shipping sector that is greater than its share in trade value might suggest. These commodities travel in a range of forms, sometimes in bulk in open-hold vessels, sometimes as bagged cargoes on multi-purpose ships, and sometimes (increasingly) in shipping containers. These trade also tend to involve secondary ports located in or near to production regions, and they are particularly dependent on the provision of an adequate multi-purpose berths at such ports.
Most high value-added agro-based products will travel by sea in containers. Ensuring adequate and efficient intra-ASEAN container shipping services will therefore be important to the future development and increasingly sophistication of these industries. A significant proportion of this trade, including meat and dairy exports, is dependent on temperature controlled transport, and this proportion is likely to increase. ‘Cool chain’ logistics is very demanding, and requires a smoothly functioning intermodal transport system. Logistics improvements in ASEAN will therefore be vital to the increased integration of this sector.
2. Fisheries products The majority of intra-ASEAN trade in this sector is with fresh, chilled or frozen product.
The geographical distribution of the trade suggests that a significant share may be transported by the fishing vessels themselves.
Some of the highest value products (e.g. fresh crustaceans) will also travel by air freight. But commercial shipping services will still account for the majority of cargo volume. There appear to be few if any conventional refrigerated cargo ships operating in the ASEAN region, and the use of such vessels is declining internationally. The future mode of transport of perishable products in this sector is likely to be refrigerated trade containers. This may pose some challenges in the future, as the asymmetrical trading patterns typical of these commodities will mean imbalances between the need for refrigerated containers in one direction and for general purpose dry containers in the other.
9 Gallacher, 2004.

Promoting Efficient and Competitive Intra-ASEAN Shipping Services
REPSF Project 04/001: Final Main Report 18
As with value-added agro-based products, the potential loss from spoilage means that high quality intermodal logistics operations will be critical to the future integration of this sector.
3. Health care products Most of the products currently traded in this sector will be shipped in containerised
form using standard dry containers, although some of the highest value components may rely on air transport.
There do not appear to be any specific challenges that will arise from the integration of this sector. The shipping requirements that will be needed to support increased ASEAN trade in health care products are likely to be the same as those that will affect many other general cargo flows: smoothly functioning ports and CIQS operations; adequate and reliable container shipping services provided a broad coverage of ASEAN ports; low transit times; good cargo care; and competitive freight rates.
4. Rubber-based products The rubber-based products sector is a low growth sector in general – in fact, both
ASEAN exports and imports have declined in recent times, and even with closer integration is unlikely that there will be great growth in intra-ASEAN trade in this sector.
Trade in this sector is currently dominated by the movement of natural rubber, which represents well over half the value and approximately 90% of the volume of goods traded. Historically multi-purpose vessels loading at secondary ports have played a major role in this trade. There does appear to be an increasing trend towards containerisation, but this process is far from complete and may never be so. Ensuring that relevant ports continue to provide adequate facilities for non-containerised general cargoes will therefore have a special significance for this trade.
5. Wood-based products Trade in this sector is quite varied, varying from a trade in ‘wood in the rough’ (HS
code 4403) to relatively high value wooden kitchenware, tableware and ornaments.
Much of intra-ASEAN trade in ‘wood in the rough’ is cross-border trade from Lao PDR and Myanmar to Thailand which does not involve a shipping movement. However, there is a substantial sea-borne trade in this component from Malaysia and Indonesia. Such operations often take place outside of the formal port system, lightering from barges or landing craft on to dedicated log carriers, in a process controlled by the logging company. The major challenge for shipping policy in this area is to ensure adequate control of environmental and safety performance of the vessels, which often operate at locations remote for normal port control procedures.
The second major component of trade in the sector is trade in sawn and dressed timber. This is a difficult product to containerise, and is commonly shipped on dedicated or semi-dedicated vessels calling at multi-purpose berths. As with the trade in raw rubber, the continued availability of appropriate, well-maintained multi-purpose berths and appropriate stacking areas is critical to the efficiency of this trade. The aging of the general cargo fleet may also pose some future challenges for this component.
Finished manufactures of wood now generally travel as containerised cargoes, and have no specific requirements. Rather, they share the common cross-sectoral needs of general cargo shippers listed in the subsection on health care products above.

Promoting Efficient and Competitive Intra-ASEAN Shipping Services
REPSF Project 04/001: Final Main Report 19
6. Textiles and garments Intra-ASEAN trade in textiles and garments has grown only very slowly, as have total
ASEAN imports in this sector. It seems unlikely that volumes will increase massively even with closer economic integration.
Product life-cycles in the finished garment industry in particular can be very short, and made-to-order manufacturing is becoming increasingly the norm in the sector. Successful economic integration of the sector will entail cultivating the ability to respond to these demands, and this in turn will require a high level of sophistication in inter-modal transport. Otherwise, the shipping requirements that will be needed to support increased ASEAN trade in this sector are the common cross-sectoral needs of general cargo shippers listed in the subsection on health care products above.
7. Electronics and ICT These sectors are considered together as they share many similar characteristics and
the boundary between them is somewhat artificial.
A large proportion of intra-ASEAN trade in electronic and ICT equipment is two-way trade in these commodities between Singapore and Malaysia. Although no data is available on how this trade is transported, it is probable that the majority is carried by road. Insofar as future integration of the sector involves a deepening of this relationship, as opposed to a broadening of geographical coverage of the trade, there will be few implications for maritime transport.
This sector also includes a number of commodities with a high value per unit of weight. This characteristic, together with the fact that much of the trade consists of critical intermediate inputs into manufacturing processes, suggests that air freight may play an increasing role in this sector.
However, if North Asian experience is any guide substantial volumes will continue to move by sea transport – specifically, in container ships. As with several of the other priority sectors, the electronics and communications sectors are typically reliant on short lead times and high quality product care. Further integration of the sector will therefore require a high level of sophistication in inter-modal transport. Otherwise, the shipping requirements that will be needed to support increased ASEAN trade in this sector are the common cross-sectoral needs of general cargo shippers listed in the subsection on health care products above.
8. Automotive Growth in intra-ASEAN trade in this sector has been strong, and the prospects for
continued growth appear strong.
Both the broad geographical distribution of the trade and the nature of the commodity suggest a heavy reliance on sea transport. From a shipping perspective, the automotive sector can be divided into two major elements:
• The trade in built-up motor vehicles
• The trade in motor vehicles parts and accessories, including whole vehicles.
The first of these will generally be moved on dedicated vehicle carriers: specialised ro-ro vessels dedicated to the motor vehicle trade. The second will generally be carried in containers on scheduled container services. Increased integration of the ASEAN automotive industry will provide a stimulus to both elements of the trade, but will probably have a greater impact on the movement of boxes.

Promoting Efficient and Competitive Intra-ASEAN Shipping Services
REPSF Project 04/001: Final Main Report 20
In both cases, the trade typically moves through major metropolitan ports rather than secondary regional locations.
Vehicle carrier operations are for the most closely controlled by manufacturers, using vessels on the global market and deployed in accordance with the shipper’s needs. Provided adequate port facilities are available, there are likely to be few problems in adapting to increasing trade in built-up vehicles.
The increasing specialisation in the production of specific components is a likely consequence of increased integration of the ASEAN automotive industry. It is likely to increase the transport-intensity of production: in particular, to generate a more-than-proportionate increase in the demand for container shipping services. With large quantities of capital tied up in intermediate goods, transit times and service reliability in container shipping are likely to become increasing critical. This is likely to breed increased pressure for direct shipping services between major ASEAN destinations, a demand for improved and more consistent port performance, and a level of investment in port infrastructure that keeps congestion in key ports to a minimum. As with so many of the products in the priority sectors, it will also demand a high level of sophistication in logistics services.

Promoting Efficient and Competitive Intra-ASEAN Shipping Services
REPSF Project 04/001: Final Main Report 21
IV. OVERVIEW OF SHIPPING POLICIES
This chapter provides an overview of the current state of ASEAN shipping policies. It draws heavily on the material contained in the Country Reports, but arranges this material thematically. It contains an overall appraisal of:
• General shipping policy • Management of the national shipping register • Regulation of competition in liner shipping • Subsidies, tax concessions and other promotional measures • Cabotage restrictions • Manning issues
More details on each of these issues will be found in the Country Reports.
A. GENERAL SHIPPING POLICY The shipping policies of ASEAN countries, which have historically been very diverse,
have in recent years tended to converge on a model which emphasises open access and private sector participation.
For the planned economies of ASEAN, preparing for entry to the WTO is providing a significant stimulus for legislative and regulatory change. In Cambodia, for example, the Ministry of Public Works and Transport is in the process of drafting the new maritime law to deal with the issues raised by Cambodia's joining the WTO. Vietnam is also in the process of reforming its legislation.
There have also been recent moves to increase the level of accession to International Conventions. ASEAN’s record in this regard has historically been patchy.
Finally, there is a discernible tendency to move from the development of shipping policies to the development of coherent intermodal transport policies. This reorientation has been evident for some time in Malaysia and Singapore. The Philippines and Thailand have also recently adopted policies that focus on the development of integrated multimodal systems.
Formerly state-owned lines have been either privatised or corporatised. For instance the governments of Indonesia, Malaysia, The Philippines, Singapore, and Thailand invested in shipping in the 1960s and 1970s. Neither the Philippines nor Thailand any longer has a significant level of state participation in shipping operations.
Singapore and Malaysia have both long since privatised their national lines, although in both cases a substantial stake continues to be held by government-owned entities. For example, Malaysian International Shipping Corporation (MISC) was incorporated as a public company in 1968, and listed on the Kuala Lumpur stock exchange in 1997. National oil company Petronas is now the major shareholder in MISC, holding 65%.
The Federation of Malaysian Manufacturers (FMM) is responding to its members’ concerns of a shortage of space for Malaysia hinterland cargo. Given shipowner preference for long haul cargo in the mainline trade, the shortage of space is most acute in short-haul trades, such as those to ASEAN countries. It is lobbying Government to consider the establishment of a new national shipping line. The main thrust of their argument is that without a viable national carrier, exporters find themselves at the mercy of overseas lines, which will maximise profitability without concern for protecting regional/national trade.

Promoting Efficient and Competitive Intra-ASEAN Shipping Services
REPSF Project 04/001: Final Main Report 22
State-owned lines still play an extremely important role in the maritime sectors of Myanmar and Vietnam.
B. NATIONAL FLAG ADMINISTRATION The ASEAN community consists of a mix of open and closed registries.
The Singapore registry, the region’s largest, is an open registry that has been used as a vehicle to enhance Singapore’s status as a maritime hub rather than to encourage national ship ownership. Singapore has the 6th largest shipping registry behind Panama, Liberia, Bahamas, Greece and Malta.
The Singapore register is open to citizens and permanent residents of Singapore, as well
as companies incorporated in Singapore10. A vessel may be registered under the ownership of a locally-owned or a foreign-owned company. A locally-owned company is defined as one in which more than 50% of the equity is owned either by citizens of Singapore or by a Singaporean company. A vessel, other than a tug or barge, owned by a company, whether locally-owned or foreign-owned, may only be registered if the company has a minimum paid-up capital of S$50,000. A foreign-owned vessel must be at least 1,600GT and be self-propelled. There are no restrictions on the age of vessels that may be registered. However, a vessel above 17 years old may only be registered if the Registrar is satisfied that it is in a satisfactory condition in all respects.
Cambodia and Vietnam also operate open registries.
The other ASEAN countries operate a closed registry, which means that there is a link between the registered shipping line and the flag state.
• Brunei adopts a closed registry, which means that there is a link between the registered shipping line and the flag state. Vessels registered as Brunei Darussalam ships may be owned by the following qualified owners:
− Citizen of Brunei Darussalam; or
− Bodies Corporate established under and subject to the laws of Brunei and having their principal place of business in Brunei Darussalam.
• In Indonesia, registered vessels must be owned by Indonesian citizens or by a company ‘existing under the Law of Indonesia’, and must be crewed by Indonesian nationals. However, foreign investment requirements for shipping companies in Indonesia are quite relaxed and industry contacts suggested that the enforcement is not rigid.
• To fly the Malaysian flag, a vessel must be 51% owned by Malaysian interests. The Merchant Shipping Amendment Act (1997) created a second register, the Malaysian International Shipping Registry, as one plank of a policy designed to encourage the development of the Malaysian shipping industry leading to increased employment opportunities and technology transfer. Features of the Malaysian second register are as follows:
− The company owning the vessel must be incorporated in and have an office in Malaysia;
− The ship manager must be a Malaysian citizen or corporation;
10 In the case of a company incorporated in Singapore, there are no restrictions on the proportion of
equity that may be owned by foreign interests. However, the company must have a minimum paid up capital of S$50,000. For tugs, barges and local companies and their holding companies, the paid-up capital will be pegged to 10% of the value of the first tug or barge registered or S$50,000 whichever is the lesser, subject to a minimum of S$10,000.

Promoting Efficient and Competitive Intra-ASEAN Shipping Services
REPSF Project 04/001: Final Main Report 23
− The company must have a paid up share capital of 10% of the value of the ship or RM one million, which ever is higher; and
− Tankers or bulk ships must be less than 15 years old, and other ships less than 20 years.
• To fly The Philippines’ flag, the vessel’s owner must have substantial Philippines’ representation at management and board level. However, a similarly structured company can bareboat charter a vessel and register it under The Philippines’ flag for a minimum period of one year.
• To be eligible for registration as a Thai vessel trading with foreign countries, a ship must be either:
− Owned by natural persons11; or
− Owned by a Thai company with a majority of Thai directors and at least 51% of shares held by Thai nationals.
No restrictions are applied on the age, size or country of build of the vessel.
In most cases where there is a closed registry, there is a requirement that some or all of the crew should be nationals of the flag state.
C. COMPETITION POLICY WITH RESPECT TO LINER SHIPPING Unlike the United States, the European Union and Japan, few ASEAN countries have a
clear legislative framework for regulating the behaviour of shipping conferences or dominant shipping lines. In many cases, this reflects the absence of general competition legislation, which generally forms the background against which specific provisions relating to international liner shipping are framed.
• Brunei does not regulate the activities of liner shipping. Further, Brunei does not have any anti-trust laws. However, the economy is relatively open and market-oriented and efforts are being made to increase competition in accordance with the domestic situation and WTO commitments.
• Indonesia has not attempted to control the activities of shipping conferences. However, we note that Law No. 5/1999 Prohibition of Monopolistic Practices and Unfair Business Competition, contains provisions on prohibited contracts and activities, dominant positions, and establishes a Commission on Business Competition Supervision. The Law became effective in March 2000.12
• Malaysia does not have general competition legislation. Nor is there any governing body overseeing or administering competition rules or regulations, including the monitoring of abuses within the market or restrictive business practices.
• The Philippines has no anti-trust law applying specifically to the maritime sector, and The Philippines Government has not sought to control the activities of shipping conferences. The Philippines Constitution of 1987 prohibits anti-competitive practices, combinations in restraint of trade and unfair competition. Industry specific laws or executive orders strengthen the competition policy framework. For example, Executive Order No 185 (1994) fosters competition in coastal shipping by liberalising rules relating to the entry of new operators to established routes.
• Historically, Singapore has not regulated the activities of liner shipping. While in Singapore, the Government has long subscribed to the philosophy that competition, both
11 A natural person is defined as a person of Thai nationality. 12 APEC Competition Policy and Law Database (http://www.apeccp.org.tw)

Promoting Efficient and Competitive Intra-ASEAN Shipping Services
REPSF Project 04/001: Final Main Report 24
international and domestic, is desirable for the health of the economy, it has regarded the world as its marketplace, and international competition is thought of as an ‘invisible hand’ disciplining the domestic economy13. Singapore passed legislation to ban certain anti-competitive practices in 2004, although the legislation will not come into effect until 2006.
• The Thai Government has not pursued an active anti-trust policy in the maritime sector. We note that significant changes have recently been made to competition legislation in Thailand. In 1999, Thailand enacted the Prices of Goods and Services Act B.E. 2542 (1999) and the Trade Competition Act B.E. 2542 (1999) with a view to ensuring free and fair competition in trade in goods and services.14 Section 27 of the Business Competition Act defines the types of anti-competitive conduct that are prohibited. The activities of conferences, consortia and stabilisation agreements, especially with respect to joint pricing and monopolisation, would appear to come within the scope of the Act. However, under s. 35(2) of the Act, enterprises must be declared ‘controlled businesses’ before action can be taken. The Maritime Sector has not been declared
• Vietnam has not adopted an active stance towards shipping conferences. Vietnam does not have a general competition law, although a number of laws and sub-laws have pro-competition clauses.
D. SUBSIDIES, GRANTS AND TAX INCENTIVES The development of a significant shipping industry is an important element of the
maritime policy for many ASEAN countries. There are however some exceptions to this: Brunei, Cambodia and (understandably) Lao PDR do not have large shipping fleets15, and do not appear to have policies directed toward building a national shipping capability.
• Indonesia does not have a clearly structured program of support for its shipping industry. Some indirect benefits may flow to Indonesian operators from the long-running exemption from import duties and import sales taxes on purchases of materials, equipment, machinery and spare parts enjoyed by the Indonesian shipbuilding and ship-repairing industries. These measures and those relating to financing of ships are covered in a new Inpres than was in the final stage of development during the interview program. The new Inpres and changes to the Mortgage Act are intended not only to further open up the industry and ease financing, but also to clarify and expand cargo reservation.
• Malaysia has a long-standing program designed to encourage the growth of the Malaysian fleet. Malaysia has a long-standing and systematic program of support for national shipowners. Fiscal incentives, many operating through the tax system, include”
− Tax Exemptions for shipping businesses
− Tax Exemption for ship’s crew
− Exemption of import duty and surtax for ships
− Accelerated depreciation on ships
− Income tax concessions to shippers suing Malaysian ships
− Concessional ship finance facility
• Myanmar provides an accelerated depreciation allowance, using the straight-line method.16
13 APEC Competition Policy and Law Database (http://www.apeccp.ord.tw). 14 Office of the Maritime Promotion Commission, personal communication, Nov 2000. 15 A significant number of vessels are registered under the Cambodian flag, but few are controlled by
Cambodian interests. 16 UN ESCAP, 1999, p.60.

Promoting Efficient and Competitive Intra-ASEAN Shipping Services
REPSF Project 04/001: Final Main Report 25
• In The Philippines, there are various measures that have been in place to assist ship owners.
The Maritime Vision 2000, under the President Fidel V. Ramos administration, provided a general framework for industry development, including:
− Executive Order No. 438 (1997) extended to bareboat chartering program until 2009;
− Republic Act No.7471 “An Act to Promote the Development of Philippines Overseas Shipping”, provides companies engaged in overseas shipping with exemption from income tax and import duties and taxes on vessels, spare parts etc.
− Maritime Liens and Ship Mortgage Bill (2003) designed to replace PD No. 1521 (the “Ship Mortgage Decree of 1978”), found to be out dated and unclear regarding maritime liens, thereby discouraging ship financiers extending loans to Filipino shipowners. The new bill redefines rights and obligations relating to liens to conform to international practice.
Other measures address a perceived difficulty in obtaining finance for ship replacement and upgrade. Targeted financial assistance to domestic shipping includes:
− Public Utilities Priorities Plan: Grants exemption to domestic shipowners from input duties and taxes on vessels, machinery and parts. Includes provision for income tax exemption
− Development Bank of Philippines – IBRD Iran facility of US$20 million to provide financial assistance for replacement and repair of vessels in the inter-island fleet
− World Bank: Loan facility for domestic shipping
− Domestic Shipping Modernisation Program (DSMP) commenced 1995 – Yen 15 billion fund for modernisation etc.
• Thailand has a clearly articulated policy of fostering the development of its national fleet. The Maritime Law 1992 gave Thai nationals a tax exemption on the purchase of vessels and reduced import taxes on the purchase of vessels from 30% to 1%17. The policies currently in place aimed at promoting the use of Thai registered vessels include:
− Packing credits: Packing credits are available to exporters using Thai vessels, the effect of which is to increase the volume of credit available to exporters to purchase promissory notes.
− Shipowners Fund: The Bank of Thailand (BOT) provides financial assistance through the Industrial Finance Corporation of Thailand (IFCT) and the Export-Import Bank of Thailand (EXIM) by way of promissory notes issued by IFCT or EXIM which are guaranteed by the Ministry of Finance. Of the total credit line of 8,000 million Baht, 4,000 million Baht is provided by BOT and 4,000 million Baht jointly by IFCT and EXIM. The credit is provided over a five year term, recently extended to 8 years. No further funds have been provided, although there is talk of a ‘revolving fund’. Final decisions over the creation of a revolving fund have yet to be taken.
− Tax Incentives: Under the Board of Investment Act, shipowners are granted exemption from import duties and corporate income tax. This assistance is provided on a case-by-case basis. To obtain assistance, shipowners have to set up a new ‘one ship company’ but interviewees reported that few companies qualify for the aid. The privilege is extended for a maximum of 8 years. Measures include:
− Exemption of import duty for vessels over 1,000 GRT
17 OECD, Maritime Transport, 1992.

Promoting Efficient and Competitive Intra-ASEAN Shipping Services
REPSF Project 04/001: Final Main Report 26
− Reduction of withholding tax on charter hire payments made by owners of Thai ships used for international trade from 15% to 1%
− Exemption from corporate income tax on income derived from the sale of ships used for international freight transport, providing income is used within one year to purchase replacement tonnage that is larger than the vessel sold
− Exemption from income tax on income paid to Thai or foreign seamen working aboard Thai flagged ships.
• The Singapore Government’s current policy aims to build on the strength and reputation of the port of Singapore by developing a comprehensive cluster of shore-based maritime service industries – including bunkering, marine insurance, ship management and ship repair18. Incentives are used to attract foreign shipowners to register vessels in Singapore. An Approved International Shipping Enterprise Scheme (AIS), providing conditional tax benefits to international shipping companies, was introduced in 1991. To qualify, companies must be significant owners and/or operators of vessels. Shipping companies awarded AIS status are exempt from paying tax on income earned from qualifying activities19. We understand that over 40 shipping companies, controlling some 1,000 vessels, operate under the AIS and benefit from tax and other concessions.20
In the 2004 budget, the AIS was extended so that ‘with effect from YA 2005, all onshore charter income received by an AIS company will be tax exempt..21
To encourage the growth of maritime-related service industries, Singapore offers a variety of tax breaks and tax exemptions. For example, tax breaks to promote the marine insurance industry have been introduced, including encouragement for professional reinsurers to write offshore business in Singapore. A concessional tax rate of 10% is granted to insurance companies on income derived from underwriting profits stemming from offshore insurance business. Other services sectors - including transport, logistics, warehousing and distribution activities – are offered lucrative incentives to invest in Singapore. These incentives include:
− accelerated depreciation allowances and investment incentives allowing exemption of taxable income of an amount equal to a specific percentage, not exceeding 50 per cent, of fixed capital expenditure
− exemption of corporate tax for up to 10 years for income arising from pioneer activities
− a concessionary tax rate of not less than 10 per cent for up to 10 years for companies with qualifying activities
− warehousing and servicing incentives (50% of qualifying export income is exempted from tax; the tax relief period is 5 years, with provision for extension.)
− export of services incentives (90% of qualifying export income is exempted from tax; the tax relief period is 5 years, with provision for extension).
• Vietnam national carrier Vinalines’ fleet development is supported by low interest loans from Government.
18 Transport Minister Yeo Cheow Tong has argued that ‘Singapore should not just be a place to
tranship goods, or buy bunkers and supplies. We want to create value, and be a one-stop shop for shippers, shipowners and shipping lines, so that all their needs can be met here.’ See ‘Singapore wants larger marine insurance role’, Straits Times (Singapore), 13 September 2004.
19 ‘Incentives – Glad Handing’, Lloyd’s Maritime Asia, May 1992, p.13. 20 See ‘Use S’pore as launch pad for Asia, Yeo urges marine insurers’, Business Times (Singapore),
13 September 2004. 21 Budget Speech 2004. http://www.budget2004.gov.sg/budget_speech/subsection26.1.html. Accessed 19 Dec
2004.

Promoting Efficient and Competitive Intra-ASEAN Shipping Services
REPSF Project 04/001: Final Main Report 27
E. CARGO RESERVATION POLICIES Historically, cargo reservation (a policy that restricts what cargoes may be carried by
which carriers, usually used to provide preferential access for national lines) has played a significant part in ASEAN shipping policy. However, this approach to national fleet development has fallen out of favour both with ASEAN and globally, and as far as international shipping is concerned, there are now only a few residual elements. (Cargo reservation, in the form of cabotage, is still widespread in domestic trades: this is dealt with in a separate section.)
In Cambodia, while there is no formally articulated cargo reservation policy, the monopoly position of the Kampuchea Shipping Agency & Brokers (KAMSAB) means that it could in principle act as a ‘freight bureau’: a monopoly purchaser of shipping services. In practice, it appears that it does not do this, and that access to cargoes is essentially open, although the requirement to use KAMSAB is considered by many to result in an unnecessary cost.
Cargo reservation has a long history in Indonesia. Under Presidential Decree 18-82, Indonesia reserved Government cargo (broadly defined) for national flag carriers. In the 1970s and early 1980s, Indonesian shipowners entered into several bilateral trade-sharing agreements. These cargo preference and trade-sharing arrangements were wound back in the late 1980s and 1990s, and by the early 1990s a number of cargo reservation measures were reported to be non-operational.22 Indonesia’s responses to APEC’s Transparency Exercise Questionnaire indicated that cargo reservation is now confined to reservation of Government and State owned enterprise import cargoes, which must be carried by Indonesian-flag vessels.
Restrictions on agency participation in Indonesia can act as a low-level barrier to entry and form of cargo reservation. There are no independent agents in Indonesia: to be a shipping agent, it is necessary also to be a ship owner with at least one vessel and a minimum of 5,000 DWT, which can be a total rather than one vessel. Hence, there are many companies owning one ship, often not even operating the vessel. Foreign shipowners can only enter agency work through an arrangement with a local owner/agent.
In The Philippines, cargo owned by Government or purchased with public funds or under Government guarantee requires a waiver to move on non-Philippine vessels.
Thailand has historically practiced cargo reservation. Thailand concluded bilateral shipping agreements, including provisions for cargo sharing, with China and Vietnam in 1979.23 This policy has been progressively unwound. Thailand removed the cargo sharing provisions from its bilateral agreements with China (in 1995) and Vietnam (in 1999), with the result that Thailand no longer has any bilateral agreements restricting access to cargo.24
Residual restrictions are limited to Government-controlled cargoes.25 The Mercantile Marine Promotion Act of 1978 required Government-generated cargo to be carried by national flag vessels, but there is provision for a waiver where no Thai vessel is available. Similarly, Ministerial Regulation No. 2527, adopted in July 1984, required all private firms engaged in business transaction with Government agencies or State enterprises to carry imports in Thai vessels where possible. Government cargoes continued to be reserved for Thai ships operating on 7 routes: Thailand-Japan, Thailand-South Korea; Thailand-Taiwan, Thailand-Hong Kong, Thailand-Singapore, Thailand-Eastern Europe, Thailand-United States. These regulations are still in force, but are said to apply to less than 100,000 tonnes of cargo per year.
22 See US Maritime Administration, Maritime Subsidies, September 1993. 23 OECD, Maritime Transport, 1994. 24 Meyrick and Associates, APEC Stage 2 Report. 25 US Maritime Administration, Maritime Subsidies, September 1993, p.154.

Promoting Efficient and Competitive Intra-ASEAN Shipping Services
REPSF Project 04/001: Final Main Report 28
In UN ESCAP’s 1999 review of market access arrangements amongst countries of the ESCAP region, Vietnam indicated that it still pursues the 40:40:20 cargo sharing formula of the UNCTAD Code.26 However, during the field work program it was noted that Vietnamese vessels now account for only around 20% of Vietnam’s foreign trade, and the preparations now under way for WTO accession appear to be incompatible with the continuance of such a policy.
F. CABOTAGE Cabotage restrictions remain in place in all of the ASEAN nations that are either
archipelagic or have an extensive coastline: Brunei, Cambodia, Lao PDR and Singapore do not have cabotage restrictions.
• In Indonesia, Regulation PP17 (1988) reserves coastal trades for Indonesian-flag vessels, provides operating subsidies for vessels used on selected inter-island routes, provides construction subsidies for vessels used for domestic trades, and requires that crews be Indonesian citizens.
Indonesian law allows foreign companies to participate in local trade, providing they do so in joint ventures with Indonesian partners. Government Regulation No. 20 (1994) allows up to 95% overseas investment in shipping ventures.27 In addition, the Industrial Shipping Law 1988 allows shipping lines to use foreign flag vessels when local flag tonnage is not available. The legislation stipulates that when time charters extend beyond six months, 50% of the chartered vessel’s crew must be Indonesian nationals. However, according to Containerisation International, the rules have been circumvented by the replacement of one chartered vessel with another at the end of the six months period.28
Whilst Indonesia practices cabotage, the policy does not appear to have been effective in reserving domestic cargoes for Indonesian owned and flagged vessels. INSA, the Indonesian National Shipowners’ Association, commented that, after Inpres 4/1985 opened up Indonesian ports to foreign ships, the previous INSA-Singapore agreement to share trade collapsed. Suddenly 144 Indonesian ports were open to foreign trade and foreign ship calls, resulting in a collapse in Indonesian market share. Some US$11 billion in income has been lost to foreign carriers.
Further comment by various interviewees suggests that the Government has difficulty in applying and enforcing cabotage provisions in the domestic shipping industry. In fact INSA reports that its members now achieve only 50% of the 117 million tonnes moved yearly. They would like to achieve 80% immediately, with the help of the proposed draft Inpres, then 100% after 3 years. For passengers, containers and logs, cabotage is already fully applied. The next targets are coal and oil. Others suggest that these levels may not be achievable, given the current difficulty in enforcement and shortage of Indonesian flagged tonnage.
• The cabotage trade in Malaysia is administered by the Domestic Shipping and Licensing Board (DLSB), set up in 1980, part of the Maritime Division of the Ministry of Transport. In order to participate in the cabotage trade a license per vessel is required by a Malaysian citizen or company. The DSLB grants three types of licences:
− Unconditional licence is granted to a Malaysian entity in respect of a Malaysian flagged vessel on the condition that it:
a) is qualified to own a Malaysian flagged vessel according to the law stipulated for owning a Malaysian ship;
26 UN ESCAP, 1999, p.77. 27 OECD, Maritime Transport, 1994. 28 Containerisation International, September 1997, p.61.l

Promoting Efficient and Competitive Intra-ASEAN Shipping Services
REPSF Project 04/001: Final Main Report 29
b) has 30% bumiputra participation in terms of equity, directorship and office staff; and
c) employs Malaysian citizens as ratings on the vessel in question to the tune of 75%.
− Conditional licenses are granted to vessels meeting some, but not all, of the above conditions.
− Temporary licences, upon exemption given by the Minister of Transport, are granted to Malaysian companies that are required to operate foreign flagged vessels due to the non-availability of suitable Malaysian flagged vessels
• Myanmar reserves coastal cargoes to ships registered domestically.29
• In The Philippines, cabotage continues, with only Philippines’ vessels allowed to lift domestic cargo. There has been some loosening up, with overseas vessels allowed to carry empties between ports as long as this is for positioning and not carried as cargo. If it can be shown that no local owned vessel is available, domestic cargo can be carried under a single voyage permit issued by Marina. This has been happening frequently but mostly for tankers and gas carriers.
• In Thailand, the Vessels Act 1938 reserves coastal trade for Thai-flagged vessels. In October 1985, the Vessels Act was amended to allow foreigners to own up to 49% of Thai vessels employed in international trades (foreigners are only allowed to own 30% of Thai vessels employed in coastal trades).
If no suitable Thai vessel is available, owners may seek permission to employ a foreign flag vessel. The Ministry will advertise for suitable ships with the proviso that, if no suitable ship found, a foreign vessel may be employed. There has been no other relaxation of restrictions on employment of foreign vessels.
• Transportation of cargoes between Vietnamese ports and harbours is wholly reserved for vessels which are Vietnam-owned, fly the flag of Vietnam and have a Vietnamese crew (except for some specialised officer positions). In cases where Vietnamese coastal vessels are unable to handle a cargo, foreign vessels are allowed to operate on the coast under (single voyage) licence from the Minister of Transportation, which will normally only be granted after consultation with Vinamarine and Vinalines. State-owned Vinalines enjoys a privileged position in the carriage of coastal cargoes.
G. MANNING ISSUES Manning issues were a recurrent theme of our consultation program, with some ASEAN
countries suffering from an acute manning shortage while others are major international exporters of seafarer labour.
Shipowners’ representatives identified manning as a major problem in Malaysia, attributing it largely to changing social patterns. As Malaysia becomes more developed, its rate of population growth is declining. Few now want to go to sea and those that do qualify as seafarers, stay a short time and then go into the many shore jobs available. Whilst industry statistics show a massive workforce, some of those interviewed suggested the statistics are misleading. Once registered, a name is not removed, so many on the register may have departed the industry. Interviewees felt that Malaysia will shortly experience shortages of maritime labour similar to those faced by the UK 20 years ago and Singapore more recently.
Malaysia allows foreign nationals to serve on Malaysian ships provided that they have a permit obtained from the Marine Department. Ostensibly, there is no impediment to employing foreign seafarers on international vessels as long as their qualifications are
29 UN ESCAP, 1999, p. 89.

Promoting Efficient and Competitive Intra-ASEAN Shipping Services
REPSF Project 04/001: Final Main Report 30
genuine, although there were indications that the procedures for doing so are somewhat cumbersome. Estimates suggest that the current ratio of Malaysians to foreigners in the fleet is 60/40, but sources feel that it will move to 50/50 shortly. Regulation requires a certain percentage of crewing on domestic vessels must be nationals (51%). However, this is not rigorously enforced. Even if not complying, vessel owners are effectively only asked to redress the situation in due course.
Interviewees in both Thailand and Indonesia also reported difficulty in obtaining sufficient skilled crew to meet the demands of the industry.
The Philippines on the other hand is a net supplier of seafarers of global importance. The recruitment industry supplies Filipino crews for the world’s fleet, with over 200,000 seafarers contributing 25% to 28% of the global crew, and US$2.5 billion to The Philippines economy. A major initiative is under way to further boost the recruitment industry. The initiative, administered by the Philippines Seafarers’ Promotion Council, is focused on developing quality amongst the seafarers, protecting this major industry from competition from lower cost providers.
H. SUMMARY It is clear from the general review of policy developments in individual ASEAN economies
that there has been significant progress in maritime liberalisation over the last decade. This mirrors the broad developments that have taken place in international shipping more generally, and which are noted in the APEC study on Facilitation of International Shipping30:
• Cargo reservation measures have been very significantly reduced and in many cases completely abandoned;
• Privatisation and commercialisation of government shipping operations have led to improved operating efficiency and reduced distortions in the shipping market;
• Liberalisation of the provision of port services and the encouragement of private investment in port facilities have enhanced productivity and accelerated port development;
• Formal discrimination between the vessels of different economies in the terms and conditions of access to port services has been virtually eliminated;
• Greater flexibility in the requirements for vessel registration has created conditions in which national shipowners can achieve cost reductions without resorting to flagging out.
These advances have already notably contributed to improving the efficiency of intra-ASEAN shipping. However, it is also clear from the review of individual countries policies that some restrictions and distortions of the market remain. In many instances, these extend beyond the shipping sector itself to the landside services to ships and the intermodal transport system. The achievements of the past cannot be cause for complacency; they should serve as an encouragement that, with goodwill and a common purpose, further improvements to shipping services are an achievable objective.
30 Meyrick and Associates. Facilitation of International Shipping. Report prepared for APEC Transport
Working Group, 2000.

Promoting Efficient and Competitive Intra-ASEAN Shipping Services
REPSF Project 04/001: Final Main Report 31
V. THE ASEAN SHIPPING SYSTEM
A. ASEAN SHIPPING FLEETS
1. Defining the Regional Fleet Vessels providing services between two countries can fall into three main categories:
1. Vessels registered and operated by organisations within target countries;
2. Vessels registered elsewhere but operated by organisations within the target country (‘flagged out’); and
3. Vessels owned, registered and/or managed/operated elsewhere offering services between target countries (‘cross traders’).
Data on these vessels can be captured in various ways. In the first categories, Lloyds Register, which issues the unique number now universally applied to commercial vessels, provides the definitive source. Whilst many vessels in the other categories will be relevant, the vessels registered in the target countries will be of primary interest as they will probably provide the most fertile ground for reform and improvement of services, since flag countries will often have a greater level of influence over the operators.
The information contained in this paper is a summary of data on ASEAN registered fleets obtained from Lloyds Register of Shipping/Fairplay database, correct as at 20 July 2004. The data is limited only to vessels under the flag of the ASEAN country. The focus is on vessels carrying commercial cargoes, thus excluding such categories as fishing, towage and offshore support, inland trading and recreational.
2. Composition of the Registered Fleet Table 3 shows the overall number in main ship types (dry cargo including containers,
tankers and bulk carriers). It also provides a generalised age and size distribution. In the second and third categories set out above, there will be many vessels trading in and from the focus countries that are ‘flagged out’ or ‘cross trading’: these are not included in Table 3.
The profile of ASEAN registered tonnage carried out in this study paints an interesting picture of the diverse nature of the industry. The following table reproduced from that review shows the difference in the fleet make-up for the different nations.
A detailed analysis of the fleets registered in each ASEAN country is provided in the Country Reports. The analysis comprises a size and age distribution for the critical sectors: tankers, container vessels and bulk carriers. In many economies there is a large fleet of general cargo vessels, many of small size and varying levels of antiquity. Where this sector is a significant proportion of the fleet, a size and age distribution has also been calculated.
The fleets differ with the very different nature of the economies. Size and age distribution reveals some underlying weaknesses, particularly in the aging of particular sectors. For instance, of the 220 tankers shown for The Philippines, almost half are over 25 years old. Similarly, in the Indonesian fleet, nearly 200 of the 304 tankers are over 25 years. In the Cambodian fleet, of the 490 general cargo vessels, approximately 270 are over 25 years. Perhaps most disturbing, is the small number of younger vessels, indicating a low or non-existent replacement program.
Not surprisingly, the fleets of Malaysia and Singapore show a much more even age distribution, and many new buildings, indicating healthy replacement policies at work. A pro-active policy to ensure access to capital and an enlightened approach to safety and environmental regulation will be key to encouraging progress on such issues.

Promoting Efficient and Competitive intra-ASEAN Shipping Services
REPSF Project 04/001: Final Main Report 32
Table 3: Summary of ASEAN Registered Shipping Fleets
ASEAN COMMERCIAL SHIPPING FLEET ANALYSIS: SUMMARY
ASEAN country
Brun
ei
Dar
ussa
lam
Cam
bodi
a
Indo
nesi
a
Laos
Mal
aysi
a
Mya
nmar
Philip
pine
s
Sing
apor
e
Thai
land
Viet
nam
Container vessels Panamax and smaller 6 36 52 5 166 22 3Post Panamax 2 46Total container vessels 0 6 36 0 54 0 5 212 22 3
General cargo/passenger General 5 448 889 1 178 28 421 93 162 543General/pax 1 30 1 3 43 1 11Reefer 17 3 1 4 27 3 32 7Ro-ro cargo 2 9 155 39 9 68 56 1 1Ro-ro/pax 3 2 66 16 2 112 7 12Passenger (pax) 1 146 85 2 112 55 13 2Other 6 3 2 10 5Total dry cargo incl containers 10 490 1328 1 376 48 798 431 243 567
Tanker Up to 100,000 gt 36 304 172 6 220 558 244 63>100,000 gt 14 38Total tankers 0 36 304 0 186 6 220 596 244 63
Bulk carriers Handysize 9 33 22 13 33 53 9Handymax 10 9 17 7 28 31 3 9Panamax 3 13 55 36Capesize 7 6 33Total bulk carriers 0 19 45 0 59 7 102 133 56 18
Grand total Grand total 10 545 1677 1 621 61 1120 1160 543 648
Source: Lloyds Register database at 26 July 2004

Promoting Efficient and Competitive Intra-ASEAN Shipping Services
REPSF Project 04/001: Final Main Report 33
3. Composition of the Owned Fleet Statistics on the fleet of vessels controlled by nationals of ASEAN countries are not
readily available. However, some data is available for the ASEAN countries with the five largest fleets. This is presented in Table 4 below. We understand that there are few ships of the other ASEAN nations registered under foreign flags.
Table 4: Beneficially Owned Fleets of Leading ASEAN Ship Owning Nations
Countrya Number of Ships DWT Nationally
registered Foreign
registered Total Nationally
registered Foreign
registered Total
Indonesia 519 91 610 3,225,973 1,088,783 4,314,756 Malaysia 254 52 304 5,790,177 798,897 6,589,074 Philippines 305 31 336 4,095,428 751,145 4,846,573 Singapore 457 257 714 12,637,368 6,764,542 19,391,910 Thailand 234 59 293 2,469,000 1,166,000 3,635,000
a. Country of domicile of beneficial owner
Source: UNCTAD (2003); for Thailand, UN ESCAP 1999.
B. INTRA-ASEAN SHIPPING SERVICES
1. Overview This section documents the regular shipping services operating between the ASEAN
countries.
Shipping between nations in the region is by a variety of modes: by container; in bulk; in dry bulk carriers or tankers; break-bulk in general cargo vessels; or in ro-ro services, comprising many modes from fast passenger/freight ferries, to basic landing craft or deck ships that abound in the Asian Pacific region.
2. Container shipping services The majority of intra-ASEAN general cargo movements are now containerised.
The structure of services in the intra-Asian region and in the trades between Asia, the Middle East and South Asia, is highly complex, mainly due to the sheer number of operators involved. As an illustration, in Figure 1 the number of services offering between Singapore and Malaysian ports is a staggering 368. Whilst many of these are different strings or segments being offered by one carrier, there are 80 lines involved in those services. In overall terms, the operations are divided between dedicated and common user feeder services, combination feeder and local carriers, regional specialists and global consortia and alliances between major lines.
Deep sea operators include the major lines, particularly those based in Asia, such as Evergreen, Cosco, Yangming, China Shipping, APL, NYK and OOCL. Korean carriers Hanjin and Hyundai and Europeans, Maersk/Sealand and P&O Nedlloyd are also strongly represented. Regional lines such as Wan Hai Lines, Regional Container Lines and Pacific International Lines feeder offshoot, Advance Container Lines, represent local interests.

Promoting Efficient and Competitive Intra-ASEAN Shipping Services
REPSF Project 04/001: Final Main Report 34
Figure 6 provides an overview of liner services serving ASEAN nations. The thickness of the lines in the figure reflects the relative frequency of container shipping services operating between the countries concerned.
Figure 6: Analysis of Liner Services Offering Between ASEAN Nations
Source: Derived from information in Containerisation International Yearbook, 2004.
The analysis shown in Figure 6 demonstrates the heavy imbalance in existing liner
container services. The shaded cells indicate no direct liner services. The values shown represent the number of different services (strings) theoretically offering. The extreme is between Singapore and Malaysian ports, where 80 shipping lines offer space on 368 different services and service strings.
Whilst ostensibly these many services also offer opportunities for intra-regional cargo, there is a negative aspect. As they rely heavily on transhipment cargo, space is often used by consortium partners to move feeder and interline cargo. Thus gateway or hinterland cargo, can be excluded. Therefore, direct and dedicated services can be the best options for regional growth, provided that cargo volumes and the commercial and regulatory environment support such operations. This underlines the importance of efficient sea transport, as identified by ASEAN.
3. Bulk and liquid bulk Bulk and liquid bulk services, while not as visible and easily measured as the container
services, are essential to the region. Tanker and bulk carrier capacity is critical to the flow of raw materials to support the manufacturing industries. Recent massive increases in charter rates for bulk vessels underline the vulnerability of smaller nations to movements in supply chain integrity.
SIN
KHM
LAO
MYS
THA
IND
VNM
MYA
BRU
PHL

Promoting Efficient and Competitive Intra-ASEAN Shipping Services
REPSF Project 04/001: Final Main Report 35
Defining bulk shipping services is more difficult than defining liner shipping services. While some bulk carriers operate on more-or-less regular routes, for the most part they do not follow regular schedules and deployment patterns. Ships may be chartered on a single voyage basis, or chartered for short periods during which they may operate on several different routes.
4. General cargo Although less visible than the container services, a characteristic of the ASEAN shipping
scene is the multitude of vessels falling under the category of general cargo. This category of vessels comprises small freighters, passenger/freight ferries and roll on/roll off vessels, including landing craft style vessels and refrigerated cargo vessels essential to fruit and vegetable movements. The importance of this sector is underlined by the numbers – in the Cambodian fleet, these vessels comprise 88% of the total of 545 vessels; in Indonesia it is 77% of the total of 1,677 commercial cargo vessels.
While the number of vessels in this category is large, the average size is small and relatively slow cargo working rates mean that productivity is low. In addition, many of them are deployed principally on domestic routes. Because the sector is very poorly documented it is difficult to estimate with any precision precisely what share of the total intra-ASEAN shipping task they handle: however the view universally encountered during the field research is that the share of the international shipping task has declined rapidly in recent years, and a substantial majority of the international general cargo movements between ASEAN countries is now containerised.
There are, however, some important intra-ASEAN trades in which traditional breakbulk vessels and, importantly, modern multi-purpose vessels, still play an important role: most notably, the carriage of rubber and rice, in large volume contract cargo and heavy lifts. Perhaps more importantly, vessels of this type play a central role in maintaining services to the more remote regions of ASEAN, where port facilities are not capable of handling containerised traffic and the volume and regularity of cargo flowing does not justify the establishment of container services. A persistent theme of the field work has been that the rapid growth of containerisation and the emphasis that this has placed on providing the facilities to meet this burgeoning demand has led to a neglect of this sector.
C. DOMESTIC SHIPPING The importance of domestic shipping varies greatly between the ASEAN countries.
For the small island State of Singapore, coastal shipping is clearly of very little significance. In landlocked Lao PDR, the domestic shipping sector is restricted to small-scale barge and motorised craft movements along the Mekong River.
Domestic shipping in Myanmar is also largely limited to inland waterway movements, although there is some ocean-going domestic traffic between Yangon and the southern Andaman Sea coast. Inland waterway transport plays an important role in both the carriage of domestic cargoes and as a connecting mode for international cargoes. Little information on the structure of inland waterway operations is readily available. Inland waterways are controlled by Inland Water Transport, a State-owned enterprise. The limitations of up-river port facilities would tend to confirm that the trade is dominated by small-scale low technology barge services.
In Brunei Darussalaam, the coastal shipping sector is also limited in size. The domestic shipping industry includes: self-propelled barges transporting gravel from Temburong to Bandar; supply vessels serving Brunei Shell Petroleum’s offshore oil field operations; and a few cargo vessels (of approximately 100 GT) plying between Temburong and Muara Port (Bandar Seri Bagawan). Brunei Darussalaam has no inland waterways of commercial significance.
Promoting Efficient and Competitive Intra-ASEAN Shipping Services
REPSF Project 04/001: Final Main Report 36
The domestic shipping industry of Cambodia consists of river craft and a small number of coastal trading vessels. The main coastal shipping task is the transport of commodities to/from Sihanoukville and Koh Kong Province, for on-carriage to Thailand. The vessels used for this traffic are small and many are of wooden construction.
In Thailand, the domestic shipping sector is also relatively small, confined largely to small refined petroleum movements and ocean-going barges.
Although little detailed information is readily available, it is clear that domestic shipping plays a more significant role in Vietnam. Both riverine and ocean-going services play an important role in internal freight movements, in part because of the relatively underdeveloped state of land transportation services in that country. Approximately 12,000km of rivers and canals are used for inland water transport, mainly in the Red River and Mekong deltas. A total of 6,230km of rivers and canals is managed by the Vietnam Inland Waterways Administration (VIWA). The remainder of the system is under the control of local government. Vietnamese inland waterways are estimated to carry over 38 million tonnes of cargo a year. Vietnam National Transport Strategy Study predictions suggest that inland waterways could carry up to 120 million tonnes of freight by 2010.
Malaysia, The Philippines and Indonesia have large domestic shipping sectors.
The wide geographic spread between the peninsular Malaysia and East Malaysia and the difficult terrain between the east and west coasts of the Malay peninsular, underline the importance of shipping services, both feeder for international cargo and domestic trade. In 2002 it was reported that the Malaysian Ministry of Transport estimated that approximately 200,000 full TEU were shipped between Malaysian ports in 2000. This consisted mainly of cargo moved to and from peninsular Malaysia, predominantly Port Klang, and the eastern provinces of Sabah and Sarawak.
Partial deregulation of Malaysia’s cabotage rules, which allow non-Malaysian flagged ships to move cargo between Penang and Port Klang, has helped to promote the latter port as a natural hub for Malaysia. Discussions with Malaysian interests in 2000 indicated this relaxation did not at that time apply to cargo moving between Eastern Malaysia and the mainland. Much transhipment and a part of actual domestic cargo therefore has been shipped via the port of Singapore. The actual domestic trade flow could therefore be double the number estimated above.
This study has therefore focused on how the cabotage policy has changed in the interim, and if and how these issues are impacting on domestic container and break-bulk cargo, and on feeder containerised flows.
Given the geographically fragmented nature of The Philippines, cargo interests, including both importers and exporters and domestic traders, rely heavily on inter-island shipping services. In 2000, an estimated 550,000 full TEU was shipped between Philippine ports, plus an unquantified volume of break-bulk and unitised cargo. Much of this container cargo moves to or from the port of Manila. Some of this traffic is feeder or relay in nature and once it arrives at the North Harbour – the centre for inter-island services – it is moved to the South Harbour and MICT for connection to international services.
The principal inter-island routes comprise Manila to Cebu, Davao City, Zamboanga, General Santos and Cebu to Davao City and Zamboanga. Domestic cargo is reserved to Philippine-registered vessels and freight rates remain relatively high.
There has recently been considerable consolidation of The Philippines coastal shipping industry. Over the past decade, the larger coastal shipping operators (William Lines, Aboitiz Shipping, Negros Navigation, Lorenzo Shipping Lines) have generated capital through public share offerings. Aboitiz and Gothong Lines have amalgamated into a dominant grouping.
Much of the traffic – especially container traffic – moving on domestic services in Indonesia is international cargo being hubbed through the main ports. However, there is also

Promoting Efficient and Competitive Intra-ASEAN Shipping Services
REPSF Project 04/001: Final Main Report 37
a significant volume of pure domestic inter-island traffic that is moved in containers, estimated to be in the range 300,000/350,000 TEU annually. Our provisional estimate is that this is equivalent to about 50% of total inter-island box movements.
There is also an unquantified but very significant volume of cargo moving as break-bulk in small vessels, as units in passenger/ro-ro type vessels and the ubiquitous landing craft. Over the next five years, the container component of the domestic sector is expected to grow strongly as more break-bulk cargo is unitised or containerised. Local operators are showing interest in investment in cellular and multipurpose tonnage (Meratus in particular), although the lack of progress in improving port facilities and supporting infrastructure may be inhibiting improvements to shipping services.
D. LANDSIDE & INTERMODAL The focus of the present study is on maritime services. However, landside infrastructure
within the various countries is critical to the support of efficient shipping service. In the ports sector, there is a massive gradient between the larger ports, such as Singapore or Tanjung Pelepas, and some of the regional ports. While clearly the level of investment will not be forthcoming to bring all ports to such a high level, the provision of proper access, both physical and institutional, to ports and marine services, is critical. In this context the definition of an ASEAN transport network, providing the opportunity to focus investment on the links that will be critical to the integration of the ASEAN economy, is an important development.
On the software side, the last few years have seen a dramatic increase in attention to supply chain management. Many companies, including those engaged in global liner shipping, are positioning themselves to take advantage of commercial opportunities becoming available. Within the ASEAN nations there are many examples of major advances by ship operators in developing and operating ports and storage/distribution complexes. Freight forwarders, ocean carriers and third party logistics specialists, in addition to establishing services geared towards improving the international flow of goods, are pursuing many opportunities in domestic distribution and freight transport sectors in Asia generally. This is an area that promises strong growth, and will drive a quantum leap in supply chain efficiency. ASEAN nations will wish to encourage this activity.
E. THE ASEAN PORT SYSTEM The focus on this project is on the promotion of efficient and competitive intra-ASEAN
shipping services. However, a repeated theme in the relevant literature – backed by our own direct experience in the sector – is that the major challenges to improving the performance of intra-ASEAN shipping lie with the management of the sea/land interface, rather than in ship operation and management.
With two major archipelagic nations and extensive shorelines in several continental states, the ASEAN countries have literally thousands of ports. Clearly even a very brief review of each of these is beyond the scope of the present study. Fortunately, ASEAN has recently defined the ports that member nations consider to be of significance to the development of the intra-ASEAN network. This section and the Country Report, which provides a more detailed discussion of the facilities and role of the ports of the intra-ASEAN transport network, concentrates primarily on these ports.
A summary of port characteristics is given in Table 5 below.

Promoting Efficient and Competitive Intra-ASEAN Shipping Services
REPSF Project 04/001: Final Main Report 38
Table 5: ASEAN Ports’ Roles and Connectivity Port Handling Functions Connectivity
Country/Study Ports Container Dry Bulk Liquid Bulk Gen.Cargo Passenger Highway Rail IWT
Brunei Darussalam Muara Cambodia Sihanoukville Phom Penh Indonesia Belawah Dumai Tanjung Priok (Jakarta) Palembang Panjang Pontianak Tanjung Perak (Surabaya) Tanjung Emas (Semarang) Makassar Balikpapan Bitung Jayapura Sorong Benjarmasin Malaysia Port Klang Penang Johore Kuantan Kemanan Bintulu Kuching Sandakan Kota Kinabalu Tanjung Pelepas Myanmar Yangon Thilawa Kyuakphyu Philippines Manila Subic Bay Batangas Cebu Iloilo Cagayan de Oro Davao General Santos Zamboanga Singapore Singapore/Jurong Thailand Bangkok Laem Chabang Songkhla Vietnam Saigon Haiphong Source: Almec 2002

Promoting Efficient and Competitive Intra-ASEAN Shipping Services
REPSF Project 04/001: Final Main Report 39
VI. STRENGTHS AND WEAKNESSES OF INTRA-ASEAN SHIPPING
This chapter focuses on our assessment of the performance of the intra-ASEAN shipping services, based both on the perceptions of and evidence provided by industry participants and, where relevant, comparisons with shipping services in other regions in terms of cost, coverage and service quality. The assessment will deal with our diagnosis of the current system – that is, our findings on where any existing problems lie, and what is causing them. This is intended to lay the foundations for the next chapter, in which we discuss what ASEAN might do to bring about further improvements.
In principle, inefficiencies in the ASEAN shipping system may manifest themselves in excessive costs in two ways: the daily costs of operating vessels could be excessive, or the network could be operated in such a way that vessels are used inefficiently. In either case, the result will be higher freight rates. In this section, we therefore look first at the costs of operating individual ships; then at the efficiency of operating patterns; and finally at comparative freight rates.
A. ASEAN SHIP OPERATING COSTS
1. Preliminary Remarks Despite extensive endeavours during the field-work phase of the study, the amount of
primary data that could be obtained on these factors was limited. In making the comparative analysis it has been necessary to supplement the information obtained from interviews with secondary data and in some cases with estimates based on qualitative comments provided during the interview programs.
A second issue that emerged during the interview program is that it is difficult to define ‘ASEAN shipping costs’. There are significant differences between ASEAN countries: crewing costs for a Malaysian-crewed vessel, for instance, are significantly higher than for a vessel with a Myanmar crew. There is not a single ‘ASEAN’ operating cost, but rather a range of operating costs.
Thirdly, the costs of intra-ASEAN shipping are not necessarily determined by the costs of operating an ASEAN-flagged vessel. To a very large extent, the market for the movement of international cargoes in ASEAN is open: operators from non-ASEAN countries are free to compete for intra-ASEAN cargoes.
2. Components of Ship Operating Costs The major components of ship operating costs are:
• capital costs
• fuel
• crewing costs
• insurance
• repairs and maintenance
• stores and lubes
• administration.

Promoting Efficient and Competitive Intra-ASEAN Shipping Services
REPSF Project 04/001: Final Main Report 40
Capital costs The capital costs of shipping are in turn determined by two major factors (i) the
cost of building or purchasing a ship and (ii) the conditions on which finance for the ship purchase can be accessed.
With regard to the first of these elements, ship owners operating in the intra-ASEAN trades – including the domestic trades – are free to acquire vessels on the open international market. Although some ASEAN countries have or have had schemes designed to encourage the use of the national shipbuilding industry, even in domestic trades there is no requirement to do so. Since ASEAN shipowners have free access to a competitive international market for the purchase of both new and second-hand tonnage, and there is abundant evidence that they make use of this, it is reasonable to conclude that the prices paid for vessels are unlikely to be excessive.
It is more difficult to make a judgement on the second element. The largest and best-established ASEAN shipowners are likely to have access to the full range of ship financing instruments that are available to shipowners elsewhere. There are a range of facilities available for ship financing within ASEAN including:
Traditional commercial bank lending: International shipping banks are important providers of funds to ‘top tier’ shipping lines such as Singapore’s Neptune Orient Line. Although these banks are generally reluctant to lend funds to smaller owners, some finance is available to lend for vessel acquisition through local banks, such as Indonesia’s Bank Mandiri.31 Nevertheless, a widespread theme of the consultation program was the reluctance of banks in many countries to provide funds for shipbuilding: a reluctance compounded in some instances (for instance, in Indonesia) by weaknesses in the legal system that make the use of the ships themselves as security for loans difficult.
Export-import banks: Ship acquisition is supported by a number of export-import banks. Japan’s Bank of International Cooperation is reported to have been particularly active in the LNG sector, included providing an $820 million facility to Malaysian International Shipping Corporation for the purchase of six LNG ships. The Export-Import Bank of Korea is also active in this area.32
Government-backed funding facilities: Several ASEAN governments – including Malaysia, Thailand and Vietnam – have established specific financing facilities that make funds available for ship acquisition at concessional rates. However, there seems to be some concern at how effective some of these schemes have in practice been in mobilising funds for ship acquisition.
Islamic finance: Islamic finance has not been a major source of funds for shipping, either in ASEAN or elsewhere, but this appears to be changing, with recent deals including a $129 million Islamic lease for an LNG carrier. As Malaysia is one of the principal centres of Islamic finance, the potential for the future use of such facilities in ASEAN is considerable.
Bond Issues: Indonesian regional chemical tanker operator Berlian Ju Tankers is reported to have successfully financed a significant proportion of the expansion of its fleet since 1990 from six to fifty ships through the issue of unsecured corporate bonds.33
Despite the availability of these options, it appears clear from the field work that it can be difficult for ASEAN shipowners – other than the largest and best-established – to raise funds for ship acquisition. It is reasonable to anticipate that this will, in some
31 Julian McQueen, Eyes Turn East, Lloyds Shipping Economist, January 2004,pp 32-35. 32 Ibid, p35, 33 Ibid, p34

Promoting Efficient and Competitive Intra-ASEAN Shipping Services
REPSF Project 04/001: Final Main Report 41
instances at least, mean that the cost of ship financing, when it can be secured, will be somewhat higher than the minimum achievable elsewhere. However, because every ship purchase deal is individually negotiated, and the details of transaction are confidential, it is difficult to assess the extent of any additional costs from this source.
Fuel Figure 7: Comparison of Bunker Prices (heavy fuel oil)
80
90
100
110
120
130
140
150
160
Rotterd
am
Gibralt
arMalt
a
Durban
Fujaiar
ah
Singap
ore
Port K
lang
Bangk
ok
Manila
Tanjun
g Prio
k
Port
Inde
x (R
otte
rdam
= 1
00)
Low High Source: Study estimates, based on data drawn from Lloyd’s List Bunker 60, November 2004
Figure 7 compares the price of bunker fuels within ASEAN with those available at other major centres throughout the world. The figure shows that the price of heavy fuel oil in ASEAN are somewhat higher than in some of the major international bunkering centres, but that remain reasonably comparable at the regional hub ports, and also in Thailand. Elsewhere in ASEAN fuel prices may be significantly higher
Most of the larger regional services have the opportunity to purchase bunker fuel at a regional hub, and so will face fuel prices broadly in line with the best available internationally. Many domestic or minor regional services, however, will face fuel prices that are significantly higher.
Crewing costs It is important to bear in mind that, in general, ships operating in the intra-ASEAN
international trades are not constrained to the use of ASEAN crews: vessels operating within ASEAN may be registered in any country, and this in effect allows shipowners to employ crews of any nationality. Moreover, registration under some ASEAN flags – in particular the important Singapore register – does not bring with it any specific obligations with respect to the nationality of the vessels crews.
Under these conditions, it would be unlikely that crewing costs on most intra-ASEAN vessels would be excessive: if ASEAN crews were too expensive to use in regional trades, owners could simply use crews from other areas, including India and China. However, there is good reason to believe that the ASEAN crews (or at least crews from some ASEAN countries) are highly competitive on an international scale.

Promoting Efficient and Competitive Intra-ASEAN Shipping Services
REPSF Project 04/001: Final Main Report 42
Table 6: Wage cost comparison ($US per month served)
Master Able-bodied Seaman Country
Dry Cargo Tanker Dry Cargo Tanker
China 2,700-3,000 3,550-4,150 820-1,000 970-1,200
Croatia 4,600-5,000 6,000-8,000 1,300-1,400 1,300-1,400
Denmark 8,760-10,820 9,790-11,850 3,810-4,120 4,330-4,640
Egypt 3,880-4,080 4,490-4,690 1,400-1,450 1,400-1,450
India 4,700-4,900 5,500-5,900 1,160-1,400 1,215-1,400
Italy 6,500-6,800
Latvia 4,500-5,000 5,500-5,800 1,300-1,400 1,300-1,400
Mexico 4,330-4,530 4,750-4,950 1,150-1,400 1,200-1,450
Montenegr0 4,100-4,300 6,150-6,350 1,300-1,400 1,390-1,490
Myanmar 2,150-2,350 2,550-2,750 370-420 450-500
Pakistan 4,800-5,200 5,300-5,600 1,300-1,400 1,300-1,400
Philippines 3,600-4,000 3,800-4,300 1,050-1,400 1,100-1,400
Poland 4,500-4,700 5,900-6,300 1,200-1,400 1,350-1,550
Romania 3,800-4,000 5,050-5,250 1,150-1,400 1,350-1,550
Russia 4,500-4,800 5,000-5,500 1,300-1,400 1,350-1,450
South Korea 4,500-5,000 5,500-5,800 1,400-1,700 1,700-2,300
Spain 7,300-7,500 8,300-8,500 2,100-2,300 2,200-2,400
UK 9,300-11,000 11,000-12,800 3,500-4,200 4,200-4,900
Ukraine 3,460-3,660 3,980-4,190 870-970 970-1,070 Source: Drewry Shipping Consultants 2004. Ship Operating Costs: Annual Review and Forecasts 2004/
There is now a well-established international market for shipboard labour. These seafarers sell their skills on a competitive global market, and are unlikely to be successful in that market unless the prices that they seek are competitive (taking into account their level of skill and competence). The Philippines is the leading supplier of seafaring labour to the world’s ‘open registry’ fleet: in 2000, it supplied an estimated 50,000 officers and 180,000 ratings to the world market. Indonesia and Myanmar are important sources of labour supply to these markets.34
Table 6 shows a comparison of the wage costs for seafarers of various nationalities. It is clear from the table that seafarers from the Philippines are competitive in cost with seafarers from most other nations supplying seafaring labour, while seafarers from Myanmar provide very low cost crews.
Although precise data is difficult to come by, it is quite clear that the cost of crewing a vessel with nationals varies significantly between ASEAN member countries, largely in line with the level of economic development of that country. Singaporean crews will typically cost much the same as crews for OECD countries; the costs of crews from other ASEAN countries are very significantly lower. We would expect the cost of crews from Indonesia to be roughly comparable to the cost of crews from the Philippines, while crews from Cambodia would be similar in cost to
34 Drewry Shipping Consultants 2004. Ship Operating Costs: Annual Review and Forecasts 2004/5. Drewry:
London.

Promoting Efficient and Competitive Intra-ASEAN Shipping Services
REPSF Project 04/001: Final Main Report 43
those from Myanmar. The cost of crews from Vietnam would lie somewhere in between. Crews from Malaysia and Thailand would be more expensive than crews from the Philippines, but somewhat less expensive than crews from South Korea. (Brunei and Lao PDR do not provide significant number of seafarers).
Other costs Fuel, the capital costs of the vessel, and crewing costs comprise the most
important elements in the structure of a vessels total cost of operations. They also comprise the elements in which there is the greatest likelihood that the costs incurred in one country, or in one region, are likely to differ significantly from those incurred in another. We will therefore deal only briefly with other elements of ASEAN shipping costs.
Insurance Insurance cover of various sorts typically accounts for something in excess of
10% of total operating costs. Little information is available that will allow insurance costs for intra-ASEAN shipping to be compared directly to international norms, but there are some reason to believe that they may be slightly higher than average. This is because:
• The ASEAN fleet is on average quite old, and old vessels usually attract higher premiums for both Hull and Machinery and Protection and Indemnity (P&I) insurance
• Ownership is also quite fragmented, with many small scale operators. Marine insurance premiums are usually determined on a case-by-case basis, and premiums are generally somewhat higher for smaller operators – especially for P&I
• The high incidence are piracy in the region and perceived risk of disruption due to terrorist activity is likely increase insurance costs (Drewry reports an 0.015% insurance premium on vessels visiting Indonesian ports)35
• Despite a growing marine insurance industry in ASEAN (especially in Singapore) ASEAN remains quite remote for the global centres of the specialised marine insurance sector, and lack of intimate knowledge of the operating environment is often reflected in an over-estimation of risk
Repairs and maintenance The costs of ship repairs and maintenance in the ASEAN region are generally
regarded as highly competitive by international standards. However, the average age of the ASEAN fleet will, all other things being equal, tend to result in high repair and maintenance costs. This is to some extent compounded by increasingly stringent requirements in international conventions on safety and the environment, coupled with a growing willingness of ASEAN governments to enforce these requirements. These can require significant additional costs for older vessels.36
Stores and lubes This component of operating costs is comparatively small, and most shipboard
supplies coming under this category are purchased on the international market. There is no obvious reason to expect that ASEAN operators face particularly high costs for these supplies, and no indication in our field work that this was the case.
35 Drewry 2004, p112. 36 Drewry 2004, p146.

Promoting Efficient and Competitive Intra-ASEAN Shipping Services
REPSF Project 04/001: Final Main Report 44
Administration Administration costs vary greatly within trade segments, with the costs of
administration for ships operating a liner service very much higher than the cost of administering the operations of a dry bulk tramp vessel. However, although some allowances must be made for economies from the application of advanced technology and management practices, in general administration costs are related to the general level of costs in the country in which the management offices of the company are located. Since these are, for all ASEAN countries other than Singapore, low by international standards, it is likely that administration costs in ASEAN are somewhat below the international average.
B. NETWORK OPERATING COSTS It is possible that individual ship operating costs with ASEAN are efficient, yet the costs of
the intra-ASEAN shipping system as a whole are higher than they should be. This could happen for a number of reasons, including:
• The commercial interests of incumbent operators favour certain operating patterns (for instance, hub and spoke operations) over others (for instance, direct services between regional centres) that would lead to lower cost outcomes, but barriers to entry, possibly in the form of information deficits, prevent new operators introducing newer more efficient operations
• Government regulations – especially cabotage restrictions – inhibit efficient structuring of routes
• Shipping operations themselves may be efficient, but poor port performance or other landside delays adds to system costs.
In this section, we examine each of these issues in turn. We look principally at general cargo shipping, and specifically at the container sector. This is in part because the availability of information in this sector, while still not good, is better than in the bulk and non-containerised general cargo sectors. It is also in part because we were forcibly reminded during our field work of the rapidity with which this sector has grown, and the likelihood that, as ASEAN integration increases and there is an increasing two-way trade in manufactures, it will become increasingly dominant.
Finally, we have this focus because the industrial structure of liner shipping sector (either containers or general cargo) is such that they permit – at least in principle – the emergence and persistence of inefficiencies. For most of the other major cargo movements, decisions on the type and nature of shipping services provided are made directly by the importer or exporters, who has considerable freedom to enter into a contract for shipping services with the party of its choice, and has access to a competitive international market place (with some restrictions in the case of the carriage of domestic cargoes). In most cases too the buyers concerned are large and sophisticated companies, often multi-nationals.
In the general cargo sector, however, the purchaser of services does not generally directly control how the services are provided: the shipowner decides what services will be provided, and the shipper must select from the range of service offerings that owners choose to provide. If the relevant markets are efficient, it would be expected that, over time, the choices of shippers would signal to shipowners what type of services are desired, and shipowners would be forced by competitive pressures to provide these services, and to provide them efficiently. However, this depends on the existence of an effective market. If the market has serious weaknesses – because, for example, of major imperfections in information flow or the impact of dominant cartels or firms – it is possible that there will be a mismatch between the type of services demanded by shippers and the services that shipowners actually provide, or that services will be provided inefficiently.

Promoting Efficient and Competitive Intra-ASEAN Shipping Services
REPSF Project 04/001: Final Main Report 45
1. Hub-and-spoke versus direct services Despite the emergence of highly efficient transhipment operations, shippers in
general tend to prefer direct shipment to indirect shipment via a hub-and-spoke operation. This is in part due to concerns than the more complex an operation, the more risk there is of cargo damage or delay. It is also in part due to feeling that direct shipment must be, in some sense, more efficient that double handling cargoes which, in addition, often have to be carried over much greater total distances.
The key to why hub-and-spoke systems work is economies of scale in ship operations. These are very large, especially at the lower end of the size spectrum: Figure 8 shows that the cost per TEU per day for a 2000-TEU ship is only a little over half that for a 500-TEU ship.
In addition, hub and spoke services can offer shippers a higher frequency of service than direct end-to-end services. By consolidating cargo bound for Manila with cargoes bound for Singapore, Europe and North America a shipping line may easily justify a daily sailing from Tanjung Priok for Manila-bound cargoes. Carrying cargoes for the Philippines alone it may difficult for the same operator to justify even a fortnightly sailing with a much smaller ship.
Despite this, there comes a point at which cargo volumes are sufficiently large, or perhaps the additional costs of an indirect services are so high, that direct services will be economically sensible and commercially viable. The recent emergence of a number of direct services between ASEAN ports and China, substituting for former transhipment services over Singapore, Hong Kong or Kaohsiung, is evidence of this.
Figure 8: Economies of Scale in Container Ship Operation (US$/TEU/day at sea)
Unit cost for containerships
$-
$10.00
$20.00
$30.00
$40.00
$50.00
$60.00
50 100
200
500
1000
1500
2000
2500
3000
4000
5000
6000
8000
1000
012
000
1500
0
Ship size (TEU)
Cos
t per
TE
U p
er d
ay a
t sea
Source: Meyrick and Associates in-house ship cost model
2. Cost of transhipment versus direct shipment Whether direct services are more efficient than transhipment services is therefore an
empirical question, the answer to which will depend both on the geography of the route concerned and the volume of the cargo to be carried. Given the range of possible routes that could be operated within ASEAN, it is obviously a question to which no general

Promoting Efficient and Competitive Intra-ASEAN Shipping Services
REPSF Project 04/001: Final Main Report 46
answer can be given. And the answer will change over time: the range and quality of direct services between ASEAN ports is now vastly greater than it was five years ago.
It is nevertheless useful to explore some specific instances as case studies in order to obtain an enhanced appreciation of the circumstances under which direct services are likely to be appropriate. We modelled three case studies in an attempt to obtain further insight into this issue. Because direct connections between the major ports are already very well established, the case studies involved connections between a major port in one ASEAN country and a secondary port in another, or between two secondary ports. In each, a search was made of the online database to ensure that there were few or no direct connections currently existing between the modelled ports.
In each case, the cost of operating a direct service was compared to the cost of a transhipment operation over Singapore, with an assumed charge of $120/TEU for transhipment at that port. (Transhipment charges in Singapore are not publicly disclosed, but we understand this figure to be realistic: considerably lower transhipment charges are offered at Port Klang).
In each case also, port to port volumes were estimated using unpublished tables from the KMI-UN ESCAP study on container shipping and port strategies, updated to allow for subsequent growth.37 While these estimates do not necessarily reflect actual volumes (no data on actual flows was available), they are of a realistic magnitude.
For the direct services, it was assumed that, given the high frequencies that are available using transhipment services, a minimum weekly frequency would be required to be competitive in these trades. The required vessel size was then determined by matching the capacity of the service to the available cargo volume, on the favourable assumption that the direct service would capture all of the available cargo.
For the transhipment alternative, there are existing links between the ports at each end of the hypothetical route and Singapore. It was therefore possible to use actual information – again obtained from the online database – in costing the transhipment services.
The three case studies were:
− Tanjung Priok - Ho Chi Minh - Hai Phong
− Tanjung Perak - Bangkok - Laem Chanbang
− Pontianak - Kota Kinabulu
The results of the analyses are recorded in Table 7 and Table 8 below. In each instance, the simulated transhipment option is slightly cheaper than the corresponding direct shipment option.
The results are of course indicative only: the precise costs borne by individual shipowners vary from the typical costs used in the modelling, the range of route choices available is more complex than the simple routes used in this example, and the cargo volume estimates –which have a critical impact on the outcomes – are only very rough estimates of the actual size of the markets. But the modelling work does tend to indicate that under a range of plausible conditions the services missing from the current network are missing because they would be uneconomical to provide, rather than because there is some market failure that precludes the provision of viable new services.
37 KMI/UN ESCAP, 2001. Regional Shipping and Port Development Strategies Under a Changing
Maritime Environment. UN ESCAP, Bangkok.

Promoting Efficient and Competitive Intra-ASEAN Shipping Services
REPSF Project 04/001: Final Main Report 47
Table 7: Results from Case Study 1: Tanjung Priok-Vietnam Services
Cargo volumes (TEU)
Destination Origin T Priok HCM Haiphong T Priok 0 3800 7300 Ho Chi Minh 900 0 0 Hai phong 1726 0 0
Direct Shipping option Transhipment Option Distance Distance Tanjung Priok 1032 Service 1 Ho Chi Minh 803 Tanjung Priok 352 Haiphong 1668 Singapore 352 Ship size 250 TEU Ship size 1000 TEU Cost per Slot $723 Cost per Slot $ 96 Total cost per TEU $585 Service 2
Singapore 646
Ho Chi Min 803
Hai Phong 1322
Ship size 600 TEU
Cost per slot provided
$475
Transhipment Charge $120
Total Costs per TEU $582

Promoting Efficient and Competitive Intra-ASEAN Shipping Services
REPSF Project 04/001: Final Main Report 48
Table 8: Results from Case Study 3: Pontianak-Kota Kinabulu Service
Cargo volumes (TEU)
Destination Origin Pontianak Kota Kinabulu Pontianak 0 1500 Kota Kinabulu 2500 0
Direct Shipping option Transhipment Option Distance Distance Pontianak 650 Service 1 Kota Kinabulu 650 Pontianak 352 Singapore 352 Ship size 50 TEU Ship size 1000 TEUCost per Slot $688 Cost per Slot $96 Service 2 Total cost per TEU carried $430
Singapore 795
Kota Kinabulu 795
Ship size 500 TEU
Cost per slot provided
$ 264
Transhipment Charge $120
Total Costs per TEU carried
$ 385
3. Evolving route patterns Further evidence of this can be seen in the emergence of new and innovative
services that have evolved as the intra-ASEAN trade has developed. Ten years ago, the intra-ASEAN shipping system was to a very large extent a simple ‘hub-and-spoke’ system, with Singapore as the hub. Five years ago this was still very largely true.
Now, there are some services that totally bypass the three important regional shipment centres38, especially when a direct service is considerably shorter than the transhipment operation (for example, APM-Saigon offers a shuttle service between Thailand and Vietnam).39 But much more common are ‘butterfly’ services, which by alternating services between Singapore (or one of the other transhipment hubs) and two or three different ASEAN countries manage to combine the attributes of a transhipment/feeder service and a direct connection.
38 Singapore, T Pelepas and Port Klang 39 www,ci-online.co.uk, verified 19 December 2004

Promoting Efficient and Competitive Intra-ASEAN Shipping Services
REPSF Project 04/001: Final Main Report 49
Table 9: Results from Case Study 3: Tanjung Perak – Thailand Service
Cargo volumes (TEU)
Destination Origin T Perak Bangkok Laem Chabang T Perak 0 4000 6000 Bangkok 3500 0 0 Laem Chabang 10500 0 0
Direct Shipping Option Transhipment Option
Distance Distance T Perak 1486 Service 1 Bangkok 60 T Perak 759Laem Chabang 1430 Singapore 759 Ship size 250 TEU Ship size 1200 TEU Cost per Slot $647 Cost per Slot $198
Total cost per TEU $377 Service 2
Singapore 831 Bangkok 60 Laem Chabang 775 Ship size 1200 TEU
Cost per slot provided
$ 203
Transhipment Charge
$120
Total Costs per TEU
$ 354

Promoting Efficient and Competitive Intra-ASEAN Shipping Services
REPSF Project 04/001: Final Main Report 50
A good example of such a service is Regional Container Lines’ ‘RPX’ service, which is presented diagrammatically in Table 10 below.
Table 10: Schematic Representation of Regional Container Lines’ ‘RPX’ service
This service – which, as the diagram shows – is not excessively complicated, serves a very large number of markets:
• It provides a feeder service for Thai and Indonesia cargoes to a choice of two hubs
• It provides a direct service between Indonesia and Malaysia for both imports and exports
• It provides a direct service between Indonesia and Thailand for both imports and exports
• It provides a direct service between Malaysia and Thailand for both imports and exports
• It also of course provides a service for local cargoes between Singapore and Malaysia, Thailand and Indonesia.
There are now a large number of services of this sort operating within ASEAN. They provide a compromise between a traditional hubbing operation and an express direct service: at the expense of a slightly extended transit time, they provide a means of avoiding the transhipment operation while maintaining the economies of scale that can be gained from carrying cargoes bound for a large number of destinations on a single service.
In summary shipping operations within ASEAN are continually evolving. Shipowners are by and large free to devise routes as they wish (we will deal with the main exception to this – domestic cabotage – in the next section) and appears to be making full use of this freedom. Shippers too are free to choose their carrier. With this combination of circumstances, it is unlikely that the service patterns that evolve are significantly inefficient. This view tends to be supported from our cost analysis of selected case studies, as well as by our observations of the way in which shipping services have adapted to a growing ASEAN trade.
Tanjung Priok
Singapore
Port Klang
Laem Chabang

Promoting Efficient and Competitive Intra-ASEAN Shipping Services
REPSF Project 04/001: Final Main Report 51
4. Intra-ASEAN Freight Rates It has been suggested that freight rates, expressed in terms of $/kilometre, are higher
in the intra-ASEAN trades than they are on the major East-West routes.
This is undoubtedly true, but it does not necessarily imply that intra-ASEAN shipping is inefficient. Shipping freight rates are affected by a large number of factors, but there are four that are of fundamental importance:
• The overall state of supply and demand in the market: because it is not easy to adjust shipping capacity instantaneously, relatively small changes in the supply/demand balance can lead large adjustments in freight rates
• The directional balance of the trade: in a balanced trade, average prices will be lower as less capacity will be wasted. Additionally, when a trade is imbalanced there will often be very large differences in freight rates between the two directions: in the Thailand-Philippines trade for instance, eastbound rates are approximately three times as high as westbound rates
• The density of traffic on the route: there are significant economies of scale in shipping, and on heavily trafficked routes it is possible to use very large vessels. This results in a lower unit cost, and hence in lower freight rates
• The length of the route: even if the cost of loading and unloading cargo is excluded from the calculation, the cost of carrying goods by sea does not double if the distance doubles. This is because the ship must spend some part of its time port. Provided the number and performance of ports of call is the same, this time will be the same for a short route as it will for a long route. If the route length is doubled, the time the ship spends at sea doubles, but the time it spends in port stays the same. The total time to complete the voyage increases, but to something less than twice the duration of the shorter journey. Similarly, the costs increase, but to something less than twice the costs. If this cost is then divided by the journey length, which does double, the result will be a lower cost per unit of distance travelled.
There is no reason to expect that intra-ASEAN trade will differ systematically from the major East-West trades with respect to the first two of these factors. Both will be susceptible to cyclical variations in the supply/demand balance, and both are subject to trade imbalances. But there is a systematic difference with respect to the second two factors: intra-ASEAN trades are smaller in volume than the major East-West trades, and the routes are much shorter. On both counts, we would expect the cost per unit of distance travelled to be higher in the intra-ASEAN trades.
If we are to make a cost per unit distance comparison, therefore, it is important to use freight rates from markets that are similar both in trade volume and route length. The intra-European short sea trades provide a suitable comparator.
Figure 9 shows the results of a comparison of intra-ASEAN freight rates obtained during the field research with indicative European short sea rates. It can be seen that, with the exception of rates from Brunei and some rates from Cambodia, intra-ASEAN rates compare favourably with the intra-European rates.

Promoting Efficient and Competitive Intra-ASEAN Shipping Services
REPSF Project 04/001: Final Main Report 52
Figure 9: Comparison of Intra-European with Intra-ASEAN Freight Rates
$-
$200
$400
$600
$800
$1,000
$1,200
0 200 400 600 800 1000 1200 1400 1600 1800
Maritime Distance
Oce
an F
reig
ht R
ate
($/T
EU
)
Europe Vietnam Brunei Cambodia Indonesia Philippines Thailand Other
European Short Sea Routes
Source: Information gathered from shipowners and shippers during study
Figure 10: Comparison of Intra-European with Intra-ASEAN Freight Rates
Ho Chi Minh-Phnom PenhMuara-Manila
Muara-Laem ChabangMuara-Bangkok
Muara-SingaporeMuara-Jakarta
Muara-Pasir GudangSihanoukville-Manila
Muara-Port KlangSihanoukville-Tanjung Priok
Antwerp-leixoesJakarta-Singapore
Bangkok/LC-Ho Chi MinhSihanoukville-Ho Chi Minh
Bangkok/LC-Port KlangBangkok/LC-PTP
Rotterdam-St PetersburgJakarta-Port Klang
Algeciras-PiraeusBangkok/LC-ManilaBangkok/LC-Singapore
Bangkok/LC-JakartaPort Klang-Manila
Ho Chi Minh-P Klang/PTPHo Chi Minh-PenangHo Chi Minh-Jakarta
Ho Chi Minh-SingaporeJakarta-Manila
Jakarta-BangkokSingapore-Manila
Ho Chi Minh-BangkokManila-Bangkok/LCManila-Port Klang
Manila-Singapore
$- $0.20 $0.40 $0.60 $0.80 $1.00 $1.20 $1.40 $1.60
US$/nautical mile
However, it is also true that many, though by no means all, of the intra-ASEAN routes are significantly shorter than the intra-European routes. Figure 10 therefore presents the same data, but expressed as US$/TEU/nautical mile.
Most of the intra-ASEAN rates are once again comparable to or below the intra-European rates. The major exceptions are:
• The Ho Chi Minh-Phnom Penh route, which, as a river transit restricted to very small shallow draft vessels, is something of a special case.
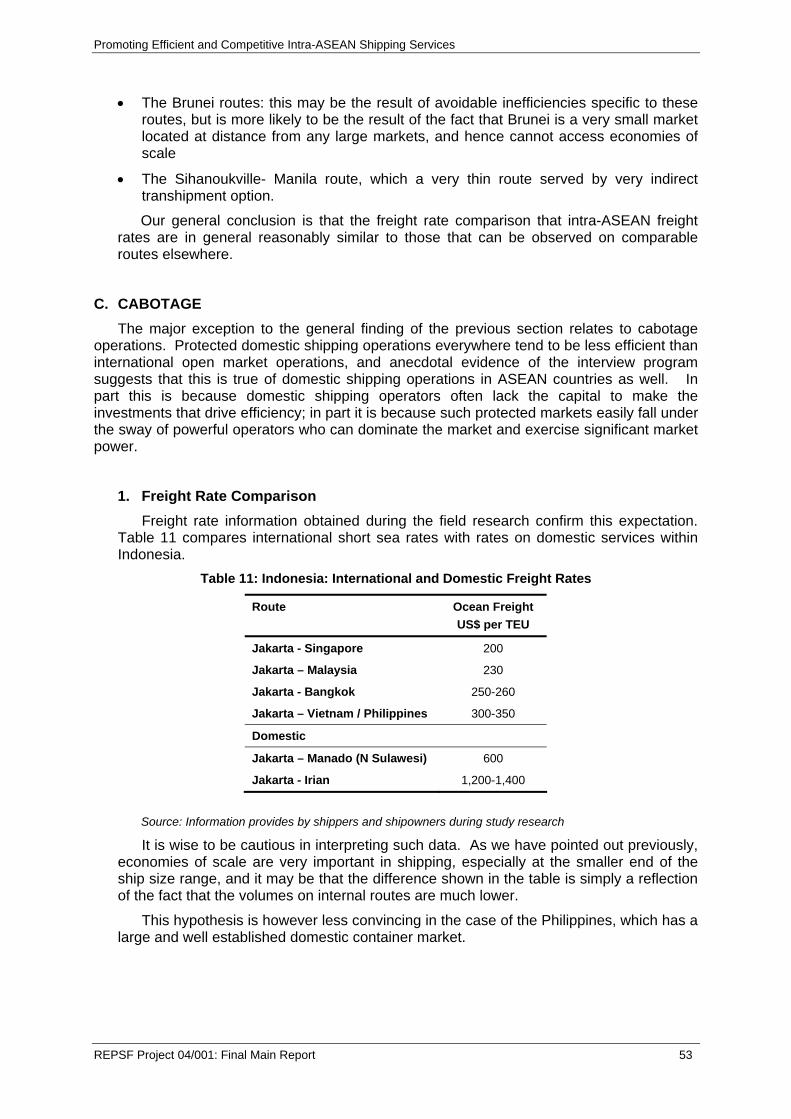
Promoting Efficient and Competitive Intra-ASEAN Shipping Services
REPSF Project 04/001: Final Main Report 53
• The Brunei routes: this may be the result of avoidable inefficiencies specific to these routes, but is more likely to be the result of the fact that Brunei is a very small market located at distance from any large markets, and hence cannot access economies of scale
• The Sihanoukville- Manila route, which a very thin route served by very indirect transhipment option.
Our general conclusion is that the freight rate comparison that intra-ASEAN freight rates are in general reasonably similar to those that can be observed on comparable routes elsewhere.
C. CABOTAGE The major exception to the general finding of the previous section relates to cabotage
operations. Protected domestic shipping operations everywhere tend to be less efficient than international open market operations, and anecdotal evidence of the interview program suggests that this is true of domestic shipping operations in ASEAN countries as well. In part this is because domestic shipping operators often lack the capital to make the investments that drive efficiency; in part it is because such protected markets easily fall under the sway of powerful operators who can dominate the market and exercise significant market power.
1. Freight Rate Comparison Freight rate information obtained during the field research confirm this expectation.
Table 11 compares international short sea rates with rates on domestic services within Indonesia.
Table 11: Indonesia: International and Domestic Freight Rates
Route Ocean Freight US$ per TEU
Jakarta - Singapore 200
Jakarta – Malaysia 230
Jakarta - Bangkok 250-260
Jakarta – Vietnam / Philippines 300-350
Domestic
Jakarta – Manado (N Sulawesi) 600
Jakarta - Irian 1,200-1,400
Source: Information provides by shippers and shipowners during study research
It is wise to be cautious in interpreting such data. As we have pointed out previously, economies of scale are very important in shipping, especially at the smaller end of the ship size range, and it may be that the difference shown in the table is simply a reflection of the fact that the volumes on internal routes are much lower.
This hypothesis is however less convincing in the case of the Philippines, which has a large and well established domestic container market.

Promoting Efficient and Competitive Intra-ASEAN Shipping Services
REPSF Project 04/001: Final Main Report 54
Table 12: Philippines: International and Domestic Freight Rates (1999)
Route Distance (nm) Freight Rate ($/TEU) c/TEU/nm (US)
International Manila – Bangkok 547 300 55 Manila – Hong Kong 633 250 39 Manila – Kaohsiung 1308 350 27 Manila – Singapore 1485 600 40 Manila – Jakarta 1571 650 41 Domestic Manila – Cebu 392 318 81 Manila – Cagayan de Oro 504 390 77 Manila – Zamboanga 512 395 77 Manila – General Santos 723 531 74 Manila - Davao 829 600 72
Source: Drewry Shipping Consultants, Intra-Asia Container Trades: Dynamism Beyond Bounds.
Table 12 compares freight rates on a number of domestic trades within the Philippines with those on international routes to and from Manila. The domestic rates are clearly considerably higher. In the publication from which this data was taken, Drewry Shipping Consultants concludes:
“it can cost three times as much on a per nautical mile basis to ship a container from Manila to Cebu than [sic] from Manila to Singapore. On the whole, rates for international consignment to ports, such as Hong Kong and Kaohsiung, are 40% to 100% cheaper”.40
2. Interaction with International Shipping The geography of ASEAN is complex. Political and cultural boundaries do not always
coincide with natural trading areas. This has been recognised in the efforts that have been made to establish various trans-national growth areas, such as GMS, IMT-GT and BIMP-EAGA. By artificially constraining the way in which shipping lines might construct routes to serve such areas, cabotage restrictions may increase the cost not only of domestic but also of international shipping.
To test the extent to which this might be the case, we modelled the choices facing a hypothetical owner contemplating serving Balikpapan and Makassar out of Davao. With cabotage restrictions in place, the operator (assuming the operator to be a Philippines national) could carry cargoes to and from Davao, but not between Balikpapan and Makassar. In this hypothetical example, we have assumed a conventional general cargo operation which could in principle win the volumes of cargo shown in Table 13 below.
Table 13: Cargo Volumes used in Modelling of Hybrid International/Domestic Service (tonnes)
Makassar Balikpapan Davao
Makassar 0 10000 12000 Balikpapan 10000 0 10000 Davao 40000 30000 0
40 Drewry Shipping Consultants 2003. Intra-Asia Container Trades: Dynamism Beyond Bounds. Drewry: London.

Promoting Efficient and Competitive Intra-ASEAN Shipping Services
REPSF Project 04/001: Final Main Report 55
The costs per tonne carried was estimated under three separate regimes:
• Two separate services, one to Makassar and one to Balikpapan
• A single service operating on a triangular service calling at both Makassar and Balikpapan, but unable to lift Indonesian domestic cargo
• A single service operating on the same service, but with the ability to lift Indonesian domestic cargo.
The estimated cost under the first two regimes was almost identical, at $13.20 per tonne. But by providing the ability for the service to lift both international and Indonesian domestic cargo, this figure could be reduced to $10.80 per tonne – a saving of around 18% for international cargoes. Importantly, the potential savings for domestic cargoes could be a lot higher: because of the small volume involved, we estimate that the cost of stand alone domestic service between Makassar and Balikpapan could be as high as $35/tonne.
D. INSIGHTS FROM THE INTERVIEW PROGRAM The interview program has confirmed that, in general, the ASEAN countries have moved
rapidly and successfully to open their economies, relax regulations, encourage private investment, expand their public infrastructure and encourage trade. The constraints on ASEAN shipping are relatively few. Entrepreneurs are largely free to respond to market opportunities, and services do tend to emerge where there is a demand. A range of services is on offer, from international liner and bulk services to regional and local tramping.
There are however a number of persistent themes that emerged during the fieldwork that suggest that there is scope for further improvement. The main issues and shortcomings identified in the course of the interview program that are common to the majority of the ASEAN countries concern:
1. Shipping rates and availability Reflecting the influence of an extremely strong growth of demand, fuelled mainly by
the expansion of China trade, freight rates in 2004 have reached record levels. The global shortage of shipping capacity has also been reflected in a lack of space available to shippers. This has hit particularly hard in ASEAN, where only a few years ago shipping lines operating on the major East-West route had been aggressively selling space on intra-Asian legs into an already over-tonnaged market. As a result ASEAN traders have found their plans disrupted by both very high prices and a lack of available capacity. This has prompted calls for government action, including a reversion to the direct Government provision of shipping services.
However, the history of such initiatives has not in general been a happy one, and there is a serious danger of creating a long-term liability in order to address a short-term problem. Shipping rates are volatile, and have become increasingly so in recent years: in 2001 freight rates were at an all-time low. Competition within the shipping industry – notwithstanding the consolidation that has taken place – is fierce: in the long run there is good reason to be confident that, over time, average rates will be no higher than is appropriate for the level of investment in technology, the efficiency of vessel and port utilisation, the volume and reliability of demand, and the balance in shipping patterns.
Capacity shortages are also likely to be transient. Most commentators believe that the tonnage now on order is large enough to change the supply-demand balance in late 2005/2006 in favour of shippers. Apart from adopting measures to remove any impediments to investment and market response, there is little further that ASEAN governments can do to influence world shipping rates, and it is likely that any attempt to intervene in the local market will be both ineffectual and costly.

Promoting Efficient and Competitive Intra-ASEAN Shipping Services
REPSF Project 04/001: Final Main Report 56
2. Ship crewing A growing world-wide shortage of skilled seafarers is impacting on the more
developed ASEAN maritime nations, notably Malaysia, Singapore and Thailand. Yet there is a surplus in the Philippines, Indonesia and Myanmar. Some stakeholders suggested the possibility of establishing an ASEAN-certified pool of seafarers with regulations relaxed to allow free movement.
3. Ship finance Since the Asian economic crisis, it has been difficult for companies to invest in new
ships to upgrade capacity, adjust to customers’ needs or meet statutory safety and security requirements. With the notable exception of Singapore’s, commercial banks tend to prefer more concrete assets. Companies that do not have access to funds through stock exchange listing must rely on government funding. Often this is unavailable, poorly targeted or requires onerous and restrictive conditions.
An ASEAN-wide approach to shipping finance was suggested. This would avert the danger that ASEAN countries may seek to improve their competitive position by providing finance on better terms than their neighbours, leading to a competitive race to provide lower interest rate, longer grace period or longer repayment periods.
4. ASEAN shipping in a global context There is a prevailing feeling among stakeholders that the region’s shipping is being
adversely bound by decisions and rules being made elsewhere (e.g. on the application of THC and anti-piracy and security measures). With 40-45% of world tonnage and trade, Asian shippers and shipowners feel that Asia should have a bigger stake yet feels powerless to strengthen its role when many shipping decisions are made by shippers, customers and their logistics agents outside the region. Rather than attempt to introduce controls (e.g. caps on rates), however, several stakeholders felt that ASEAN countries should aim to regulate shipping with a light hand while establishing common approaches and standards to stimulate, not discourage, competition and trade.
5. Shipping trends Government and local shipping companies feel that the domination of international
liner services through regional hubs has tended to push ASEAN shipping services further back down the distribution chain, from international and regional feeder services through domestic feeder services to local domestic non-liner distribution. Except where cabotage rules prevent them, international services have squeezed into domestic routes, often as a result of the desire of international customers and their logistics service-providers for greater control over the whole transport chain. Only a few regional shipping companies with enough financial and management strength have been able to compete with these trends. Rather than restrict outside competition, however, stakeholders tend to favour measures that would foster the growth of local competitors.
6. Informal charges The culture of informal charges and corrupt practices continues throughout much of
ASEAN. While possibly helping to “oil the wheels” of trade in a limited way, this ultimately acts against the interests of the ASEAN economies, raising costs and reducing reliability. Greater transparency is needed.
Informal charges and corrupt practices not only add to the cost of trading within ASEAN: they may also stifle effective competition and subvert the efforts of ASEAN governments to build an effective single market. The markets for port and shipping services will operate more efficiently if players and potential players have access to the same information and opportunities. If some parties with insider knowledge or the right contacts are able to deter entry or establish an unfair advantage through informal charges/corrupt practices, the full benefits of a single AEAN market will not be realised.

Promoting Efficient and Competitive Intra-ASEAN Shipping Services
REPSF Project 04/001: Final Main Report 57
7. Lagging port infrastructure in minor ports A significant level of investment in fixed port infrastructure (wharves, handling and
storage facilities etc) in the major ASEAN ports has not always been matched by investments in the lesser ports, particularly in handling equipment. Productivity levels in minor ports suffer as a result of failure to provide equipment. Privatisation of ASEAN ports has concentrated investment in the major ports handling large container volumes and major bulk trades, to the partial or complete exclusion of minor ports which have by and large remained under the control of state and local governments. State and local governments may lack funds, knowledge of port needs or the focus to respond appropriately to shipping needs. As a result, vessels often need to be self-geared, loading/discharge operations are slow, congestion delays occur and unit costs are higher than they would otherwise be.
8. Lack of provision for breakbulk operators Although container shipping now dominates the region’s non-bulk shipping, break-
bulk/general cargo traffic is still important in intra-ASEAN trades. But it tends to have been neglected – in terms of the provision of handling equipment and other port infrastructure – in the push for containerisation. This is particular so with respect to small-scale operators: in the major ports in particular, lower volume ‘informal’ operators consider that they have been crowded out by the demands of the rapidly expanding and space-hungry container sector.
These services, although they carry only a small share of the total national cargo task, continue to play a vital social role in ensuring that remote communities receive regular shipping services. Port planning should take account of the range of users’ needs, rather than focus exclusively on the containerised hub/feeder liner system. Several stakeholders felt that allowing greater autonomy in port planning and decision-making would be likely to have a beneficial effect in this respect. As catering for these minor trades is often not attractive to private investors, there is likely to be a continuing role for government investment in this area.
9. Planning and regulation This is very much a question of striking the right balance. There is undoubtedly a
need for ASEAN governments to maintain a long-term vision for their transport systems, and to be aware of the need for longer-term investment. Clear and coherent national infrastructure plans, especially if they are consistent with and complementary to those of other ASEAN countries, will not only ensure that scarce public funds are wisely allocated: they will also provide the information that the private sector needs to provide a context for its own investment decisions. Proper planning is also essential to ensure that port sites and access corridors are reserved for future use, and that infrastructure is developed in a timely manner as demand grows
But on the other hand planning and decision-making processes need to be flexible enough to respond to changing needs, and open enough to encourage entrepreneurial activity. Many stakeholders, even in government, felt that business units such as individual ports should be given greater autonomy to make their own decisions about how best to respond to markets using their own financial resources. The best way to encourage this, it was felt, is to give private investors a greater stake under transparent, competitive arrangements. Rules and regulations should be transparent, consistent and supportive of open markets and competition.
10. Information deficiencies One of the key learnings for the study team from the field work is how fragmented and
incomplete information of both intra-ASEAN trade and intra-ASEAN shipping services are. Moreover, in some cases this is likely to become considerably worse: decentralisation policies in Indonesia and bureaucratic reform in Thailand, for instance,

Promoting Efficient and Competitive Intra-ASEAN Shipping Services
REPSF Project 04/001: Final Main Report 58
appear to have resulted in disruption to previously established patterns of data-gathering and data dissemination.
11. Port productivity and charges At the level of the port there remains much to be done. Productivity levels could be
raised further throughout the region, by investment, more efficient working practices and more customer-oriented management, particularly in secondary ports.
Port charges should reflect the efficiencies gained; currently they often do not reflect the costs incurred. Informal practices should be eliminated; if additional payments are needed, they should be incorporated in the formal port charges. The complexity and diversity of charging practices makes it difficult to monitor whether efficiencies are being reflected and how. It also makes it difficult to compare the performance of different ports.41
12. Trade imbalances A feature of several ASEAN countries is an imbalance of trade, most notably in the
Philippines, with import shipping volumes exceeding export volumes. The result is a large proportion of empty containers moved, generally higher transport costs due to inefficient vessel and equipment utilisation and significant differences between import and export shipping rates. According to several stakeholders, measures to establish a better trade balance should be actively pursued, such as are already showing success with the integration of motor vehicle component manufacturing through initiatives under the ASEAN Investment Cooperation Program.
13. Similarities between ASEAN countries A further, related, factor limiting opportunities for intra-ASEAN trade and shipping is
the fact that many of the ASEAN economies trade in similar commodities. Apart from raw materials, their exports are those of agricultural economies that are rapidly diversifying into manufactured goods and services; their imports meet the needs of a growing manufacturing base and expanding consumer markets. Their international ports compete with one another. Efforts to stimulate trade, stakeholders felt, should aim at encouraging diversification and strengthening the complementarity of their economies, rather than their similarities.
Whilst many ASEAN economies currently specialise in the production of similar commodities, the effect of AFTA will be to encourage countries to specialise according to comparative advantage. In the medium to long-run this will increase the volume of intra-ASEAN trade and create employment opportunities for ASEAN shipping. AFTA should also encourage the further development of some types of industry within the ASEAN area – all trade blocs have both trade creating and trade diverting effects. AFTA will encourage some degree of trade diversion, the effect of which is that ASEAN made products will replace foreign products. The common external tariff wall will have this effect.
14. Partnerships ASEAN countries, with the exception of Singapore, Malaysia and Thailand, have
been slow to develop the relationships between customers and logistics service providers that characterise the more efficient international trades. The concept of integrated services, with sellers, buyers, transport intermediaries and government infrastructure-providers working together in partnership to bring down costs, is only just emerging. According to several interviewees, greater involvement by competitive foreign logistics specialists would probably help hasten this move.
41 See United Nations ESCAP/KMI, 2002. Comparative Analysis of Port Tariffs in the ESCAP region, UN ESCAP: Bangkok.
Promoting Efficient and Competitive Intra-ASEAN Shipping Services
REPSF Project 04/001: Final Main Report 59
E. SUMMARY Taken together, these considerations of this chapter suggest that the intra-ASEAN
shipping system, although it works fairly well at present, is capable of further improvement. The next and final chapter of this report is concerned with the development of a plan for bringing about that improvement.

Promoting Efficient and Competitive Intra-ASEAN Shipping Services
REPSF Project 04/001: Final Main Report 60
This page has intentionally been left blank.

Promoting Efficient and Competitive Intra-ASEAN Shipping Services
REPSF Project 04/001: Final Main Report 61
VII. THE WAY FORWARD
In this chapter we discuss the things that will need to change in order to ensure the best possible performances of the intra-ASEAN shipping system. The core of the improvement strategy is the adoption of an agreed framework for future cooperation in shipping, incorporating the articulation of a set of common principles for shipping policy within the ASEAN region.
A. KEY CONSIDERATIONS
1. Building on a strong foundation Working together on the Hanoi Plan of Action (HPA) transport agenda and Successor
Plan of Action in Transport 1999-2004, the member countries of ASEAN have further developed what has for some time been a fairly open market for shipping service to, from and within ASEAN. With the exception of cabotage limitations, there are few restrictions on where ASEAN (or non-ASEAN) shipowners may operate, or what cargoes they may carry.
• There are few cargo reservation measures (other than cabotage restrictions): those that remain are generally related to cargo controlled by government-owned enterprises
• Although direct and indirect government ownership of shipping operations remains a feature of most ASEAN countries, commercialisation of these operations and exposure of government-owned lines to competition has improved operating efficiency and reduced distortions in the shipping market
• There is little if any formal discrimination between the vessels of different economies in the terms and conditions of access to port services
• Liberalisation of the provision of port services and the encouragement of private investment in port facilities have led improvements in productivity and in some cases has accelerated port development
• In some countries, flexibility in the requirements for vessel registration and/or operation has created conditions in which national shipowners can achieve cost reductions without resorting to flagging out
In general, the shipping component of the intra-ASEAN shipping system works well.
The policy alternatives presented in this report therefore do not represent a radical transformation of the intra-ASEAN shipping environment. Rather, they focus on consolidating and building on the sound foundation that has already been laid, extending the trends of recent years in ways which are consistent with the developed a single ASEAN market for goods and services, and the specific goals and objectives of the Transport Action Plan.
2. An ASEAN Approach The field work program has reinforced the perception of our technical proposal: that
the challenge lies in developing flexible pathways to a common goal. ASEAN countries are at different stages in economic development, and they have differing factor endowments that require tailored approaches to policy and strategy. ASEAN’s success

Promoting Efficient and Competitive Intra-ASEAN Shipping Services
REPSF Project 04/001: Final Main Report 62
has to a very large extent been built on finding ways to develop and progress a shared vision while acknowledging and accepting of this diversity,
The diversity of the ASEAN member countries is evident in shipping as elsewhere. For example, Singapore and Malaysia are significant established players on the global maritime sector whereas others, like Cambodia and Lao PDR, have only a minimal involvement in the provision of shipping services. For countries like Indonesia and Philippines, maritime services are of crucial importance in domestic transportation: in others, such as Thailand, they play only a very minor role in the carriage of domestic passengers and freight. In some countries, such as Vietnam and Myanmar, the public sector plays a crucial role in the delivery of shipping services; in others, such as the Philippines, the role of the public sector is largely limited to regulation and infrastructure provision. Finally, the development of a strong national shipping industry has been a long-term policy commitment for some ASEAN members, such as Malaysia, while others, such as Brunei, have focused their maritime policy on ensuring the provision of efficient and competitive services to shippers rather than development of a national shipping industry.
Despite this diversity, however, ASEAN is bound by the common goal of closer economic integration. The focus on this goal has been clarified and intensified through the Bali Concord II. The Bali Concord makes specific reference to the diversity of the ASEAN economies, and the opportunities that this provides for complementarity:
“The ASEAN Economic Community shall establish ASEAN as a single market and production base, turning the diversity that characterises the region into opportunities for business complementation making the ASEAN a more dynamic and stronger segment of the global supply chain…”
Moreover the document notes that:
“The realization of a fully integrated economic community requires implementation of both liberalization and cooperation measures”42
The principles of diversity as opportunity and the need to complement competition and liberalisation with capacity building measures are reflected in the policy direction articulated below.
3. Balancing different values While all ASEAN countries are keen to foster further improvements in the
performance of intra-ASEAN shipping, it is important that the way in which this is done acknowledges that transport efficiency is not the only concern of ASEAN leaders when contemplating the future of the intra-ASEAN shipping system.
Security considerations in particular have recently once more become a significant focus for the agenda of most of the nations of the region. The future direction of shipping policy need to acknowledge the legitimacy of an economy’s desire to maintain a certain level of maritime capability for security reasons, and recognize that this may, in some cases, require support measures for shipping that result in some degree of distortion in shipping markets.
Many ASEAN member countries have a more general national aspiration to develop a significant shipping capability. This is perhaps most clearly articulated in the Master Plan for Maritime Development of Thailand.43
42 ASEAN, Declaration Of ASEAN Concord II (Bali Concord II), http://www.aseansec.org/15159.htm,
accessed 17 December 2004. 43 Office of the Maritime Promotion Commission 1999, Ministry of Transport and Communication,
Master Plan for Maritime Development. MoTC: Bangkok.

Promoting Efficient and Competitive Intra-ASEAN Shipping Services
REPSF Project 04/001: Final Main Report 63
The way forward for shipping policy must recognise the legitimacy of developing economy aspirations, and acknowledge that the fulfilment of these aspirations may require some degree of government support, at least in the short term. This is reflected in the 2000 APEC report on the Facilitation of International Shipping:
− “Aspiring newcomers to the international shipping market face the historical reality that a range of countries (both developed and developing) have built up comparative/competitive advantage in the provision of shipping services. In many cases, the development of this advantage has involved a significant degree of past government involvement or support. Developing economies aspiring to build the capacity to compete on equal terms with established shipping powers may need to provide some degree of support for their shipping industries in order to build a sustainable comparative/competitive advantage.”44
One of the challenges for ASEAN shipping policy is to ensure that the means by which this support is delivered are such that any short-run negative impact on the efficiency of the intra-ASEAN shipping system is minimised. This is most likely to be achieved if support measures are direct, transparent, and of limited duration.
4. Intra-ASEAN Shipping and the Global Maritime System While the focus of the current study is on the efficiency of intra-ASEAN shipping
services, the structure, costs and policies of intra-ASEAN shipping cannot be properly considered in isolation from the global maritime transport system.
With the possible exception of the Mediterranean, the interplay between local, regional and global shipping services is more complex in the ASEAN region than in other regions of the world:
• Mainline carriers operating on long-distance East-West trades may make calls at several ASEAN ports, and if space is available may carry intra-ASEAN cargoes on these legs
• Intra-Asian services may carry a combination of intra-ASEAN cargoes, cargoes flowing between ASEAN members and non-member countries within Asia, and cargoes between two non-member countries
• In the system of short-sea container shipping routes that centre on the key ASEAN hub ports there is no clear distinction between regional services (carrying cargo between ASEAN nations) and feeder services (carrying goods bound for destinations further afield, destined for transhipment in the hub port on to intra-Asian or inter-continental services).
Intra-ASEAN shipping is therefore not a clearly defined closed system. It shades off imperceptibly into the broader global shipping system on the one hand, and on the other into the domestic shipping services of member countries.
This indefiniteness is a good thing. The integration of the various levels of shipping service allows a range of different shipping line actors to assess new market opportunities as they arise, and to respond by developing new services where this is commercially sensible. Each of these actors will have different strengths, and each will have different options for exploiting synergies between the new service and their existing operations. The diversity of potential service providers will increase the likelihood that potential markets are identified and served.
44 Meyrick and Associates, 2000. Facilitation of International Shipping, report to the APEC Transport
Working Group, downloaded from http://www.apec-tptwg.org.tw/TPT/tpt-main/Archives/tpt-wg24/tpt-24-all-papers.htm#MaritimeInitiative on 4 December 2004.

Promoting Efficient and Competitive Intra-ASEAN Shipping Services
REPSF Project 04/001: Final Main Report 64
The lack of precise definition does however have implications for policy recommendations. The two most important of these are that:
• There is a limit to the extent to which it is sensible to talk about policies for intra-ASEAN shipping. In many instances, the policies needed to support and enhance the efficient operation of intra-ASEAN shipping are precisely the same as those that are required to support and enhance efficient shipping operations between ASEAN and the rest of the world. Our policy recommendations therefore encompass measures which will have an impact on intra-ASEAN shipping, but whose impact will not be confined to intra-ASEAN operations.
• We have suggested above that the flexibility that results from close integration of the intra-ASEAN shipping system with the global shipping system is beneficial. We have also suggested that this is also true at the other relevant interface: that between domestic shipping and intra-ASEAN shipping. However, whereas there are no regulatory impediments to integrating intra-ASEAN services with other international services, cabotage restrictions do limit the scope for integration of domestic and international operations. Obtaining the full potential benefit of seamless integration of the various market segments will require re-thinking of these restrictions.
B. RECOMMENDED POLICY INITIATIVES
1. Overview of the Way Forward In line with ASEAN’s commitment to the development of a single market by 2020, the
vision for the way forward is based on a strong ASEAN shipping sector operating efficiently within a single shipping market. The shipping sector will be globally competitive and supported by appropriate infrastructure, regulation and human resources. The recommended strategy envisages orderly progress towards the achievement of these aims.
The proposed way forward comprises for major activity areas:
• Infrastructure strategies to support the full range of shipping services
• Integration to form a single ASEAN shipping market
• Harmonisation of regulatory requirements and commercial practices
• Human resources and capacity development
• The development of a single ASEAN voice.

Promoting Efficient and Competitive Intra-ASEAN Shipping Services
REPSF Project 04/001: Final Main Report 65
These areas, and their relationship to our research findings, are set out in more detail in Table 14 below.
Table 14: Overview of The Way Forward
Activity Area Policy objective How this relates to our research findings
A single ASEAN voice
Developing the capacity of ASEAN to express a single coherent policy position on maritime matters of common interest to ASEAN countries
A number of the problems noted by ASEAN shippers and shipowners alike stem from conditions that are not directly under the control of ASEAN governments or of ASEAN shippers and shipowners. Some though by no means all of these are, at least in part, the effect of policies of other governments or to actions of international shipowners. The development of a common ASEAN voice on matters of international shipping policy will allow ASEAN countries to exercise an influence on these actors that cannot be achieved by the unilateral action of individual ASEAN governments.
Infrastructure
Ensuring that the transport infrastructure exists to support the effective and efficient operation on intra-ASEAN shipping services.
Two of the consistent themes or our research are (i) unevenness in the level of development of ports that are important to intra-ASEAN shipping (ii) a concern that investment in serving high growth commercially attractive areas (international container shipping) may be crowding out investment in socially vital but less commercially rewarding areas (small-scale general cargo shipping)
Integration
The development of a single integrated ASEAN shipping market in which all ASEAN operators can operate without restriction
The research reveals that cabotage policies are implemented in most ASEAN member countries, but are partly undermined by the desire to compete effectively in international marketplaces (leading to selective liberalisation in Malaysia) or by resource shortages (for instance in Indonesia), which have led to tensions between general policy settings and shipping practice.
Harmonisation Ensuring that the single ASEAN shipping market is effective by ensuring that competition takes place on equitable terms and conditions
The research reveals that many ASEAN countries remain committed to supporting the development of their national fleets, and employment of national seafarers. How this is done varies from country to country. These policy differences lead to inefficiencies through the distortion of competition in international service within ASEAN, but perhaps more importantly will be a barrier to the development of a single ASEAN shipping market. In addition, the operation of an efficient single market would be made more effective by harmonisation of registration procedures. Finally there are other aspects of harmonisation not so directly related to the current brief – most notably harmonisation of customs and quarantine procedures
Human resources and capacity development
Developing and spreading throughout ASEAN the management capacity and technologies required to manage shipping and port operations safely, efficiently and in an environmentally acceptable manner.
The research encountered a growing realisation that it is no longer adequate to consider shipping operations in isolation from the broader operation on the logistics system, but also vast divergences in the capacity of individual ASEAN countries to manage effectively complex supply chains. In addition, there is a marked imbalance within ASEAN in the supply of and demand for seafarers. Imbalances also exist in the capacity of ASEAN nations to train seafarers.

Promoting Efficient and Competitive Intra-ASEAN Shipping Services
REPSF Project 04/001: Final Main Report 66
2. A Single ASEAN Voice
A recurring theme of the fieldwork was a sense of threat - of loss of control - amongst participants in the ASEAN shipping sector. The efficiency and cost structure of ASEAN shipping services, and in some instances the very existence of an ASEAN shipping sector, are seen by many as being determined in large part by forces that are beyond the control of ASEAN. Developments as diverse as the introduction of new global security requirements, the thinness of intra-ASEAN trade flows, a shortage of available shipping capacity, extreme and persistent imbalances in trade flows, and the introduction of terminal handling charges were identified as factors over which the ASEAN shipping industry had little or no control, but which could profoundly affect shipping costs both within ASEAN and between ASEAN and other regions.
It is undoubtedly true that some of these factors are and will continue to be beyond the control of ASEAN: the current imbalance in global trade flows is an obvious example. But with some other factors the issue is not so straightforward. New security requirements and the introduction and calculation of terminal handling changes are two examples where conscious policy decisions as being made that have an important impact on the cost of ASEAN shipping, but the decisions are currently made outside of ASEAN. In these instances ASEAN has the potential to affect the outcome, to a greater or lesser extent, by making sure that its interests and views are clearly articulated and forcefully presented to the parties who make these decisions. In order to do this effectively, ASEAN will need to speak consistently with a single voice. This is turn will require – as it has for the European Union and the OECD45 – the development of a formally defined and clearly articulated common shipping policy.
This common policy will need be anchored in a set of clear principles. The following principles, suggested in the APEC Facilitation of International Shipping Report, are equally applicable ASEAN.
• That the special character of shipping as an international activity creates a need for the coordination and harmonisation of shipping polices
• That free and fair competition is the most effective means of ensuring the provision of the adequate and economic maritime services required by international trade
• That there is a need to maintain an equitable balance of interest between shipper and shipowners, bearing in mind the long term interest of consumers;
• That there should be no discrimination between the citizens and businesses of ASEAN economies in access to cargoes or port facilities, or in access to investment or business opportunities in maritime auxiliary and intermodal services
• That particular economies may need to provide some measure of support to their national shipping industries, either for national security reasons or in order to build a national maritime capability
• That any such support should be delivered by mechanisms that minimise any adverse consequence for the efficiency and flexibility of international maritime transport.
45 OECD 2000. Recommendation of the Council concerning Common Principles of Shipping Policy for Member
Countries. 28 September 2000, C(2000)124/Final

Promoting Efficient and Competitive Intra-ASEAN Shipping Services
REPSF Project 04/001: Final Main Report 67
The content of a common ASEAN shipping policy should contain, as a minimum, the following elements:
• a set of agreed guidelines for the regulation of liner shipping markets
• an undertaking to act collectively to oppose:
− attempts by non-member countries to restrict access to cargoes moving to from or between ASEAN countries by shipping lines adhering to the principle of free competition on a commercial basis
− the imposition of unjustifiable fees, surcharges or imposts by shipping lines or associations of shipping lines with a dominant position in any trade to from or within ASEAN
• commitments to:
− ensure that any international shipping operations retained under Government ownership are corporatised and operated in accordance with commercial principles
− refrain from providing preferential access to routes, cargoes or contracts to Government-owned lines, and to adopt a timetable for the removal of such preferences where they currently exist
− foster competition in all shipping markets
− work collectively and progressively towards the development of a single integrated ASEAN shipping market in which all sections of the market are open to all ASEAN shipping operators
• a shared understanding of the limits acceptable in the role of government in supporting and promoting the development of the shipping industry of an ASEAN country, which would preferably commit ASEAN governments to
− pursuing, in the long term, the target of free competition between unsubsidised shipping lines on a commercial basis
− ensuring that all support measures that are provided for national flag are direct, aimed at reducing the cost of shipping, and limited to the minimum necessary to achieve the desired national goals.
• The development and progressive implementation of a set of common principles for the pricing of port services based on the cost of service and infrastructure provision.
3. Infrastructure Discussion
It is easy to define in conceptual terms the process of developing adequate and effective port infrastructure and supporting road network for the ASEAN region. But the coherent planning is extremely difficult to achieve in practice, in part because of the inherent uncertainties involved in predicting patterns of demand over the long term, but also because of national rivalries and differing national priorities.
Over-planning is also an ever present danger. While it is important to prepare properly for the future, and to ensure that potential investors from both the public and private sector are provided with a context within which to frame their individual investment decisions, it is also important to retain sufficient flexibility to adapt to emerging trends. For this reason any infrastructure planning framework must be constantly under review.

Promoting Efficient and Competitive Intra-ASEAN Shipping Services
REPSF Project 04/001: Final Main Report 68
But despite these difficulties, a clearly specified regional vision on transport infrastructure development is important if intra-ASEAN shipping is to operate as efficiently and effectively as it should and realise its potential to foster and support ASEAN’s vision of an integrated single market by 2020.
ASEAN has recognised this, and has begun the process of defining an ASEAN transport network. This transport network consists of the hardware elements – roads, ports and airports – that are of significance at the regional level. 47 ports have been identified as part of that network.
Identifying which components of ASEAN’s extensive and diverse transport infrastructure are of regional significance is important. The development of the ASEAN transport network will improve the targeting of investment both in ports themselves and in supporting infrastructure. It may also help to ensure adequate provision is made for those elements of the intra-ASEAN system which are less lucrative than the high-growth container sector, but which continue to play a vital role in maintaining maritime transport links, especially in the more remote regions of ASEAN.
But network definition is only a first step. The ultimate goal is to ensure that all elements of the ASEAN transport network are capable of efficiently meeting the demands that are likely to be made on them. In achieving this goal, the more important task – and a much more difficult one – will be to influence national investment priorities so that they align more closely with the needs of ASEAN as an integrated economic unit.
In doing so, however, it will be important to retain an outward focus. The ASEAN transport network is important not just because it will help to bring ASEAN together. The ASEAN countries have grown by being outward looking economies, and the impact of AFTA will be to further increase the trade dependence of the ASEAN countries. The ASEAN transport network should perform the dual function of integrating the ASEAN economies, and improving the links connecting ASEAN to the rest of the world.
Towards Implementation The development of the transport infrastructure required to support the optimal
operation of the intra-ASEAN shipping system can be divided into four phases.
Definition ASEAN has identified the links of the ASEAN Highway and identified the ports
that are included in the ASEAN transport network. However, it is our understanding that ports were included by nomination by member countries rather through any systematic evaluation of the contribution that they could make to closer ASEAN economic integration. It would be difficult now to exclude any ports that have already been included. However, the late inclusion of Tanjung Pelepas in the set of ports suggests a degree of flexibility with respect to including new elements. A systematic review of the port system and likely developments in shipping networks may be worthwhile in order to identify any further ports that should be included in the network.
Evaluation The second phase would involve an assessment of both the magnitude and
character of likely future demand for each included port (and where appropriate supporting inland linkages), and the capacity of the port to cater for that demand. The effective completion of this phase would require as a prerequisite the development of an improved common database on both the structure of demand

Promoting Efficient and Competitive Intra-ASEAN Shipping Services
REPSF Project 04/001: Final Main Report 69
for maritime transport within ASEAN and the nature and capabilities of ASEAN network ports. (A draft outline of the desirable contents of such a database is provided in Appendix 3).
Project Development The third phase would entail the identification and specification of the priority
projects that would need to undertaken in order to bridge the gap between likely future demand and current capabilities. This is a difficult and complex business, since it necessarily implies that each individual country must make some compromises in its individual investment priorities. However, without this willingness the concept of an intra-ASEAN transport network will be little more than a polite gesture. As was said in the context of the development of the Trans-European Transport Network:
“History shows us, in fact, that each politico-economic system uses a communications system which serves its requirements. In Europe, for example, the transport network has been designed to serve the internal needs of states, with highly dense transport links within national boundaries and traffic with other states tending to be channeled through border crossing- points, the number of which is relatively limited compared with national routes and which are more constrained than the latter by geographical factors. The structure of national transport networks, then, means that European traffic passes through connected national subsystems rather than through a proper European system operating as a function of the single market, while the increase in international trade has led to an increase in bottlenecks at frontier crossing-points, thereby highlighting the limitations of this situation”.46
These issues are as relevant to the ASEAN context as they are to Europe – and possibly more so.
The European Union sought to assist this process through the establishment of clear guidelines for project selection. In practice however the guidelines were very broad. This has resulted in the priority projects ultimately being selected through a semi-political process.
Project Implementation The most complex aspect of project implementation is likely to be funding. In
the European Union, with its comparatively mature trans-national political and legal infrastructure, support for the implementation of priority projects can be funded - or at least co-funded – from European institutions. The European Investment Bank is reported to have contributed one-quarter of the total cost of developing the priority projects of the Trans-European Transport Network.47 This option is unlikely to be available to ASEAN in the foreseeable future. However, ASEAN member countries already provide assistance to each other with ASEAN transport network projects: Thailand, for instance, has provided both grant and soft loan funding for the completion of the Myawaddy – Mawlamyine road in Myanmar. One option is to formalise such contributions into a structured program of support for identified priority projects.
46 European Community 1997. The Financing Of Trans-European Transport Networks. Working Document, Transport Series 5/97. 47 Trans-European Transport Networks: A political and financial challenge. http://www.ita-aites.org/cms/431.html. Accessed 21 December 2004.

Promoting Efficient and Competitive Intra-ASEAN Shipping Services
REPSF Project 04/001: Final Main Report 70
4. Integration Entry to international shipping operations to, from and within ASEAN are generally
free and subject to few restrictions. This is not the case with domestic shipping operations: most ASEAN countries impose significant restrictions on the operation of foreign-flagged vessels in their coastal trades.
The prevalence of cabotage policies is a possible inhibiting factor in the development of efficient shipping routes servicing the more remote regions of archipelagic ASEAN countries. This is in tension with the general social objectives of ASEAN, which stress the importance of ensuring that all members of the ASEAN community are included in the process of economic development.
While ASEAN countries clearly wish to maintain a level of control over domestic shipping operations – as do most other countries – selective and progressive liberalisation would yield some important benefits.
There are significant obstacles to such liberalisation, and the field work program identified strong pressure within some ASEAN countries for a reversion to the more strictly controlled regimes that provided higher levels of protection for national shipowners on domestic routes, and in some instances on international routes as well. Yet the precedent of the European Union, which remains the most successful example of nations working together to develop a single economic unit while retaining political sovereignty, shows that these difficulties can be overcome if the commitment is strong, rewards are clear, the timetabling sensitive to the particular conditions prevailing in individual member states.
ASEAN is very different from the European Union. Importantly, the gap between the most developed and the least developed members of ASEAN is very much larger than any which exists in the European Union. The range of political systems that exists within ASEAN is also much greater. Finally, the European Union has a formal legal structure and established institutions that ASEAN does not. Also, much of the European Union is basically a single land mass, so that a range of land and transport options exist as an alternative to the use of shipping services.
Alongside these differences, however, are some interesting similarities. Although member states of the EU were more homogenous than those of ASEAN, there were nevertheless significant differences in income, in politics, and in maritime history. Despite the existence of a formal legal framework the process of establishing a Common Maritime Policy was gradual and required much negotiation between member states. The task was to develop a balance between the needs of individual Member States and the need to foster a competitive Community fleet and an open and liberalized shipping market. (A brief history of the creation of a single internal shipping market in the European Union is included as Appendix 4).
The phasing of the creation of a single internal shipping market within ASEAN would no doubt need to be different from that of the European Union, reflecting differences in geography and political sensitivities. However, the two broad phases of the European approach do appear to be also applicable in ASEAN:
I. Consolidation of an already generally liberalised international shipping sector
During this phase, the following commitments could be negotiated:
• Assurance of the right of any ASEAN member country to undertake international trade through the ports of any other member without any further licence or permit requirements
• Grant of the right to ASEAN shipowners or ship’s agencies to establish a ship’s agency in any member country, and of freedom to select the agent of choice

Promoting Efficient and Competitive Intra-ASEAN Shipping Services
REPSF Project 04/001: Final Main Report 71
• National treatment of ASEAN carriers with respect to any remaining reservations of any cargoes (for example, government cargoes)
II. Gradual relaxation of cabotage restrictions
The phasing of any relaxation of cabotage is likely to be the subject of long and complex negotiations between the governments of member countries, and it is impossible to predict what will emerge from such negotiations. The sequencing suggested below is put forward in an attempt to balance the likely level of threat to national shipping industries against the expected benefits of liberalisation of particular subsectors:
For vessels registered in an ASEAN member country
1. Liberalise domestic feeder operations: allow the carriage of cargoes on domestic legs that comprise part of an international journey
2. Allow incidental carriage of domestic cargoes on vessels operating primarily in an international trade
For vessels registered in an ASEAN member country and crewed by ASEAN
nationals
1. Liberalise near-sea operations: allow free access to participating ASEAN countries operating within established growth areas (IMT-GT, BIMP-EAGA)
2. Allow all ASEAN operators to participate in coastal general cargo and dry bulk trades (that is excluding trade between islands)
3. Allow all ASEAN operators to participate in coastal liquid bulk trades (that is excluding trade between islands)
4. Allow all ASEAN operators to participate in inter-island bulk trades 5. Allow all ASEAN operators to participate in inter-island general cargo trades 6. Allow all ASEAN operators to participate in domestic passenger trades.
5. Harmonisation
Fiscal Regimes Many ASEAN nations desire to strengthen and develop their national fleets.
Historically, cargo reservation and cargo preference have been used as instruments to achieve this objective. Today there is a general recognition that the cost of using such devices is high, and that shippers lose from such policies far more than shipowners gain, and few countries now depend on such policies to any marked extent. Explicit subsidies are also relatively rare.
The use of concessional financing arrangements and taxation relief are however much more common. While it is easy to sympathise with the aspirations of ASEAN member countries, particularly those whose maritime sectors are not yet especially strong, to develop a strong national fleet, there is a risk that the competition between ASEAN countries could see this degenerate into a negative spiral, with each country seeking to provide more advantageous financial conditions to its shipowners than its neighbours.
Harmonisation of fiscal support arrangements for shipping amongst ASEAN member countries could provide an effective protection against this risk.

Promoting Efficient and Competitive Intra-ASEAN Shipping Services
REPSF Project 04/001: Final Main Report 72
An agreement of this sort was reached by the OECD in 1981 as a ‘Gentleman’s agreement’: that is, an agreement with no legal force.48 It was subsequently incorporated into law by the European Union.
The different levels of economic development within ASEAN, as well as the differences in the priority given to the development of national shipping capacity, will clearly make achieving agreement on the harmonisation of fiscal policy a major challenge. However, there is scope for a gradual approach which recognises these differences through an interim multi-tiered approach. Similar strategies have been adopted elsewhere: for example, that the EU accepted in 1999 a support package for that provided shipowners of European Economic Area will loans 80% of the ships value to be financed by loans up to 3% below the long-term reference rate over a 12-year period, while at the same time confirming the 8.5-year, 8% per annum limit for European Union shipowners.49 This in effect sanctions the provision of more generous financing terms for less developed economies. A similar multi-tier system may be appropriate in ASEAN.
Agreement on harmonised fiscal support arrangements will need to be founded on a basis of trust and transparency. Moreover, defining appropriate and achievable harmonised arrangements will benefit from enhanced understanding of current arrangements and an improved appreciation of both the intended and unintended consequences of various measures. Exchange of experiences among Member Countries would be assist with all of these objectives, and should be encouraged as a first step towards greater harmonisation.
Registration practices The implementation of a fully integrated shipping market will benefit from
harmonisation of ship registration procedures. On the one hand, countries will understandably wish to be confident that vessels trading in their waters meet the safety and environmental standards that are required by the national government. On the other, it would be a significant impediment to the free movement of ships between routes if this required additional inspections and certifications.
There are a number of ways in which this issue could be addressed. One is the creation of a single ASEAN shipping register, open to the vessels of all ASEAN countries. A similar idea was floated some years ago in the European Union, with the proposal to introduce a European Register of Ships (Euros). However, this proposition never found great favour with community members, and has not been implemented.
Instead, the approach that has been adopted in practice is the promulgation of Europe-wide standards to which all ships registered in member countries will conform. This approach avoids the difficulties associated with creating a registry that is not associated with a sovereign state, but lays the foundation for a system of mutual recognition which has a similar effect. It parallels in the maritime sector the initiatives that are being taken by ASEAN in the land transport sector to support the mutual recognition of road vehicle registration.
48 OECD, Summary overview of the arrangement.
http://www.oecd.org/document/42/0,2340,en_2649_37431_2668394_1_1_1_37431,00.html Accessed 20 Dec 2004. The basic terms of the 1981 agreement allow for financing of 80% of the ship’s value at 8.5% over 8 years
49 EU, Commission approves shipbuilding aid scheme in Spain. Press release 18/01/2000. Ref IP/00/43.

Promoting Efficient and Competitive Intra-ASEAN Shipping Services
REPSF Project 04/001: Final Main Report 73
As a first step towards this, the development of commonly accepted ASEAN safety standards of ships for Intra-ASEAN shipping services (Common ASEAN Near Coastal Voyage Limits) could be prioritised.
An effective ASEAN single market for shipping services would be further facilitated by providing ASEAN shipowners with the ability to move their vessels freely from one register to another.
Port charging practices Port pricing practices vary significantly between ASEAN countries.
While some divergence in pricing practices and strategies may be necessary to reflect different organisation structures and different cost bases, and can be a useful element of competition between ports, it is difficult to avoid the impression that many of the differences that currently exist reflect port history and reluctance to change rather than any clearly defined pricing or competitive strategy. The result is a lack of transparency and ambiguity in precisely what is being charged for by whom.
A more consistent approach to port pricing would allow port users to compare the price and service offerings from various ports more readily, and hence encourage both direct and yardstick competition between ports. It will also allow users to predict with greater certainty the costs that they will face in particular ports, facilitating sound route planning, and provide port organisations with a better indication of the financial performance of particular facilities, encouraging improved investment practices. The UN ESCAP Model Port Tariff provides a template around which a more consistent approach might be built.50
A more consistent approach to port pricing does not however imply uniform port tariffs. As a means of encouraging regional integration – and in particular in encouraging services between remote regions of neighbouring countries – agreements on uniform port pricing appeal to a sense of equity. If it can seem to be fair that one nation should agree to charge the ships of a second nation a price for the use of the ports of the first nation that is equal to the price that the second nation charges ships of the first nation for the use of the second nation’s ports. Considerations of this sort have led to a commitment to common port prices as part of the BIMP-EAGA maritime transport initiatives.51 However, there are some good reasons for avoiding this route – most importantly, the distortion of investment decisions that could result from such practices.
Customs Immigration and Quarantine Services The issue of the harmonisation of Customs, Immigration and Quarantine Services
lies beyond the scope of the present brief. However, as this has been a persistent theme both in earlier studies of the efficiency and effectiveness of shipping services to, from and between ASEAN countries, and recurred frequently in our own consultations, we simply note that inconsistency in both the nature of regulatory requirements and the administration of those requirements is well documented.
50 ESCAP 1989, ESCAP/UNDP Model Port Tariff Structure: Final Report (ST/ESCAP/830: United
Nations: New York 51 Paul G. Dominguez 1997. Brunei Darussalam Indonesia Malaysia Philippines East Asian Growth
Area (BIMP-EAGA) Asian Review Of Public Administration 36-41.

Promoting Efficient and Competitive Intra-ASEAN Shipping Services
REPSF Project 04/001: Final Main Report 74
6. Human resources and capacity development Training of Seafarers
Globally, there is a structural supply demand gap in the seafarer market, and this imbalance is likely to worsen in coming years. The imbalance consists of
• A shortage of officers • A surplus of ratings
At present the supply mix of ASEAN seafarers is towards ratings rather than officers.
With advances in technology, maritime training – especially at officer level – is increasingly expensive. Increased competitiveness in international shipping and pressures for lower manning has reduced the availability of seagoing places. Simulator training can be a partial substitute, but simulators are expensive.
There is also an increasing need for specialised training of both existing crew and new trainees in certain specialised areas – most specifically in meeting the requirements of the new ISPS Code and the application of new shipboard technologies.
This initiative could be supported by
• Development of Regional Centres of Excellence with defined specialties to increase quality, recognition and availability of seafarer training at the regional levels
• The development and implementation of specific, focussed training courses, delivered to regional groups, particularly in:
− Maritime security, and in particular the effective discharge of ISPS Code obligations
− The use of new shipboard technologies
• Expanded access to sea-time placements
Creation on an integrated ASEAN labour market for seafarers The existence of shortages and surpluses of seafaring labour within ASEAN
suggests that there could be advantages from the development of a common seafaring labour market. The creation of an ASEAN-certified pool of seafarers, with national regulations relaxed to allow employment of ASEAN seamen throughout the region, should help countries currently experiencing a shortage of skilled seafarers. This would complement the integration initiative that was discussed previously. It would also both support and maximise the benefits of the training initiatives noted above.
The International Convention on Standards of Training Certification and Watchkeeping for Seafarers 1995 (STCW95) provides an internationally agreed framework within which mutual recognition of seafarers certificates could be implemented. However, Regulation I-10 of the STCW95 Convention requires places a clear obligation on the flag state to ensure that the certificates to which it grants recognition are issued in accordance with the standards of the Convention. A prerequisite for full mutual recognition will therefore be that all ASEAN seafarers are trained to meet requirements of STCW95.
The principle underlying this policy would be that it is intended to foster and support a single integrated ASEAN economy. It would be undesirable to allow this

Promoting Efficient and Competitive Intra-ASEAN Shipping Services
REPSF Project 04/001: Final Main Report 75
policy to have the effect of rolling back the freedoms now enjoyed by ASEAN national carriers to crew their vessels in the global trades, or on routes between ASEAN member countries. It is not the intention of this recommendation that the ability to select the crews for their vessels on the basis of purely commercial considerations should be replaced by a requirement to use, or preference for, ASEAN crews. Rather, the intention is that, where requirements at present exist that vessels be crewed by – or that preference be given to – crews of a particular nationality, this would eventually be replaced by a requirement that crews of an ASEAN nation be used.
Capacity building for maritime transport operators The liberalisation of the ASEAN maritime sector will bring with it significant new
commercial and technical challenges for ASEAN maritime transport operators. To ensure that operators are adequately equipped to meet these challenges – particular operators from ASEAN countries with a history of high levels of protection and in which the industry consists of a large number of small-scale operators - it will be important to develop an appropriate training and development strategy.
It has not been possible within the context of the current project to develop a detailed specification of the content of the program that would be required, and we recommend that further investigation of requirements should be an early priority. However, it is likely that the required training will include at least the following elements:
• Financial management
• International conventions and their implications
• Quality control systems
• Advanced ship management
Logistics skills development The draft ASEAN transport action plan emphasises the development of a
seamless multi-modal transport network incorporating ‘an established hierarchy of modal interfaces such as inland terminals, container stations and cargo clearance facilities’52. Transport planning in ASEAN as elsewhere still has a strong modal focus, with the consequence that (apart from terminals in major ports) intermodal and cargo consolidation facilities are often poorly planned and under-developed.
Table 15: Extract from ASEAN Transport Plan of Action
ASEAN Transport Plan of Action 2005-2010 Strategic Thrust Conceptual Planning for an Integrated Intermodal Transport Network in ASEAN Specific Action Promote strategic logistics centres, e.g. inland clearance depots, regional warehouse and distribution centres linking the major regional trade centres
The extent to which integrated logistics services have developed differs greatly across ASEAN countries. For example, Singapore, Malaysia and (more recently) Thailand have a relatively sophisticated approach to integrated logistics. The concept
52 Draft ASEAN Transport Action Plan 2005-2010, p4.

Promoting Efficient and Competitive Intra-ASEAN Shipping Services
REPSF Project 04/001: Final Main Report 76
is ill developed or completely lacking in less developed countries such as Cambodia and Myanmar. Several ASEAN nations are at the cutting edge of world’s best practice in these areas, while others are still developing basic capacities in this area. Since the effectiveness of the supply chain is limited to that of its weakest link, this is an ASEAN as well as a national problem.
In 1999, the importance of human resources development in intermodal transport and logistics was acknowledged in the ASEAN Framework Plan.
The Framework Plan identified the need:
• to establish centres of skills development and technical training in various aspects of transport infrastructure planning, construction, operation and management, with consideration on the availability and levels of expertise and facilities in the ASEAN.
• To develop ASEAN tertiary institutions of excellence in higher learning for advanced technologies and establishment of ASEAN centres of excellence in transport research and development.
The need to build capacity in intermodal transport was also identified in the report of the OECD Trilateral Logistics [TRILOG] project, Transport Logistics: Shared solutions to Common Challenges, and the successor subproject which focused on logistics in Asia. Key findings of these studies were that:
• Many governments still have limited understanding of logistics and a number of countries suffer from insufficient specialized logistics knowledge as well as lack of more general awareness of the importance of logistics, and hence unable to formulate cohesive policies to manage logistics.
• While some ASEAN nations have established global leadership in logistics, in others, awareness and understanding of modern logistics concepts like intermodal transport are still in their infancy.
• Logistics and ICT developments necessitate changes in the demand for skills. Improved training and qualification systems are needed to respond to these developments. Human resource development in support of the freight industry should be considered both a public and a private sector responsibility. Since the level of skills differs across countries, developing countries may need assistance in establishing training courses.
Moreover, the project also highlighted the need to develop capability building programs in logistics and intermodal transport for countries in the Asia-Pacific region, where the ASEAN region is situated, in order to effectively and efficiently formulate transport policies and initiatives responsive of their economic and trade objectives
The TRILOG project also recommended specific initiatives to strengthen the human resource base for increased awareness and professional competence in the area of transport facilitation and logistics:
• HRD programs on EDI and other IT applications (e.g. e-commerce, bar coding) and on Intermodal/Multimodal Transport System
• Training for Trainers for Multimodal Transport Operators.
There is a strong case for encouraging the ASEAN wide development of integrated logistics services through intra-ASEAN cooperation. By sharing the best of ASEAN practice – which in this case is essentially the same as world best practice – it will be possible to accelerate the development of advanced logistics capabilities in the lagging countries, to the ultimate benefit of the entire ASEAN community. It should also be possible to take advantage of the considerable work that has already been
Promoting Efficient and Competitive Intra-ASEAN Shipping Services
REPSF Project 04/001: Final Main Report 77
undertaken by international agencies, including UNCTAD, on the development of appropriate materials for training in freight forwarding, logistics and multimodal transport.
At the heart of this element of the strategy is the establishment of selected tertiary institutions throughout ASEAN as centres of excellence in logistics.53 Careful choice of educational institutions, adequate training of trainers, and effective promotion of courses will be essential to ensure that training effort is maintained once the project is completed.
An ASEAN-wide approach can help to moderate the cost of developing logistics capacity, and to enhance the quality of logistics skills, in several ways:
• By drawing on the expertise already available within ASEAN to deliver courses, especially to train trainers (Singapore has already highly developed training capabilities)
• By encouraging and facilitating specialization of institutions, and guaranteeing access to nationals of other ASEAN nations to courses run by specialist institutions
• By collaborating in research and
• By the interchange of scholars between training institutions
C. IMPLEMENTATION
The list of initiatives outlined in the sections above is ambitious but the vision for an integrated ASEAN economy by 2020 is ambitious, and it is vital that the maritime sector at least keep pace with the changes that this will bring. It is far preferable that, as a facilitator of economic integration, the maritime sector embraces the idea of single ASEAN market early. As an outward-looking sector accustomed to an openly competitive framework, it is well placed to do so.
It is proposed that the implementation of the above program should be managed under a sectoral Road Map, similar in style and content too the Road Maps that have been developed for the liberalisation of the eleven priority sectors. In particular, the Road Map for Integration of the Air Travel Sector provides an appropriate model. A draft road map is provided in the next subsection,
Figure 11 summarises in graphical form the indicative timetable for implementing the strategy. It envisages a synchronous advance on all five dimensions over a ten-year period, with the end point of single intra-ASEAN shipping market that delivers quality shipping services at a competitive price. This in turn will allow the maritime sector to play its proper role in stimulating and supporting the ASEAN economic integration project.
53 This recommendation was made in ALMEC (2000).

Promoting Efficient and Competitive Intra-ASEAN Shipping Services
REPSF Project 04/001: Final Main Report 78
Figure 11: Indicative Timetable for Implementation of Proposed Strategy
2005 2006 2007 2010 2011 2012 2013 2014 2015
Establish and agree general frameworkDevelop common principlesEstablish structure for coordination of ASEAN responses
Review list of ports in networkDevelop trade databaseFuture needs forecastsInventory of existing facilitiesNeeds assessmentDefine guidelines for project assessmentDevelop project prioritiesNegotiate funding mechanismsProject implementation
Assurance of free participation in international tradesGrant of rights to establish agencyNational treatment with respect to reserved cargoesPermit domestic feeder operationsLiberalisation of near sea in growth areasAllow incidental carriageOpen coastwise trades in dry bulk and general cargoOpen coastwise trades in liquid bulkOpen inter-island bulk tradesOpen inter-island general cargoOpen domestic passenger trades
Develop common rules for fiscal supportHarmonise ship registration practicesAllow free movement between registriesDevelop guidelines for structure of port tariffsHarmonise customs and quarantine procedures
Develop training strategy for maritime operatorsImplement maritime operator development strategyEstablish centres of logistics excellenceDevelop strategy for enhanced shipboard placementsEstablish regional centres of maritime excellenceImplement single labour market for seafarers
Human resource and capacity development
Harmonisation
Integration
A single ASEAN voice20092008
Infrastructure

Promoting Efficient and Competitive Intra-ASEAN Shipping Services
REPSF Project 04/001: Final Main Report 79
D. DRAFT ROAD MAP FOR INTEGRATION OF ASEAN MARITIME TRANSPORT SECTOR 1. Objective
The objective of this initiative is to advance full liberalisation of maritime transport services in ASEAN. The liberalisation of transport services is consistent with and supportive of the commitment of the ASEAN Leader’s commitment, recorded in the Bali Concord of October 2003, to the development of ASEAN as a single market and production base. Specifically, it furthers the goal of the leaders to institute new mechanisms and measures to strengthen the implementation of its existing economic initiatives, including the 1995 ASEAN Framework Agreement on Services (AFAS), and supports the goals and strategies enunciated in the Transport Sectoral Action plan 2005-2010.
2. Measures The Draft Roadmap provides a timebound action plan for concrete actions that
ASEAN member countries shall pursue in order to achieve a more open, efficient and competitive ASEAM maritime transport system. In keeping with the Bali Concord, the Road Map includes both liberalization and cooperation measures. These measures are grouped around five key themes.
Developing a single ASEAN voice
Developing the capacity of ASEAN to express a single coherent policy position on maritime matters of common interest to ASEAN countries
Infrastructure
Ensuring that the transport infrastructure exists to support the effective and efficient operation on intra-ASEAN shipping services.
Integration
The development of a single integrated ASEAN shipping market in which all ASEAN operators can operate without restriction
Harmonisation Ensuring that the single ASEAN shipping market is effective by ensuring that competition takes place on equitable terms and conditions
Human resources and capacity development
Developing and spreading throughout ASEAN the management capacity and technologies required to manage shipping and port operations safely, efficiently and in an environmentally acceptable manner.
In the implementation, two or more ASEAN Member Countries who are ready can
negotiate, conclude and sign implementing agreements/arrangements in line with the ASEAN-X Formula, on a plurilateral, multilateral or sub-regional basis. The other Member Countries could join in the implementation when they are ready.
ASEAN Member Countries shall be provided flexibility with regard to the implementation of the proposed timeline for the specific measures.
3. Coverage The measures will cover the movement/carriage of both passengers and cargo or
freight by maritime transport, and the provisions of the port and related services necessary for the safe, efficient and reliable operation of maritime transport services.

Promoting Efficient and Competitive Intra-ASEAN Shipping Services
REPSF Project 04/001: Final Main Report 80
4. Specific Measures and Timing
No MEASURES IMPLEMENTING BODY
TARGET DATE
I. Developing a single ASEAN voice
1 Establish and agree general principles and framework for a common shipping policy Dec 2006
2 Develop of fully articulated common shipping policy Dec 2006
3
Establish structure for the coordination of ASEAN responses to emerging maritime policy issues and actions by non-member countries or organizations that are contrary to the interests of ASEAN
Senior Transport Officials Meeting (STOM) through the Maritime Transport Working Group (MTWG) Dec 2007
II. Infrastructure
4 Review list of ports in the ASEAN transport network to ensure that all ports of regional significance are included. Dec 2005
5 Develop a comprehensive database of maritime trade to from and within ASEAN. Dec 2007
6 Develop a forecasting process and produce forecasts of future maritime trade flows to from and within ASEAN June 2008
7
Compile an full and comprehensive database on ASEAN network ports, including inventory of the facilities available, shipping services, port tariffs and key performance indicators
Dec 2007
8 Identify shortfalls in ASEAN network port performance and capacity
ASEAN Secretariat under the guidance of STOM through the MTWG
Dec 2008
9 Define agreed criteria and guidelines for assessing port development priorities, including the definition of acceptable performance criteria for ASEAN network ports.
Dec 2008
10 Develop project priorities for bridging performance and capacity gaps in ASEAN network ports
Senior Transport Officials Meeting (STOM) through the Maritime Transport Working Group (MTWG) Dec 2010
11 Negotiate funding mechanisms to support the implementation of identified projects in the ports of less developed ASEAN nations
ASEAN Leaders Dec 2012
12 Ensure that all ASEAN network ports meet defined minimum performance criteria. Member countries Dec 2015

Promoting Efficient and Competitive Intra-ASEAN Shipping Services
REPSF Project 04/001: Final Main Report 81
No MEASURES IMPLEMENTING BODY
TARGET DATE
III. Integration
13 Formally confirm the principal of open access to the international maritime trade of all ASEAN countries. Dec 2005
14 Provision of the right to ASEAN shipowners or ship’s agencies to establish a ship’s agency in any member country, and of freedom to select the agent of choice
Dec 2006
15
Grant ships of all ASEAN countries national treatment with respect to the carriage of any cargoes that remain subject to reservations or national preference arrangements (for instance, cargoes carried on behalf of government agencies).
Dec 2006
16
Relax cabotage restrictions to allow ship of all ASEAN nations to carry international cargoes between the port or origin and a transhipment port where these two ports are in the same country.
Dec 2007
17
Allow ASEAN ships primarily engaged in international trade but making a number of port calls in another ASEAN country to carry domestic cargos between those ports of call.
Dec 2008
18
Allow ships that are registered in ASEAN nations and crewed by ASEAN nationals, and are conducting services wholly within designated growth areas, to carry domestic cargoes of any participating nations between points within the growth area.
Dec 2007
19
Further relax cabotage operations by allowing all ASEAN-flagged ASEAN-crewed vessels to carry dry bulk and general cargo on coastwise54 operations on routes wholly within all ASEAN member countries.
Dec 2010
20 Liberalise coastwise movement in liquid bulk cargoes in the manner proposed in 19 above. Dec 2011
21 Liberalise the carriage of domestic inter-island bulk trades in the way proposed in 19 above. Dec 2013
22 Liberalise domestic inter-island general cargo trades in the way proposed in 19 above. Dec 2014
23 Liberalise domestic passenger trades in the way proposed in 19 above.
Senior Transport Officials Meeting (STOM) through the Maritime Transport Working Group (MTWG)
Dec 2015
54 ‘Coastwise operations’ means shipping operations along a single contiguous coastline: that is, the provision of
shipping services on routes where land transport could, at least in principle, provide an alternative to shipping services. These are distinguished from inter-island operations, where geography prohibits the use of land transport.

Promoting Efficient and Competitive Intra-ASEAN Shipping Services
REPSF Project 04/001: Final Main Report 82
No MEASURES IMPLEMENTING BODY
TARGET DATE
IV. Harmonisation
24 Develop and apply common rules on acceptable practices in the provision of fiscal support for shipping operations
Dec 2007
25 Harmonise ship registration practices Dec 2009
26 Allow free movement of ASEAN vessels between the registries of ASEAN countries
Dec 2015
27 Develop and implement guidelines for structure of port tariffs to be applied in ASEAN transport network ports.
Senior Transport Officials Meeting (STOM) through the Maritime Transport Working Group (MTWG)
Dec 2008
28 Complete the harmonization of customs and quarantine procedures
ASEAN Directors General of Customs
Dec 2010
V. Human resources and capacity development
29 Investigate skill enhancement requirements for ASEAN maritime operators and develop detailed training and development strategy
Dec 2006
30 Define training delivery mechanisms and implement training strategy
Dec 2008
31 Establish centres of logistics excellence at selected tertiary institutions within ASEAN.
Dec 2007
32 Develop strategy for enhanced shipboard placements including
Dec 2006
33
Establish regional centres of maritime excellence to provide advanced training in high technology aspects of maritime operations and specialized courses in areas such as port and shipboard security
Dec 2009
34 Implement single labour market for seafarers
Senior Transport Officials Meeting (STOM) through the Maritime Transport Working Group (MTWG)
Dec 2013

Promoting Efficient and Competitive Intra-ASEAN Shipping Services
REPSF Project 04/001: Final Main Report 83
REFERENCES
REPORTS, BOOKS AND MONOGRAPHS
AADCP Regional Economic Policy Support Facility, Preparing ASEAN For Open Sky, report prepared by P Forsyth, J King, C L Rodolfo and K Trace, Monash International Pty Ltd, AusAID, February 2004.
AADCP Regional Economic Policy Support Facility, The Pattern of intra-ASEAN trade in the Priority Goods Sectors. REPSF 03/006e, Final Main Report. Prepared by Austria, Myrna S, AusAID, Augsut, 2004.
ALMEC Corporation and Japan Marine Science Inc., STRAMINDO: Study on the Development of Domestic Sea Transportation and Maritime Industry in the Republic of Indonesia, Vols. 1-2, Japan International Cooperation Agency, March 2004.
ALMEC Corporation ASEAN Maritime Transport Development Study, Final Report, Prepared for ASEAN, November 2002.
Air Transportation Office, Philippines, and Japan International Cooperation Agency, Data Book: Air Transportation in the Philippines, Philippines, August 2003
ASEAN ASEAN Annual Report 2002-2003, ASEAN , 2003.
ASEAN ASEAN Statistical Yearbook 2003, ASEAN Secretariat, Jakarta, 2003
ASEAN Transport Cooperation Framework Plan National and Regional Workshops on the Role of Transport and Communications in the ASEAN Region in the 21st Century, ASEAN, 1999.
ASEAN Revised Handbook on Selected ASEAN Political Documents, ASEAN Secretariat, Jakarta, 2003
Asian Task Force, Institute of Highway Economics, Japan. Logistics Integration in the Asia-Pacific Region, Prepared for OECD RTR Outreach Activity-Asian Logistics Project. IHE, Tokyo, 2000
Asian Task Force, Institute of Highway Economics, Japan. Logistics Developments Supported by ICT & ITS in the Asia-Pacific Region, Prepared for OECD RTR Outreach Activity-Asian Logistics Project. IHE, Tokyo, 2003.
Australian Department of Foreign Affairs and the Centre for International Economics, APEC Economies: Breaking Down the Barriers, Prepared for APEC for the APEC Economic Ministerial and Leaders’ Meeting, 2001.
Davies M, Pedersen J T, Arendt F, and Contos D, The Identification of Market and Policy Requirements to Support the Development of Quality Shipping, prepared for the Added Value Network Concerning European Shipping, April 2000
Department of Transportation and Communication, National Transportation System, Department of Transportation and Communication, Indonesia, 2003.
Economic Planning Unit, Eighth Malaysia Plan 2001-2005, Prime Minister’s Department, Malaysia, 23 April 2001

Promoting Efficient and Competitive Intra-ASEAN Shipping Services
REPSF Project 04/001: Final Main Report 84
Halcrow Fox, Philippine Transport Strategy Study, Vols. 2-3, Final Report, Government of The Philippines and Asian Development Bank, 1997
International Maritime Organization, Report of the International Maritime Organization to the Commission on Sustainable Development in Connection with the World Summit on Sustainable Development, Background Paper No. 9, Prepared for the Commission on Sustainable Development, Department of Economic and Social Affairs, 2002.
International Maritime Organization, ‘Updated Project Information Document’, East Asia and the Pacific – 4E –Marine Electronic Highway, Report No. AB93, World Bank, London, 4 March 2004.
Meyrick and Associates Facilitation of International Shipping Project: Executive Summary, Prepared for APEC – Transport Working Group, September 2000.
Meyrick and Associates & PricewaterhouseCoopers, Non-Tariff Measures in the Trade of Transport Services: Final Report, Prepared for APEC – Transport Working Group, December 2003.
Ministry of International Trade and Industry, Annual Report 2004, Ministry of International Trade and Industry, Malaysia, 2004
Ocean Shipping Consultants, World Container Port Outlook to 2015, Ocean Shipping Consultants, London, 2003.
OECD ,Transport Logistics: Shared Solutions to Common Challenges, Trilateral Logistics Project, OECD, 2002.
Office of the Maritime Promotion Commission, Ministry of Transport and Communication, Master Plan for Maritime Development. MoTC: Bangkok, 1999.
Pacific Consultants International, Tokyo, The Master Plan Study on the Strategic Policy of the Air Transport Sector in the Republic of Indonesia, Vols. 2-3, Draft Final Report, Japan International Cooperation Agency and the Ministry of Communications, Directorate General of Air Communications Indonesia, June 2004.
Parikesit D, Karim R M, Naruputi S, Estimating Future Needs of Transportation Infrastructures and Services in the Southeast Asian Area Project Final Report, Project No. UGM 0105, AUN/SEED-Net Project and JICA, March 2003.
Raven J, ‘Trade and Transport Facilitation: An Audit Methodology’, Global Facilitation Partnership for Transport and Trade, World Bank, 2004.
SMEC, Port of Brisbane Port Corporation and International Infrastructure Management Pty Ltd, Best Practice Model Report, Prepared for APEC as part of the Efficiency in the Faciliation of International Seaborne Trade Project, August 2002.
Sydney Ports Corporation, Sydney Ports Trade Report, Sydney Ports Corporation, 1 July 2004 – 31 July 2004.
United Nations ESCAP, A Pilot Study on the Alleviation of Poverty in Remote Island Communities in Indonesia – Inter-island Shipping: Issues and Strategies, UN, Bangkok, 1999
United Nations ESCAP, The Economic Regulation of Transport Infrastructure Facilities and Services: Principles and Issues, United Nations, New York, 2001.

Promoting Efficient and Competitive Intra-ASEAN Shipping Services
REPSF Project 04/001: Final Main Report 85
United Nations ESCAP, Regional Shipping and Port Development Strategies: Under a Changing Maritime Environment, ESCAP/UNDP Maritime Policy Planning Model, United Nations, New York, 2001.
United Nations ESCAP, Statistical Abstract of Transport in Asia and the Pacific, Preparatory Draft, United Nations, New York, 2002.
United Nations ESCAP and Korea Maritime Institute, Comparative Analysis of Port Tariffs in the ESCAP Region, United Nations, New York, 2002.
United Nations ESCAP, Commercial Development of Regional Ports as Logistics Centres, UN, New York, 2002.
United Nations ESCAP, Review of Developments in Transport in the ESCAP Region, United Nations, New York, 2003.
United Nations ESCAP, Improvement of Transport and Logistics Facilities to Expand Port Hinterlands: Policy Guidelines, United Nations, New York, 2003.
United Nations ESCAP, Commercial Development of Regional Ports as Logistics Centres, United Nations, New York, 2003.
PERIODICALS AND SERIES
ASEAN Public Information Series Recent Developments in Asian Economic Integration, ASEAN, Jakarta, September 1999.
ASEAN Public Information Series Promoting Trade Facilitation Through Mutual Recognition Arrangements, ASEAN, Jakarta, 2001.
ASEAN Public Information Series Towards an ASEAN Community, ASEAN, Jakarta, 2003. ASEAN Public Information Series Building Competitiveness Through Science and Technology, ASEAN, Jakarta, 2003. ASEAN Public Information Series Towards a Single Economic Space ASEAN, Jakarta, 2003. Bora B and Neufeld I N ‘Tariffs and the East-Asian Financial Crisis’, Policy Issues in International Trade and Commodities, Study Series No. 13, United Nations Conference on Trade and Development, United Nations, New York, 2001. Bora B, Kuwahara A, Laird S, ‘Quantification of Non-Tariff Measures’, Policy Issues in International Trade and Commodities, Study Series No. 18, United Nations Conference on Trade and Development, United Nations, New York, 2002. Burgess, A, Port Strategy, April 2004. Cernat L ‘Assessing South-South Regional Integration: Same Issues, Many Metrics’, Policy Issues in International Trade and Commodities, Study Series No. 21, United Nations Conference on Trade and Development, United Nations, New York, 2003.
PUBLISHED PROCEEDINGS
‘Concept Note’, Proceedings of the UNESCAP/AITD Conference on Transport and the Millenium Development Goals (MDGs), Asia-Pacific Network for Transport and Logistics Education and Research (ANTLER), New Delhi, 28-30 October 2004.
‘Estimating Future Needs of Transportation Infrastructures and Services in the Southeast Asian Region’, Proceedings of the Researcher’s Meeting, Gadjah Mada University, Grand Melia, Jakarta, 28 August 2002.

Promoting Efficient and Competitive Intra-ASEAN Shipping Services
REPSF Project 04/001: Final Main Report 86
Fuchsluger, J ‘An analysis of maritime transport and its costs for the Caribbean’, Proceedings of the ECLAC Experts’ Meeting on Maritime Transport in the Caribbean, UN Economic Commission for Latin America & the Caribbean, Port of Spain, Trinidad and Tobago, 14-15 September 2000.
Nikomborirak, D ‘Shipping Cartels: ‘What to Do and What Not to Do’, Proceedings of the28th PAFTAD Conference, Pacific Trade and Development, Makati City, Philippines, 16-18 September 2002.
O’Neill, W A Proceedings of the IPS-IMO InternationalConference on the Malacca and Singapore Straits, Singapore, 14-15 October 1999.
Tadashi, S ‘Cooperation With Regional Maritime Authorities…Is there room for more players?’, Proceedings of the Intertanko Asian Panel Meeting, Singapore, 15 October 2002.
United Nations ESCAP Report of the Forum on Regional Cooperation for Maritime Manpower Planning, Training and Utilization, UN, Bangkok, Thailand, 13-15 December 1999.
United Nations ESCAP Report on the Subregional Seminar and Country-Level Workshops on Freight Forwarding, Multimodal Transport and Logistics, UN, New York, 2001.
UNPUBLISHED PROCEEDINGS (IN CHRONOLOGICAL ORDER)
‘Connecting APEC: Pathways to Prosperity’, Proceedings of the 3rd APEC Transportation Ministerial Meeting, Lima, Peru, 6-9 May 2002.
‘Joint Declaration on Cooperation to Combat Terrorism’, Proceedings of the 14th ASEAN-EU Ministerial Meeting, 27 January 2003.
ASEAN Secretariat ‘ASEAN Efforts to Combat Terrorism’ (Submitted by APEC Secretariat), Proceedings of the APEC Counter Terrorism Task Force II, Phuket, Thailand, 20 August 2003
‘National Strategies’, submitted by Brunei, Indonesia, Malaysia, Philippines and Singapore, Proceedings of the APEC Counter Terrorism Task Force II, Phuket, Thailand, 20 August 2003.
‘Agreed Minutes’ Proceedings of the 9th Meeting of the BIMP-EAGA Working Group on Sea Linkages, Transportation, and Shipping Services, Bandar Seri Begawan, Brunei Darussalam, 17-18 December 2003.
‘Joint Communiqué’, Proceedings of the Fourth ASEAN Ministerial Meeting on Transnational Crime (AMMTG), 8 January 2004
‘Co-Chairs Statement’, Proceedings of the Bali Regional Ministerial Meeting on Counter-Terrorism, ASEAN, Bali, 5 February 2004.
‘ASEAN Transport Action Plan 2005-2010’, Proceedings of the First STOM Expert Task Group Meeting, 24-26 February 2004.
Proceedings of the Counter Terrorism Task Force Meeting 1, South East Asia Regional Centre for Counter-Terrorism (SEARCCT), Santiago, Chile, 1 March 2004.
‘Securing the Smart Supply Chain’, Bangkok/Laem Chabang Efficient and Secure Trade (BEST) Project, Proceedings of the 2nd Conference on Secure Trade in APEC Region (STAR), 5-6 March 2004

Promoting Efficient and Competitive Intra-ASEAN Shipping Services
REPSF Project 04/001: Final Main Report 87
‘Implementation of Security Initiatives and ISPS Code in Port of Singapore’, Proceedings of the 2nd Conference on Secure Trade in APEC Region (STAR), 5-6 March 2004
Jackson G ‘STAR – Strengthening Public-Private Collaboration on Building Capacity for Secure Trade’, Proceedings of the 2nd Conference on Secure Trade in APEC Region (STAR), 5-6 March 2004
‘APEC Private Sector Supply Chain Security Guidelines’, Proceedings of the 2nd Conference on Secure Trade in APEC Region (STAR), 5-6 March 2004 ‘Special Task Force on the International Ship and Port Feasibility Security Code (ISPS Code)’, Proceedings of the 23rd APEC Transportation Working Group Meeting, Beijing, China, 19-23 April 2004.
‘Maritime and Land Security Experts Subgroup Conference on Secure Trade in the APEC Region (STAR)’ Proceedings of the 23rd APEC Transportation Working Group Meeting, Beijing, China, April 19-23 2004
‘Progress Report on the APEC Accreditation of Seafarer Manning Agencies’ Proceedings of the 23rd APEC Transportation Working Group Meeting, Beijing, China April 19-23 2004
‘Highlights of the 17th ASEAN Senior Transport Officials Meeting (STOM), Proceedings of the 17th ASEAN STOM, Siem Reap, Cambodia, 22-24 June 2004.
‘Agreed minutes’, Proceedings of the First Transport and Infrastructure Working Group Cluster Meeting of the Brunei Darussalam Indonesia Malaysia and the Philippines – East ASEAN Growth Area, Jerudong, Brunei Darussalam, 28-29 June 2004.
Cooperative Aviation Security Programme, Asia Pacific ‘Draft Conclusions of the Meeting’Proceedings of the 1st Steering Committee Meeting, Bangkok, Thailand, 30-31 August 2004.
DIRECTORIES
ASEAN Shipping Directory 2003/2004, Federation of ASEAN Shipowners’ Associations, 2003
Profile of Philippine Ports, 3rd edn, Philippine Ports Authprity, Manila, 1997
Baird, N (ed) Asia Pacific Shipping Directory 2002, Baird Publications Ltd., Melbourne, 2002.
INTERNET SOURCES
Ali M, and Chen J ‘Maritime Security Cooperation in the Malacca Straits: Prospects and Limits’, IDSS Commentaries, Institute of Defence and Strategic Studies, 1 July 2004, http://www.idss.edu.sg
Asian Development Bank, ADB Establishes Regional Fund to Strengthen Port Security and to Combat Money Laundering and Financing of Terrorism in Developing Asia, Press Release, Asian Development Bank, 5 July 2004, http://www.adb.org/Documents/News/2004/nr2004073.asp
Asian Development Bank Asian Development Outlook 2004: Indonesia, Asian Development Bank, 2003. http://www.adb.org
Asian Development Bank Asian Development Outlook 2004: Philippines, Asian Development Bank, 2003. http://www.adb.org

Promoting Efficient and Competitive Intra-ASEAN Shipping Services
REPSF Project 04/001: Final Main Report 88
Asian Development Bank Asian Development Outlook 2004: Malaysia, Asian Development Bank, 2003. http://www.adb.org
Asian Development Bank Asian Development Outlook 2004: Singapore, Asian Development Bank, 2003. http://www.adb.org
Asian Development Bank, Key Indicators of Developing Asian and Pacific Countries, Asian Development Bank, 2003. www.adb.org/Documents/Books/Key_Indicators/2003/default.asp
APEC 2002 Leaders’ Declaration: APEC Leaders’ Statement on Fighting Terrorism and Promoting Growth, Los Cabos, Mexico, 26 October 2002, APEC, http://www.apecsec.org.sg/apec/leaders__declarations/2002/statement_on_fighting.html
APEC 2003 Leaders’ Declaration: Bangkok Declaration on Partnership for the Future, Bangkok, Thailand, 21 October 2003, APEC, http://www.apecsec.org.sg/apec/leaders__declarations/2003.html
ASEAN, ARF Statement on Cooperation Against Piracy and Other Threats to Maritime Security, ASEAN, 17 June 2003, http://www.aseansec.org/14837.htm
ASEAN ARF Statement on Cooperative Counter-Terrorist Action on Boarder Security, ASEAN, http://www.aseansec.org/14835.htm ASEAN ASEAN Free Trade Area: An Update, ASEAN, November 1999, viewed 9 June 2004. http://www.aseansec.org/10342.htm
ASEAN ASEAN Investmeant Area: An Update, ASEAN, 2003, viewed 9 June 2004 http://www.aseansec.org/10341.htm
ASEAN Common ASEAN Position on Reforming the International Financial Architecture, ASEAN 2003, viewed 9 June 2004, http://www.aseansec.org/10339.htm
ASEAN Hanoi Plan of Action, ASEAN 2003, viewed 23 June 2004. http://www.aseansec.org/8754.htm
ASEAN Recent Developments in ASEAN Economic Integration, ASEAN, September 1999, viewed 9 June 2004. http://www.aseansec.org/7661.htm
ASEAN Work Programme to Implement the ASEAN Plan of Action to Combat Transnational Crime, Kuala Lumpar, 17 May 2002, ASEAN, viewed 30 August 2004, http://www.aseansec.org/5953.htm
ASEAN ASEAN Framework Agreement for the Integration of Priority Sectors, Vientiane, 29th November 2004 http://www.aseansec.org/16656.htm
Department of Trade and Industry, Philippines, viewed 9 June 2004, http://www.dti.gov.ph
Gallacher, Scott. ASEAN - Critical steps towards deeper integration and closer linkages with Australia and New Zealand. Viewed 29 Jan 2004. http://www.minterellison.com
Malaysia External Trade Development Corporation, The National Trade Promotion Agency of Malaysia, viewed 9 June 2004, http://www.matrade.gov.my
Mindanao Economic Development Council, BIMP-EAGA Working Groups, Mindanao Economic Development Council, Philippines, viewed 18 June 2004, http://www.medco.gov.ph/medcoweb/bimpwg.asp?AreArealID

Promoting Efficient and Competitive Intra-ASEAN Shipping Services
REPSF Project 04/001: Final Main Report 89
Mindanao Economic Development Council, Major BIMP-EAGA Accomplishments, Mindanao Economic Development Council, Philippines, viewed 18 June 2004, http://www.medco.gov.ph/medcoweb/bimpmajor.asp
National Agency For Export Development, Ministry of Industry and Trade, Indonesia, viewed 9 June 2004, http://www.nafed.go.id
Scwarz A and Villinger R, ‘Integrating Southeast Asia’s economies’, The McKinsey Quarterly:the Online Journal of McKinsey and Co, no. 1, 2004, viewed 11 February 2004, http://www.mckinseyquarterly.com
Sekimizu K, Sainlos J C and Paw J N The Marine Electronic Highway in the Straits of Malacca and Singapore- An Innovative Project for the Management of Highly Congested and Confined Waters, International Maritime Organisation, http://www.imo.org/includes/blastDataOnly.asp
Statistics Singapore, Singapore Department of Statistics, viewed 9 June 2004, http://www.singstat.gov.sg
The Digital Ship Digital Ship plus, Iss. 5, 7 November 2003, http://www.thedigitalship.com/plus
United Nations Statistics Division, United Nations, viewed 9 June 2004 http://unstats.un.org/unsd/default.htm
United Nations Document E/CN.17/1996/20/Add.4 of 29 February 1996, ‘Maritime transport in small island developing States’, Progress in the Implementation of the Programme of Action for the Sustainable Development of Small Island Developing States, Commission on Sustainable Development, Fourth Session, 18 April-3 May 1996, viewed 11 May 2001, http://www.unep.ch/islands/d96-20a4.htm
US Department of Environment World Oil Transit Chokepoints, US Department of Environment, http://www.eia.doe.gov/emeu/security/choke.html
US Trade and Development Agency, USTDA Announces Support For APEC ISPS Code Training, press release, USTDA, 29 July 2004, http://www.tda.gov/trade/press/press.html
MEDIA RELEASES (IN CHRONOLOGICAL ORDER)
Signing of a Memorandum of Understanding, joint press statement by the Brunei Economic Development Board and ACI Corporation Ltd (ACI), 10 July 2003
Brunei Economic Development Board and Alcoa Sign MOU to Study Feasibility of a Brunei Smelter, joint press statement by the Brunei Economic Development Board and Alcoa Primary Development Group, September 25 2003.
ADB Establishes Regional Fund to Strengthen Port Security and to Combat Money Laundering and Financing of Terrorism in Developing Asia, Asian Development Bank, 5 July 2004
DATABASES
Containerisation International on-line database (www.ci-online.co.uk)
Nationmaster on-line data base (www.nationmaster.com)

Promoting Efficient and Competitive Intra-ASEAN Shipping Services
REPSF Project 04/001: Final Main Report 90
World Bank Economic Statistics Database. www.publications.worldbank.org
United Nations Trade Statistics Database (COMTRADE) www.unstats.un.org/unsd/comtrade
Lloyds/Fairplay Lloyds Register of Ships (CD).
UNPUBLISHED MATERIAL
ALMEC/SAP 2004. Subregional Transport Cooperation Initiative: Inception Report. TA4204-INO., Asian Development Bank AND ministry OF Communications, Indonesia, August 2004.
Bdp1 Consulting Ltd. The Cost Of Maritime Security, working paper, New York, 2004.
International Civil Aviation Organisation, Cooperative Development of Operational Safety and Continuing Airworthiness Programme in the Southeast Asia Area, Project Document, in possession of the author, 2000.
Lidasan, Hussein , The Study of Cross-Border Procedures in View of Supporting the Transport Sector Cooperation in the BIMP-EAGA and IMT-GT Subregions, Report prepared for ADB RETA 6013, 2003.
Parakesit D, Karim M R, Narupiti S, Hushari B The Development of an Initial Mobility Model for Intra-ASEAN Travel, in the possession of the author.
Parakesit D, Karim M R, Narupiti S, Hushari B Planning for Better Mobility in Southeast Asian Region: A case study of ASEAN Highway and Singapore-Kunming Rail Link, in the possession of the author.

Promoting Efficient and Competitive Intra-ASEAN Shipping Services
REPSF Project 04/001: Final Main Report 91
APPENDIXES
APPENDIX 1: PERSONS AND ORGANISATIONS CONSULTED Singapore: Kion Hong Seah, Executive Director/General Manager, Advance Container Lines (Pte) Ltd Low Meng Sia, General Manager, Regional Sales/Marketing Support, Regional Container Lines Singapore Louis Yeo, Vice President Trade, Regional Container Lines Singapore Mr. Lie Sek Guan, Manager, Statistics and Market Research, PSA Corporation Ltd Winarto Jauhari, Manager, Business Development & Import Division, Accord Shipping Pte Ltd Jardine Shipping Agencies Manjit Singh Randhawa, Assistant Director, Port Development, Marine and Port Authority of Singapore (MPA) Yap Wei Yim, Senior Planning Officer, Policy Division, MPA Daniel Tan, Executive Director, Singapore Shipping Association, and Secretary General, Federation of ASEAN Shipowners’ Associations Lim Kee Hee, Samudera Shipping Line Goh Hung Song, Managing Director, Singapore Agency, APL Co. Pte Ltd. Federation of ASEAN Shipowners’ Associations (FASA) Singapore Shipping Association (SSA) John Yu, Chairman, Asian Shippers Council (ASC) and Singapore National Shippers Council (SNSC)
Malaysia: Maritime Division, Ministry of Transport (MOT) International Unit, MOT Hub Line Coslink (M) Sdn Bhd Selatan Agency Co Sdn Bhd (agents for Advance Container Lines and PIL) Jardine Shipping Services Malaysian Shipowners’ Association (MASA) Malaysian International Shipping Corporation Federation of Malaysian Manufacturers (FMM) Malaysian Shippers Association Port Klang – Southport Ahmat Narawi, Senior Manager, Cargo Handling Services Division, Bintulu Port Sdn. Bhd. Hans D Troelsen, Director, Special Project Division, Starship Agencies Sdn. Bhd. Hamdan Bin Abdul Hamid, Assistant General Manager (Operation), Bintulu Port Authority Chieng Kuok Lok, Shipping Manager, Harbour Agencies (Sarawak) Sdn. Bhd. Nobel Pang, Executive Director, Portrade dotcom Bhd. Morsidi B. Tundok, Senior Manager, Marine Services Division, Bintulu Port Sdn. Bhd. Bakri anak Jurong, Senior Traffic Superintendent, Kuching Port Authority Madame Liu Mui Fong, General Manager, Kuching Port Authority Johnny Tan, Business Development Executive, Kuching Port Authority
Indonesia: Sumadi Kusuma, President/CEO, PT Global Putra International Group Mikradj (Miki), VP International, PT Global Putra International Group Lakhbir Singh, Country Manager, PT Jardine Tangguh Transport Services Burkhard Schliephake, Senior Representative, SE Asia, Rickmers Line, Indonesia Jean-Charles Tassoni, President Director, PT Container Maritime Activities (agents for CMA CGM and ANL Indonesia); Chairman, Overseas Shipowners' Representatives Association (OSRA) Adolf Tambunan, Deputy Director, International Shipping, Directorate of Sea Traffic and Transport, Directorate General of Sea Communications (DGSC) Drs Loren Situmorang, Sub-Directorate of Special Shipping, DGSC Drs Jimmy Nikiluyu, Directorate of Shipping, DGSC Wijayanto, Sub-Directorate of Port Engineering, DGSC Djoko Riyanto, Directorate of Ports and Dredging, DGSC Tjuk Supardiman, Director-General, DGSC Mochamad Syawal, Secretary General, Indonesian Shipowners’ Association (INSA) Maman Permana, Secretary, INSA; Dry Bulk Senior Manager, PT Arpeni Pratama Ocean Line Suardi Zen, Chairman, Indonesian National Shippers’ Council (Depalindo) HM Nur Nungkat, Vice-Chairman, Depalindo Rachim Kartabrata, Secretary General, Depalindo Ir H Irwandy MA Rajabasa, Chairman, Transport & Distribution Services, Depalindo Toto Dirgantoro, Deputy Chairman, Ports & Customs Services, Depalindo Soepadi SW, Marketing & Commercial Development Director, Indonesian Port Corporation II (Pelindo II) Cipto Pramono, Senior Manager Marketing, Pelindo II Suparjo, Assistant Senior Manager, Supporting Services, Pelindo II Yos Nugroho, PT Jakarta International Container Terminal
Thailand Maritime Promotion Bureau, Marine Department Ministry of Transport – Water Transport Economics Office of Transport Policy & Planning Director Transport & Tourism, UNESCAP Bangkok Shipowners and Agents Association (BSSA) Thai Shipowners’ Association (TSA) Thai National Shippers’ Council (TNSC) P & O Nedlloyd Evergreen Star (agents for Evergreen, Hatsu Marine, Lloyd Trestino) Unioil Bulk Transport Co Chemstar Shipping Co Ngow Hock Agency Co (agents for RCL containers and dry bulk carriers) Capital Rice Co Rice Exporters’ Association Riceland Foods

Promoting Efficient and Competitive Intra-ASEAN Shipping Services
REPSF Project 04/001: Final Main Report 92
Port Authority of Thailand (PAT) Private Terminals Club (PTC) Sriracha Harbour Public Co Bangkok Modern Terminal Ltd Thai International Freight Forwarders Association East-West Air Services Co Ltd Transcontainer Logistics (Thailand) Co Ltd Johnson Stokes & Master (Thailand) Ltd
Vietnam Vietnam Maritime Administration (VINAMARINE) Ministry of Transport Vietnam National Shipping Lines (VINALINES) Vietnam Freight Forwarders Association (VIFFAS) Vietnam Chamber of Commerce & Industry (VCCI) Vietfracht Vinatrans Vietnam Seaports Association (VPA) Vietnam Ships Agents’ and Brokers’ Association (VISABA) Vietnam Overseas Shipping Agents (VOSA) Gemartrans (JV between Vinalines and CMA-CGM) Jardine Shipping Services John Swire Group – Swire Pacific Cold Storage
Philippines Department of Transportation and Communications (DOTC) Water Transport Planning Division, DOTC Maritime and Special Concerns, DOTC Maritime Industry Authority (Marina), DOTC ASEAN Federation of Ports Authorities Philippine Ports Authority ASEAN Federation of Forwarders Associations Eagle Express Lines Association of International Shipping Lines (AISL) K Line (Philippines ), Inc Cosco Philippines, Inc P&O Ports Jardine Davis Transport Services, Inc Filipino Shipowners Association Aboitiz/WG&A Philippine Liner Shipping Association Asian Terminals Inc International Container Terminal Services, Inc Philippines Seafarers Promotion Council, Inc (PSPC) Wallem Philippines Shipping, Inc Philippines Shippers’ Bureau
Cambodia Chan Dara, Director, Merchant Marine Department, General Department of Transport, Ministry of Public Works and Transport (MPWT) Mak Sideth, Chief of General Affairs, Merchant Marine Department, MPWT Ma Sun Hout, Deputy Director General, Sihanoukville Autonomous Port Pheng Hok, Harbourmaster, Sihanoukville Autonomous Port Christine Soutif, Managing Director, SDV Cambodge Ltd Olivier Guillot, Business Development Manager, SDV Cambodge Ltd Deepak Mahtani, Owner's Representative, Maersk (Cambodia) Ltd So Sam Ok, Manager, MCC Transport Cambodia Ltd Hok Thong, Sales Manager, MCC Transport Cambodia Ltd
Chum Iek, Secretary of State, MPWT Loeung Simona, Chief, Planning & Legal Affairs Office, Merchant Marine Department, MPWT Chieap Thol, Manager, Operations Centre, Phnom Penh Autonomous Port (PPAP) Koan Chuon, Chief, Technical Office, PPAP Hang Hary, Director, Business & Shipping, Forwarding Services, Kampuchea Shipping Agency and Brokers (KAMSAB) Chhay Traluon, Manager, Shipping and Operation Forwarding, KAMSAB Chuong Lay Heang, Assistant Manager, Accounting Department, KAMSAB B Khieng P, Sales Representative, Sovereign/Hansen Base Logistics Holdings Co Ltd Slat Sanan, Operations Manager, Sovereign Sok Hou Sambath, Advisor to the President, Mong Reththy Group Co Ltd Sen Pasary, Vice Director, Inland Water Transport Department, MPWT Him Saith, Deputy Director, IWTD, MPWT
Lao DPR Khampoun Inpenglasabout, Director, International Relations Division, Customs Department, Ministry of Finance Vichit Sadettan, Sales Manager/UPS Laos Supervisor, Lao PDR Prachith Sayavong, Managing Director, Societe Mixte De Transport Co Ltd Director General, Laos Customs, Vientiane, Lao PDR
Myanmar Colonel Khin Maung Linn, Director General, Customs Department, Ministry of Finance & Revenue (MFR) Kyaw Lwin Oo, Secretary General, Myanmar International Freight Forwarders’ Association Capt. Thet Htay, Deputy Director (Nautical), Department of Marine Administration, Ministry of Transport (MOT) Capt. Win Zaw, Deputy Marine Superintendent, Myanma Five Star Line Y Kyi Soe, General Manager (Technical Planning), Myanma Shipyards H.E. U Pe Than, Deputy Minister, Ministry of Transport Maung Maung Gyi, Deputy Engineering Superintendent, Port of Yangon U Ko Ko Oo, Director, Administration Division, Customs Department, MFR Thiha Thura Thein Tun Tin, Deputy Director General, MFR U San Khaing Hla, Managing Director, Eagle Shipping Dr Khin Maung Kyaing, Managing Director, Yangon Shipping Winn Pe, Director General, Department of Transport
Brunei Darussalam Tri Star Shipping and Trading Seri Bagawan Muara Container Terminal Ports Department, Muara Port, Ministry of Communications Marine Department, Muara Port, MOC Bee Seng Shipping Shipping Association of Brunei

Promoting Efficient and Competitive Intra-ASEAN Shipping Services
REPSF Project 04/001: Final Main Report 93
APPENDIX 2: DETAILS OF INTRA-ASEAN CARGO FLOWS
1. Agro-based industries Growth
Figure 12: Development of Intra-ASEAN Trade in Agro-Based Commodities
Source: Study estimates, based on Comtrade data
Figure 12 shows that, for most of the analysis period, ASEAN exports and imports of Agro-based products have moved more or less in parallel. This parallelism has been disturbed in recent times, largely because of greatly increased volatility in the export series, which dipped sharply over the 2000-2002 period, then made a very strong recovery in 2003. Given the great importance of poultry and poultry products to this group, it is likely that the late instability in export value is very largely connected with the avian flu crisis.
Intra-ASEAN trade accounts for a significant proportion of total ASEAN trade in agro-based commodities. Over the last decade, the proportion of total ASEAN imports that is accounted for by intra-ASEAN trade has fluctuated between 29% and 35%. Despite this, intra-ASEAN trade has grown a little more rapidly than total agro-based trade volumes, with a compound average growth rate of around 3.6% per annum over the last decade. However, given the relatively large share of these agro-based product imports that are already sourced from other ASEAN countries, the potential for this sector to grow more rapidly than total imports is perhaps more limited than for some other commodities.
y = 11923e0.0337x
y = 3673.3e0.0362x
-
5,000
10,000
15,000
20,000
25,000
30,000
35,000
1992 1993 1994 1995 1996 1997 1998 1999 2000 2001 2002 2003
Year
$US
mill
ion
ASEAN Imports ASEAN Exports Intra-ASEANExpon. (ASEAN Imports) Expon. (Intra-ASEAN)

Promoting Efficient and Competitive Intra-ASEAN Shipping Services
REPSF Project 04/001: Final Main Report 94
Trade Structure
Table 16 shows the geographical structure of the intra-ASEAN agro-based trades, based on an analysis of COMTRADE data.
Malaysia is the single most important supplier of intra-regional product in this category. However, much of Malaysia’s exports will have no impact on shipping demand. Approximately 20% of total intra-regional agro-based cargo movements (over one-half of total Malaysian exports) is made by the two-way trade between Singapore and Malaysia. Of this total, a large part will travel by land transport between peninsular Malaysia and Singapore. It is probable that a considerable amount of the Malaysia-Brunei trade in these commodities is also land-based, and this may also be true for a part of Malaysia’s exports to Thailand. Malaysia’s sea-borne exports are therefore likely to account for approximately 15% of total intra-regional trade.
By contrast, Indonesia, the other major supplier of agro-based products to other ASEAN countries, is almost entirely dependent on shipping for its participation in the trade. The only exception is likely to be small volumes of cargo travelling overland in Borneo, and very high value cargoes moving by air. We estimate that Indonesia’s sea-borne exports will account for around 25% of the total value of intra-regional agro-based trade in 2002.
Table 16: Geographical Structure of Intra-ASEAN Agro-Based Products Trade
Source: Study estimates, based on analysis of COMTRADE data
Commodities
Agro-based trade covers a wide range of commodities, with vastly different unit values and handling characteristics. These range from live animals on the one hand to processed foodstuffs on the other.
By value, the most significant commodity class is tobacco products, which accounts for over 20% of total intra-regional trade in agro-based products. This is almost matched by trade in edible oils (the most important element of which is palm oil).
The distribution of these commodities by value, however, is not necessarily representative of the distribution by volume – and hence of shipping requirements. The ‘cereals’ group in particular, which accounts for only a little over 1% of the total value of intra-Asian trade in agro-based commodities, includes intra-regional movements of rice and maize. The commodities are comparatively low value – typically in the range $100-$300 per tonne – but move in large quantities.
Exporter Brunei Cambodia Indonesia Lao PDR Malaysia Myanmar Philippines Singapore Thailand Viet Nam Grand TotalBrunei 0.0% 0.0% 0.0% 0.0% 0.0% 0.0% 0.0% 0.0% 0.0% 0.0% 0.0%Cambodia 0.0% 0.0% 0.0% 0.0% 0.1% 0.0% 0.0% 0.0% 0.0% 0.0% 0.1%Indonesia 0.1% 0.7% 0.0% 0.0% 10.5% 0.2% 1.7% 10.8% 2.0% 1.0% 27.0%Lao PDR 0.0% 0.0% 0.0% 0.0% 0.0% 0.0% 0.0% 0.0% 0.0% 0.0% 0.0%Malaysia 1.7% 0.2% 6.8% 0.0% 0.0% 1.5% 2.2% 20.7% 3.6% 2.1% 38.7%Myanmar 0.0% 0.0% 0.6% 0.0% 0.6% 0.0% 0.0% 1.0% 0.0% 0.0% 2.2%Philippines 0.0% 0.0% 0.9% 0.0% 1.6% 0.0% 0.0% 1.1% 0.4% 0.3% 4.4%Singapore 1.3% 2.0% 0.0% 0.6% 8.6% 1.5% 6.8% 0.0% 2.4% 4.2% 27.5%Grand Total 3.2% 2.9% 8.3% 0.6% 21.4% 3.2% 10.7% 33.6% 8.4% 7.6% 100.0%
Key < 0.1% Very little trade0.1%-1% Minor but significant share of intra-regional total1%-10% Significant share of intra-regional trade> 10% Dominant movement in intra-regional trade
Importer

Promoting Efficient and Competitive Intra-ASEAN Shipping Services
REPSF Project 04/001: Final Main Report 95
Table 17: Commodity structure of Intra-ASEAN Agro-Based Products Trade55
Code Commodity $US million
01 Live animals 134.1 02 Meat and edible meat offal 11.1 04 Dairy products, eggs, honey, edible animal product nes 211.8 05 Products of animal origin, nes 5.5 06 Live trees, plants, bulbs, roots, cut flowers etc 19.4 07 Edible vegetables and certain roots and tubers 154.3 08 Edible fruit, nuts, peel of citrus fruit, melons 142.4 09 Coffee, tea, mate and spices 157.7 10 Cereals 48.4 11 Milling products, malt, starches, insulin, wheat gluten 49.9 12 Oil seed, oleagic fruits, grain, seed, fruit, etc, nes 41.8 13 Lac, gums, resins, vegetable saps and extracts nes 11.9 14 Vegetable plaiting materials, vegetable products nes 4.5 15 Animal,vegetable fats and oils, cleavage products, etc 821.3 16 Meat, fish and seafood food preparations nes 57.8 17 Sugars and sugar confectionery 179.8 18 Cocoa and cocoa preparations 293.9 19 Cereal, flour, starch, milk preparations and products 253.2 20 Vegetable, fruit, nut, etc food preparations 74.5 21 Miscellaneous edible preparations 222.4 22 Beverages, spirits and vinegar 248.7 23 Residues, wastes of food industry, animal fodder 98.9 24 Tobacco and manufactured tobacco substitutes 890.7
Source: Study estimates, based on analysis of COMTRADE data
55 In this context, ‘general cargo’ is used to describe the miscellany of cargoes that would, if traveling by sea, be expected to travel in containerized form.

Promoting Efficient and Competitive Intra-ASEAN Shipping Services
REPSF Project 04/001: Final Main Report 96
2. Fisheries Growth
Figure 13: Development of Intra-ASEAN Trade in Fisheries Products
Source: Study estimates, based on Comtrade data
Figure 13 shows that, for most of the analysis period, ASEAN imports of fisheries products have remained more or less constant, while fisheries exports have seen a declining trend since peaking in 1995. Figures for 2003 show a sharp rise in fisheries imports (to $1.9 billion) while the downward trend in exports appears to have continued (exports fell to $4.1 billion). (These figures are not shown in the graph because the COMTRADE database does not include 2002 statistics for Thailand, a major exporter, with the result that there is a break in the series in 2002).
As with agro-based products, intra-ASEAN trade accounts for a significant proportion of total ASEAN trade in fisheries products. Over the last decade, the proportion of total ASEAN imports that is accounted for by intra-ASEAN trade has fluctuated between 28% and 35%. The absolute volume of intra-ASEAN trade in fisheries products has declined slightly over the decade, with an average decline in trade values over the period of around 1.5% per annum over the last decade. Figures for 2003 suggest that this decline is continuing – in that year, intra-ASEAN trade value dipped below $400 million for the first time, falling to $380 million. Given the overall decline in imports and exports, and the slight fall in intra-ASEAN share of total imports in recent times, it appears unlikely that there will be large increases in intra-ASEAN trade in these commodities in the foreseeable future.
Trade Structure
Table 18 shows the geographical structure of the intra-ASEAN fisheries trades, based on an analysis of COMTRADE data.
Indonesia is the single most important supplier of intra-regional product in this category. The principal destinations for Indonesian exports are Singapore, Malaysia
y = 1520.3e0.003x
y = 507.62e-0.0143x
-
1,000
2,000
3,000
4,000
5,000
6,000
1992 1993 1994 1995 1996 1997 1998 1999 2000 2001
Year
$US
mill
ion
ASEAN Imports ASEAN Exports Intra-ASEANExpon. (ASEAN Imports) Expon. (Intra-ASEAN)

Promoting Efficient and Competitive Intra-ASEAN Shipping Services
REPSF Project 04/001: Final Main Report 97
and Thailand. It is to be expected that most of this product will be carried by commercial shipping services, although an unknown but possibly quite large proportion may be delivered direct to the destination country by the fishing vessel itself.
Thailand is the next largest exporter. With Malaysia and Singapore the two largest markets for Thai product, both land transport and direct delivery from fishing vessels are feasible alternatives to the use of commercial shipping for these trades. Similar comments are relevant to the exports of the third largest exporter – Malaysia – approximately 80% of whose exports are directed to its near neighbours, Singapore and Thailand.
By contrast, the exports of Vietnam, the other major supplier of fisheries products to other ASEAN countries, are largely carried by sea, and probably by commercial shipping services.
Table 18: Geographical Structure of Intra-ASEAN Fisheries Products Trade
Source: Study estimates, based on analysis of COMTRADE data
Commodities
Table 19 shows the commodity distribution of the intra-ASEAN trade in fisheries products. The high proportion of live, fresh and chilled fish, as opposed to canned or otherwise processed fish products, suggests that direct deliveries from fishing vessels may play an important part in the delivery of these products.
Table 19: Commodity Structure of Intra-ASEAN Fisheries Products Trade
Code Commodity Value ($US m) 0301 Live fish 28.54 0302 Fish, fresh or chilled, whole 120.11 0303 Fish, frozen, whole 192.33 0304 Fish fillets, fish meat, mince except liver, roe 37.41 0305 Fish,cured, smoked, fish meal for human consumption 21.40 0306 Crustaceans 160.77 0307 Molluscs 39.34
Source: Study estimates, based on analysis of COMTRADE data
Brunei Cambodia Indonesia Lao PDR Malaysia Myanmar Philippines Singapore Thailand Viet Nam TotalBrunei 0.0% 0.0% 0.0% 0.0% 0.0% 0.0% 0.0% 0.0% 0.0% 0.0% 0.1%Cambodia 0.0% 0.0% 0.0% 0.0% 0.0% 0.0% 0.0% 0.2% 0.1% 0.0% 0.3%Indonesia 0.0% 0.0% 0.0% 0.0% 7.2% 0.0% 0.5% 11.4% 7.4% 0.9% 27.4%Lao PDR 0.0% 0.0% 0.0% 0.0% 0.0% 0.0% 0.0% 0.0% 0.0% 0.0% 0.0%Malaysia 0.3% 0.0% 1.0% 0.0% 0.0% 0.0% 0.1% 9.4% 5.1% 1.6% 17.6%Myanmar 0.0% 0.0% 0.2% 0.0% 3.9% 0.0% 0.0% 2.6% 3.1% 0.0% 9.7%Philippines 0.0% 0.0% 0.5% 0.0% 0.1% 0.0% 0.0% 1.0% 0.4% 0.0% 2.1%Singapore 0.6% 0.0% 0.0% 0.0% 8.7% 0.0% 0.4% 0.0% 2.1% 0.3% 12.1%Thailand 0.0% 0.2% 0.6% 0.1% 8.2% 0.1% 0.1% 9.5% 0.0% 0.4% 19.2%Viet Nam 0.0% 0.0% 0.2% 0.0% 1.4% 0.0% 0.0% 4.3% 5.6% 0.0% 11.5%Total 1.0% 0.2% 2.5% 0.1% 29.6% 0.1% 1.2% 38.4% 23.8% 3.2% 100.0%
Key < 0.1% Very little trade0.1%-1% Minor but significant share of intra-regional total1%-10% Significant share of intra-regional trade> 10% Dominant movement in intra-regional trade

Promoting Efficient and Competitive Intra-ASEAN Shipping Services
REPSF Project 04/001: Final Main Report 98
3. Health Care Products Growth
Figure 14: Development of Intra-ASEAN Trade in Health Care Products
Source: Study estimates, based on Comtrade data
Figure 14 shows that both ASEAN imports and ASEAN exports of health products have grown rapidly over the analysis period, with exports recording an average growth rate over the 1992-2001 period of nearly 11%. Imports grew slightly more slowly, but still impressively, at over 7% per year. This is notwithstanding the severe impact of the currency crisis on this sector: imports declined by nearly 20% in 1998, and export growth slowed and finally stalled in the years leading the crisis.
Figures for 2003 show strong recent growth in both imports and exports has continued. The total value of ASEAN exports of health care products in 2003 reached $3.8 billion – over 18% up on 2001 values. Imports grew even more strongly, increasing nearly 25% over the two year period to $4.6 billion. (These figures are not shown in the graph because the COMTRADE database does not include 2002 statistics for Thailand, a major exporter, with the result that there is a break in the series in 2002).
Intra-ASEAN trade accounts for around 20% of total ASEAN imports of health care products. Over the last decade, this proportion fluctuated between 16% and 23%. There is some evidence of an increase in this proportion over the period, but the ratio is quite volatile. However, in absolute value terms, intra-ASEAN trade in health care products nearly trebled over the decade, rising from $286 million in 1992 to $822 in 2001 – an average growth rate of over 10%, and very close to the overall rate of increase of ASEAN exports in this sector. Figures for 2003 suggest that this trend is continuing – between 2001 and 2003, intra-ASEAN trade value rose to over $1 billion for the first time ($1,012 million): an increase of nearly 25% over 2001. With continued strong growth in this sector and intra-ASEAN trade liberalisation, future growth of around 12% per annum seems an achievable target.
Trade Structure
y = 1890.6e0.0742x
y = 321.13e0.1035x
y = 1233.7e0.1077x
-
500
1,000
1,500
2,000
2,500
3,000
3,500
4,000
4,500
1992 1993 1994 1995 1996 1997 1998 1999 2000 2001
Year
$US
mill
ion
ASEAN Imports ASEAN Exports Intra-ASEANExpon. (ASEAN Imports) Expon. (Intra-ASEAN) Expon. (ASEAN Exports)

Promoting Efficient and Competitive Intra-ASEAN Shipping Services
REPSF Project 04/001: Final Main Report 99
Table 20 shows the geographical structure of the intra-ASEAN health care products trades, based on an analysis of COMTRADE data.
Singapore is the single most important supplier of intra-regional product in this category. The principal destinations for Singaporean exports are Malaysia and Thailand, which between them account for roughly two-thirds of Singapore’s exports of these products. It is to be expected that some of this product will be carried by land between Singapore and Malaysia: Thailand imports from Singapore are likely to travel by sea in containerised form.
Thailand is the next largest exporter, with a much more even distribution of destinations within ASEAN. It is likely that the vast majority of Thai exports would be carried by container ships. Similar comments are relevant to the exports of the fourth largest exporter - Indonesia.
The main market for Malaysian exports is Singapore, which takes approximately 50% of Malaysia’s total exports. Land transport will be a real option for much of this cargo.
These four exporters together account for approximately 95% of total exports. Table 20: Geographical Structure of Intra-ASEAN Health Care Products Trade
Source: Study estimates, based on analysis of COMTRADE data
Commodities
Table 21 shows the commodity distribution of the intra-ASEAN trade in health care products.
Some of these commodities are of very high value: it is reasonably safe to assume that, except for relatively short distances where land transport is a realistic option air transport would be the preferred mode of transport for all commodities with a unit value in excess of $20/Kg (codes 2937,3002,3303). However, these products comprise only a small proportion of the cargo transport task. The majority of the commodities in this group would be carried by either land or by sea in containers.
Brunei Cambodia Indonesia Lao PDR Malaysia Myanmar Philippines Singapore Thailand Viet Nam TotalBrunei 0.0% 0.0% 0.0% 0.0% 0.0% 0.0% 0.0% 0.0% 0.0% 0.0% 0.0%Cambodia 0.0% 0.0% 0.0% 0.0% 0.0% 0.0% 0.0% 0.0% 0.0% 0.0% 0.0%Indonesia 0.3% 0.1% 0.0% 0.0% 3.6% 0.2% 1.2% 5.2% 1.6% 0.5% 12.7%Lao PDR 0.0% 0.0% 0.0% 0.0% 0.0% 0.0% 0.0% 0.0% 0.0% 0.0% 0.0%Malaysia 1.3% 0.0% 0.7% 0.0% 0.0% 0.3% 2.0% 6.9% 1.3% 1.5% 14.1%Myanmar 0.0% 0.0% 0.0% 0.0% 0.0% 0.0% 0.0% 0.0% 0.0% 0.0% 0.0%Philippines 0.0% 0.1% 0.7% 0.0% 1.1% 0.1% 0.0% 0.3% 0.6% 0.3% 3.3%Singapore 1.7% 0.2% 0.0% 0.0% 14.4% 0.7% 4.4% 0.0% 9.9% 5.0% 36.3%Thailand 0.1% 3.5% 4.5% 1.3% 5.9% 2.1% 7.3% 4.3% 0.0% 2.6% 31.6%Viet Nam 0.0% 0.0% 0.1% 0.0% 0.4% 0.0% 0.1% 0.3% 1.1% 0.0% 1.9%Total 3.4% 3.9% 6.1% 1.3% 25.4% 3.5% 15.0% 17.1% 14.5% 9.8% 100.0%
Key < 0.1% Very little trade0.1%-1% Minor but significant share of intra-regional total1%-10% Significant share of intra-regional trade> 10% Dominant movement in intra-regional trade

Promoting Efficient and Competitive Intra-ASEAN Shipping Services
REPSF Project 04/001: Final Main Report 100
Table 21: Commodity Structure of Intra-ASEAN Health Care Products Trade
Code Description Value Unit Value Tonnes H2-2936 Provitamins and vitamins, natural or reproduced by synthesis 199.22 $ 10.01 19,895 H2-2937 Hormones, prostaglandins, thromboxanes and leukotrienes 7.27 $ 154.64 47 H2-3001 Glands and other organs for organo-therapeutic uses, dried 0.22 $ 5.07 42 H2-3002 Human blood; animal blood prepared for therapeutic uses 19.60 $ 21.77 529 H2-3004 Medicaments (excluding 30.02, 30.05 or 30.06) 270.80 $ 5.44 35,375 H2-3303 Perfumes and toilet waters. 62.67 $ 18.84 1,746 H2-3304 Beauty or make-up preparations 152.53 $ 5.56 20,114 H2-3305 Preparations for use on the hair 168.95 $ 2.91 55,913 H2-3306 Preparations for oral or dental hygiene 58.09 $ 2.02 28,097 H2-3307 Pre-shave, shaving or after-shave preparations 63.99 $ 2.14 23,139 H2-3401 Soap; organic surface-active products 77.10 $ 0.98 78,632 H2-9018 Medical Instruments and appliances 236.28 n/a/ n/a
Source: Study estimates, based on analysis of COMTRADE data

Promoting Efficient and Competitive Intra-ASEAN Shipping Services
REPSF Project 04/001: Final Main Report 101
4. Rubber-based products Growth
Figure 15: Development of Intra-ASEAN Trade in Rubber-Based Products
Source: Study estimates, based on Comtrade data
Figure 15 shows that ASEAN exports of rubber-based products declined markedly after peaking in 1994: by 2001 the total value of exports stood at $6 billion, only 65% of the peak of $9.6 billion. However, this appears to have been reversed recently: 2003 data shows a total export value roughly equal to the 1994 peak. It is of course not yet possible to tell whether this revival of fortune is indicative of a long-term trend reversal or due to particular events of that year.
ASEAN imports of rubber-based goods on the other hand have followed a similar pattern to exports, but in a less extreme form. On average, they grew moderately between 1992 and 2001, and, despite a marked drop in imports in 1998, averaged a growth rate of nearly 3.5% per annum over the period. This appears to have accelerated recently: 2003 imports exceeded 2001 imports by nearly 15%, bringing the total value of imports in 2003 to $2.6 billion. (These figures are not shown in the graph because the COMTRADE database does not include 2002 statistics for Thailand, a major exporter, with the result that there is a break in the series in 2002).
Intra-ASEAN trade accounts for nearly 40% of total ASEAN imports of rubber-based products. Over the last decade, this proportion fluctuated between 32% and 49%. The trend in this market share parallels to the trends in total ASEAN exports and imports of rubber-based goods: after peaking in 1994, the intra-ASEAN market share gradually declined until 2001. In 2003, however, intra-ASEAN trade surged sharply, climbing back to 49% of total ASEAN imports. In absolute value terms intra-ASEAN trade in rubber-based products reached an all-time high of around $1.25 billion.
It seems likely that future growth in intra-regional trade in these commodities will be closely tied to the overall growth of ASEAN imports. With moderate long-term growth in the sector and intra-ASEAN trade liberalisation encouraging the
y = 782.41e0.0029x
y = 1726.6e0.0358x
-
2,000
4,000
6,000
8,000
10,000
12,000
1992 1993 1994 1995 1996 1997 1998 1999 2000 2001
Year
$US
mill
ion
ASEAN Imports ASEAN Exports Intra-ASEANExpon. (Intra-ASEAN) Expon. (ASEAN Imports)

Promoting Efficient and Competitive Intra-ASEAN Shipping Services
REPSF Project 04/001: Final Main Report 102
development of trade in a range of higher value-added rubber-based products, future growth of around 5% per annum seem an achievable target.
Trade Structure
Table 22 shows the geographical structure of the intra-ASEAN rubber-based products trades, based on an analysis of COMTRADE data.
Thailand is the single most important supplier of intra-regional product in this category, accounting for nearly 60% of the total intra-regional supply. The principal destination for Thai exports is Malaysia, which accounts for nearly two-thirds of Thailand’s intra-regional exports of these products. As much of Thai rubber is produced in Southern Thailand, it is likely that a significant proportion of this product will be carried by land between Thailand and Malaysia. However, some will be carried by sea, with some of it using small conventional vessels on short haul routes between minor ports.
Indonesia is the second largest exporter of rubber-based products. Virtually all Indonesian rubber-based product exports will be carried by sea. Since a significant proportion of Indonesian exports is likely to be crude rubber, it is possible that most of this travels as uncontainerized cargo on conventional vessels.
Singapore’s exports, by contrast, are likely to be principally high value-added products. As around 60% of Singapore’s exports are bound for Malaysia, land transport probably plays a major role in the movement of this product. Exports to more distant locations, and some exports to Malaysia, will be carried by sea, almost certainly in containerised form.
Malaysia is the other significant exporter. Its main market is Singapore, which takes nearly 50% of Malaysia’s total exports. Land transport will be a real option for much of this cargo.
These four exporters together account for approximately 95% of total exports. Table 22: Geographical Structure of Intra-ASEAN Rubber-Based Products Trade
Source: Study estimates, based on analysis of COMTRADE data
Commodities
Table 23 shows the commodity distribution of the intra-ASEAN trade in rubber-based products.
It is clear from the table that the dominant element in this trade is natural rubber (code 4001), which accounts for 50% of the value of rubber-based products trade. In volume terms, this element is even more important: on our estimates, it comprises over 80% of the total volume of cargo moved in this category.
Brunei Cambodia Indonesia Lao PDR Malaysia Myanmar Philippines Singapore Thailand Vietnam TotalBrunie 0.0% 0.0% 0.0% 0.0% 0.0% 0.0% 0.0% 0.0% 0.0% 0.0% 0.0%Cambodia 0.0% 0.0% 0.0% 0.0% 0.2% 0.0% 0.0% 0.1% 0.0% 0.0% 0.3%Indonesia 0.1% 0.1% 0.0% 0.0% 1.8% 0.1% 1.7% 9.2% 1.1% 0.3% 14.3%Lao PDR 0.0% 0.0% 0.0% 0.0% 0.0% 0.0% 0.0% 0.0% 0.0% 0.0% 0.0%Malaysia 0.0% 0.0% 1.0% 0.0% 0.0% 0.0% 0.9% 4.4% 2.2% 0.6% 9.2%Myanmar 0.0% 0.0% 0.0% 0.0% 0.7% 0.0% 0.0% 0.1% 0.0% 0.0% 0.8%Philippines 0.0% 0.0% 0.1% 0.0% 1.3% 0.0% 0.0% 0.7% 0.3% 0.0% 2.5%Singapore 1.2% 0.1% 0.0% 0.0% 8.5% 0.2% 0.8% 0.0% 2.0% 0.5% 13.3%Thailand 0.0% 1.6% 2.6% 0.7% 37.6% 1.5% 2.4% 8.6% 0.0% 2.7% 57.7%Viet Nam 0.0% 0.0% 0.2% 0.0% 0.7% 0.0% 0.0% 0.8% 0.1% 0.0% 1.9%Total 1.3% 1.8% 3.7% 0.8% 50.1% 1.8% 5.8% 23.0% 5.7% 4.1% 98.1%

Promoting Efficient and Competitive Intra-ASEAN Shipping Services
REPSF Project 04/001: Final Main Report 103
Table 23: Commodity Structure of Intra-ASEAN Rubber-Based Products Trade
Source: Study estimates, based on analysis of COMTRADE data
Code Commodity Value ($m) $/Kg Tonnes
H0-4001 Natural rubber and gums, in primary form, plates, etc 638.11 $ 0.72 886,425
H0-4002 Synthetic rubber 61.49 $ 0.95 64,744
H0-4003 Reclaimed rubber in primary forms or in sheets 0.81 $ 0.43 1,886
H0-4004 Rubber waste, parings and scrap (except hard rubber) 0.78 $ 0.19 4,035
H0-4005 Compounded unvulcanised rubber, in primary forms 30.19 $ 1.46 20,663
H0-4006 Unvulcanised rubber as rods, tubes, discs, rings, etc 3.47 $ 1.62 2,147
H0-4007 Vulcanised rubber thread and cord 7.85 $ 1.42 5,519
H0-4008 Rubber plate, sheet, strip, rod etc, except hard 16.82 $ 2.02 8,308
H0-4009 Rubber tube, pipe, hose, except hard rubber 27.40 $ 3.73 7,342
H0-4010 Conveyor and similar belts or belting of rubber 32.40 $ 1.24 26,197
H0-4011 New pneumatic tyres, of rubber 207.52 $ 5.23 39,663
H0-4012 Tyres nes, retreaded, used pneumatic, solid, cushione 12.02 $ 4.59 2,622
H0-4013 Inner tubes of rubber 13.59 $ 12.66 1,073
H0-4014 Hygienic or pharmaceutical articles of rubber 12.08 n/a n/a
H0-4015 Rubber clothing and accessories, except hard rubber 29.19 $ 47.94 609
H0-4016 Articles of vulcanised rubber except hard rubber, nes 143.50 $ 6.47 22,163
H0-4017 Hard rubber (eg ebonite) in all forms, articles, scrap 5.63 $ 2.61 2,157

Promoting Efficient and Competitive Intra-ASEAN Shipping Services
REPSF Project 04/001: Final Main Report 104
5. Wood-based products Growth
Figure 16: Development of Intra-ASEAN Trade in Wood-Based Products
Source: Study estimates, based on Comtrade data
Figure 16 shows that ASEAN exports of wood-based products have remained
essentially unchanged over the last decade: in 2001 the total value of ASEAN exports of wood-based products stood at just under $12 billion, almost exactly the average for the period 1992-2001. 2003 data shows a total export value that is slightly higher than the 2001 value ($12.2 million), but not greatly so.
ASEAN imports of wood-based goods on the other hand have grown slightly more strongly. On average, they grew between 1992 and 2001, and averaged a growth rate of nearly 1.5% per annum over the period. As with many other import groups, wood-based products showed a marked downturn in 1998. 2003 figures ($5.6 billion) suggest that the total value of intra-ASEAN wood-based imports continues to hover around the average for the last decade ($5.4 billion). (2003 figures are not shown in the graph because the COMTRADE database does not include 2002 statistics for Thailand, with the result that there is a break in the series in 2002).
Intra-ASEAN trade accounts for approximately 35% of total ASEAN imports of wood-based products. Over the last decade, this proportion fluctuated between 30% and 39%. The trend in this market share, parallels the trends in total ASEAN exports and imports of wood-based goods: from a high of nearly 40% in the early 1990s, the intra-ASEAN market share gradually declined until 1997. By 2003, however, intra-ASEAN share had climbed back to 35% of total ASEAN imports. In absolute value terms, intra-ASEAN trade in wood-based products were around $2.0 billion in 2003 – still nearly 20% down from the peak recorded in 1995.
It seems likely that future growth in intra-regional trade in these commodities will be closely tied to the overall growth of ASEAN imports. With very low long-term growth in the sector, and declining local supplies of raw timber, there is no strong
y = 1956.1e-0.0077x
y = 5081.8e0.0154x
y = 12014e0.0036x
-
2,000
4,000
6,000
8,000
10,000
12,000
14,000
16,000
1992 1993 1994 1995 1996 1997 1998 1999 2000 2001
Year
$US
mill
ion
ASEAN Imports ASEAN Exports Intra-ASEANExpon. (Intra-ASEAN) Expon. (ASEAN Imports) Expon. (ASEAN Exports)

Promoting Efficient and Competitive Intra-ASEAN Shipping Services
REPSF Project 04/001: Final Main Report 105
indication that significant growth in intra-ASEAN trade in wood-based products can be anticipated in the near future.
Trade Structure
Table 17 shows the geographical structure of the intra-ASEAN wood-based products trades, based on an analysis of COMTRADE data.
Malaysia is the single most important supplier of intra-regional product in this category, accounting for nearly 30% of the total intra-regional supply. Malaysian exports are quite widely distributed. The principal destination is Singapore, which accounts for over one-third of Malaysia’s intra-regional exports of these products. Thailand is also an important destination, accounting for nearly one quarter of Malaysian exports to ASEAN. As much of Malaysian timber exports originate in Eastern Malaysia, it is to be likely that the majority of this cargo moves by sea. This will certainly be true for the low value-added component of the trade: unsawn timber and raw dressed timber. Much of this cargo is likely to be carried on small general-purpose vessels, many of which will operate out of minor ports.
Indonesia is the second largest exporter of wood-based products. The distribution of destinations for Indonesian exports is similar to that of Malaysia, with the main difference being that Malaysia itself is the principal destination for Indonesian wood-based products. All of Indonesia’s exports will be sea-borne, but the nature of the shipping used will depend on the precise nature of the product: low value-added exports will generally be carried on small multi-purpose vessels in essentially tramping operations, while manufactured wood products will generally be shipped in containerised form.
Singapore is the third largest exporter of wood-based products in the intra-ASEAN trades. As with rubber-based products, Singapore’s exports are understood to be mainly high value-added products. As around 50% of Singapore’s exports are bound for Malaysia, land transport may play a major role in the movement of this product. Exports to more distant locations, including Thailand, and some exports to Malaysia, will be carried by sea, almost certainly in containerised form. Thailand is the other significant exporter, with a wide range of markets, the most important of which is Malaysia. There may be some cross-border movements by truck, but it is likely that the majority of Thailand’s wood-based products exports will travel by sea.
These four exporters together account for approximately 87.5% of total exports, and almost all seaborne movements. The other two significant exporters – Lao PDR and Myanmar – are mainly involved in the cross-border movement of timber to Thailand. Table 24: Geographical Structure of Intra-ASEAN Wood-Based Products Trade
Source: Study estimates, based on analysis of COMTRADE data
Brunei Cambodia Indonesia Lao PDR Malaysia Myanmar Philippines Singapore Thailand Vietnam TotalBrunei 0.0% 0.0% 0.0% 0.0% 0.0% 0.0% 0.0% 0.0% 0.0% 0.0% 0.0%Cambodia 0.0% 0.0% 0.0% 0.0% 0.0% 0.0% 0.0% 0.0% 0.0% 0.0% 0.0%Indonesia 0.1% 0.3% 0.0% 0.0% 9.5% 0.3% 2.2% 8.1% 2.6% 3.1% 26.3%Lao PDR 0.0% 0.0% 0.0% 0.0% 0.0% 0.0% 0.0% 0.0% 4.2% 0.0% 4.2%Malaysia 0.7% 0.2% 1.4% 0.0% 0.0% 0.1% 3.4% 11.5% 8.7% 3.2% 29.2%Myanmar 0.0% 0.0% 0.0% 0.0% 1.0% 0.0% 0.0% 0.8% 4.2% 0.0% 6.0%Philippines 0.0% 0.0% 0.1% 0.0% 0.3% 0.0% 0.0% 0.3% 0.2% 0.2% 1.2%Singapore 0.4% 0.2% 0.0% 0.0% 8.7% 0.7% 0.9% 0.0% 3.1% 3.5% 17.6%Thailand 0.0% 0.6% 2.1% 0.3% 5.2% 0.3% 1.9% 2.0% 0.0% 2.0% 14.4%Viet Nam 0.0% 0.0% 0.0% 0.0% 0.2% 0.0% 0.0% 0.7% 0.2% 0.0% 1.2%Total 1.2% 1.3% 3.6% 0.3% 24.7% 1.4% 8.4% 22.8% 23.1% 12.1% 100.0%
Key < 0.1% Very little trade0.1%-1% Minor but significant share of intra-regional total1%-10% Significant share of intra-regional trade> 10% Dominant movement in intra-regional trade

Promoting Efficient and Competitive Intra-ASEAN Shipping Services
REPSF Project 04/001: Final Main Report 106
Commodities Table 25 shows the commodity distribution of the intra-ASEAN trade in wood-
based products.
It is clear from the table that the most important single element in this trade is natural rubber (code 4407), which accounts for 15% of the value of wood-based products trade. In volume terms, this element is even more important: on our estimates, it comprises around 22% of the total volume of cargo moved in this category. Some other low value components – in particular undressed timber (code 4403) as also very important in volume terms.
Table 25: Commodity Structure of Intra-ASEAN Wood-Based Products Trade
Unit Value Quantity
Code Description Value Share $/Kg $/m3 Tonne 000m3
H0-4401 Fuel wood, wood in chips or particles, wood waste 1.06 0.1% n.a. $0.007 - 160,393
H0-4402 Wood charcoal (including shell or nut charcoal) 6.50 0.3% n.a. $0.060 - 108,770
H0-4403 Wood in the rough or roughly squared 123.27 6.2% n.a. $0.284 - 434,289
H0-4404 Hoopwood, split poles, pile, pickets and stakes 0.49 0.0% $0.13 n.a. 3,835 -
H0-4405 Wood wool, wood flour 0.99 0.1% $0.21 n.a. 4,789 -
H0-4406 Railway or tramway sleepers (cross-ties) of wood 0.04 0.0% n.a. $0.411 - 102
H0-4407 Wood sawn, chipped lengthwise, sliced or peeled 296.09 15.0% $0.30 $0.391 971,032 -
H0-4408 Veneers and sheets for plywood etc <6mm thick 18.64 0.9% $1.22 n.a. 15,324 -
H0-4409 Wood continuously shaped along any edges 31.41 1.6% n.a. $0.356 - 88,281
H0-4410 Particle board, similar board, wood, ligneous materia 36.00 1.8% $0.17 n.a. 211,041 -
H0-4411 Fibreboard of wood or other ligneous materials 37.72 1.9% $0.23 n.a. 161,347 -
H0-4412 Plywood, veneered panels and similar laminated wood 107.98 5.5% $0.40 n.a. 271,940 -
H0-4413 Densified wood, in blocks, plates, strips or profile 7.28 0.4% $0.50 n.a. 14,420 -
H0-4414 Wooden frames for paintings, photographs, mirrors etc 4.09 0.2% $1.66 n.a. 2,464 -
H0-4415 Wooden cases, boxes, crates, drums, pallets, etc 21.77 1.1% $0.29 n.a. 73,843 -
H0-4416 Wooden casks, barrels, vats, tubs, etc 0.06 0.0% $0.60 n.a. 103 -
H0-4417 Tools, broom handles, bodies, etc, of wood 1.74 0.1% $0.44 n.a. 3,957 -
H0-4418 Builders joinery and carpentry, of wood 43.83 2.2% $0.79 n.a. 55,794 -
H0-4419 Tableware and kitchenware of wood 1.48 0.1% $1.08 n.a. 1,370 -
H0-4420 Ornaments of wood, jewel, cutlery caskets and cases 5.39 0.3% $1.59 n.a. 3,396 -
H0-4421 Articles of wood, nes 10.26 0.5% $0.91 n.a. 11,267 -
H0-4501 Natural cork 0.05 0.0% n.a. $1.125 - 44
H0-4502 Natural cork, debacked, roughly squared, in blocks et 1.22 0.1% n.a. $29.124 - 42
H0-4503 Articles of natural cork 0.39 0.0% $17.35 n.a. 23 -
H0-4504 Agglomerated cork and articles thereof 0.16 0.0% $5.65 n.a. 28 -
H0-4601 Mats, screens, articles nes of plaiting materials 3.01 0.2% $1.51 n.a. 1,985 -
H0-4602 Basketwork, wickerwork and similar articles 2.44 0.1% $1.68 n.a. 1,450 -
H0-4701 Mechanical wood pulp 0.05 0.0% $0.45 n.a. 120 -
H0-4702 Chemical wood pulp, dissolving grades 0.04 0.0% $0.31 n.a. 128 -
H0-4703 Chemical wood pulp, soda or sulphate, not dissolving 40.29 2.0% $0.36 n.a. 110,871 -
H0-4704 Chemical wood pulp, sulphite, not dissolving grade 0.08 0.0% $1.95 n.a. 39 -
H0-4705 Semi-chemical wood pulp 0.02 0.0% $1.39 n.a. 12 -
H0-4706 Pulps of other fibrous cellulosic material 0.34 0.0% $1.88 n.a. 180 -
H0-4707 Waste or scrap of paper or paperboard 25.49 1.3% $0.13 n.a. 199,030 -
H0-4801 Newsprint 62.13 3.1% $0.40 n.a. 154,086 -
H0-4802 Uncoated paper for writing, printing, office machines 156.11 7.9% $0.65 n.a. 241,933 -
H0-4803 Paper, household, sanitary, width > 36 centimetres 13.85 0.7% $0.84 n.a. 16,461 -

Promoting Efficient and Competitive Intra-ASEAN Shipping Services
REPSF Project 04/001: Final Main Report 107
Unit Value Quantity
Code Description Value Share $/Kg $/m3 Tonne 000m3
H0-4804 Uncoated kraft paper and paperboard 16.79 0.9% $0.35 n.a. 47,843 -
H0-4805 Uncoated paper and paperboard nes 57.11 2.9% $0.30 n.a. 191,996 -
H0-4806 Glazed transparent, translucent papers 2.13 0.1% $1.20 n.a. 1,772 -
H0-4807 Composite paper and board, not coated or impregnated 5.51 0.3% $0.96 n.a. 5,740 -
H0-4808 Paper, board corrugated creped embossed perforated ne 12.15 0.6% $0.40 n.a. 30,208 -
H0-4809 Carbon, self-copy paper etc, width > 36 cm 26.09 1.3% $1.16 n.a. 22,429 -
H0-4810 Paper, board, clay, inorganic coated at least one sid 140.79 7.1% $0.56 n.a. 249,853 -
H0-4811 Paper, board, etc coated, impregnated, coloured, nes 160.52 8.1% $2.45 n.a. 65,460 -
H0-4812 Filter blocks, slabs and plates, of paper pulp 4.27 0.2% $0.71 n.a. 6,023 -
H0-4813 Cigarette paper 16.61 0.8% $2.21 n.a. 7,508 -
H0-4814 Wallpaper and similar wall coverings etc of paper 2.29 0.1% $3.48 n.a. 660 -
H0-4815 Floor coverings with a base of paper or of paperboard 0.03 0.0% $0.19 n.a. 137 -
H0-4816 Carbon, copy, duplicating, stencil, offset plate pape 6.11 0.3% $1.51 n.a. 4,036 -
H0-4817 Envelopes for mail, cards, writing compendiums, etc 6.18 0.3% $0.94 n.a. 6,571 -
H0-4818 Household, sanitary, hospital paper articles, clothin 153.40 7.8% $1.73 n.a. 88,597 -
H0-4819 Paper, board containers, packing items, box files, et 118.71 6.0% $1.54 n.a. 76,876 -
H0-4820 Office books, forms, exercise books, folders, binders 21.53 1.1% $1.32 n.a. 16,350 -
H0-4821 Paper or paperboard labels including printed labels 43.63 2.2% $0.34 n.a. 130,060 -
H0-4822 Bobbins, spools, cops etc of paper pulp, paper, board 5.14 0.3% $0.94 n.a. 5,453 -
H0-4823 Paper and paper articles nes 112.00 5.7% $0.73 n.a. 152,942 -
Source: Study estimates, based on analysis of COMTRADE data

Promoting Efficient and Competitive Intra-ASEAN Shipping Services
REPSF Project 04/001: Final Main Report 108
6. Textiles and garments Growth
Figure 17: Development of Intra-ASEAN Trade in Textiles and Garments
Source: Study estimates, based on Comtrade data
Figure 17 shows that ASEAN exports of textile products have grown reasonably
steadily over the last decade: in 2001 the total value of ASEAN exports of textiles and garments stood at $20.5 billion, approximately 30% higher than in 1992. The average rate of growth over the period was fractional over 3%. There is some sign of peaking in 2000 – possibly as a result of increased competition from exporters such as China and Vietnam. The value of exports in 2003 was slightly below the 2001 figure, at $20.0 billion: this is approximately 10% below the 2001 peak.
ASEAN imports of textile and garment goods show a mixed trajectory over the period. After growing quite strongly between 1992 and 1996, a sharp fall reduced import levels to around their 1992 value by 1997. The subsequent recovery has not been strong, with 2001 imports at only $10.5 billion – still 15% down from the 1996 peak. 2003 figures ($9.5 billion) show a further decline in the total value of intra-ASEAN textile and garment imports, which are once more close to the levels of the 1998 trough.
Intra-ASEAN trade accounts for approximately 40% of total ASEAN imports of textile and garment products. Over the last decade, this proportion fluctuated between 36% and 49%. While the trend is not particularly clear, there has if anything been a tendency for the share to decline over the decade, although a slight rebound in 2003 once more lifted the intra-ASEAN share to above 40% of total ASEAN imports. In absolute value terms intra-ASEAN trade in textile products were around $3.8 billion in 2003 – still over 12% down from the peak recorded in 1995.
It seems likely that future growth in intra-regional trade in textiles and garments will be closely tied to the overall growth of ASEAN imports. As with wood-based products, a combination of very low long-term growth in the sector and a stable or declining intra-ASEAN market share provide is no strong indication that significant
y = 1956.1e-0.0077x
y = 9365.8e0.0118x
y = 15618e0.0302x
-
5,000
10,000
15,000
20,000
25,000
1992 1993 1994 1995 1996 1997 1998 1999 2000 2001
Year
$US
mill
ion
ASEAN Imports ASEAN Exports Intra-ASEANExpon. (Intra-ASEAN) Expon. (ASEAN Imports) Expon. (ASEAN Exports)

Promoting Efficient and Competitive Intra-ASEAN Shipping Services
REPSF Project 04/001: Final Main Report 109
growth in intra-ASEAN trade in these commodities can be anticipated in the near future.
Trade Structure Table 26 shows the geographical structure of the intra-ASEAN textile and garment
trades, based on an analysis of COMTRADE data.
Indonesia is the single most important supplier of intra-regional product in this category, accounting for approximately 26% of the total intra-regional supply. Malaysian exports are quite widely distributed, with Malaysia (9%) and Singapore (6%) the principal destinations. Thailand and the Philippines are also important destinations. All Indonesian exports – except perhaps a small percentage of high end product, which may travel by air – will be carried by sea, and will almost certainly travel in containers.
Thailand is the second largest exporter of textile and garments in the intra-ASEAN trades, accounting for 25% of the total intra-ASEAN trade in these commodities. Thailand’s exports are very evenly distributed around the region, with no individual country accounting from more than 20% of Thailand’s total intra-ASEAN exports. The overwhelming majority of Thailand’s exports of textiles and garments are carried by container shipping services.
Singapore is the third largest intra-ASEAN exporter of textiles and garments. Singapore’s exports are very heavily concentrated on Malaysia, which accounts for nearly two-thirds of Singapore’s total intra-ASEAN exports. It is likely that much of this component of the trade travels by land transport, but this is difficult to verify.
Malaysia is the other significant exporter. Malaysian exports make up almost 16% of total intra-ASEAN trade in textiles and garments. Almost half of this total is destined for Singapore, and a significant proportion of this total will travel by land transport. Exports to other destinations will be almost wholly by container shipping.
These four exporters together account for over 86% of total intra-ASEAN trade in textiles and garments. Table 26: Geographical Structure of Intra-ASEAN Textiles and Garments Trade
Source: Study estimates, based on analysis of COMTRADE data
Commodities
Table 27 shows the commodity distribution of the intra-ASEAN trade in textile and garments.
Intra-ASEAN trade in these commodities is fairly evenly split between textiles and fibres (codes 50 to 60: approximately 60%) and garments (codes 61 to 62:
Brunei Cambodia Indonesia Lao PDR Malaysia Myanmar Philippines Singapore Thailand Vietnam TotalBrunei 0.0% 0.0% 0.0% 0.0% 0.1% 0.0% 0.0% 2.9% 0.0% 0.0% 3.0%Cambodia 0.0% 0.0% 0.0% 0.0% 0.0% 0.0% 0.1% 1.7% 0.0% 0.0% 1.8%Indonesia 0.1% 0.5% 0.0% 0.0% 9.3% 0.3% 3.3% 6.2% 3.8% 2.4% 26.0%Lao PDR 0.0% 0.0% 0.0% 0.0% 0.0% 0.0% 0.0% 0.0% 0.0% 0.0% 0.0%Malaysia 0.5% 1.0% 2.3% 0.0% 0.0% 0.2% 0.9% 6.8% 1.3% 2.9% 15.9%Myanmar 0.0% 0.0% 0.0% 0.0% 0.4% 0.0% 0.0% 1.3% 0.0% 0.0% 1.8%Philippines 0.0% 0.2% 0.5% 0.0% 0.4% 0.0% 0.0% 0.9% 0.3% 0.4% 2.7%Singapore 1.6% 0.7% 0.0% 0.0% 12.1% 0.5% 1.1% 0.0% 2.1% 1.3% 19.4%Thailand 0.1% 1.5% 4.5% 2.2% 4.1% 2.1% 3.6% 4.1% 0.0% 2.7% 24.9%Viet Nam 0.0% 0.0% 0.1% 0.0% 0.9% 0.0% 0.2% 2.9% 0.4% 0.0% 4.5%Total 2.4% 3.9% 7.3% 2.2% 26.5% 3.1% 9.0% 23.9% 7.4% 9.7% 100.0%
Key < 0.1% Very little trade0.1%-1% Minor but significant share of intra-regional total1%-10% Significant share of intra-regional trade> 10% Dominant movement in intra-regional trade
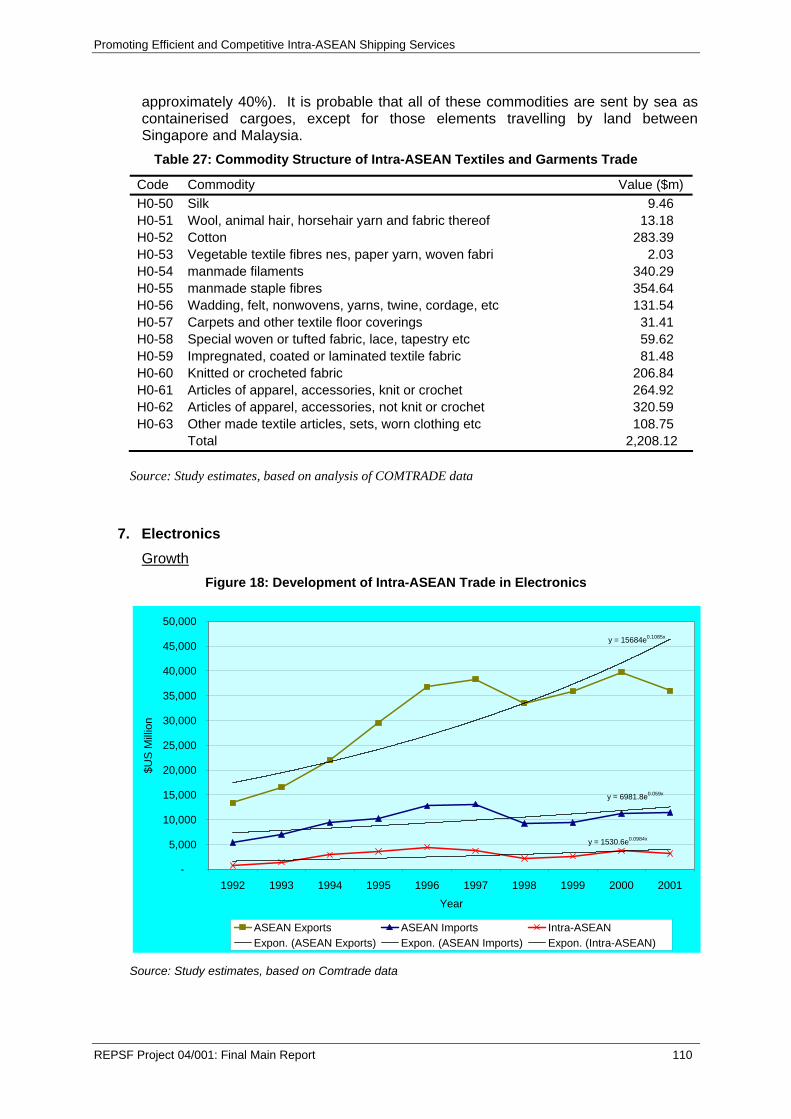
Promoting Efficient and Competitive Intra-ASEAN Shipping Services
REPSF Project 04/001: Final Main Report 110
approximately 40%). It is probable that all of these commodities are sent by sea as containerised cargoes, except for those elements travelling by land between Singapore and Malaysia.
Table 27: Commodity Structure of Intra-ASEAN Textiles and Garments Trade
Code Commodity Value ($m) H0-50 Silk 9.46 H0-51 Wool, animal hair, horsehair yarn and fabric thereof 13.18 H0-52 Cotton 283.39 H0-53 Vegetable textile fibres nes, paper yarn, woven fabri 2.03 H0-54 manmade filaments 340.29 H0-55 manmade staple fibres 354.64 H0-56 Wadding, felt, nonwovens, yarns, twine, cordage, etc 131.54 H0-57 Carpets and other textile floor coverings 31.41 H0-58 Special woven or tufted fabric, lace, tapestry etc 59.62 H0-59 Impregnated, coated or laminated textile fabric 81.48 H0-60 Knitted or crocheted fabric 206.84 H0-61 Articles of apparel, accessories, knit or crochet 264.92 H0-62 Articles of apparel, accessories, not knit or crochet 320.59 H0-63 Other made textile articles, sets, worn clothing etc 108.75 Total 2,208.12
Source: Study estimates, based on analysis of COMTRADE data
7. Electronics Growth
Figure 18: Development of Intra-ASEAN Trade in Electronics
Source: Study estimates, based on Comtrade data
y = 15684e0.1085x
y = 6981.8e0.059x
y = 1530.6e0.0984x
-
5,000
10,000
15,000
20,000
25,000
30,000
35,000
40,000
45,000
50,000
1992 1993 1994 1995 1996 1997 1998 1999 2000 2001
Year
$US
Milli
on
ASEAN Exports ASEAN Imports Intra-ASEANExpon. (ASEAN Exports) Expon. (ASEAN Imports) Expon. (Intra-ASEAN)

Promoting Efficient and Competitive Intra-ASEAN Shipping Services
REPSF Project 04/001: Final Main Report 111
Figure 18 shows that ASEAN exports of electronics have grown rapidly over the last decade, with a compound average growth rate of over 10%56. However, the period is divided quite clearly into two phases: a rapid growth phase from 1992 to 1997, during which exports almost trebled; and a subsequent period of low growth. By 2001 the total value of ASEAN exports of electronic equipment stood at around $36 billion, over three times the 1992 value. There is some sign of renewed growth over the last few years: by 2003, the value of exports had increased to over $40 million, nearly 5% higher that the previous peak in achieved in 2000.
ASEAN imports of electronic goods display a very similar temporal pattern, but growth rates have been more moderate. After growing quite strongly between 1992 and 1996, imports flattened and then fell as the currency crisis struck. The subsequent recovery has not been strong, with 2001 imports at $11.5 billion – still over 10% down from the 1996 peak. 2003 figures ($11.5 billion) show little further growth over the last two years.
Intra-ASEAN trade accounts for approximately 30% of total ASEAN imports of electronic products. This proportion increased rapidly during the early 1990s, but subsequently there has been no clear trend: ASEAN market share has fluctuated with the range 23% and 36%. In 2003, the share was 32.3%. In absolute value terms intra-ASEAN trade in electronic products were around $3.7 billion in 2003 – up from under $1 billion in 1992, but still below the 1996 peak of $4.5 billion.
Overall, the average rate of growth of intra-ASEAN trade in electronic products over the decade 1992-2001 was approximately 10% - approximately the same as the rate of growth of ASEAN exports in general. The prospects for future substantial growth in this sector appear good.
Trade Structure Table 26 shows the geographical structure of the intra-ASEAN trade in electronic
goods, based on an analysis of COMTRADE data.
The table quite clearly shows that the trade in electronic goods is more concentrated than trade in other priority sectors. It is very much concentrated on a triangular trade between Singapore, Malaysia and Thailand, with each of these countries being major destinations for the exports of the others: a typical pattern for an industry in which intra-industry trade is well-established.57
Singapore is the single most important supplier of intra-regional product in this category, accounting for approximately 40% of the total intra-regional supply. The principal destinations for Singapore’s exports are Malaysia, which takes just under half of Singapore’s total exports, and Thailand (about one-quarter). Vietnam and the Philippines are also important destinations. As with many other products, it is likely that land transport plays a major role in the carriage of Singapore’s exports to Malaysia – the other elements will be mainly carried by container shipping, although some high value product may move by air.
Thailand is the second largest exporter of electronic goods in the intra-ASEAN trades, accounting for approximately 30% of the total intra-ASEAN trade in these commodities. Thailand’s exports are directed principally to Singapore, which is the destination for almost 50% of Thailand’s total intra-ASEAN exports. Malaysia accounts for approximately one-third of Thailand’s total exports. The overwhelming
56 For the purpose of this report, the definition of electronic goods is taken from Austria (2004). This
includes some computer equipment (HS Code 8471) , which might equally well have been included under the ICT sector
57 See Austria (2004) [Final Report of REPSF 03/006e].

Promoting Efficient and Competitive Intra-ASEAN Shipping Services
REPSF Project 04/001: Final Main Report 112
majority of Thailand’s exports of electronic goods are carried by container shipping services.
Malaysia is the third largest intra-ASEAN exporter of electronic goods. Malaysia’s exports are very heavily concentrated on Singapore, which accounts for nearly two-over 60% of Malaysia’s total intra-ASEAN exports. It is likely that much of this component of the trade travels by land transport, but this is difficult to verify. Malaysia’s exports to Thailand, Indonesia and Vietnam will generally move by container shipping.
These three countries together account for over 99% of total intra-ASEAN exports of electronic goods. The same three countries account for over 75% of intra-ASEAN imports.
Table 28: Geographical Structure of Intra-ASEAN Electronics
Source: Study estimates, based on analysis of COMTRADE data
Commodities
Table 29 shows the commodity distribution of the intra-ASEAN trade in electronic goods.
It is clear from the table that automated data processing equipment (code 8471) is the dominant component of this trade, accounting for over two-thirds of the total value of intra-ASEAN trade in the sector.
Table 29: Commodity Structure of Intra-ASEAN Electronics Code Commodity Value ($m) Share
H2-8414 Air or vacuum pumps, air or other gas compressors and fans 283.3 8.9%
H2-8415 Air conditioning machines, comprising a motor-driven fan 368.5 11.6%
H2-8418 Refrigerators, freezers and other refrigerating or freezing equipment 211.2 6.6%
H2-8471 Automatic data processing machines and units thereof 2170.5 68.3%
H2-8509 Electro-mechanical domestic appliances, with self-contained electric motor. ... 30.4 1.0%
H2-8510 Shavers, hair clippers and hair-removing appliances, with self-contained el ... 2.3 0.1%
H2-8516 Electric instantaneous or storage water heaters and immersion heaters 110.1 3.5%
Total 3176.3 100.0%
Source: Study estimates, based on analysis of COMTRADE data
Brunei Cambodia Indonesia Lao PDR Malaysia Myanmar Philippines Singapore Thailand Viet Nam TotalCambodia 0.0% 0.0% 0.0% 0.0% 0.0% 0.0% 0.0% 0.0% 0.0% 0.0% 0.0%Malaysia 0.2% 0.0% 2.3% 0.0% 0.0% 0.1% 1.8% 17.5% 5.9% 0.9% 28.6%Myanmar 0.0% 0.0% 0.0% 0.0% 0.0% 0.0% 0.0% 0.0% 0.0% 0.0% 0.0%Singapore 0.7% 1.0% 0.0% 0.0% 19.1% 0.5% 4.9% 0.0% 9.4% 5.1% 40.6%Thailand 0.0% 0.4% 2.1% 0.8% 9.7% 0.2% 1.7% 14.3% 0.0% 1.1% 30.3%Viet Nam 0.0% 0.0% 0.0% 0.0% 0.2% 0.0% 0.0% 0.2% 0.1% 0.0% 0.5%Total 0.9% 1.4% 4.4% 0.8% 28.9% 0.7% 8.4% 32.0% 15.4% 7.1% 100.0%
Key < 0.1% Very little trade0.1%-1% Minor but significant share of intra-regional total1%-10% Significant share of intra-regional trade> 10% Dominant movement in intra-regional trade

Promoting Efficient and Competitive Intra-ASEAN Shipping Services
REPSF Project 04/001: Final Main Report 113
8. Information and Communications Technology Growth
Figure 19: Development of Intra-ASEAN Trade in ICT Products
Source: Study estimates, based on Comtrade data
Figure 19 shows that ASEAN exports of ICT equipment have at a very high rate over the last decade, with a compound average growth rate of over 15%58. A rapid growth phase from 1992 to 1997, during which exports almost trebled, slowed temporarily in 1997 and 1998. A return to strong growth in 1999 and 2000 was again brought to a halt in 2001, when world-wide problems in the IT industries precipitated a sharp fall in ASEAN’s ICT exports. In 2001 the total value of ASEAN exports of ICT equipment stood at just under $100 billion: roughly four times the 1992 value. Renewed growth over the last two years has seen the total value of exports rise to nearly $120 billion in 2003. This is slightly higher than the previous peak in achieved in 2000, and over 20% above the 2001 trough.
ASEAN imports of ICT goods display a very similar temporal pattern, but the effect of the 1997/8 crisis on imports was more marked and has been more lasting. As a result, ASEAN’s position as a net importer prior to the crisis appears to have been permanently replaced by a role as a net exporter. After growing very strongly between 1992 and 1996, imports flattened and then fell sharply as the currency crisis struck. The strong recovery in 1999 and 2000 saw import levels rise above the previous peak in 2000 before falling sharply again in 2001. As with exports, a strong subsequent recovery has boosted exports in 2003 to levels in excess of the 2000 peak: the value of ASEAN exports of ICT products in 2003 figures was $103 billion.
Intra-ASEAN trade accounts for approximately 30% of total ASEAN imports of ICT equipment products. This proportion increased from around 20% during the early 1990s, but there has been no clear trend over the last five years, during which ASEAN market share has fluctuated with the range 30%-34%. In 2003, the share
58 ICT equipment excludes includes some computer equipment (HS Code 8471), which is – consistent
with the classifications used by Austria (2004), been included under the electronics sector
y = 27593e0.151x
y = 35234e0.1119x
y = 7032e0.1603x
-
20,000
40,000
60,000
80,000
100,000
120,000
140,000
1992 1993 1994 1995 1996 1997 1998 1999 2000 2001
Year
$US
Milli
on
ASEAN Exports ASEAN Imports Intra-ASEANExpon. (ASEAN Exports) Expon. (ASEAN Imports) Expon. (Intra-ASEAN)

Promoting Efficient and Competitive Intra-ASEAN Shipping Services
REPSF Project 04/001: Final Main Report 114
was 30.6%. In absolute value terms intra-ASEAN trade in ICT equipment was around $32 billion in 2003 – up from under $6 billion in 1992.
Overall, the average rate of growth of intra-ASEAN trade in electronic products over the decade 1992-2001 was approximately 16% - slightly higher than the general rate of growth of ASEAN exports. The prospects for future substantial growth in this sector appear good.
Trade Structure
Table 30 shows the geographical structure of the intra-ASEAN trade in ICT goods, based on an analysis of COMTRADE data.
The table quite clearly shows that the trade in ICT equipment is even more concentrated than trade in electronic goods. It is very much concentrated on a bilateral trade between Singapore and Malaysia, with trade between these two countries accounting for over 57% of total intra-ASEAN.
Singapore is the single most important supplier of intra-regional product in this category, with Singapore’s exports comprising approximately 45% of the total intra-regional supply. Three-quarters of Singapore’s exports are destined for Malaysia: almost all of the remainder goes to Thailand and the Philippines.
Malaysia is the second largest exporter of ICT equipment in the intra-ASEAN trades, accounting for approximately 30% of the total intra-ASEAN trade in these commodities. Nearly 80% of Malaysia’s exports are directed to Singapore. Thailand is the next most important ASEAN market for Malaysia’s ICT exports, accounting for just over 10%.
The Philippines is the third largest intra-ASEAN exporter of ICT goods: Philippines’ exports account for 13% of total intra-regional trade. Exports from the Philippines are directed mainly to Singapore and Malaysia, which between them consume about 90% of the total.
As with many other products, it is likely that land transport plays a major role in the carriage of trade between Singapore and Malaysia. The high value of many of these products (sampling suggests $10 to $150 per kilogram is typical) suggests that air transport will play a major role, with container shipping a secondary mode.
Table 30: Geographical Structure of Intra-ASEAN Trade in ICT Products
Source: Study estimates, based on analysis of COMTRADE data
Brunei Cambodia Indonesia Lao PDR Malaysia Myanmar Philippines Singapore Thailand Viet Nam TotalBrunei 0.0% 0.0% 0.0% 0.0% 0.0% 0.0% 0.0% 0.0% 0.0% 0.0% 0.0%Cambodia 0.0% 0.0% 0.0% 0.0% 0.0% 0.0% 0.0% 0.0% 0.0% 0.0% 0.0%Indonesia 0.0% 0.0% 0.0% 0.0% 0.3% 0.0% 0.1% 3.6% 0.2% 0.0% 4.3%Lao PDR 0.0% 0.0% 0.0% 0.0% 0.0% 0.0% 0.0% 0.0% 0.0% 0.0% 0.0%Malaysia 0.0% 0.0% 0.6% 0.0% 0.0% 0.0% 1.5% 23.6% 3.3% 0.2% 29.3%Myanmar 0.0% 0.0% 0.0% 0.0% 0.0% 0.0% 0.0% 0.0% 0.0% 0.0% 0.0%Philippines 0.0% 0.0% 0.2% 0.0% 6.3% 0.0% 0.0% 5.5% 1.0% 0.0% 13.1%Singapore 0.1% 0.0% 0.0% 0.0% 33.8% 0.1% 3.8% 0.0% 7.0% 0.5% 45.2%Thailand 0.0% 0.0% 0.2% 0.0% 2.0% 0.0% 1.3% 3.7% 0.0% 0.2% 7.4%Viet Nam 0.0% 0.0% 0.0% 0.0% 0.0% 0.0% 0.4% 0.1% 0.0% 0.0% 0.6%Total 0.0% 0.0% 0.6% 0.0% 0.4% 0.0% 1.6% 27.3% 3.6% 0.2% 100.0%
Key < 0.1% Very little trade0.1%-1% Minor but significant share of intra-regional total1%-10% Significant share of intra-regional trade> 10% Dominant movement in intra-regional trade

Promoting Efficient and Competitive Intra-ASEAN Shipping Services
REPSF Project 04/001: Final Main Report 115
Commodities
Table 31 shows the commodity distribution of the intra-ASEAN trade in ICT equipment.
It is clear from the table that trade in partial assemblies and components (codes 8532, 8534, 8541, 8542) is the dominant component of this trade, accounting for over 70% of the total value of intra-ASEAN trade in the sector.
Table 31: Commodity Structure of Intra-ASEAN Trade in ICT Equipment
Code Commodity Value ($m) Share
H2-3818 Chemical elements doped for use in electronics 109.9 0.4%
H2-8469 Typewriters other than printers of heading 84.71; word-processing machines. ... 0.5 0.0%
H2-8470 Calculating machines and pocket-size data recording, reproducing machines 11.2 0.0%
H2-8504 Electrical transformers, static converters (for example, rectifiers) and in ... 661.8 2.5%
H2-8517 Electrical apparatus for line telephony or line telegraphy 638.5 2.4%
H2-8518 Microphones and stands therefor; loudspeakers 260.4 1.0%
H2-8520 Magnetic tape recorders and other sound recording apparatus 8.6 0.0%
H2-8523 Prepared unrecorded media for sound recording or similar recording of other ... 657.8 2.5%
H2-8524 Records, tapes and other recorded media for sound 70.8 0.3%
H2-8525 Transmission apparatus for radio-telephony, radio-broadcasting 1020.3 3.9%
H2-8527 Reception apparatus for radio-telephony, radio-telegraphy or radio-broadcas ... 247.8 0.9%
H2-8529 Parts suitable for use with the apparatus of headings 85.25 to 85.28 1259.2 4.8%
H2-8531 Electric sound or visual signalling apparatus 211.0 0.8%
H2-8532 Electrical capacitors, fixed, variable or adjustable (pre-set). 917.7 3.5%
H2-8533 Electrical resistors (including rheostats and potentiometers) 272.4 1.0%
H2-8534 Printed circuits. 1180.6 4.5%
H2-8536 Electrical apparatus for switching or protecting electrical circuits, or fo ... 1060.8 4.1%
H2-8541 Diodes, transistors and similar semiconductor devices 2252.0 8.6%
H2-8542 Electronic integrated circuits and microassemblies. 14223.1 54.5%
H2-8543 Electrical machines and apparatus, having individual functions 204.3 0.8%
H2-8544 Insulated (including enamelled or anodised) wire, cable 359.9 1.4%
H2-9009 Photocopying apparatus incorporating an optical system 133.7 0.5%
H2-9026 Instruments and apparatus for measuring or checking the flow, level, pressu ... 38.9 0.1%
H2-9027 Instruments and apparatus for physical or chemical analysis 41.1 0.2%
H2-9030 Oscilloscopes, spectrum analysers 260.0 1.0%
Source: Study estimates, based on analysis of COMTRADE data

Promoting Efficient and Competitive Intra-ASEAN Shipping Services
REPSF Project 04/001: Final Main Report 116
9. Automotive Growth
Figure 20: Development of Intra-ASEAN Trade in Automotive Products
Source: Study estimates, based on Comtrade data
Figure 20 shows that ASEAN exports of automobiles and related products have grown at a very high rate over the last decade, with a compound average growth rate of over 13%. Growth has been fairly consistent over this period, interrupted only by a brief and – compared with other sectors – mild setback in 1998. Growth has accelerated markedly recently: the total value of exports rose to nearly $7.7 billion in 2003. This is nearly 50% higher than the value of exports recorded in 2001.
ASEAN imports of automobiles and related products has shown a dramatically different temporal pattern. The effect of the 1997/8 crisis on imports of automobiles and related products was more profound and has been lasting. Imports fell by nearly two-thirds in 1998. As a result, imports, which had been five times the value of exports in 1996, exceeded exports by only one-third in 1998. Recovery in 1999 and 2000 was strong, but not nearly strong enough to return imports to their pre-crisis levels. The value of imports turned down again during the economic slowdown of 2001. The last two years have shown robust growth, with imports in 2003 ($11 billion) approximately 25% higher than in 2001. Nevertheless, total ASEAN imports in 2003 remained well below the 1996 peak of nearly $16 billion.
Intra-ASEAN trade accounts for approximately 20% of total ASEAN imports of automobiles and related products. This proportion increased from around 10% during the early 1990s. The main increase has occurred since 1998, when the ASEAN market share rose to 16%. After a decline from this level over the next 3 years, the share increased sharply again between 2001 and 2003. In absolute value terms intra-ASEAN trade in automobiles and related products reached $2.4 billion in 2003: nearly five times the level in 1992.
Overall, the trend rate of growth of intra-ASEAN trade in these products over the decade 1992-2001 was approximately 5% - well below the trend rate of growth of
y = 1508.7e0.1308x
y = 10248e-0.0204x
y = 786.36e0.0539x
-
2,000
4,000
6,000
8,000
10,000
12,000
14,000
16,000
18,000
1992 1993 1994 1995 1996 1997 1998 1999 2000 2001
Year
$US
Milli
on
ASEAN Exports ASEAN Imports Intra-ASEANExpon. (ASEAN Exports) Expon. (ASEAN Imports) Expon. (Intra-ASEAN)

Promoting Efficient and Competitive Intra-ASEAN Shipping Services
REPSF Project 04/001: Final Main Report 117
ASEAN exports. The prospects for future substantial growth in this sector appear good.
Trade Structure
Table 32 shows the geographical structure of the intra-ASEAN trade in the automotive sector, based on an analysis of COMTRADE data.
The table quite clearly shows that the predominance of Thailand in this sector. Thailand’s exports comprise over two-thirds of the total intra-regional supply. These exports are widely spread around the region. Indonesia is the largest market, accounting for approximately one-third of total Thai exports, but Malaysia, the Philippines and Singapore are also significant markets. Exports to the newer ASEAN member countries are also importer..
Singapore is the second largest exporter of automobiles and related products in the intra-ASEAN trades. These statistics include re-exports from Singapore, and it is possible that re-exports are a large component of the total in this sector. Singapore’s for nearly one quarter of the total intra-ASEAN trade in these commodities, of which almost one-half goes to Malaysia.
Malaysia is the only other significant intra-ASEAN exporter of goods in this sector, accounting for 9% of total intra-regional trade. Malaysia exports are distributed farily evenly between Singapore, Thailand and Indonesia.
The large majority of intra-regional trade in these commodities will travel by sea. The form of sea transport used will depend on whether the trade is in parts and knocked-down kits, or in fully built up vehicles. Table 32: Geographical Structure of Intra-ASEAN Trade in the Automotive Sector
Source: Study estimates, based on analysis of COMTRADE data
Commodities
Table 33 shows the commodity distribution of the intra-ASEAN trade in automobiles and related products.
It is clear from the table that trade is fairly evenly divided between the trade in built-up vehicles, and trade in motor vehicles parts and accessories. The latter will most commonly be carried on container shipping services, while the former will generally be moved on dedicated vehicle carriers.
Brunei Cambodia Indonesia Lao PDR Malaysia Myanmar Philippines Singapore Thailand Viet Nam TotalBrunei 0.0% 0.0% 0.0% 0.0% 0.0% 0.0% 0.0% 0.0% 0.2% 0.0% 0.2%Lao People's Dem 0.0% 0.0% 0.0% 0.0% 0.0% 0.0% 0.0% 0.0% 0.0% 0.0% 0.0%Malaysia 0.2% 0.0% 2.1% 0.0% 0.0% 0.0% 0.5% 2.3% 3.6% 0.5% 9.2%Lao PDR 0.0% 0.0% 0.0% 0.0% 0.0% 0.0% 0.0% 0.0% 0.0% 0.0% 0.0%Singapore 1.7% 0.5% 0.0% 0.0% 11.2% 0.4% 2.1% 0.0% 5.9% 1.6% 23.4%Thailand 0.6% 4.1% 22.8% 2.5% 11.1% 1.3% 12.2% 8.3% 0.0% 4.2% 67.0%Viet Nam 0.0% 0.0% 0.0% 0.0% 0.1% 0.0% 0.0% 0.0% 0.2% 0.0% 0.3%Total 2.5% 4.6% 24.8% 2.5% 22.3% 1.7% 14.7% 10.6% 9.7% 6.3% 100.0%
Key < 0.1% Very little trade0.1%-1% Minor but significant share of intra-regional total1%-10% Significant share of intra-regional trade> 10% Dominant movement in intra-regional trade

Promoting Efficient and Competitive Intra-ASEAN Shipping Services
REPSF Project 04/001: Final Main Report 118
Table 33: Commodity Structure of Intra-ASEAN Trade in Automobiles and Related Products
Code Commodity Value ($m) Share
H2-8709 Works trucks, self-propelled, not fitted with lifting or handling equipment ... 5.5 0.3%
H2-8714 Parts and accessories of vehicles of headings 87.11 to 87.13. 239.8 14.9%
H2-8715 Baby carriages and parts thereof. 0.4 0.0%
H2-8716 Trailers and semi-trailers 16.1 1.0%
H2-8701 Tractors (other than tractors of heading 87.09). 20.8 1.3%
H2-8703 Motor cars and other motor vehicles principally designed for the transport ... 454.5 28.3%
H2-8706 Chassis fitted with engines, for the motor vehicles of headings 87.01 to 87 ... 7.0 0.4%
H2-8710 Tanks and other armoured fighting vehicles, motorised 8.7 0.5%
H2-8711 Motorcycles (including mopeds) and cycles fitted with an auxiliary motor 94.6 5.9%
H2-8712 Bicycles and other cycles (including delivery tricycles), not motorised. 3.0 0.2%
H2-8713 Carriages for disabled persons 0.4 0.0%
H2-8704 Motor vehicles for the transport of goods. 139.4 8.7%
H2-8708 Parts and accessories of the motor vehicles of headings 87.01 to 87.05. 599.1 37.3%
H2-8702 Motor vehicles for the transport of ten or more persons, including the driv ... 1.4 0.1%
H2-8705 Special purpose motor vehicles, other than those principally designed for t ... 8.5 0.5%
H2-8707 Bodies (including cabs), for the motor vehicles of headings 87.01 to 87.05. ... 5.0 0.3%
Source: Study estimates, based on analysis of COMTRADE data
10. Container Trade
Growth Figure 21: Development of Intra-ASEAN Container Trade
Source: Study estimates, based on unpublished data from KMI/ESCAP
Figure 21 shows that a reasonable balance between export and import cargoes has been maintained within the region over the analysis period. However, export
y = 2865188.73e0.10x
y = 3100675.20e0.08x
y = 467332.34e0.12x
0
1,000,000
2,000,000
3,000,000
4,000,000
5,000,000
6,000,000
7,000,000
8,000,000
1992 1993 1994 1995 1996 1997 1998 1999 2000 2001
TEU
Intra-ASEAN
Exports
Imports
Expon.(Exports)Expon.(Imports)Expon. (Intra-ASEAN)

Promoting Efficient and Competitive Intra-ASEAN Shipping Services
REPSF Project 04/001: Final Main Report 119
growth has been stronger than import growth, particularly in later years, so that a gap has begun to emerge between total export volumes and total import volumes.
Intra-ASEAN trade accounts for only a small proportion of total container movements, but has grown more rapidly than total container trade volumes. However, with the slowdown in regional economic growth in post-1997, intra-ASEAN trade volume growth has also moderated.
Trade Structure
Figure 22 shows the geographical structure of the intra-ASEAN general cargo trades, based on an analysis of COMMTRADE data.
A very large proportion of total general cargo movements is the two-way trade between Singapore and Malaysia. Of this total, a large part will travel by land transport between peninsular Malaysia and Singapore in non-containerised form.
Volume of these movements is not readily available. However, it is possible to make an estimate of the proportion of the Singapore-Malaysian general cargo trade travelling by sea by comparing the share of this movement total intra-ASEAN general cargo trade to the proportion of Singapore-Malaysia trade in the total intra-regional container flows (using unpublished data tables from the KMI-ESCAP study). A similar adjustment can be made to eliminate the much smaller land transport component from Malaysia-Thailand trade.
Figure 22: Geographical Structure of Intra-ASEAN General Cargo Trade59
Source: Study estimates, based on analysis of COMMTRADE data
59 In this context, ‘general cargo’ is used to describe the miscellany of cargoes that would, if traveling by sea, be
expected to travel in containerized form.
0
2000
4000
6000
8000
10000
12000
BruneiDarussalam
Cambodia Indonesia Malaysia Myanmar Philippines Singapore Thailand Viet Nam
Viet NamThailandSingaporePhilippinesMyanmarMalaysiaLao People's Dem. Rep.IndonesiaCambodiaBrunei Darussalam
Group General Cargo
Sum of 000 Tonnes
From
To

Promoting Efficient and Competitive Intra-ASEAN Shipping Services
REPSF Project 04/001: Final Main Report 120
Figure 23 shows the geographical structure of the intra-ASEAN maritime general cargo trades, expressed in TEU terms, after these adjustments have been made.
Figure 23: Geographical Structure of Intra-ASEAN General Cargo Trade
Source: Study estimates, based on analysis of COMMTRADE data
0
50,000
100,000
150,000
200,000
250,000
300,000
350,000
400,000
Brunei
Daruss
alam
Cambo
dia
Indon
esia
Lao P
eople
's Dem
. Rep
.
Malays
ia
Myanm
ar
Philipp
ines
Singap
ore
Thaila
nd
Viet N
am
TEU
Viet NamThailandSingaporePhilippinesMyanmarMalaysiaIndonesiaCambodiaBrunei Darussalam

Promoting Efficient and Competitive Intra-ASEAN Shipping Services
REPSF Project 04/001: Final Main Report 121
APPENDIX 3: DRAFT SPECIFICATION OF DATABASE CONTENTS Maritime Trade Data Level of Detail Preferable at HS 4-digit level
Scope Both international and domestic shipments
ASEAN Exports Province /State of Origin
Port of Shipment
Port of Discharge
Province/State of Destination (intra-ASEAN cargo, including domestic) Country of Destination (outside of ASEAN)
Volume (mass tonnes)
Mode of shipment (dry bulk, liquid bulk, general cargo, containerised cargo)
ASEAN Imports Province/State of Origin (intra-ASEAN cargo, including domestic) Country of Origin (outside of ASEAN)
Port of Shipment
Port of Discharge
Province /State of Destination
Volume (mass tonnes)
Mode of shipment (dry bulk, liquid bulk, general cargo, containerised cargo)
Scheduled shipping services Scope Regular services offered by vessels > 500 GT
For each service Operating company
Conventional General Cargo
Ro-ro
Geared container
Ungeared container
Ship Type
Other
Number of ships deployed
Port rotation
Average size of vessel used
Service frequency

Promoting Efficient and Competitive Intra-ASEAN Shipping Services
REPSF Project 04/001: Final Main Report 122
Port Data
Maximum allowable draft
Other size restrictions (length, beam)
Approach length
Tidal restrictions
Approaches
Pilotage requirements
Identifier (Name or Berth No)
Quay length
Alongside draft
Quayside handling equipment
Storage area – covered
Storage area – open
Types of cargo handled
Typical discharge rates
Berths (for each berth or terminal)
Berth occupancy
Ship based infrastructure charges (e.g. tonnage)
Cargo based infrastructure charges (e.g. wharfage)
Handling charges
Pilotage charges
Tariffs
Towage charges
Port throughput by commodity (2-digit HS) [Serves as cross check to maritime trade data]
Container movements
Inbound Outbound
Full Number of 20’ Number of 40’
Number of 20’ Number of 40’
Cargo
Empty Number of 20’ Number of 40’
Number of 20’ Number of 40’
Number of ships by ship type Ship calls
Size distribution of ships

Promoting Efficient and Competitive Intra-ASEAN Shipping Services
REPSF Project 04/001: Final Main Report 123
APPENDIX 4: BREAKDOWN OF GENERAL CARGO CLASSIFICATION
Table 34: Breakdown of Movement General Cargo Commodities within ASEAN by SITC Rev 3 Classification - $US, 2001.
Code Value Description
12 $10,813,608 Meat, other than of bovine animals, and edible offal, fresh, chilled or frozen for human consumption
17 $18,054,778 Meat and edible meat offal, prepared or preserved n.e.s.
37 $126,735,995 Fish, crustaceans, molluscs and other aquatic invertebrates, prepared or preserved, n.e.s.
46 $11,281,078 Meal and flour of wheat and flour of meslin
48 $47,227,516 Cereal preparations and preparations of flour or starch of fruits or vegetables
57 $111,042,272 Fruit and nuts (not including oil nuts), fresh or dried 58 $11,408,365 Fruit preserved, and fruit preparations (excluding fruit juices) 71 $68,136,800 Coffee and coffee substitutes 72 $152,218,482 Cocoa 75 $106,453,163 Spices 81 $92,216,836 Feeding stuff for animals (not including unmilled cereals) 91 $14,759,516 Margarine and shortening 98 $270,904,016 Edible products and preparations, n.e.s.
111 $82,805,171 Nonalcoholic beverages, n.e.s. 112 $107,849,002 Alcoholic beverages 121 $10,266,266 Tobacco, unmanufactured; tobacco refuse 122 $908,495,106 Tobacco, manufactured (whether or not containing tobacco substitutes) 231 $281,959,077 Natural rubber, balata, etc., 266 $23,923,542 Synthetic fibres suitable for spinning 267 $16,847,924 Manmade fibres, n.e.s. suitable for spinning and waste of manmade fibres 269 $26,826,568 Worn clothing and other worn textile articles; rags 292 $23,101,357 Crude vegetable materials, n.e.s. 421 $27,279,550 Fixed vegetable fats and oils, soft, crude, refined or fractionated 422 $413,539,730 Fixed vegetable fats and oils (other than soft), crude, refined or fractionated 431 $48,287,327 Animal or vegetable fats and oils processed 525 $13,971,960 Radioactive and associated materials
531 $75,799,782 Synthetic organic coloring matter and color lakes and preparations based thereon
533 $282,801,201 Pigments, paints, varnishes and related materials
541 $140,224,907 Medicinal and pharmaceutical products, other than medicaments (of group 542)
542 $152,720,418 Medicaments (including veterinary medicaments) 551 $174,462,755 Essential oils, perfume and flavor materials 553 $253,780,056 Perfumery, cosmetics, or toilet preparations, excluding soaps 554 $162,523,394 Soap, cleansing and polishing preparations 582 $295,218,667 Plates, sheets, film, foil and strip of plastics
591 $48,615,439 Insecticides, fungicides, herbicides, plant growth regulators, etc., disinfectants and similar products
592 $89,703,100 Starches, inulin and wheat gluten; albuminoidal substances; glues
597 $180,317,120 Prepared additives for mineral oils etc.; liquids for hydraulic transmissions; antifreezes and deicing fluids

Promoting Efficient and Competitive Intra-ASEAN Shipping Services
REPSF Project 04/001: Final Main Report 124
Code Value Description 611 $78,577,865 Leather
621 $14,653,972 Materials of rubber, including pastes, plates, sheets, rods, thread, tubes, etc.
625 $106,075,683 Rubber tires, interchangeable tire treads, tire flaps and inner tubes for wheels of all kinds
629 $82,745,229 Articles of rubber, n.e.s. 634 $123,717,681 Veneers, plywood, particle board, and other wood, worked, n.e.s. 635 $58,345,228 Wood manufactures, n.e.s. 641 $609,060,507 Paper and paperboard 651 $319,319,417 Textile yarn 652 $79,303,511 Cotton fabrics, woven (not including narrow or special fabrics)
653 $248,533,593 Woven fabrics of manmade textile materials (not including narrow or special fabrics)
655 $185,570,606 Knitted or crocheted fabrics (including tubular knit fabrics, n.e.s., pile fabrics and open-work fabrics), n.e.s.
657 $75,567,874 Special yarns, special textile fabrics and related products 658 $33,550,194 Made-up articles, wholly or chiefly of textile materials, n.e.s. 662 $36,839,768 Clay construction materials and refractory construction materials 663 $56,927,581 Mineral manufactures, n.e.s. 664 $239,587,396 Glass 665 $25,618,270 Glassware 667 $14,279,044 Pearls, precious and semiprecious stones, unworked or worked 681 $26,385,380 Silver, platinum and other platinum group metals 691 $90,788,644 Metal structures and parts, n.e.s., of iron, steel or aluminum 692 $97,684,375 Metal containers for storage or transport 693 $29,033,412 Wire products (excluding insulated electrical wiring) and fencing grills
694 $37,393,568 Nails, screws, nuts, bolts, rivets and similar articles, of iron, steel, copper or aluminum
695 $41,915,784 Tools for use in the hand or in machines 699 $231,985,782 Manufactures of base metal, n.e.s. 713 $210,981,513 Internal combustion piston engines and parts thereof, n.e.s.
714 $88,587,256 Engines and motors, non-electric & parts b(except steam turbines, internal combustion piston engines power generating machinery.
716 $788,057,722 Rotating electric plant and parts thereof, n.e.s. 724 $82,989,816 Textile and leather machinery, and parts thereof, n.e.s. 726 $33,362,332 Printing and bookbinding machinery, and parts thereof 727 $28,619,436 Food-processing machines (excluding domestic)
728 $712,557,150 Machinery and equipment specialized for particular industries, and parts thereof, n.e.s.
731 $134,060,664 Machine tools working by removing metal or other material
733 $32,943,960 Machine tools for working metal, sintered metal carbides or cermets, without removing material
735 $45,516,492 Parts and accessories suitable for use solely or principally with metal working machine toolsers
737 $21,027,860 Metalworking machinery (other than machine tools) and parts thereof, n.e.s.
741 $446,658,990 Heating and cooling equipment and parts thereof, n.e.s. 742 $92,044,120 Pumps for liquids, whether or not fitted with a measuring device 743 $306,737,201 Pumps (not for liquids), air or gas compressors and fans 744 $122,477,401 Mechanical handling equipment, and parts thereof, n.e.s.

Promoting Efficient and Competitive Intra-ASEAN Shipping Services
REPSF Project 04/001: Final Main Report 125
Code Value Description
745 $74,798,444 Nonelectrical machinery, tools and mechanical apparatus, and parts thereof, n.e.s.
746 $416,900,946 Ball or roller bearings
747 $105,635,305 Taps, cocks, valves and similar appliances for pipes, boiler shells, tanks, etc. (
748 $76,080,508 Transmission shafts and cranks; bearing housings and plain shaft bearings; gears and gearing;
749 $194,395,531 Non-electric parts and accessories of machinery, n.e.s. 751 $88,493,857 Office machines
752 $2,339,050,921 Automatic data processing machines and units thereof; magnetic or optical readers
759 $9,017,255,760 Parts and accessories suitable for use solely or principally with office machines or automatic data processing machines
761 $357,061,308 TV receivers (including video monitors & projectors)
762 $461,630,413 Radio-broadcast receivers, whether or not incorporating sound recording or reproducing apparatus or a clock
763 $267,538,113 Sound recorders or reproducers; television image and sound recorders or reproducers
764 $3,866,670,660 Telecommunications equipment, n.e.s.; and parts, n.e.s., and accessories of apparatus falling within telecommunications, etc.
771 $737,362,646 Electric power machinery (other than rotating electric plant of power generating machinery) and parts thereof
772 $2,844,022,140 Electrical apparatus for switching or protecting electrical circuits or for making connections to or in electrical circuits
773 $537,727,595 Equipment for distributing electricity, n.e.s.
774 $11,517,271 Electro-diagnostic apparatus for medical, surgical, dental or veterinary sciences and radiological apparatus
775 $251,384,775 Household type electrical and non-electrical equipment, n.e.s.
776 $17,357,394,110
Thermionic, cold cathode or photocathode valves and tubes; diodes, transistors and similar semiconductor devices
778 $2,549,785,591 Electrical machinery and apparatus, n.e.s.
784 $597,383,673 Parts and accessories for tractors, motor cars and other motor vehicles, trucks, public-transport vehicles
812 $13,016,011 Sanitary, plumbing and heating fixtures and fittings, n.e.s. 813 $25,761,023 Lighting fixtures and fittings, n.e.s.
821 $191,086,067 Furniture and parts thereof; bedding, mattresses, mattress supports, cushions and similar stuffed furnishings
831 $12,438,185 Trunks, suitcases, vanity cases, binocular and camera cases, handbags, wallets, etc. of leather, etc.;
841 $69,909,978 Men's or boys' coats, jackets, suits, trousers, shirts, underwear etc. of woven textile fabrics (
842 $12,608,625 Women's or girls' coats, capes, jackets, suits, trousers, dresses, skirts, underwear, etc. of woven textiles
843 $15,722,848 Men's or boys' coats, capes, jackets, suits, blazers, trousers, shirts, etc. knitted or crocheted textile fabric
844 $31,147,560 Women's or girls' coats, capes, jackets, suits, trousers, dresses, underwear, etc. knitted or crocheted
845 $157,001,149 Articles of apparel, of textile fabrics, whether or not knitted or crocheted, n.e.s.
851 $82,431,874 Footwear 871 $66,788,856 Optical instruments and apparatus, n.e.s.

Promoting Efficient and Competitive Intra-ASEAN Shipping Services
REPSF Project 04/001: Final Main Report 126
Code Value Description
872 $81,978,165 Instruments and appliances, n.e.s., for medical, surgical, dental or veterinary purposes
874 $615,281,060 Measuring, checking, analysing and controlling instruments and apparatus, n.e.s.
881 $195,727,298 Photographic apparatus and equipment, n.e.s. 882 $236,023,748 Photographic and cinematographic supplies 884 $42,535,476 Optical goods, n.e.s. 885 $216,971,217 Watches and clocks 892 $171,916,588 Printed matter 893 $582,774,729 Articles, n.e.s. of plastics 894 $67,447,160 Baby carriages, toys, games and sporting goods 895 $75,868,400 Office and stationery supplies, n.e.s.
897 $218,188,961 Jewellery, goldsmiths' and silversmiths' wares, and other articles of precious or semiprecious materials, n.e.s.
898 $428,909,398 Musical instruments, parts and accessories thereof; records, tapes and other sound or similar recordings
899 $37,088,562 Miscellaneous manufactured articles, n.e.s.

Promoting Efficient and Competitive Intra-ASEAN Shipping Services
REPSF Project 04/001: Final Main Report 127
APPENDIX 5: INTEGRATION – THE MODEL OF THE EUROPEAN COMMUNITY
1. Background Like ASEAN, the European Union (EU) – formerly known as he European Community
(EC) - aspires to develop economic and social cohesion and solidarity amongst its member states and to foster sustainable economic growth. With a view to this the 1957 Treaty of Rome, by which the EU was founded, was concerned to establish a common market. The Treaty prohibited discrimination based on nationality within the EC, granted the freedom to provide services and established rules for competition. These general principles were to have an impact on the transport sector. In addition to being bound by the general rules, the treaty of Rome made specific provisions for the implementation of a common transport policy. Articles 74 to 84 of the Treaty set out:
(a) common rules applicable to international transport to or from the territory of a Member State or passing across the territory of one or more Member States;(b) the conditions under which non-resident carriers may operate transport services within a Member State; (c) measures to improve transport safety; (d) any other appropriate provisions.
The inclusion of Articles 74-84 in the Treaty, in conjunction with the general principles
outlined above, gave the EC the power to regulate transport policy. The provisions of Articles 74-84 were, however, applicable only to transport by rail, road and inland waterways under the original Treaty. The exclusion of provisions for sea transport from the treaty meant that some thirty years passed before the council developed a common maritime policy.
2. The Beginnings of a Common Maritime Policy In the 1980s a recession in the shipping industry and the decline of the EC vessels
share of the world fleet bought the need for a coherent maritime policy to the forefront of transport concerns. A series of events led up to the eventual adopting of the EC’s common maritime policy. In 1983, for example, the European Parliament bought action against the Council for a failure to act in accordance with the dictates of the Treaty of Rome with regards to maritime policy and the European Court of Justice found in favour of the parliament. The council was required to develop a common maritime policy.
By 1987 the Treaty of Rome had been amended with the Single European Act (SEA), which sought to further liberalise the EC. Article 16 of the SEA increased the scope of the original treaty’s transport provisions to include air and sea transport. In the meantime, the council produced a report on progress towards a common maritime policy shortly after the findings of the European Court of Justice (Com 1985 (0090)). As a part of this report the commission made a series of proposals regarding a common maritime policy. These proposals formed the basis of a package of regulations passed in 1986 that constituted the first phase in the implementation of a Common Maritime Policy.
3. Phase One: The 1986 Package This package consisted of four Acts that were primarily concerned with combating the
threat posed to community shipping interests from protectionist practices of non-member states.

Promoting Efficient and Competitive Intra-ASEAN Shipping Services
REPSF Project 04/001: Final Main Report 128
They were:
• 4055/86, establishing the freedom to provide maritime transport services between member states and between member states and third countries. (Did not run cabotage services)
• 4056/86, setting out the application of EC competition rules for maritime transport. It sought to find a balance between the UN liner shipping code,60 which was ratified by the Member States, and the sustainability of the maritime sector. This act deals only with international maritime services.
• 4057/86 dealing with unfair pricing practices of third countries in international cargo liner shipping. Its primary function is to set out a complaint process for those who consider themselves disadvantaged by unfair pricing practices.
• 4058/86 safeguarding free access to cargoes in ocean trades. This regulation is anti-protectionist and designed to ensure a freely competitive environment in the international maritime market.
Significantly, this package of regulations did not deal with cabotage. This was because during the deliberations on 4055/86 the member states could not reach agreement on the sensitive issue of cabotage in time for the 1986 passing of the legislation. As a result the issue of cabotage was to be omitted from the 1986 legislation and dealt with separately at a later date.
4. Phase Two: Cabotage The second phase of the implementation of a common maritime policy in the EC was
the lifting of cabotage restrictions in member states. The treatment of cabotage related issues was both vital and highly contentious. The Northern Member States had traditionally had an open coastline policy, and were thus already well into the process of liberalizing their cabotage services by the time that the legislation was proposed in the late 1980s. The lifting of remaining cabotage restriction was not expected to have a major impact on the national maritime industries in the Northern Member States. Indeed, a report from the commission in 1996 found that after the lifting of Cabotage restriction passenger services, for example, tended to remain in domestic hands even after being opened up. It is not surprising then that during discussion of cabotage services the Northern States were in favour of immediate and complete lifting of cabotage restrictions services.
For the Southern Member States, however, the stakes were much higher. Some member states were concerned about the security risks of opening up cabotage services. Greece, for example, was concerned about its proximity to Turkey, with whom relations had not always been harmonious. However, the key to the concerns about cabotage regulations was economic. The passenger and ferry services in the Southern Members States were highly profitable, particularly in the summer tourist season. They would therefore be economically attractive to non-national investors. The lifting of cabotage restrictions, therefore, posed a threat to the national industries of Southern Member States. Most notably, the lifting of restrictions posed a threat to the employment of nationals. Initially, all matters relation to manning were the responsibility of the host state; however, it was proposed that all manning matters become the responsibility of the flag state. The change in manning rules would mean that non-nationals would be able to take advantage of third world labour: a prospect which was expected to be detrimental to
60 Council Regulation 954/79 committed EC members to the provisions set out in The United Nations
convention on the code of conduct for liner conferences (1974) after much debate in 1979.

Promoting Efficient and Competitive Intra-ASEAN Shipping Services
REPSF Project 04/001: Final Main Report 129
the maritime industry in the Southern Member states. The Southern member states were therefore opposed to the lifting of cabotage restrictions.
After much negotiation Council Regulation 3577/92 relating to the freedom to provide maritime cabotage services was passed in 1992. The regulation provided for the total liberalization of cabotage services but took into account the difficulties faced by Southern Member States in enacting its requirements. A compromise was reached in the form of provision of a plan for the gradual implementation of the new cabotage regulations.
5. The Implementation of Council Regulation 3577/92 There were a number of measures written in to Regulation 3577/92 to accommodate
a gradual lifting of cabotage restrictions. The process of implementing the regulation was to be completed by January 1st 1999 with the exception of some services in Greece, which were to be unrestricted by 2004. The Commission was required to report on the process of the implementation of the regulation every two years during a transitional period. The resulting four reports contained annexes that provide a detailed country-by-country account of the state of cabotage restrictions.
The measures taken to stagger the adopting of 3577/92 took the form of a series of temporary exemptions. Two key exemptions were used to ease the initial impact of the new regulations. Firstly, any existing public service contracts were permitted to remain in force up to the expiry date of the relevant contract. Further, Article four of 3577/92 entitled member state to impose public service obligations for services between islands. Secondly, the regulations states that:
“As from 1 January 1993, freedom to provide maritime transport services within a Member State (maritime cabotage) shall apply to Community ship owners who have their ships registered in, and flying the flag of a Member State, provided that these ships comply with all conditions for carrying out cabotage in that Member State, including ships registered in Euros, once that Register is approved by the Council.”
While it was required that “Community shipowners exercising the freedom to provide cabotage services should comply with all the conditions for carrying out cabotage in the Member State in which their vessels [were] registered” the application of this provision was suspended until 31 December 1996. As a consequence of which, Community shipowners operating ships registered in a Member State who did not have the right to carry out cabotage in that State were also beneficiaries of this Regulation during a transitional period.
Table 35: Phasing of the Removal of Cabotage Restrictions In The European Union
Exempt Until
Exemptions
1995 Cruise services carried out in the Mediterranean and along the coast of Spain, Portugal and France
1997 Transport of strategic goods (oil, oil products and drinking water) carried out in the Mediterranean and along the coast of Spain, Portugal and France
1998 Services by ships smaller than 650 gt, until 1 January 1998 1999 Jan 1, Regular passenger and ferry services carried out in the
Mediterranean and along the coast of Spain, Portugal and France Island cabotage (in the Mediterranean and cabotage with regard to the Canary, Azores and Madeira archipelagos, Ceuta and Melilla, the French islands along the Atlantic coast and the French overseas departments
2004 Greek passenger and ferry services

Promoting Efficient and Competitive Intra-ASEAN Shipping Services
REPSF Project 04/001: Final Main Report 130
Most of the exemptions allowed for in Regulation 3577/92 were designed to allow the
Southern member states to phase out their cabotage restrictions. Several maritime transport services carried out in the Mediterranean and along the coast of Spain, Portugal and France were temporarily exempted from the implementation of Regulation 3577/22. These exemptions extended to cruise service, strategic goods and ships under 650gt and Island cabotage.
By 1997 all Northern Member States had fully liberalized both mainland and island cabotage while Southern Member States had only lifted mainland restriction by the same date.
Perhaps the most sensitive aspect of the lifting of cabotage laws was the regulations pertaining to manning laws and their impact on employment. In light of the controversy over the manning policy, the council saw fit to delay the transferring in the responsibilities from the host state to the flag state until the first of January 1999. Nevertheless, the council report found that the impact of the lifting of cabotage restrictions on the Southern States was such that Article 3 of 3577/92 was amended to permit the host state to require that, in the case of passenger services, the host state rules concerning the proportion of EU nationals in the crew shall apply.

Promoting Efficient and Competitive Intra-ASEAN Shipping Services
REPSF Project 04/001: Final Main Report 131
APPENDIX 6: ABOUT THE AUTHORS
These reports have been produced by PDP Australia Pty Ltd and Meyrick and Associates Pty Ltd.
PDP is an international economics development company specialising in Public Sector Management and helping build better institutions around the globe. Since 1998, PDP has undertaken more that 300 assignments in over 60 countries in public policy and economic management for international agency clients and governments. They were responsible for the recently completed Pacific Regional Transport Project funded by AusAID which was a high profile and complex study. PDP also worked on the Tumen River Area Development Program for the UNDP, in five riparian countries of Korea(s), Russia, China and Mongolia. Please see their website www.pdp.com.au for further examples of successful projects.
Meyrick and Associates specialises in the transport and infrastructure sectors and have successfully completed over 50 projects in the Asia-Pacific region since 1988. These projects have covered many aspects of transport policy and management, including technical, analytical and policy issues. Of specific relevance to the current project are Meyrick’s work in (i) trade forecasting, a review of strategic developments in the ASEAN shipping sector, cost modelling of shipping services and an analysis of port requirements; (ii) the analysis of developments in container shipping services in the ASEAN region and assessment of future port and shipping needs; and (iii) assessment of non-tariff barriers to trade in transport services in the APEC region. Further details can be found on their website www.meyrick.com.au.
The individuals contributing to this report include:
• Stephen Meyrick - Team Leader has 25 years experience as a team leader and transport economist predominantly in the maritime sector. He has led and worked on policy and strategy studies for World Bank, Asian Development Bank, OECD, SEATAC, ESCAP, ESCWA and the European Community, as well as a wide range of Australian clients in both the public and private sectors.
• Dr Keith Trace - Maritime Economist - has over 30 years maritime transport policy and regulatory experience having published over forty articles and chapters in books on all areas of policy and regulation of shipping and ports including ASEAN. He has advised Australian Government transport and economic management and regulation instrumentalities, international agencies, governments ands private sector companies. He has worked in Malaysia, Philippines, Singapore, Thailand and Vietnam on shipping policy and strategy assignments.
• Richard Filmer - Trade Facilitation Specialist - has vast experience in transport policy and strategy, economic management and industry policy. He has held Director level positions in Australian transport and economic management agencies. He has acted as consultant to governments and international agencies in trade policy, including free trade agreements, export facilitation, tariffs and duties and customs facilitation.
• Jeremy Brown - Maritime Operations Specialist - has 30 years experience in maritime transport, export marketing and logistics including seagoing experience, management of commercial shipping services, ships’ agency and shore operations. He has specific experience in port management, container operations, ship operations and chartering and the carriage of refrigerated cargoes. He has wide experience in the commercial aspects of container, bulk and bulk liquids shipping

Promoting Efficient and Competitive Intra-ASEAN Shipping Services
REPSF Project 04/001: Final Main Report 132
services, container terminals, yards and depots and in the logistics of moving cargo to the wharf.
• John Lee - Transport Policy Specialist - is a transport planner and economist with over 30 years international consulting experience in all modes of transport. He has directed policy-based institutional strengthening and capacity building in transport sector organisations, and has worked for international agencies including AusAID in directly relevant assignments in all ASEAN countries and an additional 14 countries.
• Jose Tongzon - Port Economist - a Philippine national, has 30 years of high level maritime policy and strategy advisory experience in ASEAN countries and East and Central Asia. He commenced his career as special assistant to the Philippines Minister of Trade and since then has written 6 books, 11 chapters of books, 27 internationally refereed journal articles and 38 conference papers in maritime economics, and trade and regulation policy. He has massive experience in ASEAN countries in all aspects of maritime policy, business structures and evolution of the maritime industry at a global and regional level.