the importance of intra-industry trade between asean … the importance of intra-industry trade...
TRANSCRIPT
1
The Importance of Intra-Industry Trade between ASEAN-7 and
the Pacific Alliance: A Mechanism to Strengthen Economic
Integration and Expanding Trade Across the Pacific.
Adriana Roldán1
Camilo Pérez
Asia Pacific Studies Centre - Universidad EAFIT, Colombia.
Abstract
The trade between Latin America and Asia has been rapidly increasing over the last years,
due to the growing commercial interdependence with Asian economies such as China,
Japan and South Korea. However, there is still some room for expanding trade and
economic cooperation with South East Asia where Latin American products could play an
important role in the production networks. This paper explains the importance of the intra-
industry trade between the seven ASEAN members of APEC and the members of the
Pacific Alliance. The ITT was measured using the trade-weighted Grubel-Lloyd index
based on the SITC rev.4 for the commerce among these regions between 2005- 2009. The
economic sectors in this analysis include the agro-based, rubber-based, wood-based
products, fisheries, health-care, automobile, textile and garments, electronics, and ICT
industries. 1Adriana Roldán: Master in International Relations, Waseda University. Associate Professor and Academic Coordinator at the Asia Pacific Studies Centre. Universidad EAFIT. Colombia. [email protected]
Camilo Pérez: PG Cert. on Political Studiesand International Negotiator, Universidad EAFIT. Research Assistant and Lecturer at the Asia Pacific Studies Centre. Universidad EAFIT. Colombia. [email protected]
2
The GLI allowed the identification of sectors where there is evidence of ITT among
ASEAN-7 and the PA and the trade relation that have the potential to become ITT. These
results are relevant in the light of the identification of opportunities to expand trade and
straighten the production linkages among APEC members and also because of the
importance that SMEs play in the intra-industry trade.
Introduction
The transpacific dimension of APEC has become a major issue in recent years as a result of
the economic transformation in Asia and the Americas. Some of the changes that have
shaped this evolution include the impact that the U.S. economic downturn had in the world
economy, which redefined the economic and political linkages between the two regions; the
proliferation of free trade agreements and other trade liberalization initiatives intended to
boost trade across the Pacific; and the increasing trade between Asia and Latin America.
The economic crisis evidenced the trends of greater international involvement of emerging
economies, particularly in Asia Pacific and Latin America. Most of the economies in Asia
and Latin America have overcome the economic crisis and are showing signs of strong
growth, while other regions such as North America and Europe are still struggling their
way out. While Latin America was also hit by the global economic crisis, this time the
region has been able to withstand the severe external shock, coming back on track to
achieve a solid recovery ahead of other regions. Furthermore, Latin America became an
interesting partner for Asia and other countries throughout the world.
It is within this framework that the relation between Asia and Latin America becomes a
core issue for the strengthening regional economic integration and expanding trade among
APEC members.
The trade between Latin America and Asia has been rapidly increasing in recent years,
mainly due to the booming trade with East Asia. Nonetheless, there are still opportunities
3
for trade expansion and economic cooperation with South East Asia where Latin American
products could play an important role in the production networks.
This paper focuses in the analysis of the intra-industry trade (ITT) between the seven
ASEAN members of APEC (hereinafter ASEAN-7)2 and the members of the Pacific
Alliance (hereafter PA)3. This analysis is aimed at identifying the economic sectors with
high potential for intra-industry trade between these two regions. The understanding of this
potential is important in the light of the capacity of these sectors to generate effective
productive linkages between the two regions. Likewise, the identification of trade patterns
is particularly important with a view to identify useful complementary elements for the
future consolidation of the PA.
Methodological Approach
The discussion on intra-industry trade is mainly based on the works of Leontief (1954),
Verdoorn (1960), Balassa (1963) and Grubel and Lloyd (1975), among others. The intra-
industry trade (IIT) is defined as one that occurs "if a country simultaneously imports and
exports similar goods and services" (Van Marrewijk, 2009). Within this definition, it is
necessary to differentiate between two types of IIT: vertical IIT and horizontal IIT
(Greenaway, Hine and Milner, 1995). Horizontal intra-industry trade refers to the
simultaneous import and export of goods classified in the same industry and at the same
level of processing (Van Marrewijk, 2009). Vertical intra-industry trade is characterized by
a two-way exchange of goods classified in the same industry but with different levels of
processing (Van Marrewijk, 2009).
Some of the studies that have analyzed the intra-industry trade between Latin America in
the past include works by Moneta (1995), which places particular emphasis on trade
relations between Mercosur and the economies of East Asia; and more recently the report
2 ASEAN-7 Includes ASEAN members also in APEC: Brunei Darussalam, Indonesia, Malaysia, Philippines, Singapore, Thailand and Vietnam. 3The Pacific Alliance or Alianza del Pacifico in Spanish was initially known as Acuerdo de Integración Profunda AIP. Currently, the Pacific Alliance members are: Mexico, Colombia, Chile and Peru.

4
published by ECLAC (2010), which analyzes the potential for intra-industry trade between
China and Latin America.
For the purposes of this research, the ITT was measured using the trade-weighted
Grubel-Lloyd index based on the Harmonized Commodity Description and Coding System
(HS Re. 2002). This analysis considers the trade among the PA and ASEAN-7 members in
the period comprised between 2005-2009. The economic sectors included in this analysis
are based on the criteria suggested by Austria (2004) and Wattanapruttipaisan (2008).
These sectors are: agro-based, automobile, electronics, fisheries, healthcare supplies, ICT,
rubber-based, textile and garments, and wood-based products.
For the assessment of intra-industry trade among members of PA and ASEAN-7 economies
the weighted Grubel-Lloyd Index (GLI) (Equation 2) is used:
Equation 1. !"#$%&'() = !!"# −!!"# (!!"# −!!"#)
Equation 2.!"#$ℎ!ℎ!"#$% = (!"#!×!!)
Where !!"# and !!"# are the exports and imports of the product or group ! of country !
to/from country ! in a given year or period, respectively. The weighted method takes into
account the proportion exported and/or traded at the level of each group ! considered. Thus
!! is the weight of each product group in total exports and imports of each country’s
specific sector (see table 1).
Table1: IIT Levels interpretation
Level 1 !"# > 0,33 Evidence of IIT
Level 2 0,10 ≤ !"# ≤ 0,33 Potential of IIT
Level 3 !"# < 0,10 Inter-industrial relations Source: Duran and Alvarez (2008).
5
1. Trade Characteristics between ASEAN-7 and PA in Selected Sectors
The Asia-Pacific Economic Cooperation (APEC) was established in 1989 including 12
members. Among the participants were Singapore, Thailand, Indonesia, Philippines,
Malaysia and Brunei that were already members of ASEAN. Later, in 1997 Vietnam4
joined the forum. In 1993, Mexico5 was the first Latin American country to become a
member of APEC, followed later by Chile in 1994 and Peru in 1997. Colombia has
manifested its interest to become but its accession has not been possible due to multiples
moratoriums imposed on new members in 1993, 1997 and 2003.
The growing trade between Asia and Latin America has been widely discussed in academic
circles and within institutions such as ECLAC6, ADB7 and authors such as Roldán (2010).
They argue that the proliferation of Free Trade Agreements (FTAs) among APEC member
economies has been the result of several factors such as the slow liberalization of trade,
both within the WTO and APEC, the growing interest of Asia, and particularly of China in
Latin America’s natural resources, the identification of potential access of Asian products
to Latin America markets in recent years, and the conclusion of investment protection
agreements among the economies in both regions (ECLAC 2009, Roldán, 2010).
APEC meetings have been an appropriate scenario to strengthen trade relations between
Latin America’s APEC members and some Asia-Pacific countries. For instance, Mexico
already has an Economic Partnership Agreement with Japan and its negotiating a Free
Trade Agreement with Korea. Chile currently has nine Free Trade Agreements with
countries in Asia Pacific such as: Japan, China, Korea, Australia, New Zealand, Brunei and
Singapore, Malaysia and Vietnam; and it is negotiating with Thailand. Peru has Free Trade
Agreements with China and Singapore; recently signed an agreement with Korea, and it is
negotiations with Japan and Thailand. Colombia is trying to close its foreign policy to Asia;
in 2009 it started negotiations with Korea, and is currently moving forward with other
Asian countries such as Japan and Singapore.
4 Vietnam became an APEC member with Peru and Russia. 5 Mexico joined APEC with Papua New Guinea. 6 ECLAC: Economic Commission for Latin America and the Caribbean. 7 ADB: Asian Development Bank.
6
As an evidence of the effects of these agreements, the evaluation of the Bogor goals in
2010 proved that the trade among APEC members has grown steadily in recent years. As
reported in APEC Yokohama Leader’s statement in 2010, APEC trade in goods with the
world increased at an annualized rate of 7.1%, reaching US$11.4 trillion in 2009. The
nominal value of trade in commercial services in the APEC region also increased at an
annualized rate of about 7%, reaching a total of US$2.4 trillion in 2009. Moreover, since
1994, the 2010 economies have reduced their tariffs significantly, with the simple average
applied tariff rate falling from 8.2% in 1996 to 5.4% by 2008, well below the world average
of 10.4% (APEC, 2010).
This increase is explained by trade liberalization in both regions and the establishment of
FTAs between some APEC´s member economies. The Latin American economies that
participate in APEC, namely Chile, Mexico and Peru, have not been unaffected by these
trends. Asia Pacific economies have become important trade partners for these countries
and as members of APEC they have been at the forefront of strengthening political relations
and cooperation between Asia and Latin America.
In the context of the booming trade between Asia and Latin America, some multilateral
liberalization initiatives have also flourished. One of the most notable examples is the
Trans-Pacific Strategic Agreement signed in 2005 by Brunei Darussalam, Chile, New
Zealand and Singapore. Other APEC members such as Australia, Malaysia, Peru, United
States, and Vietnam are negotiating their accession to this initiative. Other examples
include the Latin American Pacific Arc8, created in 2007 to strengthen the commercial
relations among the countries in the Latin American Pacific Rim in order to enhance
regional influence in Trans-Pacific issues.
The most recent example is the Pacific Alliance created in 2011. This initiative brings
together the most dynamic economies in the Latin American Pacific Rim: Chile, Mexico,
and Peru (APEC Latin American members), and Colombia (currently lobbying for
membership). This group was established as a strategic mechanism to integrate their
markets and improve their foothold in Asia and other international markets. The Pacific
8 The Latin American Pacific Arc is known as Arco del Pacífico Latinoamericano in Spanish.

7
Alliance was first proposed by Alan Garcia, the former president of Peru, in 2010 based on
the growing affinity between a set of countries all betting on market economies, foreign
investment and trade with Asia to achieve development. These four countries, whose
populations add up to over 200 million, account for approximately one-third of Latin
America’s total GDP and over half its exports to the rest of the world, with Mexico
contributing the greatest share (World Bank, 2011).
The PA agreement is an extensive economic integration pact aiming to facilitate the free
movement of goods, services, capital, and people between the member states. Some of the
initiatives include:
1. To complement its members bilateral pacts and membership to other Pacific trade
treaties such as the Asia-Pacific Economic Cooperation (APEC) and eventually the
Trans-Pacific Partnership (TPP).
2. To prompt stronger competition through greater economies of scale.
3. To establish a strategic plan to share trade offices (Proexport Colombia, Prochile
and Promperu) in Asia in order to strengthen the trade front and to share
experiences in promoting exports and attracting tourism and foreign investment.
4. To develop plans aimed to merge Chile, Colombia, and Peru stock exchanges to
create the Integrated Latin American Market (known as MILA).9
The Pacific Alliance also serves the purpose of consolidating the relationship between Asia
and Latin America. The four members of PA have a huge potential to integrate their
markets and products with Asian economies. Some of the most developed members of
ASEAN-7 such as Singapore, Malaysia, and Thailand could become important trade
partners of PA in the future. Furthermore, ASEAN free trade area has identified key
economic sectors within the group that could have complementary elements with the PA in
the future.
9MILA: Mercado Integrado Latinoamericano in Spanish.

8
Despite the fact that the share of PA trade with ASEAN-7 members is less than 4%, the
Pacific Alliance trade with ASEAN-7 members has been growing steadily for the last five
years. While PA total exports to the world grew 16.8% from 2005 to 2009, PA exports to
ASEAN-7 increased 52%, from US$ 1,332 million to US$ 2,024 million in the same period.
PA imports from ASEAN-7 also increased from US$ 10,810 million to US$ 11,734 million
between 2005 and 2009 (see table 2).
Table 2: Pacific Alliance Trade with the World, APEC and ASEAN-7 (US$ million)
Exports Exports
2005
Exports
2009
% of total
PA
Exports
2005
% of total
PA
Exports
2009
Variation 2005-
2009 (%)
PA to the World 293,777 343,035 100% 100% 16.80%
PA to APEC 240,403 267,281 81.80% 77.90% 11.20%
PA to ASEAN-7 1,332 2,024 0.50% 0.60% 52.00%
Imports Imports
2005
Imports
2009
% of total
PA
Imports
2005
% of total
PA
Imports
2009
Variation 2005-
2009 (%)
PA from the World 288,260 331,579 100% 100% 15.00%
PA from APEC 211,591 245,241 73.40% 74.00% 15.90%
PA from ASEAN-7 10,810 11,734 3.80% 3.50% 8.50% Source: CEAP-EAFIT estimations based on UNCTAD-COMTRADE data (2010).
From 2005-2009, ASEAN-7 countries exported an average of US$ 5,150.75 million to the
Pacific Alliance, while imports from this region accounted for US$ 2,478.28 million.
Mexico is the largest destination for ASEAN-7 exports with US$ 3,839.36 million,
followed by Chile US$ 611.51 million, Colombia US$ 432.24 million and Peru
US$ 267.64 million. ASEAN-7 exports to Mexico mainly come from Singapore, Malaysia

9
and Thailand. Thailand is the main exporter to Chile, Colombia and Peru. Mexico is the
main source of imports with US$ 1,233.66 million, followed by Chile US$ 896.29 million.
The main ASEAN-7 importers from PA are Singapore, Thailand and Malaysia. Brunei´s
trade with PA is fairly small (see table 3).
Table 3: Trade between ASEAN-7 and PA 2005-2009 (US$ millions)
Exports to Pacific
Alliance Chile Colombia Mexico Peru Total
ASEAN-7 611.51 432.24 3,839.36 267.64 5,150.75
Brunei Darussalam 0.03 0.01 0.15 0.01 0.20
Indonesia 139.41 97.82 353.25 41.08 631.56
Malaysia 82.00 61.58 1,120.52 57.24 1,321.34
Philippines 30.80 3.91 147.37 10.41 192.49
Singapore 65.61 51.30 1,178.46 25.04 1,320.41
Thailand 233.04 185.37 713.02 114.17 1,245.60
Vietnam 60.62 32.25 326.59 19.69 439.15
Imports from
Pacific Alliance Chile Colombia Mexico Peru Total
ASEAN-7 896.29 139.43 1,233.66 208.90 2,478.28
Brunei Darussalam - - 0.56 - 0.56
Indonesia 199.94 7.31 92.60 34.14 333.99
Malaysia 175.94 4.40 230.37 8.26 418.97
Philippines 57.59 8.04 53.06 33.80 152.49
Singapore 156.30 100.68 555.39 15.11 827.48
Thailand 206.10 14.97 250.06 65.46 536.59
Vietnam 100.42 4.03 51.62 52.13 208.20 Source: CEAP-EAFIT estimations based on UNCTAD-COMTRADE data (2010).
The main exporting sectors from ASEAN-7 to PA are: ITC with US$ 1,973.69 million,
followed by electronics US$ 592.03 million, the textile and garments with US$

10
457.08million, and the automobile sector with US$ 379.73 million. The main ASEAN-7
importing sectors from PA are: ITC with US$ 674.12 million, followed by agro-based
sector with US$ 234.71 million, electronics with US$ 137.82 million and the wood-based
sector with US$ 122.64 million (see table 4).
Table 4:ASEAN-7 and PA trade, average 2005-2009 (US$ millions)
ASEAN-7 exports
to PA by Sector
ASEAN-7 imports
from PA by Sector
Agro-based 138.96 234.71
Automobile 379.73 40.9
Electronics 592.03 137.82
Fisheries 47.03 97.18
Healthcare 75.56 31.35
ICTs 1,973.69 674.12
Rubber-based 230.25 4.43
Textile and Garments 457.08 26.8
Wood-based 69.19 122.64
Total 3,963.53 1,369.95 Source: CEAP-EAFIT estimations based on UNCTAD-COMTRADE data (2010).
These figures confirm the hypothesis that ASEAN-7 exports value added products to Latin
America, whereas the latter’s export basket is basically composed by raw materials, despite
the notable ITC trade.
The trade patterns between the two regions in the above-mentioned sectors are evidenced in
Table 5. Mexico is the main export destination for ASEAN-7 in almost all sectors. This
situation is to some extent explained due to the size of the Mexican economy vis-à-vis the
other members of the PA. In the automobile sector, the contributions of exports to PA are
very similar, being Chile and Colombia their main destinations.
As for ASEAN-7 imports from PA, Mexico is the most important partner in the automobile,
electronics, healthcare, ICT, rubber-based, and textile and garments sectors. Chile is the
11
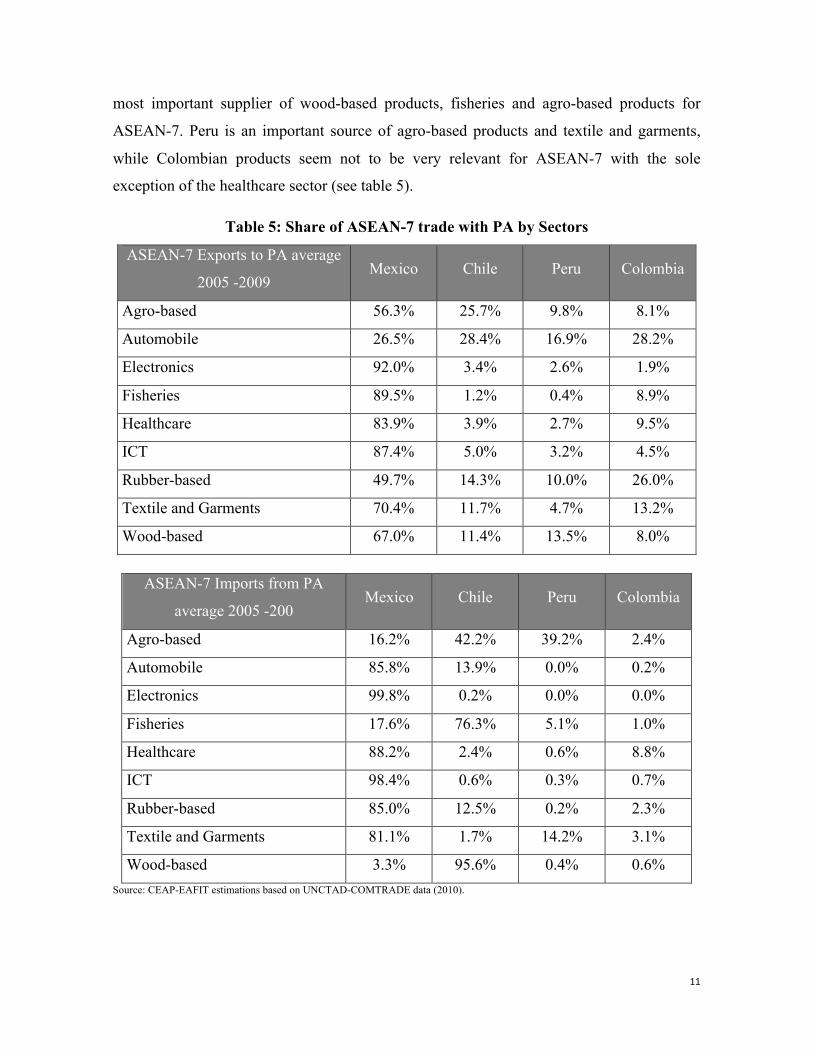
most important supplier of wood-based products, fisheries and agro-based products for
ASEAN-7. Peru is an important source of agro-based products and textile and garments,
while Colombian products seem not to be very relevant for ASEAN-7 with the sole
exception of the healthcare sector (see table 5).
Table 5: Share of ASEAN-7 trade with PA by Sectors
ASEAN-7 Exports to PA average
2005 -2009 Mexico Chile Peru Colombia
Agro-based 56.3% 25.7% 9.8% 8.1%
Automobile 26.5% 28.4% 16.9% 28.2%
Electronics 92.0% 3.4% 2.6% 1.9%
Fisheries 89.5% 1.2% 0.4% 8.9%
Healthcare 83.9% 3.9% 2.7% 9.5%
ICT 87.4% 5.0% 3.2% 4.5%
Rubber-based 49.7% 14.3% 10.0% 26.0%
Textile and Garments 70.4% 11.7% 4.7% 13.2%
Wood-based 67.0% 11.4% 13.5% 8.0%
ASEAN-7 Imports from PA
average 2005 -200 Mexico Chile Peru Colombia
Agro-based 16.2% 42.2% 39.2% 2.4%
Automobile 85.8% 13.9% 0.0% 0.2%
Electronics 99.8% 0.2% 0.0% 0.0%
Fisheries 17.6% 76.3% 5.1% 1.0%
Healthcare 88.2% 2.4% 0.6% 8.8%
ICT 98.4% 0.6% 0.3% 0.7%
Rubber-based 85.0% 12.5% 0.2% 2.3%
Textile and Garments 81.1% 1.7% 14.2% 3.1%
Wood-based 3.3% 95.6% 0.4% 0.6% Source: CEAP-EAFIT estimations based on UNCTAD-COMTRADE data (2010).
12
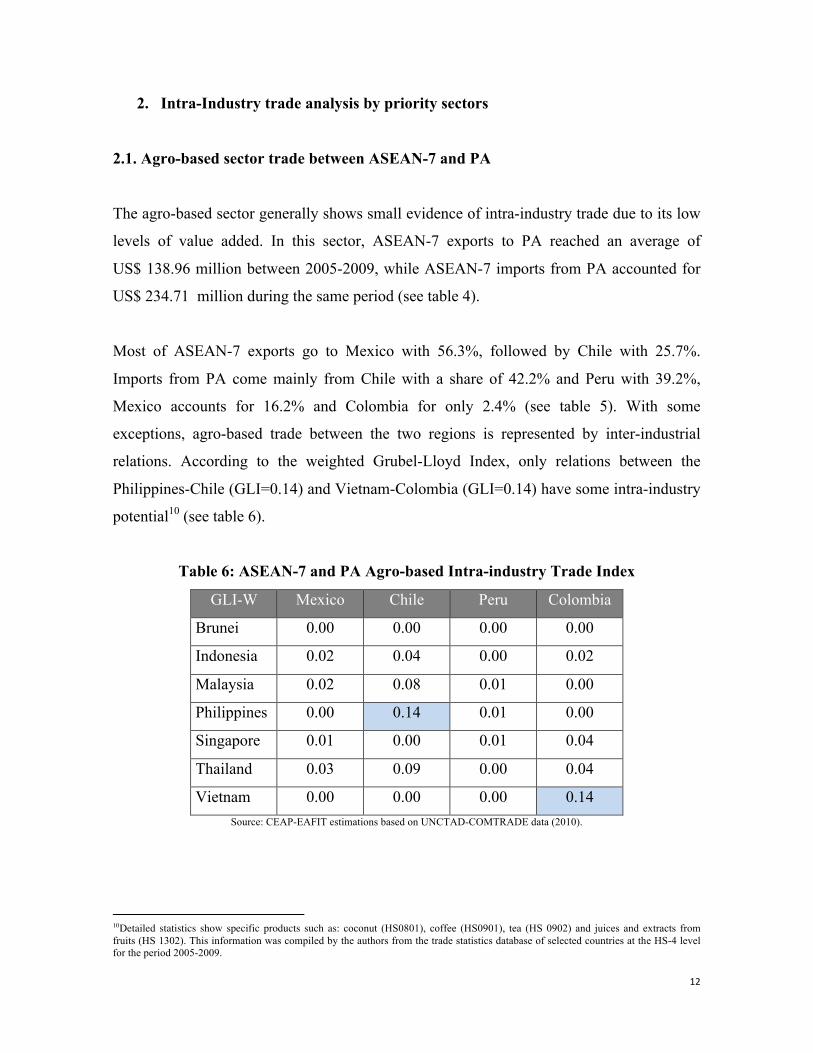
2. Intra-Industry trade analysis by priority sectors
2.1. Agro-based sector trade between ASEAN-7 and PA
The agro-based sector generally shows small evidence of intra-industry trade due to its low
levels of value added. In this sector, ASEAN-7 exports to PA reached an average of
US$ 138.96 million between 2005-2009, while ASEAN-7 imports from PA accounted for
US$ 234.71 million during the same period (see table 4).
Most of ASEAN-7 exports go to Mexico with 56.3%, followed by Chile with 25.7%.
Imports from PA come mainly from Chile with a share of 42.2% and Peru with 39.2%,
Mexico accounts for 16.2% and Colombia for only 2.4% (see table 5). With some
exceptions, agro-based trade between the two regions is represented by inter-industrial
relations. According to the weighted Grubel-Lloyd Index, only relations between the
Philippines-Chile (GLI=0.14) and Vietnam-Colombia (GLI=0.14) have some intra-industry
potential10 (see table 6).
Table 6: ASEAN-7 and PA Agro-based Intra-industry Trade Index
GLI-W Mexico Chile Peru Colombia
Brunei 0.00 0.00 0.00 0.00
Indonesia 0.02 0.04 0.00 0.02
Malaysia 0.02 0.08 0.01 0.00
Philippines 0.00 0.14 0.01 0.00
Singapore 0.01 0.00 0.01 0.04
Thailand 0.03 0.09 0.00 0.04
Vietnam 0.00 0.00 0.00 0.14 Source: CEAP-EAFIT estimations based on UNCTAD-COMTRADE data (2010).
10Detailed statistics show specific products such as: coconut (HS0801), coffee (HS0901), tea (HS 0902) and juices and extracts from fruits (HS 1302). This information was compiled by the authors from the trade statistics database of selected countries at the HS-4 level for the period 2005-2009.

13
2.2.Automobile sector trade between ASEAN- 7 and PA
In the automobile sector, the ASEAN-7 economies have an important trade surplus with PA
members. The ASEAN-7 automobile exports to PA averaged US$ 379.73 million between
2005-2009, while its imports from PA accounted for only for US$ 40.90 million. This
difference explains the low intra-industry levels (see tables 4).
The ASEAN-7 members mainly export to Chile 28.4%, Colombia 28.2%, Mexico 26.5%
and Peru trails behind with a share of 16.9%. Mexico, with 85.8%, is the main country of
origin for ASEAN-7 automobile imports within PA, followed by Chile with 13.9% (see
table 5).
Only the trade relation between Thailand-Mexico (GLI= 0.48) provides with evidence of
intra-industry trade. There is an intra-industry potential 11 between Philippines-Peru
(GLI=0.28) and Malaysia-Chile (GLI=0.20). In the remaining cases, trade between
ASEAN-7 and PA is inter-industry (See table 7).
Table 7: ASEAN-7 and PA Automobile Intra-industry Trade Index
GLI-W Mexico Chile Peru Colombia
Brunei 0.00 0.00 0.00 0.00
Indonesia 0.01 0.03 0.00 0.00
Malaysia 0.04 0.20 0.00 0.00
Philippines 0.01 0.00 0.28 0.09
Singapore 0.06 0.06 0.00 0.01
Thailand 0.48 0.00 0.00 0.00
Vietnam 0.00 0.00 0.00 0.00 Source: CEAP-EAFIT estimations based on UNCTAD-COMTRADE data (2010).
11 Products such as automobile parts (HS 8708) and (HS 8714).
14
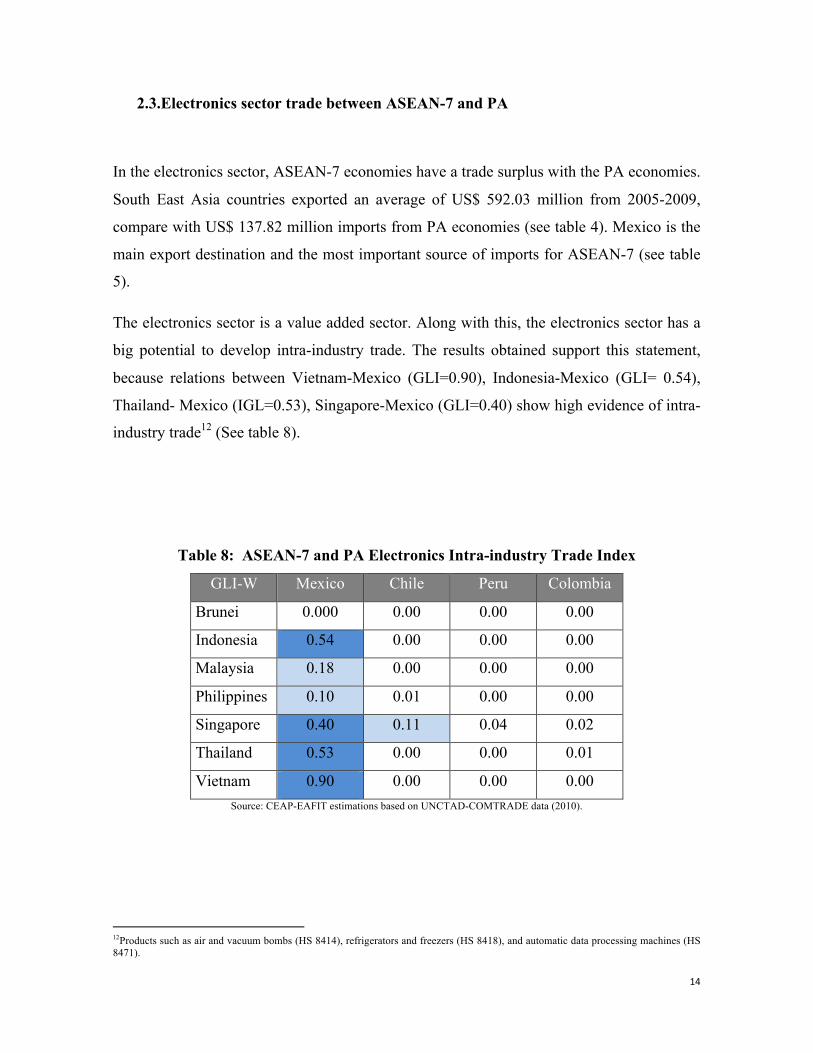
2.3.Electronics sector trade between ASEAN-7 and PA
In the electronics sector, ASEAN-7 economies have a trade surplus with the PA economies.
South East Asia countries exported an average of US$ 592.03 million from 2005-2009,
compare with US$ 137.82 million imports from PA economies (see table 4). Mexico is the
main export destination and the most important source of imports for ASEAN-7 (see table
5).
The electronics sector is a value added sector. Along with this, the electronics sector has a
big potential to develop intra-industry trade. The results obtained support this statement,
because relations between Vietnam-Mexico (GLI=0.90), Indonesia-Mexico (GLI= 0.54),
Thailand- Mexico (IGL=0.53), Singapore-Mexico (GLI=0.40) show high evidence of intra-
industry trade12 (See table 8).
Table 8: ASEAN-7 and PA Electronics Intra-industry Trade Index
GLI-W Mexico Chile Peru Colombia
Brunei 0.000 0.00 0.00 0.00
Indonesia 0.54 0.00 0.00 0.00
Malaysia 0.18 0.00 0.00 0.00
Philippines 0.10 0.01 0.00 0.00
Singapore 0.40 0.11 0.04 0.02
Thailand 0.53 0.00 0.00 0.01
Vietnam 0.90 0.00 0.00 0.00 Source: CEAP-EAFIT estimations based on UNCTAD-COMTRADE data (2010).
12Products such as air and vacuum bombs (HS 8414), refrigerators and freezers (HS 8418), and automatic data processing machines (HS 8471).
15
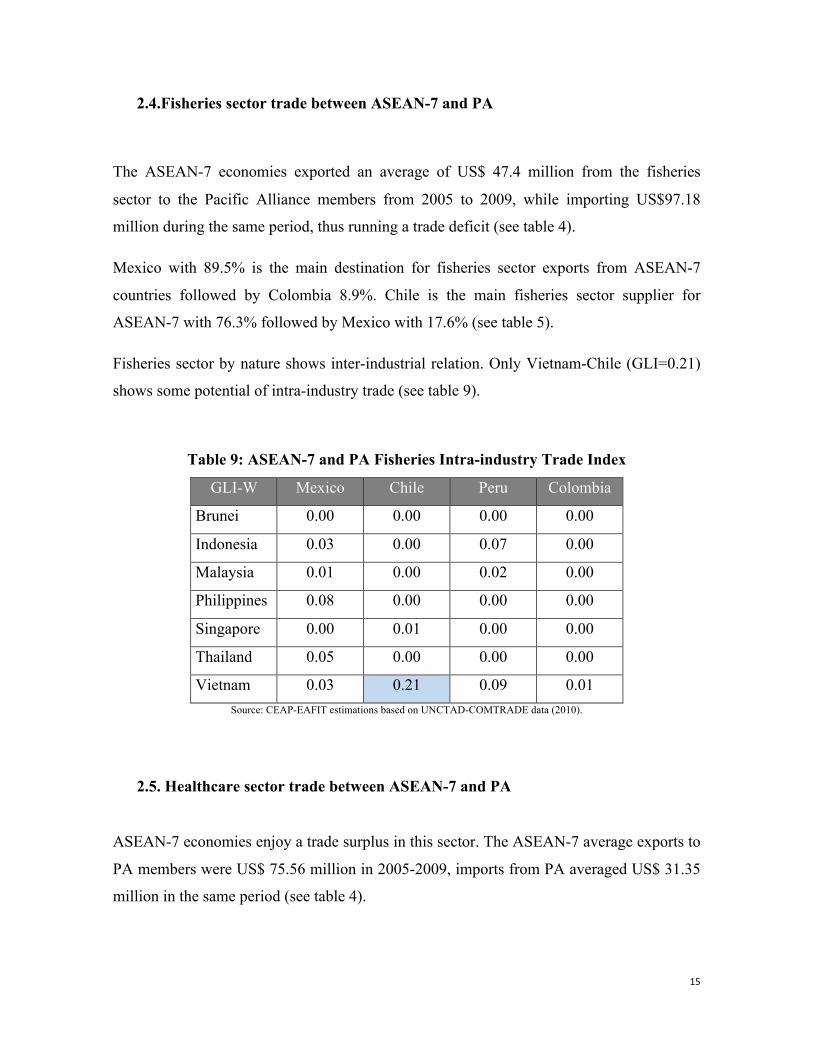
2.4.Fisheries sector trade between ASEAN-7 and PA
The ASEAN-7 economies exported an average of US$ 47.4 million from the fisheries
sector to the Pacific Alliance members from 2005 to 2009, while importing US$97.18
million during the same period, thus running a trade deficit (see table 4).
Mexico with 89.5% is the main destination for fisheries sector exports from ASEAN-7
countries followed by Colombia 8.9%. Chile is the main fisheries sector supplier for
ASEAN-7 with 76.3% followed by Mexico with 17.6% (see table 5).
Fisheries sector by nature shows inter-industrial relation. Only Vietnam-Chile (GLI=0.21)
shows some potential of intra-industry trade (see table 9).
Table 9: ASEAN-7 and PA Fisheries Intra-industry Trade Index
GLI-W Mexico Chile Peru Colombia
Brunei 0.00 0.00 0.00 0.00
Indonesia 0.03 0.00 0.07 0.00
Malaysia 0.01 0.00 0.02 0.00
Philippines 0.08 0.00 0.00 0.00
Singapore 0.00 0.01 0.00 0.00
Thailand 0.05 0.00 0.00 0.00
Vietnam 0.03 0.21 0.09 0.01 Source: CEAP-EAFIT estimations based on UNCTAD-COMTRADE data (2010).
2.5. Healthcare sector trade between ASEAN-7 and PA
ASEAN-7 economies enjoy a trade surplus in this sector. The ASEAN-7 average exports to
PA members were US$ 75.56 million in 2005-2009, imports from PA averaged US$ 31.35
million in the same period (see table 4).
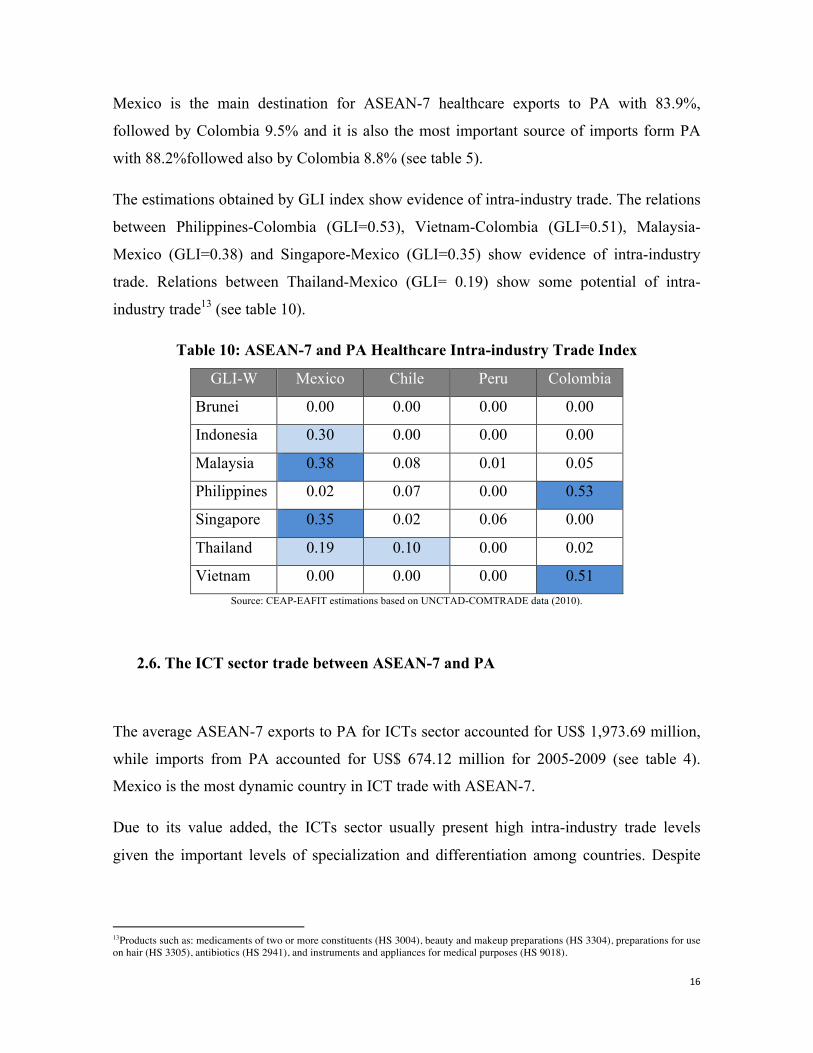
16
Mexico is the main destination for ASEAN-7 healthcare exports to PA with 83.9%,
followed by Colombia 9.5% and it is also the most important source of imports form PA
with 88.2%followed also by Colombia 8.8% (see table 5).
The estimations obtained by GLI index show evidence of intra-industry trade. The relations
between Philippines-Colombia (GLI=0.53), Vietnam-Colombia (GLI=0.51), Malaysia-
Mexico (GLI=0.38) and Singapore-Mexico (GLI=0.35) show evidence of intra-industry
trade. Relations between Thailand-Mexico (GLI= 0.19) show some potential of intra-
industry trade13 (see table 10).
Table 10: ASEAN-7 and PA Healthcare Intra-industry Trade Index
GLI-W Mexico Chile Peru Colombia
Brunei 0.00 0.00 0.00 0.00
Indonesia 0.30 0.00 0.00 0.00
Malaysia 0.38 0.08 0.01 0.05
Philippines 0.02 0.07 0.00 0.53
Singapore 0.35 0.02 0.06 0.00
Thailand 0.19 0.10 0.00 0.02
Vietnam 0.00 0.00 0.00 0.51 Source: CEAP-EAFIT estimations based on UNCTAD-COMTRADE data (2010).
2.6. The ICT sector trade between ASEAN-7 and PA
The average ASEAN-7 exports to PA for ICTs sector accounted for US$ 1,973.69 million,
while imports from PA accounted for US$ 674.12 million for 2005-2009 (see table 4).
Mexico is the most dynamic country in ICT trade with ASEAN-7.
Due to its value added, the ICTs sector usually present high intra-industry trade levels
given the important levels of specialization and differentiation among countries. Despite
13Products such as: medicaments of two or more constituents (HS 3004), beauty and makeup preparations (HS 3304), preparations for use on hair (HS 3305), antibiotics (HS 2941), and instruments and appliances for medical purposes (HS 9018).

17
this reasoning, the results obtained show that only trade between Singapore and Mexico
(GLI= 0.52) present evidence of intra-industry trade (see table 11).
Nevertheless, it is interesting to analyze the results and point out which relations have some
potential of intra-industry trade. For instance, Mexico has a huge potential of developing
intra-industry trade with different countries such as: Thailand-Mexico (GLI=0.27),
Malaysia-Mexico (GLI=0.22), Indonesia-Mexico (GLI=0.20), and the Philippines-Mexico
(GLI= 0.18)14 (see table 11).
Table 11: ASEAN-7 and PA ICTs Intra-industry Trade Index
GLI-W Mexico Chile Peru Colombia
Brunei 0.01 0.00 0.00 0.00
Indonesia 0.20 0.03 0.01 0.01
Malaysia 0.22 0.01 0.01 0.01
Philippines 0.18 0.06 0.07 0.02
Singapore 0.52 0.10 0.03 0.04
Thailand 0.27 0.04 0.00 0.03
Vietnam 0.01 0.01 0.00 0.00 Source: CEAP-EAFIT estimations based on UNCTAD-COMTRADE data (2010).
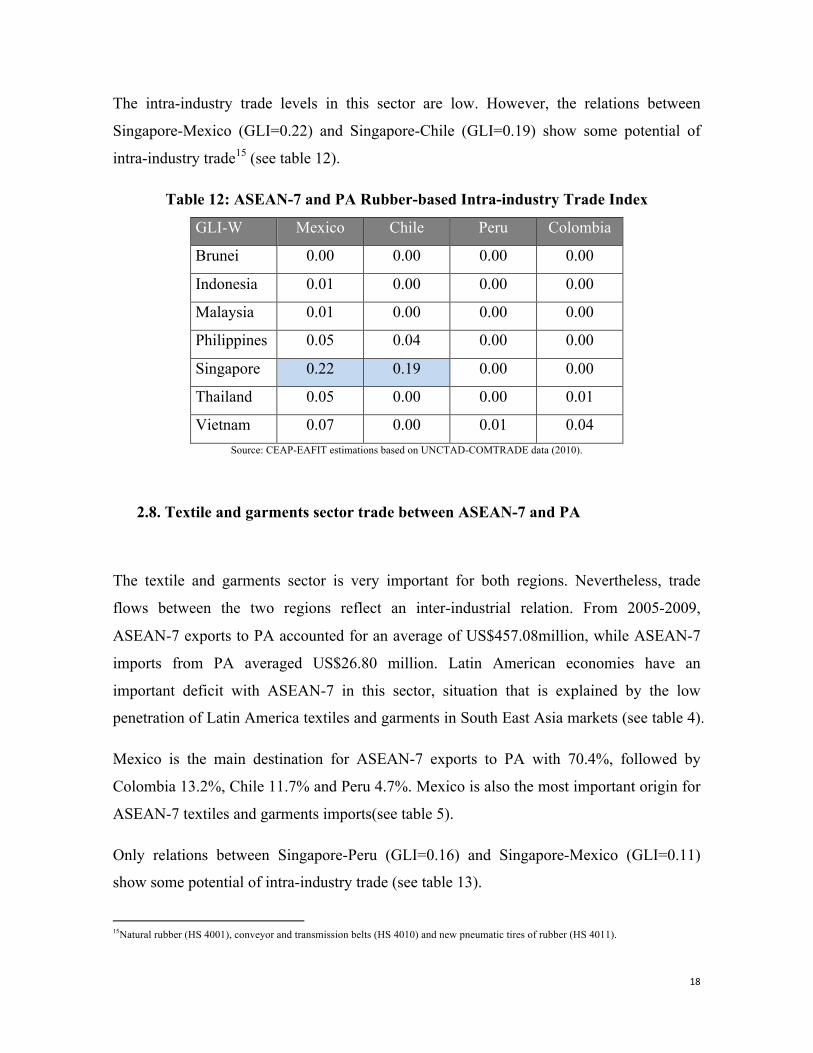
2.7.Rubber-based sector trade between ASEAN-7 and PA
Rubber-based ASEAN-7 exports to PA accounted for US$ 230.25 million, while imports
were US$ 4.43 million (see table 4). ASEAN-7 exports to PA go mainly to Mexico 49.7%,
Colombia 26.0%, Chile 14.3% and Peru10%. Mexico is the main supplier of Rubber-based
products for ASEAN-7 (see table 5).
14 Parts and accessories suitable for electrical machines (HS 8473), printed circuits (HS 8534), electronic integrated circuits (HS 8542), boards, panels and controls for electrical equipment (HS 8537), parts for televisions (HS 8529), printing machines and equipment (HS 8443).
18
The intra-industry trade levels in this sector are low. However, the relations between
Singapore-Mexico (GLI=0.22) and Singapore-Chile (GLI=0.19) show some potential of
intra-industry trade15 (see table 12).
Table 12: ASEAN-7 and PA Rubber-based Intra-industry Trade Index
GLI-W Mexico Chile Peru Colombia
Brunei 0.00 0.00 0.00 0.00
Indonesia 0.01 0.00 0.00 0.00
Malaysia 0.01 0.00 0.00 0.00
Philippines 0.05 0.04 0.00 0.00
Singapore 0.22 0.19 0.00 0.00
Thailand 0.05 0.00 0.00 0.01
Vietnam 0.07 0.00 0.01 0.04 Source: CEAP-EAFIT estimations based on UNCTAD-COMTRADE data (2010).
2.8. Textile and garments sector trade between ASEAN-7 and PA
The textile and garments sector is very important for both regions. Nevertheless, trade
flows between the two regions reflect an inter-industrial relation. From 2005-2009,
ASEAN-7 exports to PA accounted for an average of US$457.08million, while ASEAN-7
imports from PA averaged US$26.80 million. Latin American economies have an
important deficit with ASEAN-7 in this sector, situation that is explained by the low
penetration of Latin America textiles and garments in South East Asia markets (see table 4).
Mexico is the main destination for ASEAN-7 exports to PA with 70.4%, followed by
Colombia 13.2%, Chile 11.7% and Peru 4.7%. Mexico is also the most important origin for
ASEAN-7 textiles and garments imports(see table 5).
Only relations between Singapore-Peru (GLI=0.16) and Singapore-Mexico (GLI=0.11)
show some potential of intra-industry trade (see table 13).
15Natural rubber (HS 4001), conveyor and transmission belts (HS 4010) and new pneumatic tires of rubber (HS 4011).

19
Table 13: ASEAN-7 and PA Textiles and Garments Intra-industry Trade Index
GLI-W Mexico Chile Peru Colombia
Brunei 0.00 0.00 0.00 0.00
Indonesia 0.03 0.00 0.02 0.02
Malaysia 0.00 0.01 0.05 0.00
Philippines 0.00 0.00 0.01 0.03
Singapore 0.11 0.02 0.16 0.09
Thailand 0.04 0.00 0.08 0.01
Vietnam 0.01 0.00 0.00 0.00 Source: CEAP-EAFIT estimations based on UNCTAD-COMTRADE data (2010).
2.9. Wood-based sector trade between ASEAN-7 and PA
From 2005-2009ASEAN-7 exported an average of US$ 69.19 million to PA members
while importing US$ 122.64 million from the region. Hence, the accumulated trade deficit
with PA(see table 4).
Wood-based products from ASEAN-7 are mainly exported to Mexico 67%, followed by
Peru 13.5%; Chile 11.4% and Colombia 8%. ASEAN-7 main imports from PA come from
Chile 95.6% (see table 5).
Trade at the wood-based sector is predominantly inter-industrial. The results show that only
trade between Singapore-Mexico (GLI=0.27) has some potential for intra-industry
relations.16
16 Paper and paperboard labels (HS 4821); and paper, paperboard and other cellulose fibers (HS 4811).

20
Table 14: ASEAN-7 and PA Wood-based Intra-industry Trade Index
GLI-W Mexico Chile Peru Colombia
Brunei 0.00 0.00 0.00 0.00
Indonesia 0.00 0.00 0.00 0.00
Malaysia 0.01 0.01 0.00 0.03
Philippines 0.03 0.00 0.00 0.00
Singapore 0.27 0.00 0.04 0.00
Thailand 0.09 0.00 0.04 0.03
Vietnam 0.01 0.00 0.00 0.00 Source: CEAP-EAFIT estimations based on UNCTAD-COMTRADE data (20
21
Conclusions
Trade between the Pacific Alliance and ASEAN-7 members has been growing gradually for
the last five years. The evaluation of intra-industry trade among members of Pacific
Alliance and ASEAN-7 economies using the weighted Grubel-Lloyd Index for the nine
identified sectors, shows that trade relations between two regions are mostly inter-industrial.
However, there are some evidences of intra-industry trade, mainly in the electronics, ICT,
automobile, and healthcare sectors. As for the trade relations between the two regions,
Mexico is the most dynamic country among PA members, while Singapore is the most
vibrant country among ASEAN-7 members.
This is a standing point for the integration of Latin American products and manufactures to
ASEAN-7 production networks. As a result of the analysis, it is possible to highlight
Mexico’s particular relations with Indonesia, Singapore, Thailand and Vietnam in the
electronic sector; with Singapore in the ICT sector and with Thailand in the automobile
sector. The healthcare sector presents some interesting evidence of intra-industry trade for
Colombia with Philippines and Vietnam, while Mexico has an important relation with
Malaysia and Singapore.
The study also provides evidence of potential IIT in all nine sectors:1) in the agro-based
sector, the relations between Philippines-Chile and Vietnam-Colombia demonstrate
potential of intra-industry trade; 2) in automobile sector, there is a potential for Malaysia-
Chile and Philippines-Peru; 3) in the electronics, the relations between Malaysia-Mexico
and Singapore-Chile might become intra-industry as trade increases. 4) In the fisheries
sector, there is some potential for Vietnam-Chile. 5) In the healthcare sector, the trade
between Thailand and Mexico might tend to become intra-industry with the time. 6) In the
ICT sector it is important to mention the relations between Mexico and Thailand, Malaysia
and Indonesia because their potential to adopt an intra-industry trade in the near future.
7) In the rubber-based sector the potential exist in Singapore-Mexico and Singapore-Chile.
8) In the textile and garments sector there is some potential between Singapore-Peru and
22
Singapore-Mexico. 9) Finally, the wood-based sector provides with evidence of the
potential IIT between Singapore and Mexico.
The connection with ASEAN-7 seems to be a suitable beginning for PA to boost trade
relations with Asia. ASEAN is the most vigorous institution in Asia and it has already
defined trade linkages identifying nine particular sectors within the group. Those sectors
could be the first step to identify complementary elements for the integration of Latin
American products into the production networks in South East Asia.
The attainment of this potential requires that the Pacific Alliance goes beyond the political
agreement established among its members and materializes its ideals into concrete actions
in terms of economic development and trade liberalization. To achieve this goal, the region
must ensure that aspects such as the new government in Peru, the low popularity of the
current President in Chile, or the upcoming elections in Mexico do not become obstacles to
the integration. For its part, Colombia as an emerging market with an important growth
potential within this group must continue to overcome its security problems and need to
keep on with the development of its Asia Pacific strategy.

23
References
• ADB. (2009). “Comparative Perspectives on Trans-Pacific Trade, Integration, and
Development”. Manila, Philippines. ADB and IDB, November 2009.
• APEC Secretariat (2010). “Yokohama Leader’s Statement on 2010 Bogor Goals
Assessment”. Yokohama, Japan. 14 November 2010.
• Austria, M. (2004). “The Pattern of Intra-ASEAN Trade in the Priority Goods
Sectors”. Sydney, Australia. Policy Support Facility (REPSF) under the ASEAN-
Australia Development Cooperation Program.
• Balassa, B. (1963). “An Empirical Demonstration of Classical Comparative Cost
Theory”. Review of Economics and Statistics. Vol. 45: 231-238.
• Duran, J y Álvarez, A. (2008). “Indicadores de comercio exterior y política
comercial: medidores de posición y dinamismo comercial”. CEPAL, Santiago de
Chile.
• ECLAC. (2009). “El Arco del Pacífico Latinoamericano Después de la Crisis”.
Chile: ECLAC.
• ECLAC. (2010). “The People's Republic of China and Latin America and the
Caribbean: towards a strategic relationship”. Chile: ECLAC.
• Greenaway, D et al (1995). “Vertical and Horizontal Trade across industry
Analysis”. The Economic Journal. London, UK. Vol. 105. Pp. 1505 – 1518.
• Grubel, H and Lloyd, P. (1975). “The Intra-industry trade: Theory and
Measurement of International Trade in Differentiated products”. McMillan:
London.
• Kimura, F. and Ando, M. (2005). “The Economic Analysis of International
Production/Distribution Networks in East Asia and Latin America: The Implications
of Regional Trade Arrangements”. Business and Politic. San Francisco, United
States of America. Berkeley Economic Press. Vol. 7, No. 1. Article 2.
• Leontief, W. (1954), 'Input-output analysis and the general equilibrium theory', in T.
Barna (ed.), The Structural Interdependence of the Economy, New York, Wiley and
Sons.

24
• Moneta, C. (1995). “Comercio e integración intraindustrial en el Asia Pacífico:
perspectivas de vinculación con América Latina”. ISEAN, Ministerio de Relaciones
Exteriores, Comercio y Culto. República Argentina.
• Roldán, A.et al (2008).“Inserción de la República Popular China en el Nordeste
Asiático desde los años 1970: ¿Hacia un nuevo regionalismo?”. Cuadernos de
Investigación, Universidad EAFIT.
• Roldán, A. (2009),”El ASEAN y la integración regional en Asia Oriental” Global
Asia. Madrid, Spain. No. 8. July and August2009.
• Roldán, A. (2010), “Beneficios y retos de Colombia en APEC”. Centro de Estudios
Asia Pacífico, Universidad EAFIT y Ministerio de Relaciones Exteriores.
• Van Marrewijk, Charles (2009). “The Princeton Encyclopedia of the World
Economy”. Princeton, United States of America: Princeton. Vol. 2: 708 – 713.
• Wattanapruttipaisan, T. (2008) “Priority Integration Sectors in ASEAN: Supply-
side Implications and Options“. Asian Development Review, vol. 24, no. 2: 64−89.
• Wilhelm, M. (2010).“The Future of Global and Regional Cooperation: Looking
toward the G-20 and APEC. A Latin American Perspective”. Roundtable
Discussion: The Future of Global and Regional Cooperation: Looking toward the
G-20 and APEC.19th PECC General Meeting-PECC, Tokyo, October 20 -22, 2010.
• Verdoom, P. (1960). “The Intra-Block Trade in Benelux” in E.A.G. (ed.). Economic
Consequences of the Size of Nations. McMillan: London: 291-329.