promising credentials in hawaii final report 10.20.20
TRANSCRIPT

2
PROMISING CREDENTIALS IN HAWAI‘I
Final Report
October 2020
TABLE OF CONTENTS EXECUTIVE SUMMARY ............................................................................................................................. 3
OUR CHALLENGE ....................................................................................................................................... 3 OUR PROCESS ........................................................................................................................................... 3 OUR OPPORTUNITY .................................................................................................................................... 4 OUR CALL TO ACTION ................................................................................................................................. 4 ABOUT PROMISING CREDENTIALS PROJECT TEAM ........................................................................................ 5
PROMISING CREDENTIALS ...................................................................................................................... 6 INDUSTRY FEEDBACK KEY FINDINGS ................................................................................................. 11
INDUSTRY DEMAND FOR EMPLOYABILITY SKILLS IN ADDITION TO TECHNICAL SKILLS ..................................... 11 INDUSTRY IS WILLING TO SUPPORT TRAINING FOR EMPLOYEES .................................................................. 11 INDUSTRY DESIRE TO EXPAND WORK OPPORTUNITIES FOR STUDENTS ....................................................... 12 EMPLOYER IDENTIFIED OCCUPATIONS FOR WORKFORCE DEVELOPMENT ..................................................... 12 LACK OF AWARENESS REGARDING CAREER OPPORTUNITIES ...................................................................... 13 GROWING NEED FOR TECH AND CROSS SECTOR SKILLS ............................................................................ 13 COVID-19 RESPONSE AND IMPLICATIONS ................................................................................................. 13
RECOMMENDATIONS ............................................................................................................................. 15 APPENDIX A: TABLES FOR REFERENCE ............................................................................................. 17 APPENDIX B: METHODOLOGY .............................................................................................................. 32 APPENDIX C: SURVEY INSTRUMENT ................................................................................................... 39 APPENDIX D: FOCUS GROUP DISCUSSION QUESTIONS .................................................................. 44 APPENDIX E: DATA SOURCES .............................................................................................................. 45 APPENDIX F: GLOSSARY ....................................................................................................................... 46

3
EXECUTIVE SUMMARY Students in Hawai‘i can earn hundreds of industry-recognized credentials right now. Thousands of students are investing time and resources to achieve these credentials with the hope they will lead to a career that enables them to live and thrive in Hawai‘i. But how effective are these programs at preparing Hawai‘i students for future careers and long-term success? Promising Credentials in Hawai‘i, a first-of-its-kind analysis for our state, looks at whether the credentials students can earn actually matter in the real world to local employers. Our Challenge Identifying the right credentials to offer students matters now more than ever. Our state must make sure we are preparing students for jobs that are forecasted to increase in demand, pay a family sustaining wage, and have a promising career ladder. The number of households in our state classified as “asset limited, income constrained, and employed” (ALICE), or living at or below the poverty level, jumped from 42% in 2018 to 59% in June 20201. The need to connect students with credentials that matter and lead to career success has never been more urgent. It is estimated that more than 80% of good jobs today require a post-secondary credential2, either an industry-recognized credential, post-secondary certificate, Associate or Bachelor’s degree. Those with a high school diploma or less often face significant gaps in opportunity. That is why Hawai‘i has adopted a 55 by `25 goal to have 55% of adults earn a post-secondary credential or college degree by 20253. National data shows only 18% of credentials earned by K-12 students in the US hold real value to employers.4 How does Hawai‘i compare and what changes can we make to better match student preparation with workforce demand? Our Process Through intensive labor market analysis and outreach to local Hawai‘i businesses, this project has identified 137 Promising Credentials that are associated with in-demand, living wage occupations throughout the state. The process began with identifying 274 Promising Occupations that met wage and demand thresholds. A list of corresponding credentials for the 274 occupations was then compiled using job postings data. Finally, Hawai‘i employers from across the state completed surveys and participated in focus groups to assist in our understanding of local credential value and challenges. The combined analysis of the labor market data and outreach feedback helped narrow the list of nearly 2,000 credentials down to the 137 credentials that matter most when making hiring and promotion decisions.
4
Our Opportunity Ensuring that Hawai‘i residents are prepared for promising occupations across the state requires a combination of academic and technical preparation. To assist learners and educators in understanding both the academic and technical training needed for these occupations, the Promising Credentials list groups credentials into four broad categories associated with the typical entry level education that is most commonly requested alongside these technical credentials. Foundational credentials prepare learners with essential knowledge and skills for a range of priority occupations, including workplace safety. They are requested across a range of occupations and are often coupled with other credentials. Springboard credentials signal proficiency in industry-specific skills for priority occupations that often do not require a postsecondary certificate or degree. Door opener credentials signal proficiency in industry-specific skills for priority occupations that require some post-secondary education, including certificates and associate degrees. Advanced credentials signal proficiency in industry-specific skills for priority occupations that may also require a Bachelor’s degree. Within these broad organizational categories, we acknowledge that educational training may be more nuanced for specific occupations. Our Call to Action Having a list of credentials valued by Hawai‘i employers is just the beginning. The next phase of work will require a committed partnership between K-12, postsecondary, workforce development and industry leaders to take action. Education leaders, this report is a springboard for future analysis and discussion to shape our state’s educational offerings, so that curriculum and credentials align to workforce demand. We also have a great need for student-level data collection so we know which credentials are being attained and by whom so access to credentials can be equitable. Parents and students, we hope this report empowers you to use job demand and labor data to make smart career pathway decisions. Resource Sheets have been created for each Promising Credential and are available at www.HawaiiCareerPathways.org/promising-credentials. We hope you use these tools to take a deeper dive into credentials of interest and when choosing a career technical education (CTE) Program of Study. State leaders, equipped with this data can now focus CTE investments and consider ways to incentivize schools to provide training programs that lead to high value credential attainment.

5
Employers, continue to use attainment of these credentials as a proxy to validate that students have the skills you are looking for. Participate in the education experience by offering internships and other work-based learning activities. This research was collected in the midst of the COVID-19 pandemic and we have proactively adjusted our research framework to address the short- and long-term impacts on Hawai’i’s economy and the global economy. Though the results provide a framework to move forward today, the research should be updated regularly to account for the shifting workforce needs that affect credential demand. This Promising Credentials in Hawai‘i report provides a foundation for future work by our state’s leaders. Coupled with the Talent Roadmap to Support Economic Recovery in Hawai‘i5, we are now equipped with data and insights to hone in on industries, strategies and credentials that will enable us to fill Hawai‘i jobs with local, highly skilled workers for a more resilient economy About Promising Credentials Project Team Promising Credentials in Hawai‘i is a collaboration between Chamber of Commerce Hawai‘i, Harold K.L. Castle Foundation, Hawai‘i P-20 Partnerships for Education and Kamehameha Schools. This project has been advised by an Executive Advisory Committee comprised of Hawai‘i industry, public sector and philanthropy leaders. The project was also supported by a Department of Education CTE advisory group. Our consultant partners were Education Strategy Group (ESG), national leaders in the credential analysis process, and Hawai‘i-based SMS Research. Mahalo to our consultant partners for guiding the process.
1: Aloha United Way, ALICE Report 2020. 2: Georgetown Center on Education and the Workforce (2018). 3: 55 by 25, Hawai‘i P20 Partnership for Education. 4: Credentials Matter 2.0, ExcelinEd and Burning Glass Technologies. 5: Talent Roadmap for Recovery, Hawai‘i Executive Collaborative (2020).

6
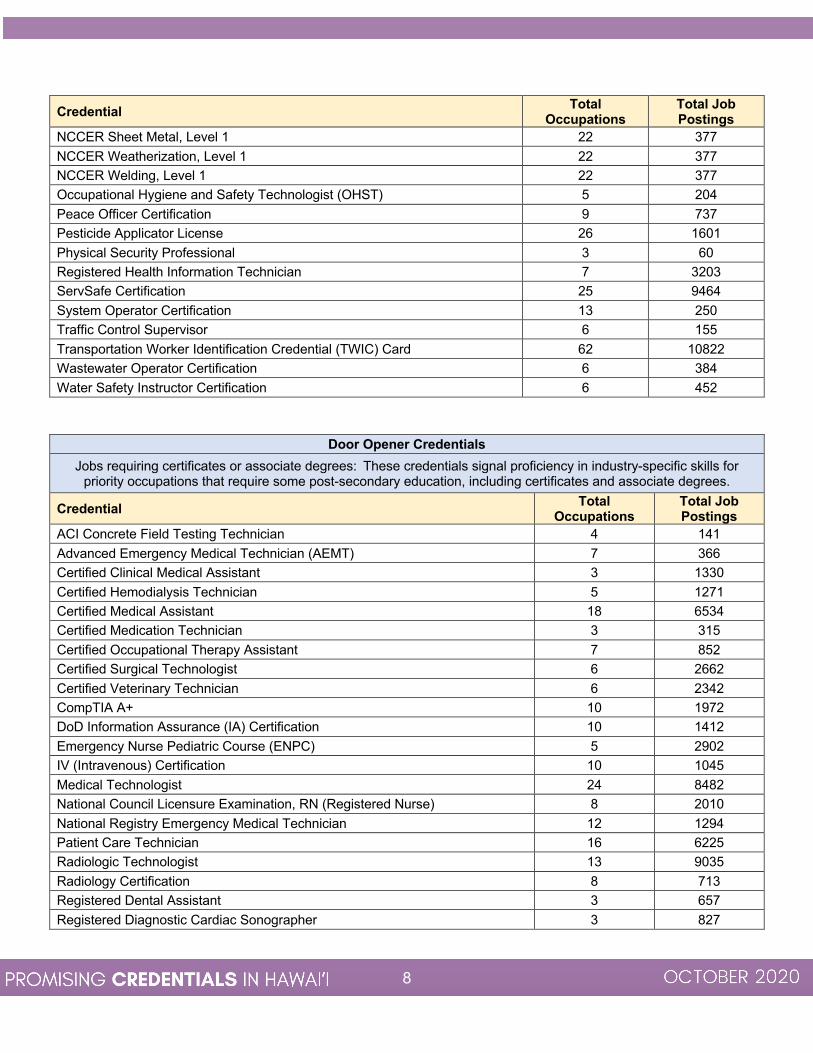
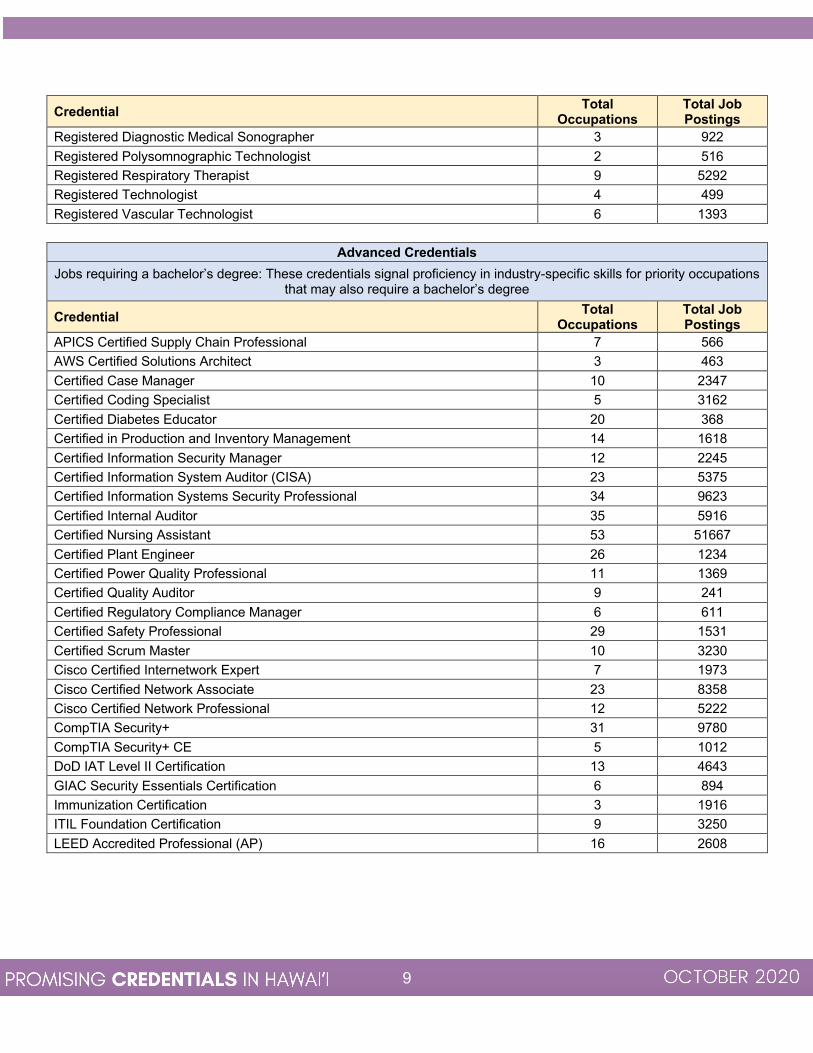
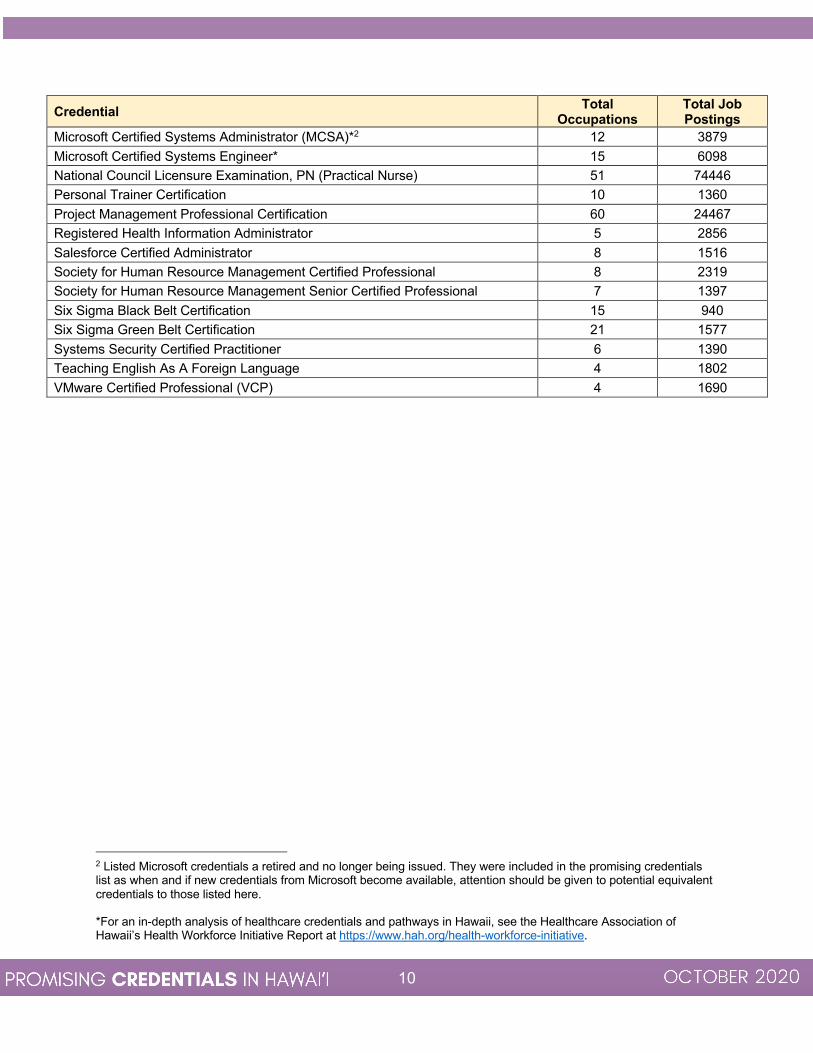
PROMISING CREDENTIALS The resulting list of credentials below was identified through labor market data analysis and employer feedback. Each credential is shown with the corresponding number of occupations and unduplicated count of annual job postings that referenced that credential. There are 137 credentials listed in total. Unique resource pages are available for all Promising Credentials at www.HawaiiCareerPathways.org/promising-credentials.1 Credentials are listed in four categories; foundational, springboard, door opener and advanced. These categories are based on the education level commonly associated with the occupations requesting or requiring that credential. Not all of the associated occupations fall into these education categories, but most.
Table 1. Promising Credentials, Total Occupations, and Job Postings Foundational Credentials
Cross-cutting knowledge and skills: These credentials prepare learners with essential knowledge and skills for a range of priority occupations across industries and are often coupled with other credentials.
Credential Total Occupations
Total Job Postings
Advanced Life Support 31 3219 Alcohol Certification 14 1507 Certified First Responder 51 2404 Food Safety Certification 25 3209 HAZWOPER Certification 16 346 Professional Rescuer CPR 4 90
Springboard Credentials
Jobs requiring a high school diploma: These credentials signal proficiency in industry-specific skills for priority occupations that do not require a postsecondary certificate or degree.
Credential Total Occupations
Total Job Postings
Airline Transport Pilot License 13 383 ASE A1 Engine Repair 32 28170 ASE A2 Automatic Transmission/Transaxle 32 28170 ASE A3 Manual Drive Train & Axles 32 28170 ASE A4 Suspension & Steering 32 28170
ASE A5 Brakes 32 28170 ASE A6 Electrical/Electronic Systems 32 28170 ASE A7 Heating & Air Conditioning 32 28170 ASE A8 Engine Performance 32 28170
1 There are 137 Promising Credentials and 112 credential resource sheets available. The number of resource sheets developed is slightly smaller due to the grouping of some credentials, such as ASE Type A and NCCER credentials. These credentials were grouped on the resource pages because they often had identical labor market data and similar references for additional information.

7
Credential Total Occupations
Total Job Postings
ASE A9 Light Vehicle Diesel Engines 32 28170 ASE Parts Specialist 32 28170 ASNT Non-Destructive Tester 10 242 Certified Arborist 14 381 Certified Flight Instructor 9 253 Certified Forklift Operator 71 6570 Certified Fraud Examiner 20 1694 Certified Payroll Professional 4 495 Certified Pharmacy Technician 18 17043 Certified Phlebotomy Technician 6 472 Certified Professional Coder 34 3451 Certified Registered Central Service Technician (CRCST) 3 1020 Certified Welding Inspector 11 346 Commercial Driver’s License (CDL) 145 285241 Commercial Pilot License 9 215 CompTIA Network+ 17 3442 Cosmetology License 9 1153 EPA 608 Universal Certification 31 4545 EPA Type II Certification 3 278 Flagger Certification 14 202 Food Handler's Card 37 7643 Food Protection Manager Certification 6 217 Food Safety Manager Certification 5 95 HVAC Certification 20 3715 Journeyman Electrician 13 800 Journeyman Lineman 8 850 Licensed Massage Therapist 3 561 NATE Certification (North American Technician Excellence) 5 659 National Apprenticeship Certificate 15 235 NCCER Carpentry, Level 1 22 377 NCCER Construction Technology 22 377 NCCER Core Curriculum 22 377 NCCER Electrical, Level 1 22 377 NCCER Electronic Systems Technician, Level 1 22 377 NCCER Industrial Maintenance Mechanic, Level 1 22 377 NCCER Instrumentation, Level 1 22 377 NCCER Masonry, Level 1 22 377 NCCER Millwright, Level 1 22 377 NCCER Painting/Commercial and Residential, Level 1 22 377 NCCER Pipefitting, Level 1 22 377 NCCER Plumbing, Level 1 22 377
8
Credential Total Occupations
Total Job Postings
NCCER Sheet Metal, Level 1 22 377 NCCER Weatherization, Level 1 22 377 NCCER Welding, Level 1 22 377 Occupational Hygiene and Safety Technologist (OHST) 5 204 Peace Officer Certification 9 737 Pesticide Applicator License 26 1601 Physical Security Professional 3 60 Registered Health Information Technician 7 3203 ServSafe Certification 25 9464 System Operator Certification 13 250 Traffic Control Supervisor 6 155 Transportation Worker Identification Credential (TWIC) Card 62 10822 Wastewater Operator Certification 6 384 Water Safety Instructor Certification 6 452
Door Opener Credentials Jobs requiring certificates or associate degrees: These credentials signal proficiency in industry-specific skills for
priority occupations that require some post-secondary education, including certificates and associate degrees.
Credential Total Occupations
Total Job Postings
ACI Concrete Field Testing Technician 4 141 Advanced Emergency Medical Technician (AEMT) 7 366 Certified Clinical Medical Assistant 3 1330 Certified Hemodialysis Technician 5 1271 Certified Medical Assistant 18 6534 Certified Medication Technician 3 315 Certified Occupational Therapy Assistant 7 852 Certified Surgical Technologist 6 2662 Certified Veterinary Technician 6 2342 CompTIA A+ 10 1972 DoD Information Assurance (IA) Certification 10 1412 Emergency Nurse Pediatric Course (ENPC) 5 2902 IV (Intravenous) Certification 10 1045 Medical Technologist 24 8482 National Council Licensure Examination, RN (Registered Nurse) 8 2010 National Registry Emergency Medical Technician 12 1294 Patient Care Technician 16 6225 Radiologic Technologist 13 9035 Radiology Certification 8 713 Registered Dental Assistant 3 657 Registered Diagnostic Cardiac Sonographer 3 827
9
Credential Total Occupations
Total Job Postings
Registered Diagnostic Medical Sonographer 3 922 Registered Polysomnographic Technologist 2 516 Registered Respiratory Therapist 9 5292 Registered Technologist 4 499 Registered Vascular Technologist 6 1393
Advanced Credentials
Jobs requiring a bachelor’s degree: These credentials signal proficiency in industry-specific skills for priority occupations that may also require a bachelor’s degree
Credential Total Occupations
Total Job Postings
APICS Certified Supply Chain Professional 7 566 AWS Certified Solutions Architect 3 463 Certified Case Manager 10 2347 Certified Coding Specialist 5 3162 Certified Diabetes Educator 20 368 Certified in Production and Inventory Management 14 1618 Certified Information Security Manager 12 2245 Certified Information System Auditor (CISA) 23 5375 Certified Information Systems Security Professional 34 9623 Certified Internal Auditor 35 5916 Certified Nursing Assistant 53 51667 Certified Plant Engineer 26 1234 Certified Power Quality Professional 11 1369 Certified Quality Auditor 9 241 Certified Regulatory Compliance Manager 6 611 Certified Safety Professional 29 1531 Certified Scrum Master 10 3230 Cisco Certified Internetwork Expert 7 1973 Cisco Certified Network Associate 23 8358 Cisco Certified Network Professional 12 5222 CompTIA Security+ 31 9780 CompTIA Security+ CE 5 1012 DoD IAT Level II Certification 13 4643 GIAC Security Essentials Certification 6 894 Immunization Certification 3 1916 ITIL Foundation Certification 9 3250 LEED Accredited Professional (AP) 16 2608
10
Credential Total Occupations
Total Job Postings
Microsoft Certified Systems Administrator (MCSA)*2 12 3879 Microsoft Certified Systems Engineer* 15 6098 National Council Licensure Examination, PN (Practical Nurse) 51 74446 Personal Trainer Certification 10 1360 Project Management Professional Certification 60 24467 Registered Health Information Administrator 5 2856 Salesforce Certified Administrator 8 1516 Society for Human Resource Management Certified Professional 8 2319 Society for Human Resource Management Senior Certified Professional 7 1397 Six Sigma Black Belt Certification 15 940 Six Sigma Green Belt Certification 21 1577 Systems Security Certified Practitioner 6 1390 Teaching English As A Foreign Language 4 1802 VMware Certified Professional (VCP) 4 1690
2 Listed Microsoft credentials a retired and no longer being issued. They were included in the promising credentials list as when and if new credentials from Microsoft become available, attention should be given to potential equivalent credentials to those listed here. *For an in-depth analysis of healthcare credentials and pathways in Hawaii, see the Healthcare Association of Hawaii’s Health Workforce Initiative Report at https://www.hah.org/health-workforce-initiative.

11
INDUSTRY FEEDBACK KEY FINDINGS Over a two-month period, there were a total of 177 survey responses from 93 different businesses and an additional 33 business executives participated in industry specific focus groups. The feedback received through industry surveys and focus groups had both multiple points of consensus and some distinct variations by industry. Included below are the combined results and key takeaways from an industry perspective. Industry Demand for Employability Skills in addition to Technical Skills Almost all employers stressed the importance of employability, “the attributes of a person that makes that person able to gain and maintain employment3.” Based on feedback these attributes include soft skills such as professional behavior, integrity, and initiative. Some employers mentioned even the basic ability to show up on time ready to work. Many considered technical skills a definite plus, but employers were willing to “up-skill” or “re-skill” new hires for entry level employment, but found certain qualities, including work ethic, teachability, and flexibility to be foundational requirements for a candidate to be successful in their organizations. Industry is Willing to Support Training for Employees Nearly 71% of employers surveyed reported providing training they considered necessary to employees once hired. Some of the training programs mentioned were general company trainings, but many also included trainings related to specific formal credentials. The most common training and certifications offered to employees by Hawai‘i employers are listed below. Many are considered foundational certifications.
1. Cardiopulmonary Resuscitation (CPR) / First Aid 2. OSHA / Safety Training 3. Basic Computer or Software Training 4. Chainsaw Safety 5. Commercial Driver License (CDL)
Industries with the highest rate of training support included Agriculture, Food, and Natural Resources, Law and Public Safety, and Manufacturing at more than 90 percent. Many of the certifications supported are foundational certifications that span many industries and are not considered highly technical or industry specific. This signals that these certifications may be valuable as a transferable and useful baseline for many occupations. However, since many employers are willing to offer these certifications to new employees, they are less likely to be a determining factor in employment.
3 Defined by Wikipedia.
12
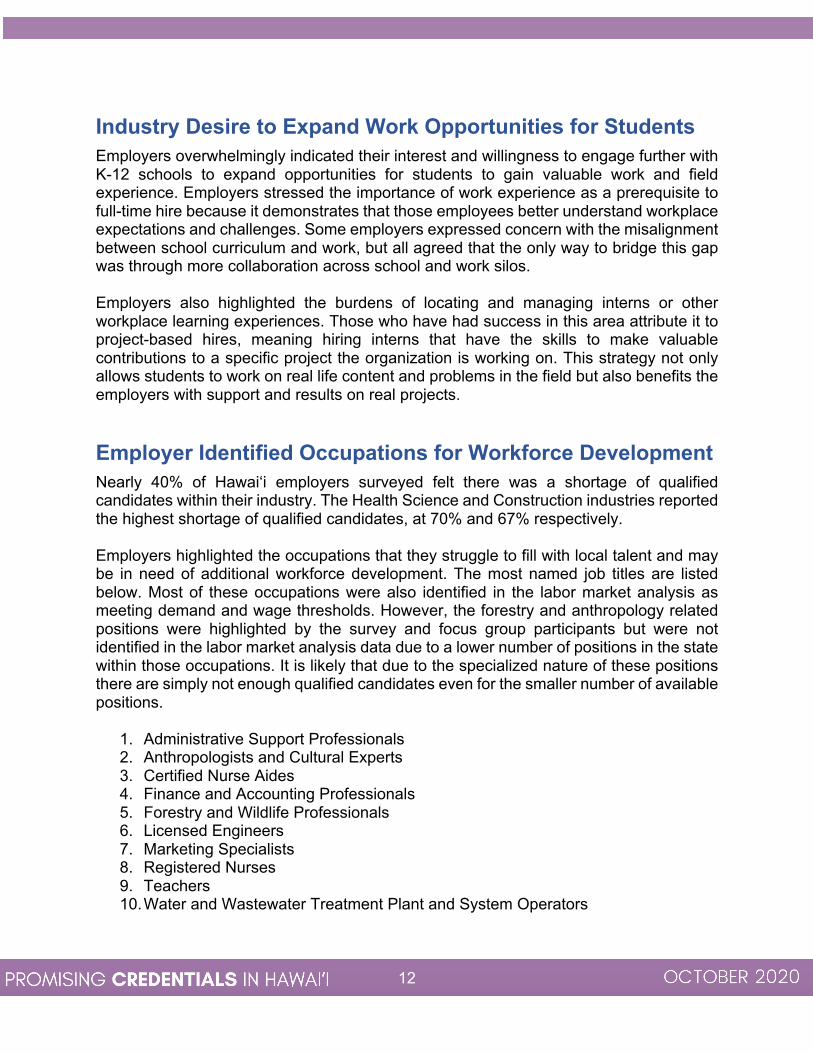
Industry Desire to Expand Work Opportunities for Students Employers overwhelmingly indicated their interest and willingness to engage further with K-12 schools to expand opportunities for students to gain valuable work and field experience. Employers stressed the importance of work experience as a prerequisite to full-time hire because it demonstrates that those employees better understand workplace expectations and challenges. Some employers expressed concern with the misalignment between school curriculum and work, but all agreed that the only way to bridge this gap was through more collaboration across school and work silos. Employers also highlighted the burdens of locating and managing interns or other workplace learning experiences. Those who have had success in this area attribute it to project-based hires, meaning hiring interns that have the skills to make valuable contributions to a specific project the organization is working on. This strategy not only allows students to work on real life content and problems in the field but also benefits the employers with support and results on real projects. Employer Identified Occupations for Workforce Development Nearly 40% of Hawai‘i employers surveyed felt there was a shortage of qualified candidates within their industry. The Health Science and Construction industries reported the highest shortage of qualified candidates, at 70% and 67% respectively. Employers highlighted the occupations that they struggle to fill with local talent and may be in need of additional workforce development. The most named job titles are listed below. Most of these occupations were also identified in the labor market analysis as meeting demand and wage thresholds. However, the forestry and anthropology related positions were highlighted by the survey and focus group participants but were not identified in the labor market analysis data due to a lower number of positions in the state within those occupations. It is likely that due to the specialized nature of these positions there are simply not enough qualified candidates even for the smaller number of available positions.
1. Administrative Support Professionals 2. Anthropologists and Cultural Experts 3. Certified Nurse Aides 4. Finance and Accounting Professionals 5. Forestry and Wildlife Professionals 6. Licensed Engineers 7. Marketing Specialists 8. Registered Nurses 9. Teachers 10. Water and Wastewater Treatment Plant and System Operators
13
Lack of Awareness regarding Career Opportunities Industry leaders consistently believe students and the wider community were unaware of career opportunities and pay levels within many of their fields. This was particularly true within trade and fieldwork industries including Construction, Transportation, Energy, and Agriculture. In Agriculture, for example, employers felt the community perception is that the only available career is “farmer.” However, beyond the farmer, available positions include executives, sales, distributors, agriculture tech specialists, accountants, and more. Industry members believe that a lack of interest in certain industries is due to potential employees not understanding what types of positions may be available, many of which pay very well. Growing Need for Tech and Cross Sector Skills The increasing role technology now plays in business across all industries is evident. All industries expressed technology skills as a growing requirement. Generally, most positions require basic computer skills, and this is likely to increase with many sectors planning on increased reliance on programs and applications to track clientele, sales, patients or other data. Industries reported there has been a growing need for broad cross sector skills or hybrid skillsets, meaning skills that employees demonstrate that can transfer between industries. This means skills such as client relations, communicating with executives, and successfully completing a sales call, were often equally as important as technical, lab, and field work when it came to climbing the ladder within an organization. This suggests that having well developed interpersonal skills to pair with technical expertise has become more relevant to employers. COVID-19 Response and Implications The COVID-19 pandemic impacted businesses both globally and locally. Many companies are pivoting and learning to survive in a “new normal”. Business leaders discussed the need for true innovation in times like these. As revenue sources dry up overnight, finding alternative markets to supplement their income through the pandemic has been key. It has been necessary for businesses to implement not only temporary but some potentially permanent changes. Businesses feel some hybrid form of home and office work will remain post COVID. While initial efforts included some growing pains, such as setting up work stations at home and working out technology kinks, many feel the transition to remote work has been successful. A challenge discussed was the lack of natural collaboration opportunities with co-workers when everyone is working remotely. Where you once discussed a project and found solutions in the office halls, collaboration must now be more intentional with fewer face-to-face interactions. The new reality of working from home has also led employers
14
to rely more on employee initiative. With no manager physically present to oversee work, employees must be able to stay on task and complete assignments with little to no oversight. This is leading to new metrics on productivity, with benchmarks based on deliverables rather than time in the office. Many business leaders discussed the potential opening of markets to Hawai‘i providers, most specifically in the tech and business sectors. With a global shift toward digital communications and remote platforms, contracting with partners overseas has become less of an obstacle and places Hawai‘i on more equal footing with competitors overseas who may be physically closer to clients and work opportunities. Many leaders felt this may lead to a permanent expansion of opportunities for Hawai‘i companies to access business across the globe that may have been previously unrealistic.

15
RECOMMENDATIONS
1. CONDUCT CREDENTIAL GAP ANALYSIS. Conduct a thorough analysis of credentials offered versus credentials valued by employers and adjust offerings as appropriate.
2. INCENTIVIZE CREDENTIAL ATTAINMENT IN SCHOOLS. Increase the number of students that can attain promising credentials by incentivizing schools and campuses to provide training programs and classes. The state should consider providing funding to schools and campuses for additional Career and Technical Education (CTE) program development and/or issuing bonuses to schools for every student certified.
3. ESTABLISH AND TRACK METRICS FOR CTE AND CREDENTIAL ATTAINMENT.
There is currently a lack of comprehensive data on the availability of certification programs statewide both within K-12 and post-secondary education. Improving data collection around credentialing, including credential enrollment, attainment, and career success post attainment, will be essential to track and make planning decisions as the relevance of credentials increases in the state.
4. ALIGN PROMISING CREDENTIALS WITH DOE PATHWAYS. Align and integrate the
Promising Credentials with DOE pathways so that more students complete credentials by graduation. Increasing credential integration into these programs will help standardize the pursuit of credentials and make attainment easier for students by taking much of the outside identification and logistical work.
5. INCREASED FOCUS ON EMPLOYABILITY SKILLS. Enhance focus in secondary schools on the development of employability skills that help increase employability and versatility in the workplace. Industry continued to highlight the demand for candidates with critical thinking and communication skills as well as strong work ethics.
6. SUPPORT PROFESSIONAL DEVELOPMENT (PD) FOR TEACHERS IN INDUSTRY
FOCUS AREAS. Support professional development for teachers in various industries to better support student learning in these content areas. Enabling teachers to pursue industry specific credentials themselves will better prepare them for supporting students through industry credentialing programs and exams.
7. BUILD A COALITION OF CTE PROGRAM LEADERS TO ENHANCE ALIGNMENT
WITHIN THE STATE. Build a coalition of secondary and post-secondary education leaders within the state to clarify the credential landscape within the state. Currently, there is a lack of clarity regarding availability and credential value for learners. Clear pathways and information sharing on the possibilities for students will assist families and counselors in education and career planning.

16
8. EXPAND PARTNERSHIP OPPORTUNITIES WITH INDUSTRY. Expand opportunities to include industry as part of the education experience including work-based learning, internships, job shadowing and career days. Industry highlighted the importance of work experience as well as an interest in increased involvement with students. Streamlining pathways for industry engagement will help increase partnerships and support additional opportunities for students. This work will also help increase student awareness of career opportunities within different fields of interest.
9. INDUSTRY OUTREACH AND EDUCATION. Increase industry education and awareness on nationally recognized credentials and those that will be incorporated into local education programs. This can be done through associations and conferences and will assist in developing more consistent understanding statewide of what credentials indicate about the candidate and will aid in increasing their recognition and value across the state.
10. INCREASED SUPPORT FOR HIGH DEMAND, LOW WAGE OCCUPATIONS. Develop
policies to support or subsidize increased wages for in demand positions that did not meet the wage thresholds for this project. Increasing funding for these positions will help prevent shortages in supply of workers in some of these essential occupations.
11. UPDATE PROMISING CREDENTIALS ANNUALLY. Develop a systematic process to
update this research to facilitate continued alignment between certification programs of focus and industry needs. Ensuring the continued industry relevance of credentials prioritized for workforce development is essential. In light of COVID-19 and the increasingly unstable short- and long-term economic forecast, an annual update is recommended.

17
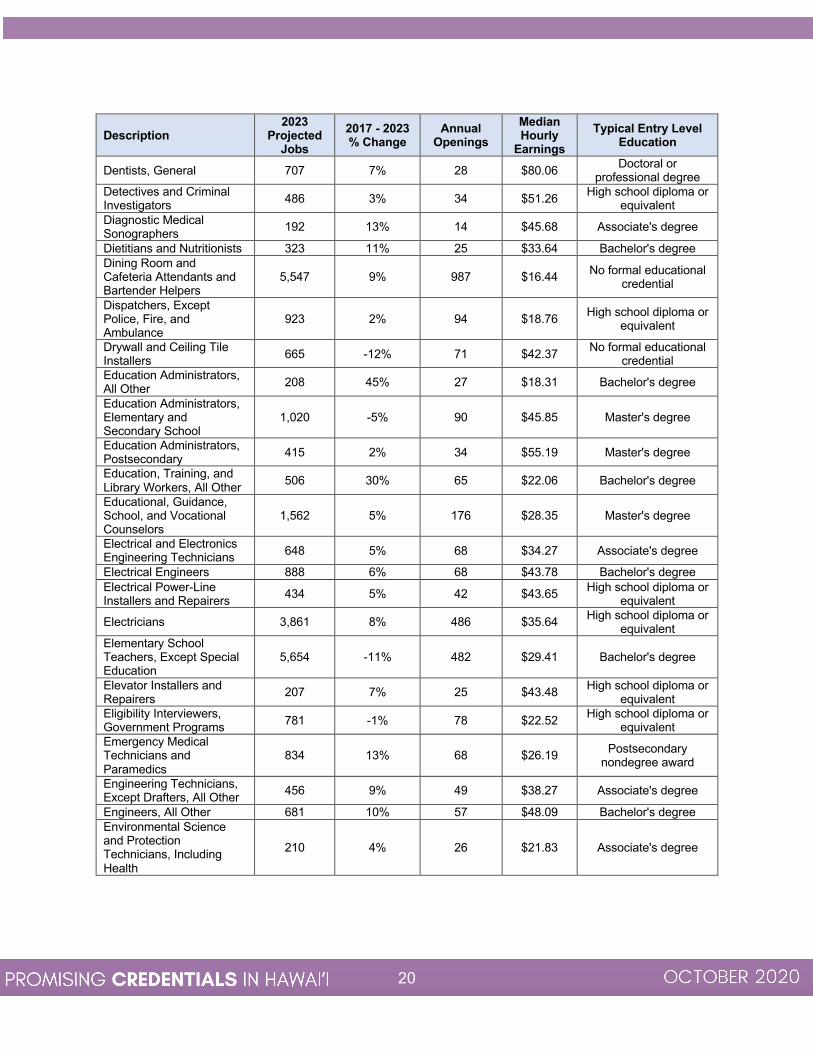
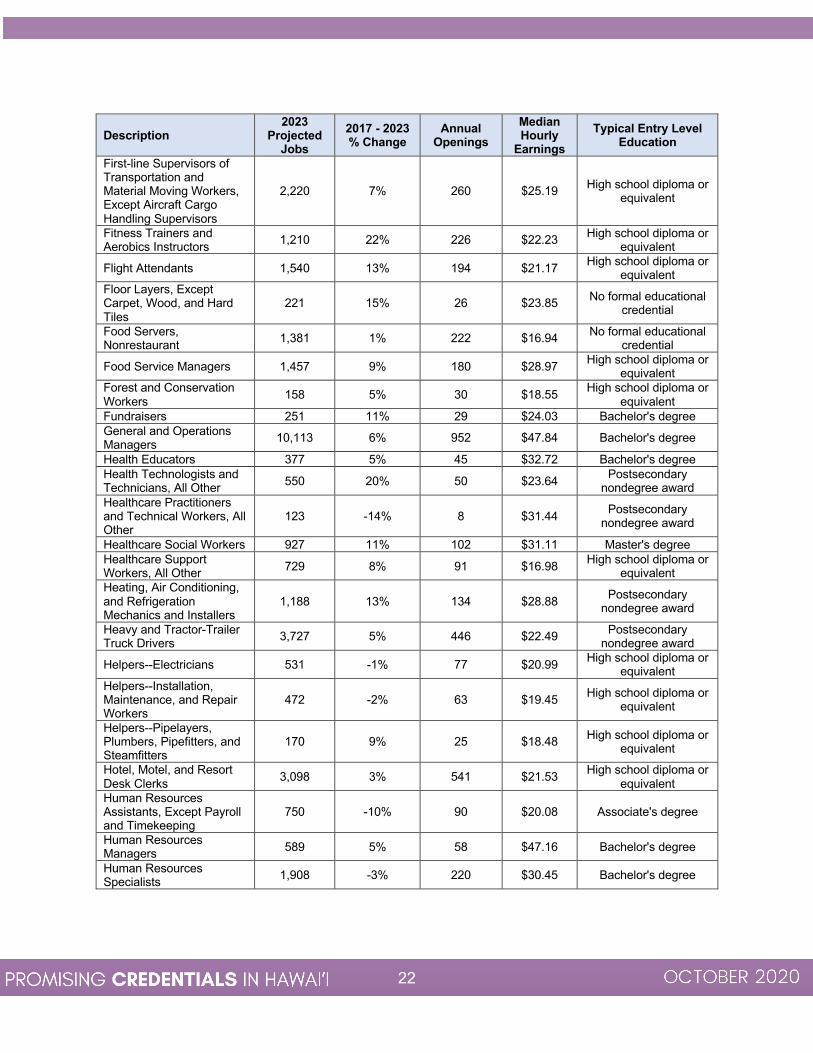
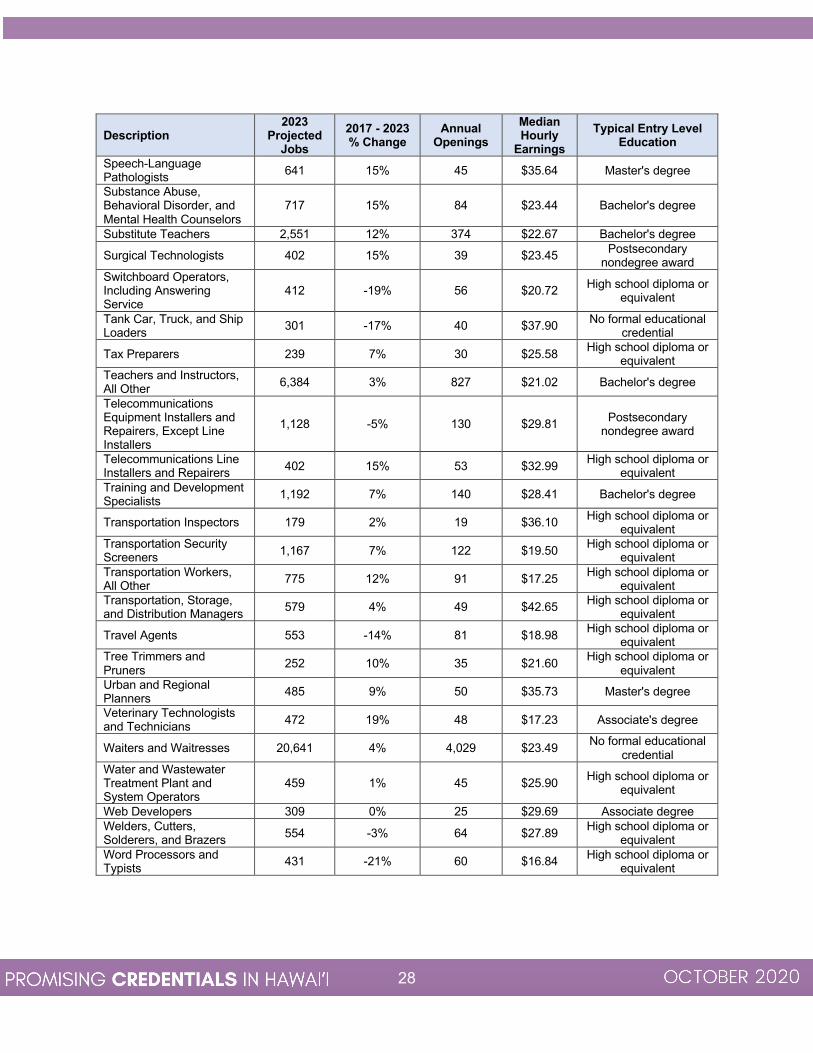
APPENDIX A: TABLES FOR REFERENCE Table 2 lists the occupations that met wage and demand thresholds that are considered promising occupations. The table includes projected job numbers and expected growth, as well as the number of annual job openings for those positions and their median hourly earnings in the state of Hawai‘i. The typical entry-level education for each occupation is pulled directly from the Bureau of Labor Statistics’ Education and Training Measurements for Workers 15 Years and Older by Detailed Occupation. These data come from a variety of sources, including the Census Bureau's American Community Survey, Occupational Information Network (ONET) and data on postsecondary completion from the National Center for Education Statistics. Entry-level education requirements represent national trends and are not Hawai‘i-specific. Employers in Hawai‘i may prefer more or less education than is captured in the federal data. For the purposes of the Promising Credentials list, these education levels are used to help organize credentials, but do not impact whether credentials are added or removed from the list itself.
Table 2: Promising Occupations Identified in Labor Market Analysis
Description 2023
Projected Jobs
2017 - 2023 % Change
Annual Openings
Median Hourly
Earnings Typical Entry Level
Education Accountants and Auditors 5,079 2% 489 $29.47 Bachelor's degree Administrative Services Managers 1,369 4% 120 $45.65 Bachelor's degree
Advertising Sales Agents 365 -7% 53 $27.74 High school diploma or equivalent
Agricultural Equipment Operators 290 8% 52 $21.27 No formal educational
credential Agricultural Workers, All Other 477 1% 87 $21.24 No formal educational
credential Air Traffic Controllers 302 2% 30 $49.70 Associate's degree Aircraft Mechanics and Service Technicians 1,561 7% 143 $30.64 Postsecondary
nondegree award Airfield Operations Specialists 641 15% 72 $23.50 High school diploma or
equivalent Airline Pilots, Copilots, and Flight Engineers 1,169 8% 132 $82.62 Bachelor's degree
Architects, Except Landscape and Naval 757 1% 61 $36.49 Bachelor's degree
Architectural and Civil Drafters 534 3% 58 $25.37 Associate's degree
Architectural and Engineering Managers 838 8% 70 $61.86 Bachelor's degree
Assemblers and Fabricators, All Other, Including Team Assemblers
566 -10% 72 $15.92 High school diploma or equivalent
Audio and Video Equipment Technicians 455 10% 56 $25.63 Postsecondary
nondegree award

18
Description 2023
Projected Jobs
2017 - 2023 % Change
Annual Openings
Median Hourly
Earnings Typical Entry Level
Education Automotive Body and Related Repairers 671 11% 72 $24.62 High school diploma or
equivalent Automotive Service Technicians and Mechanics
2,656 4% 273 $21.95 Postsecondary nondegree award
Bartenders 3,771 6% 683 $26.19 No formal educational credential
Bill and Account Collectors 512 -17% 66 $20.03 High school diploma or equivalent
Billing and Posting Clerks 1,282 4% 148 $19.76 High school diploma or equivalent
Biological Scientists, All Other 345 8% 36 $38.62 Bachelor's degree
Biological Technicians 615 8% 71 $16.11 Bachelor's degree Bookkeeping, Accounting, and Auditing Clerks 6,278 -3% 751 $19.27 Some college, no
degree Bus and Truck Mechanics and Diesel Engine Specialists
870 6% 87 $28.09 High school diploma or equivalent
Bus Drivers, School or Special Client 1,130 -5% 156 $18.46 High school diploma or
equivalent Bus Drivers, Transit and Intercity 2,408 -5% 310 $22.12 High school diploma or
equivalent Business Operations Specialists, All Other 5,143 9% 550 $34.25 Bachelor's degree
Butchers and Meat Cutters 745 14% 102 $20.43 No formal educational credential
Buyers and Purchasing Agents 1,706 -4% 172 $26.94 Bachelor's degree
Captains, Mates, and Pilots of Water Vessels 1,328 -5% 135 $24.52 Postsecondary
nondegree award Career/Technical Education Teachers, Secondary School
1,337 -1% 127 $19.64 Bachelor's degree
Carpenters 5,856 4% 634 $35.39 High school diploma or equivalent
Cement Masons and Concrete Finishers 902 6% 102 $37.69 No formal educational
credential
Chefs and Head Cooks 1,150 3% 158 $30.68 High school diploma or equivalent
Chemical Equipment Operators and Tenders 130 91% 24 $32.10 High school diploma or
equivalent Chief Executives 1,013 -11% 76 $91.31 Bachelor's degree Child, Family, and School Social Workers 1,833 2% 187 $26.84 Bachelor's degree
Civil Engineers 2,184 9% 194 $40.20 Bachelor's degree Claims Adjusters, Examiners, and Investigators
831 3% 74 $29.03 High school diploma or equivalent
Clergy 516 4% 60 $19.69 Bachelor's degree Clinical Laboratory Technologists and Technicians
1,487 6% 117 $27.69 Bachelor's degree
Clinical, Counseling, and School Psychologists 493 14% 43 $37.71 Doctoral or
professional degree Coaches and Scouts 1,165 7% 177 $17.21 Bachelor's degree

19
Description 2023
Projected Jobs
2017 - 2023 % Change
Annual Openings
Median Hourly
Earnings Typical Entry Level
Education
Commercial Pilots 381 12% 45 $41.39 High school diploma or equivalent
Community and Social Service Specialists, All Other
892 1% 105 $27.09 Bachelor's degree
Community Health Workers 560 12% 71 $20.49 High school diploma or
equivalent Compensation, Benefits, and Job Analysis Specialists
270 6% 28 $28.68 Bachelor's degree
Compliance Officers 1,729 7% 167 $33.05 Bachelor's degree Computer and Information Systems Managers 890 9% 81 $56.81 Bachelor's degree
Computer Network Support Specialists 692 -7% 59 $29.09 Associate's degree
Computer Occupations, All Other 1,607 5% 128 $44.92 Bachelor's degree
Computer Systems Analysts 1,543 2% 121 $36.82 Bachelor's degree
Computer User Support Specialists 1,263 4% 113 $22.10 Some college, no
degree Computer, Automated Teller, and Office Machine Repairers
477 0% 57 $20.58 Some college, no degree
Concierges 1,167 1% 171 $19.88 High school diploma or equivalent
Construction and Building Inspectors 804 9% 108 $30.82 High school diploma or
equivalent
Construction Laborers 5,415 7% 638 $28.47 No formal educational credential
Construction Managers 2,025 11% 173 $48.08 Bachelor's degree
Cooks, All Other 463 21% 77 $17.04 No formal educational credential
Cooks, Institution and Cafeteria 1,419 4% 207 $18.03 No formal educational
credential Correctional Officers and Jailers 1,546 -6% 141 $28.20 High school diploma or
equivalent Cost Estimators 988 3% 105 $38.41 Bachelor's degree Court, Municipal, and License Clerks 827 9% 86 $21.14 High school diploma or
equivalent Crane and Tower Operators 128 10% 17 $41.46 High school diploma or
equivalent Customer Service Representatives 8,120 3% 1,147 $17.33 High school diploma or
equivalent
Dancers 394 -4% 77 $17.67 No formal educational credential
Dental Assistants 1,718 6% 203 $18.16 Postsecondary nondegree award
Dental Hygienists 991 8% 76 $36.86 Associate's degree
20
Description 2023
Projected Jobs
2017 - 2023 % Change
Annual Openings
Median Hourly
Earnings Typical Entry Level
Education
Dentists, General 707 7% 28 $80.06 Doctoral or professional degree
Detectives and Criminal Investigators 486 3% 34 $51.26 High school diploma or
equivalent Diagnostic Medical Sonographers 192 13% 14 $45.68 Associate's degree
Dietitians and Nutritionists 323 11% 25 $33.64 Bachelor's degree Dining Room and Cafeteria Attendants and Bartender Helpers
5,547 9% 987 $16.44 No formal educational credential
Dispatchers, Except Police, Fire, and Ambulance
923 2% 94 $18.76 High school diploma or equivalent
Drywall and Ceiling Tile Installers 665 -12% 71 $42.37 No formal educational
credential Education Administrators, All Other 208 45% 27 $18.31 Bachelor's degree
Education Administrators, Elementary and Secondary School
1,020 -5% 90 $45.85 Master's degree
Education Administrators, Postsecondary 415 2% 34 $55.19 Master's degree
Education, Training, and Library Workers, All Other 506 30% 65 $22.06 Bachelor's degree
Educational, Guidance, School, and Vocational Counselors
1,562 5% 176 $28.35 Master's degree
Electrical and Electronics Engineering Technicians 648 5% 68 $34.27 Associate's degree
Electrical Engineers 888 6% 68 $43.78 Bachelor's degree Electrical Power-Line Installers and Repairers 434 5% 42 $43.65 High school diploma or
equivalent
Electricians 3,861 8% 486 $35.64 High school diploma or equivalent
Elementary School Teachers, Except Special Education
5,654 -11% 482 $29.41 Bachelor's degree
Elevator Installers and Repairers 207 7% 25 $43.48 High school diploma or
equivalent Eligibility Interviewers, Government Programs 781 -1% 78 $22.52 High school diploma or
equivalent Emergency Medical Technicians and Paramedics
834 13% 68 $26.19 Postsecondary nondegree award
Engineering Technicians, Except Drafters, All Other 456 9% 49 $38.27 Associate's degree
Engineers, All Other 681 10% 57 $48.09 Bachelor's degree Environmental Science and Protection Technicians, Including Health
210 4% 26 $21.83 Associate's degree

21
Description 2023
Projected Jobs
2017 - 2023 % Change
Annual Openings
Median Hourly
Earnings Typical Entry Level
Education Environmental Scientists and Specialists, Including Health
691 3% 77 $32.46 Bachelor's degree
Executive Secretaries and Executive Administrative Assistants
2,647 -14% 320 $27.56 High school diploma or equivalent
Farmers, Ranchers, and Other Agricultural Managers
921 -2% 101 $60.94 High school diploma or equivalent
File Clerks 543 -20% 73 $15.62 High school diploma or equivalent
Financial Analysts 684 11% 68 $36.47 Bachelor's degree Financial Managers 2,808 12% 257 $51.91 Bachelor's degree Financial Specialists, All Other 799 6% 75 $36.96 Bachelor's degree
Firefighters 1,786 4% 130 $29.05 Postsecondary nondegree award
First-Line Supervisors of Construction Trades and Extraction Workers
3,165 12% 368 $39.62 High school diploma or equivalent
First-Line Supervisors of Farming, Fishing, and Forestry Workers
260 15% 46 $26.89 High school diploma or equivalent
First-Line Supervisors of Fire Fighting and Prevention Workers
453 14% 37 $44.44 Postsecondary nondegree award
First-Line Supervisors of Food Preparation and Serving Workers
6,351 11% 1,024 $19.43 High school diploma or equivalent
First-Line Supervisors of Housekeeping and Janitorial Workers
1,689 4% 200 $22.16 High school diploma or equivalent
First-Line Supervisors of Landscaping, Lawn Service, and Groundskeeping Workers
675 4% 78 $26.91 High school diploma or equivalent
First-Line Supervisors of Mechanics, Installers, and Repairers
2,845 3% 275 $36.20 High school diploma or equivalent
First-Line Supervisors of Non-Retail Sales Workers 1,113 -4% 111 $32.24 High school diploma or
equivalent First-Line Supervisors of Office and Administrative Support Workers
7,596 1% 825 $27.10 High school diploma or equivalent
First-Line Supervisors of Personal Service Workers 1,437 14% 162 $22.35 High school diploma or
equivalent First-Line Supervisors of Police and Detectives 634 10% 48 $54.56 High school diploma or
equivalent First-Line Supervisors of Production and Operating Workers
1,402 1% 149 $28.75 High school diploma or equivalent
First-Line Supervisors of Protective Service Workers, All Other
736 4% 75 $24.00 High school diploma or equivalent
First-Line Supervisors of Retail Sales Workers 7,472 0% 836 $19.86 High school diploma or
equivalent
22
Description 2023
Projected Jobs
2017 - 2023 % Change
Annual Openings
Median Hourly
Earnings Typical Entry Level
Education First-line Supervisors of Transportation and Material Moving Workers, Except Aircraft Cargo Handling Supervisors
2,220 7% 260 $25.19 High school diploma or equivalent
Fitness Trainers and Aerobics Instructors 1,210 22% 226 $22.23 High school diploma or
equivalent
Flight Attendants 1,540 13% 194 $21.17 High school diploma or equivalent
Floor Layers, Except Carpet, Wood, and Hard Tiles
221 15% 26 $23.85 No formal educational credential
Food Servers, Nonrestaurant 1,381 1% 222 $16.94 No formal educational
credential
Food Service Managers 1,457 9% 180 $28.97 High school diploma or equivalent
Forest and Conservation Workers 158 5% 30 $18.55 High school diploma or
equivalent Fundraisers 251 11% 29 $24.03 Bachelor's degree General and Operations Managers 10,113 6% 952 $47.84 Bachelor's degree
Health Educators 377 5% 45 $32.72 Bachelor's degree Health Technologists and Technicians, All Other 550 20% 50 $23.64 Postsecondary
nondegree award Healthcare Practitioners and Technical Workers, All Other
123 -14% 8 $31.44 Postsecondary nondegree award
Healthcare Social Workers 927 11% 102 $31.11 Master's degree Healthcare Support Workers, All Other 729 8% 91 $16.98 High school diploma or
equivalent Heating, Air Conditioning, and Refrigeration Mechanics and Installers
1,188 13% 134 $28.88 Postsecondary nondegree award
Heavy and Tractor-Trailer Truck Drivers 3,727 5% 446 $22.49 Postsecondary
nondegree award
Helpers--Electricians 531 -1% 77 $20.99 High school diploma or equivalent
Helpers--Installation, Maintenance, and Repair Workers
472 -2% 63 $19.45 High school diploma or equivalent
Helpers--Pipelayers, Plumbers, Pipefitters, and Steamfitters
170 9% 25 $18.48 High school diploma or equivalent
Hotel, Motel, and Resort Desk Clerks 3,098 3% 541 $21.53 High school diploma or
equivalent Human Resources Assistants, Except Payroll and Timekeeping
750 -10% 90 $20.08 Associate's degree
Human Resources Managers 589 5% 58 $47.16 Bachelor's degree
Human Resources Specialists 1,908 -3% 220 $30.45 Bachelor's degree

23
Description 2023
Projected Jobs
2017 - 2023 % Change
Annual Openings
Median Hourly
Earnings Typical Entry Level
Education Industrial Machinery Mechanics 704 2% 70 $32.22 High school diploma or
equivalent Industrial Truck and Tractor Operators 943 10% 117 $21.86 No formal educational
credential Information and Record Clerks, All Other 1,157 -3% 140 $21.42 High school diploma or
equivalent Installation, Maintenance, and Repair Workers, All Other
1,329 2% 147 $30.82 High school diploma or equivalent
Instructional Coordinators 893 -11% 90 $30.88 Master's degree Insurance Claims and Policy Processing Clerks 594 5% 63 $18.14 High school diploma or
equivalent
Insurance Sales Agents 1,006 4% 103 $25.56 High school diploma or equivalent
Interviewers, Except Eligibility and Loan 488 -3% 63 $19.48 High school diploma or
equivalent Labor Relations Specialists 593 3% 64 $37.12 Bachelor's degree
Laborers and Freight, Stock, and Material Movers, Hand
7,407 3% 1,094 $15.72 No formal educational credential
Landscaping and Groundskeeping Workers 8,598 3% 1,147 $15.77 No formal educational
credential
Lawyers 2,144 4% 115 $46.76 Doctoral or professional degree
Legal Secretaries 758 -17% 94 $22.54 High school diploma or equivalent
Librarians 509 0% 53 $33.68 Master's degree Licensed Practical and Licensed Vocational Nurses
1,443 15% 135 $23.73 Postsecondary nondegree award
Life, Physical, and Social Science Technicians, All Other
710 -4% 86 $26.54 Associate's degree
Lifeguards, Ski Patrol, and Other Recreational Protective Service Workers
982 5% 239 $19.30 No formal educational credential
Light Truck or Delivery Services Drivers 5,166 11% 653 $16.60 High school diploma or
equivalent Loan Interviewers and Clerks 799 -1% 83 $19.61 High school diploma or
equivalent Loan Officers 1,173 2% 102 $28.09 Bachelor's degree Locker Room, Coatroom, and Dressing Room Attendants
314 7% 73 $19.40 High school diploma or equivalent
Locomotive Engineers 306 3% 31 $38.97 High school diploma or equivalent

24
Description 2023
Projected Jobs
2017 - 2023 % Change
Annual Openings
Median Hourly
Earnings Typical Entry Level
Education
Lodging Managers 483 5% 54 $38.77 High school diploma or equivalent
Logisticians 546 14% 61 $39.28 Bachelor's degree
Machinists 255 -3% 28 $32.60 High school diploma or equivalent
Magnetic Resonance Imaging Technologists 147 4% 9 $44.18 Associate degree
Maids and Housekeeping Cleaners 13,820 0% 1,917 $18.59 No formal educational
credential Maintenance and Repair Workers, General 7,669 6% 801 $21.95 High school diploma or
equivalent Management Analysts 2,349 14% 256 $37.97 Bachelor's degree Managers, All Other 2,194 9% 191 $45.41 Bachelor's degree Market Research Analysts and Marketing Specialists 1,807 20% 220 $26.88 Bachelor's degree
Marketing Managers 649 17% 71 $48.48 Bachelor's degree
Massage Therapists 1,464 13% 189 $27.76 Postsecondary nondegree award
Mechanical Engineers 787 5% 62 $37.74 Bachelor's degree Media and Communication Equipment Workers, All Other
223 4% 28 $39.27 High school diploma or equivalent
Medical and Health Services Managers 1,861 18% 183 $55.04 Bachelor's degree
Medical Assistants 4,005 13% 492 $17.99 Postsecondary nondegree award
Medical Equipment Preparers 290 6% 36 $20.10 High school diploma or
equivalent Medical Records and Health Information Technicians
728 10% 55 $22.60 Postsecondary nondegree award
Medical Secretaries 1,609 12% 200 $19.96 High school diploma or equivalent
Meeting, Convention, and Event Planners 813 8% 100 $25.84 Bachelor's degree
Mental Health and Substance Abuse Social Workers
389 7% 42 $26.01 Master's degree
Middle School Teachers, Except Special and Career/Technical Education
1,786 -3% 156 $29.14 Bachelor's degree
Mobile Heavy Equipment Mechanics, Except Engines
577 6% 62 $33.13 High school diploma or equivalent
Motor Vehicle Operators, All Other 491 8% 87 $30.90 No formal educational
credential
Musicians and Singers 609 1% 87 $35.71 No formal educational credential

25
Description 2023
Projected Jobs
2017 - 2023 % Change
Annual Openings
Median Hourly
Earnings Typical Entry Level
Education Natural Sciences Managers 278 6% 27 $53.92 Bachelor's degree
Network and Computer Systems Administrators 1,159 -4% 85 $38.87 Bachelor's degree
Nurse Practitioners 520 27% 44 $59.41 Master's degree
Nursing Assistants 5,304 7% 648 $16.76 Postsecondary nondegree award
Occupational Health and Safety Specialists 497 7% 32 $33.40 Bachelor's degree
Occupational Therapists 389 21% 31 $41.32 Master's degree
Office Clerks, General 10,508 -2% 1,298 $15.95 High school diploma or equivalent
Operating Engineers and Other Construction Equipment Operators
2,070 12% 266 $39.42 High school diploma or equivalent
Ophthalmic Medical Technicians 356 14% 36 $17.29 Postsecondary
nondegree award Painters, Construction and Maintenance 1,960 10% 223 $26.53 No formal educational
credential Painters, Transportation Equipment 224 8% 27 $25.08 High school diploma or
equivalent Paralegals and Legal Assistants 1,125 9% 132 $24.12 Associate's degree
Parts Salespersons 668 1% 83 $18.10 No formal educational credential
Payroll and Timekeeping Clerks 550 -10% 64 $22.30 High school diploma or
equivalent Personal Financial Advisors 764 1% 62 $32.70 Bachelor's degree
Pest Control Workers 585 5% 94 $17.58 High school diploma or equivalent
Pharmacists 1,727 -1% 81 $59.08 Doctoral or professional degree
Pharmacy Technicians 1,868 2% 161 $18.46 High school diploma or equivalent
Phlebotomists 834 14% 100 $17.41 Postsecondary nondegree award
Physical Therapist Assistants 269 29% 39 $27.95 Associate's degree
Physical Therapists 1,163 18% 76 $43.03 Doctoral or professional degree
Physician Assistants 393 22% 32 $55.88 Master's degree Physicians and Surgeons, All Other 1,518 13% 71 $117.90 Doctoral or
professional degree Plumbers, Pipefitters, and Steamfitters 2,143 9% 258 $31.10 High school diploma or
equivalent

26
Description 2023
Projected Jobs
2017 - 2023 % Change
Annual Openings
Median Hourly
Earnings Typical Entry Level
Education Police and Sheriff's Patrol Officers 2,741 3% 203 $35.27 High school diploma or
equivalent Police, Fire, and Ambulance Dispatchers 247 4% 25 $22.23 High school diploma or
equivalent Postal Service Mail Carriers 1,034 -4% 83 $30.04 High school diploma or
equivalent
Postsecondary Teachers 6,156 2% 537 $33.39 Doctoral or professional degree
Power Plant Operators 223 -5% 24 $44.53 High school diploma or equivalent
Preschool Teachers, Except Special Education 1,438 -2% 147 $18.68 Associate's degree
Producers and Directors 566 16% 69 $33.71 Bachelor's degree Production, Planning, and Expediting Clerks 879 11% 104 $24.71 High school diploma or
equivalent Property, Real Estate, and Community Association Managers
2,761 10% 249 $26.29 High school diploma or equivalent
Public Relations and Fundraising Managers 452 9% 44 $46.29 Bachelor's degree
Public Relations Specialists 1,334 3% 145 $28.48 Bachelor's degree
Purchasing Managers 295 4% 26 $51.19 Bachelor's degree Radiologic Technologists 722 14% 53 $36.98 Associate's degree Railroad Conductors and Yardmasters 121 -7% 12 $50.87 High school diploma or
equivalent
Real Estate Brokers 270 7% 28 $34.76 High school diploma or equivalent
Real Estate Sales Agents 413 15% 46 $29.29 High school diploma or equivalent
Refuse and Recyclable Material Collectors 595 3% 86 $18.63 No formal educational
credential Registered Nurses 12,531 10% 835 $50.62 Bachelor's degree Reservation and Transportation Ticket Agents and Travel Clerks
3,150 -5% 380 $20.42 High school diploma or equivalent
Respiratory Therapists 389 9% 26 $34.44 Associate's degree
Riggers 236 6% 25 $34.48 High school diploma or equivalent
Roofers 874 -4% 97 $26.71 No formal educational credential
Sailors and Marine Oilers 673 2% 90 $18.33 No formal educational credential
Sales and Related Workers, All Other 346 6% 47 $17.95 High school diploma or
equivalent Sales Managers 2,033 3% 195 $40.00 Bachelor's degree

27
Description 2023
Projected Jobs
2017 - 2023 % Change
Annual Openings
Median Hourly
Earnings Typical Entry Level
Education Sales Representatives, Services, All Other 3,768 1% 493 $26.47 High school diploma or
equivalent Sales Representatives, Wholesale and Manufacturing, Except Technical and Scientific Products
3,700 -5% 402 $22.77 High school diploma or equivalent
Sales Representatives, Wholesale and Manufacturing, Technical and Scientific Products
1,092 -2% 121 $34.15 Bachelor's degree
Secondary School Teachers, Except Special and Career/Technical Education
4,025 -4% 323 $28.92 Bachelor's degree
Secretaries and Administrative Assistants, Except Legal, Medical, and Executive
9,994 -11% 1,174 $19.11 High school diploma or equivalent
Securities, Commodities, and Financial Services Sales Agents
793 11% 88 $30.31 Bachelor's degree
Security and Fire Alarm Systems Installers 450 14% 59 $22.26 High school diploma or
equivalent
Security Guards 9,562 -1% 1,250 $15.75 High school diploma or equivalent
Self-Enrichment Education Teachers 1,848 7% 227 $17.75 High school diploma or
equivalent
Sheet Metal Workers 797 0% 89 $39.06 High school diploma or equivalent
Shipping, Receiving, and Traffic Clerks 1,850 -7% 191 $17.28 High school diploma or
equivalent
Skincare Specialists 271 25% 38 $22.02 Postsecondary nondegree award
Social and Community Service Managers 691 12% 70 $31.59 Bachelor's degree
Social and Human Service Assistants 2,419 6% 302 $17.15 High school diploma or
equivalent Social Scientists and Related Workers, All Other 325 4% 39 $46.46 Bachelor's degree
Social Workers, All Other 258 8% 27 $40.90 Bachelor's degree Software Developers, Applications 932 17% 83 $38.46 Bachelor's degree
Software Developers, Systems Software 1,035 1% 79 $43.87 Bachelor's degree
Solar Photovoltaic Installers 324 46% 52 $25.98 High school diploma or
equivalent Special Education Teachers, Kindergarten and Elementary School
1,569 -6% 142 $27.07 Bachelor's degree
28
Description 2023
Projected Jobs
2017 - 2023 % Change
Annual Openings
Median Hourly
Earnings Typical Entry Level
Education Speech-Language Pathologists 641 15% 45 $35.64 Master's degree
Substance Abuse, Behavioral Disorder, and Mental Health Counselors
717 15% 84 $23.44 Bachelor's degree
Substitute Teachers 2,551 12% 374 $22.67 Bachelor's degree
Surgical Technologists 402 15% 39 $23.45 Postsecondary nondegree award
Switchboard Operators, Including Answering Service
412 -19% 56 $20.72 High school diploma or equivalent
Tank Car, Truck, and Ship Loaders 301 -17% 40 $37.90 No formal educational
credential
Tax Preparers 239 7% 30 $25.58 High school diploma or equivalent
Teachers and Instructors, All Other 6,384 3% 827 $21.02 Bachelor's degree
Telecommunications Equipment Installers and Repairers, Except Line Installers
1,128 -5% 130 $29.81 Postsecondary nondegree award
Telecommunications Line Installers and Repairers 402 15% 53 $32.99 High school diploma or
equivalent Training and Development Specialists 1,192 7% 140 $28.41 Bachelor's degree
Transportation Inspectors 179 2% 19 $36.10 High school diploma or equivalent
Transportation Security Screeners 1,167 7% 122 $19.50 High school diploma or
equivalent Transportation Workers, All Other 775 12% 91 $17.25 High school diploma or
equivalent Transportation, Storage, and Distribution Managers 579 4% 49 $42.65 High school diploma or
equivalent
Travel Agents 553 -14% 81 $18.98 High school diploma or equivalent
Tree Trimmers and Pruners 252 10% 35 $21.60 High school diploma or
equivalent Urban and Regional Planners 485 9% 50 $35.73 Master's degree
Veterinary Technologists and Technicians 472 19% 48 $17.23 Associate's degree
Waiters and Waitresses 20,641 4% 4,029 $23.49 No formal educational credential
Water and Wastewater Treatment Plant and System Operators
459 1% 45 $25.90 High school diploma or equivalent
Web Developers 309 0% 25 $29.69 Associate degree Welders, Cutters, Solderers, and Brazers 554 -3% 64 $27.89 High school diploma or
equivalent Word Processors and Typists 431 -21% 60 $16.84 High school diploma or
equivalent
29
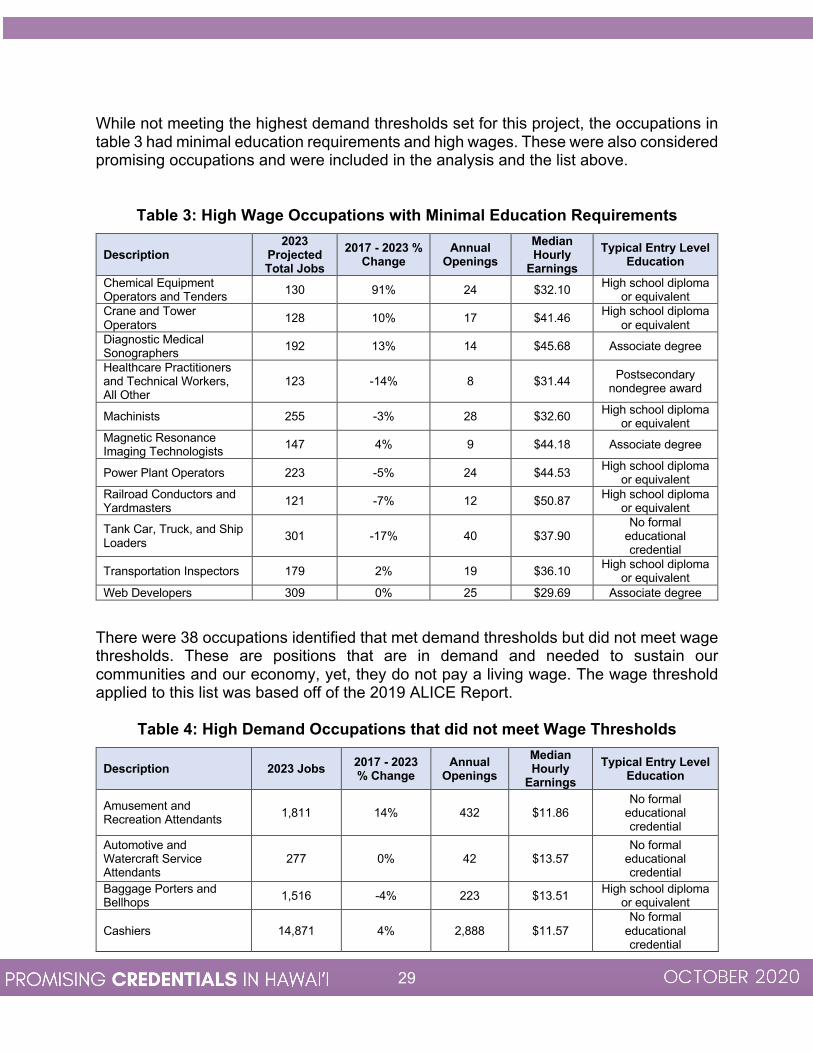
While not meeting the highest demand thresholds set for this project, the occupations in table 3 had minimal education requirements and high wages. These were also considered promising occupations and were included in the analysis and the list above.
Table 3: High Wage Occupations with Minimal Education Requirements
Description 2023
Projected Total Jobs
2017 - 2023 % Change
Annual Openings
Median Hourly
Earnings Typical Entry Level
Education Chemical Equipment Operators and Tenders 130 91% 24 $32.10 High school diploma
or equivalent Crane and Tower Operators 128 10% 17 $41.46 High school diploma
or equivalent Diagnostic Medical Sonographers 192 13% 14 $45.68 Associate degree
Healthcare Practitioners and Technical Workers, All Other
123 -14% 8 $31.44 Postsecondary nondegree award
Machinists 255 -3% 28 $32.60 High school diploma or equivalent
Magnetic Resonance Imaging Technologists 147 4% 9 $44.18 Associate degree
Power Plant Operators 223 -5% 24 $44.53 High school diploma or equivalent
Railroad Conductors and Yardmasters 121 -7% 12 $50.87 High school diploma
or equivalent
Tank Car, Truck, and Ship Loaders 301 -17% 40 $37.90
No formal educational credential
Transportation Inspectors 179 2% 19 $36.10 High school diploma or equivalent
Web Developers 309 0% 25 $29.69 Associate degree
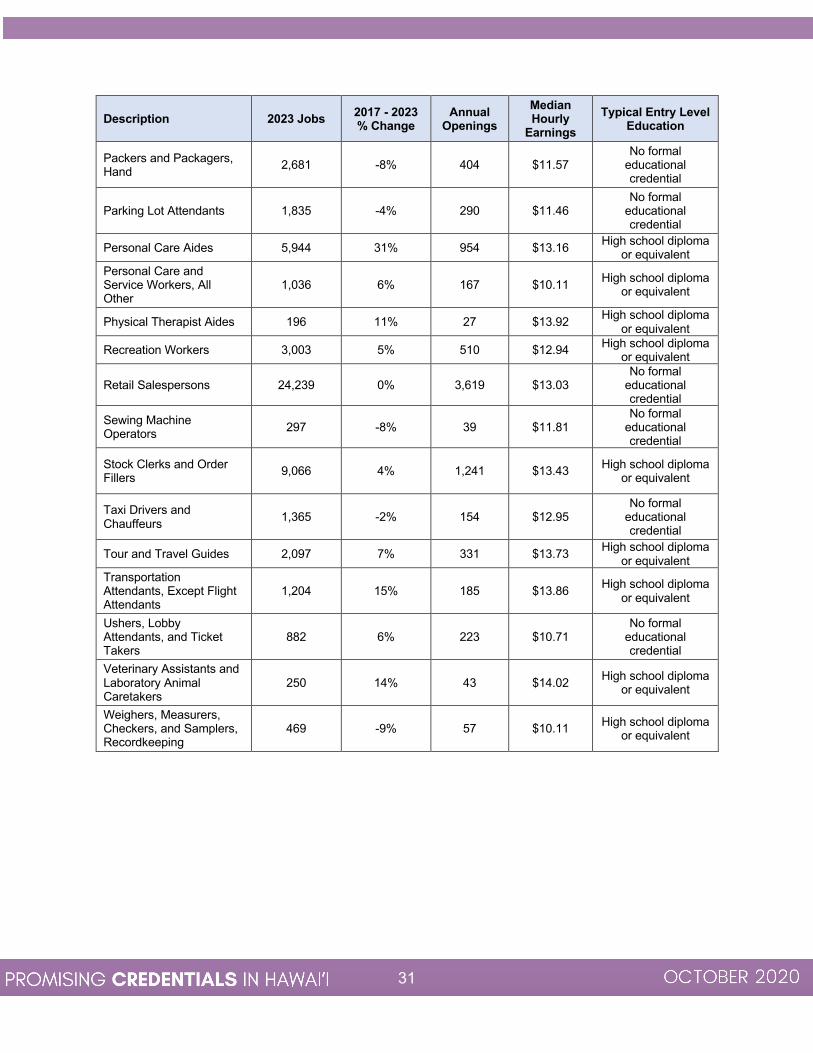
There were 38 occupations identified that met demand thresholds but did not meet wage thresholds. These are positions that are in demand and needed to sustain our communities and our economy, yet, they do not pay a living wage. The wage threshold applied to this list was based off of the 2019 ALICE Report.
Table 4: High Demand Occupations that did not meet Wage Thresholds
Description 2023 Jobs 2017 - 2023 % Change
Annual Openings
Median Hourly
Earnings Typical Entry Level
Education
Amusement and Recreation Attendants 1,811 14% 432 $11.86
No formal educational credential
Automotive and Watercraft Service Attendants
277 0% 42 $13.57 No formal
educational credential
Baggage Porters and Bellhops 1,516 -4% 223 $13.51 High school diploma
or equivalent
Cashiers 14,871 4% 2,888 $11.57 No formal
educational credential

30
Description 2023 Jobs 2017 - 2023 % Change
Annual Openings
Median Hourly
Earnings Typical Entry Level
Education
Childcare Workers 2,021 3% 311 $11.49 High school diploma or equivalent
Cleaners of Vehicles and Equipment 2,050 7% 316 $12.08
No formal educational credential
Combined Food Preparation and Serving Workers, Including Fast Food
16,066 14% 2,980 $11.31 No formal
educational credential
Cooks, Fast Food 1,607 -4% 232 $13.50 No formal
educational credential
Counter and Rental Clerks 2,100 2% 281 $13.93
No formal educational credential
Counter Attendants, Cafeteria, Food Concession, and Coffee Shop
4,538 2% 998 $11.34 No formal
educational credential
Demonstrators and Product Promoters 666 -5% 117 $13.12
No formal educational credential
Dishwashers 4,687 2% 759 $12.26 No formal
educational credential
Food Batchmakers 694 5% 108 $12.99 High school diploma or equivalent
Food Preparation and Serving Related Workers, All Other
281 15% 52 $11.52 No formal
educational credential
Food Preparation Workers 8,110 4% 1,430 $12.42 No formal
educational credential
Helpers--Production Workers 393 -11% 62 $13.65 High school diploma
or equivalent
Home Health Aides 5,597 11% 721 $12.69 High school diploma or equivalent
Inspectors, Testers, Sorters, Samplers, and Weighers
849 -9% 118 $12.90 High school diploma or equivalent
Manicurists and Pedicurists 335 21% 45 $11.18 Postsecondary
nondegree award
Meat, Poultry, and Fish Cutters and Trimmers 671 7% 89 $13.85
No formal educational credential
Nonfarm Animal Caretakers 796 19% 139 $12.95 High school diploma
or equivalent Office and Administrative Support Workers, All Other
1,870 -1% 224 $13.60 High school diploma or equivalent
Packaging and Filling Machine Operators and Tenders
701 0% 84 $13.77 High school diploma or equivalent
31
Description 2023 Jobs 2017 - 2023 % Change
Annual Openings
Median Hourly
Earnings Typical Entry Level
Education
Packers and Packagers, Hand 2,681 -8% 404 $11.57
No formal educational credential
Parking Lot Attendants 1,835 -4% 290 $11.46 No formal
educational credential
Personal Care Aides 5,944 31% 954 $13.16 High school diploma or equivalent
Personal Care and Service Workers, All Other
1,036 6% 167 $10.11 High school diploma or equivalent
Physical Therapist Aides 196 11% 27 $13.92 High school diploma or equivalent
Recreation Workers 3,003 5% 510 $12.94 High school diploma or equivalent
Retail Salespersons 24,239 0% 3,619 $13.03 No formal
educational credential
Sewing Machine Operators 297 -8% 39 $11.81
No formal educational credential
Stock Clerks and Order Fillers 9,066 4% 1,241 $13.43 High school diploma
or equivalent
Taxi Drivers and Chauffeurs 1,365 -2% 154 $12.95
No formal educational credential
Tour and Travel Guides 2,097 7% 331 $13.73 High school diploma or equivalent
Transportation Attendants, Except Flight Attendants
1,204 15% 185 $13.86 High school diploma or equivalent
Ushers, Lobby Attendants, and Ticket Takers
882 6% 223 $10.71 No formal
educational credential
Veterinary Assistants and Laboratory Animal Caretakers
250 14% 43 $14.02 High school diploma or equivalent
Weighers, Measurers, Checkers, and Samplers, Recordkeeping
469 -9% 57 $10.11 High school diploma or equivalent
32
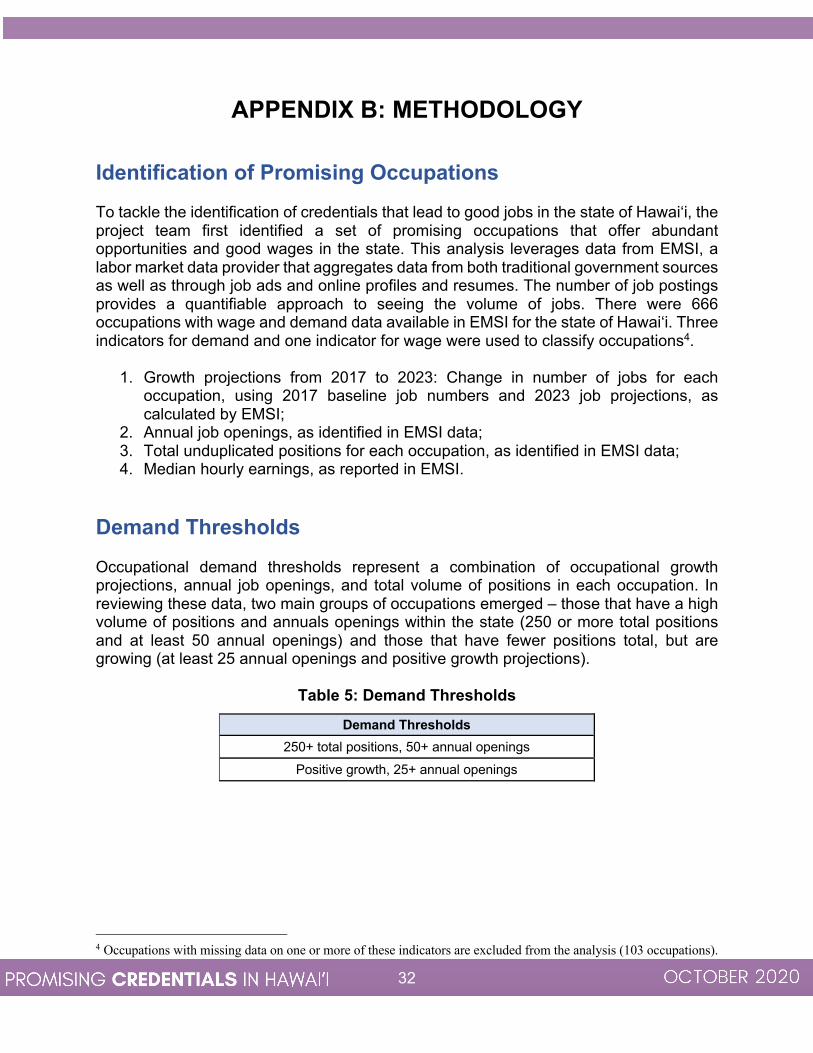
APPENDIX B: METHODOLOGY Identification of Promising Occupations To tackle the identification of credentials that lead to good jobs in the state of Hawai‘i, the project team first identified a set of promising occupations that offer abundant opportunities and good wages in the state. This analysis leverages data from EMSI, a labor market data provider that aggregates data from both traditional government sources as well as through job ads and online profiles and resumes. The number of job postings provides a quantifiable approach to seeing the volume of jobs. There were 666 occupations with wage and demand data available in EMSI for the state of Hawai‘i. Three indicators for demand and one indicator for wage were used to classify occupations4.
1. Growth projections from 2017 to 2023: Change in number of jobs for each occupation, using 2017 baseline job numbers and 2023 job projections, as calculated by EMSI;
2. Annual job openings, as identified in EMSI data; 3. Total unduplicated positions for each occupation, as identified in EMSI data; 4. Median hourly earnings, as reported in EMSI.
Demand Thresholds Occupational demand thresholds represent a combination of occupational growth projections, annual job openings, and total volume of positions in each occupation. In reviewing these data, two main groups of occupations emerged – those that have a high volume of positions and annuals openings within the state (250 or more total positions and at least 50 annual openings) and those that have fewer positions total, but are growing (at least 25 annual openings and positive growth projections).
Table 5: Demand Thresholds
Demand Thresholds 250+ total positions, 50+ annual openings
Positive growth, 25+ annual openings
4 Occupations with missing data on one or more of these indicators are excluded from the analysis (103 occupations).
33
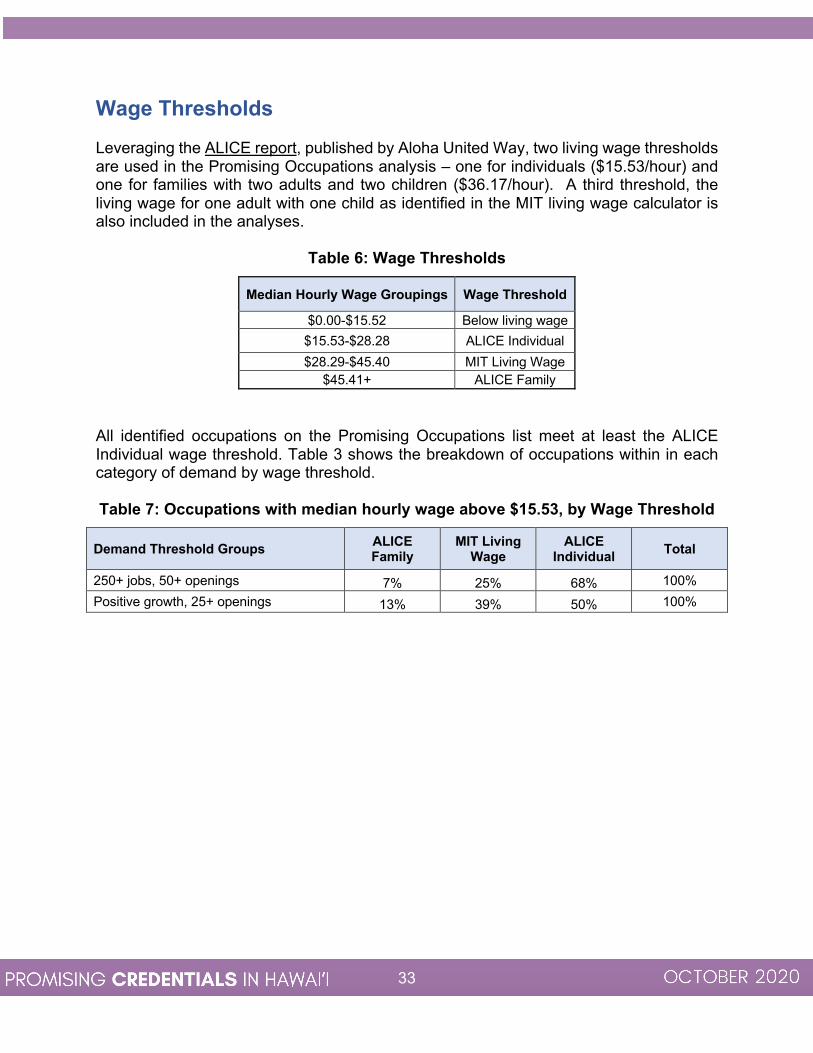
Wage Thresholds Leveraging the ALICE report, published by Aloha United Way, two living wage thresholds are used in the Promising Occupations analysis – one for individuals ($15.53/hour) and one for families with two adults and two children ($36.17/hour). A third threshold, the living wage for one adult with one child as identified in the MIT living wage calculator is also included in the analyses.
Table 6: Wage Thresholds
Median Hourly Wage Groupings Wage Threshold
$0.00-$15.52 Below living wage $15.53-$28.28 ALICE Individual $28.29-$45.40 MIT Living Wage
$45.41+ ALICE Family All identified occupations on the Promising Occupations list meet at least the ALICE Individual wage threshold. Table 3 shows the breakdown of occupations within in each category of demand by wage threshold. Table 7: Occupations with median hourly wage above $15.53, by Wage Threshold
Demand Threshold Groups ALICE Family
MIT Living Wage
ALICE Individual Total
250+ jobs, 50+ openings 7% 25% 68% 100% Positive growth, 25+ openings 13% 39% 50% 100%
34
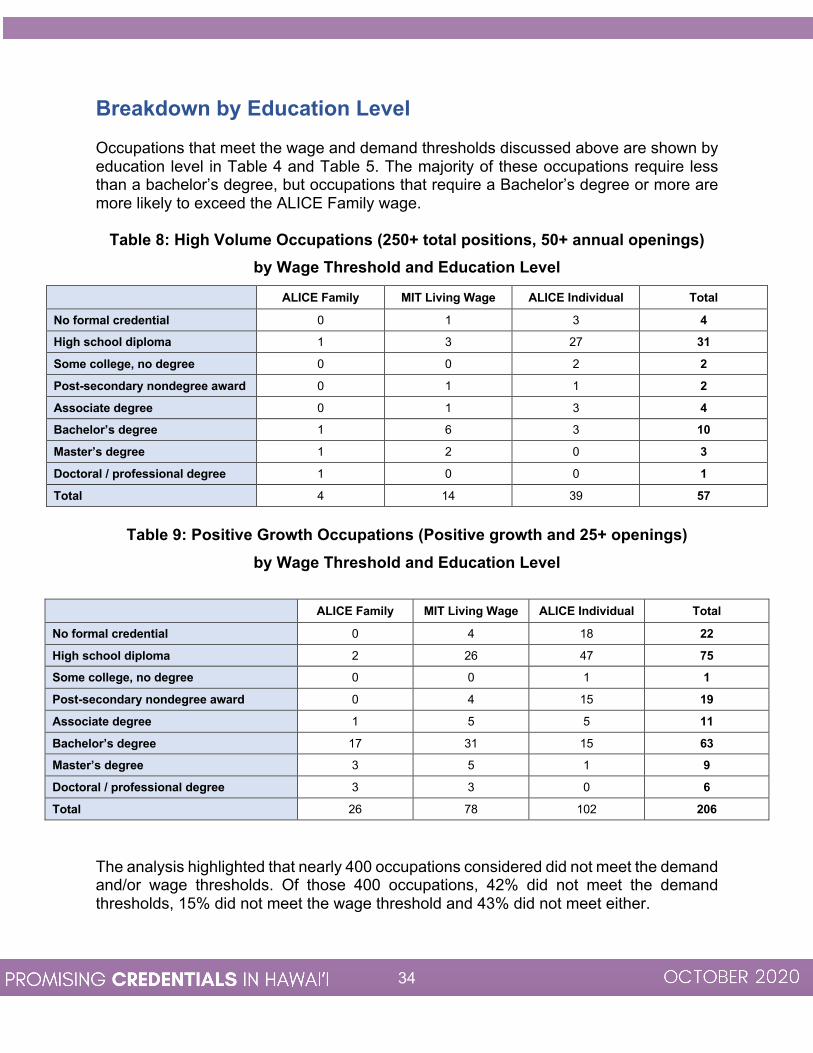
Breakdown by Education Level Occupations that meet the wage and demand thresholds discussed above are shown by education level in Table 4 and Table 5. The majority of these occupations require less than a bachelor’s degree, but occupations that require a Bachelor’s degree or more are more likely to exceed the ALICE Family wage.
Table 8: High Volume Occupations (250+ total positions, 50+ annual openings) by Wage Threshold and Education Level
ALICE Family MIT Living Wage ALICE Individual Total
No formal credential 0 1 3 4 High school diploma 1 3 27 31
Some college, no degree 0 0 2 2
Post-secondary nondegree award 0 1 1 2
Associate degree 0 1 3 4 Bachelor’s degree 1 6 3 10
Master’s degree 1 2 0 3
Doctoral / professional degree 1 0 0 1
Total 4 14 39 57
Table 9: Positive Growth Occupations (Positive growth and 25+ openings)
by Wage Threshold and Education Level
ALICE Family MIT Living Wage ALICE Individual Total
No formal credential 0 4 18 22
High school diploma 2 26 47 75 Some college, no degree 0 0 1 1
Post-secondary nondegree award 0 4 15 19
Associate degree 1 5 5 11
Bachelor’s degree 17 31 15 63 Master’s degree 3 5 1 9
Doctoral / professional degree 3 3 0 6
Total 26 78 102 206
The analysis highlighted that nearly 400 occupations considered did not meet the demand and/or wage thresholds. Of those 400 occupations, 42% did not meet the demand thresholds, 15% did not meet the wage threshold and 43% did not meet either.
35
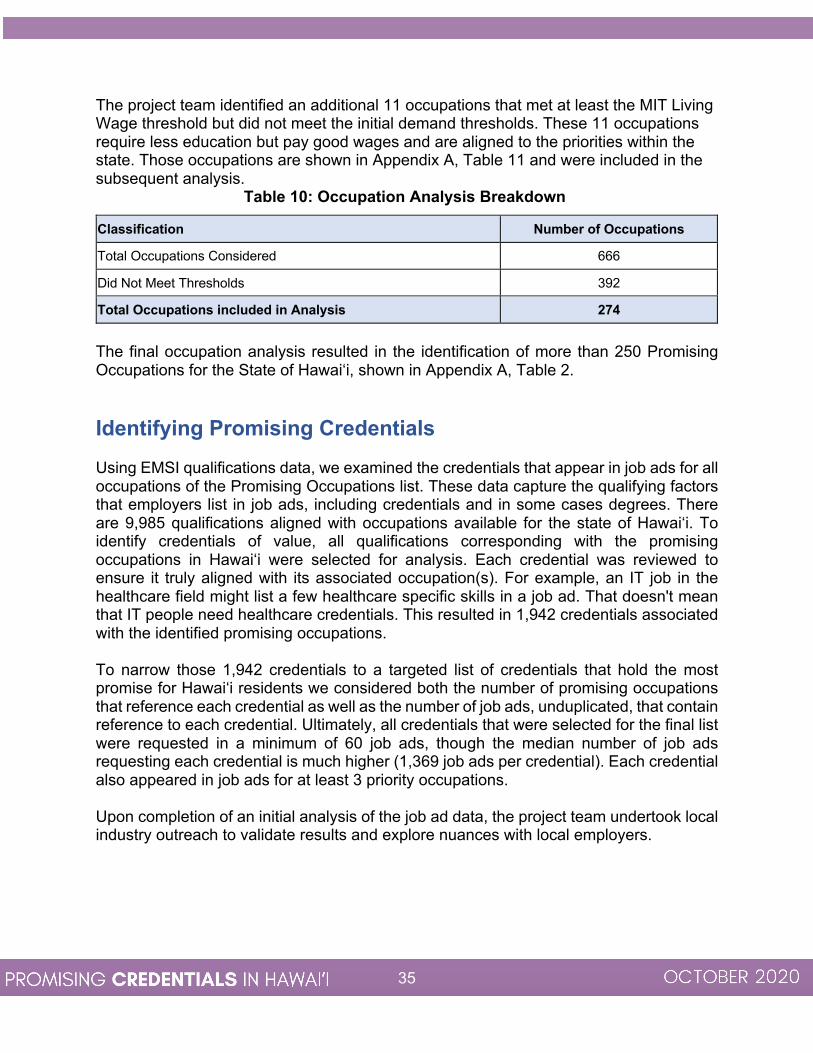
The project team identified an additional 11 occupations that met at least the MIT Living Wage threshold but did not meet the initial demand thresholds. These 11 occupations require less education but pay good wages and are aligned to the priorities within the state. Those occupations are shown in Appendix A, Table 11 and were included in the subsequent analysis.
Table 10: Occupation Analysis Breakdown
Classification Number of Occupations
Total Occupations Considered 666
Did Not Meet Thresholds 392
Total Occupations included in Analysis 274
The final occupation analysis resulted in the identification of more than 250 Promising Occupations for the State of Hawai‘i, shown in Appendix A, Table 2. Identifying Promising Credentials Using EMSI qualifications data, we examined the credentials that appear in job ads for all occupations of the Promising Occupations list. These data capture the qualifying factors that employers list in job ads, including credentials and in some cases degrees. There are 9,985 qualifications aligned with occupations available for the state of Hawai‘i. To identify credentials of value, all qualifications corresponding with the promising occupations in Hawai‘i were selected for analysis. Each credential was reviewed to ensure it truly aligned with its associated occupation(s). For example, an IT job in the healthcare field might list a few healthcare specific skills in a job ad. That doesn't mean that IT people need healthcare credentials. This resulted in 1,942 credentials associated with the identified promising occupations. To narrow those 1,942 credentials to a targeted list of credentials that hold the most promise for Hawai‘i residents we considered both the number of promising occupations that reference each credential as well as the number of job ads, unduplicated, that contain reference to each credential. Ultimately, all credentials that were selected for the final list were requested in a minimum of 60 job ads, though the median number of job ads requesting each credential is much higher (1,369 job ads per credential). Each credential also appeared in job ads for at least 3 priority occupations. Upon completion of an initial analysis of the job ad data, the project team undertook local industry outreach to validate results and explore nuances with local employers.
36
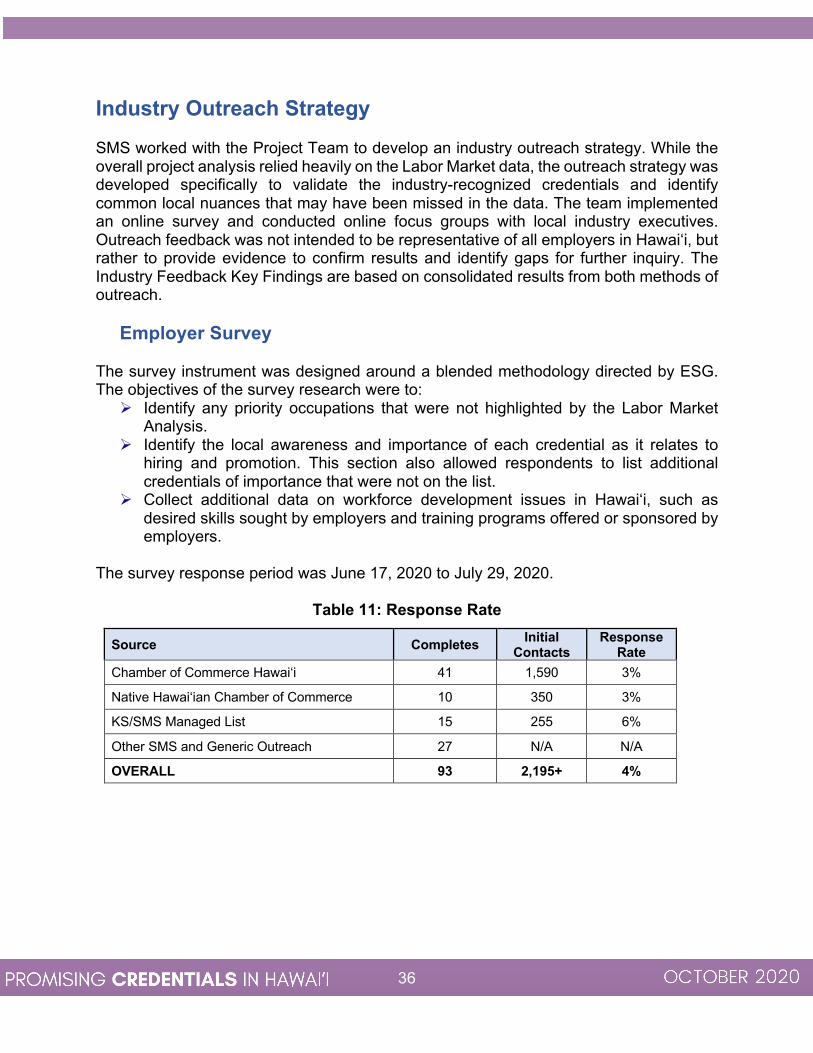
Industry Outreach Strategy SMS worked with the Project Team to develop an industry outreach strategy. While the overall project analysis relied heavily on the Labor Market data, the outreach strategy was developed specifically to validate the industry-recognized credentials and identify common local nuances that may have been missed in the data. The team implemented an online survey and conducted online focus groups with local industry executives. Outreach feedback was not intended to be representative of all employers in Hawai‘i, but rather to provide evidence to confirm results and identify gaps for further inquiry. The Industry Feedback Key Findings are based on consolidated results from both methods of outreach.
Employer Survey The survey instrument was designed around a blended methodology directed by ESG. The objectives of the survey research were to:
Ø Identify any priority occupations that were not highlighted by the Labor Market Analysis.
Ø Identify the local awareness and importance of each credential as it relates to hiring and promotion. This section also allowed respondents to list additional credentials of importance that were not on the list.
Ø Collect additional data on workforce development issues in Hawai‘i, such as desired skills sought by employers and training programs offered or sponsored by employers.
The survey response period was June 17, 2020 to July 29, 2020.
Table 11: Response Rate
Source Completes Initial Contacts
Response Rate
Chamber of Commerce Hawai‘i 41 1,590 3%
Native Hawai‘ian Chamber of Commerce 10 350 3%
KS/SMS Managed List 15 255 6%
Other SMS and Generic Outreach 27 N/A N/A
OVERALL 93 2,195+ 4%

37
Response rates below are listed by industry. Primary indicates the first industry that was selected by respondents and secondary indicates any additional industries that were selected. Both primary and secondary industry respondents completed questions on credentials and priority occupations so responses by industry are the total number of respondents, both primary and secondary combined.
Table 12: Response Rate by Industry
Industry Total Primary Secondary
Agriculture, Food, and Natural Resources 22 20 2
Architecture and Construction 8 6 2
Arts, Audio/Video Technology & Communications 9 4 5
Administration, Business, Finance, & Marketing 42 15 27
Education and Training 19 12 7
Health Science 11 10 1
Hospitality and Tourism 8 6 2
Human Services 15 8 7
Information Technology (IT) 22 0 22
Law and Public Safety 8 2 6
Manufacturing 3 3 0
Transportation, Distribution, & Logistics 10 7 3
OVERALL 177 93 84

38
Industry Focus Groups Traditionally, focus group research is “a way of collecting qualitative data, by engaging a small number of people in an informal group discussion ‘focused’ around a particular topic or set of issues.” Focus groups are less threatening to many research participants and this environment often solicits a range of perceptions, ideas, opinions, and thoughts. SMS conducted six focus groups comprised of business leaders from like-minded industries and completed three additional one-on-one executive interviews. At these discussions, SMS presented the objectives of the industry credential project and led the discussion. Discussion focused on skills, credentials, trends in the industry, and hiring issues.
Elements of the Discussion The discussion guide included the topics below.
Ø Staffing needs including hard to fill and in demand occupations Ø Skills in demand within the workforce Ø Sourcing and talent pipelines Ø Internal or external training opportunities Ø Credentials and qualifications of value within their industry Ø Barriers to workforce development Ø Growing trends in their industry and beyond Ø Long- and short-term implications of the COVID-19 pandemic Recruitment
The first task was to recruit qualified participants for each group. Virtual group meetings were conducted via Zoom. Each group had six to eight executives, recruited using a list of names, phone numbers and emails provided by the Project Team and additional direct outreach to businesses and contacts. SMS conducted a short screening process to ensure the desired mix of participants. SMS guaranteed confidentiality to all participants.

39
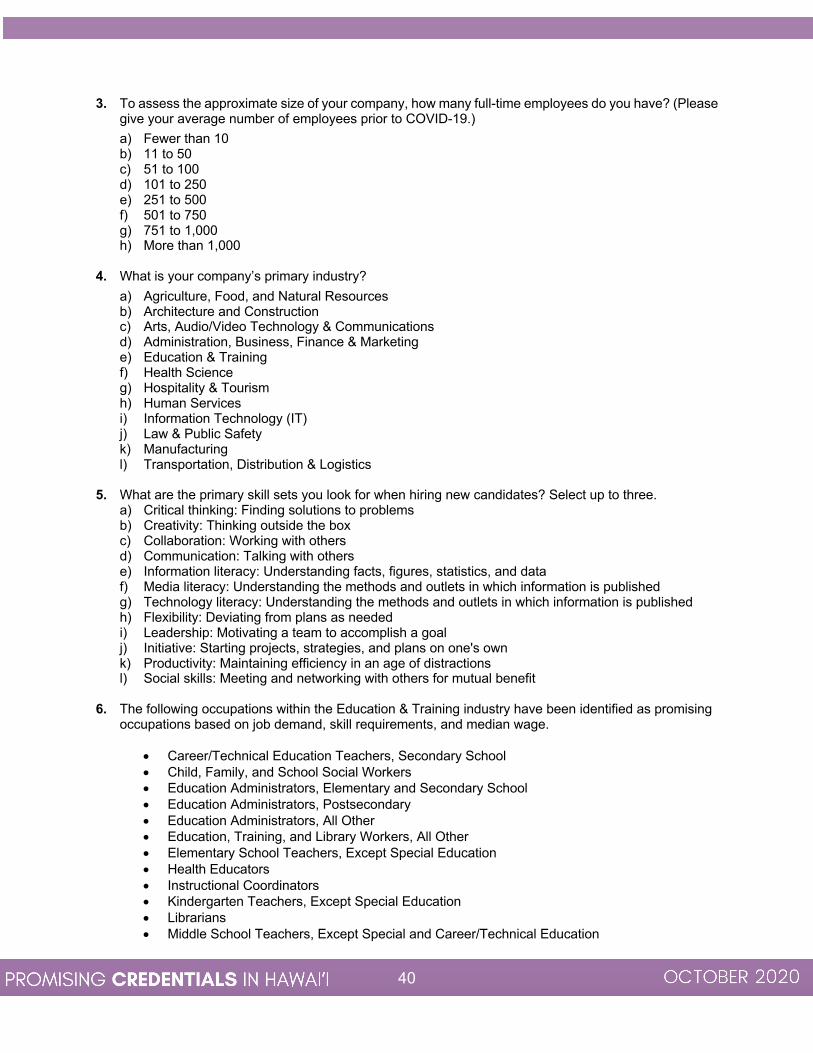
APPENDIX C: SURVEY INSTRUMENT Below is an example of the series of questions asked to survey respondents. Credential and occupational listings varied by industry sector chosen. Respondents had the opportunity to respond to questions within as many industries as desired. Credentials Survey INTRODUCTION The Promising Credentials project is a consolidated effort between Kamehameha Schools, the Chamber of Commerce Hawai‘i, the Harold K.L. Castle Foundation and the University of Hawai‘i P-2. This project aims to address the gap between workforce training and the demand for quality employees in Hawai’i. In light of the economic impacts already being felt due to the COVID-19 pandemic, we believe this work is even more important and will help us build a stronger workforce and more resilient economy. Using labor market data, the project has identified promising occupations that are forecasted to be in demand over the coming years and pay a living wage. For each industry, we have also identified the existing industry certifications that can be earned at local community colleges, completed at local testing sites, or accessed online. Our next step is to validate these occupations and industry certifications with you, the employer community. We are doing this to ensure local businesses, now and into the future, will have a sustained supply of well-trained local workers ready to step in to in-demand roles within your companies. We thank you in advance for responding to this survey. Your input and insight are an essential part of this work. The survey is designed to take no more than 10 minutes of your time. 1. What is the zip code where your main office is located?
2. Are there any additional regions where your employees might report to work? Long term job sites or
other out of office locations that you conduct business? Choose as many as applicable.
a) O'ahu-wide b) Statewide c) Honolulu d) North Shore e) Central O'ahu f) East O'ahu g) West O'ahu h) Hawai'i Island i) Kaua'i j) Maui k) Moloka'i l) Lana'i m) Continental US
40
3. To assess the approximate size of your company, how many full-time employees do you have? (Please give your average number of employees prior to COVID-19.)
a) Fewer than 10 b) 11 to 50 c) 51 to 100 d) 101 to 250 e) 251 to 500 f) 501 to 750 g) 751 to 1,000 h) More than 1,000
4. What is your company’s primary industry?
a) Agriculture, Food, and Natural Resources b) Architecture and Construction c) Arts, Audio/Video Technology & Communications d) Administration, Business, Finance & Marketing e) Education & Training f) Health Science g) Hospitality & Tourism h) Human Services i) Information Technology (IT) j) Law & Public Safety k) Manufacturing l) Transportation, Distribution & Logistics
5. What are the primary skill sets you look for when hiring new candidates? Select up to three.
a) Critical thinking: Finding solutions to problems b) Creativity: Thinking outside the box c) Collaboration: Working with others d) Communication: Talking with others e) Information literacy: Understanding facts, figures, statistics, and data f) Media literacy: Understanding the methods and outlets in which information is published g) Technology literacy: Understanding the methods and outlets in which information is published h) Flexibility: Deviating from plans as needed i) Leadership: Motivating a team to accomplish a goal j) Initiative: Starting projects, strategies, and plans on one's own k) Productivity: Maintaining efficiency in an age of distractions l) Social skills: Meeting and networking with others for mutual benefit
6. The following occupations within the Education & Training industry have been identified as promising occupations based on job demand, skill requirements, and median wage.
• Career/Technical Education Teachers, Secondary School • Child, Family, and School Social Workers • Education Administrators, Elementary and Secondary School • Education Administrators, Postsecondary • Education Administrators, All Other • Education, Training, and Library Workers, All Other • Elementary School Teachers, Except Special Education • Health Educators • Instructional Coordinators • Kindergarten Teachers, Except Special Education • Librarians • Middle School Teachers, Except Special and Career/Technical Education

41
• Postsecondary Teachers • Preschool Teachers, Except Special Education • Secondary School Teachers, Except Special and Career/Technical Education • Self-Enrichment Education Teachers • Special Education Teachers, Kindergarten and Elementary School • Substitute Teachers • Teacher Assistants • Teachers and Instructors, All Other
Are there any occupations within this industry that are not listed above that you believe should be included as a priority within local workforce development and training? a) Yes b) No [SKIP TO Q8]
7. Please list those occupations here: Occupation 1: _________________________________ Occupation 2: _________________________________ Occupation 3: _________________________________ Occupation 4: _________________________________
8. The following non-degree credentials within the Education & Training industry were selected for either being available locally or posted in job ads from employers across Hawai‘i. Based on your experience and knowledge, how important is each credential in deciding to hire or promote an individual? Please select one option for each credential.
Required: This credential is commonly required to
hire/promote
Preferred: This credential is preferred, but not required, to hire/promote.
Not Important: This credential is not relevant
to decision making.
I am not familiar with this
credential. Certified Diabetes Educator Certified Flight Instructor Certified Health Education Specialist Child Development Associate (CDA) Early Childhood Education Certification English Learner Authorization Teaching English As A Foreign Language
Water Safety Instructor Certification Wilderness First Aid
9. Are there any non-degree credentials in this industry that are not on the list above that you believe
should be considered for inclusion in the next cycle, based on alignment to in-demand, living-wage occupations? a) Yes b) No [SKIP TO Q11]
10. Please list those non-degree credentials here:

42
Credential 1: __________________________________ Credential 2: __________________________________ Credential 3: __________________________________ Credential 4: __________________________________
11. Are there any occupations in the [RESPONDENT’S ANSWER FROM Q4] industry that are particularly difficult to fill because prospective employees lack the necessary non-degree credentials? a) Yes b) No [SKIP TO Q13]
12. Please list which occupations you have noticed a shortage due to credentialing:
Occupation 1: _________________________________ Occupation 2: _________________________________ Occupation 3: _________________________________ Occupation 4: _________________________________
13. Does your organization provide training or sponsor employees to acquire credentials? a) Yes b) No [SKIP TO Q15]
14. Please list which occupations you have noticed a shortage due to credentialing: Credential/Training 1: ___________________________ Credential/Training 2: ___________________________ Credential/Training 3: ___________________________ Credential/Training 4: ___________________________
15. Does your company routinely hire full-time employees to perform business functions that are outside of your primary industry (for example, IT staff, accountants, lawyers, etc.)? a) Yes b) No [SKIP TO Q17]

43
16. Please select the industry(s) or function(s) for which you hire additional full-time support staff? (choose all that apply) [RESPONDENT’S ANSWER FROM Q4 NOT INCLUDED]
a) Agriculture, Food, and Natural Resources b) Architecture and Construction c) Arts, Audio/Video Technology & Communications d) Administration, Business, Finance & Marketing e) Education & Training f) Health Science g) Hospitality & Tourism h) Human Services i) Information Technology (IT) j) Law & Public Safety k) Manufacturing l) Transportation, Distribution & Logistics
[RESPONDENT WILL LOOP THROUGH QUESTIONS 6-10 FOR EACH ADDITIONAL
INDUSTRY THEY SELECTED]
17. If you are willing to participate in a possible follow up interview or focus group, please leave your preferred contact information below. Name: _______________________________________ Company: ____________________________________ Role: ________________________________________ Phone: ______________________________________ Email: _______________________________________
18. If you are interested in receiving a copy of the final report once available, please leave your email below. Email: _______________________________________

44
APPENDIX D: FOCUS GROUP DISCUSSION QUESTIONS
1. From your perspective, what are the most pressing current and future employment needs
within the field? 2. Do you feel that your businesses are able to successfully identify and hire the right talent from
within Hawai‘i? a. If not, what is missing from the talent pool?
i. Are potential workers not equipped with the right skills, training, or credentials? If so, could you elaborate on what those skills, training, or credentials are?
ii. Are there not enough workers to meet demand for open positions? b. If yes, where do you find talent?
i. Do you have partnerships with colleges and universities, high schools, industry associations, etc. that help you identify talent?
ii. Do you operate any workforce training programs that feed into your talent pool?
iii. Do you routinely seek talent from outside of Hawai‘i? 3. We used industry research and job posting data from employers across the state to identify a
set of credentials that employers likely consider as part of their hiring strategies. We’d like to review those credentials with you and get your honest feedback on the value and importance of these credentials.
a. In your opinion and experience, are these the relevant credentials that are preferred to gain employment within your industry? b. Do these credentials hold value across the industry, regardless of business or specific job title, or are they especially relevant to a specific occupation? c. Are there groupings of credentials you like to see candidates have? For example, are there credentials on this list that are only valuable in combination with other credentials and/or degrees? d. Are there credentials not on this list that are important for hiring and/or promotion in your industry? How are those credentials used (bundling/stacking, hiring/promotion)?
5. What do you believe are the barriers to workforce training and development in your industry?
How could Hawai‘i address these gaps? 6. Are there emerging trends in your industry that the team should keep in mind for
future planning? Are any new policies or technologies likely to impact desired skills and/or workforce demand? Do you expect any significant declines in demand within certain occupations or fields?
7. What impacts are you experiencing, or do you expect, from the current COVID-19 pandemic
and do you believe these to be short or long-term?

45
APPENDIX E: DATA SOURCES Alice Report – Completely annually, the ALICE report measures financial hardship to understand why so many households struggle to make ends meet. Each ALICE report contains data on household budgets, demographics, employment opportunities, housing affordability, public and private assistance, and other critical economic factors. For more information on ALICE research, see www.unitedforalice.org. EMSI – EMSI provide the labor market data for use in higher education, economic development, workforce development, talent acquisition, and site selection. EMSI data covers more than 99% of the workforce and is compiled from a wide variety of government sources, job postings, and online profiles and résumés. For more information on EMSI data please see the website for Emsi – economicmodeling.com. MIT Living Wage – MIT Living Wage is a living wage calculator that estimates the cost of living in communities and regions based on typical expenses. The tool helps individuals, communities, and employers determine a local wage rate that allows residents to meet minimum standards of living. For more information on MIT Living Wage, see livingwage.mit.edu.
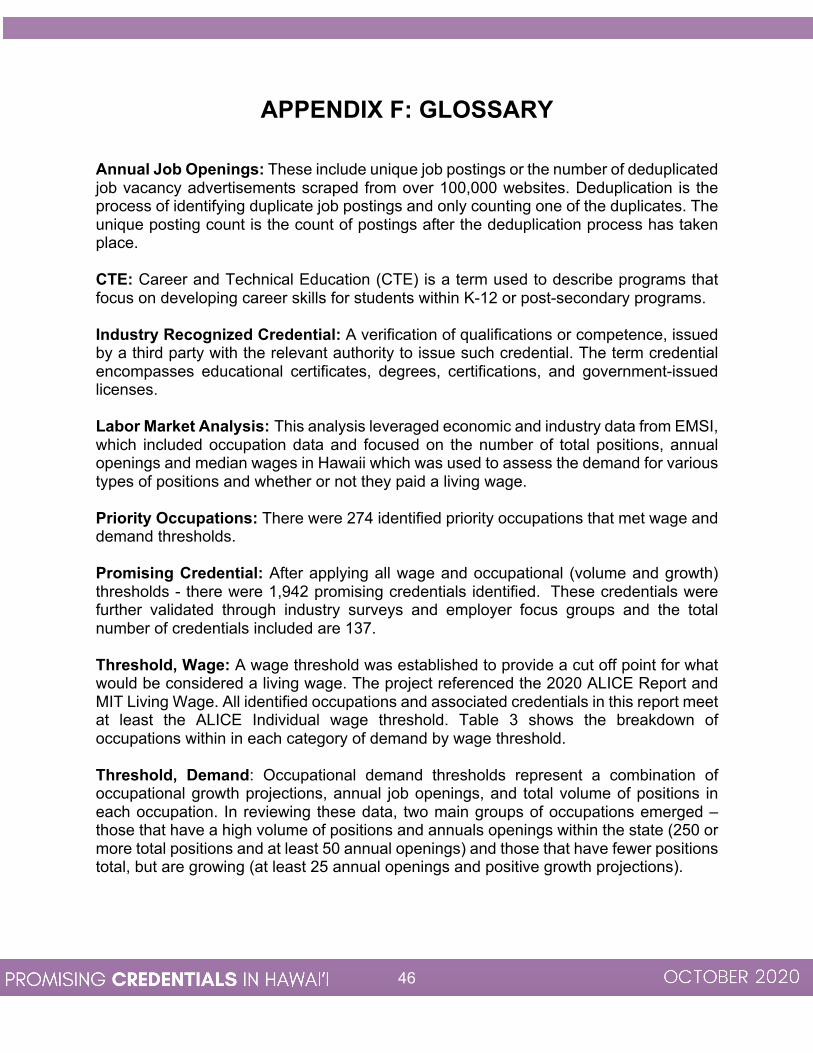
46
APPENDIX F: GLOSSARY Annual Job Openings: These include unique job postings or the number of deduplicated job vacancy advertisements scraped from over 100,000 websites. Deduplication is the process of identifying duplicate job postings and only counting one of the duplicates. The unique posting count is the count of postings after the deduplication process has taken place. CTE: Career and Technical Education (CTE) is a term used to describe programs that focus on developing career skills for students within K-12 or post-secondary programs. Industry Recognized Credential: A verification of qualifications or competence, issued by a third party with the relevant authority to issue such credential. The term credential encompasses educational certificates, degrees, certifications, and government-issued licenses. Labor Market Analysis: This analysis leveraged economic and industry data from EMSI, which included occupation data and focused on the number of total positions, annual openings and median wages in Hawaii which was used to assess the demand for various types of positions and whether or not they paid a living wage. Priority Occupations: There were 274 identified priority occupations that met wage and demand thresholds. Promising Credential: After applying all wage and occupational (volume and growth) thresholds - there were 1,942 promising credentials identified. These credentials were further validated through industry surveys and employer focus groups and the total number of credentials included are 137. Threshold, Wage: A wage threshold was established to provide a cut off point for what would be considered a living wage. The project referenced the 2020 ALICE Report and MIT Living Wage. All identified occupations and associated credentials in this report meet at least the ALICE Individual wage threshold. Table 3 shows the breakdown of occupations within in each category of demand by wage threshold. Threshold, Demand: Occupational demand thresholds represent a combination of occupational growth projections, annual job openings, and total volume of positions in each occupation. In reviewing these data, two main groups of occupations emerged – those that have a high volume of positions and annuals openings within the state (250 or more total positions and at least 50 annual openings) and those that have fewer positions total, but are growing (at least 25 annual openings and positive growth projections).