project 216: lab testing and modeling of advanced variable
TRANSCRIPT

1
Project 216: Lab Testing and Modeling of Advanced Variable Refrigerant Flow Systems
Project Start: 12/3/2010 End Date: 3/31/13 Total Project Budget: $784, 842 BPA Budget: $392,421 Cost Share: $ 392,421 BPA Project Actuals: BPA FTE Budget: 0.15 BPA FTE Actuals: 0.10 BPA PM: Mira Vowles Principal Investigator: Ron Domitrovic, EPRI Project Stakeholders: Utilities and VRF designers
February 2012

2
VRF Heat Pump
VRF Heat Recovery Heat Pump
Variable Refrigerant Flow (VRF) Systems

VRF Performance Testing
BPA relies on building energy simulation models to estimate VRF savings
Currently 6 models use: manufacturer performance data unverified operating characteristics
This project accomplishes: Better understanding of VRF heat recovery heat pumps Performance maps over wide operating ranges Models based on actual performance data Models vetted with field data
3

4
Project Synopsis FY 2011 accomplishments 4-zone test facility built Two heat recovery systems tested One heat pump system tested with leveraged funds FY2012 planned deliverables: Performance maps for 3 ducted & 1 non-ducted systems Support VRF model development
FY2013 planned deliverable:
Vet models with field data

5
Accomplishments VRF HR Test Stand
Unique system capable of independent control of four indoor zones

Comparison of Lab Tested Heating Capacity and Mitsubishi Published Data
6

Comparison of Lab Tested Cooling Capacity and Mitsubishi Published Data
7
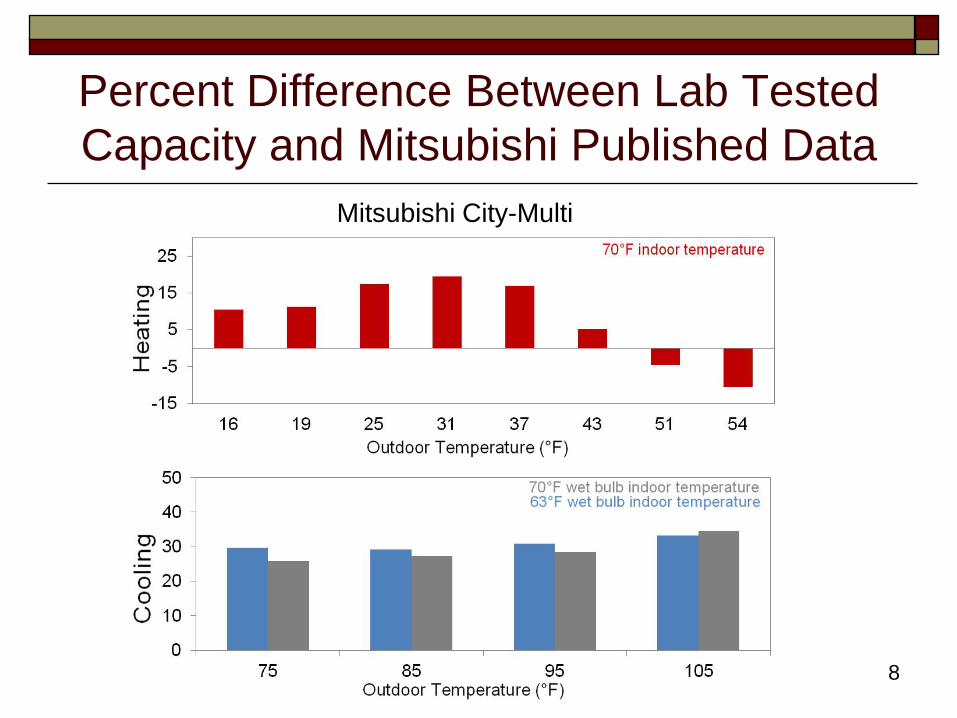
Percent Difference Between Lab Tested Capacity and Mitsubishi Published Data
Mitsubishi City-Multi
8

9
Next Steps FY 2012:
Provide data to modelers Stage Gate: Is data appropriate for modelers?
• Adjust data as appropriate
Test 3rd & 4th systems Stage Gate: Can test-stand accommodate non-ducted systems?
(Testing to date has been on ducted systems)
FY 2013: Vet models with field data

Collaborative VRF Performance Testing
Project Team: Mira Vowles, BPA PM Ron Domitrovic, EPRI PM Harshal Upadhye, EPRI Sr. Engineer Walt Hunt, EPRI Engineer John Bush, EPRI Engineer Ammi Amarnath, EPRI Technical Advisor
Collaborators: Paul Delaney, SCE PM Bach Tsan, SCE Engineer Jerine Ahmed, SCE Technical Advisor Richard Raustead, FSEC PM
10
11
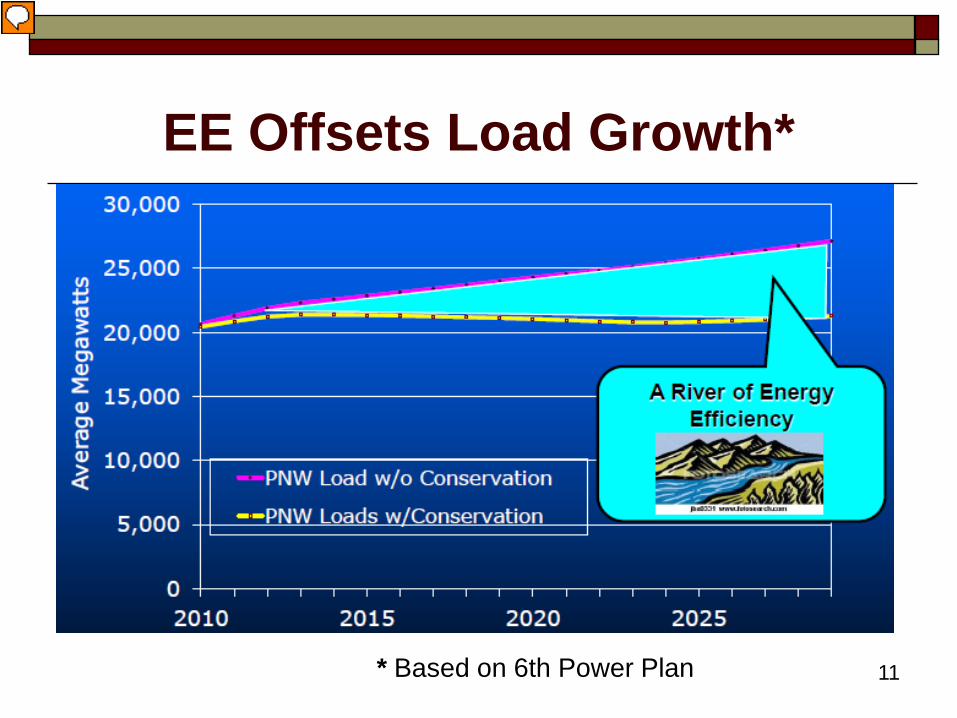
EE Offsets Load Growth*
* Based on 6th Power Plan

12
Expected Value to BPA / Region *
4.6 aMW to offset load growth $21 million cost savings Ancillary service potential BPA seen as a leader Access to future results * Based on:
6th Power Plan Incremental generation cost ($52 per MWh) For energy savings over the life of the measure

13
Technology Transfer Plan
Activity Results Provide VRF data
Support model development
Vet models with field data
Streamline VRF custom projects
Education & Outreach
Data and report on BPA website
Feedback to manufacturers
Develop VRF system best practices
Proven and tested models
VRF savings offset regional load growth
Acquisition of cost effective savings
Public access to information
Improved VRF systems
Customer satisfaction & reliable savings

14
PNW VRF Outreach Plan Share early research:
VRF Sub-Committee BPA Transmission Planning
Measure outreach: BPA Energy Efficiency E3T HVAC TAG BPA Utilities Building Simulation Users Group RETAC, SCE, EPRI, etc.

15
Summary Multi-year project on track
Expect to be within budget
BPA’s Lab equipment testing
No intellectual property issues

Questions?

Comparison of Lab Tested Heating Capacity and LG Published Data
17

Comparison of Lab Tested Cooling Capacity and LG Published Data
18