product brochure: asia-pacific online travel market 2016
TRANSCRIPT
ASIA-PACIFIC ONLINE TRAVEL MARKET 2016 PUBLICATION DATE: NOVEMBER 2016
PAGE 2 GENERAL INFORMATION I PAGE 3 KEY FINDINGS I PAGE 4 - 6 TABLE OF CONTENTS I PAGE 7 REPORT-SPECIFIC SAMPLE
CHARTS I PAGE 8 METHODOLOGY I PAGE 9 RELATED REPORTS I PAGE 10 CLIENTS I PAGE 11-12 FREQUENTLY ASKED QUESTIONS
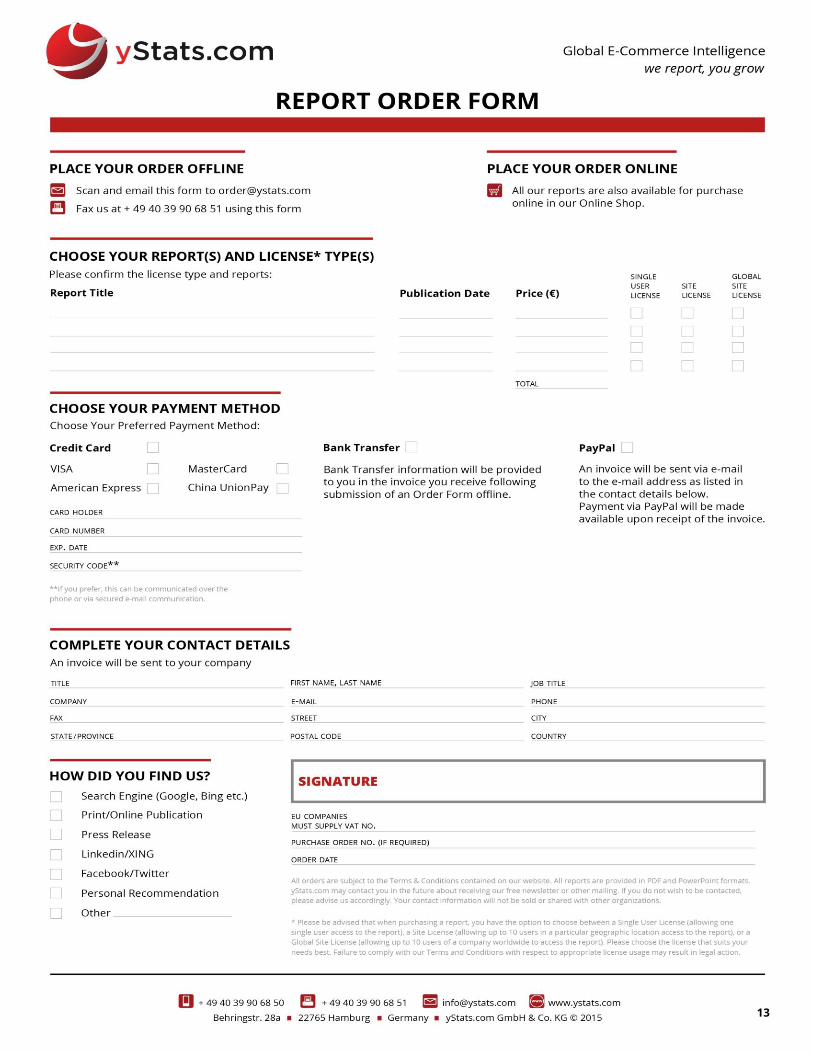
PAGE 13 ORDER FORM I PAGE 14 TERMS AND CONDITIONS
2
2
PRODUCT DETAILS Title:
Type of Product:
Category:
Covered Regions:
Covered Countries:
Language:
Formats:
Number of Charts:
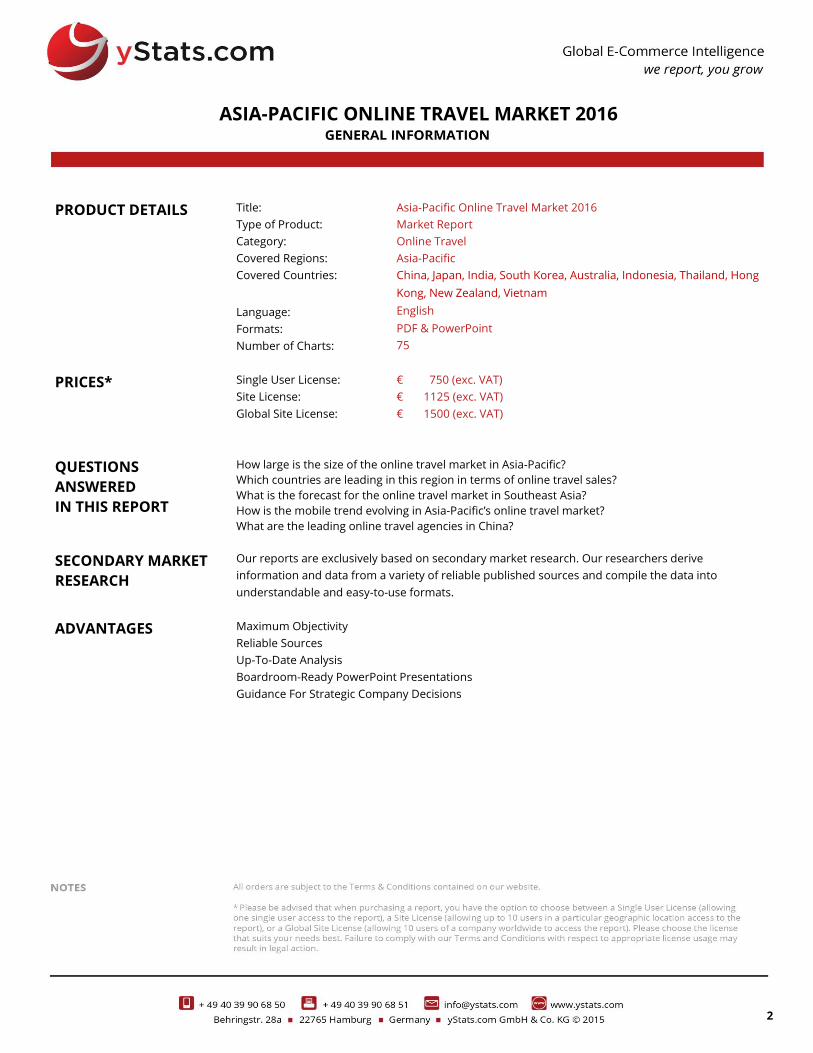
Asia-Pacific Online Travel Market 2016
Market Report
Online Travel
Asia-Pacific
China, Japan, India, South Korea, Australia, Indonesia, Thailand, Hong
Kong, New Zealand, Vietnam
English
PDF & PowerPoint
75
PRICES* Single User License:
Site License:
Global Site License:
€ 750 (exc. VAT)
€ 1125 (exc. VAT)
€ 1500 (exc. VAT)
QUESTIONS
ANSWERED
IN THIS REPORT
How large is the size of the online travel market in Asia-Pacific?
Which countries are leading in this region in terms of online travel sales?
What is the forecast for the online travel market in Southeast Asia?
How is the mobile trend evolving in Asia-Pacific’s online travel market?
What are the leading online travel agencies in China?
SECONDARY MARKET
RESEARCH
Our reports are exclusively based on secondary market research. Our researchers derive
information and data from a variety of reliable published sources and compile the data into
understandable and easy-to-use formats.
ADVANTAGES Maximum Objectivity
Reliable Sources
Up-To-Date Analysis
Boardroom-Ready PowerPoint Presentations
Guidance For Strategic Company Decisions
ASIA-PACIFIC ONLINE TRAVEL MARKET 2016

ASIA-PACIFIC TO BECOME THE LARGEST ONLINE TRAVEL MARKET WORLDWIDE
Online travel sales are growing rapidly across Asia-Pacific, leading to the prediction
that this region will soon overtake North America as the largest online travel market
worldwide. The forecast cited in the yStats.com report reveals that the share of this region
in global online travel sales will increase considerably, supported by strong double-digit
growth, the highest among all global regions. The most stunning growth is expected in
Southeast Asia, with online travel sales there predicted to quadruple in next 10 years.
The yStats.com report highlights China as the largest online travel market in this
region. Outbound travel and mobile bookings are the two driving forces for China’s market,
with Ctrip as the largest online travel agency. The mobile trend is also prominent in Japan,
where close to a third of all travel bookings were made via mobile in 2015, and in South
Korea, where this share was even higher. The online travel market in India grew at rates of
over +50% in 2015 and 2016, while in some other emerging markets, such as Thailand and
Vietnam, the popularity of travel as an online shopping category is yet to catch up.
ASIA-PACIFIC ONLINE TRAVEL MARKET 2016
3
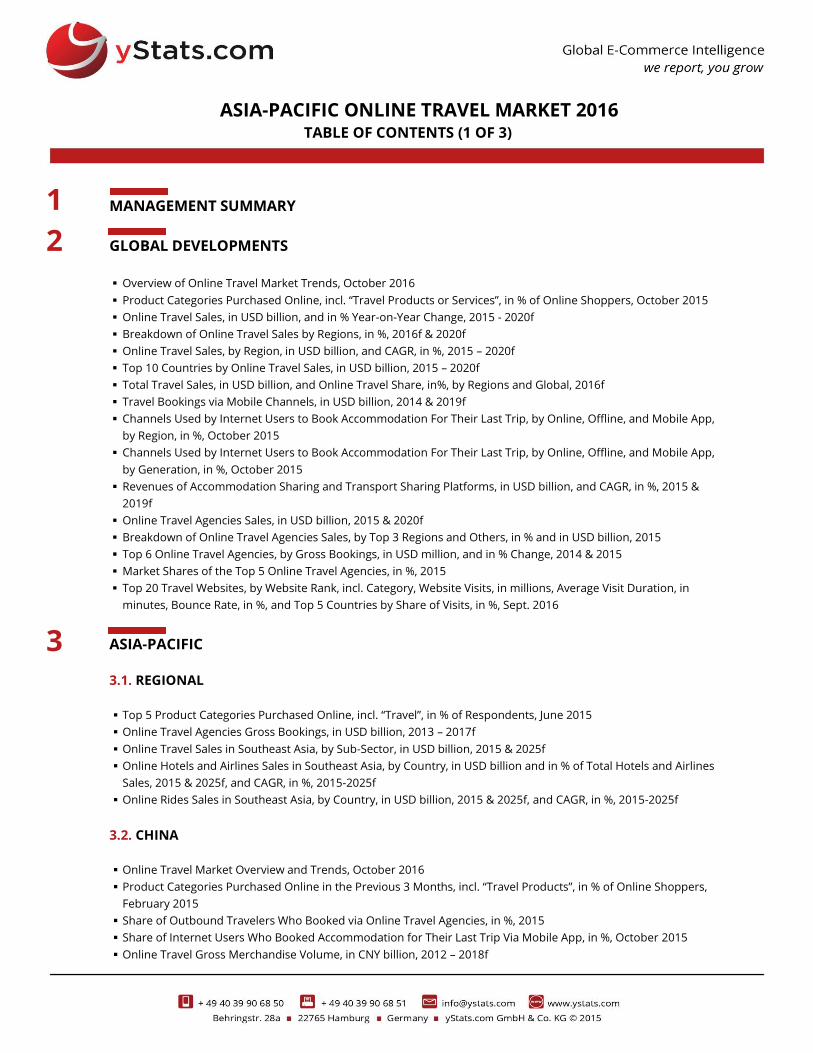
MANAGEMENT SUMMARY
GLOBAL DEVELOPMENTS
Overview of Online Travel Market Trends, October 2016
Product Categories Purchased Online, incl. “Travel Products or Services”, in % of Online Shoppers, October 2015
Online Travel Sales, in USD billion, and in % Year-on-Year Change, 2015 - 2020f
Breakdown of Online Travel Sales by Regions, in %, 2016f & 2020f
Online Travel Sales, by Region, in USD billion, and CAGR, in %, 2015 – 2020f
Top 10 Countries by Online Travel Sales, in USD billion, 2015 – 2020f
Total Travel Sales, in USD billion, and Online Travel Share, in%, by Regions and Global, 2016f
Travel Bookings via Mobile Channels, in USD billion, 2014 & 2019f
Channels Used by Internet Users to Book Accommodation For Their Last Trip, by Online, Offline, and Mobile App,
by Region, in %, October 2015
Channels Used by Internet Users to Book Accommodation For Their Last Trip, by Online, Offline, and Mobile App,
by Generation, in %, October 2015
Revenues of Accommodation Sharing and Transport Sharing Platforms, in USD billion, and CAGR, in %, 2015 &
2019f
Online Travel Agencies Sales, in USD billion, 2015 & 2020f
Breakdown of Online Travel Agencies Sales, by Top 3 Regions and Others, in % and in USD billion, 2015
Top 6 Online Travel Agencies, by Gross Bookings, in USD million, and in % Change, 2014 & 2015
Market Shares of the Top 5 Online Travel Agencies, in %, 2015
Top 20 Travel Websites, by Website Rank, incl. Category, Website Visits, in millions, Average Visit Duration, in
minutes, Bounce Rate, in %, and Top 5 Countries by Share of Visits, in %, Sept. 2016
ASIA-PACIFIC
3.1. REGIONAL
Top 5 Product Categories Purchased Online, incl. “Travel”, in % of Respondents, June 2015
Online Travel Agencies Gross Bookings, in USD billion, 2013 – 2017f
Online Travel Sales in Southeast Asia, by Sub-Sector, in USD billion, 2015 & 2025f
Online Hotels and Airlines Sales in Southeast Asia, by Country, in USD billion and in % of Total Hotels and Airlines
Sales, 2015 & 2025f, and CAGR, in %, 2015-2025f
Online Rides Sales in Southeast Asia, by Country, in USD billion, 2015 & 2025f, and CAGR, in %, 2015-2025f
3.2. CHINA
Online Travel Market Overview and Trends, October 2016
Product Categories Purchased Online in the Previous 3 Months, incl. “Travel Products”, in % of Online Shoppers,
February 2015
Share of Outbound Travelers Who Booked via Online Travel Agencies, in %, 2015
Share of Internet Users Who Booked Accommodation for Their Last Trip Via Mobile App, in %, October 2015
Online Travel Gross Merchandise Volume, in CNY billion, 2012 – 2018f
ASIA-PACIFIC ONLINE TRAVEL MARKET 2016
1
2
3
TABLE OF CONTENTS (1 OF 3)
5
5
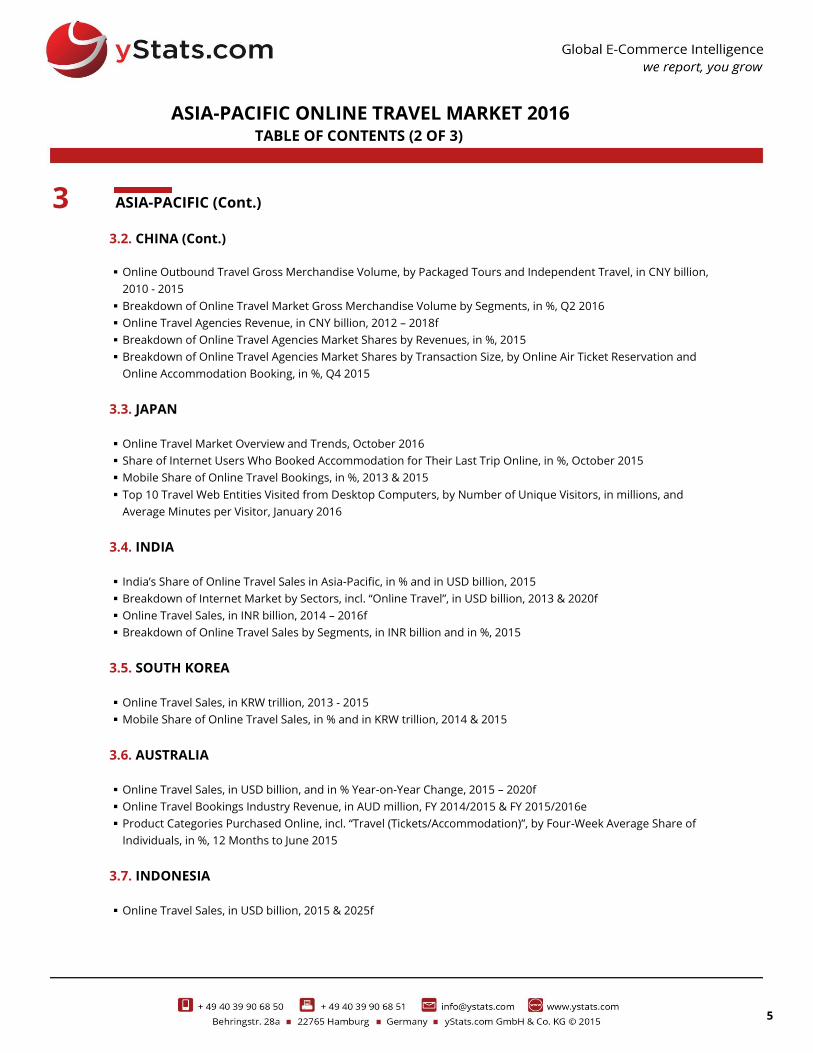
ASIA-PACIFIC (Cont.)
3.2. CHINA (Cont.)
Online Outbound Travel Gross Merchandise Volume, by Packaged Tours and Independent Travel, in CNY billion,
2010 - 2015
Breakdown of Online Travel Market Gross Merchandise Volume by Segments, in %, Q2 2016
Online Travel Agencies Revenue, in CNY billion, 2012 – 2018f
Breakdown of Online Travel Agencies Market Shares by Revenues, in %, 2015
Breakdown of Online Travel Agencies Market Shares by Transaction Size, by Online Air Ticket Reservation and
Online Accommodation Booking, in %, Q4 2015
3.3. JAPAN
Online Travel Market Overview and Trends, October 2016
Share of Internet Users Who Booked Accommodation for Their Last Trip Online, in %, October 2015
Mobile Share of Online Travel Bookings, in %, 2013 & 2015
Top 10 Travel Web Entities Visited from Desktop Computers, by Number of Unique Visitors, in millions, and
Average Minutes per Visitor, January 2016
3.4. INDIA
India’s Share of Online Travel Sales in Asia-Pacific, in % and in USD billion, 2015
Breakdown of Internet Market by Sectors, incl. “Online Travel”, in USD billion, 2013 & 2020f
Online Travel Sales, in INR billion, 2014 – 2016f
Breakdown of Online Travel Sales by Segments, in INR billion and in %, 2015
3.5. SOUTH KOREA
Online Travel Sales, in KRW trillion, 2013 - 2015
Mobile Share of Online Travel Sales, in % and in KRW trillion, 2014 & 2015
3.6. AUSTRALIA
Online Travel Sales, in USD billion, and in % Year-on-Year Change, 2015 – 2020f
Online Travel Bookings Industry Revenue, in AUD million, FY 2014/2015 & FY 2015/2016e
Product Categories Purchased Online, incl. “Travel (Tickets/Accommodation)”, by Four-Week Average Share of
Individuals, in %, 12 Months to June 2015
3.7. INDONESIA
Online Travel Sales, in USD billion, 2015 & 2025f
ASIA-PACIFIC ONLINE TRAVEL MARKET 2016
TABLE OF CONTENTS (2 OF 3)
3
6
6
ASIA-PACIFIC (Cont.)
3.8. THAILAND
Product Categories Purchased Online, incl. “Travel & Tourism”, in % of Online Shoppers, May 2015
3.9. HONG KONG
Product Categories Purchased Online, incl. “Travel”, in % of Online Shoppers, 2015
3.10. NEW ZEALAND
Product Categories Purchased Online, incl. “Travel (Tickets/Accommodation)”, by Four-Week Average Share of
Individuals, in %, 12 Months to June 2015
3.11. VIETNAM
Product Categories Purchased Online, incl. “Train and Air Tickets” and “Tour and Hotel Booking”, in % of Online
Shoppers, 2015
ASIA-PACIFIC ONLINE TRAVEL MARKET 2016
TABLE OF CONTENTS (3 OF 3)
3

7
7
ASIA-PACIFIC ONLINE TRAVEL MARKET 2016
REPORT-SPECIFIC SAMPLE CHARTS
GENERAL METHODOLOGY OF OUR MARKET REPORTS Secondary Market Research
The reports are compiled based on secondary market
research. Secondary research is information gathered from
previously published sources. Our reports are solely based on
information and data acquired from national and international
statistical offices, industry and trade associations, business
reports, business and company databases, journals, company
registries, news portals and many other reliable sources. By using
various sources we ensure maximum objectivity for all obtained
data. As a result, companies gain a precise and unbiased
impression of the market situation.
Cross referencing of data is conducted in order to
ensure validity and reliability.
The source of information and its release date are
provided on every chart. It is possible that the information
contained in one chart is derived from several sources. If this is
the case, all sources are mentioned on the chart.
The reports include mainly data from the last 12 months
prior to the date of report publication. Exact publication dates are
mentioned in every chart.
Definitions
The reports take into account a broad definition of B2C
E-Commerce, which might include mobile commerce. As
definitions may vary among sources, exact definition used by the
source (if available) is included at the bottom of the chart.
Chart Types
Our reports include text charts, pie charts, bar charts,
rankings, line graphs and tables. Every chart contains an Action
Title, which summarizes the main idea/finding of the chart and a
Subtitle, which provides necessary information about the
country, the topic, units or measures of currency, and the
applicable time period(s) to which the data refers. With respect to
rankings, it is possible that the summation of all categories
amounts to more than 100%. In this case, multiple answers were
possible, which is noted at the bottom of the chart.
Report Structure
Reports are comprised of the following elements, in the
following order: Cover page, preface, legal notice, methodology,
definitions, table of contents, management summary
(summarizing main information contained in each section of
report) and report content (divided into sections and chapters).
When available, we also include forecasts in our report content.
These forecasts are not our own; they are published by reliable
sources. Within Global and Regional reports, we include all major
developed and emerging markets, ranked in order of importance
by using evaluative criteria such as sales figures.
Notes and Currency Values
If available, additional information about the data
collection, for example the time of survey and number of people
surveyed, is provided in the form of a note. In some cases, the
note (also) contains additional information needed to fully
understand the contents of the respective data.
When providing information about amounts of money,
local currencies are most often used. When referencing currency
values in the Action Title, the EUR values are also provided in
brackets. The conversions are always made using the average
currency exchange rate for the respective time period. Should the
currency figure be in the future, the average exchange rate of the
past 12 months is used.
METHODOLOGY OF OUR ASIA-PACIFIC ONLINE TRAVEL MARKET 2016 REPORT Report Coverage
This report covers the online travel market. It takes into
account a wide definition of the travel segment, including
transportation, accommodation, tour packages and others.
Besides sales figures, penetration and rankings, this report also
reveals important market trends that affect the online travel
market, such as the rise of mobile bookings and peer-to-peer
services.
This report is focused on the online travel market in
Asia-Pacific and covers all major markets in this region. Besides
regional and country data, also information about global
developments is included.
Report Structure
The global chapter opens the report, including an
overview of global market developments, trends, regional and
country comparisons.
The rest of the report is devoted to Asia-Pacific. Regional
information is presented first, followed by country chapters.
The countries are presented in the order of descending
online travel sales. Where no comparable sales figures were
available, other related criteria such as total E-Commerce sales,
online shopper and Internet penetration were applied.
In the country sections, the following information is
covered, where available: online travel sales, the share of online
shoppers booking travel services online and the rank of this
category among other E-Commerce product categories, total
revenues and shares of online travel agencies, platforms and
channels used by travelers to book travel services. Not all types of
information mentioned are provided for each country, due to
varying data availability.
For the two leading online travel markets in Asia-Pacific
(China and Japan), text charts with a qualitative overview of the
online travel market, trends and players are included.
ASIA-PACIFIC ONLINE TRAVEL MARKET 2016
8

UPCOMING RELATED REPORTS
Europe Online Travel Market 2016 October 2016 € 750
Top 5 Online Travel Markets 2016 October 2016 € 750
Global Online Travel Market 2016 October 2016 € 2,450
Asia-Pacific Online Payment Methods: First Half 2016 September 2016 € 750
Asia-Pacific Online Payment Methods: Full Year 2015 March 2016 € 1,950
Asia-Pacific B2C E-Commerce Market 2015 October 2015 € 3,450
Southeast Asia B2C E-Commerce Market 2015 September 2015 € 1,950
China B2C E-Commerce Market 2015 September 2015 € 950
India B2C E-Commerce Market 2015 September 2015 € 950
Global Mobile Payment Methods: First Half 2016 October 2016 € 950
Global Alternative Online Payment Methods: First Half 2016 September 2016 € 950
Global Online Payment Methods: First Half 2016 September 2016 € 1,950
Global B2C E-Commerce Market 2016 June 2016 € 4,950
Trends in Worldwide Internet Retail 2016 July 2016 € 1,450
Top Players in Global B2C E-Commerce Market 2016 July 2016 € 950
MENA B2C E-Commerce Market 2016 June 2016 € 2,950
Africa B2C E-Commerce Market 2016 May 2016 € 1,950
Middle East B2C E-Commerce Market 2016 May 2016 € 1,950
Latin America B2C E-Commerce Market 2016 March 2016 € 1,950
Europe B2C E-Commerce Market 2016 February 2016 € 2,950
North America B2C E-Commerce Market 2015 November 2015 € 950
REPORT
PUBLICATION
DATE
PRICE*
Global Cross-Border B2C E-Commerce 2016 December 2016 € 2,950
Asia-Pacific Cross-Border B2C E-Commerce 2016 December 2016 € 950
ASIA-PACIFIC ONLINE TRAVEL MARKET 2016
9
10

11

12
13
14