preliminary report on the 2004 great indian ocean … report on the 2004 great indian ocean tsunami:...
TRANSCRIPT

Preliminary Report on the 2004 Great Indian Ocean Tsunami: Tsunami Survey along the South-East Indian Coast
Harry Yeh, Oregon State University, USA Curt Peterson, Portland State University, USA
R.K. Chadha, National Geophysical Research Institute, Hyderabad, India G. Latha, National Institute of Ocean Technology, Chennai, India
Toshitaka Katada, Gunma University, Japan The Great Indian Ocean Tsunami was an extraordinary event in the history of natural hazards. At 00:58:49 (GMT) on December 26, 2004, a strong earthquake of magnitude Mw=9.0 struck at (3.09˚N, 94.26˚E) of north-west off Sumatra, which soon triggered giant tsunamis that propagated throughout the entire oceans on the earth. Tsunamis killed more than 300,000 people in Indonesia, Thailand, Malaysia, Myanmar, Bangladesh, India, Sri Lanka, Maldives, and African counties. The aftershock pattern indicates that the fault rupture spanned more than 1200km-long of the India-plate subduction beneath the overriding Burma plate. There is no doubt that this event will provide many opportunities to explore both basic and applied research in tsunami science and engineering fields, which directly and indirectly lead to better preparedness for the future disaster. However, unlike the previous tsunami events since the 1964 Great Alaskan Earthquake and Tsunamis, seriously affected areas are so vast, literally the entire Indian Ocean basin, which makes the traditional ground-level tsunami survey difficult to cover the necessary areas. Here we report a portion of international tsunami survey efforts, which covered from Vedaranniyam (10˚23.5’N) to Pulicat (13˚23.0’N), the 350 km stretch of the South-East Indian Coast. It is emphasized that the area was suffered by the distant tsunami, more than 1500 km away from the tsunami source.
Tsunami Survey Our international team was comprised of 8 members, having very distinct disciplinary and
background from each other: five from India (a seismologist, a ocean scientist, a graduate student and two assistants), two from US (a sedimentologist and a tsunami hydrodynamist) and one from Japan (a social engineer). The team began its tsunami survey along the South-East Indian Coast (in Tamil Nadu and Pondicherry), gathering the data from January 7 through January 11, 2005. Both initial media reports and our preliminary numerical prediction indicate that the most affected area is south of Chennai, and that was the area we targeted. The survey consisted of measurements of maximum tsunami runup heights and distances, average runup heights and areas of inundation, flow patterns of runup and rundown, and recording of eyewitness accounts. Because of the distant tsunami, no observation of subsidence, uplift, and landslides was made, although we examined geomorphological changes and sediment deposits by tsunami. The maximum tsunami runup height is defined as the vertical water-surface elevation reached by the tsunamis above sea level. It was measured using the standard surveying instrumentation. The maximum runup locations were determined visually based on watermarks on structures and/or the ground, breakage of the tree limbs, scratch-marks on trees or structures caused by water-borne objects, and/or the locations of waterborne debris. Every mark used for the runup was photographed for archiving and its location was identified using a global positioning system
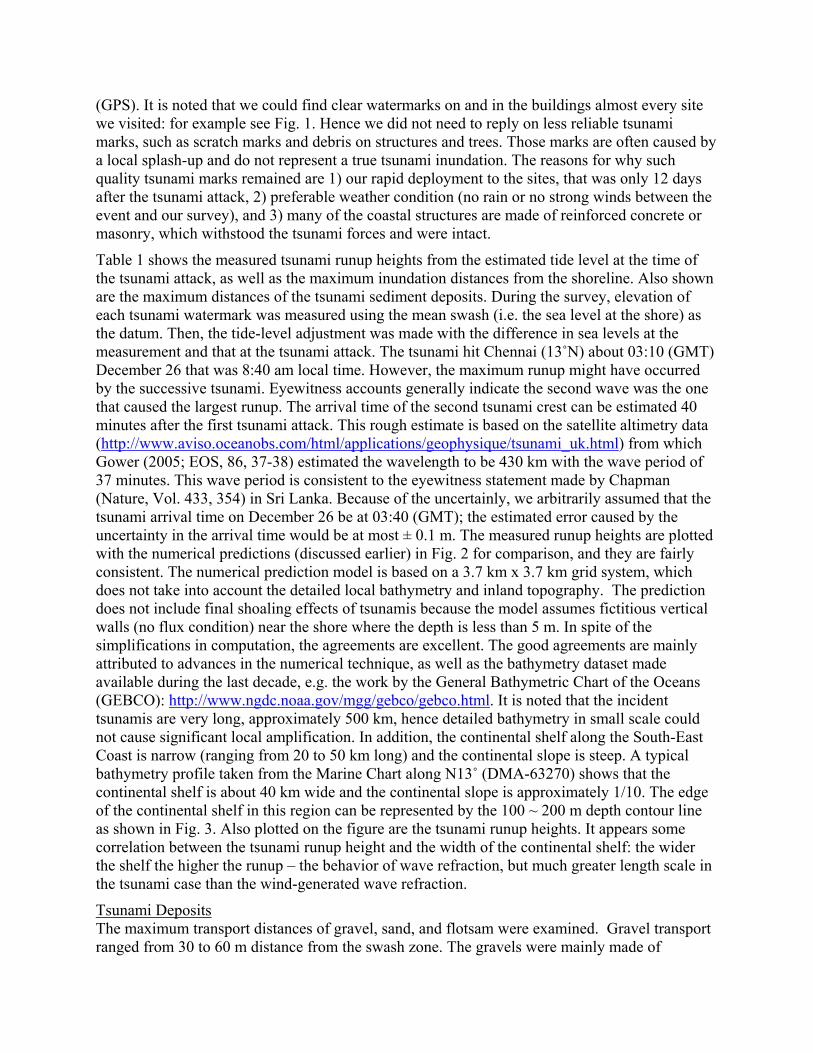
(GPS). It is noted that we could find clear watermarks on and in the buildings almost every site we visited: for example see Fig. 1. Hence we did not need to reply on less reliable tsunami marks, such as scratch marks and debris on structures and trees. Those marks are often caused by a local splash-up and do not represent a true tsunami inundation. The reasons for why such quality tsunami marks remained are 1) our rapid deployment to the sites, that was only 12 days after the tsunami attack, 2) preferable weather condition (no rain or no strong winds between the event and our survey), and 3) many of the coastal structures are made of reinforced concrete or masonry, which withstood the tsunami forces and were intact.
Table 1 shows the measured tsunami runup heights from the estimated tide level at the time of the tsunami attack, as well as the maximum inundation distances from the shoreline. Also shown are the maximum distances of the tsunami sediment deposits. During the survey, elevation of each tsunami watermark was measured using the mean swash (i.e. the sea level at the shore) as the datum. Then, the tide-level adjustment was made with the difference in sea levels at the measurement and that at the tsunami attack. The tsunami hit Chennai (13˚N) about 03:10 (GMT) December 26 that was 8:40 am local time. However, the maximum runup might have occurred by the successive tsunami. Eyewitness accounts generally indicate the second wave was the one that caused the largest runup. The arrival time of the second tsunami crest can be estimated 40 minutes after the first tsunami attack. This rough estimate is based on the satellite altimetry data (http://www.aviso.oceanobs.com/html/applications/geophysique/tsunami_uk.html) from which Gower (2005; EOS, 86, 37-38) estimated the wavelength to be 430 km with the wave period of 37 minutes. This wave period is consistent to the eyewitness statement made by Chapman (Nature, Vol. 433, 354) in Sri Lanka. Because of the uncertainly, we arbitrarily assumed that the tsunami arrival time on December 26 be at 03:40 (GMT); the estimated error caused by the uncertainty in the arrival time would be at most ± 0.1 m. The measured runup heights are plotted with the numerical predictions (discussed earlier) in Fig. 2 for comparison, and they are fairly consistent. The numerical prediction model is based on a 3.7 km x 3.7 km grid system, which does not take into account the detailed local bathymetry and inland topography. The prediction does not include final shoaling effects of tsunamis because the model assumes fictitious vertical walls (no flux condition) near the shore where the depth is less than 5 m. In spite of the simplifications in computation, the agreements are excellent. The good agreements are mainly attributed to advances in the numerical technique, as well as the bathymetry dataset made available during the last decade, e.g. the work by the General Bathymetric Chart of the Oceans (GEBCO): http://www.ngdc.noaa.gov/mgg/gebco/gebco.html. It is noted that the incident tsunamis are very long, approximately 500 km, hence detailed bathymetry in small scale could not cause significant local amplification. In addition, the continental shelf along the South-East Coast is narrow (ranging from 20 to 50 km long) and the continental slope is steep. A typical bathymetry profile taken from the Marine Chart along N13˚ (DMA-63270) shows that the continental shelf is about 40 km wide and the continental slope is approximately 1/10. The edge of the continental shelf in this region can be represented by the 100 ~ 200 m depth contour line as shown in Fig. 3. Also plotted on the figure are the tsunami runup heights. It appears some correlation between the tsunami runup height and the width of the continental shelf: the wider the shelf the higher the runup – the behavior of wave refraction, but much greater length scale in the tsunami case than the wind-generated wave refraction.
Tsunami Deposits The maximum transport distances of gravel, sand, and flotsam were examined. Gravel transport ranged from 30 to 60 m distance from the swash zone. The gravels were mainly made of
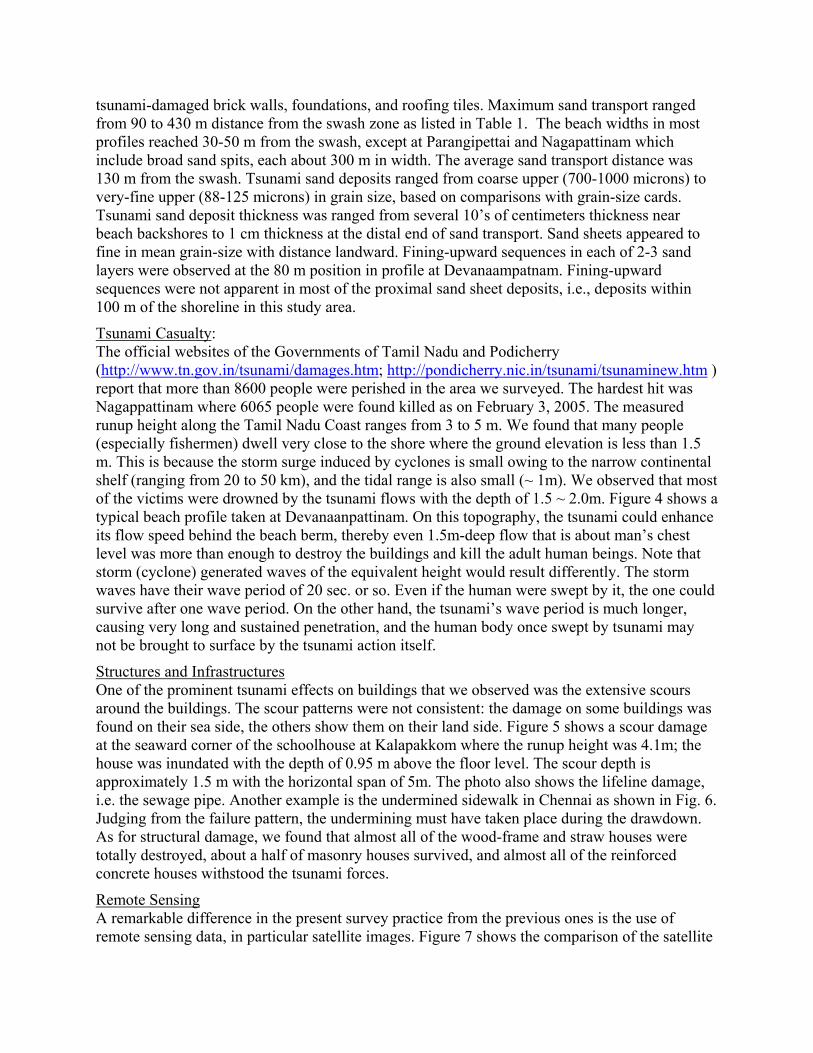
tsunami-damaged brick walls, foundations, and roofing tiles. Maximum sand transport ranged from 90 to 430 m distance from the swash zone as listed in Table 1. The beach widths in most profiles reached 30-50 m from the swash, except at Parangipettai and Nagapattinam which include broad sand spits, each about 300 m in width. The average sand transport distance was 130 m from the swash. Tsunami sand deposits ranged from coarse upper (700-1000 microns) to very-fine upper (88-125 microns) in grain size, based on comparisons with grain-size cards. Tsunami sand deposit thickness was ranged from several 10’s of centimeters thickness near beach backshores to 1 cm thickness at the distal end of sand transport. Sand sheets appeared to fine in mean grain-size with distance landward. Fining-upward sequences in each of 2-3 sand layers were observed at the 80 m position in profile at Devanaampatnam. Fining-upward sequences were not apparent in most of the proximal sand sheet deposits, i.e., deposits within 100 m of the shoreline in this study area. Tsunami Casualty: The official websites of the Governments of Tamil Nadu and Podicherry (http://www.tn.gov.in/tsunami/damages.htm; http://pondicherry.nic.in/tsunami/tsunaminew.htm ) report that more than 8600 people were perished in the area we surveyed. The hardest hit was Nagappattinam where 6065 people were found killed as on February 3, 2005. The measured runup height along the Tamil Nadu Coast ranges from 3 to 5 m. We found that many people (especially fishermen) dwell very close to the shore where the ground elevation is less than 1.5 m. This is because the storm surge induced by cyclones is small owing to the narrow continental shelf (ranging from 20 to 50 km), and the tidal range is also small (~ 1m). We observed that most of the victims were drowned by the tsunami flows with the depth of 1.5 ~ 2.0m. Figure 4 shows a typical beach profile taken at Devanaanpattinam. On this topography, the tsunami could enhance its flow speed behind the beach berm, thereby even 1.5m-deep flow that is about man’s chest level was more than enough to destroy the buildings and kill the adult human beings. Note that storm (cyclone) generated waves of the equivalent height would result differently. The storm waves have their wave period of 20 sec. or so. Even if the human were swept by it, the one could survive after one wave period. On the other hand, the tsunami’s wave period is much longer, causing very long and sustained penetration, and the human body once swept by tsunami may not be brought to surface by the tsunami action itself.
Structures and Infrastructures One of the prominent tsunami effects on buildings that we observed was the extensive scours around the buildings. The scour patterns were not consistent: the damage on some buildings was found on their sea side, the others show them on their land side. Figure 5 shows a scour damage at the seaward corner of the schoolhouse at Kalapakkom where the runup height was 4.1m; the house was inundated with the depth of 0.95 m above the floor level. The scour depth is approximately 1.5 m with the horizontal span of 5m. The photo also shows the lifeline damage, i.e. the sewage pipe. Another example is the undermined sidewalk in Chennai as shown in Fig. 6. Judging from the failure pattern, the undermining must have taken place during the drawdown. As for structural damage, we found that almost all of the wood-frame and straw houses were totally destroyed, about a half of masonry houses survived, and almost all of the reinforced concrete houses withstood the tsunami forces.
Remote Sensing A remarkable difference in the present survey practice from the previous ones is the use of remote sensing data, in particular satellite images. Figure 7 shows the comparison of the satellite

image with the ground-level survey. The washed up ship on the quay can be identified in the satellite image. The small anomaly next to the ship in the satellite image was found to be a damaged concrete block of the quay wall. This demonstrates that the correct interpretation of satellite image can be made by the ground-level survey. Another example is shown in Fig. 8 that was taken at the same spot but in the opposite direction. The ground-level photograph shows many damaged boats stacked on the quay, while no such boats are found in the satellite image that was taken prior to our survey. This discrepancy indicates that the boats were indeed carried after the event as the clean-up process and they were not caused by the tsunami; the satellite images can provide correct interpretation for the ground-level survey.
The December 26 2004 Great Indian Ocean Tsunami is undoubtedly a remarkable event that took away more than 300,000 human lives. Because of the size of the tsunamis, it is formidable to collect all the necessary data. We collected the data and information in approximately 350 km span of the South-East Indian coast, which would have been sufficient for the past tsunami surveys for the earthquake magnitudes less than Mw 8.0. That is not the case evidently. Even at the northern most survey location (~ 13.5˚N) the tsunami height is still significant (3.2 m). The additional survey in the region of the Central and North-East Indian coasts is critical to understand the tsunami strength distribution. Our rapid reconnaissance tsunami survey was supported by National Geophysical Research Institute in Hyderabad, National Institute of Ocean Technology in Chennai, Gunma University in Japan, and the US National Science Foundation through Earthquake Engineering Research Institute (EERI) as part of the Learning From Earthquakes (LFE) program. Reference Gower, J. 2005. Jason 1 detects the 26 December 2004 Tsunami, EOS, 86, 37-38.

Table 1 – Tsunami run-up surveys along the coast of Tamil Nadu and Pondicherry
Sl.No
Location Latitude oN/Longitude oE
Run-upelevation (m)
LateralInundation(m)
Max SandDistance (m)
1. Pulicat 13°23.040’80°19.984’__
3.2 160 90
2. Pattinapakam 13°01.263’_80°16.722’_
2.7 145 120
3. Kovalam 12°47.455’_80°15.003’_
4.3 180 120
4. Kalpakkam 12°30.378’ _80°09.688’ _
4.1 360 190
5. Periakalapet 12°01.544’ _79°51.888’ _
3.9 170 130
6. Puttupatnam 11°51.618’ _79°48.926’ _
2.6 -- --
7. Devanaam-patnam
11°44.576’ _79°47.230’ _
2.5 340 180
8. Parangipettai 11°30.965’ _79°45.947’ _
2.8 700 400
9. Tarangambadi 11°01.620’79°51.350’__
4.4 400 150
10. Nagapattinam 10°45.785’ _79°50.928’ _
5.2 800 430
11. Vedaranniyam 10°23.597’ _79°52.014’ _
3.6 -- --
• “Runup elevation” is the vertical distance between the still sea level at the time oftsunami attack and the maximum water level caused by the tsunami; tsunami markscaused by local effects, splash-up, etc. are excluded. Almost all of the values reportedabove are based on the sandy-mud-line marks remained inside of the houses. Suchhighly reliable quality data were possible because of our rapid reconnaissance.
Figure 1. Typical tsunami runup marks: a sandy-mud line on the outside of the inundated houseand the scratch marks evidently made by some floating objects. The similar sandy-mud markfound inside of the house is a more accurate tsunami mark since it is not influenced by thesplash-up or other local effects.
Scratch by a floating object
Mud line inside

Figure 2. Comparison of the numerical predictions with the measured tsunami runup heights.The numerical predictions are provided by Philip Liu. ** Note that I have not yet obtained apermission to use this figure from Philip **

10
10.5
11
11.5
12
12.5
13
13.5
14
0 10 20 30 40 50 60
Lati
tud
e (
˚)
Distance from the shoreline (km); runup heights (decimeter)Figure 3. The breadth of the continental shelf in the survey region, presented by the 100m and200m depth contours and the tsunami runup heights in decimeters.
Figure 4. A typical beach profile taken at Devanaanpattinam. The tsunami runup flow mayenhanced by the beach berm.
0
1
2
3
4
-50 0 50 100 150
Inshore Distance from the shore (m)
Ele
vati
on
(m
)
Tsunami inundation
Sea level

Figure 5. Tsunami scour and failure of a lifeline (sewage pipe) at a schoolhouse at Kalapakkom.
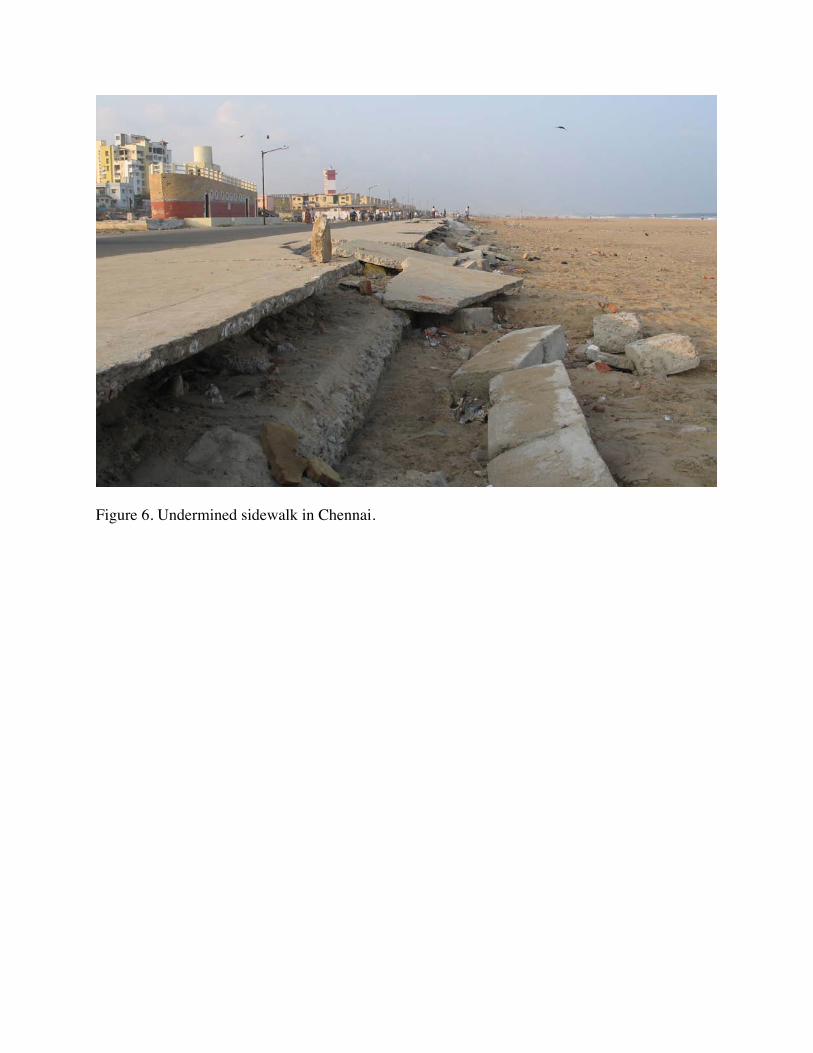
Figure 6. Undermined sidewalk in Chennai.
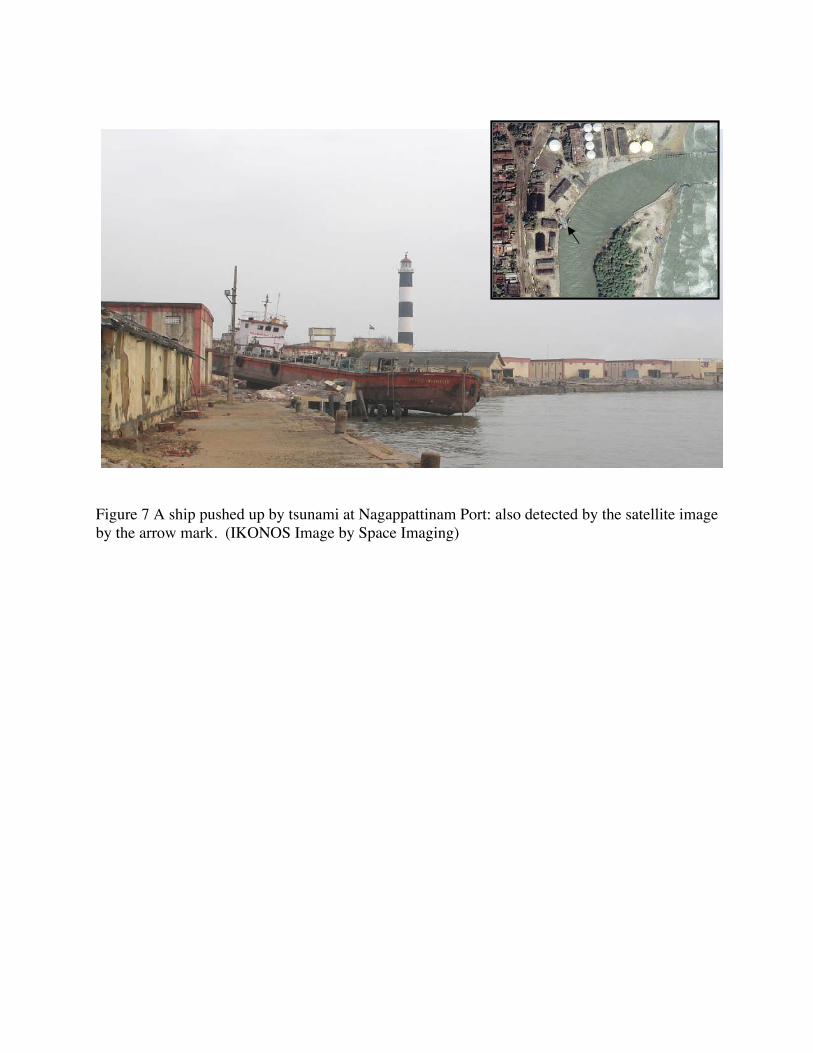
Figure 7 A ship pushed up by tsunami at Nagappattinam Port: also detected by the satellite imageby the arrow mark. (IKONOS Image by Space Imaging)

Figure 8. Many damaged fishing boats on the quay at Nagappattinam Port; no boat was presentin the satellite image. (IKONOS Image by Space Imaging)