prediction of student completion of an associate degree
TRANSCRIPT

East Tennessee State UniversityDigital Commons @ East
Tennessee State University
Electronic Theses and Dissertations Student Works
December 1995
Prediction of Student Completion of an AssociateDegree Radiologic Technology ProgramDonna R. ShehaneEast Tennessee State University
Follow this and additional works at: https://dc.etsu.edu/etd
Part of the Educational Administration and Supervision Commons, and the Training andDevelopment Commons
This Dissertation - Open Access is brought to you for free and open access by the Student Works at Digital Commons @ East Tennessee StateUniversity. It has been accepted for inclusion in Electronic Theses and Dissertations by an authorized administrator of Digital Commons @ EastTennessee State University. For more information, please contact [email protected].
Recommended CitationShehane, Donna R., "Prediction of Student Completion of an Associate Degree Radiologic Technology Program" (1995). ElectronicTheses and Dissertations. Paper 2792. https://dc.etsu.edu/etd/2792
INFORMATION TO USERS
This manuscript has been reproduced from the microfilm master. UMI films the text directly from the original or copy submitted Thus, some thesis and dissertation copies are in typewriter face, while others may be from any type of computer printer.
The quality of this reproduction is dependent upon the quality of the copy submitted. Broken or indistinct print, colored or poor quality illustrations and photographs, print bleedthrough, substandard margins, and improper alignment can adversely affect reproduction.
In the unlikely, event that the author did not send UMI a complete manuscript and there are missing pages, these will be noted Also, if unauthorized copyright material had to be removed, a note will indicate the deletion.
Oversize materials (e.g^ maps, drawings, charts) are reproduced by sectioning the original, beginning at the upper left-hand corner and continuing from left to right in equal sections with small overlaps. Each original is also photographed in one exposure and is included in reduced form at the back of the book.
Photographs included in the original manuscript have been reproduced xerographically in this copy. Higher quality 6" x 9” black and white photographic prints are available for any photographs or illustrations appearing in this copy for an additional charge. Contact UMI directly to order.
UMIA Bell & Howell Information Company
300 North Zeeb Road. Ann Arbor. Ml 48106*1346 USA 313/761-4700 600/521-0600

Prediction of Student Completion of an Associate Degree Radiologic
Technology Program
A Dissertation Presented to the Faculty of the Department
of Educational Leadership and Policy Analysis
In Partial Fulfillment of the Requirements for the Degree
Doctor of Education in Educational Leadership and Policy Analysis
byDonna Richardson Shehane
December 1995

OMI Number: 9608990
Copyright 1996 by Shehane* Donna Richardson
All rights reserved.
UMI Microform 9608990 Copyright 1996, by UMI Company. All rights reserved.
This microform edition is protected against unauthorized copying under Title 17, United States Code.
UMI300 North Zeeb Hoad Ann Arbor, MI 4B103

APPROVAL
This is to certify that the Graduate Committee of
The committee read and examined her dissertation/ supervised her defense of it in an oral examination/ and decided to recommend that her study be submitted to the Graduate Council/ in partial fulfillment of the requirements for the degree of Doctor of Education.
DONNA RICHARDSON SHEHANEmet on the
31st day of October, 1995
Chair, Graduate Committee
Signed on behalf of the Graduate Council 9 • @£XaJ ]Interim Dean/
School of Graduate Studies
ii

ABSTRACTPREDICTION OF STUDENT COMPLETION OF AN ASSOCIATE DEGREE
RADIOLOGIC TECHNOLOGY PROGRAMby
Donna Richardson ShehaneThe primary purpose of this study was to investigate the admission/selection process of the Radiologic Technology Program at East Tennessee State University to ascertain predictive validity of the admission process and to identify specific indicators leading to program completion. The population for this investigation consisted of 510 students who had applied to East Tennessee State University and the Radiologic Technology Program from 1991 through 1993. Data were collected from institutional and program academic records, correlation research was chosen to establish validity. One-way Analysis of Variance and t-test were applied to investigate different admission parameters and discriminate analysis was completed due to prior groupings in the initial academic analysis. An alpha level of .05 was selected for this study.The population (N 8 510) consisted of four groups of students: Program completers (graduates), program non-completers, students interviewed/not admitted, and students not interviewed nor admitted. One way analysis of variance (ANOVA) determined significant differences in all admission parameters between the four groups. Discriminate analysis of program completers and non-completers found that curriculum GPA ranking was significant explaining 47% of the shared variance. The population of students admitted to the program (N = 110) was further statistically analyzed by t-Tests and no significant differences were Identified between program completers and non completers.Based on the findings, the following conclusions were drawn: (1) The admission parameters utilized by the Radiologic Technology Program at East Tennessee State University were statistically significant in identifying differences among the four groups of students; (2) No significant differences were identified between program completers and noncompleters; (3) The admission model utilized by the Radiologic Technology Program is equitable. The following recommendations were suggested: (1) Further studies should be conducted incorporating demographic factors; (2) Studies addressing selection parameter
iii

reliability should be conducted; (3) Reliability of each interview question should be ascertained; (4) Studies involving common admission parameters at different sponsoring institutions should be investigated, and (5) Incorporation of qualitative methodology regarding program completion versuB noncompletion could be beneficial.
iv

INSTITUTIONAL REVIEW BOARD APPROVAL
This is to certify that the following study has been filed and approved by the Institutional Review Board of East Tennessee State University.
Title of Grant or Project Prediction of student________Completion of an Associate Degree Radiologic Technology Program_________________________________________________
Principal Investigator Donna Richardson Shehane________
Department Educational Leadership & Policy Analysis
Date Submitted July 1995___________ ^ N. ________
Institutional Review Board, Chairman
v

ACKNOWLEDGEMENTS I wish to thank God for giving me the ability and
the strength to complete this project and program of study. I also give praise to all those who have come before me making this accomplishment possible. I would like to properly thank those people who were incredibly supportive in my guest to complete this goal.
First, my family whose love and support has sustained me throughout my formal education, especially my mother, father, and my children, Ashley and Chase. Thank you for all of your confidence and compromises that you have made for me. I wish to thank my lifelong friend, Peggy, for her support.
I also wish to thank my committee chair, Dr. Marie Hill for her continual support, confidence, expertise, and guidance and my other committee members Dr. Thomas zimmerer, Dr. Terrence Tollefson, and Dr. Hal Knight.A special thank you to Dr. Leah Witta for all the hours you helped me in completing this project. I will forever be indebted to you.
vi

TABLE OF CONTENTSPage
APPROVAL.......................................... 11ABSTRACT...........................................IllINSTITUTIONAL REVIEW.............................. VACKNOWLEDGEMENTS................................... vlCHAPTERS
1. INTRODUCTION............................ 1Statement of the Problem................ 5Purpose of the study.................... 5Significance of the Problem............ 5Hypothesis.............................. 8Definition of Terms..................... 8Limitations of the Study................ 10Assumptions............................. 10Overview of the study................... 11
2. LITERATURE REVIEWIntroduction............................ 12Grade Point Average..................... 13Standardized Testing.................... 18Interview............................... 22Fsychomotor Testing and CognitiveParameters.............................. 24Integration of Admission Parameters..... 27 Summary................................. 35
3. RESEARCH DESIGN AND METHODOLOGY Introduction............................ 38
vii

Setting.................................. 38Subjects................................. 39Materials................................ 39Data Collection.......................... 41Data Analysis............................ 42Research Ethics.......................... 43Null Hypothesis.......................... 43
4. ANALYSIS OF RESULTSIntroduction............................. 45Total Admission Rank..................... 46Interview................................ 47Composite Academic Ranking................ 50Composite Academic Ranking Components,.., 52High School Grade Point Average/GEDRanking.................................. 52Biology.................................. 53Chemistry................................ 55Physics.................................. 56Algebra.................................. 58College Credit Ranking................... 59College G P A ............................. 61Curriculum Credits....................... 62Curriculum G P A .......................... 64Program Completers and Non-CompletersAnalysis................................. 65
Discriminate Analysis.............. 65
viii
Total Admission Ranking............ 69Interview Ranking................... 70Composite Academic Ranking......... 71Composite Academic RankingComponents.......................... 72High School GPA/GED Ranked Score.... 72Biology............................. 74Chemistry........................... 75Physics............................. 76Algebra............................. 77College Credit Ranking............. 78College GPA Ranking................. 79Curriculum Credit Ranking.......... 80Curriculum GPA...................... 81
5. SUMMARY, CONCLUSIONS, and RECOMMENDATIONS for FUTURE RESEARCH & CHANGESSummary.................................. 82Conclusions.............................. 85Recommendations for Future Research 87
REFERENCES.................................... 89APPENDICES.................................... 99VITA...........................................102
ix
LIST OF TABLES Table Page
1 Attrition Causes...................... 62 Program Attrition..................... 73 Admission Criteria Used in Surveyed
Programs (n = 31)..................... 334 One-Way Anova Results for Total
Admission Ranking for Program Completers, Non-Completers, and Interviewed/Non- Admitted.............................. 47
5 Interrater Reliability of ApplicantInterviews............................. 48
6 One-Way Anova Results for InterviewedStudents Scores........................ 49
7 One-Way Anova Results for CompositeAcademic Ranking for Program Completers, Non-Completers, Interviewed/Non- Admitted, & Non-Interviewed/NonAccepted............................... 51
8 One-Way Anova Results for High SchoolGPA/GED Scaled Scores for Program Completers, Non-Completers, andNon-Admit ted............................ 53
9 One-Way Anova Results for BiologyRanked Scores for Program Completers, Non-Completers, Interviewed/Non Admitted, and Not Interviewed/Non Admitted................................ 54
10 One-Way Anova Results for ChemistryRanked Scores for Program Completers, Non-Completers, Interviewed/Non- Admitted, and Not Interviewed/Non Admitted................................ 56
11 One-Way Anova Results for PhysicsRanked Scores for Program Completers, Non-Completers, Interviewed/Non- Admitted, and Not Interviewed/Non Admitted................................ 57
x
12 One-Way Anova Results for AlgebraRanked Scores for Program Completers, Non-Completers, Interviewed/Non- Admitted, and Not Interviewed/Non Admitted............................... 59
13 One-Way Anova Results for CollegeCredit Ranked Scores for Program Completers, Non-Completers, Interviewed/Non-Admitted, and Not Interviewed/Non Admitted............... 60
14 One-Way Anova Results for CollegeGPA Ranked Scores for Program Completers, Non-Completers,Intervlewed/Non-Admitted, and Not Interviewed/Non Admitted.............. 62
15 One-Way Anova Results for CurriculumCredit Ranked Scores for Program Completers, Non-Completers, Interviewed/Non-Admitted, and Not Interviewed/Non Admitted.............. 63
16 One-Way Anova Results for CurriculumGPA Ranked Scores for Program Completers, Non-Completers, Interviewed/Non-Admitted, and Not Interviewed/Non Admitted.............. 65
17 Variable Selection In DiscriminateAnalysis............................... 68
18 t-Test for Total Admission RankingBetween Program Graduates (Completers) and Non-Completers..................... 70
19 t-Test for Interview Ranking BetweenProgram Graduates (Completers) and Non-Completers......................... 71
20 t-Test for Composite Academic RankingBetween Program Graduates (Completers) and Non-Completers..................... 72
21 t-Test for High School GPA/GED RankingBetween Program Graduates (Completers) and Non-Completers..................... 73
22 t-Test for Biology Ranking BetweenProgram Graduates (Completers) and Non-Completers......................... 74
xi

23 t-Test for Chemistry Ranking BetweenProgram Graduates (Completers) and Non-Completers........................ 75
24 t-Test for Physics Ranking BetweenProgram Graduates (Completers) and Non-Completers........................ 76
25 t-Test for Algebra Ranking BetweenProgram Graduates (Completers) and Non-Completers........................ 77
26 t-Test for College credit RankingBetween Program Graduates (Completers) and Non-Completers.................... 78
27 t-Test for College GPA RankingBetween Program Graduates (Completers) and Non-Completers .............. 79
28 t-Test for Curriculum credit RankingBetween Program Graduates (Completers) and Non-Completers.................... 80
29 t-Test for Curriculum GPA RankingBetween Program Graduates (Completers) and Non-Completers.................... 81
xii

Chapter 1 Introduction
Institutions of higher education have evolved from serving an agrarian society to an industrial society that is rapidly moving into the information age. Societal metamorphosis is reflected in changing enrollment patterns in higher education. Institutions have refocused from basic liberal arts programs reserved for select societal members to occupational- technical programs that are necessary for the information age in today's economic climate (Capoor/ 1983).
In conjunction with social factors/ economic factors have created a shift from industrial and technological careers toward service industries such as nursing, radiology, respiratory care, physical and occupational therapy. As a result future job prospects in these industries show rapid growth patterns and the need for more qualified personnel (IOM, 1989).
Because of these factors, institutions offering such occupational-technical programs experience large numbers of applicants for few vacancies. Student admission demands and the necessity to produce highly qualified practitioners create a dilemma. How are the most qualified and most-likely-to-graduate candidates selected from a large applicant pool? Unfortunately,

investigation of predictive success parameters of candidates enrolled in radiologic technology and other allied health programs has not been extensively reviewed.
Student selection and retention are critical to program viability and growth due to (a) the closed enrollment mandates placed on many allied health programs; (b) the high cost of instruction; and (c) the shortage of funding. Currently, the program of radiologic technology at EaBt Tennessee State University has been approved by the Joint Committee on Education in Radiologic Technology to accept 55 students per year (Joint Review Committee on Education in Radiologic Technology, 1992a) although typically the program accepts fewer students depending upon clinical availability. In accordance with the curriculum sequence of allied health programs, students typically are admitted once a year. After a student has been accepted, that particular appointment cannot be altered for a two-year period. If student attrition occurs during this period those seats will remain vacant throughout the program sequence.
Costs of attrition can be substantial. Fewer trained professionals can result in increased waiting time for service or lengthened hospital stays. Both situations can impact public and private health. The
3community forfeits the services of a trained health care practitioner as well as the potential revenue from income this individual would produce. The university and the allied health program experience a loss of $4,050 in tuition if the student exits the program during the first semester (ETSU Schedule of Classes Bulletin, 1994).
Clinical and didactic curriculum structure also contributes to the financial costs of allied health programs. Currently, the Essentials and Guidelines for Accreditation for Radiologic Technology Programs,(1992b), requires that for every ten students in clinical practice, one full-time instructor must be assigned. The program of radiologic technology at East Tennessee State University has four major sites currently used in the clinical portion of the program (East Tennessee State University, Self-Study Report, Radiologic Technology Program, 1995). To meet accreditation guidelines and to provide service to students, the radiologic technology program staff includes one program director, one didactic instructor, one clinical coordinator, and four clinical instructors. Faculty/student ratio is a major administrative concern. As the attrition rate Increases, the Instructional cost ratio obviously

increases resulting in decreasing institutional revenues,
The Bureau of Labor Statistics projects that radiologic technologist positions will have a high rate of occupational growth, estimating that from 1986 to the year 2000, the job market will increase by 65%, from 115,400 to 190,100 positions (IOM, 1989, p. 135). Due to its popularity and the expanding job market, the field has experienced a large number of applicants for the restricted number of available seats. In 1993, the East Tennessee State University radiologic technology program received 321 applications for twenty-five vacancies. The large applicant pool provides an opportunity for the program to be selective. Valid admission indicators must be utilized to reduce attrition and the adverse economic impact on the program and institution.
An adequate selection process is necessary to identify those individuals who have the qualities necessary to meet the rigorous demands of the allied health professions. Attempting to identify admission/success correlation factors is a difficult process. Nevertheless, a progressive academic administrator must address this critical area.
statement of the Problem5
Currently the attrition average (students admitted but not completing the program) of the radiologic technology program at East Tennessee State University is 25%. The problems of this study were (1) to determine if the selection process utilised by the program is valid and 2) to identify any specific valid parameters that can be utilized to predict student completion.
Purpose of the Study The purpose of this study was to investigate the
admission/selection process of the radiologic technology program at East Tennessee State University to ascertain predictive validity of the admission process and to identify specific indicators leading to program completion.
Significance of the Problem Since a terminated radiologic student cannot be
replaced retention and attrition levels are of special concern to program administrators . The current attrition rate for the radiologic technology program is 25% (East Tennessee state University, Self-Study Report, Radiologic Technology Program, 1995). From 1991 through 1993 academic problems encountered by students account for 84 percent of the attrition rate.

6When a student in the program receives a "D" in any radiology course or an "FM in any required core class, the student is terminated (East Tennessee state University, Additional Policies and Procedures Handbook - Radiologic Technology Program)* Therefore, if screening factors can be identified in common to those individuals having academic difficulty, attrition may be decreased.
From 1991 through 1993 16% of the attrition rate was due to personal problems. Students withdrew from the program for a variety of reasons which included finances, relocation, or other personal difficulties. Refer to Table 1 for yearly Attrition Causes and Table 2 for attrition percentages (Program Director, Radiologic Technology Program, East Tennessee State University, 1994).
Table 1Attrition Causes
ClassReasons Cited for Attrition
Academic Personal1993-1995 7 31992-1994 9 21991-1993 7 0

7Table 2Program AttritionClass N of Students
StartinaN of Students
GraduatingAttrition %
1993-1995 40 30 25%1992-1994 41 30 27%1991-1993 29 22 24%
In view of these statistics, admission indicators should be reviewed for validity to more adequately identify students who will be academically successful.
Numerous studies may be found in the literature that deal with admission and student success. However, studies specifically addressing radiologic technology program success indicators and an admission process are limited. The present study was designed to determine, through data collection and analysis, the validity of the selection and admission process utilized by the Radiologic Technology Program at East Tennessee State University and also to determine valid indicators for student completion.
Results of this investigation could provide useful information for reviewing admission and selection processes. This study could also yield valuable information that other allied health programs might find useful in the student selection processes.
This study may also provide a framework for and a basis of study not previously explored in the field of radiologic technology. Therefore, the study may broaden the educational base of radiologic technology by revealing relationships between a number of variables that indicate student success. By identifying student characteristics related to program success, allied health educators could more effectively meet the needs of both the student and employers in the health care field.
HypothesisThe following null hypothesis was formulated for
this study:Null Hypothesis - The selection process (or any
components) utilized by the radiologic technology program at East Tennessee State University is not related to program completion.
Definitions of Terms For the purpose of this study, the following terms
are defined:Admission refers to the process by which those
individuals who have applied and are accepted as a student to the radiologic technology program at East Tennessee State University.
Allied Health as defined by the Committee on Allied Health Education and Accreditation (CAHEA) {DHS, Health Personnel In the United States, 1992) as "a large cluster of health care related professions and personnel whose functions Include assisting, facilitating, or complementing the work of physicians and other specialists In the health care system, and who choose to be Identified as allied health personnel" (P. 177).
Attrition is defined as withdrawal or termination from the radiologic technology program.
Radiologic Technology is defined as a professional field in which practitioners, radiographers, provide patient services using imaging equipment as directed by physicians qualified to order and/or perform radiologic procedures.
Clinical Grades are defined as grades received from courses focussing on direct patient care interaction and clinical procedures.
Didactic Grades are defined as grades received from courses taught in a classroom that do not have direct patient care involvement.
Psychomotor relates to motor action which is preceded by mental activity.
10Cognitive refers to the "recall or recognition of
knowledge and the development of Intellectual abilities and skills" (Bloom & Krathwohl, 1985).
Program Success/Completion is defined aB graduation from the radiologic technology program.
Limitations of the StudyIn conducting this research/ the following
limitations were noted:1. The findings of this study are not
generalizable to other allied health programs.2. The study was limited to East Tennessee State
University.3. The study was limited for students that
applied to the radiologic technology program from 1991 through 1993.
4. Retention strategies employed by East Tennessee State University were not considered because of the off-campus site location of the radiologic technology program.
5. Gender was not considered as a factor in this study.
AssumptionsIn conducting this research, the following
assumptions were made:

111. The population is assumed to represent
students admitted to radiologic technology programs in previous and future years.
2. Academic performance evaluation would be available in the form of final recorded grades on transcripts (with due concern for students' rights).
Overview of the StudyChapter 1 identifies the problem investigated,
offers a brief overview, introduces the subject of student admission processes, and delineates the importance of valid admission procedures. Chapter 2 presents a literature review concerning admission processes and criteria related to allied health professions. A description of the research method is presented in chapter 3. An analysis of results is delineated in chapter 4. Chapter 5 contains research conclusions and recommendations.

Chapter 2 Literature Review
Introduction
This study is designed to ascertain salient indicators of candidate selection leading to completion of the radiologic technology program. The criterion- related validity of these Indicators must be determined to ascertain the correlation between the admission parameters and the criterion variable that is defined as graduation in this study. In reviewing admission parameters, a number of studies have been conducted in a variety of academic areas to identify and verify factors that are significant predictors of success.
Some of the more common indicators investigated are academic grade point average (Young, 1990; Payne & Duffey, 1986; Schwirian & Gortner, 1979) and standardized testing instruments (Shahani, Dipboye & Gehrelin, 1991; Roose, Mitchell, & Rudman, 1985; & Balogun, 1988). Common testing instruments are the Scholastic Aptitude Test (SAT), the American College Test (ACT) and the College Level Academic Skills Test (CLAST) (Safian-Rush & Belock, 1988; Roose, Mitchell, s Rudman, 1985). Individual grades in mathematics and English are also investigated. These factors and
12

13others will be more fully discussed within this chapter.
Another admission parameter utilized by some institutions is student interviews. Using interviews as an admission factor has been questioned by researchers (McGinnis, 1984; Schmalz, Rohr, & Allen, 1990; Shahani, Dipboye, & Gehrelin, 1991).
Grade Point AverageYoung (1990), Payne and Duffey (1986), and
Schwirian and Gortner (1979) reported that various configurations of grade point averages continue to be the most widely used admission criteria and success predictors of success in nursing academic programs. Kavanagh (1981) investigated the use of high school biology and algebra grades and overall high school grade point average and concluded that high school grade point average was a valid indicator of success in "post-secondary achievement" (p. 116). In particular, his study disclosed that algebra and biology grades were reasonably valid predictors.
Kroll (1990) also indicated that prior academic success is an appropriate predictor of future success and "patterns of D's in previous college course work may indicate a . . . student who is at risk" (p. 163) for noncompletion. Dietrich and Crowley (1982) reviewed admission requirements of eleven allied health

14professions and found that 50-60% of programs weighed grade point average heavily. Balogun, Karakoloff and Farina (1986) reported that grade point average accounts for 38.5% to 40% of the variance in successful program completion.
Schuler, Funke, and Baron-Boldt (1990) suggested that individual success predictors demonstrate a hierarchy of subjects and relationships. They found that mathematics was a strong predictor for academic and vocational success. Math scores as valid predictors of success are also supported by Althoff (1986).
In contrast, Ballinger (1976) found in a study of radiologic technology students, grades in mathematics courses and natural science courses had a low correlation with predicting success. He also determined that grades in English courses were statistically significant in terms of student success. He attributes this to the student's ability to analyse and synthesize "written course material and case presentations" (p. 370).
Schuler, Funke and Baron-Boldt (1990) found in their meta-analysis of school grades through aggregation that the average grade is a better predictor than a single grade. Prediction of vocational training success, although no statistically

15significant correlation was illustrated, was also demonstrated in this study. Recognized in the study were the cognitive components' importance necessitating life-long learning and societal adaptation.
Schuler, Funke, and Baron-Boldt*s (1990) summary of the impact of cognitive components' importance is supported by a previous study conducted by Ballinger (1976) at Ohio State University. In his study the most significant predictor of success was high school percentile rank supporting cognition and motivation as important characteristics in determining completion.He recognized that motivation should be considered as an admission parameter and that high school rank may inherently reflect motivation.
Utilization of grade point averages as a lone predictor, however, has resulted in several methodological problems. Higgs (1984) found that utilizing grade point averages as screening devices for nursing program admission is likely to minimize the correlation between test predictors and the criterion variables. A larger problem noted by Higgs was that using grades as the predictor and criterion variable could inflate the correlation coefficient. The Inflation of the coefficient can result in inconsistent cognitive measures in relation to "theory grades" versus "clinical grades."

16Prevalent use of school grades for admission
contrasts sharply with doubts that are often raised concerning their value as predictors. For grades to represent a meaningful and useful variable in admission criteria, "fulfillment of theoretical measurement quality criteria must be assumed" (Schuler, Funke, & Baron-Boldt, 1990, p. 90). Due to teacher subjectivity, performance is judged differently. As a result of teacher subjectivity, reliability of gradeB also must be questioned. Therefore, one can assume there are moderators influencing the comparability of grades and their respective validity that cannot be eliminated by aggregation (Schuler, Funke, & Baron- Boldt, 1990).
An additional problem noted by Higgs (1984) when using grade point average as the Bole predictor was the lack of course grade comparison between institutions concerning course intensity and difficulty. Students transferring credit from community colleges and universities where course rigor varies results in uncontrolled variability and reliability according to Higgs (1984). Astute students can manipulate the academic system through course articulation agreements between institutions and utilize "forgiveness" policies to enhance their grade point averages.

17A final problem of utilizing grade point average
as a sole predictor is reported by Higgs (1984), Schwirian and Gortner (1979), and Schwirian (1977). These investigators found that cognitive measures are better predictors of didactic grades. Cognitive measures, however, are not significant predictors for clinical grades. Criterion-related validity, a central concept in educational and psychological measurement, is of utmost concern to the administrator. The predictor or set of predictors must measure a desired outcome and be valid. Through a meta-analysis of school grades conducted by Schuler, Funke, and Baron- Boldt (1990), evidence was found that grammar school average grades were the best predictors of university academic success. This study also illustrated that university performance prediction was more valid and reliable than vocational training success. The investigators attributed this success to the cognitive nature and more demanding criteria utilized, i.e, intelligence testing.
Young (1990) used Item Response Theory (IRT) to develop a more reliable measure of performance utilizing grade point averages. Principal factor analysis was used as a precursor to determine the dimensionality of course data and to divide courses into approximately unidimensional subsets that were

18scaled Independently. By Integrating the grade point averages with the Item Response Theory, Young (1990) could Illustrate a substantial Increase In prediction of student's collegiate grade point average.Predictors were SAT scores, high school grade point average, high school rank, high school size, admissions-staff-assigned academic rating and nonacademic ranking success. Although several studies have suggested utilizing grade point averages In student admission practices (Hold & Worth, 1990; Kroll, 1990; Ballinger, 1976), a universal model cannot be located In the literature.
Standardized Testing The use of standardized test scores as the sole
Indicator of success has been questioned. Criticism has been expressed by potential applicants, college administrators and faculty (Shahanl, Dlpboye, & Gehrleln, 1991; Roose, Mitchell, & Rudman, 1985). Balogun (1988) supported the questionable reliability of standardized testing because he studied the Allied Health Professions Admission Test and demonstrated that this test had little predictive strength (<8%) (p.240). The controversial nature of using standardized testing as the sole predictor of successful program completion is also substantiated by Bauwen and Gerhard (1987). They report that an objective instrument

19administered nationally Is not available or currently recognized as a predictor of success.
Public universities in Florida require the College Level Academic Skills Test (CLAST) to assess student achievement in areas of math, reading, writing and essay writing. The CLAST examination, according to Safian-Rush and Belock (1988), tests the students' ability to read comprehensively, to clearly write a sentence, and to conceptualize and analyze at basic levels. They used the CLAST as a predictor variable of academic success for students enrolled in the baccalaureate nursing program. Other factors assessed in this study included grade point average, ethnicity, foreign birth, and age. The study concluded that higher CLAST scores and older students correlated positively, whereas ethnicity and sex did not reveal any significant correlations. Lack of statistical significance in this study could have been due to the small sample size, (N=55).
Safian-Rush and Belock (1988) and Walsh (1985) reported that achievement tests alone are not better overall success predictors than prior academic performance. This suggests that, if used alone, the CLAST results would probably lead to erroneous admission decisions.

20Progressive academic administrators should realize
that academic predictor tests do not consistently measure success in health sciences. "Cognitive acumen does not necessarily correlate with psychological maturity and discipline" (Safian-Rush & Belock/ 1989/ p. 73). One must realize that emotional age can be a determining factor whether or not a student can function in the higher education realm and remain enrolled in school.
Slovensky (1986) conducted a study in predicting academic success in a medical record technician program. This study revealed that the Nelson-Denny Reading Test did not have a significant correlation with success. However/ this study did demonstrate a significant relationship (r = .4031) (p. 14) with Tests of Adult Basic Education (TABE). Upon further analysis a correlation was found between entering grade point average (r- .4030) (p. 14) and success. Slovensky (1986) recommended that other avenues of student evaluation be explored.
Another study that was supported by the Kentucky State Department of Education (1988) evaluated the effectiveness of the Test of Adult Basic Education (TABE). Predictors for attainment or failure in postsecondary health occupations programs were reviewed. Predictor variables in this study were the Test of

21Adult Basic Education (TABE) reading and mathematics grade equivalent scores and the number of attempts on the examination. Criterion variables were graduation or withdrawal from a health program and scores on the Kentucky Vocational Achievement Test (KVAT),
Post-secondary health occupation programs investigated in Kentucky's study were practical nursing, dental assisting, surgical technology, respiratory therapy, radiologic technology and medical assisting. Participating in this study were 1485 subjects. The standardized test subscores in math and reading were found not to be significant indicators for program completion or withdrawal. Further discriminate analysis failed to classify reasons for completion or withdrawal.
Standardized tests evaluating personality types and correlation of success have also been studied. Hidden Figures Testing to determine field independence- field dependence and the Myers-Briggs Type Indicator Test to determine Junglan personality types are typically utilized. These tests were administered to ten students enrolled in a radiologic technology program by Cisneros-Blagg and Blagg (1983). Unexpectedly, these researchers reported that although definite personality types could be identified, personality types did not correlate to academic course

22performance. Interestingly/ this study demonstrated that most subjects were field dependent which is in contrast to the course content of most radiography courses which require analytical skills. However, the authors note that patient interaction situations may attract more socially oriented field-dependent individuals. Upon review of these findings, questions arise whether personality variables could be utilized to predict academic, in particular, clinical performance.
InterviewSome institutions utilize admission committees to
employ an admission Interview to predict academic success. Admission Interviews are of prime importance to an administrator due to costs involved in conducting such interviews. CoBts incurred result from faculty time and faculty travel (if adjunct faculty are involved).
Shahani, Dlpboye, and Gehrelin (1991) attempted to evaluate the interview process in determining if motivation or other attributes should be weighed more heavily than standardized test results. This study concluded that the interviewer judgments had little validity. Validity could be disputed and attributed to the applicant's verbal ability. The researchers concluded that an applicant's verbal ability could be
23assessed by standardized testing, communication grades, or application essays and therefore interviewing "was less important than paper credentials,..and the addition of the interview to the list of predictor variables added virtually nothing" (p. 1059). This study also indicated that, if academic performance prediction is the goal, SATs, grades and systematic evaluation of validated paper credentials are a better basis for admissions than interviewer judgments.
Research performed by McGinnis (1984) noted no significant correlation between interview scores and achievements. Due to the subjectivity of the interview process, schmalz, Rohr and Allen (1990) concluded that it does not reliably predict success. This study supports research completed by Balogun, Karakoloff, and Farina (1986) and Vargo, Madill, and Davidson (1986). Vargo, Madill, and Davidson (1986) reported that interview scores are not predictive of academic success.
Although interview scores do not accurately predict academic success, research suggests that Interview scores can be correlated with clinical performance. Balogun (1988) reported that Interview scores account for 34.6% of the variance in clinical proficiency. The knowledge a candidate possesses about a particular profession can be determined by an

24interview and assuring such knowledge through the interview process was illustrated by Douce and Coates (1984). Lack of professional information or misinformation according to Holt and Dunlevy (1992) which results in attrition wastes both faculty and student time and money. They concluded that although interviews are not effective predictors of academic success, "they are important in determining the potential of clinical skills and affective attributes" (p. 440).
Psychomotor Testing and Cognitive ParametersPsychomotor testing is often the most neglected
admission parameter. Psychomotor testing requires the applicant to perform in a group setting tasks similar to those anticipated in the practicum. The lack of universal acceptable taxonomy, however, makes precise measurement of this domain difficult because allied health programs have not identified any specific parameters.
Dietrich (1981) defined the elements of the psychomotor domain as "fine and gross motor skills and perceptual - motor abilities" (p. 231). Admission committees must determine the relative Importance of each domain in respect to entry-level requirements.The selection committee observes the applicants as they
25perform certain tasks to accurately predict successful completion of the program.
Group and psychomotor testing has a twofold function by providing the applicant an opportunity to determine career choice satisfaction and admission determination. Roose, Mitchell and Rudman*s (1985) research indicated that;
the addition of...challenging activities to the selection process increases the amount of time and energy expended later by turning away candidates who would not benefit from this...program (p.221).Psychomotor evaluation is time consuming and
expensive due to one-on-one testing. Tests such as the Minnesota Paper Form Board Test, Differential Aptitude Test, and the General Aptitude Test Battery are used. These tests measure spatial perception abilities. Admission committees, however, may utilize biographic data such as knitting, piano playing, and tennis as an alternative mechanism for psychomotor skill assessment.
Legal constraints in reference to the Americans with Disabilities Act also must be reviewed in determining psychomotor abilities. The institution must ensure they are not discriminating against any physically challenged individuals and must provide reasonable accommodation to physically challenged

26individuals who then may perform the required technical skills.
Research also Indicates that cognitive style is related to occupational preference and performance. Witkin, Moore, Goodenough, and Cox (1977) found that individuals choose and succeed in occupational and academic areas that are congruent with skills inherent in their cognitive styles. Furthermore, they suggest that students whose college-entry occupational choices are congruent with their cognitive styles have reduced attrition. Upon investigation of cognitive styles, Blagg (1964) found that integrative complexity and dogmatism were excellent predictors for allied health leadership programs.
Blagg (1985), while Investigating cognitive and learning styles as predictors of academic success, found that 20.44% to 41.36% of the variance in standardized testing could be attributed to learning style variables. Dreher and Singer (1965) postulated from their research that affective factors are mobilizers of cognitive and metacognitive skills and strategies that effect student success. Moreover, they suggest three factors that are significant in predicting student success: the ability to learn from text, background knowledge, and attitude toward learning. Overall, the impact of cognitive parameters

27should be considered in determining admission of borderline students, cognitive parameter consideration is also Important in counseling students and predicting academic success.
Integration of Admission ParametersNumerous studies indicate that academic success
can be more accurately predicted by using a combination of admission variables. Predictors and estimators in higher education institutions have been primarily developed for traditional students (campus-based programs). Considering the increasing number of non- traditional allied health programs and students, a need emerges for the evaluation of predictor variables.
Petty and Todd (1985) conducted a study of allied health programs in North Carolina in an attempt to identify variables associated with student success. Programs in nursing, dental hygiene, medical laboratory, physical therapy, radiologic technology, and respiratory therapy participated (representing a total population of 1,800 students). Statistical data analysis revealed that "age, admission testing, and personal student characteristics had predictive powers in relation to the measure of student success— and grade point average" (Petty & Todd, 1985, p. 1). From this analysis, the researchers developed preliminary

28program-specific admission models illustrating relationships of GPA and various predictive variables.
A study examining admission criteria and success of 40 nontraditional respiratory students was conducted by Tompkins and Harkins (1990). From this study a model was developed that Identified three indicators of success: program average, clinical performance rating, and credentialing examination Bcores. They found all models to be significant at a .05 alpha level. Independent variables identified by the researchers in predicting student success were: high school guartile, number of years since attending formal education, and the vocational adjustment scores derived from the Health Occupations Aptitude Examination.
Schwirian (1976) surveyed 150 nursing programs to ascertain the most common entrance criteria. Health data, high school grade point average, high school rank, applicant interview and prior college grade point average were the most widely used admission criteria. Bellow (1977) found that age. Comparative Guidance and Placement Tests Reading and Sentence Scores (CGP), high school algebra and college level science grade point averages were the best predictors of success. Success in this study was defined as program completion and passage of the state licensing examination. Larkin (1977) supported Bellow by concluding that certain

29
Comparative Guidance and Placement Tests scores were significantly related to success or failure on state board examinations.
Jensen (1989) conducted a study that included three allied health programs - dental hygiene, radiologic technology, and respiratory therapy. Jensen (1989) utilized multiple regression techniques and developed predictive equations and found that ACT natural science scores, high school grade point average, and high school class rank were the best preadmission predictors of success in allied health programs. Jensen, however, warned that "care must be taken to weigh the percentage of predictability of each regression . , . and the use of quantifiable predictors equations is not the answer to all admissions questions" (Jensen, 1989, p. 303).
Bistereich (1977) conducted a broader study inclusive of four allied health programs. This study analyzed high school grade point average, the average grade and number of high school natural science courses taken, high school English grades, high school math grades, high school rank, and college grade point average. Significant correlations reported were: 1) initial grade point average was a predictor of final program grade point average in dental hygiene; 2) medical laboratory technology graduation was

30significantly related to high school grades in natural science; and 3) high school English grades were positively related in predicting graduation in medical laboratory technology.
Tatham (1975) presented a contrary view of the value of academic qualifications. This study reviewed program completion rate, clinical course grade point average, and nursing and dental hygiene examination scores to measure success. He concluded that academic variables were not significantly related to program completion but were useful in identifying those students who might have difficulty in clinical practicums or on state board examinations. This atypical study finding could have resulted from incomplete data as reported by the author.
Previous success in education and age as reported by Friedemann and Valentine (1988) is an adequate criterion for predicting academic success. Wold and Worth (1990) support the contention of previous academic grade point average and verbal ability measured by the SAT or other standardized testing instruments as a strong prediction tool. A significant correlation in grade point average in biology courses and pre-nursing grade point average was found by McClelland, Yang, and Click (1992) to be the best predictors of success in nursing applicants. Data

31analysis by Oliver (1985) indicated the use of high school ranking, biology and English grades as having a "significant relationship with academic success" (p. 204).
Allied health educators must assure to all applicants/ consumers/ and federal agencies that admission practices are rational/ valid, reliable, fair and humane. Therefore, the admission policies must address four critical areas. Dietrich (1981) described these areas as 1) refinement of criteria; 2) identification of quantifiable Information sources; 3) data transformation into measurable form; and 4) evaluation of admissions criteria.
To ascertain current methods used in student selection in the United States, Shehane (1995) conducted a national survey of 42 located associate degree university-based radiologic technology programs. Programs were identified from the Allied Health Education Directory (1994) and telephone contact was made with representatives of 39 programs. Three identified programs did not have working telephone numbers and eight programs did not respond to repeated contacts. Thirty-one programs participated in the survey representing a 79% completion rate of contacted programs. A number of different indicators for student selection were identified as illustrated in Table 3.
32Math and science courses, minimum GPA, and interviews were the most often used criteria.
Shehane (1995) further identified that different methods were employed by programs in student selection. Sixty-eight percent (N-21) of the surveyed programs utilized a ranking instrument in student selection. Thirty-nine percent (N«12) of the programs noted that certain percentages were assigned to academics and subjective factors such as interviews, student biographies, and references. Sixteen percent (N-5) indicated that an interview was utilized for final student selection. Sixteen percent (N=5) reported that academic performance was the final deciding factor in student selection. The diverse nature of student selection as identified by Shehane (1995) also yielded wide attrition ranges in university-based associate- degree radiography programs. Shehane (1995) identified attrition rates ranging from 1 to 50% with an average national attrition rate of 17.6%.
Discussion generated by the study conducted by Shehane disclosed universal concerns among radiography educators regarding better methods of student selection. Most radiography educators Indicated they could not identify a valid factor which could indicate student success. Some educators hypothesized that GPA was a good indicator, while others hypothesized that

33specific coursework performance, persistence, experience, interview, standardized tests, medical knowledge, or application date may be a good indicator. Table 3Admission Criteria Used in Surveyed ProgramsAdmission criteria Percentage N**Math and/or Science High School or College Courses 74 23Interviews 65 20Minimum Grade Point Average 64 20
3.0 3 12.5 26 82.4 3 12.3 3 12.25 7 22.0 19 6Not indicated by reported 3 1
♦♦Specifically Collegiate English and/or Speech 55 17ACT/SAT 42 13♦Prerequisite College Courses 35 11Clinical Observation 29 9♦♦Computer Coursework 29 9(n = 31)
Note. ♦Prerequisite college courses required general college course work prior to program admission.

Note. **Specifically collegiate English and/or speech, computer coursework, and math are specific courses required prior to program admission.

35Summary
Numerous studies concerning nursing and allied health programs have investigated singular and composite plural factors regarding student success which are in agreement or dispute with each other. Configurations of grade point averages were reported to be the most widely used admission criteria and success predictors in nursing academic programs. However/ serious questions concerning the validity of this procedure have been raised. Concerns expressed included methodological problems/ teacher subjectivity, and institutional comparability.
Discussion of standardized testing used as a sole predictor yields concern regarding student selection and successful completion. Tests such as the Allied Health Professions Admissions Test have been found to have little predictive strength. Other tests such as CLAST, have not been found to be better Indicators of success than prior academic performance. Moreover, a nationally recognized test which can Indicate successful completion in radiologic technology is not available.
Interviews are utilized by a number of radiologic technology programs as part of the admission process. However, interviews contribute little or nothing in the prediction of student success. The literature does

36provide data in which interviews have been useful in predicting clinical proficiency. Therefore, in evaluating the admission process, the administrator should weigh interview validity and reliability in regard to program completion and clinical performance.
Psychomotor testing, which is utilized less frequently as a predictor, could be of particular significance to a radiologic technology program. Psychomotor skills are essential for a student to successfully complete the clinical portion of a radiologic technology program. Problems which include time and expense associated with this type of testing are significant.
Other studies indicate that to consistently predict academic success, a combination of admission variables must be used. Factors such as age, student characteristics, grade point averages, high school rank, applicant interview, and specific standardized test scores have been related to student success. However, particular emphasis has not been placed singularly on radiologic technology programs. A solid foundation in determining successful program completion is needed.
After investigation of the major areas which academic programs utilize to select students, it is obvious that a particular method is not universally
37accepted. Moreover/ none of these studies provide a model from which valid admission decisions can be made with predictive certainty. A study designed specifically for radiologic technology admission and program completion utilizing longitudinal data is not available. As a result, many radiologic technology educators and admission committees find themselves in a quandary. What is the best data and procedure to select students who will successfully complete the program of study? This study will try to answer this question.

Chapter III Research Design and Methodology
Introduction
This chapter includes a description of the setting in which this study took place, the population, the methodology, instrumentation, procedures for data collection and method for data analysis. Reasons for initiating the activities are also discussed and described.
SettingThis research describes a population of students
who applied to the radiologic technology program at East Tennessee State University from 1991 through 1993. At the time of this study, the program of radiologic technology was accredited by the Joint Review Committee on Education in Radiologic Technology. This program was administered by one program director, two didactic faculty, and four clinical instructors.
East Tennessee State University is located in northeast Tennessee and is a state-supported, comprehensive, regional university. The University, governed by the Tennessee Board of Regents, has an student population of about 12,000.
38

39Subjects
The population for this investigation consisted of 510 students who had applied to East Tennessee State University and the radiologic technology program from 1991 through 1993.
MaterialsMaterials necessary for this study included:
1) Academic ranking instrument; 2) Interview ranking instrument; 3) Composite entrance ranking; 4) Student listing; and, 5) Academic records. The academic ranking instrument was formulated by the radiologic technology program faculty in 1991 to indicate successful completion of program admission requirements (see Appendix A). In 1991, the academic ranking instrument was reviewed by a panel of experts and deemed to have valid content. The panel of experts from northeast Tennessee consisted of the following:(a) two didactic instructors both possessing master's degrees in adult education and an accumulation of 25 years of experience in radiologic technology education; and (b) four clinical instructors who are recognized by the Joint Review of Education in Radiologic Technology with a total of 25 years of experience in radiologic technology education.
Each completed application was reviewed and ranked according to this standardized instrument. Areas of
40application evaluation were as follows: high school6PA or GED (integration of two adopted from Bluefield State College)/ course grades in biology, chemistry, physics, algebra, all college course work, cumulative college GPA, collegiate curriculum specific course credit hours, and curriculum specific GPA. Course grades, GPA, and prior college course work in each area was evaluated. For an example, a student having completed a course in biology with a grade of "A" received four points in this section. All individual ranked scores in each category were added and determined the applicant's composite academic ranking. From this instrument, students were selected for the interviewing process.
An interview ranking instrument was formulated by the radiologic technology program faculty in 1991. The interview ranking instrument was reviewed by a panel of experts from northeast Tennessee and deemed valid in 1991. The panel of experts consisted of the following: (a) two didactic instructors both possessing master's degrees in adult education and a accumulation of 25 years of experience in radiologic technology education; and (b) four clinical instructors who are recognized by the Joint Review of Education in Radiologic Technology with a total of twenty five years of experience in radiologic technology education.

41The interviewing process utilized a standardized
evaluation of twenty questions designed by the radiologic technology department at East Tennessee State University (see appendix B). Applicants selected for interviews were notified of an interview date. The interview evaluation was completed by program faculty during each applicant interview.
A total admission composite entrance ranking was formulated consisting of the academic and interview scores. The composite ranking was formulated by utilizing 60% of the overall composite academic ranking and 40% of the interview ranking.
A listing was formulated that contained the identities of students completing or not completing the program. This listing was from 1991 through 1993. Academic records of 510 radiologic technology students from 1991 through 1993 were obtained.
Data CollectionDue to the nature of data required to conduct this
study, application was made to the Institutional Review Board of East Tennessee state University to obtain the required data. Upon approval from the Institutional Review Board, academic records of 510 students were retrieved and placed in a data base. Specific data inquiries included the following areas: high school GPA or GED, course background in high

42school or college In biology, chemistry, physics, algebra, all college course work, cumulative college GPA, collegiate curriculum specific course credit hours and curriculum specific GPA.
Data concerning the interview process were obtained from the radiologic technology program at East Tennessee State University. Available composite interview scores were entered into the data base.
Data AnalysisCorrelation research was chosen for this study
because it attempts to determine whether, and to what degree, a relationship exists between two or more quantifiable variables. The purpose of this research methodology was to establish the validity of the admission process utilized by the radiologic technology program. In this study, one-way analysis of variance and t-tests were applied to investigate the different admission parameters (high school GPA or GED, course background in biology, chemistry, physics, algebra, all college course work, cumulative college GPA, collegiate curriculum specific course credit hours and curriculum specific GPA) that were collected from academic records of radiology applicants from 1991 through 1993. Discriminate analysis was also completed on each parameter due to prior grouping in the initial academic analysis.

43An alpha level of .05 for significance was
selected for this study. This research also proposed to use multiple Ra, or variance, explained by the equation plus the increment in R3 for additional factors. While additional explained variance may not be statistically significant due to sample size, the factor may be included due to substantive reasons.
Research Ethics The subjects' identities were protected through
encoding the information collected by not identifying the subjects' names. Subject anonymity was extended not only in writing but also in reporting the information. The most important goal in reporting conclusions was honesty. The researcher reported accurate information from data findings.
Null Hypothesis In exploratory research of this nature, it is
unknown how many factors (constructs) may be developed. A priori, it was hypothesized that the discriminate function would contribute significantly to prediction. The null hypotheses of this study was as follows:
Null Hypothesis - The selection process (or any components) utilized by the radiologic technology program at East Tennessee State University is not related to program completion.
44Data to test the null hypothesis were gathered
from individuals that applied to the radiologic technology program from 1991 through 1993. These data were analyzed using one-way analysis of variance, discriminate methodology, and t-tests. Post hoc comparisons, Scheffe's tests, were used when omnibus F was significant because it is conservative and holds the alpha level consistently across all variables (Hinkle, Wiersma, & Jurs, 1994). The use of discriminate analysis allowed for relationships to be shown between academic ranking and interview ranking, and completion of the radiologic technology program.

Chapter 4 Analysis of Results
Introduction
In this chapter the results, data analyses, and interpretation of the findings are presented. Data for this study were secured from admission files of the radiologic technology program and student records and at East Tennessee State University from 1991 through 1993. The purpose of the study was to determine the validity of the selection process utilized by East Tennessee state University and also to determine valid indicators for program completion.
To determine selection process validity, the null hypothesis formulated for this study was that the selection process (or any components) utilized by the radiologic technology program at East Tennessee State University was not related to program completion. Variables used in student selection were: high school grade point average (GPA) or high school GED score, prior coursework in biology, chemistry, physics, algebra, college credit hours obtained, cumulative college grade point average (GPA), college credit hours obtained in program curriculum, curriculum GPA, composite academic ranking, interview scores, and total admission rank. All variables were analyzed together
45

46and separately to test the selection model and to identify specific valid indicators for student success. Results testing the null hypothesis are as follows:
Total Admission Rank. One-way analysis of variance (ANOVA) was used to compare total admission ranked scores of program graduates, students who did not complete the program, and students interviewed but not accepted into the program. Students who were not selected for an interview were not assigned total admission ranks. Total admission rank was determined by calculating 60% of the composite academic ranking and 40% of the interview mean score and adding the two together.
Results of the one-way ANOVA for total admission ranked scores for program completers, non-completers, and interviewed/not accepted candidates are presented in Table 4. The mean total admission rank for program completers was 56.50 (SE = 2.57), mean total admission rank for program non-completers was 54.41 (SE - 4.4), and the mean total admission rank for students interviewed but not accepted was 43.37 (SE = 1.98).The analysis yielded a statistically significant difference between the means illustrating that there is a significant difference between the three groups of students.

Table 4One-Way ANOVA Results for Total Admission Ranking for Program Completers, Non-Completers, and Interviewed/Non-Admitted
Sum of Mean FSource df Squares Square
BetweenWithin
2246
9835.06133626.1
4917.53543.2
9.05*
*p < .05.
A post hoc comparison was performed because omnibus F was significant. Students completing the program had higher total rank scores and were significantly different (alpha = .05) as compared to students interviewed but not admitted.
Interview. The radiologic technology program utilizes interviews as part of the student selection process. During 1991 through 1993, twelve (12) different evaluators participated in the interview process. Interviewer inter-rater reliability was established utilizing Spearman's rho. Inter-relator reliability ranged from .53 to .97 with an average reliability of .78. Refer to Table 5 for inter-rater reliability.
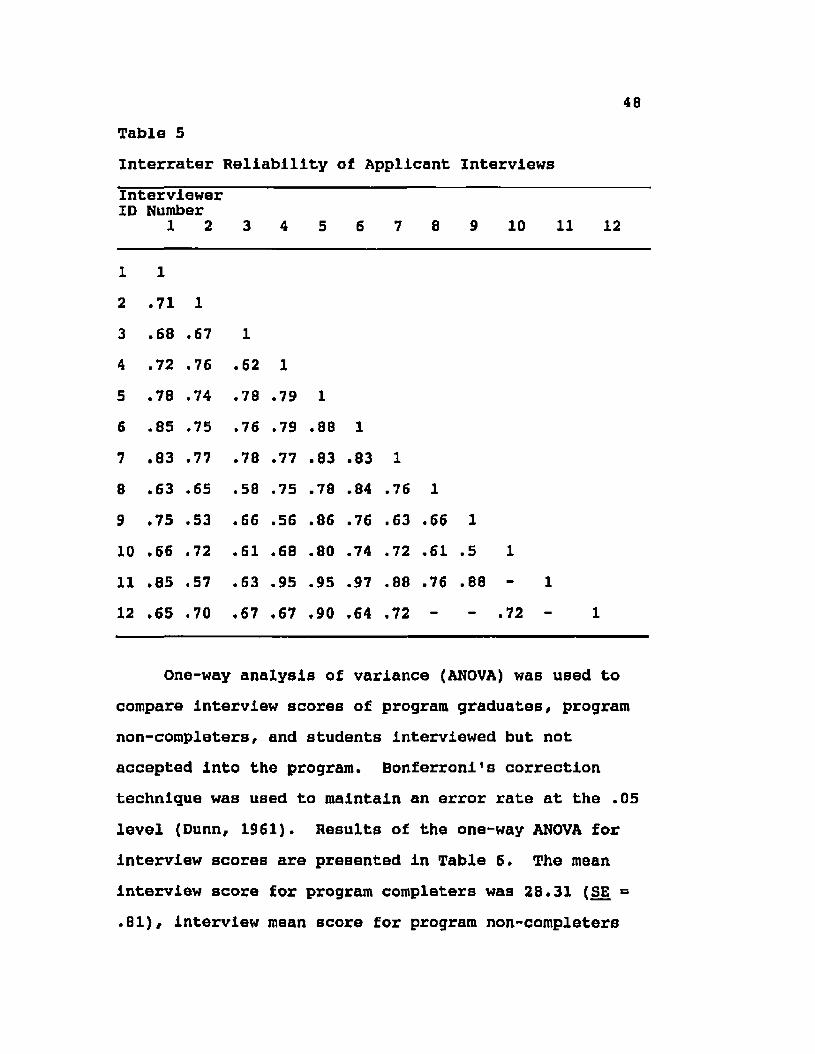
Table 5Interrater Reliability of Applicant Interviews
48
Interviewer ID Number
1 2 3 4 5 6 7 8 9 10 11 12
1 12 .71 13 .68 .67 14 .72 .76 .62 15 .78 .74 .78 .79 16 .85 .75 .76 .79 .88 17 .83 ,77 .78 .77 .83 .83 18 .63 .65 .58 .75 .78 .84 .76 19 .75 .53 .66 .56 .86 .76 .63 .66 110 .66 .72 .61 .68 .80 .74 .72 .61 .5 111 .85 .57 .63 .95 .95 .97 .88 .76 .88 112 .65 .70 .67 .67 .90 .64 .72 - - .72 - 1
One-way analysis of variance (ANOVA) was used to compare interview scores of program graduates/ program non-completers, and students Interviewed but not accepted into the program. Bonferroni's correction technique was used to maintain an error rate at the .05 level (Dunnf 1961). Results of the one-way ANOVA for interview scores are presented in Table 6. The mean interview score for program completers was 28.31 (SE = .81)/ interview mean score for program non-completers

49was 28.16 (SE = 1.39), and Interview mean score for students interviewed but not admitted was 19.36 (SE - .63). The analysis yielded a statistically significant difference (alpha = .025) between the means. This finding illustrates that there is a significant difference among the three groups of students.
Table 6One-Way ANOVA Results for Interviewed Students Scores
Sum of Mean FSource df Squares Square
BetweenWithin
2246
4868.1913390.5
2434.0954.43
44.72*
*p < .025.
A post hoc comparison was performed because omnibus F was significant. Students admitted to the program (completers and non-completers) were significantly different as compared to students not admitted to the program (interviewed/not admitted), £ < .025. This finding indicates that students admitted into the program (completers and non-completers) had higher interview rankings and are significantly different as compared to those students interviewed but not admitted into the program of study.

50Composite Academic Ranking* One-way analysis of variance (ANOVA) was used to compare composite academic ranking of program graduates/ program non-completers, applicants interviewed but not accepted/ and applicants not interviewed and not accepted* Results of the oneway ANOVA for composite academic ranking of all four groups are shown in Table 7. The mean composite academic ranking for program completers was 28.77 (SE = .64)/ mean composite academic rank for program noncompleters was 26.25 (SE = 1.09)/ mean composite academic rank for applicants interviewed but not accepted was 21.36 (SE = .49)/ and the mean composite academic rank for studentB not interviewed and not accepted was 11.51 (SE - .36).
The analysis yielded a statistically significant difference between the means. This finding shows that there was a significant difference (alpha = .025) between program completers, program non-completers, applicants interviewed/not admitted, and applicants not interviewed or admitted to the program.

51Table 7One-Way ANOVA Results for Composite Academic Ranking for Program Completers, Non-Completers, Interviewed/Not Accepted, and Non-Interviewed/Non Accepted
Sum of Mean FSource df Squares Square
BetweenWithin
3506
23963.6316928.58
7987.8833.46
238.76*
*p < .025.
A post hoc comparison was performed because omnibus F was significant, students completing the program had a higher composite academic ranking mean and were significantly different (alpha - .025) as compared to applicants not interviewed and not admitted to the program and applicants interviewed and not admitted to the program. Students not completing the program had a higher composite academic ranking mean and were significantly different (alpha « ,025) as compared to applicants interviewed and not admitted and applicants not interviewed and not admitted to the program. Applicants interviewed and not admitted had a higher composite academic mean and were significantly different (alpha *» .025) as compared to applicants not interviewed and not admitted to the program.

52Composite Academic Ranking Components. Due to the significance of the composite academic ranking/ the nine components used to formulate this parameter were analyzed individually. The Bonferronl approach (Dunn/ 1961) was used to maintain the alpha level among the individual components. The alpha level of 0.05 was divided by nine resulting in an alpha level of 0.0056.
High School Grade Point Averaqe/GED Score. One-way analysis of variance (ANOVA) was used to compare ranked high school GPA's or GED (HSHGPA/GED) scores of program graduates/ students that did not complete the program/ students interviewed but not accepted into the program/ and students not interviewed or accepted into the program. All scores were ranked using equal intervals. One-way ANOVA for High School GPA/GED for the four groups is presented in Table 8. The mean HSHGPA/GED ranked score for program completers was 3.80 (SE =.12)/ mean HSHGPA/GED ranked score for program noncompleters was 3.39 (SE = .21)/ mean HSHGPA/GED ranked score for applicants interviewed but not accepted was 3.51 (SE = .1)/ and the mean HSHGPA/GED ranked score for students not interviewed and not accepted waB 2.66 (SE = .07). The analysis yielded a statistically significant difference between the means. This finding illustrates a significant difference in high school GPA/GED ranking between the four groups.

53Table 8One-Way ANOVA Results for High School GPA/GED Scaled Scores for Program Completers, Non-Completers, and Non- Admltted
Source dfSum of Squares
MeanSquare £
Between 3 111.33 37.11 30.18*Within 479 588.92 1.23
*p < .0056.
A post hoc comparison was performed because omnibus F was significant, students completing the program and students interviewed but not admitted to the program had a higher high school GPA/GED rank and were significantly different (alpha - .0056) as compared to students not interviewed and not admitted to the program and students that did not complete the program.
Biology. One-way analysis of variance (ANOVA) was used to compare biology rankings of program graduates, students that did not complete the program, applicants interviewed but not accepted into the program, and applicants not interviewed or accepted into the program. All scores were ranked using equal Intervals. One-way ANOVA for biology ranking for the four groups is presented in Table 9. The mean biology ranked score

for program completers was 11.48 (SE - .54), mean biology ranked score for program non-completers was13.44 (SE = .94), mean biology ranked score for applicants interviewed but not accepted was 8.42 (SE - .42), and the mean biology ranked score for students not interviewed and not accepted was 4.72 (SE =.34).
The analysis yielded a statistically significant difference between the means. This finding shows that there was a significant difference between program completers, program non-completers, applicants interviewed/not admitted, and applicants not interview or admitted to the program.Table 9One-Way ANOVA Results for Biology Ranked Scores for Program Completers, Non-Completers, Interviewed/Non- Admitted, and Not Interviewed/Non Admitted
Sum of Mean FSource df Squares Square
Between 3 3966.57 1322.19 55.5*Within 446 10624.95 23.82
*p < .0056.
A post hoc comparison was performed because omnibus F was significant, students completing the program had a higher biology ranking and were significantly different (alpha = .0056) as compared to

55applicants not interviewed and not admitted to the program and applicants interviewed/not accepted. Students not completing the program had a higher biology ranking and were significantly different (alpha = .0056) as compared to students interviewed/not admitted and applicants not interviewed or admitted to the program. Applicants interviewed/not admitted had a higher biology ranking and were significantly different (alpha - .0056) as compared to students not interviewed and not admitted to the program.
Chemistry. One-way analysis of variance (ANOVA) was used to compare chemistry rankings of program graduates, students that did not complete the program, students interviewed but not accepted into the program, and students not interviewed or accepted into the program. All scores were ranked using equal Intervals. One-way ANOVA for chemistry ranking for the four groups is presented in Table 10. The mean chemistry ranked score for program completers was 7.42 (SE « .45), mean chemistry ranked score for program non-completers was 6.33 (SE = .8), mean chemistry ranked score for applicants interviewed but not accepted was 5.23 (SE «.4), and the mean chemistry ranked score for students not interviewed and not accepted was 3.91 (SE **.38).

The analysis yielded a statistically significant difference between the means. This finding illustrates that there is a significant difference between the four groups.Table 10One-Way ANOVA Results for Chemistry Ranked Scores for Program Completers, Non-Completers, Interviewed/Non- Admitted, and Not Interviewed/Non Admitted
Sum of Mean £Source df Squares Square
BetweenWithin
3224
427.552577.32
142.5211.51
12.39*
*p < .0056.
A post hoc comparison was performed because omnibus F was significant. Students completing the program had a higher chemistry ranking and were significantly different (alpha “ .0056) aB compared to students interviewed but not admitted to the program and students not interviewed or admitted to the program.
Physics. One-way analysis of variance (ANOVA) was used to compare physics rankings of program graduates, students that did not complete the program, students interviewed but not accepted into the program, and students not interviewed or accepted into the program.

All scores were ranked using equal intervals. One-way ANOVA for physics ranking for the four groups is presented in Table 11. The mean physics ranked score for program completers was 7.00 (SE = .63), mean physics ranked score for program non-completers was 8 (SE = 1.9), mean physics ranked score for applicants interviewed but not accepted was 3.92 (SE « .76), and the mean physics ranked score for students not interviewed and not accepted was 3.83 (SE = .76).
The analysis yielded a statistically significant difference between the means. This finding illustrates a significant difference between the four groups.
Table 11One-Way ANOVA Results for Physics Ranked Scores for Program Completers, Non-Completers, Interviewed/Non- Admitted, and Not Interviewed/Non Admitted
Sum of Mean FSource df Squares Square
BetweenWithin
340
115.30288.58
38.437.21
5.33*
*p < .0056.
A post hoc comparison was performed because omnibus F was significant. Students completing the program had a higher physics ranking and were significantly different (alpha = .0056) as compared to
58students interviewed but not admitted and students not interviewed or admitted to the program.
Algebra. One-way analysis of variance (ANOVA) was used to compare algebra rankings of program graduates, students that did not complete the program, students interviewed but not accepted into the program, and students not interviewed or accepted into the program. All scores were ranked using equal intervals. One-way ANOVA for algebra ranking for the four groups is presented in Table 12. The mean algebra ranked score for program completers was 6.48 (SE = .27), mean algebra ranked score for program non-completers was 5.71 (SE = .46), mean algebra ranked score for applicants interviewed but not accepted was 6.11 (SE = .21), and the mean algebra ranked score for students not interviewed and not accepted was 4.19 (SE = .17).
The analysis yielded a statistically significant difference between the means. This finding illustrates a significant difference between the four groups.
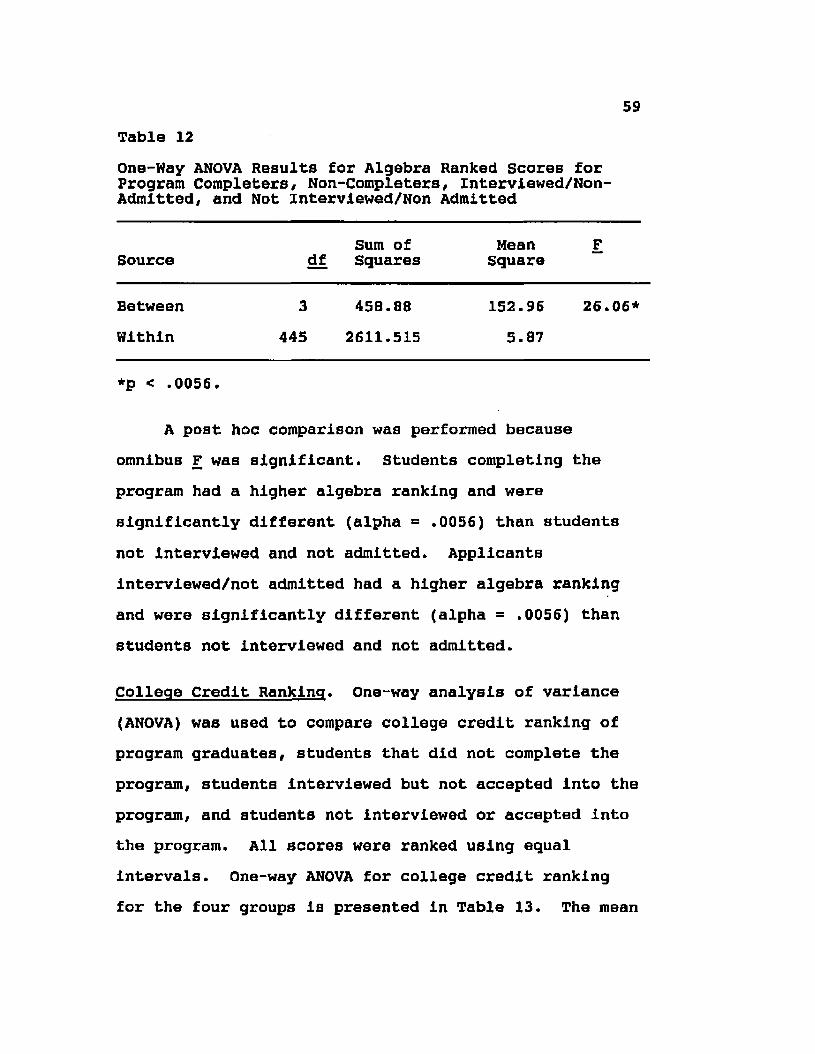
Table 12One-Way ANOVA Results for Algebra Ranked Scores for Program Completers, Non-Completers, Interviewed/Non- Admitted, and Not Interviewed/Non Admitted
Sum of Mean FSource df Squares Square
BetweenWithin
3445
458.88 2611.515
152.965.87
26.06*
*p < .0056.
A post hoc comparison was performed because omnibus F was significant, students completing the program had a higher algebra ranking and were significantly different (alpha = .0056) than students not interviewed and not admitted. Applicants interviewed/not admitted had a higher algebra ranking and were significantly different (alpha = .0056) than students not interviewed and not admitted.
College Credit Ranking. One-way analysis of variance (ANOVA) was used to compare college credit ranking of program graduates, students that did not complete the program, students interviewed but not accepted into the program, and students not interviewed or accepted into the program. All scores were ranked using equal intervals. One-way ANOVA for college credit ranking for the four groups is presented in Table 13. The mean

college credit ranking score for program completers was 4.82 (SE = .19), mean college credit ranking score for program non-completers was 4.75 (SE = .31), mean college credit ranked score for applicants interviewed but not accepted was 4.79 (SE = >15), and the mean college credit ranking score for students not interviewed and not accepted was 3.93 (SE = .13).
The analysis yielded a statistically significant difference between the means. This finding illustrates a significant difference between the four groups.
Table 13One-Way ANOVA Results for College Credit Ranked Scores for Program Completers, Non-Completers, Interviewed/Non-Admitted, and Not Interviewed/Non Admitted
Source df Sum of Squares
MeanSquare £
Between 3 71.34 23.78 8.67*Within 388 1064.8 2.74
*p < .0056.
A post hoc comparison was performed because omnibus F was significant. Students completing the program had a higher college credit ranking and were significantly different (alpha = .0056) as compared to students not interviewed and not admitted. Applicants
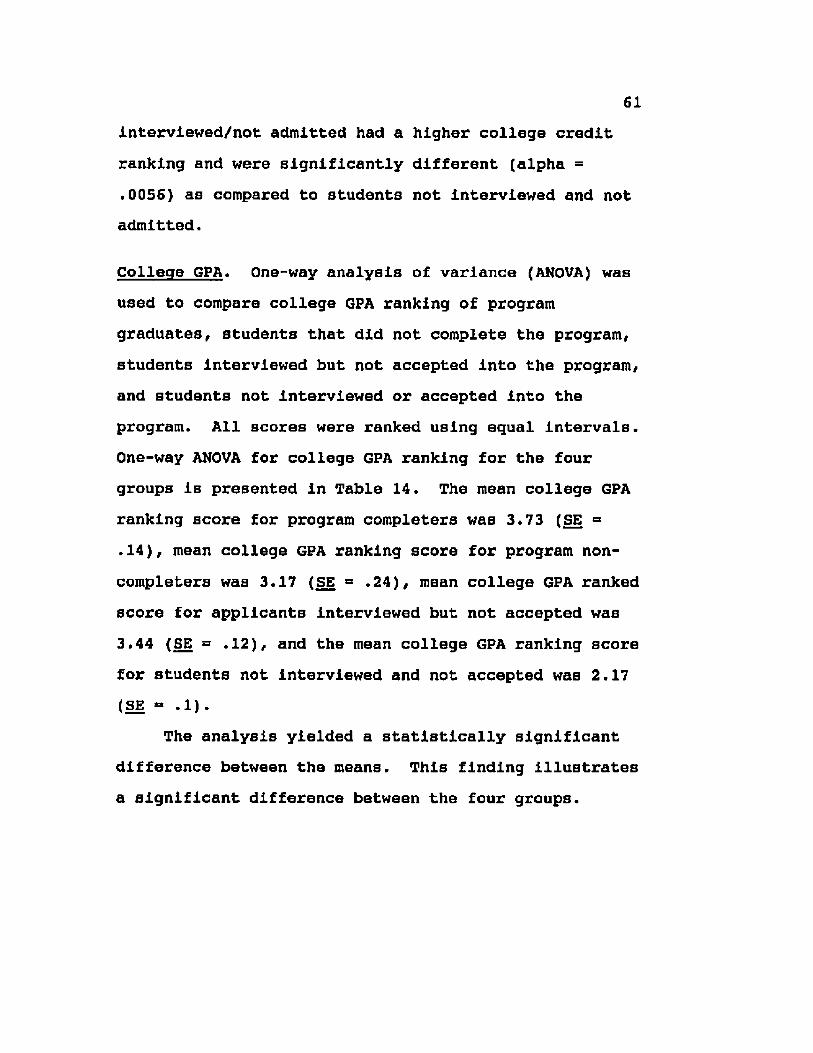
61interviewed/not admitted had a higher college credit ranking and were significantly different (alpha =.0056) as compared to students not interviewed and not admitted.
College GPA. One-way analysis of variance (ANOVA) was used to compare college GPA ranking of program graduates/ students that did not complete the program, students Interviewed but not accepted into the program, and students not interviewed or accepted into the program. All scores were ranked using equal intervals. One-way ANOVA for college GPA ranking for the four groups is presented in Table 14. The mean college GPA ranking score for program completers was 3.73 (SE =.14), mean college GPA ranking score for program noncompleters was 3.17 (SE = .24), mean college GPA ranked score for applicants interviewed but not accepted was3.44 (SE = >12), and the mean college GPA ranking score for students not interviewed and not accepted was 2.17 (SE «* .1).
The analysis yielded a statistically significant difference between the means. This finding illustrates a significant difference between the four groups.

62Table 14One-Way ANOVA Results for College 6PA Ranked Scores for Program Completers, Non-Completers, interviewed/Non- Admltted, and Not Interviewed/Non Admitted
Sum of Mean FSource df Squares Square
BetweenWithin
338B
177.79624.98
59.261.61
36.79*
*p < .0056.
A post hoc comparison was performed because omnibus F was significant. Students completing the program, students not completing the program, and students interviewed but not admitted to the program had a higher college GPA and were significantly different (alpha ** .0056) as compared to applicants not interviewed and not admitted to the program.
Curriculum Credits. One-way analysis of variance (ANOVA) was used to compare curriculum credit ranking of program graduates, students that did not complete the program, students interviewed but not accepted into the program, and students not interviewed or accepted into the program. All scores were ranked using equal intervals. One-way ANOVA for curriculum credit ranking for the four groups is presented in Table 15. The mean curriculum credit ranking score for program completers

63was 3.05 (SB - . 12), mean curriculum credit ranking score for program non-completers was 3.11 (SB ** .2), mean curriculum credit ranking score for applicants interviewed but not accepted was 2.56 (SE 9 .09)/ and the mean curriculum credit ranking score for students not interviewed and not accepted was 2.20 (SB - .09).
The analysis yielded a statistically significant difference between the means. This finding illustrates a significant difference between the groups.
Table 15One-Way ANOVA Results for Curriculum Credit Ranked Scores for Program Completers, Non-Completers,Interviewed/Non-Admitted, and Not Interviewed/Non Admitted
Source dfSum of Squares MeanSquare £
Between 3 45,71 15.24 14.3*Within 365 388.91 1.07
*p < .0056.
A post hoc comparison was performed because omnibus F was significant* Students completing the program had a higher curriculum credit ranking and were significantly different (alpha = .0056) as compared to applicants not interviewed and not admitted. Students not completing the program had a higher curriculum credit ranking and were significantly different (alpha
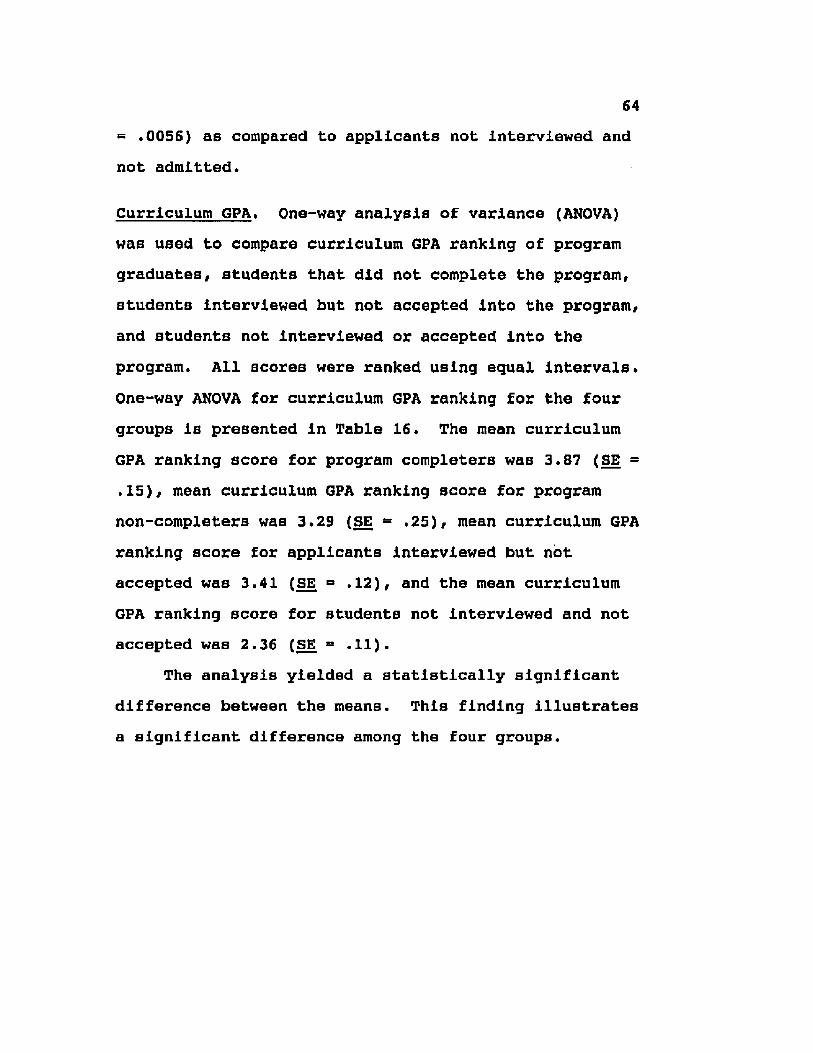
64= .0056) as compared to applicants not interviewed and not admitted.
Curriculum GPA, One-way analysis of variance (ANOVA) was used to compare curriculum GPA ranking of program graduates, students that did not complete the program, students interviewed but not accepted into the program, and students not interviewed or accepted into the program. All scores were ranked using equal intervals. One-way ANOVA for curriculum GPA ranking for the four groups is presented in Table 16. The mean curriculum GPA ranking score for program completers was 3.87 (SE = .15), mean curriculum GPA ranking score for program non-completers was 3.29 (SE - .25), mean curriculum GPA ranking score for applicants interviewed but not accepted was 3.41 (SE = .12), and the mean curriculum GPA ranking score for students not interviewed and not accepted was 2.36 (SE = .11).
The analysis yielded a statistically significant difference between the means. This finding illustrates a significant difference among the four groups.

65Table 16One Way ANOVA Results for Curriculum GPA Ranked Scores for Program Completers, Non-Completers, Interviewed/Non-Adroitted, and Not Interviewed/Non Admitted
Sum of Mean FSource df Squares Square
Between 3 133.87 44.62 25.03*Within 364 648.99 1.78
*p < .0056.
A post hoc comparison was performed because omnibus F was significant. Students completing the program and students interviewed but not admitted to the program had a higher curriculum GPA ranking and were significantly different (alpha = .0056) from students that were not interviewed nor admitted to the program.
Program Completers & Non-Completers Analysis
Discriminate Analysis. Discriminate analysis was completed on each parameter due to prior grouping in the initial academic analysis. The use of discriminate analysis allowed for relationships to be shown between academic ranking and interview ranking, and completion of the radiologic technology program. In the discriminate analysis, the criterion variables were

66completers vs. non-completers. The predictor variables were; high school GFA/GED ranked score, ranked scores in biology, chemistry, physics, and algebra, ranked curriculum GPA, college credits, college GPA, curriculum credits, composite academic rank, interview rank, and total admission ranking.
Discriminate analysis of the composite academic ranking and interview rankings between program completers and program non-completers illustrates that by knowing these two factors, the percentage error could be reduced 10.9%. Further discriminate analysis of composite academic ranking for these two groups demonstrates significance at an alpha of .1 (£ = .06) explaining 24% of the shared variance or predictability. The values of Wilks Lambda (\ ) observed for the independent variables ranged from .83 to .98. These values represent the residual variance of the-ac3 regression analysis (1 - R) (or that proportion of variance of the respective dependent variables that is not associated with the regression of ^on the dichotomous completion variable). The term,1 is the proportion of the variance of the dichotomous completion variable that is associated (or explained) by the regression of y on the respective independent variables.
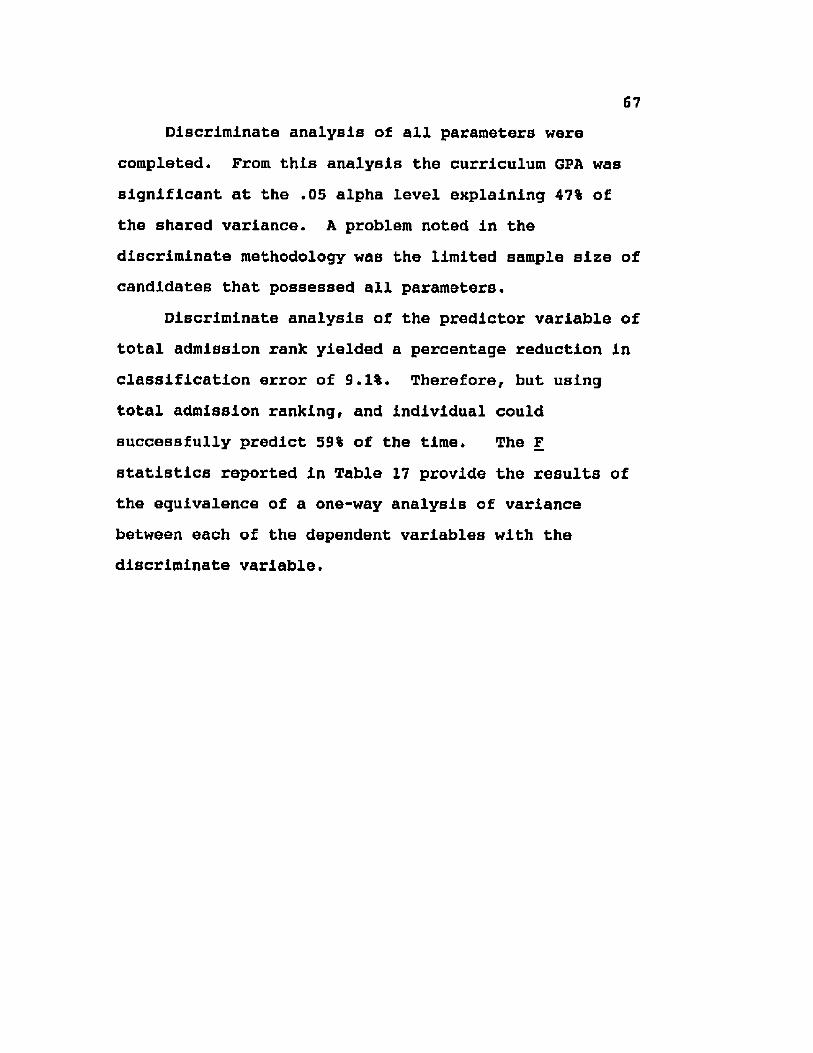
67Discriminate analysis of all parameters were
completed. From this analysis the curriculum GPA was significant at the .05 alpha level explaining 47% of the shared variance. A problem noted in the discriminate methodology was the limited sample size of candidates that possessed all parameters.
Discriminate analysis of the predictor variable of total admission rank yielded a percentage reduction in classification error of 9.1%. Therefore, but using total admission ranking, and individual could successfully predict 59% of the time. The F statistics reported in Table 17 provide the results of the equivalence of a one-way analysis of variance between each of the dependent variables with the discriminate variable.

68Table 17Variable Selection In Discriminate AnalysisDependentVariable Wilks Lambda F E
CompositeAcademicRanking .98 2.5 .12Interview .97 1.0 .31Chemistry .85 2.6 .11HISH GPA/GED .89 2.0 .17Curriculum GPA .94 7,1 .009*College GPA .92 1.3 .26College Credits .92 .3 .6Curriculum Credits .92 0.0 .98Algebra .83 0.0 .88Biology .83 .1 .76Physics .84 .2 .66
*p < .05.
T-test procedures were incorporated in this study to identify any specific admission components or program groupings that could differentiate students completing the program versus those students not completing the program. T-tests were chosen due to the unequal sample sizes (completers » 82, non-completers = 28) and the limited sample size of admitted students who had rankings in all parameters.

In the admission model currently utilized by the radiologic technology program, three grouping variables occur, which are composite academic ranking, interview ranking, and total admission rank, ab described previously, 60% of the academic ranking combined with 40% of the interview ranking determines total admission ranking. Therefore, initially a t-test was done on total admission ranking to determine significance (See Table 18).
Total Admission Ranking. A t-test for independent samples was used to compare total admission ranking group means of program completers and program noncompleters to determine whether any differences between the means of the groups were greater than would be expected from sampling error alone. All scores were ranked using equal intervals. The t-test for total admission ranking for the two groups is presented Table in 18.
The analysis did not yield a statistically significant difference between the means at a probability level of .05; [t (1, 108) « 1.32, g = .19). This finding illustrates no significant difference in total admission ranking between program completers and non-completers.
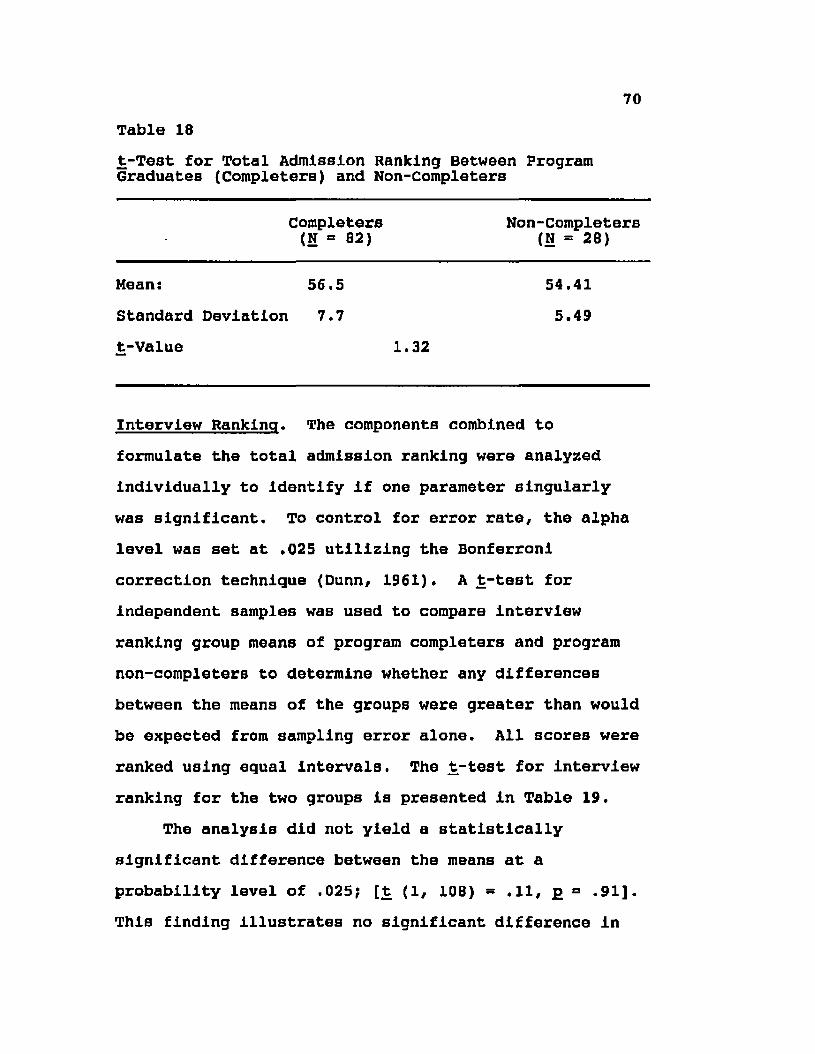
70Table 18t-Test for Total Admission Ranking Between Program Graduates (Completers) and Non-Completers
Completers (N = 82)
Non-Completers (N = 28)
Mean: 56.5 54.41Standard Deviation 7.7 5.49t-Value 1.32
Interview Ranking. The components combined to formulate the total admission ranking were analyzed Individually to identify if one parameter singularly was significant. To control for error rate, the alpha level was set at .025 utilizing the Bonferroni correction technique (Dunn, 1961). A t-test for independent samples was used to compare interview ranking group means of program completers and program non-completers to determine whether any differences between the means of the groups were greater than would be expected from sampling error alone. All scores were ranked using equal intervals. The t-test for interview ranking for the two groups is presented in Table 19.
The analysis did not yield a statistically significant difference between the means at a probability level of .025; [t (1, 108) = .11, £ = .91]. This finding illustrates no significant difference in

71interview ranking between program completers and noncompleters .
Table 19t-Test for Interview Ranking Between Program Graduates (Completers) and Non-Completers
Completers (N - 82)
Non-Completers (N = 28)
Mean: 28.31 28.16Standard Deviation 6.16 5.21t-Value .11
Composite Academic Ranking. The components combined to formulate the total admission ranking were analyzed individually to identify if one parameter singularly was significant. To control for error rate, the alpha level was set at .025 utilizing the Bonferroni correction technique (Dunn, 1961). A t-test for independent samples was used to compare composite academic ranking group means of program completers and program non-completers to determine whether any differences between the means of the groups were greater than would be expected from sampling error alone. All scores were ranked using equal intervals. The t-test for composite academic ranking for the two groups is presented in Table 20.

72The analysis did not yield a statistically
significant difference between the means at a probability level of .025; (1/ 108) ** 1.57, £ =.12]. This finding illustrates no significant difference in composite academic ranking between program completers and non-completers.
Table 20t-Test for Composite Academic Ranking Between Program Graduates (Completers) and Non-Completers
Completers (N = 82)
Non-Completers (N » 28)
Mean: 28.77 26.25Standard Deviation 7.76 5.76t-value 1.57
Composite Academic Ranking Components. Because no significance was detected in composite academic ranking, those factors combined to formulate composite academic ranking were individually analyzed. A total of nine parameters is included in the formulation of the composite academic ranking. To control for error rate, the alpha level was set at .0056. Individual analysis of each parameter is presented.
High School GPA/GED Ranked Score. A t-test for Independent samples was used to compare high school
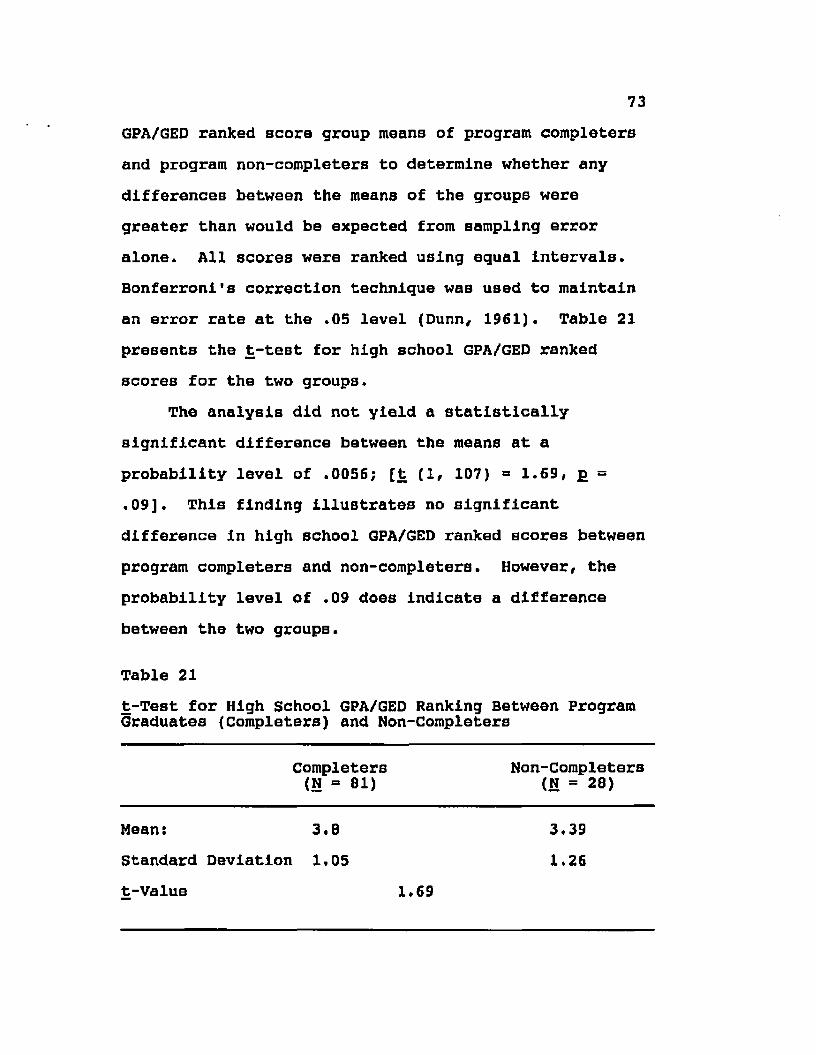
73GPA/GED ranked score group means of program completers and program non-completers to determine whether any differences between the means of the groups were greater than would be expected from sampling error alone. All scores were ranked using equal Intervals. Bonferronl's correction technique was uBed to maintain an error rate at the .05 level (Dunn, 1961). Table 21 presents the t-test for high school GPA/GED ranked scores for the two groups.
The analysis did not yield a statistically significant difference between the means at a probability level of .0056; [t (1, 107) = 1.69, £ = .09]. This finding illustrates no significant difference in high school GPA/GED ranked scores between program completers and non-completers. However, the probability level of .09 does indicate a difference between the two groups.
Table 21t-Test for High School GPA/GED Ranking Between Program Graduates (Completers) and Non-Completers
Completers (N = 81)
Non-Completers (N - 28)
Mean: 3.8 3.39Standard Deviation 1.05 1.26t-Value 1.69

74Biology* A t-test for independent samples was used to compare biology ranked score group means of program completers and program non-completers to determine whether any differences between the means of the groups were greater than would be expected from sampling error alone. All scores were ranked using equal intervals. Bonferroni1s correction technique was used to maintain an error rate at the .05 level (Dunn, 1961). The t- test for biology ranked scores for the two groups is presented in Table 22.
The analysis did not yield a statistically significant difference between the means at a probability level of .0056; [t (1, 106) = -1.36, 2 = .18]. This finding illustrates no significant difference in biology ranked scores between program completers and non-completers.
Table 22t-Test for Biology Ranking Between Program Graduates (Completers) and Non-Completers
Completers (N = 81)
Non-Completers (N - 27)
Mean: 11.48 13.44Standard Deviation 6.27 7.15t-Value -1.36
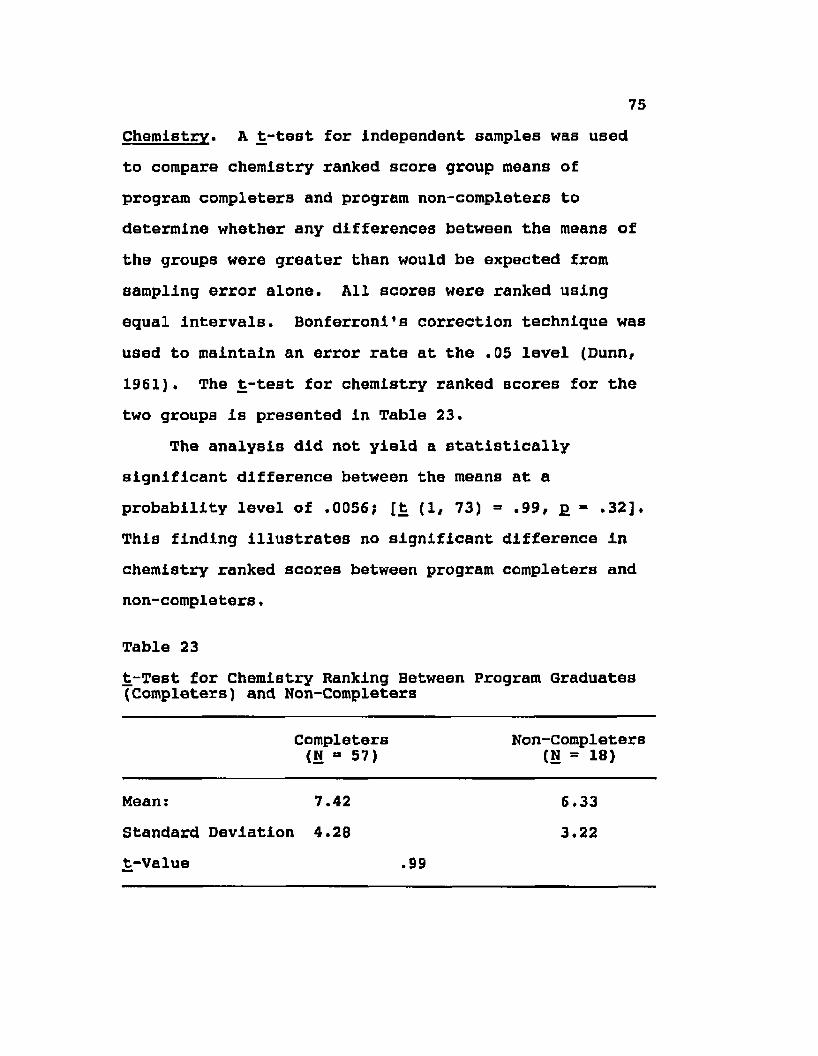
75Chemistry* A t-test for Independent samples was used to compare chemistry ranked score group means of program completers and program non-completers to determine whether any differences between the means of the groups were greater than would be expected from sampling error alone. All scores were ranked using equal intervals. Bonferronl's correction technique was used to maintain an error rate at the .05 level (Dunn/ 1961). The t-test for chemistry ranked scores for the two groups is presented in Table 23.
The analysis did not yield a statistically significant difference between the means at a probability level of .0056; [t (1, 73) = .99, j> = .32]. This finding illustrates no significant difference in chemistry ranked scores between program completers and non-completers.
Table 23t-Test for Chemistry Ranking Between Program Graduates (Completers) and Non-Completers
Completers (N «= 57)
Non-Completers (N = 18)
Mean: 7.42 6.33Standard Deviation 4.28 3.22t-Value .99

76Physics, A t-test for independent samples was used to compare physicB ranked score group means of program completers and program non-completers to determine whether any differences between the means of the groups were greater than would be expected from sampling error alone. All scores were ranked using equal intervals. Bonferronl's correction technique was used to maintain an error rate at the .05 level (Dunn/ 1961). The t- test for physics ranked scores for the two groups is presented in Table 24.
The analysis did not yield a statistically significant difference between the means at a probability level of .0056; [t (1, 18) = -.49, p =.63]. This finding illustrates no significant difference in physics ranked scores between program completers and non-completers.
Table 24t-Test for Physics Ranking Between Program Graduates (Completers) and Non-Completers
Completers (N = 18)
Non-Completers (N = 2)
Mean: 7 8Standard Deviation 2,83 0t-Value -.49

77Algebra. A t-test for Independent samples was used to compare algebra ranked score group means of program completers and program non-completers to determine whether any differences between the means of the groups were greater than would be expected from sampling error alone. All scores were ranked using equal intervals. Bonferronl's correction technique was used to maintain an error rate at the .05 level (Dunn, 1961). The t- test for algebra ranked scores for the two groups is presented in Table 25.
The analysis did not yield a statistically significant difference between the means at a probability level of .0056; [t (1, 107) = 1.38, p = .17]. This finding illustrates no significant difference in algebra ranked scores between program completers and non-completers.
Table 25t-Test for Algebra Ranking Between Program Graduates (Completers) and Non-Completers
Completers (N « 81)
Non-Completers (N = 28)
Mean: 6.48 5.71Standard Deviation 2.26 3.21t-Value 1.38

78College credit Ranking* A t-test for independent samples was used to compare college credit ranking score group means of program completers and program non-completers to determine whether any differences between the means of the groups were greater than would be expected from sampling error alone. All scores were ranked using equal intervals. Bonferronl's correction technique was used to maintain an error rate at the .05 level (Dunn, 1961). The t-test for college credit ranked scores for the two groups is presented in Table 26.
The analysis did not yield a statistically significant difference between the means at a probability level of .0056; [t (1, 104) = .22, £ =.83]. This finding illustrates no significant difference in college credit ranked scores between program completers and non-completers.
Table 26t-Test for College Credit Ranking Between Program Graduates (Completers) and Non-Completers
Completers (N - 78)
Non-Completers (N = 28)
Mean: 4.82 4.75Standard Deviation 1.45 1.55t-Value .22

79College GPA Ranking, A t-test for Independent samples was used to compare college GPA ranking score group means of program completers and program non-completers to determine whether any differences between the means of the groups were greater than would be expected from sampling error alone. All scores were ranked using equal Intervals. Bonferronl's correction technique was used to maintain an error rate at the .05 level (Dunn, 1961). The t-test for college GPA ranked scores for the two groups Is presented In Table 27.
The analysis did not yield a statistically significant difference between the means at a probability level of .0056; [t (1, 104) = 2.67, £ = .0087]. This finding illustrates no significant difference in college GPA ranked scores between program completers and non-completers.
Table 27t-Test for College GPA Ranking Between Program Graduates (Completers) and Non-Completers
Completers N = 78
Non-Completers N = 28
Mean: 3.73 3.18Standard Deviation .94 .94t-Value 2.67

eoCurriculum Credit Ranking. A t-test for independent samples was used to compare curriculum credit ranking score group means of program completers and program non-completers to determine whether any differences between the means of the groups were greater than would be expected from sampling error alone. All scores were ranked using equal intervals. Bonferronl's correction technique was used to maintain an error rate at the .05 level (Dunn, 1961). The t-test for curriculum credit ranked scores for the two groups is presented in Table 28.
The analysis did not yield a statistically significant difference between the means at a probability level of .0056; [ t (1, 104) - -.23, p - .82]. This finding illustrates no significant difference in curriculum credit ranked scores between program completers and non-completers.
Table 28t-Test for Curriculum Credit Ranking Between Program Graduates (Completers) and Non-Completers
Completers (N - 78)
Non-Completers (N - 28)
Mean: 3.05 3.11Standard Deviation 1.13 1.1t-Value -.23
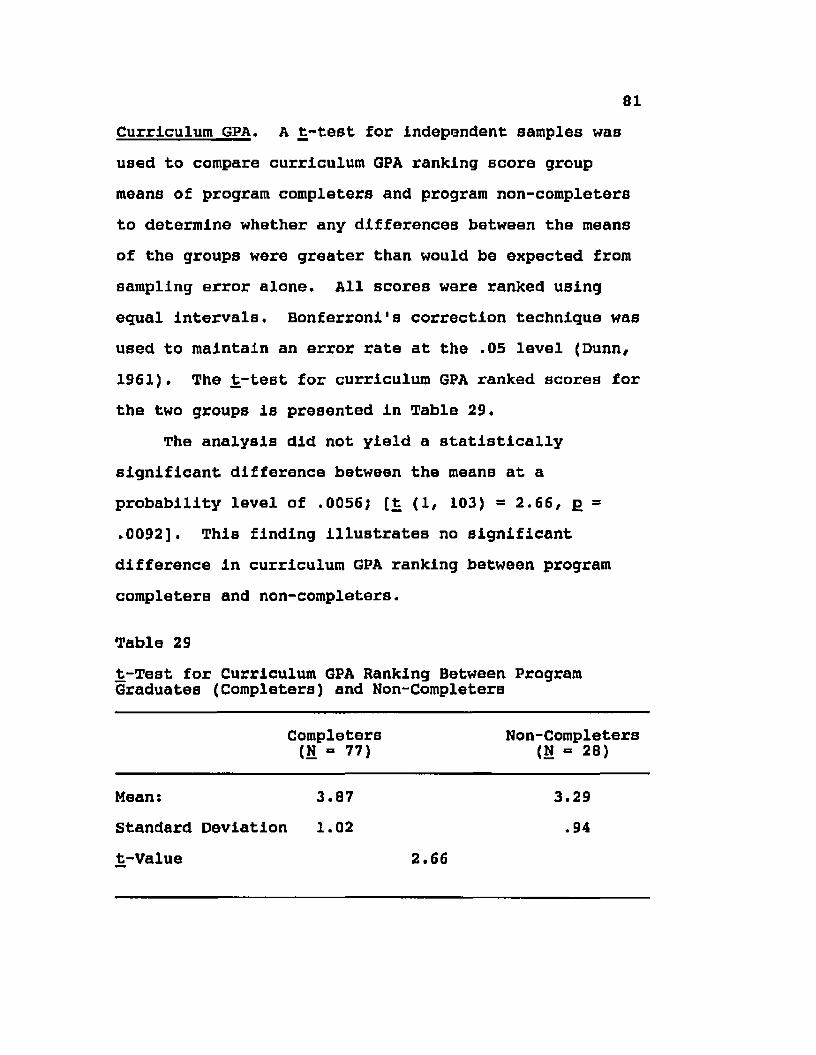
81Curriculum GPA, A t-test for independent samples waB used to compare curriculum GPA ranking score group means of program completers and program non-completers to determine whether any differences between the means of the groups were greater than would be expected from sampling error alone. All scores were ranked using equal intervals, Bonferronl's correction technique was used to maintain an error rate at the .05 level (Dunn, 1961), The t-test for curriculum GPA ranked scores for the two groups is presented in Table 29.
The analysis did not yield a statistically significant difference between the means at a probability level of ,0056; [t (1, 103) = 2.66, £ = .0092], This finding illustrates no significant difference in curriculum GPA ranking between program completers and non-completers.
Table 29t-Test for Curriculum GPA Ranking Between Program Graduates (Completers) and Non-Completers
Completers (N = 77)
Non-Completers (N = 28)
Mean: 3.87 3.29Standard Deviation 1.02 .94t-Value 2.66
Chapter 5Summary, Conclusions, and Recommendations for Future
Research and ChangesSummary
Institutions offering occupational-technical programs face certain constraints such as limited program capacity and significant financial costs. Therefore, it is essential that valid student selection procedures be incorporated in the admission process. This study was designed, therefore, to determine, through systematic data collection and analysis, the validity of the student selection process utilized by the Radiologic Technology Program at East Tennessee State University and to identify any specific components that indicated program completion.
The research literature was reviewed and support was found for the need for research concerning student selection validity for allied health programs.Concerns regarding the validity of specific admission models were voiced in the literature review. Models utilizing grade point averages, standardized testing, interviews, and pBychomotor testing were reviewed and the validity of each of these models was questioned. After investigation of the major areas which academic programs utilize to select students, it was obvious that a need existed to validate an admission model for
82

83the Radiologic Technology Program at East Tennessee State University.
A systematic study model was set forth whereby selection validity of the Radiologic Technology Program could be ascertained as well as any individual selection parameters that would indicate program completion. The population consisted of all applicants who applied to the radiologic technology program from 1991 through 1993. The population consisted of 510 students. The population was divided into four groups: 1) Students completing the program (program completers); 2) Students not completing the program (program non-completers); 3) Students interviewed but not admitted to the program; and 4) Students not interviewed and not admitted to the program.
Information used in student selection was obtained from East Tennessee State University Program of Radiologic Technology and from the Registrar's office. One- way analysis of variance (ANOVA) was used to determine significance between the four groups of the population. The statistical analysis utilized the Bonferroni correction technique.
The population of admitted students (N = 110) was also statistically analyzed. Discriminate analysis was completed on each parameter due to prior grouping in the initial academic analysis. T-tests were utilized
84to identify any differences between program graduates and individuals who did not complete the program. The statistical analysis utilized the Bonferroni correction technique.
The statistical treatment of the data collected was reported with regard to the null hypothesis selected for the study. To determine selection process validity/ the null hypothesis formulated for this study was that the selection process (or any components) utilized by the Radiologic Technology Program at East Tennessee State University was not related to program completion.
After analysis of the data of the identified four groups of students, significant statistically differences were identified in the following parameters: Total admission ranking, interview ranking, composite academic ranking, high school GPA/GED ranking, biology ranking, chemistry ranking, physics ranking, algebra ranking, college credit ranking, college GPA ranking, college credit ranking, program curriculum credit ranking, and program curriculum GPA ranking. Therefore, the null hypothesis would be rejected regarding all selection parameters. However, care must be utilized in the rejection of the null due to unequal sample sizes.

85Data from students admitted to the radiologic
technology program from 1991 through 1993 (N = 110) were also statistically analyzed to detect any difference between program graduates and program noncompleters. Discriminate analysis of admitted students found that curriculum GPA ranking significant (alpha = .05) explaining 47% of the shared variance. However, caution should be demonstrated in utilizing this statistic due to limited sample size. Therefore, t- tests were completed on the total population of admitted students to identify any significant program completion parameters. No significant results were obtained, therefore, the null hypothesis is accepted. However, all completers of the Radiologic Technology Program at East Tennessee State University since the Implementation of this admission model have passed the national examination surpassing national averages thereby validating candidate selection.
Conclusions Based upon the findings of this study, the
following conclusions are drawn:1. The admission parameters utilized by the
Radiologic Technology Program at East Tennessee State University (total admission ranking, interview ranking, composite academic ranking, high school GPA/GED scaled score, biology ranking,

chemistry ranking, physics ranking, algebra ranking, college credit ranking, college GPA ranking, college credit ranking, program curriculum credit ranking, and program curriculum GPA ranking) are statistically significant in identifying differences between program completers, program non-completers, students interviewed but not admitted, and students not interviewed or admitted.No significant differences were identified between program completers and non-completers in the total population. Therefore, if differences exist, they are not of an academic nature that are traditionally tested and measured.The admission model utilized by the Program of Radiologic Technology at Cast Tennessee state University 1b equitable.Significant differences in chemistry and physics rankings between program graduates as compared to non-admitted students exist. Therefore, the prerequisite requirement of chemistry is justified. However, the Inclusion of a prerequisite physics course would severely limit the candidate selection population and further study on this specific parameter is recommended. Inter-rater reliability of the interview process

87has a .78 correlation. Therefore, reliability between interviewers is relatively assured. Although no significant differences between interview rankings between program graduates and program non-completers were detected, the program must also consider the impact that the interviewing process haB on the collaborative effort between the sponsoring institution and the clinical education centers.
Recommendations for Future Research Based upon the data derived from this study, the
following recommendations are made:1. Further studies should be conducted
Incorporating demographic factors.2. Studies addressing selection parameter
reliability should be conducted.3. Reliability of each interview question should
be ascertained.4. Studies involving common admission parameters
at different sponsoring institutions should be investigated.
5. Studies incorporating a qualitative methodology regarding program completion versus noncompletion could be beneficial.
This study provides a starting point for other research related specifically to admission parameters

for radiologic technology programs. Therefore, more research in this area is indicated. Each radiologic technology program must critically analyze all admission parameters and access the significance and attributes of each parameter. From the results of this study, other non-academic factors, such as knowledge concerning the profession and clinical observation prior to admission, should be examined regarding student completion. By identifying student characteristics related to program success, allied health educators could more effectively meet the needs of both the student and employers in the health care field. In this age of accountability, validation of the admission model by programs could prove advantageous in light of challenges regarding admission decisions by non-accepted students. Hopefully, research in this medical specialty will be stimulated by the findings of the study.

REFERENCES
89

90Allied Health Education Directory. (1994)*
American Medical Association. Chicago, IL. <-American Medical Association* (1994). Allied
health education directory (22nd ed.).Althoff, K. (1986). Relevance of school grades in
personnel selection. Psychology and Practice, 30, 77- 85.
Ballinger, P. W. (1976). Predicting clinical performance of radiologic technology students. Radiologic Technology, 48(6). 364-371.
Balogun, J. A. (1988). Predictors of academic and clinical performance in a baccalaureate physical therapy program. Physical Therapy, 68(2), 238-242.
Balogun, J. A., Karakoloff, L. A., & Farina, N. T. (1986). Predictors of academic achievement in physical therapy. Physical Therapy, 66(6), 976-980.
Bauwen, E. E., & Gerhard, G. G. (1987). The use of the Watson-Glasser Critical Thinking Appraisal to predict success in a baccalaureate nursing program. Journal of Nursing Education. 26(7), 278-281.
Bellow, A. (1977). Factors which predict success or failure in an associate degree nursing program. Hartford, CT: Connecticut Vocational EducationalResearch and Planning Unit, 159 pgs.

91Bistereich, A. M. (1977). Predicting grade point
average, withdrawal, and graduation from four allied health programs at Mlaml-Dade Community College Medical Center Campus. Mlaml-Dade Community College.
Blagg, J. D. (1984). Potential for using cognitive styles as selection predictors for allied health education administration programs. Journal of Allied Health, 13(2), 130-139.
Blagg, J. D. (1985). Cognitive styles and learning styles as predictors of academic success in a graduate allied health education program. Journal of Allied Health. 14m . 89-98.
Bloom, B.S. fi Krathwohl, D. R. (1984). Taxonomy of Educational Objectives (28th ed.). New York:Longman Inc.
Capoor, M. (1993, May). Evaluation of open access versus selected admission to the nursing program in a community. Paper presented at the 23rd annual forum of the Association of Institutional Research, Toronto, Canada.
Cisneros-Blagg, T., & Blagg, J.D. (1983).Selected personality and demographic variables:Academic success in radiography programs. Radiologic Technology, 54(5), 372-376.

92Dietrich/ M. c. (1981). Putting objectivity in
allied health student selection procesa. Journal of Allied Health, 10(4), 226-239.
Dietrich/ M. C., & Crowley/ J. A. (1982). A national study of student selection practices in allied health professions. Journal of Allied Health/ 11. 248- 260.
Douce/ F. H./ & Coates, M. A. (1984). Attrition in respiratory therapy education: causes and relationship to admissions criteria. Respiratory Care, 29(8), 823-828.
Dreher, M. J., & Singer, H. (1985). Predicting college success: Learning from text, background knowledge, attitude toward school and the SAT as predictors. Yearbook - National Reading Conference, 34, 362-368.
Dunn, 0. J. K. (1961). Multiple comparisons among means. Journal of the American statistical Association, 56, 52-64.
East Tennessee State University (1994). Schedule of Classes Bulletin, LXXXI(2), 10.
East Tennessee State University (1995). Self- Study Report - Radiologic Technology Program.
East Tennessee State University (1995).Additional Policies and Procedures Handbook -Radiologic Technology Program.

93Friedemann, M. L ., & Valentine, s. (1988).
Success in old and new licensure examinations: Preadmission factors and academic performance. Research in Nursing & Health, 11, 343-350.
Higgs, Z. R. (1984). Predicting success in nursing: From prototype to pragmatics. WesternJournal of NurBlng Research, 6(1), 77-95.
Hinkle, D. E., Wiersma, W., & Jurs, S. 6. (1994). Applied Statistics for the Behavioral Sciences (3rd ed.). Boston: Houghton Mifflin.
Holt, T. B., & Dunlevy, C. L. (1992). The use of preadmission criteria to predict academic success in a four year respiratory care curriculum. Respiratory Care, 37(5). 439-443.
Institute of Medicine (IOM) (1989). Allied Health Services: Avoiding Crises. Washington, DC: NationalAcademic Press.
Jensen, S. C. (1989). Predictors of success for allied health students. Journal of Studies in Technical Careers, Ilf4), 297-304.
Joint Review Committee on Education in Radiologic Technology. (1992a, April). Program report. (Agenda:E #16). Chicago, IL: Claire Bender.
Joint Review Committee on Education in Radiologic Technology. (1992b). Essentials and guidelines for accreditation for radiologic technology.

94Kavanagh, L. K. (1981). Admission criteria for a
college-based radiologic technology program: Relationship of entry levels to subsequent performance in selected program courses. Radiologic Technology, 53(2), 113-116.
Kentucky State Department of Education (1988). Health Program Entrant’s Math/Reading/Success Review. 1-36.
Kroll, C. (1990). Registered nurse students: Academic admission and progression. The Journal of Continuing Education in Nursing, 21(4), 160-164.
Larkin, P. G. (1977). Admissions Test Results as Criteria for Entrance into the Nursing Program and Regression Analysis of Entrance Tests and Predictors of Success in NurBlng State Board Exams. Larso, MD:Prince George’s Community College, Office of Institutional Research.
Mann, W. C. (1979). Interviewer scoring differences in student selection. American Journal of Occupational Therapy. 33, 235-239.
McClelland, E., Yang, J. C., & Glick, O. J.(1992). A statewide study of academic variables affecting performance of baccalaureate nursing graduates on licensure examination. Journal of Professional Nursing, 9(6). 342-350.

95McGinnis, M. E. (1984). Admission predictors for
pre-physical therapy majors. Physical Therapy, 64fl), 56-58.
Oliver, D. H. (1985). The relationship of selected admission criteria to the academic success of associate degree nursing students. Journal of Nursing Education. 24(5). 197-205.
Payne, M. A, & Duffey, M. A. (1986). An investigation of the predictability of NCLEX scores of BSN graduates using academic predictors. Journal of Professional Nursing, 2(5). 326-332.
Petty, N. H., & Todd, A. (1985). A Model to Improve the Success Rate of Students in Community College System. Final Report. Raleigh, NC: NorthCarolina State Department of Community Colleges, 75 pgs.
Program Director. (1994). East Tennessee State University, Program of Radiologic Technology.
Roose, D., Mitchell, s., & Rudman, M. K. (1985). Selecting the brightest and the best. Phi Delta Kappan. 219-221.
Safian-Rush, D., & Belock, S. (1988). Ethnicity, academic skills and nursing student achievement.Journal of Nursing Education, 27f2), 71-77.

96Schmalz, 6. M., Rahr, R. R., & Allen, R. M.
(1990). The use o£ preadmission data to predict levels of success in selected allied health students. Occupational Therapy Journal, 10(6), 367-376.
Schuler, H., Funke, U., & Baron-Boldt, J. (1990). Predictive validity of school grades - a meta-analysis. Applied Psychology; An International Review, 39(1). 89- 103.
Schwirian, P. M. (1976). Predictions of successful nursing performance. Part I and II. Bethesda, MDi Health Resources Administration.
Schwirian, P. M. (1977). Prediction of successful nursing performancet Parts I and II (DHEW Publication No. 77-27). Washington, DC.
Schwirian, P. M., & Gortner, s. R. (1979). How nursing schools predict their successful graduates. Nursing Outlook, 27, 352-358.
Shahani, C., Dipboye, R. L., & Gehrlein, T. M.(1991). The incremental contribution of an interview to college admissions. Educational and Psychological Measurement. 51, 1049-1061.
Shehane, D. R. (1995). [Student selection criteria in associate degree university based radiography programs]. Unpublished raw data.

97Shepard, K. F. (1980). Use of small group
Interviews for selection into allied health educational programs. Journal of Allied Health. 9. 85-91.
Slovensky, D. J. (1986). Predicting academic success in a medical record technician program. Topics in Health Record Management. 7fl), 11-15.
Tatham, E. (1975). Nursing and Dental Hygiene Selection Procedures, Part 2 A: An examination ofAcademic Variables as Predictors of Success. Overland Park, KS: Johnson County Community College.
Tompkins, L. S., & Harkins, C. J. (1990). Predicting academic success in a nontraditional program. Journal of Allied Health, 19(1), 15-24.
U.S. Department of Health and Human Services.(1992). Health Personnel in the United States; 8th Report to Congress. 1991 (HRS-P-OD-91-1). Washington, DC: U.S. Government Printing Office.
Vargo, J. W., Madill, H. M., Davidson, P. R.(1986). The preadmission interview as a predictor of academic grades and fieldwork performance. Canadian Journal of Occupational Therapy. 53(4), 211-215.
Walsh, S. L. (1985). CLAST study results. In Planning and Analysis. Miami, FL: FloridaInternational University, Division of Planning and Analysis.
98Witkin, H. A., Moore, C. A., Goodenough, R., &
Cox, P. H. (1977). Field-dependence and field- independence cognitive styles and their educational implications. Review of Educational Research, 47, 1- 64.
Witkin, H. A., Moore, c. A., & Oltman, P. K. (1977). Role of the field-dependent and field- independent cognitive styles in academic evolution: Alongitudinal study. Journal of Education Psychology, 69, 197-211.
Wold, J. E., & Worth, C. (1990). Baccalaureate student nurse success prediction: A replication.Journal of Nursing Education, 29(2), 84-89.
Yocom, C. J., & Scherubel, J. C. (1985). Selected pre-admission and academic correlates of success on state board examinations. Journal of Nursing Education, 24(6), 244-249.
Young, J. W. (1990). Adjusting the cumulative GPA using item response theory. Journal of Educational Measurement, 27f21. 175-186.

APPENDICES
99

100Appwidix A
EAST TENNESSEE STATE UNIVERSITY RADIOLOGIC TECHNOLOGY PROGRAM - ADMITTANCE CRITERIA RAHKIN3
CEDsc* spifl 51-59 APIS 49-90 3PSS 40-44 2PTS
3.5-4.0 itn3.0-3.49 4PT83.5-1.99 3PTS3.0-1.49 2PX8
A APTS B 3PTS C 3PTB O IPX
A APTS B 3PTS C 3PTS D 1PT
A 4PXS B 3PTS C 3PTS 0 1PT
A 4PTS B 3PT3 C 3PTS D 1PT
30t 6PTS 13-29 9PT8 10-21 4PTS 12-17 3PTS «-ll 3PTS 1-5 ITT
3.5-4 SCTS3.0-3.49 4FTS2.5-2.99 3PTS2.0-2.49 3PTS
MAKE B.S. CPA BIOLOGY CHEKTRT PHYSICS ALGEBRA COTS/APP CPA CREDITS TOTAL
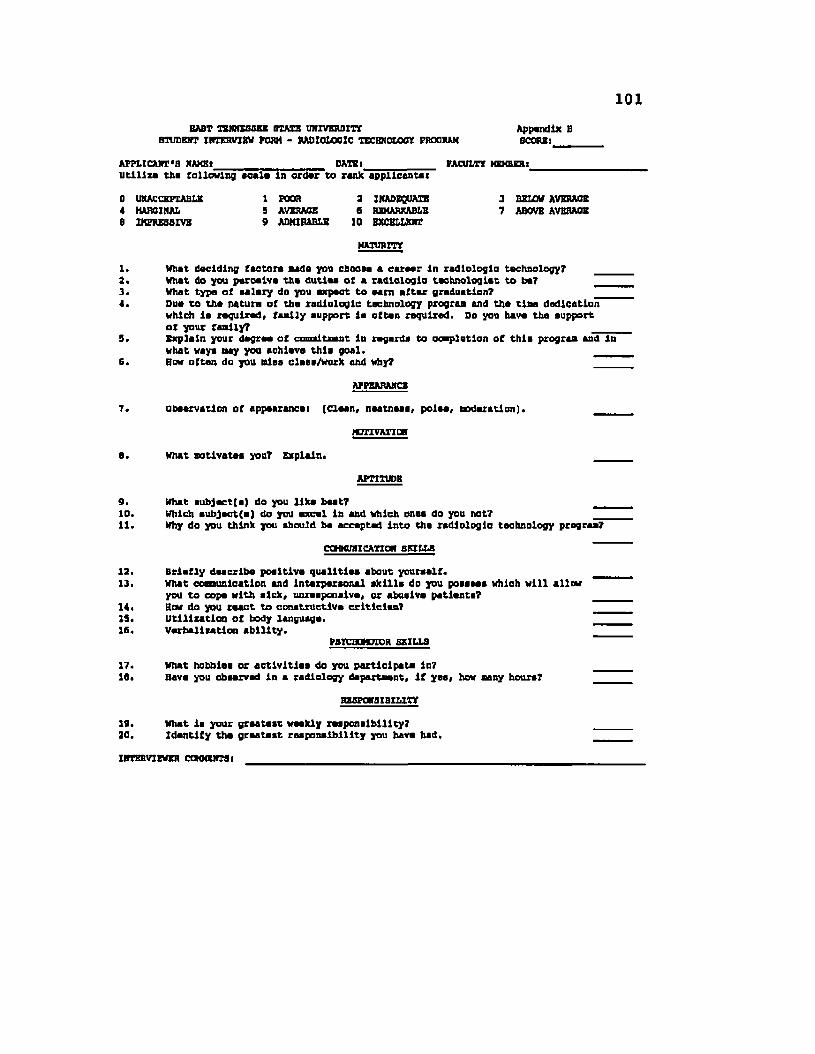
101BAST TENNESSEE STATE UNIVERSITf Appendix B
STUDENT INTERVIEW FORM - RADIOLOGIC TECHNOLOGY PROGRAM SCORE)________
APPLICANT'S NAKSt__________________ DATE!_____________ FACULTY MEMBER)______________Utilize the fallowing scale in order to rank applicants)
0 UNACCEPTABLE 1 POOR 2 INADEQUATE 3 BELOW AVERAGE4 MARGINAL 9 AVERAGE 6 REMARKABLE 7 ABCTVB AVERAGEe IMPRESSIVE 9 ADMIRABLE 10 EXCELLENT
MAaimm
1. Whet deciding factor* Bade yon choose « career In rodlologlo technology? ____2. Whet do you perceive the dutlee of * radiologic technologlet to be?_____________3. What type a? salary do you expect to earn after graduation?_____________________4. Due to the nature of the radiologic technology prograa and the tine dodlcatlan
which Is required* faelly support la often required. Do you have the supportof your faaliy?_____________________________________________________________
5. Explain your degree of comltaent In regards to ccnpletlon of this prograa and Inwhat ways nay you achieve this goal. _ _ _
6. Bow often do you nlss class/work and why?_________________________________ ____
APFBARAMCB
7. Observation of appearance) (Clean* neatness* poise, noderatlon).
motivation
6. What eotlvates you? Explain.
APTITUDE
9. What subject(s) do you Ilka beat?_____________________________________________10. Which subject(s) do you excel In and Which ones do you not?_____________________11. Why da you think you should be accepted Into the radiologic technology prograa?
CCHKUHICATIOt) SCLLB
12. Briefly describe positive qualities about yourself.13. What conninlcatlon and Interpersonal skills do you possess which will allow
you to cope with alck, unresponsive, or abusive patients?14. Bow do you react to constructive criticise?15. Utilization of body language.16. Verbalization ability.
pafcaoHaroR brills
17. What hobbles or activities do you participate ln710. Have you observed In a radiology departaent, If yea, how aany hours?
RESPONSIBILITY
19. What la your greatest weekly responsibility?30. Identify the greatest responsibility you have had.
INTERVIEWER COMMENTS)

102
Personal Data:
Education:
Professional:
VITA
Donna Richardson Shehane
Date of Birth: May 15, 1958Place of Birth: Princeton, West
Virginia Marital Status: SinglePublic schools, Princeton, West Virginia Morris Harvey College, charleston, West
Virginia; radiologic technology, A.S., 1978
University of Charleston, Charleston, West Virginia; biology, B.S., 1980
West Virginia College of Graduate Studies, Charleston, West Virginia; educational administration, M.A., 1988
Educational Coordinator, Metropolitan Nashville General Hospital; Nashville, Tennessee, 1980-1983
Assistant Professor, Bluefield State College; Bluefield, West Virginia, 1983-1991
Assistant Professor, East Tennessee State University; Johnson City, Tennessee, 1991 - Present
Honors and Awards:
Outstanding Radiologic Technology Student