predicting(:) the future of tracking - insight innovation · 2014-12-17 · turnaround . 4.21 base...
TRANSCRIPT
4.21 BASE MARGIN
4.19 TOP MARGIN
3.51 CHART TOP
11.90 LEFT MARGIN
11.90 RIGHT MARGIN
2.11 X AXIS
© TNS 2014
Predicting(:) the future of tracking [email protected] [email protected]

1 The trouble with tracking
2

4.21 BASE MARGIN
4.19 TOP MARGIN
3.51 CHART TOP
11.90 LEFT MARGIN
11.90 RIGHT MARGIN
2.11 X AXIS
© TNS 2014
The trouble with tracking
Poor links to what people actually do, or business performance
Declining response rates and poor quality data
Insights not actionable (or acted on)
Flat-lined metrics
Long, vague surveys that serve too many masters
Far from real-time turnaround

4.21 BASE MARGIN
4.19 TOP MARGIN
3.51 CHART TOP
11.90 LEFT MARGIN
11.90 RIGHT MARGIN
2.11 X AXIS
© TNS 2014 4
The client response
Inertia Scale back
Seek alternative
Cancel entirely

4.21 BASE MARGIN
4.19 TOP MARGIN
3.51 CHART TOP
11.90 LEFT MARGIN
11.90 RIGHT MARGIN
2.11 X AXIS
© TNS 2014 5
Social channels – evolution, fragmentation
1999 2003 2004 Today

4.21 BASE MARGIN
4.19 TOP MARGIN
3.51 CHART TOP
11.90 LEFT MARGIN
11.90 RIGHT MARGIN
2.11 X AXIS
© TNS 2014
2000 2014
Social Listening solutions history
6

4.21 BASE MARGIN
4.19 TOP MARGIN
3.51 CHART TOP
11.90 LEFT MARGIN
11.90 RIGHT MARGIN
2.11 X AXIS
© TNS 2014 7
Full range of opinions unfiltered
Sensitive to events “Real-time”
Social media data tracking—an attractive alternative?
Lower cost?
LIVE!
4.21 BASE MARGIN
4.19 TOP MARGIN
3.51 CHART TOP
11.90 LEFT MARGIN
11.90 RIGHT MARGIN
2.11 X AXIS
© TNS 2014 8
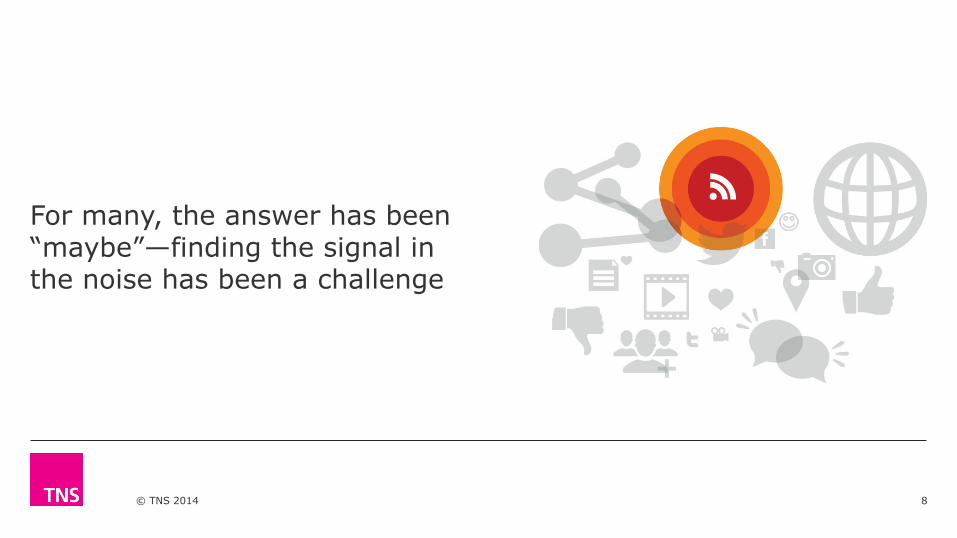
For many, the answer has been “maybe”—finding the signal in the noise has been a challenge

4.21 BASE MARGIN
4.19 TOP MARGIN
3.51 CHART TOP
11.90 LEFT MARGIN
11.90 RIGHT MARGIN
2.11 X AXIS
© TNS 2014 9
Out of the box – it doesn’t work
buzz equity
4.21 BASE MARGIN
4.19 TOP MARGIN
3.51 CHART TOP
11.90 LEFT MARGIN
11.90 RIGHT MARGIN
2.11 X AXIS
© TNS 2014 10
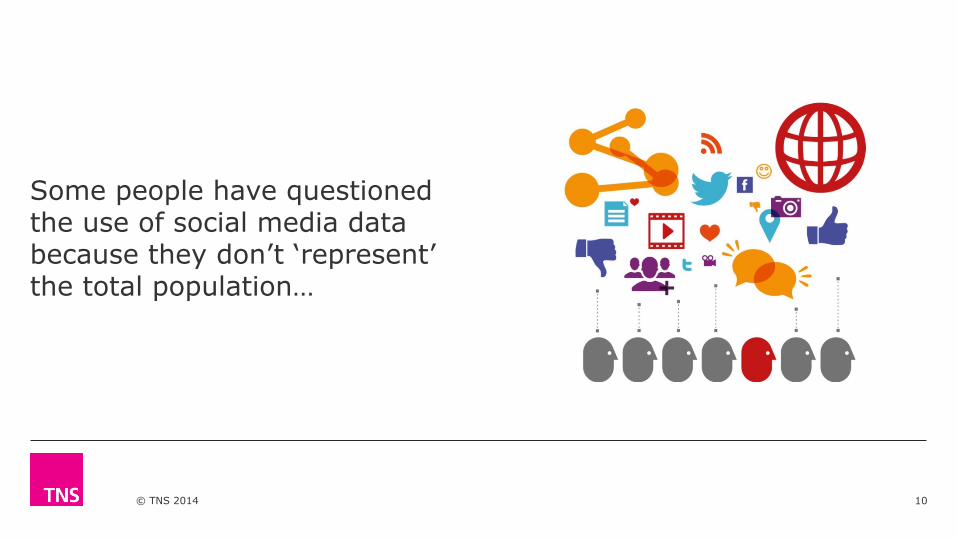
Some people have questioned the use of social media data because they don’t ‘represent’ the total population…

4.21 BASE MARGIN
4.19 TOP MARGIN
3.51 CHART TOP
11.90 LEFT MARGIN
11.90 RIGHT MARGIN
2.11 X AXIS
© TNS 2014 11
The real issue, though, in the present context, is not ‘representativeness’… …It is predictability.

2 Getting social
12

4.21 BASE MARGIN
4.19 TOP MARGIN
3.51 CHART TOP
11.90 LEFT MARGIN
11.90 RIGHT MARGIN
2.11 X AXIS
© TNS 2014 13
Can we model Survey KPIs from social media data?
From asking …to listening

4.21 BASE MARGIN
4.19 TOP MARGIN
3.51 CHART TOP
11.90 LEFT MARGIN
11.90 RIGHT MARGIN
2.11 X AXIS
© TNS 2014 14
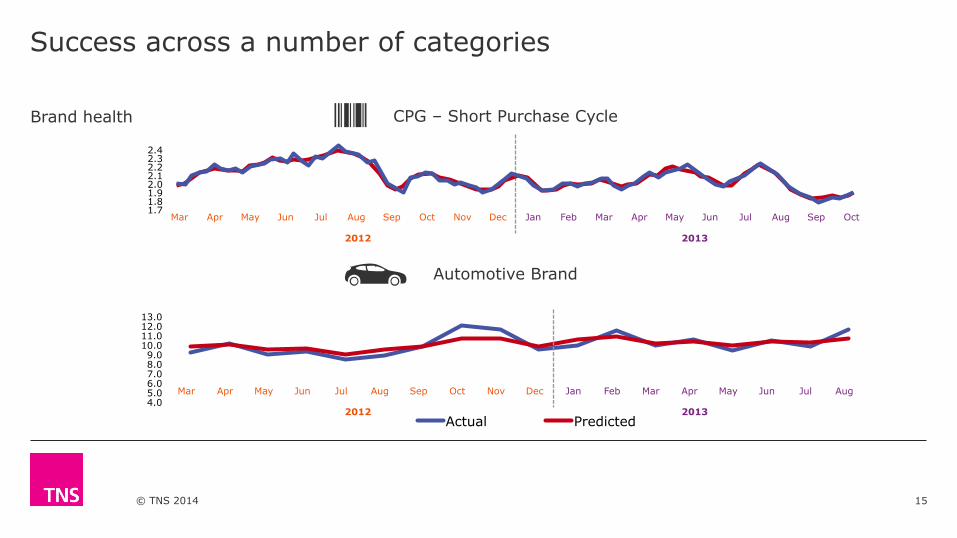
Brand health
Yup Alfa Romeo
Audi
B.M.W.
Chevrolet
Citroen
Fiat
Ford
Honda
Hyundai
Kia
Lexus
Mazda
Mercedes
Nissan
Peugeot
Renault
Skoda
Toyota
Vauxhall
Volks-wagen
Volvo
Survey Modelled
4.21 BASE MARGIN
4.19 TOP MARGIN
3.51 CHART TOP
11.90 LEFT MARGIN
11.90 RIGHT MARGIN
2.11 X AXIS
© TNS 2014
4.0 5.0 6.0 7.0 8.0 9.0
10.0 11.0 12.0 13.0
Actual Predicted
Mar Apr May Jun Jul Aug Sep Oct Nov Dec Jan Feb Mar Apr May Jun Jul Aug
15
Brand health
Success across a number of categories
Automotive Brand
CPG – Short Purchase Cycle
Mar Apr May Jun Jul Aug Sep Oct Nov Dec Jan Feb Mar Apr May Jun Jul Aug Sep Oct
2012 2013
2012 2013
1.7 1.8 1.9 2.0 2.1 2.2 2.3 2.4

4.21 BASE MARGIN
4.19 TOP MARGIN
3.51 CHART TOP
11.90 LEFT MARGIN
11.90 RIGHT MARGIN
2.11 X AXIS
© TNS 2014 16
Modeled data shows signs of being predictive
Week…
Lead time to get the jump on competition
1 2 3 4 5 6 7 8 9 10 11 12
10 10
4 2
Modelled data from engaged ‘leading indicator’ group indicates your brand health will be “10” in X weeks.
2 3 4
Survey responses amongst mass market measure your brand health to be “10”.
6
The results of your survey based tracker tell you your brand health was “10” three weeks ago.
9

4.21 BASE MARGIN
4.19 TOP MARGIN
3.51 CHART TOP
11.90 LEFT MARGIN
11.90 RIGHT MARGIN
2.11 X AXIS
© TNS 2014
-1.20
-1.00
-0.80
-0.60
-0.40
-0.20
0.00
2-Ju
l-11
2-
Aug
-11
2-Sep
-11
2-O
ct-1
1 2-
Nov
-11
2-D
ec-1
1 2-
Jan-
12
2-Fe
b-12
2-
Mar
-12
2-Apr
-12
2-M
ay-1
2 2-
Jun-
12
2-Ju
l-12
2-
Aug
-12
2-Sep
-12
2-O
ct-1
2 2-
Nov
-12
2-D
ec-1
2 2-
Jan-
13
2-Fe
b-13
2-
Mar
-13
2-Apr
-13
2-M
ay-1
3 2-
Jun-
13
2-Ju
l-13
2-
Aug
-13
2-Sep
-13
We can predict results after the period we used to build the model. n 4 and 8 week predictions have been
very accurate
n 12 week projections only slightly worse
Brand S: 4/8/12-Week Forecasts
What do we mean by predictive
17
4 8 12
Observed BHI Predicted BHI

4.21 BASE MARGIN
4.19 TOP MARGIN
3.51 CHART TOP
11.90 LEFT MARGIN
11.90 RIGHT MARGIN
2.11 X AXIS
© TNS 2014 18
Taking it further: socialising MMM
Business actions
Contextual situation
Casual factors
External influencers
What consumers Buy
Purchase consumption
Business outcomes
What consumers think
What consumers say
What consumers do online
Intermediary variables
Social media data
Brand tracking
Online behaviors

4.21 BASE MARGIN
4.19 TOP MARGIN
3.51 CHART TOP
11.90 LEFT MARGIN
11.90 RIGHT MARGIN
2.11 X AXIS
© TNS 2014 19
Taking it further—modelling sales R2 = 70%
Example sales model - FMCG
$4,000
$5,000
$6,000
$7,000
$8,000
$9,000
$10,000
$11,000
$12,000
1 4 7 10 13 16 19 22 25 28 31 34 37 40 43 46 49 52 55 58 61 64 67 70 73 76 79 82 85 88 91 94 97 100 103 106 109 112 115 Week
Observed Predicted
Drivers Inertia Health Own Spend Competitor Spend Distribution Promotion Positive Buzz Negative Buzz
*Using marketing and Twitter inputs

3 Reinventing tracking
20

4.21 BASE MARGIN
4.19 TOP MARGIN
3.51 CHART TOP
11.90 LEFT MARGIN
11.90 RIGHT MARGIN
2.11 X AXIS
© TNS 2014
The new tracking model
Predictive spine
Slimmer survey
Modular deep dives
Situational equity

4.21 BASE MARGIN
4.19 TOP MARGIN
3.51 CHART TOP
11.90 LEFT MARGIN
11.90 RIGHT MARGIN
2.11 X AXIS
© TNS 2014 22
How else we can leverage social data?
With Twitter, ability to look at particular cohorts or audiences and understand their opinions specifically
! …
Social campaign evaluation - who are you reaching and what is the impact?
New product launches - get an early read on market reactions.

4.21 BASE MARGIN
4.19 TOP MARGIN
3.51 CHART TOP
11.90 LEFT MARGIN
11.90 RIGHT MARGIN
2.11 X AXIS
© TNS 2014 23
No more rear view mirror: let’s look to the future

4.21 BASE MARGIN
4.19 TOP MARGIN
3.51 CHART TOP
11.90 LEFT MARGIN
11.90 RIGHT MARGIN
2.11 X AXIS
© TNS 2014 24
Bob Burgoyne, TNS [email protected]
Ryan France, TNS [email protected]