predicting patterns: lenawee county's use of explore and plan · predicting patterns: lenawee...
TRANSCRIPT

Predicting Patterns: Lenawee County's Use of
EXPLORE and PLAN
DataDirector 2011
User Conference
Dearborn, Michigan

POP • Purpose
– Participants will learn how Lenawee County is using the results of EXPLORE and PLAN as predictors of college and career readiness.
• Objective
– Participants will learn how DataDirector is used to produce reports to answer questions from principals
• Procedure
– PowerPoint Presentation
– Questions and Answers

WE MUST
UTILIZE AN
INQUIRY
APPROACH
TO DATA
ANALYSIS
WE MUST USE
MULTIPLE
SOURCES OF
DATA
We need a
data warehouse
for our
21st century
schools
WE MUST FOCUS ON DATA
TO INCREASE STUDENT ACHIEVEMENT
Talking Points for the Purpose of Implementing
a Data Warehouse in Lenawee Schools

Career and College Readiness
Secondary Principals’ Meeting
September, 2011

5
College Readiness Benchmark Scores
Early Indicators of College Readiness
EXPLORE PLAN ACT
English English Composition 13 15 18
Reading Social Sciences 15 17 21
Math Algebra 17 19 22
Science Biology 20 21 24
ACT Subject Area Test College Course(s)

Using Multiple Measures for Educational Decisions
Conjunctive
Approach
(All measures count)
Measures of
different
constructs
College Readiness
based upon student
achievement meeting
identified benchmark
targets in English,
Math, Reading, and
Science

Lenawee County College Readiness Data
0%
20%
40%
60%
80%
100%
2008 2009 2010 2011
Lenawee
Michigan
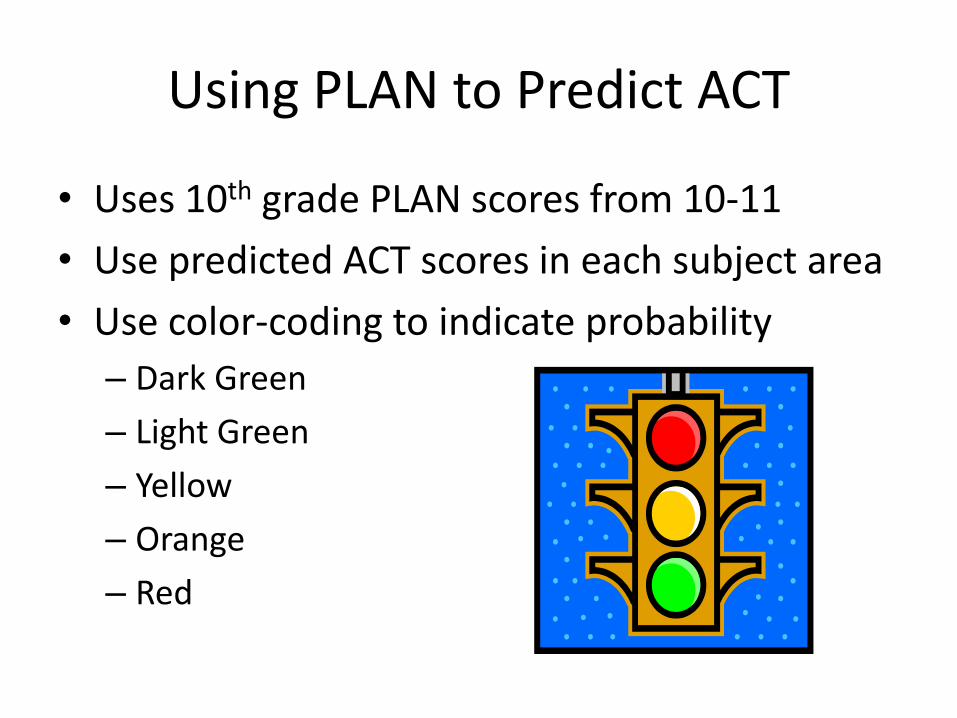
Using PLAN to Predict ACT
• Uses 10th grade PLAN scores from 10-11
• Use predicted ACT scores in each subject area
• Use color-coding to indicate probability
– Dark Green
– Light Green
– Yellow
– Orange
– Red
Analysis
• Stronger relationship in Reading than in English – curriculum vs. test? – lower CRB scores?
• Strongest relationship in Math – instruction in Algebra II?
• Weaker relationship in Science – process vs. content?
• Very few who perform well on PLAN and miss CRB on ACT

What are some other data sets to consider for “College and Career Readiness”?
• Standards Met
• Credits Earned
• Courses Taken
• Grades Earned
• EDP Completion
• Resume Completion
• Interview Completion
• Application Completion
Career and College Readiness
Secondary Principals’ Meeting
October, 2011

Using EXPLORE to Predict PLAN
• Uses EXPLORE scores from 2010-2011
• Uses predicted PLAN scores
in each subject area
• Use color-coding to indicate probability
– Dark Green
– Light Green
– Yellow
– Orange
– Red

Reasonable Growth
• “On Target”
• (met or exceeded CRB)
• “Nearly On Target”
• (<2 points from CRB)
• “Off Target”
• (>2 points from CRB)

Average Growth Points Between Tests
“On Target” (met or exceeded CRB)
“Nearly On Target” (<2 points from CRB)
“Off Target” (>2 points from CRB)
Test EXPLORE to PLAN
PLAN to ACT
EXPLORE to PLAN
PLAN to ACT
EXPLORE to PLAN
PLAN to ACT
English 2-3 2-3 3-4 1 3-4 1
Math 2-3 2-3 1-2 1-2 2-3 1-2
Reading 1-2 4-5 3-4 2-3 3-4 1-2
Science 1-2 2-3 1-2 2-3 2-3 1

College Readiness Benchmark Standards
• Compare Standards in each subject area
– below, at, and beyond benchmark
• Review written and taught curriculum
– Which unit in the course/grade level?
– How was it assessed in the classroom?
– What were the students’ scores on the classroom assessment?
• Explore lesson plans and activities

Source: College
and Career
Readiness
WORKSHOPS,
Fall 2011
Rigor Issues
National HS Grad Class 2011 Profile Summary Report

College
and Career
Readiness
Source: College and
Career Readiness
Workshops, Fall 2011
CRB=22

PLAN and EXPLORE Item Analysis
• Use test booklets from 11-12 testing
– Order extra materials for your staff (no cost)


ACT Moodle Course
Using College and Career Readiness Standards as a Tool for School Improvement

Identify students who need assistance with the testing formats
• Needs identified by students on the tests
– Writing – Reading – Math – Study Skills
• Identify students who need assistance with the testing formats
– Writings using ACT rubric – Analyzing data in graphs,
charts, and tables – Use of released items
from MDE – Use of release practice
items from ACT – Strategies for completing
timed portions of ACT – Close and critical reading
strategies from MS/HS Literacy Team

Assessment Calendars

Time Elements of an Assessment Calendar Source: White, S. H. (2005). “Beyond the Numbers: Making Data Work for Teachers and School
Leaders”. Lead and Learn Press: Englewood, CO
• When will we administer the assessment?
• When will we collect the data?
• When will we disaggregate the data?
• When will we analyze the data?
• When will we reflect upon the data?
• When will we make recommendations?
• When will we make the decisions about the recommendations?
• When will we provide written documentation about the decisions?
• When will we share the data with other stakeholders?

Questions?
Stan Masters Coordinator of Instructional Data Services Lenawee Intermediate School District Fireside Building 4107 N. Adrian Highway Adrian, Michigan 49921 517-265-1606 (phone) 517-265-2953 (fax) [email protected] www.lisd.us/links/data