precipitation response to the gulf stream in an
TRANSCRIPT

Precipitation Response to the Gulf Stream in an Atmospheric GCM*
AKIRA KUWANO-YOSHIDA
Earth Simulator Center, Japan Agency for Marine-Earth Science and Technology, Yokohama, Japan
SHOSHIRO MINOBE
Department of Natural History Sciences, Graduate School of Science, Hokkaido University, Sapporo, Japan
SHANG-PING XIE
International Pacific Research Center, and Department of Meteorology, University of Hawaii at Manoa, Honolulu, Hawaii
(Manuscript received 27 May 2009, in final form 21 January 2010)
ABSTRACT
The precipitation response to sea surface temperature (SST) gradients associated with the Gulf Stream is
investigated using an atmospheric general circulation model. Forced by observed SST, the model simulates
a narrow band of precipitation, surface convergence, and evaporation that closely follows the Gulf Stream,
much like satellite observations. Such a Gulf Stream rainband disappears in the model when the SST front is
removed by horizontally smoothing SST. The analysis herein shows that it is convective precipitation that is
sensitive to SST gradients. The Gulf Stream anchors a convective rainband by creating surface wind con-
vergence and intensifying surface evaporation on the warmer flank. Deep convection develops near the Gulf
Stream in summer when the atmosphere is conditionally unstable. As a result, a narrow band of upward
velocity develops above the Gulf Stream throughout the troposphere in summer, while it is limited to the
lower troposphere in other seasons.
1. Introduction
The influence of the Gulf Stream on the atmosphere
has been studied for the past century (Page 1906; Strachan
1907). Carson (1950) proposed a hypothesis that the
Gulf Stream causes stratus over the lower Atlantic coast
through frontogenesis along the Gulf Stream with limited
sounding data. Since the late 1960s, satellite observations,
field campaigns, and numerical simulations enable de-
tailed studies of atmospheric structures around the Gulf
Stream. Raman and Riordan (1988) report a surface con-
vergence zone along the Gulf Stream during the Genesis
of Atlantic Lows Experiment (GALE) in winter. Warner
et al. (1990) and Doyle and Warner (1993) suggest that
sharp sea surface temperature (SST) gradient causes the
surface convergence zone using mesoscale model exper-
iments, while Sublette and Young (1996) show that the
convergence can be seen in the warm season. Using sat-
ellite images, Alliss and Raman (1995a,b) show that high
clouds frequently occur over the Gulf Stream associated
with convection and surface convergence, although their
analyses are limited to areas near the coastal region.
Gulf Stream SST and its gradient also affect synoptic
cyclogenesis (Pope 1968; Cione et al. 1993; Giordani and
Caniaux 2001). Strong surface fluxes from the ocean to
the atmosphere occur in cold air outbreaks associated
with extratropical cyclones (Zolina and Gulev 2003).
Surface heat fluxes help form surface baroclinicity and
a ‘‘storm track,’’ a possible mechanism that connects the
Gulf Stream to the upper troposphere (Hoskins and
Valdes 1990; Nakamura et al. 2004).
The climatic effects of the Gulf Stream are still under
debate in the literature. Frankignoul et al. (2001) find no
evidence that interannual variability in the Gulf Stream’s
* International Pacific Research Center Contribution Number
689 and School of Ocean and Earth Science and Technology
Contribution Number 7924.
Corresponding author address: Akira Kuwano-Yoshida, Earth
Simulator Center, Japan Agency for Marine-Earth Science and
Technology, 3173-25, Showa-machi, Kanazawa-ku, Yokohama,
Kanagawa, 236-0001, Japan.
E-mail: [email protected]
3676 J O U R N A L O F C L I M A T E VOLUME 23
DOI: 10.1175/2010JCLI3261.1
� 2010 American Meteorological Society
path has a direct impact on large-scale atmospheric cir-
culation from an atmospheric reanalysis. Based on atmo-
spheric general circulation model (GCM) experiments,
Seager et al. (2002) suggest that the Gulf Stream’s in-
fluence, such as that which warms Europe during winter,
may be limited in the horizontal and vertical extent.
On the other hand, recent high-resolution observa-
tions from satellites show that mesoscale meandering of
major ocean fronts and oceanic eddies affect the surface
atmosphere in general and surface winds in particular
(Nonaka and Xie 2003; Chelton et al. 2004; Chelton and
Wentz 2005; Sampe and Xie 2007; Small et al. 2008). A
vertical mixing mechanism is often used to explain the
SST modulation of surface winds, in which warm SSTs
reduce the surface atmospheric stability, bringing down
high momentum to accelerate surface winds. Young and
Sikora (2003) show low cloud modulations by Gulf
Stream meanders.
Several sensitivity experiments to midlatitude SST fronts
using atmospheric GCMs (AGCMs) have been conducted.
Reason (2001) shows that the Agulhas Current affects the
regional atmospheric circulation patterns around the South
Indian Ocean. Nakamura et al. (2008) suggest that midlat-
itude oceanic frontal zones are important to maintaining
the mean state and dominant variability in the tropospheric
circulation by aquaplanet experiments. However, the
horizontal resolutions of their AGCMs are coarse and may
not be sufficient to capture the fine structure of SST fronts.
Minobe et al. (2008) show that surface wind conver-
gence and precipitation estimated from satellites are
sharply confined on the offshore, warmer flank of the
SST front associated with the Gulf Stream, and the up-
draft anchored over the surface convergence extends to
the upper troposphere based on outgoing longwave ra-
diation (OLR) observations and an atmospheric analysis
product from the European Centre for Medium-Range
Weather Forecasts (ECMWF). In an AGCM with 50-km
horizontal resolution, the Gulf Stream–trapped structures
of surface wind convergence, precipitation, and cyclone
activity disappear when the SST data are smoothed.
Their linear model response to diabatic heating over
the Gulf Stream indicates the possibility of a down-
stream influence.
The present study investigates the mechanism by which
the Gulf Stream anchors a major rainband as depicted
in the annual mean analysis of Minobe et al. (2008). We will
use the same AGCM as in Minobe et al. (2008) and extend
that study by examining the seasonal cycle and stratifying
precipitation into convective and stratiform condensation.
We show that it is convective rainfall that is most strongly
affected by the Gulf Stream front. A companion paper in
this special collection on western boundary currents dis-
cusses the seasonal variations of atmospheric structures
along the Gulf Stream based on satellite datasets and
atmospheric analysis datasets (Minobe et al. 2010).
The rest of the paper is organized as follows. Section 2
describes the model and experiment configuration. Sec-
tion 3 discusses seasonal variations of precipitation re-
sponse to the Gulf Stream front in the atmospheric
model. Section 4 presents a composite analysis for cu-
mulus precipitation in the Gulf Stream rainband. Section 5
discusses the relationship between cumulus precipitation
and vertical velocity in the troposphere. Section 6 offers
a summary and conclusions.
2. Model and experiment configuration
We use the AGCM for the Earth Simulator (AFES;
Ohfuchi et al. 2004) version 2 (Enomoto et al. 2008) de-
veloped at the Earth Simulator Center, Japan Agency
for Marine-Earth Science and Technology (JAMSTEC).
It is based on the Center for Climate System Research
(CCSR)/National Institute of Environment System (NIES)
AGCM (Numaguti et al. 1997), replaced with Emanuel’s
convection scheme (Emanuel 1991; Emanuel and Zivkovic-
Rothman 1999; Peng et al. 2004), and a new radiation
scheme ‘‘MstrnX’’ (Nakajima et al. 2000; Sekiguchi et al.
2003; Sekiguchi 2004; Sekiguchi and Nakajima 2008). The
horizontal resolution is T239, about 50 km in grid spac-
ing, with 48 sigma levels in the vertical. For the bottom
boundary condition, the real-time global SST (RTG SST;
Thiebaux et al. 2003) dataset of the National Centers of
Environmental Prediction (NCEP) on a 0.58 grid and at
daily intervals is used.
Two experiments are conducted: the control experi-
ment (CNTL) uses the original RTG SST data, while the
other experiment (SMTH) smoothes the SST data over
the Gulf Stream region by applying a 1–2–1 running mean
filter in both the zonal and meridional directions 100 times
on a 0.58 grid over 258–558N, 1008–308W. Figure 1 shows
the annual and seasonal mean SST for the CNTL and
SMTH runs and the differences between CNTL and
SMTH. Initial conditions are taken from the 40-yr
ECMWF Re-Analysis (ERA-40) data at 0000 UTC
11 February 2001, and both experiments are integrated for
5 yr, until 0000 UTC 1 March 2006. The simulations are
the same as in Minobe et al. (2008), except for the analysis
period. The present study uses the 6-h output for 5 yr
from 0000 UTC 1 March 2001 to 1800 UTC 28 February
2006, while Minobe et al. (2008) use the output from
January 2002 to February 2006.
To make a comparison with the model simulations, we
use precipitation observations from the Tropical Rain
Measuring Mission (TRMM) provided by the Goddard
Earth Science Data and Information Services Center
from March 2001 to February 2006. The TRMM 3A25
product features monthly accumulation of convective
1 JULY 2010 K U W A N O - Y O S H I D A E T A L . 3677
and stratiform rain at 0.58 3 0.58 horizontal resolution
estimated by spaceborne precipitation radar measure-
ments between 388S and 388N. The TRMM 3B43 data
are for monthly mean rainfall at 0.258 3 0.258 between
508S and 508N derived from TRMM, other satellite ob-
servations, and rain gauge data.
Surface evaporation is evaluated using the Japanese
Ocean Flux datasets with Use of Remote sensing
Observations, version 2.1 (J-OFURO2.1; Kubota and
Tomita 2007). The data provide daily sea surface flux
from January 1988 to December 2006 at 18 3 18 hori-
zontal resolution. The fluxes are estimated by the Cou-
pled Ocean–Atmosphere Response Experiment, version
3.0 (COARE3.0) flux algorithm (Fairall et al. 2003) using
SST and surface wind from several spaceborne micro-
wave radiometers and scatterometers, surface air specific
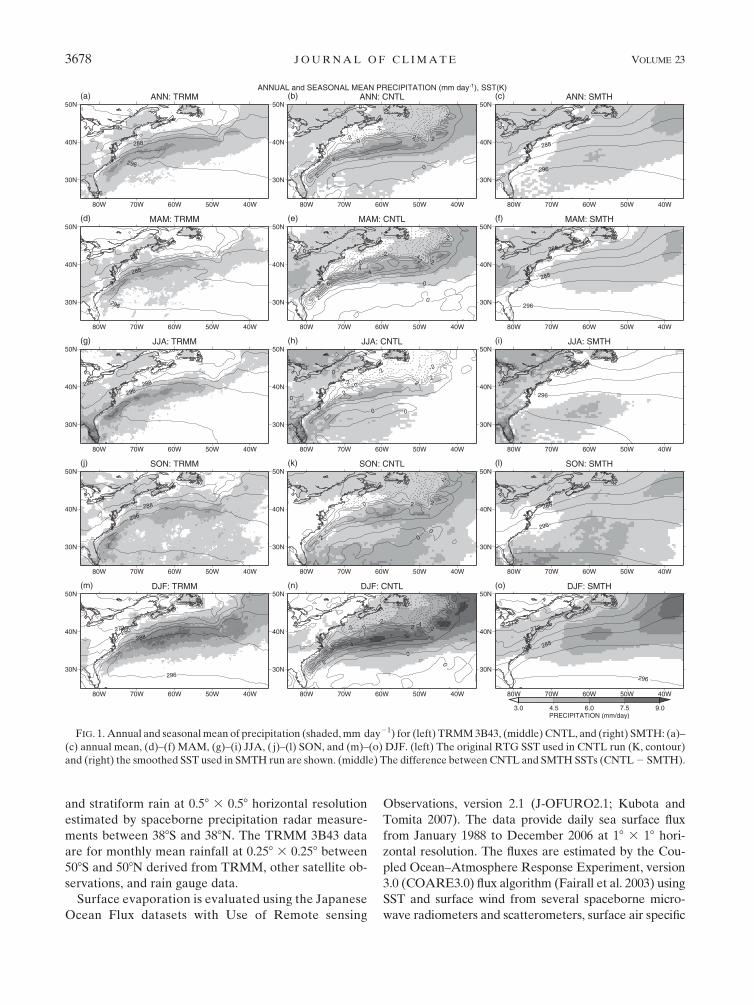
FIG. 1. Annual and seasonal mean of precipitation (shaded, mm day21) for (left) TRMM 3B43, (middle) CNTL, and (right) SMTH: (a)–
(c) annual mean, (d)–(f) MAM, (g)–(i) JJA, ( j)–(l) SON, and (m)–(o) DJF. (left) The original RTG SST used in CNTL run (K, contour)
and (right) the smoothed SST used in SMTH run are shown. (middle) The difference between CNTL and SMTH SSTs (CNTL 2 SMTH).
3678 J O U R N A L O F C L I M A T E VOLUME 23
humidity estimated from the Special Sensor Microwave
Imager (SSM/I), and surface air temperature from
the NCEP–Department of Energy (DOE) reanalysis
2 (Kanamitsu et al. 2002).
3. Seasonal variations
Figure 1 shows annual and seasonal means of precipi-
tation for TRMM 3B43 observations, CNTL, and SMTH.
The precipitation band over the Gulf Stream, described by
Minobe et al. (2008) for the annual mean, appears in all
seasons in observations with seasonal changes in strength
and shape. The precipitation band is located on the
warmer flank of the SST front, which corresponds to the
Gulf Stream axis and features warm SST anomalies com-
pared to SMTH. The rainband is strongest and broadest
in December–February (DJF), weakest in March–May
(MAM), and narrowest in June–August (JJA). These
features are almost reproduced by the AGCM in CNTL,
though precipitation is underestimated near the coastal
region and overestimated over the subtropics and east
of 508W. Therefore, the precipitation magnitude in JJA
is comparable to that in MAM, and the precipitation
band is discontinuous in September–November (SON) in
CNTL. In SMTH, the precipitation band almost disap-
pears in JJA and SON, while a broader and weaker band
can be seen in MAM and DJF. Broad atmospheric storm
tracks help maintain the rainband in cold seasons. In the
seasonal cycle, precipitation magnitude does not depend
solely on the magnitude of the SST gradient (e.g., the SST
gradient in JJA is weaker than that in MAM), but the
width of the precipitation band depends on the SST gra-
dient as in the comparison between CNTL and SMTH.
Precipitation forms are a useful characteristic to in-
fer mechanisms and the atmospheric environment for
precipitation occurrence. The TRMM 3A25 product
distinguishes convective and stratiform precipitation from
the vertical structure of precipitation radar echo (Iguchi
et al. 2000). Precipitation in AFES can also be classified as
being either convective (generated from the subgrid-scale
cumulus convection scheme) or stratiform (from the re-
solved grid-scale condensation scheme). The former fol-
lows the Emanuel cumulus parameterization (Peng et al.
2004), depending on vertical thermodynamic profiles in
a column, and the latter large-scale condensation pa-
rameterization, depending mainly on relative humidity at
each grid point (Le Treut and Li 1991). Although these
classifications are not strictly equivalent and TRMM data
coverage is limited to the south of 388N, it is meaningful
to compare them because convective precipitation from
the AFES cumulus convection scheme and in TRMM can
be considered as resulting from convectively unstable sit-
uations. Vertical stratification of an atmospheric column
is important for convective precipitation, while large-scale
upward motion is important stratiform precipitation.
Figure 2 shows annual mean convective and stratiform
precipitation in TRMM 3A25, CNTL, and SMTH. Con-
vective precipitation concentrates more sharply over the
Gulf Stream than stratiform precipitation in TRMM
3A25, consistent with coastal radar measurements (Trunk
and Bosart 1990) and lightning observations from space
(Christian et al. 2003). Similarly, in CNTL, the rainband
trapped by the Gulf Stream is largely due to cumulus
convection, while stratiform precipitation is much broader
and does not seem to be strongly affected by the SST
front. In SMTH, the narrow cumulus precipitation band
along the Gulf Stream disappears, while stratiform pre-
cipitation is not much different from that of CNTL. The
cumulus precipitation difference over the Gulf Stream
between CNTL and SMTH is quite significant above the
99% level of the Student’s t test. The degree of freedom
for the Student’s t test in the present paper is based on the
number of monthly mean data in CNTL and SMTH.
Figure 3 shows seasonal variations of cumulus and
stratiform precipitations in CNTL over the Gulf Stream.
In this study, the Gulf Stream precipitation band is de-
fined as the area where annual mean precipitation in
CNTL is larger than 5 mm day21 within 308–488N, 808–
408W (the area bounded by the thick solid contour and
outer dashed square in Fig. 2c). The maximum precipi-
tation is collocated with the Gulf Stream current axis
estimated from the satellite-derived surface currents (see
Fig. 1 in Minobe et al. 2008) and with that defined by 158C
temperature at 200-m depth (Joyce et al. 2009). In this
region, cumulus precipitation is dominant throughout the
year, especially in summer, while stratiform precipitation
is comparable in spring and winter. In SMTH, the amount
and seasonal cycle of stratiform precipitation are almost
the same, but cumulus precipitation is significantly weaker
(not shown). Thus, cumulus convection is a key aspect of
the atmospheric response to the Gulf Stream.
Minobe et al. (2008) show that a band of enhanced
evaporation forms over the Gulf Stream. Figure 4 shows
seasonal mean surface evaporation based on J-OFURO2.1,
CNTL, and SMTH. An evaporation band is found over the
Gulf Stream in all seasons. The evaporation band is largest
in winter and weakest in summer both in J-OFURO2.1 and
CNTL. In SMTH, the evaporation band disappears in JJA,
while a broader and weaker band is displaced south in other
seasons.
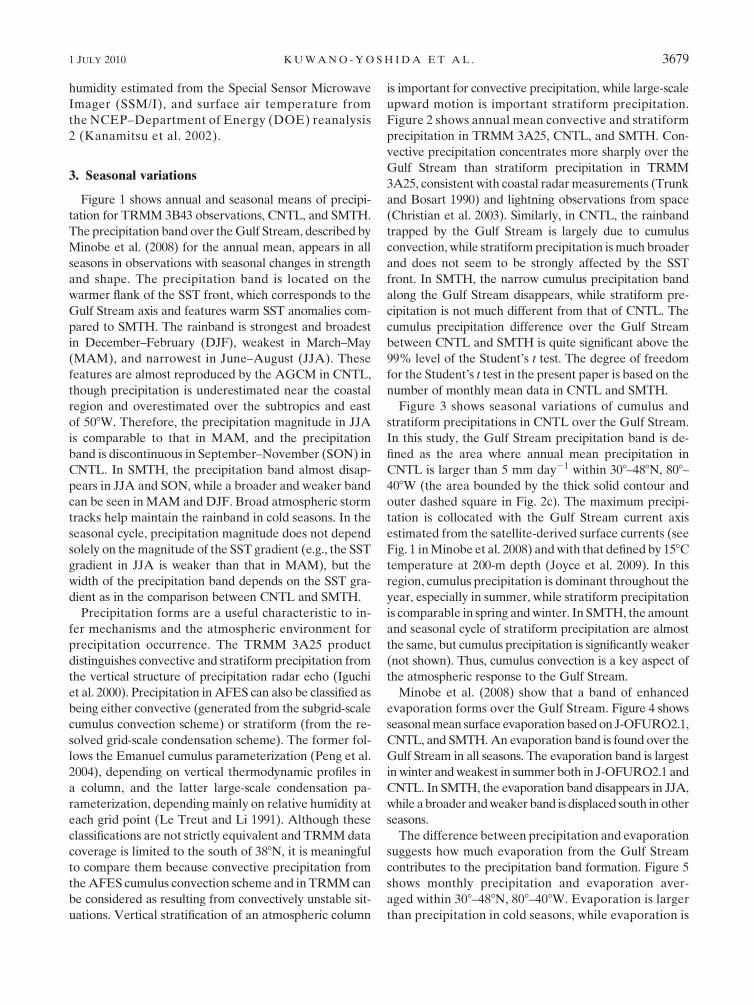
The difference between precipitation and evaporation
suggests how much evaporation from the Gulf Stream
contributes to the precipitation band formation. Figure 5
shows monthly precipitation and evaporation aver-
aged within 308–488N, 808–408W. Evaporation is larger
than precipitation in cold seasons, while evaporation is
1 JULY 2010 K U W A N O - Y O S H I D A E T A L . 3679

comparable to or less than precipitation in summer both
in observations and AFES experiments. Consequently,
the amplitude of the evaporation seasonal cycle is
larger than that of precipitation. Although the seasonal
cycle of evaporation in CNTL is weaker than that in the
observations, precipitation is similar to the observations.
Regionally averaged precipitation varies little between
CNTL and SMTH, suggesting that the narrow rainband
in CNTL is due to enhanced evaporation over the Gulf
Stream.
FIG. 2. (left) Annual mean cumulus precipitation (PRCPC) and (right) stratiform–grid-scale precipitation
(PRCPL) for (a),(b) TRMM 3A25, (c),(d) CNTL, (e),(f) SMTH, and (g),(h) CNTL 2 SMTH. (a)–(f) Precipitation
(mm day21) is shaded and SST (K) is indicated by contours, while (g)–(h) the precipitation difference is shown by
contours and the 99% significant area of the Student’s t test is shaded. The outer dashed-line square in (c) shows the
target area for the precipitation and evaporation average in Fig. 5; the thick, solid contour is the annual mean
precipitation of 5 mm day21 in CNTL, and the area it encloses is defined as the Gulf Stream rainband. The area
bounded by the inner square and the thick solid contour is the target area for the cumulus composite. The white area
north of 388N in TRMM 3A25 is beyond TRMM observation domain.
3680 J O U R N A L O F C L I M A T E VOLUME 23

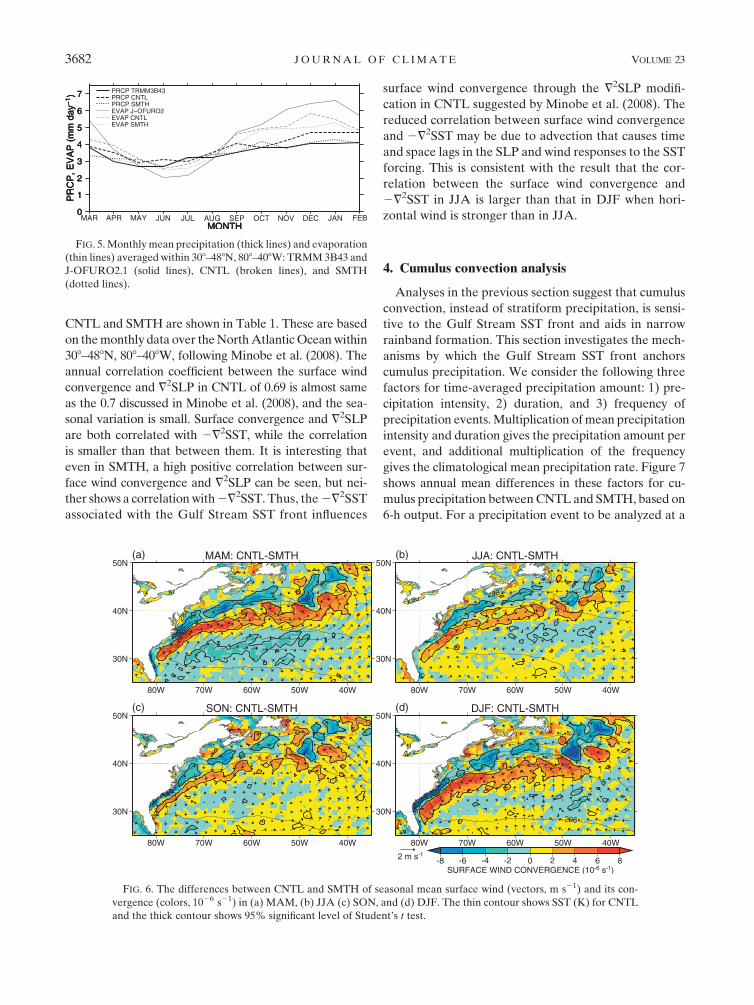
Surface convergence is locally enhanced over the
Gulf Stream (Chelton et al. 2004; Minobe et al. 2008).
Figure 6 shows the seasonal mean differences of 10-m
wind and its convergence between CNTL and SMTH.
The convergence shows a large difference, especially
in MAM and DJF. The highly significant wind differ-
ence tends to be confined near the Gulf Stream, while
the 5-yr integrations are too short to filter out atmo-
spheric internal variability on the planetary scale. Indeed,
Reason (2001) conducts 11-member simulations to get a
95% significance level for the Agulhas Current influence
on hemispherical-scale circulation, while Rodwell et al.
(2004) suggest that 20 yr are necessary to identify sig-
nificant responses to SST anomalies in the North Atlantic
region.
Minobe et al. (2008) show a high correlation between
the surface wind convergence and =2SLP in the ECMWF
operational analysis data, suggesting the importance of
a pressure adjustment mechanism (Lindzen and Nigam
1987) under SST forcing over the Gulf Stream. The an-
nual and seasonal variations of the correlation coefficients
among surface wind convergence, =2SLP, and 2=2SST in
FIG. 3. Monthly variations of cumulus precipitation (PRCPC, solid
line) and stratiform precipitation (PRCPL, broken line) for CNTL
averaged over the Gulf Stream rainband within 308–488N, 808–408W.
FIG. 4. Seasonal mean surface evaporation from (left) J-OFURO2.1, (middle) CNTL, and (right) SMTH for (a)–(c) MAM, (d)–(f) JJA,
(g)–(i) SON, and ( j)–(l) DJF. The contours are for SST (K).
1 JULY 2010 K U W A N O - Y O S H I D A E T A L . 3681
CNTL and SMTH are shown in Table 1. These are based
on the monthly data over the North Atlantic Ocean within
308–488N, 808–408W, following Minobe et al. (2008). The
annual correlation coefficient between the surface wind
convergence and =2SLP in CNTL of 0.69 is almost same
as the 0.7 discussed in Minobe et al. (2008), and the sea-
sonal variation is small. Surface convergence and =2SLP
are both correlated with 2=2SST, while the correlation
is smaller than that between them. It is interesting that
even in SMTH, a high positive correlation between sur-
face wind convergence and =2SLP can be seen, but nei-
ther shows a correlation with 2=2SST. Thus, the 2=2SST
associated with the Gulf Stream SST front influences
surface wind convergence through the =2SLP modifi-
cation in CNTL suggested by Minobe et al. (2008). The
reduced correlation between surface wind convergence
and 2=2SST may be due to advection that causes time
and space lags in the SLP and wind responses to the SST
forcing. This is consistent with the result that the cor-
relation between the surface wind convergence and
2=2SST in JJA is larger than that in DJF when hori-
zontal wind is stronger than in JJA.
4. Cumulus convection analysis
Analyses in the previous section suggest that cumulus
convection, instead of stratiform precipitation, is sensi-
tive to the Gulf Stream SST front and aids in narrow
rainband formation. This section investigates the mech-
anisms by which the Gulf Stream SST front anchors
cumulus precipitation. We consider the following three
factors for time-averaged precipitation amount: 1) pre-
cipitation intensity, 2) duration, and 3) frequency of
precipitation events. Multiplication of mean precipitation
intensity and duration gives the precipitation amount per
event, and additional multiplication of the frequency
gives the climatological mean precipitation rate. Figure 7
shows annual mean differences in these factors for cu-
mulus precipitation between CNTL and SMTH, based on
6-h output. For a precipitation event to be analyzed at a
FIG. 5. Monthly mean precipitation (thick lines) and evaporation
(thin lines) averaged within 308–488N, 808–408W: TRMM 3B43 and
J-OFURO2.1 (solid lines), CNTL (broken lines), and SMTH
(dotted lines).
FIG. 6. The differences between CNTL and SMTH of seasonal mean surface wind (vectors, m s21) and its con-
vergence (colors, 1026 s21) in (a) MAM, (b) JJA (c) SON, and (d) DJF. The thin contour shows SST (K) for CNTL
and the thick contour shows 95% significant level of Student’s t test.
3682 J O U R N A L O F C L I M A T E VOLUME 23
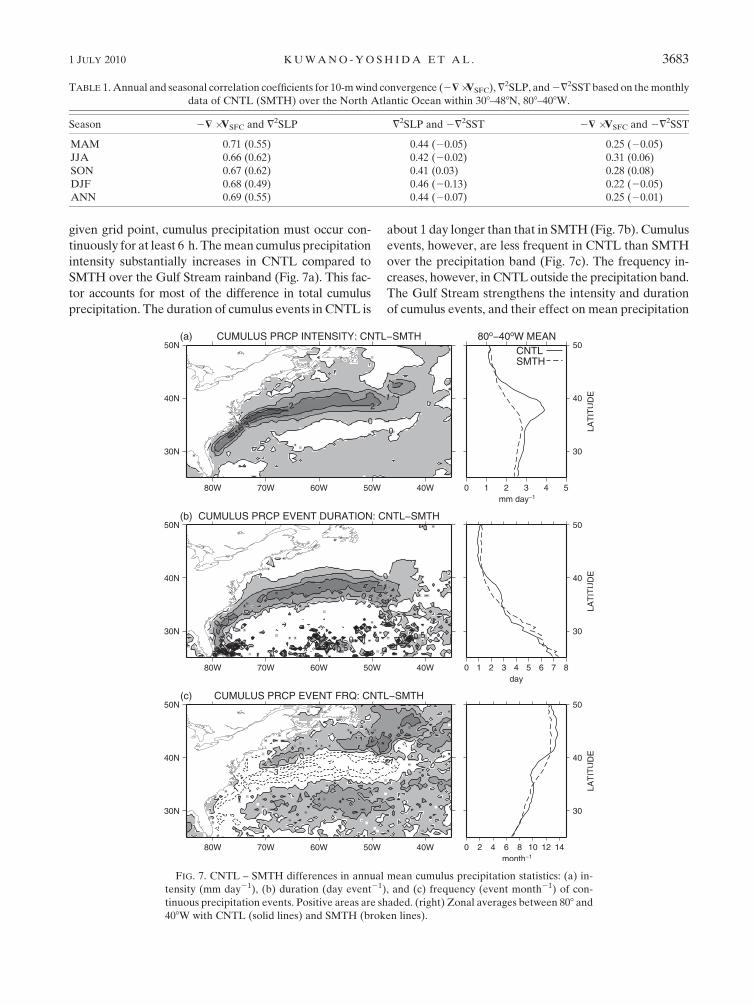
given grid point, cumulus precipitation must occur con-
tinuously for at least 6 h. The mean cumulus precipitation
intensity substantially increases in CNTL compared to
SMTH over the Gulf Stream rainband (Fig. 7a). This fac-
tor accounts for most of the difference in total cumulus
precipitation. The duration of cumulus events in CNTL is
about 1 day longer than that in SMTH (Fig. 7b). Cumulus
events, however, are less frequent in CNTL than SMTH
over the precipitation band (Fig. 7c). The frequency in-
creases, however, in CNTL outside the precipitation band.
The Gulf Stream strengthens the intensity and duration
of cumulus events, and their effect on mean precipitation
TABLE 1. Annual and seasonal correlation coefficients for 10-m wind convergence (2$ �VSFC), =2SLP, and 2=2SST based on the monthly
data of CNTL (SMTH) over the North Atlantic Ocean within 308–488N, 808–408W.
Season 2$ � VSFC and =2SLP =2SLP and 2=2SST 2$ � VSFC and 2=2SST
MAM 0.71 (0.55) 0.44 (20.05) 0.25 (20.05)
JJA 0.66 (0.62) 0.42 (20.02) 0.31 (0.06)
SON 0.67 (0.62) 0.41 (0.03) 0.28 (0.08)
DJF 0.68 (0.49) 0.46 (20.13) 0.22 (20.05)
ANN 0.69 (0.55) 0.44 (20.07) 0.25 (20.01)
FIG. 7. CNTL – SMTH differences in annual mean cumulus precipitation statistics: (a) in-
tensity (mm day21), (b) duration (day event21), and (c) frequency (event month21) of con-
tinuous precipitation events. Positive areas are shaded. (right) Zonal averages between 808 and
408W with CNTL (solid lines) and SMTH (broken lines).
1 JULY 2010 K U W A N O - Y O S H I D A E T A L . 3683

FIG. 8. Composites (see text for details) for cumulus precipitation [shaded,
mm (6 h)21], CAPE (solid contour, J kg21), and SST (broken contour, K) in (left)
CNTL and (right) SMTH, at 12-hourly intervals from T 2 12 h to T 1 48 h in JJA.
Horizontal (degrees longitude) and vertical (degrees latitude) axes are relative dis-
tances from the reference point where cumulus precipitation starts at T 5 0 h.
3684 J O U R N A L O F C L I M A T E VOLUME 23
amount dominates over that of frequency change. This
conclusion holds for all seasons.
To examine why cumulus convection intensifies and
lasts longer over the Gulf Stream, composite analyses are
conducted for cumulus events that continue for at least
24 h. The target area is where the annual mean precipi-
tation rate exceeds 5 mm day21 over the Gulf Stream
within 658–478W (the area bounded by the thick solid
contours within the inner square in Fig. 2c). There the
precipitation band is zonally oriented and far from land,
enabling us to extract the Gulf Stream influence. The
start time of a convective event is defined as T 5 0 h. The
analyses are conducted for JJA and DJF separately, be-
cause the relative contributions of cumulus and stratiform
precipitation are different between them (Fig. 3). The
analyzed events account for the majority of total cumulus
precipitation (96% in CNTL JJA, 91% in SMTH JJA,
66% in CNTL DJF, and 46% in SMTH DJF).
a. JJA
Figure 8 shows the 12-hourly composites for cumu-
lus precipitation, convective available potential energy
(CAPE), and SST from T 2 12 h to T 1 48 h in JJA in
CNTL and SMTH. CAPE is calculated using 6-h out-
puts supposing that a parcel at 950 hPa is adiabatically
lifted up to the condensation level, and moist adiabati-
cally rises up to the level of neutral buoyancy. The center
of each panel is where a cumulus event starts at T 5 0 h.
When a cumulus event starts in CNTL, a cumulus pre-
cipitation maximum approaches from the west along
the warmer flank of the SST front. The precipitation
maximum is associated with a high CAPE tongue that
slants from the southwest to the northeast. Both the
precipitation maximum and the high CAPE tongue are
nearly parallel with the SST front. After T 1 12 h,
precipitation persists and forms a band on the warmer
flank of the Gulf Stream front through T 1 48 h. In
SMTH, both the intensity of cumulus precipitation and
CAPE values are much weaker than in that in CNTL.
The precipitation maximum and CAPE tongue quickly
move away from the analysis domain by T 1 36 h.
These results suggest a mechanism by which a con-
vective precipitation band forms along the SST front
in CNTL.
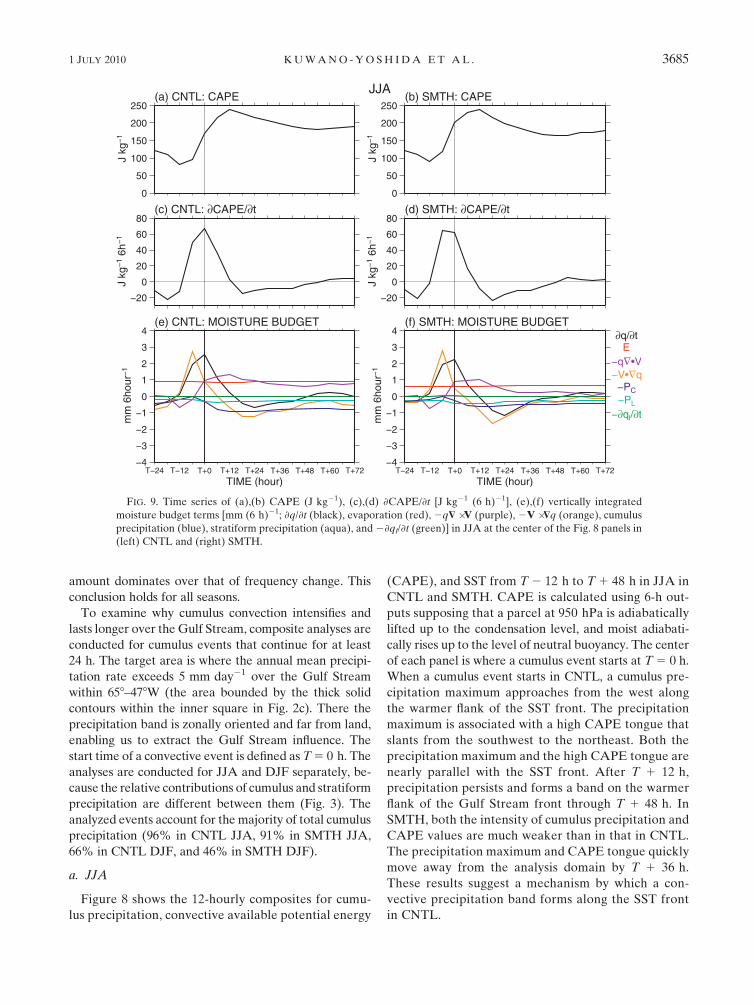
FIG. 9. Time series of (a),(b) CAPE (J kg21), (c),(d) ›CAPE/›t [J kg21 (6 h)21], (e),(f) vertically integrated
moisture budget terms [mm (6 h)21; ›q/›t (black), evaporation (red), 2q$ � V (purple), 2V � $q (orange), cumulus
precipitation (blue), stratiform precipitation (aqua), and 2›ql/›t (green)] in JJA at the center of the Fig. 8 panels in
(left) CNTL and (right) SMTH.
1 JULY 2010 K U W A N O - Y O S H I D A E T A L . 3685
Cumulus precipitation intensity depends on convec-
tive instability and moisture content. CAPE is larger in
the CNTL than SMTH composites in Fig. 8. We now
examine the evolution of the moisture budget for an air
column from the surface to 10 hPa,
ðSLP
10hPa
›q
›tdp 5
ðSLP
10hPa
�q$ �V�V � $q�›q
l
›t
� �dp 1 E� P
C� P
L, (1)
where q is the specific humidity, t the time, p the pressure,
V the horizontal velocity, ql the cloud water content,
E the surface evaporation, PC the cumulus precipitation,
and PL the stratiform precipitation. The analysis is car-
ried out at the composite reference point where cumulus
precipitation commences at T 5 0 h.
Figure 9 shows the time series of CAPE, ›CAPE/›t, and
the terms of the moisture budget Eq. (1) for JJA in CNTL
and SMTH. CAPE starts to increase at T 5 0 h, and
›CAPE/›t increases from T 2 6 h both in CNTL and
SMTH (Figs. 9a–d). Although CAPE in CNTL is smaller
than SMTH at T 5 0 h, in CNTL it is larger than SMTH
from T 5 24 h to the end of the analysis period (T 5 72 h).
Around the time of convection occurrence, ›CAPE/›t
is also larger and lasts longer in CNTL. CAPE evolu-
tion is in phase with cumulus precipitation (Fig. 8), while
›CAPE/›t is in phase with the time derivative of the
column-integrated vapor content both in CNTL and
SMTH (Figs. 9e,f).
Moisture advection (2V � $q) accounts for much of the
moisture convergence at T 2 6 h, and then turns negative
afterward, consistent with the passage of the warm sector
of an extratropical cyclone. The mass convergence term
2q$ � V becomes dominant from T 5 0 h both in CNTL
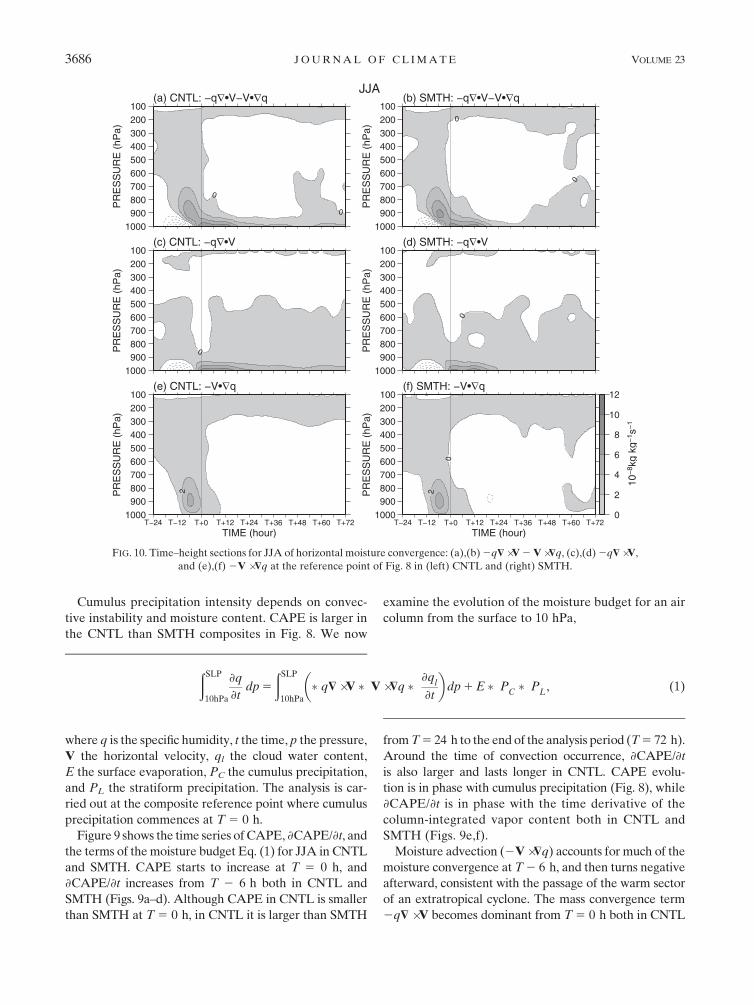
FIG. 10. Time–height sections for JJA of horizontal moisture convergence: (a),(b) 2q$ �V 2 V � $q, (c),(d) 2q$ �V,
and (e),(f) 2V � $q at the reference point of Fig. 8 in (left) CNTL and (right) SMTH.
3686 J O U R N A L O F C L I M A T E VOLUME 23
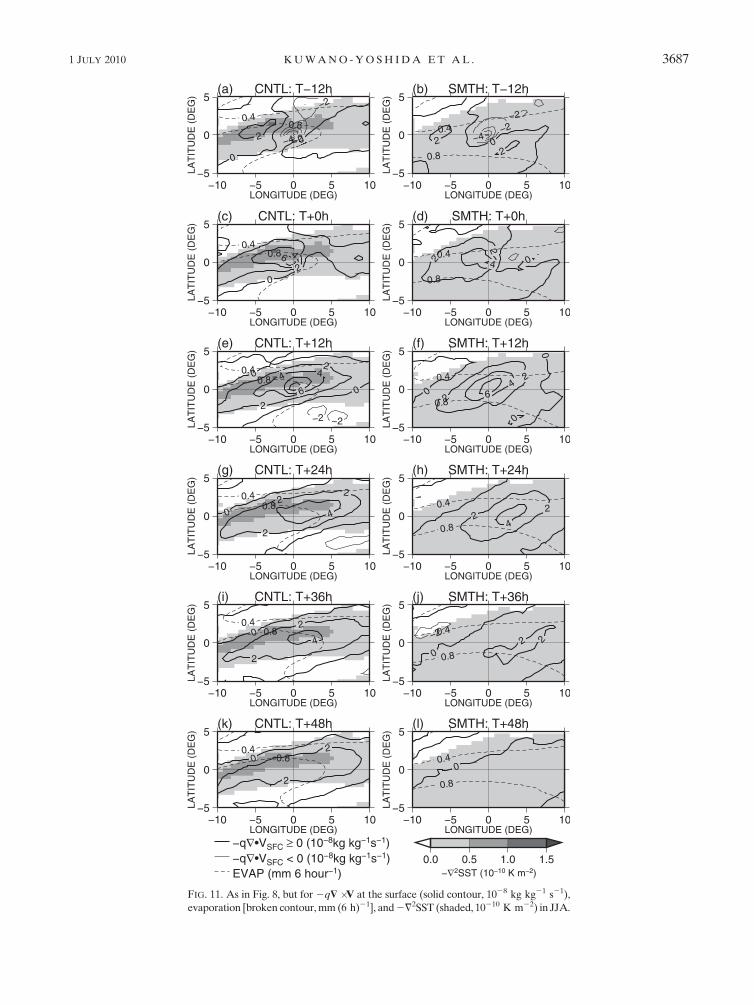
FIG. 11. As in Fig. 8, but for 2q$ � V at the surface (solid contour, 1028 kg kg21 s21),
evaporation [broken contour, mm (6 h)21], and 2=2SST (shaded, 10210 K m22) in JJA.
1 JULY 2010 K U W A N O - Y O S H I D A E T A L . 3687
and SMTH. The convergence term 2q$ �V is much larger
in CNTL than in SMTH after cumulus precipitation starts,
and remains about 0.8 mm (6 h)21 until T 1 72 h. The
amount of 2q$ � V in SMTH rapidly decreases from T 5
12 h to T 1 24 h, and then maintains a constant value of
about 0.2 mm (6 h)21. Surface evaporation is also larger
in CNTL than in SMTH. It is interesting that stratiform
precipitation is comparable to convective precipitation
in SMTH, while convective precipitation is much stronger
in CNTL. These results suggest that wind convergence
is very important in determining cumulus precipitation
evolution.
Figure 10 shows composites of total moisture conver-
gence and its components in time–height sections at the
reference point. This composite method is referred to as
the cumulus composite. Major moisture convergences
occur at T 2 6 h at 850 hPa, mainly resulting from 2V �$q
(Figs. 10e,f). When cumulus precipitation starts (T 5
0 h), 2q$ �V in the surface layer becomes dominant. The
subsequent development of moisture convergence re-
sulting from 2q$ � V is quite different between CNTL
and SMTH. In CNTL, 2q$ � V maintains positive total
moisture convergence from T 1 0 h through T 1 72 h.
The large surface moisture convergence is consistent with
the CAPE increase in Fig. 9. In SMTH, large total mois-
ture convergence persists only until T 1 18 h because
2q$ � V rapidly decreases and becomes overpowered
by negative advection (2V � $q). These results indicate
that surface wind convergence in CNTL is what sustains
cumulus precipitation for a longer time than in SMTH.
A natural question is how surface wind convergence is
related to SSTs.
The relation between the surface wind convergence
and the SST front during cumulus precipitation events is
examined by the cumulus composite. Figure 11 shows
12-hourly cumulus composites for 2q$ � V at 10 m, sur-
face evaporation, and 2=2SST in JJA. A maximum of
2q$ � V approaches the reference grid point from the
west in CNTL, preceding CAPE and cumulus precip-
itation maximum in Fig. 8. Minobe et al. (2008) show a
good correlation in space between surface wind conver-
gence and 2=2SST, a relationship that is expected from
atmospheric pressure adjustments to SST in the boundary
layer. Indeed, the maximum of 2q$ � V overlaps that
of 2=2SST along the sharp SST front, persisting until
T 1 48 h in a similar manner to persistent cumulus pre-
cipitation in Fig. 8. A tongue of larger evaporation ex-
tends over the warm flank of the SST front from the west,
persisting through T 1 48 h in CNTL. In SMTH, by
contrast, there is no maximum of 2=2SST beneath cu-
mulus precipitation at any time with smoothed SST. Al-
though a maximum of 2q$ �V propagates from the west
before T 5 0 h, it has a more circular shape than that in
CNTL, and quickly moves out of the analysis domain by
T 1 48 h.
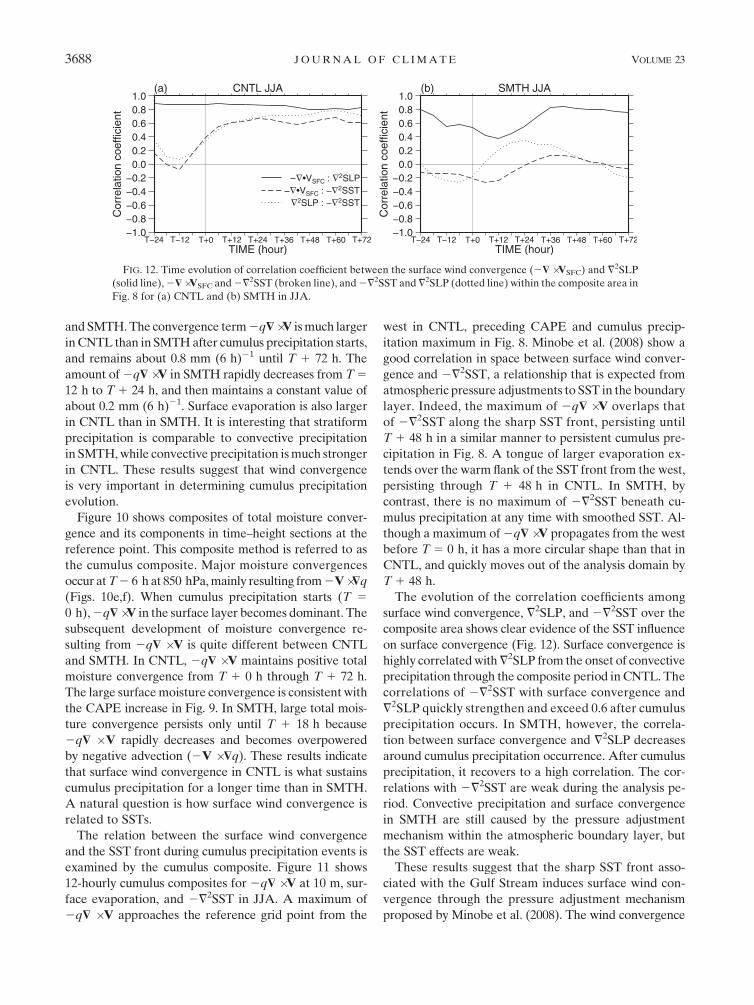
The evolution of the correlation coefficients among
surface wind convergence, =2SLP, and 2=2SST over the
composite area shows clear evidence of the SST influence
on surface convergence (Fig. 12). Surface convergence is
highly correlated with =2SLP from the onset of convective
precipitation through the composite period in CNTL. The
correlations of 2=2SST with surface convergence and
=2SLP quickly strengthen and exceed 0.6 after cumulus
precipitation occurs. In SMTH, however, the correla-
tion between surface convergence and =2SLP decreases
around cumulus precipitation occurrence. After cumulus
precipitation, it recovers to a high correlation. The cor-
relations with 2=2SST are weak during the analysis pe-
riod. Convective precipitation and surface convergence
in SMTH are still caused by the pressure adjustment
mechanism within the atmospheric boundary layer, but
the SST effects are weak.
These results suggest that the sharp SST front asso-
ciated with the Gulf Stream induces surface wind con-
vergence through the pressure adjustment mechanism
proposed by Minobe et al. (2008). The wind convergence
FIG. 12. Time evolution of correlation coefficient between the surface wind convergence (2$ � VSFC) and =2SLP
(solid line), 2$ �VSFC and 2=2SST (broken line), and 2=2SST and =2SLP (dotted line) within the composite area in
Fig. 8 for (a) CNTL and (b) SMTH in JJA.
3688 J O U R N A L O F C L I M A T E VOLUME 23
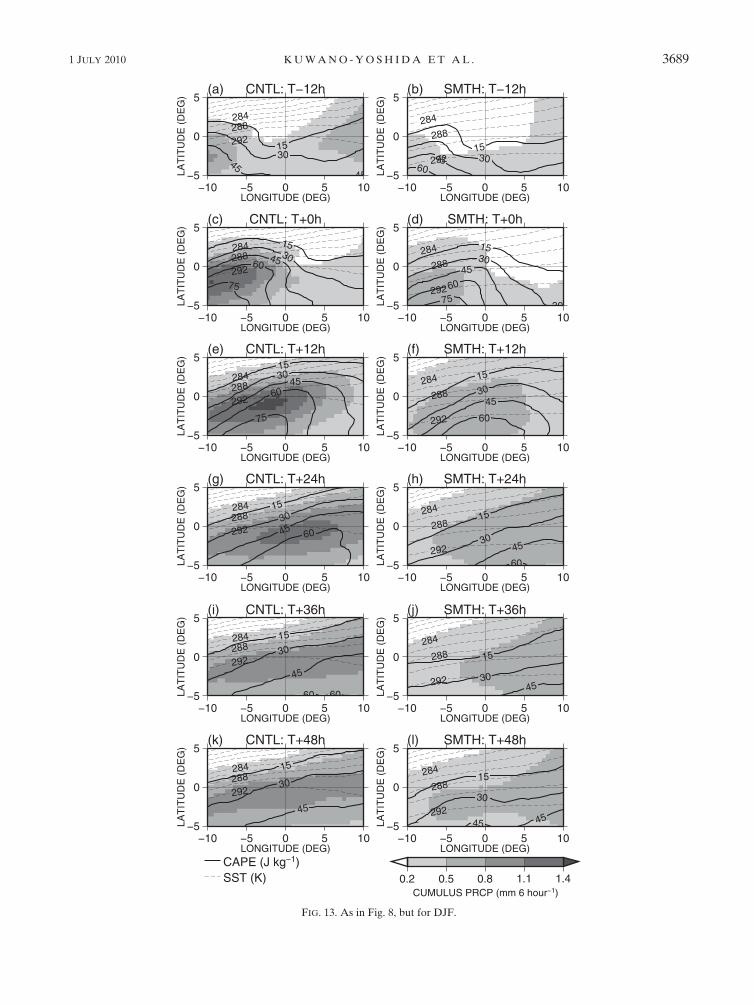
FIG. 13. As in Fig. 8, but for DJF.
1 JULY 2010 K U W A N O - Y O S H I D A E T A L . 3689

maintains high CAPE and high moisture on the warm
flank of the SST front, leading to the spatially confined,
long-lasting cumulus precipitation there. In addition, lo-
cally enhanced surface evaporation also helps the Gulf
Stream anchor the narrow rainband. The local enhance-
ment of evaporation is due to disequilibrium between
surface air temperature and SST across the SST front
(e.g., Xie 2004; Tokinaga et al. 2009). Without an SST
front in SMTH, surface wind convergence and surface
evaporation lose their geostationary anchor. Consequently,
cumulus precipitation in SMTH occurs only in moving
atmospheric disturbances, being weaker in strength and
shorter in duration without the help of SST forcing.
In addition to the stationary surface wind conver-
gence, a strong SST front may intensify transient surface
convergence by energizing synoptic disturbances (Kuo
et al. 1991; Gyakum and Roebber 2001; Xie et al. 2002).
Indeed, Minobe et al. (2008) report that surface cyclones
tend to be more concentrated along the Gulf Stream in
CNTL than in SMTH. We have decomposed the cumulus-
composite evolution of moisture convergence into syn-
optic (2–8 days) and longer components. However, there
is little difference between CNTL and SMTH in JJA (not
shown).
b. DJF
In winter, cumulus precipitation is comparable to strat-
iform precipitation, and the total amount of precipitation is
more than that in summer (Fig. 3). Figures 13–17 show the
results from the composite analysis for DJF. The intensity
of cumulus precipitation in DJF composites is stronger,
and the tongue of the high CAPE is wider in DJF than in
JJA, while the absolute value of CAPE is much smaller
than that in JJA (Fig. 13) because of a lower temperature
and moisture at the surface. As in JJA, persistent cumulus
precipitation forms a band over the Gulf Stream through
T 1 48 h in CNTL. In SMTH, the high CAPE tongue
is weaker than that in CNTL, with weak precipitation.
Furthermore, the precipitation maximum in SMTH ex-
hibits a circular shape rather than a zonal band, and it
is weaker in intensity throughout the composite period,
quickly moving out in an eastward direction by T 1 36 h.
Figure 14 shows the moisture budget analysis for DJF.
As a major difference from JJA, the CAPE is about one-
quarter in JJA both in CNTL and SMTH (Figs. 14a,b).
The contribution of stratiform precipitation is comparable
to cumulus precipitation in CNTL, consistent with Fig. 3.
However, the rate of change in column moisture is larger
FIG. 14. As in Fig. 9, but for DJF.
3690 J O U R N A L O F C L I M A T E VOLUME 23

than that in JJA. In particular, 2q$ � V and surface
evaporation are about twice of those in JJA. Evaporation
decreases from T 2 18 h and recovers at T 1 24 h in
CNTL and SMTH, while it is almost constant in JJA. This
is due to the higher wind speed and its change in DJF (not
shown). The persistence of cumulus precipitation mainly
depends on 2q$ � V and surface evaporation, which is
qualitatively similar to that in JJA. Interestingly, the
evolution of 2q$ � V is in phase with stratiform pre-
cipitation rather than cumulus precipitation in DJF,
although the difference in stratiform precipitation be-
tween CNTL and SMTH is much less than that in cu-
mulus precipitation (cloud water changes hardly affect
the moisture budget).
The evolution of vertical moisture convergence is also
similar to that in JJA, although the amplitudes are about
twice those found in JJA (Fig. 15). Remarkably, mois-
ture convergence develops and persists along the Gulf
Stream front where 2=2SST is large in CNTL in DJF
(Fig. 16). As a result, high CAPE and large convective
precipitation are trapped along the SST front (Fig. 13).
In SMTH, moisture convergence is transient and asso-
ciated with moving atmospheric disturbances.
In contrast to JJA, the synoptic component of moisture
convergence is indeed larger in CNTL than SMTH (not
shown), in addition to an increase in the persistent SST
frontal effect. Presumably as a result, the correlations
among surface convergence, =2SLP, and 2=2SST are
more complicated than those in JJA (Fig. 17). The
correlation between surface convergence and =2SLP
decreases after the cumulus precipitation starts, while
retaining relatively large values in CNTL. The corre-
lation of 2=2SST with =2SLP increases after cumulus
precipitation starts, and the correlation between surface
convergence and 2=2SST remains at about 0.6 until T 1
72 h. Strong synoptic disturbances reduce the correlation
in DJF compared to JJA. After T 1 24 h, the surface
convergence peak shifts eastward from the 2=2SST peak
(Fig. 16). The moving peak is likely associated with syn-
optic disturbances. Horizontal advection is also stronger
in DJF. Surface convergence gradually spreads horizon-
tally with time from T 1 12 h in CNTL DJF (Fig. 16). In
FIG. 15. As in Fig. 10, but for DJF.
1 JULY 2010 K U W A N O - Y O S H I D A E T A L . 3691

FIG. 16. As in Fig. 11, but for DJF.
3692 J O U R N A L O F C L I M A T E VOLUME 23

SMTH, both correlations of surface convergence with
=2SLP and 2=2SST are negative, while the correlation
between =2SLP and 2=2SST is positive with a daily
cycle. This means that surface convergence associated
with convective precipitation in SMTH DJF is controlled
by atmospheric disturbance without SST influence.
The results from the composite analyses suggest that
in response to the SST front, the pressure adjustment
mechanism strengthens and sustains cumulus precipitation
throughout the year. Its relative importance depends on the
atmospheric environment and the SST front intensity.
5. Vertical extension
This section examines the vertical extent of the Gulf
Stream’s influence on the atmosphere. Convection is an
important mechanism linking sea surface conditions to
the free troposphere. Minobe et al. (2008) report that
strong updrafts in the Gulf Stream rainband reach the
upper troposphere. Such deep updrafts could be a source
of barotropic Rossby waves propagating along the upper-
tropospheric westerly jet.
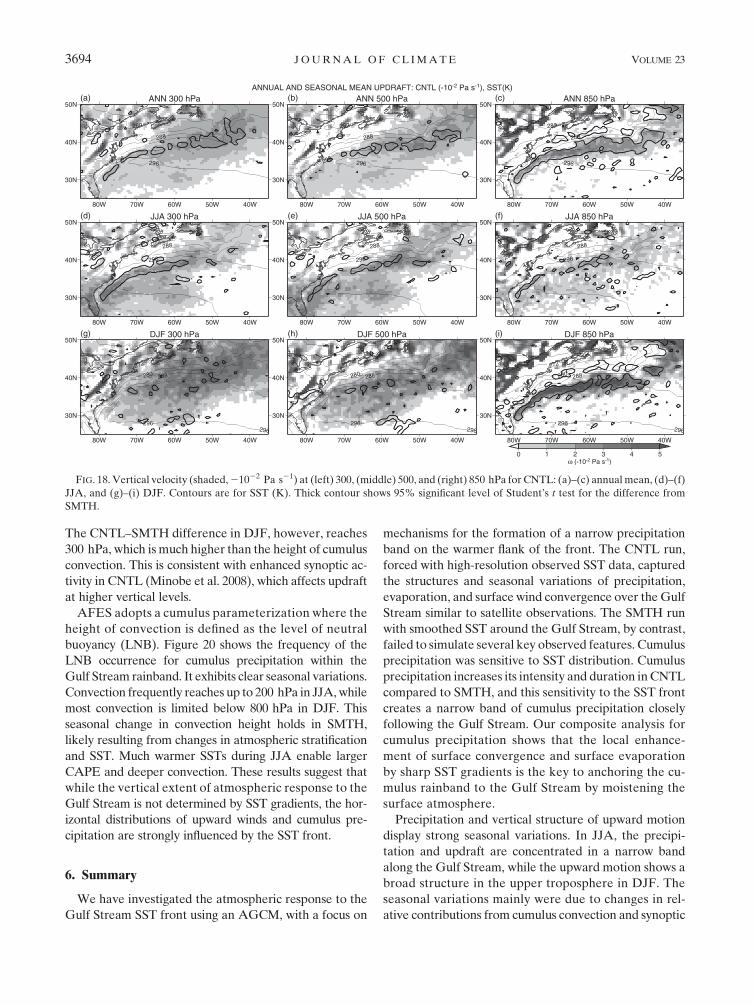
Figure 18 shows vertical velocity in CNTL. In the annual
mean, the updraft maximum follows the Gulf Stream at all
levels, especially at 850 hPa, as shown in Minobe et al.
(2008) using the ECMWF operational analysis. Significant
seasonal variations can be seen between JJA and DJF. A
narrow band of upward motion with high significant level
of the Student’s t test is found above the Gulf Stream over
the whole troposphere in JJA, while it is restricted in the
lower troposphere in DJF with a broad structure in the
upper troposphere, where the difference from SMTH is
insignificant. The magnitude of updraft is weaker in JJA
than in DJF. These features are generally consistent with
the upward motion distribution in the ECMWF operational
analysis for each season (Minobe et al. 2010). Compared
to ECMWF, the upward motion is too weak near the
American coast in the CNTL simulation, probably asso-
ciated with the underestimation of precipitation (Fig. 1).
Because the seasonal variations in horizontal structure
are similar between upward motion and precipitation in
Fig. 1, it is suggested that updraft may be related to
precipitation.
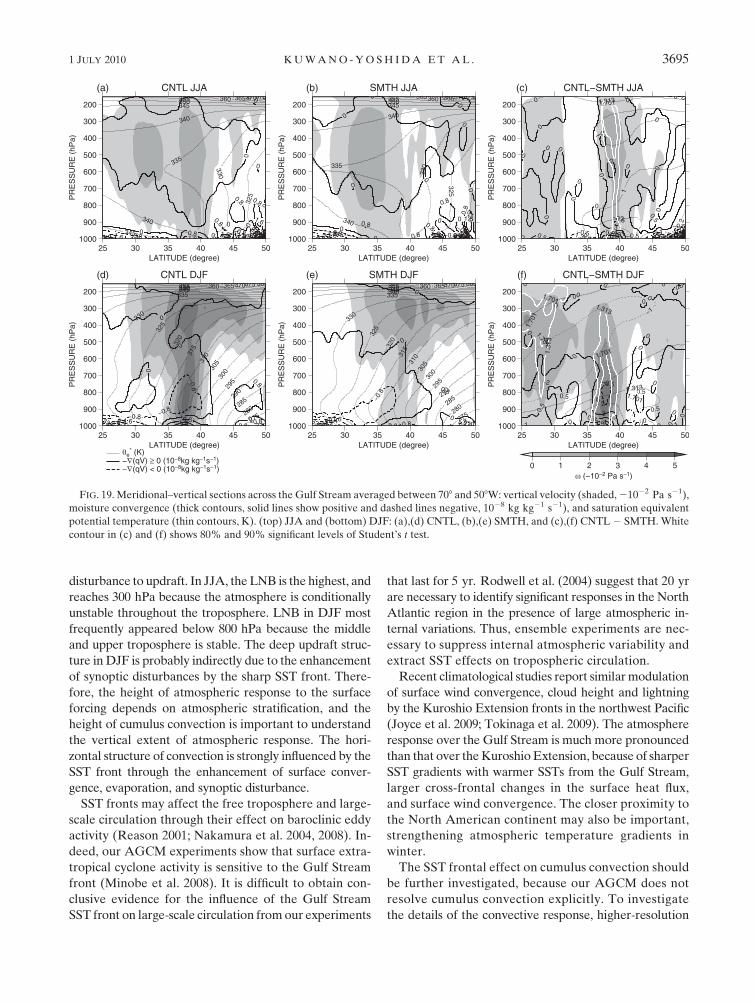
Figure 19 shows vertical meridional sections across
the Gulf Stream of vertical velocity, moisture conver-
gence, and saturation equivalent potential temperature
(ue*), averaged between 708 and 508W for JJA and DJF.
For ›ue*/›z , 0, the atmosphere is conditionally un-
stable. Where conditionally unstable, a saturated, un-
diluted parcel could rise up to the altitude where ue* is
the same as the surface ue* value. This altitude may be
considered as the convection top.
In JJA, the updraft maximum extends from 900 to
200 hPa in CNTL, sitting just above the surface moisture
convergence maximum around 388N anchored by the
Gulf Stream SST front (Fig. 19a). The warm and moist air
mass extends from the south to this surface convergence
zone, where ue* exceeds 340 K, a value that allows a sat-
urated, undiluted parcel to reach 300 hPa. In contrast,
there is no surface convergence zone and no updraft
centered on 388N in SMTH (Fig. 19b). The warm/moist
air mass with ue* . 340 K is located south of 378N, and the
updraft maximum is also displaced south. The CNTL–
SMTH difference (Fig. 19c) shows an updraft over the
surface moisture convergence zone reaching 300 hPa,
which may be taken as the SST front effect. Thus, the
updraft height agrees with the cumulus convection height
set by the atmospheric thermodynamic structure, while
the updraft position is strongly influenced by surface con-
vergence and the SST front in JJA.
In DJF, the updraft maximum in CNTL appears
around 850 hPa above the surface moisture convergence
(Fig. 19d). As a result of the atmosphere above 850 hPa
being stable, the cumulus convection height is restricted
to around 700 hPa. Thus, the updraft maximum around
400 hPa is not directly related to cumulus convection.
Indeed, only the lower updraft disappears in SMTH,
while the upper updraft maximum remains (Fig. 19e).
FIG. 17. As in Fig. 12, but for DJF.
1 JULY 2010 K U W A N O - Y O S H I D A E T A L . 3693
The CNTL–SMTH difference in DJF, however, reaches
300 hPa, which is much higher than the height of cumulus
convection. This is consistent with enhanced synoptic ac-
tivity in CNTL (Minobe et al. 2008), which affects updraft
at higher vertical levels.
AFES adopts a cumulus parameterization where the
height of convection is defined as the level of neutral
buoyancy (LNB). Figure 20 shows the frequency of the
LNB occurrence for cumulus precipitation within the
Gulf Stream rainband. It exhibits clear seasonal variations.
Convection frequently reaches up to 200 hPa in JJA, while
most convection is limited below 800 hPa in DJF. This
seasonal change in convection height holds in SMTH,
likely resulting from changes in atmospheric stratification
and SST. Much warmer SSTs during JJA enable larger
CAPE and deeper convection. These results suggest that
while the vertical extent of atmospheric response to the
Gulf Stream is not determined by SST gradients, the hor-
izontal distributions of upward winds and cumulus pre-
cipitation are strongly influenced by the SST front.
6. Summary
We have investigated the atmospheric response to the
Gulf Stream SST front using an AGCM, with a focus on
mechanisms for the formation of a narrow precipitation
band on the warmer flank of the front. The CNTL run,
forced with high-resolution observed SST data, captured
the structures and seasonal variations of precipitation,
evaporation, and surface wind convergence over the Gulf
Stream similar to satellite observations. The SMTH run
with smoothed SST around the Gulf Stream, by contrast,
failed to simulate several key observed features. Cumulus
precipitation was sensitive to SST distribution. Cumulus
precipitation increases its intensity and duration in CNTL
compared to SMTH, and this sensitivity to the SST front
creates a narrow band of cumulus precipitation closely
following the Gulf Stream. Our composite analysis for
cumulus precipitation shows that the local enhance-
ment of surface convergence and surface evaporation
by sharp SST gradients is the key to anchoring the cu-
mulus rainband to the Gulf Stream by moistening the
surface atmosphere.
Precipitation and vertical structure of upward motion
display strong seasonal variations. In JJA, the precipi-
tation and updraft are concentrated in a narrow band
along the Gulf Stream, while the upward motion shows a
broad structure in the upper troposphere in DJF. The
seasonal variations mainly were due to changes in rel-
ative contributions from cumulus convection and synoptic
FIG. 18. Vertical velocity (shaded, 21022 Pa s21) at (left) 300, (middle) 500, and (right) 850 hPa for CNTL: (a)–(c) annual mean, (d)–(f)
JJA, and (g)–(i) DJF. Contours are for SST (K). Thick contour shows 95% significant level of Student’s t test for the difference from
SMTH.
3694 J O U R N A L O F C L I M A T E VOLUME 23
disturbance to updraft. In JJA, the LNB is the highest, and
reaches 300 hPa because the atmosphere is conditionally
unstable throughout the troposphere. LNB in DJF most
frequently appeared below 800 hPa because the middle
and upper troposphere is stable. The deep updraft struc-
ture in DJF is probably indirectly due to the enhancement
of synoptic disturbances by the sharp SST front. There-
fore, the height of atmospheric response to the surface
forcing depends on atmospheric stratification, and the
height of cumulus convection is important to understand
the vertical extent of atmospheric response. The hori-
zontal structure of convection is strongly influenced by the
SST front through the enhancement of surface conver-
gence, evaporation, and synoptic disturbance.
SST fronts may affect the free troposphere and large-
scale circulation through their effect on baroclinic eddy
activity (Reason 2001; Nakamura et al. 2004, 2008). In-
deed, our AGCM experiments show that surface extra-
tropical cyclone activity is sensitive to the Gulf Stream
front (Minobe et al. 2008). It is difficult to obtain con-
clusive evidence for the influence of the Gulf Stream
SST front on large-scale circulation from our experiments
that last for 5 yr. Rodwell et al. (2004) suggest that 20 yr
are necessary to identify significant responses in the North
Atlantic region in the presence of large atmospheric in-
ternal variations. Thus, ensemble experiments are nec-
essary to suppress internal atmospheric variability and
extract SST effects on tropospheric circulation.
Recent climatological studies report similar modulation
of surface wind convergence, cloud height and lightning
by the Kuroshio Extension fronts in the northwest Pacific
(Joyce et al. 2009; Tokinaga et al. 2009). The atmosphere
response over the Gulf Stream is much more pronounced
than that over the Kuroshio Extension, because of sharper
SST gradients with warmer SSTs from the Gulf Stream,
larger cross-frontal changes in the surface heat flux,
and surface wind convergence. The closer proximity to
the North American continent may also be important,
strengthening atmospheric temperature gradients in
winter.
The SST frontal effect on cumulus convection should
be further investigated, because our AGCM does not
resolve cumulus convection explicitly. To investigate
the details of the convective response, higher-resolution
FIG. 19. Meridional–vertical sections across the Gulf Stream averaged between 708 and 508W: vertical velocity (shaded, 21022 Pa s21),
moisture convergence (thick contours, solid lines show positive and dashed lines negative, 1028 kg kg21 s21), and saturation equivalent
potential temperature (thin contours, K). (top) JJA and (bottom) DJF: (a),(d) CNTL, (b),(e) SMTH, and (c),(f) CNTL 2 SMTH. White
contour in (c) and (f) shows 80% and 90% significant levels of Student’s t test.
1 JULY 2010 K U W A N O - Y O S H I D A E T A L . 3695

regional models are necessary. For example, Song et al.
(2009) suggest that the coupling strength between the
atmosphere and ocean depends on the vertical diffusion
scheme of the model, even when a nonhydrostatic re-
gional model with 15-km horizontal resolution is used.
The influence of lateral boundary conditions is important,
especially when the relationship between the local re-
sponse and large-scale circulation is considered. In addi-
tion, the 0.58 SST product does not fully resolve sharp
SST fronts of the Gulf Stream. Therefore, a newly de-
veloped, global, cloud-resolving model (Oouchi et al.
2009) is an interesting tool for studying SST frontal effects
on the atmosphere.
Finally, the interaction between the ocean and atmo-
sphere through the local atmospheric response to the SST
front is an interesting topic. Xue et al. (2000) and Hogg
et al. (2009) report that ocean currents can be affected
by local atmosphere–ocean coupling using idealized at-
mospheric boundary layer–ocean coupled models. The
cumulus convection response reaching the tropopause
proposed in the present paper may affect the inter-
action with the ocean. High-resolution realistic coupled
models (e.g., Komori et al. 2008) are necessary to explore
this interaction.
Acknowledgments. The AGCM was developed by the
AFES team. Model integrations were performed on the
EarthSimulatorwith the supportof JAMSTEC.J-OFURO2
data are obtained from http://dtsv.scc.u-tokai.ac.jp/j-ofuro/.
This work was supported by KAKENHI (19340130),
NASA and NOAA (SPX).
REFERENCES
Alliss, R. J., and S. Raman, 1995a: Quantitative estimates of
cloudiness over the Gulf Stream locale using GOES VAS
observations. J. Appl. Meteor., 34, 500–510.
——, and ——, 1995b: Diurnal variations in cloud frequency over
the Gulf Stream locale. J. Appl. Meteor., 34, 1578–1594.
Carson, R. B., 1950: The Gulf Stream front: A cause of stratus on
the lower Atlantic coast. Mon. Wea. Rev., 78, 91–101.
Chelton, D. B., and F. J. Wentz, 2005: Global microwave satellite
observations of sea surface temperature for numerical weather
prediction and climate research. Bull. Amer. Meteor. Soc., 86,
1097–1115.
——, M. G. Schlax, M. H. Freilich, and R. F. Milliff, 2004: Satellite
measurements reveal persistent small-scale features in ocean
winds. Science, 303, 978–983.
Christian, H. J., and Coauthors, 2003: Global frequency and dis-
tribution of lightning as observed from space by the Optical
Transient Detector. J. Geophys. Res., 108, 4005, doi:10.1029/
2002JD002347.
Cione, J. J., S. Raman, and L. J. Pietrafesa, 1993: The effect of Gulf
Stream–induced baroclinicity on U.S. east coast winter cy-
clones. Mon. Wea. Rev., 121, 421–430.
Doyle, J. D., and T. T. Warner, 1993: The impact of the sea surface
temperature resolution on mesoscale coastal processes during
GALE IOP 2. Mon. Wea. Rev., 121, 313–334.
Emanuel, K. A., 1991: A scheme for representing cumulus con-
vection in large-scale models. J. Atmos. Sci., 48, 2313–2335.
——, and M. Zivkovic-Rothman, 1999: Development and evalua-
tion of a convection scheme for use in climate models. J. At-
mos. Sci., 56, 1766–1782.
Enomoto, T., A. Kuwano-Yoshida, N. Komori, and W. Ohfuchi,
2008: Description of AFES 2: Improvements for high-resolution
and coupled simulations. High Resolution Numerical Modelling
of the Atmosphere and Ocean, W. Ohfuchi and K. Hamilton,
Eds., Springer, 77–97.
Fairall, C. W., E. F. Bradley, J. E. Hare, A. A. Grachev, and
J. B. Edson, 2003: Bulk parameterization of air–sea fluxes:
FIG. 20. LNB frequency of occurrence binned every 100 hPa (103 month21) in CNTL (white) and SMTH (gray) over the Gulf Stream
rainband within 308–488N, 808–408W: (a) MAM, (b) JJA, (c) SON, and (d) DJF.
3696 J O U R N A L O F C L I M A T E VOLUME 23

Updates and verification for the COARE algorithm. J. Cli-
mate, 16, 571–591.
Frankignoul, C., G. de Coetlogon, T. M. Joyce, and S. Dong, 2001:
Gulf Stream variability and ocean–atmosphere interactions.
J. Phys. Oceanogr., 31, 3516–3529.
Giordani, H., and G. Caniaux, 2001: Sensitivity of cyclogenesis to
sea surface temperature in the northwestern Atlantic. Mon.
Wea. Rev., 129, 1273–1294.
Gyakum, J. R., and P. J. Roebber, 2001: The 1998 ice storm—
Analysis of a planetary-scale event. Mon. Wea. Rev., 129,
2983–2997.
Hogg, A. M., W. K. Dewar, P. Berloff, S. Kravtsov, and D. K.
Hutchinson, 2009: The effects of mesoscale ocean–atmosphere
coupling on the large-scale ocean circulation. J. Climate, 22,
4066–4082.
Hoskins, B. J., and P. J. Valdes, 1990: On the existence of storm
tracks. J. Atmos. Sci., 47, 1854–1864.
Iguchi, T., T. Kozu, R. Meneghine, J. Awaka, and K. Okamoto,
2000: Rain-profiling algorithm for the TRMM precipitation
radar. J. Appl. Meteor., 39, 2038–2052.
Joyce, T. M., Y. O. Kwon, and L. Yu, 2009: On the relationship
between synoptic wintertime atmospheric variability and path
shifts in the Gulf Stream and the Kuroshio Extension. J. Cli-
mate, 22, 3177–3192.
Kanamitsu, W., M. Ebisuzaki, J. Woollen, S.-K. Yang, J. J. Hnilo,
M. Fiorino, and G. L. Potter, 2002: NCEP–DOE AMIP-II
Reanalysis (R-2). Bull. Amer. Meteor. Soc., 83, 1631–1643.
Komori, N., A. Kuwano-Yoshida, T. Enomoto, H. Sasaki, and
W. Ohfuchi, 2008: High-resolution simulation of global cou-
pled atmosphere–ocean system: Description and preliminary
outcomes of CFES (CGCM for the Earth Simulator). High
Resolution Numerical Modelling of the Atmosphere and
Ocean, K. Hamilton and W. Ohfuchi, Eds., Springer, 241–260.
Kubota, M., and H. Tomita, 2007: Present state of the J-OFURO
air–sea interaction data product. Flux News, 4, 13–15.
Kuo, Y. H., M. Shapiro, and E. G. Donall, 1991: The interaction
between baroclinic and diabatic processes in a numerical sim-
ulation of a rapidly intensifying extratropical marine cyclone.
Mon. Wea. Rev., 119, 368–384.
Le Treut, H., and Z.-X. Li, 1991: Sensitivity of an atmospheric
general circulation model to prescribed SST changes: Feed-
back effects associated with the simulation of cloud optical
properties. Climate Dyn., 5, 175–182.
Lindzen, R. S., and S. Nigam, 1987: On the role of sea surface
temperature gradients in forcing low-level winds and conver-
gence in the tropics. J. Atmos. Sci., 44, 2418–2436.
Minobe, S., A. Kuwano-Yoshida, N. Komori, S.-P. Xie, and R. J.
Small, 2008: Influence of the Gulf Stream on the troposphere.
Nature, 452, 206–209.
——, M. Miyashita, A. Kuwano-Yoshida, H. Tokinaga, and S.-P. Xie,
2010: Atmospheric response to the Gulf Stream: Seasonal
variations. J. Climate, 23, 3699–3719.
Nakajima, T., M. Tsukamoto, Y. Tsushima, A. Numaguti, and
T. Kimura, 2000: Modeling of the radiative process in an
atmospheric general circulation model. Appl. Opt., 39, 4869–
4878.
Nakamura, H., T. Sampe, Y. Tanimoto, and A. Shimpo, 2004: Ob-
served associations among storm track, jet stream and mid-
latitude oceanic fronts. Earth’s Climate: The Ocean-Atmosphere
Interaction, Geophys. Monogr., Vol. 147, Amer. Geophys. Union,
329–345.
——, ——, A. Goto, W. Ohfuchi, and S.-P. Xie, 2008: On the
importance of midlatitude oceanic frontal zones for the
mean state and dominant variability in the tropospheric
circulation. Geophys. Res. Lett., 35, L15709, doi:10.1029/
2008GL034010.
Nonaka, M., and S.-P. Xie, 2003: Covariations of sea surface
temperature and wind over the Kuroshio and its extension:
Evidence for ocean-to-atmosphere feedback. J. Climate, 16,
1404–1413.
Numaguti, A., M. Takahashi, T. Nakajima, and A. Sumi, 1997:
Description of CCSR/NIES Atmospheric General Circulation
Model. National Institute for Environmental Studies, Center
for Global Environmental Research Supercomputer Mono-
graph Rep. 3, 91 pp.
Ohfuchi, W., and Coauthors, 2004: 10-km mesh mesoscale re-
solving simulations of the global atmosphere on the Earth
Simulator—Preliminary outcomes of AFES (AGCM for the
Earth Simulator). J. Earth Simulator, 1, 8–34.
Oouchi, K., A. T. Noda, M. Satoh, B. Wang, S.-P. Xie, H. G.
Takahashi, and T. Yasunari, 2009: Asian summer monsoon
simulated by a global cloud-system-resolving model: Diurnal
to intra-seasonal variability. Geophys. Res. Lett., 36, L11815,
doi:10.1029/2009GL038271.
Page, J., 1906: Has the Gulf Stream any influence on the weather of
New York City? Mon. Wea. Rev., 34, 465.
Peng, M. S., J. A. Ridout, and T. F. Hogan, 2004: Recent modifi-
cation of the Emanuel convective scheme in the Navy Oper-
ational Global Atmospheric Prediction System. Mon. Wea.
Rev., 132, 1254–1268.
Pope, C., 1968: Winter cyclogenesis with tropical characteristics
over the Gulf Stream. Mon. Wea. Rev., 96, 867–875.
Raman, S., and A. J. Riordan, 1988: The Genesis of Atlantic Lows
Experiment: The planetary boundary layer subprogram. Bull.
Amer. Meteor. Soc., 69, 161–172.
Reason, C. J. C., 2001: Evidence for the influence of the Agulhas
Current on regional atmospheric circulation patterns. J. Cli-
mate, 14, 2769–2778.
Rodwell, M. J., M. Drevillon, C. Frankignoul, J. W. Hurrell,
H. Pohlmann, M. Stendel, and R. T. Sutton, 2004: North At-
lantic forcing of climate and its uncertainty from a multi-model
experiment. Quart. J. Roy. Meteor. Soc., 130, 2013–2032.
Sampe, T., and S.-P. Xie, 2007: Mapping high sea winds from space.
Bull. Amer. Meteor. Soc., 88, 1965–1978.
Seager, R., D. S. Battisti, J. Yin, N. Gordon, N. Naik, A. C. Clement,
and M. A. Cane, 2002: Is the Gulf Stream responsible for
Europe’s mild winter? Quart. J. Roy. Meteor. Soc., 128, 2563–
2586.
Sekiguchi, M., 2004: A study on evaluation of the radiative flux and
its computational optimization in the gaseous absorbing at-
mosphere. Ph.D. dissertation, Tokyo University, 121 pp.
——, and T. Nakajima, 2008: A k-distribution-based radiation code
and its computational optimization for an atmospheric general
circulation model. J. Quant. Spectrosc. Radiat. Transfer, 19,
2779–2793, doi:10.1016/j.jqsrt.2008.07.013.
——, ——, K. Suzuki, K. Kawano, A. Higurashi, D. Rosenfeld,
I. Sano, and S. Mukai, 2003: A study of the direct and in-
direct effects of aerosols using global satellite data sets of
aerosol and cloud parameters. J. Geophys. Res., 108, 4699,
doi:10.1029/2002JD003359.
Small, R. J., and Coauthors, 2008: Air-sea interaction over ocean
fronts and eddies. Dyn. Atmos. Oceans, 45, 274–319.
Song, Q., D. B. Chelton, S. K. Esbensen, N. Thum, and L. W. O’Neill,
2009: Coupling between sea surface temperature and low-
level winds in mesoscale numerical models. J. Climate, 22,
146–164.
1 JULY 2010 K U W A N O - Y O S H I D A E T A L . 3697
Strachan, R., 1907: Temperature around the British Islands in
relation to the Gulf Stream. Quart. J. Roy. Meteor. Soc., 33,
207–212.
Sublette, M. S., and G. S. Young, 1996: Warm-season effects of the
Gulf Stream on mesoscale characteristics of the atmosphere
boundary layer. Mon. Wea. Rev., 124, 653–667.
Thiebaux, J., E. Rogers, W. Wang, and B. Katz, 2003: A new high-
resolution blended real-time global sea surface temperature
analysis. Bull. Amer. Meteor. Soc., 84, 645–656.
Tokinaga, H., Y. Tanimoto, S.-P. Xie, T. Sampe, H. Tomita, and
H. Ichikawa, 2009: Ocean frontal effects on the vertical de-
velopment of clouds over the northwest Pacific: In situ and
satellite observations. J. Climate, 22, 4241–4260.
Trunk, T. J., and L. F. Bosart, 1990: Mean radar echo character-
istics during project GALE. Mon. Wea. Rev., 118, 459–469.
Warner, T. T., M. N. Lakhtakia, and J. D. Doyle, 1990: Marine
atmospheric boundary layer circulations forced by Gulf Stream
sea surface temperature gradient. Mon. Wea. Rev., 118,
309–323.
Xie, S.-P., 2004: Satellite observations of cool ocean–atmosphere
interaction. Bull. Amer. Meteor. Soc., 85, 195–208.
——, J. Hafner, Y. Tanimoto, W. T. Liu, H. Tokinaga, and H. Xu,
2002: Bathymetric effect on the winter sea surface tempera-
ture and climate of the Yellow and East China Seas. Geophys.
Res. Lett., 29, 2228, doi:10.1029/2002GL015884.
Xue, H., Z. Pan, and J. M. Bane Jr., 2000: A 2D coupled atmosphere–
ocean model study of air–sea interactions during a cold air out-
break over the Gulf Stream. Mon. Wea. Rev., 128, 973–996.
Young, G. S., and T. D. Sikora, 2003: Mesoscale stratocumulus
bands caused by Gulf Stream meanders. Mon. Wea. Rev., 131,
2177–2191.
Zolina, O., and S. K. Gulev, 2003: Synoptic variability of ocean–
atmosphere turbulent fluxes associated with atmospheric cy-
clones. J. Climate, 16, 2717–2734.
3698 J O U R N A L O F C L I M A T E VOLUME 23