portland water bureau - american water works association guidelines.pdf · portland water bureau...
TRANSCRIPT

Portland Water Bureau
Guidelines for How To Develop an
Asset Management Plan
Tanks
Pump Stations
Mains
Transmission
Valves & Regulators
Hydrants
Service Lines
Meters
Vaults
Groundwater
Bull Run
Roads


Table of Contents
1. Introduction and Asset Profile ......................................................................................................... 1
1.1. Definition ................................................................................................................................... 1
1.2. Purpose ...................................................................................................................................... 2
2. Levels of Service ................................................................................................................................. 2
2.1. Key Service Levels in Strategic Plan ...................................................................................... 3
2.2. Current Effectiveness Measure for the Water Bureau......................................................... 3
2.3. Existing Sub‐Program Metrics ................................................................................................ 4
3. Asset Inventory and Valuation ........................................................................................................ 6
3.1. Asset and Component Listing and Hierarchy (Asset Hierarchy)...................................... 6
3.2. Data base(s)................................................................................................................................ 8
3.3. Physical Parameters ................................................................................................................. 8
3.3.1. Inventory ............................................................................................................................... 8
3.3.2. Age ......................................................................................................................................... 9
3.3.3. Location ................................................................................................................................. 9
3.4. Asset Replacement Valuation (Fully Loaded Replacement Costs) ................................... 9
4. Asset Condition and Utilization ...................................................................................................... 9
4.1. Likelihood of Failure .............................................................................................................. 10
4.2. Current Condition Overview................................................................................................ 16
4.3. Identification of Assets in Poor Condition.......................................................................... 16
4.4. Asset Capacity/ Performance (Utilization) ......................................................................... 16
4.5. Developing a Condition Assessment Strategy ................................................................... 16
5. Failure Modes and Asset Life......................................................................................................... 21
5.1. Failure Modes.......................................................................................................................... 21
5.2. Service Demands .................................................................................................................... 22
5.3. Asset Deterioration and Condition Failure......................................................................... 22
5.4. Effective or Useful Asset Lives ............................................................................................. 23
5.5. Actions to Extend Useful Life ............................................................................................... 25
6. Business Risk Exposure................................................................................................................... 26
6.1. Consequence of Failure (CoF)............................................................................................... 26

6.2. Business Risk Exposure (BRE) – Asset / Program Level ................................................... 29
6.3. Business Risk Exposure (BRE) – Bureau Level................................................................... 31
7. Maintenance, Repair, and Replacement Strategies ..................................................................... 33
7.1. Current and Potential Activities........................................................................................... 33
7.2. Maintenance Strategies .......................................................................................................... 33
7.2.1. Condition Assessment Strategies..................................................................................... 33
7.2.2. Preventive / Predictive Maintenance Strategies............................................................. 35
7.2.3. Reactive / Responsive Maintenance Strategies .............................................................. 37
7.3. Repair Strategies ..................................................................................................................... 38
7.4. Replacement Strategies .......................................................................................................... 39
7.5. Risk Cost Analysis .................................................................................................................. 41
8. Budget Forecasting .......................................................................................................................... 42
8.1. Existing Capital Improvement Projects and Programs ..................................................... 42
8.2. Recommended and Projected Activities for Maintenance................................................ 42
8.3. Recommended and Projected Activities for Repair and Replacement ........................... 42
8.4. Growth, Improvements, and New Requirements.............................................................. 43
8.5. Forecasting Asset Condition and Funding Needs ............................................................. 43
9. Performance Tracking ..................................................................................................................... 43
10. Improvement Plan and Data Requirements............................................................................ 44
10.1. Summary of Next Steps ......................................................................................................... 45
10.2. Recommended Service Levels .............................................................................................. 45
10.3. Recommended Condition Assessment Work..................................................................... 45
10.4. Recommended Failure Modes Analysis.............................................................................. 45
10.5. Recommended Risk Evaluations.......................................................................................... 45
10.6. Recommended Operational Changes .................................................................................. 45
10.7. Recommended Maintenance Strategies............................................................................... 45
10.8. Recommended Repair and Replacement Strategies .......................................................... 45
10.9. Recommended Data Collection Actions.............................................................................. 45
Appendices ............................................................................................................................................... 46


Guidelines for an Asset Management Plan
This Guideline follows the Asset Management Plan (AMP) Template. The AMP Template has all the chapters and sections formatted. The Template and the recommended chapters and sub‐chapters can be changed to meet the needs of the particular AMP, but should generally following the outline presented here and in the Template. Jessica Letteney is the contact person for Template formatting questions, the location of the template is here: AMP Template
1. Introduction and Asset Profile Provide a brief introduction to the asset and this asset management plan.
Add information on the asset category, sub‐category and who the players are: Champion, Budget Program Leader, Analyst and any support staff. This will be done in a table format as outlined below:
Asset Category <category name> Asset Sub-Category <sub-category name>
AMSC Champion <WB employee> Budget Program Lead <WB employee>
AMP Lead or Co-Lead
<WB employee> Support <WB employee or group>
Plan Author <your name> Version Number
Last Reviewed Next Review
1.1. Definition Provide definition of the asset and general information so the audience has a clear picture of the asset being addressed. For example, storage tanks AMP does not include terminal storage facilities such as Powell Butte, Mt. Tabor, or Washington Park; stand pipes are taller than they are wide; tanks may be buried, partially buried, ground level or elevated; are either concrete or steel.
Guidelines for an Asset Management Plan Page 1

1.2. Purpose Define the purpose of the asset – how it contributes to the goal of the PWB and delivers water to customers. Purpose may be taken from the Budget Program Description and Summary
Example from AMP: Distribution Mains The water system contains over 2,100 miles of distribution mains that transport water from terminal reservoirs to local distribution areas and then through a complex grid of interconnected piping to customers’ services. Distribution mains’ primary purposes are to move water between central distribution points located within different distribution zones throughout the city and to provide water service and fire protection to Portland Water Bureau (PWB) customers.
Example from Budget Program Description: Valves/Gates/Regulators
Purpose: • Through the use of valves/gates, isolate segments of the distribution system for maintenance and/or adjustments.
• Through regulator stations, reduce main water pressure to ensure adequate and appropriate pressure at the customer’s meter.
2. Levels of Service There are really three levels that occur in our strategic planning. At the Bureau level we have Key Service Levels. These bureau‐wide goals help the Bureau focus on delivering results on the strategic objectives.
At the Program level there are Effectiveness Measures. These are program level objectives that are presented in the budget and reported on. Effectiveness measures, like all objectives, are quantifiable or measurable and they contribute to the Bureau goals or strategic objectives.
Guidelines for an Asset Management Plan Page 2

The third level is Sub‐Program Metrics. These activities that are reported on quarterly. Sub‐program metric outcomes directly contribute to the Effectiveness Measures. The top two levels are considered as the “Level of Service” that an asset delivers while the bottom level is the specific activities with their measurable outcomes that are contributing to specific sub‐program objectives. Each of these strategic metrics is reported in the sub‐sections below.
2.1. Key Service Levels in Strategic Plan Use service levels from the Strategic Plan that the asset contributes to meeting the goal. Identify all levels of service linked to asset group.
Example: Pump Station: No more than 5% of customers out of water for more than 8 hours a year; Maintain minimum pressure of 20 psi during normal demands limit outage)
Outline how data will be gathered and reported on so that the Service Levels goals can be reported on.
Reference materials for service levels have been compiled within the directory: WB-PDX /Eng/Asset Management/Service Levels (WB‐PDX will be changing to WBFile1 anticipated in June 2010). The material includes a summary given as a PPT file entitled “Water Utility Service Levels Around the World”. National and Utility‐specific detailed reports are available on service levels:
• Australia National Performance Report • England Level of Service Report • Canadian Benchmarking Report • Water Performance Report for Australian Utilities • Seattle Public Utilities Strategic Plan • Charlotte Mecklenburg Utilities Strategic Plan • City of Phoenix Performance Report
2.2. Current Effectiveness Measure for the Water Bureau Use the “Effectiveness Measures” taken from the current budget and any revisions that are planned.
Guidelines for an Asset Management Plan Page 3
Example: Effectiveness Measures for Valves/Gates/Regulators
• 90 percent of valves operating and less than 5% of customers experiencing a cumulative outage of water for more than 8 hours in a year
• 99 percent of regulators operating to standard providing 40 to 100 psi (but not below 20 psi ‐ 100 percent) at the customer’s meter.
Example: Effectiveness Measures for Services and Mains
• Less than 5 percent of customers shall experience a cumulative outage of water for more than 8 hours in a year.
• Planned outages, causing disruption of service, shall be limited to 8 hours.
• Emergency outages are limited to 24 hours, except for mains exceeding 16 inches in diameter, for which emergency outages are limited to 48 hours.
The results of the Effectiveness Measures are reported on in the Budget Program Results Reports. Results should be presented in the AMP and, when possible, use data from multiple years to show trends. Provide information on issues or events that helped meet or not to meet Effectiveness Measures.
If there are applicable AWWA guidelines additional to stated measures then provide information on those measurements.
Outline how data will be gathered and reported on so that the Effectiveness measures can be reported on.
Section 7 shall include recommendations on changes or additions to Effectiveness Measures.
2.3. Existing Sub-Program Metrics
List the sub‐program metrics for the asset group. Include the CIP projects with their objectives, targets and results. This section is for existing sub‐program metrics and the capital projects that are being implemented. Any recommended changes, as with Effectiveness Measures above, is addressed in Chapter 7.
Guidelines for an Asset Management Plan Page 4
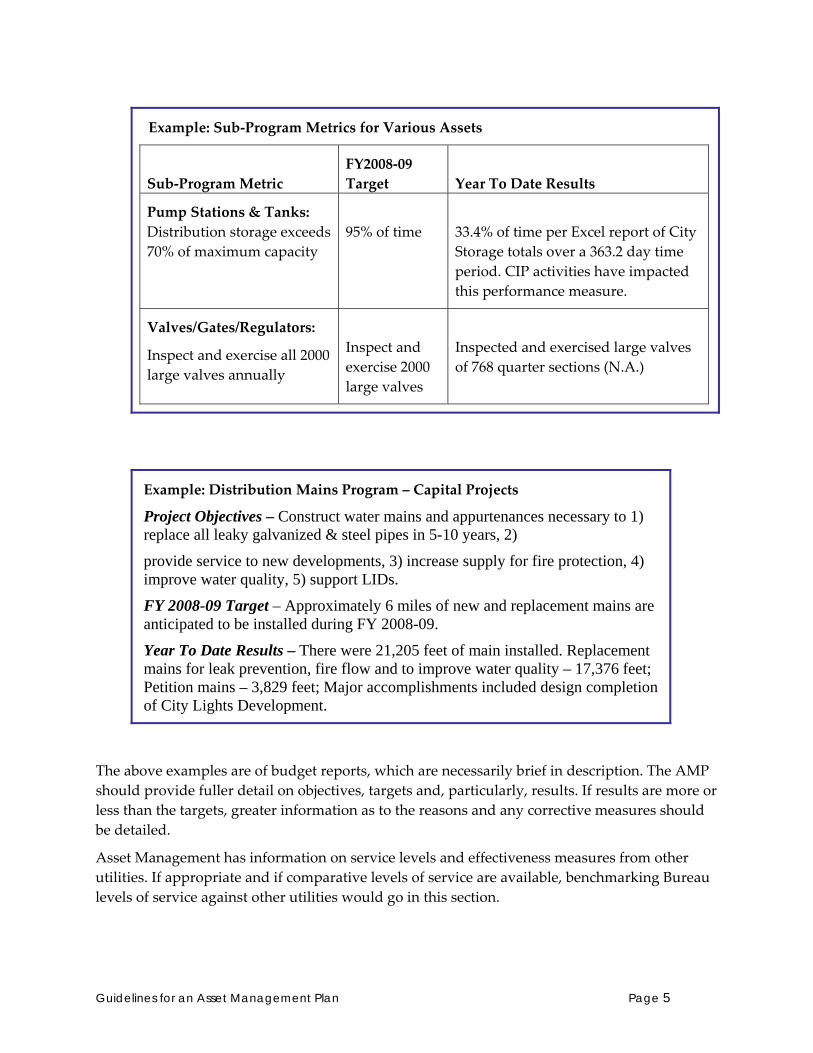
Example: Sub‐Program Metrics for Various Assets
Sub‐Program Metric
FY2008‐09 Target
Year To Date Results
Pump Stations & Tanks: Distribution storage exceeds 70% of maximum capacity
95% of time
33.4% of time per Excel report of City Storage totals over a 363.2 day time period. CIP activities have impacted this performance measure.
Valves/Gates/Regulators:
Inspect and exercise all 2000 large valves annually
Inspect and exercise 2000 large valves
Inspected and exercised large valves of 768 quarter sections (N.A.)
Example: Distribution Mains Program – Capital Projects
Project Objectives – Construct water mains and appurtenances necessary to 1) replace all leaky galvanized & steel pipes in 5-10 years, 2)
provide service to new developments, 3) increase supply for fire protection, 4) improve water quality, 5) support LIDs.
FY 2008-09 Target – Approximately 6 miles of new and replacement mains are anticipated to be installed during FY 2008-09.
Year To Date Results – There were 21,205 feet of main installed. Replacement mains for leak prevention, fire flow and to improve water quality – 17,376 feet; Petition mains – 3,829 feet; Major accomplishments included design completion of City Lights Development.
The above examples are of budget reports, which are necessarily brief in description. The AMP should provide fuller detail on objectives, targets and, particularly, results. If results are more or less than the targets, greater information as to the reasons and any corrective measures should be detailed.
Asset Management has information on service levels and effectiveness measures from other utilities. If appropriate and if comparative levels of service are available, benchmarking Bureau levels of service against other utilities would go in this section.
Guidelines for an Asset Management Plan Page 5

3. Asset Inventory and Valuation The information for Sections 3.2 and 3.3 may be available from the Status and Condition Report and in the related EXCEL file. Click here for the link to the Water System Status and Condition Summary Water System Status and Condition Report (Feb 2006) Report 2006 and the Current Condition and Cost Data (2009) , which has more current cost information than the 2006 report.
3.1. Asset and Component Listing and Hierarchy (Asset Hierarchy) The following link is PWB’s Asset Hierarchy schematic with level 1 and level 2 asset hierarch. The AMP should mention the level 1 and 2 hierarchy but then provide more detail at higher levels, if there are components to the asset in the hierarchy (see example below).
Example: Pump Station (see hierarchy diagram below) The diagram shows the child assets to be assigned and tracked within each pump station. Each pump station will be within the Operations/Distribution Facilities group of assets. The plan is for work orders issued in Synergen to be linked to a specific child asset. As maintenance is performed the labor, equipment, materials used and date will be recorded for each incident. The information will then roll up to the parent asset. This will be a very valuable tool as we move forward with future asset management plans.
Guidelines for an Asset Management Plan Page 6

Roof
Building
Grounds
Electrical System
Pumping System 1(Ty p. 6)
Hoist/Crane
Bathroom Plumbing
HVAC
Building
Intrusion Detection
Misc.
Irrigation System
Fence
Lanscape
Misc.
15KV Primary Switch
2000 KVA/2260KVA Transformer
Landscape
Switchgear for Pump 1-3
Switchgear for Pump 4-6
PumpMotor
Misc. Valve
Pump Control Valve
MCC
3-Phase Breaker Panel
House Power Electrical Service
Electrical
Starter
Misc.
Discharge Header
Suction Header
Rel ief Piping
Carolina Ball Valve
Misc.
Piping Mechanical
Flow Meter
RTU
Misc. In truments
SCAD A/Ins trumentation
Car
olin
a P
ump
Sta
tion
Guidelines for an Asset Management Plan Page 7

3.2. Data base(s) Provide information on asset databases and include links. Description should include databases and information on the fields that each database is holding. If there is duplicate information, is there a database that is considered to be the default one to use in case of discrepancies? For example, Synergen and GIS have different asset IDs for valves, when do we use the GIS number and when to use the Synergen number.
3.3. Physical Parameters Tabulation and/or graphical depiction of the number / type / physical characteristics / installation date of assets. Could also include out‐of‐service assets if applicable and significant.
For example, with valves the parameters would include size, type (pressure relief valve, altitude, pump control, check, gate, etc.), or manufacturer. One way to present the data would be to tabulate each parameter separately. If there are two or more parameters in which data sorted by multiple parameters provides useful information then tabulate those multiple parameters together (see example below):
Example: Valves by physical parameters
Size Type Count 16” Gate 1,108 16” Check 865 18” Gate 423 18” Check 288
3.3.1. Inventory
List of all assets in the AMP. For assets with limited numbers each individual asset shall be listed, e.g. pump stations or tanks. For assets that are too numerous to list individually they may be grouped by size, material or other characteristics, e.g. distribution mains or meters.
The actual list may be given in 3.3.2 or 3.3.3 below. If the actual list is given below, then this section should summarize the inventory count by characteristic (i.e. large meters inventory may be summarized by size of meter with totals given for type or manufacturer as well).
Guidelines for an Asset Management Plan Page 8

3.3.2. Age
Age of an asset is important to understanding condition which is often based on a deterioration curve with age as the independent variable. Since the AMP may not be revised for several years it may be more appropriate to list year of install rather than age, this is up to the AMP Lead.
Give ranges of age where appropriate. Include a count of assets within an age range and include a range or field for those with unknown age.
3.3.3. Location
For information on individual assets where the count is low enough to list individually provide location information. Address and/or quarter section.
3.4. Asset Replacement Valuation (Fully Loaded Replacement Costs) This section includes the replacement value including construction replacement cost, engineering services, and overhead – both direct (benefits of those working on the project) and indirect (capital borrowing charges and a portion of salaries of non‐project staff, like billing, HR, finance, etc). This should be done in cooperation with Engineering Planning as they also utilize cost estimates that should be in sync with our methodology. It should be noted that TEAM Plan (Total Enterprise Asset Management Planning Tool) is built using budget level costs, which do not include the indirect overhead. This is because when budgeting is conducted, the overhead is added as a separate line item in the budget and the output of TEAM PLAN was intended to give budget projections, so indirect overhead was removed from the costs in this model.
The Status and Condition Report is being revised and may have different estimates than the 2006 report given in the link above. Check with Asset Management on current valuation estimates for your assets.
4. Asset Condition and Utilization Available data sources for preparing asset inventories for Asset Management Plans include Asset Viewer, ATTASK, GIS, Large Meter Database, OpsInfrastructure database, SAP fixed assets data, Streetsaver, Synergen, TEAM PLAN and the Water System Status and Condition Report. Table 1 in Appendix A provides a brief description of where to find each data source, the basic information that can be found in each, and who maintains the information. It is the objective of asset management planning efforts to continually improve the completeness and accuracy of data sources and to eventually develop links between these sources so that key data for all assets has a home system that is maintained by those in charge of that system and the information is then linked into the other systems rather than duplicated. This prevents various
Guidelines for an Asset Management Plan Page 9

systems from being out of synch with one another. In working with asset management plans expect to get very familiar with GIS and how to create selections and layers displaying various characteristics of assets and their physical environment, as well as how to use Synergen to find out work history on individual assets. Asset Management staff members can provide assistance in learning to use these primary data sources. It is hoped that data collected for and updated through the Asset Management Planning process will mirror the same asset groupings, naming conventions, and FacilityID designations being used elsewhere so that it can readily be used to update data sources such as TEAM PLAN, OpsInfrastructure, GIS and/or Synergen where appropriate.
The Status and Condition Report and related EXCEL file PWB Status and Condition Report contain basic summaries of assets by class and condition by dollar value, mostly based on the age distribution of assets. See Asset Management for up to date revisions to the report and asset condition. The AMP should be the document feeding the Status and Condition Report so developing new guidelines or revisions should be part of this exercise.
The TEAM PLAN financial forecast model also contains more detailed information about asset condition and replacement value because it takes assets down to a more detailed level in some cases. The TEAM PLAN model is where the data for the Status and Condition report now comes from. So any additions or changes to the physical asset inventory, attributes, useful life, condition, replacement value, or maintenance needs of assets needs to be fed into TEAM PLAN to keep our knowledge of our assets current.
Tables of the attributes that are available in TEAM PLAN or that can be populated and used for budget forecasting but that have not been populated yet are included in Appendix A. For those who would like to learn more about the capabilities of this budget forecasting tool, see Asset Management for a demonstration.
4.1. Likelihood of Failure Recommended verbiage for starting this sub‐section:
“The Likelihood of Failure (LoF) used by Asset Management ranks the condition of each asset on a scale of 1 to 5 with 1 being a {asset name} in excellent condition and 5 being a {asset name} in poor condition.”
The first steps are to determine a list of factors that affect asset condition and determine the useful life of the asset. Tanks, for example, may have a useful life of 100 years and condition is affected by corrosion, roof, column and weld condition and other factors (see tank condition assessment tableau in section 4.5).
PWB Asset Management uses a Likelihood of Failure (LoF) rating scale of 1 to 5 (1 is in excellent or new condition, 5 is in very poor condition). For Bureau wide condition ratings the following table is a guideline used for all assets:
Guidelines for an Asset Management Plan Page 10

CLEM Likelihood of Failure (Asset Condition) rating
Likelihood Rating
Recurrence Interval for a Single Asset Failure (years)
Failure Rate of a Population
5 <= 5 years 0.34 5 - 20 years 0.13 20 - 50 years 0.032 50 - 100 years 0.0131 >> 100 years < .01
In many instances, assets may not last 100 years, or even 50 years, and therefore could only be rated at the lower upper ends of the condition rating. For example, a meter may have an expected life of < 20 years and therefore a brand new meter in the ground would be given a condition rating of “4” until it had only 5 years of expected useful life at which point it will be given a condition rating of “5”.
The bureau‐wide (CLEM) condition scale will have to be modified relative to the maximum expected useful life of an asset if that asset has an expected useful life of less than 100 years. The scale may be from 2 to 5, or 3 to 5 or even a smaller range depending on the maximum useful life of the asset and where it fits on the above CLEM table for asset condition.
In many instances the bureau‐wide scale may not suffice for a particular program when we are using asset management principals to determine maintenance, rehabilitation and replacement strategies. In the cases where a particular asset condition does not have an expected useful life of 100 years or more, the AMP program team should develop their own LOF or condition rating scale that utilizes the full 1 to 5 range.
In the above case, create two LOF tables; 1) using the CLEM likelihood of failure rating and the asset group does not use the full 1 to 5 ratings, then create 2) a second likelihood of failure rating for the asset group utilizing the full 1 to 5 ratings.
If other studies/inspections have been done on asset conditions list those and compare their scale and ratings to the asset management ratings. Include any internal inspections (i.e. the Senior Design Engineer inspects tanks internally every 5 years when they are being cleaned, OEs visit pump stations every x days/weeks, etc.)
List any condition that an asset has in poorer condition than the average rating. Those parts of the asset in worst condition should be listed with an assessment. In some cases, one part of an asset in poor condition may drive the overall condition. For example, if all parts of tank except the roof are in good condition (“2”) but the roof is in poor condition (e.g. a “4”) then it may be appropriate to list the condition of the tank as a “4” because it is a critical part of the tank and if
Guidelines for an Asset Management Plan Page 11

left unrepaired then the life of the tank will be greatly reduced. The tank would return to a condition of “2” once the roof is repaired.
Examples:
Pump Station – condition assessment was conducted by a consulting firm for 32 pump stations as part of the Distribution System Master Plan. A condition rating scale from 1 (bad) to 10 (excellent) was applied. Twenty‐one pump station system components were evaluated as part of a Level 1 assessment; a more detailed Level 2 assessment of the structure and/or electrical system was conducted at 11 of these pump stations. The DSMP rating set the minimum acceptable condition index (MACI) at a rating of 4 (i.e. at “4” the pump station is no longer considered to be in acceptable condition and should be replaced). This 4 – 10 scale that was used for both pump stations and tanks, converted into the AMP 1 – 5 ranking is summarized in the example below:
Example of DSMP tank inspection rating numbers (converted to 1 – 5 scale):
Cond. Rank Definition
1. Sound physical and operating condition. Meets all requirements for functionality, safety, and regulations. Operable and maintained. Expected to perform adequately with routine maintenance for 10 years.
2. Acceptable physical and operating condition. Exhibits signs of minor wear that results in minimal impact on performance and/or operating and maintenance costs. Minimal short‐term failure risk. Potential for further deterioration or impaired performance over next 5 to 10 years. Minor corrective maintenance required, if any.
3. Average repair history. To restore to CR 8‐10, improvements between 5‐20% of replacement value are needed for improved performance, efficiency, regulatory or code compliance.
4. High incidence of repairs. Improvements needed within 2‐5 years to maintain reliability and/or function of item. Renewal/upgrade of whole component systems likely more cost effective than continued repair/maintenance of existing equipment/systems. Investment of 20‐50% of replacement cost is required to restore CR to 8‐10).
5. Asset in unserviceable or repair so involved or difficult as to be non‐cost effective, near total failure, replacement required avoiding total loss of function of item. Investment of 50% or more of replacement cost required restoring component to CR of 8‐10.
Guidelines for an Asset Management Plan Page 12

If a scale of 1 – 5 is not robust enough for our purposes the AMP team may decide to use scale fractions (tenths, e.g. 3.1, 3.2, etc.; or by using half or quarter fractions).
The DSMP also gave a general guideline on tank condition classifications based on inspection results. This ranking could be revised for different assets using the general guidance for tank condition classification.
Example of DSMP tank condition ranking scale based on inspection results:
Cond. Rank Definition
1. Good Condition: Tanks in this group are generally in good condition and do not require near‐term attention.
2. Minor Deficiency: Tanks included in this group have components with minor deficiencies that do not require immediate repair.
3. Maintenance Repair Required: Tanks included in this group have components that require immediate repair.
4. Structural Attention Required: Tanks included in this group experience serious structural damage and require in‐depth structural evaluation.
5. Tank condition is very poor: Tanks included in this group experience severe structural damage and must either be rehabilitated or replaced. Cannot be used further either due to safety or reliability reasons.
TEAM PLAN uses condition to forecast when various assets will require rehabilitation or replacement. Each asset can be given a 1‐5 condition score (decimals between 1 and 5 are okay also), where 1 is new condition and 5 is failed or near failed. The model allows minimum condition triggers to be established for each asset, which can be automatically assigned based on the value of another variable, like size or criticality or vulnerability or consequence. Services for example are basically run to failure assets – when they break we fix or replace them, we don’t do any inspection or rehab on them or advance replacement. However, there are some critical services, for example those that supply hospitals, where we might want to inspect them and replace before they actually fail. These would be given a minimum condition of 3.5 or 4, and the model then triggers a replacement when the asset reaches this condition instead of waiting until it gets to 5. We could also schedule periodic inspections under the Pm area and put a cost in for that and if we did that for all assets that need periodic inspections, TEAM PLAN could forecast how much staff we need to do all of our preventative maintenance work
Guidelines for an Asset Management Plan Page 13

on the schedules we establish. The same can be done for corrective maintenance and rehabilitation and replacement.
Different curves are available for condition deterioration and for allocating the costs of operations, corrective and preventative maintenance, and rehabilitation and replacement. The costs for these items will then be adjusted based on where the asset is in its lifespan. For example if the minimum value for operations of an asset is set at 1% of capital cost, then TEAM PLAN starts out at 1% and increases the percentage following the selected curve until at the end of the assets life, this cost may be 5 or 10%, depending on which curve is chosen. It is possible to leave the rate as constant over the asset’s life if desired by not selecting a flat curve with no slope. Right now, only capital and rehabilitative costs are populated in TEAM PLAN. No effort has gone into modeling other operations and maintenance activities, though it is the hope that this will occur as we continue through our asset management planning endeavors.
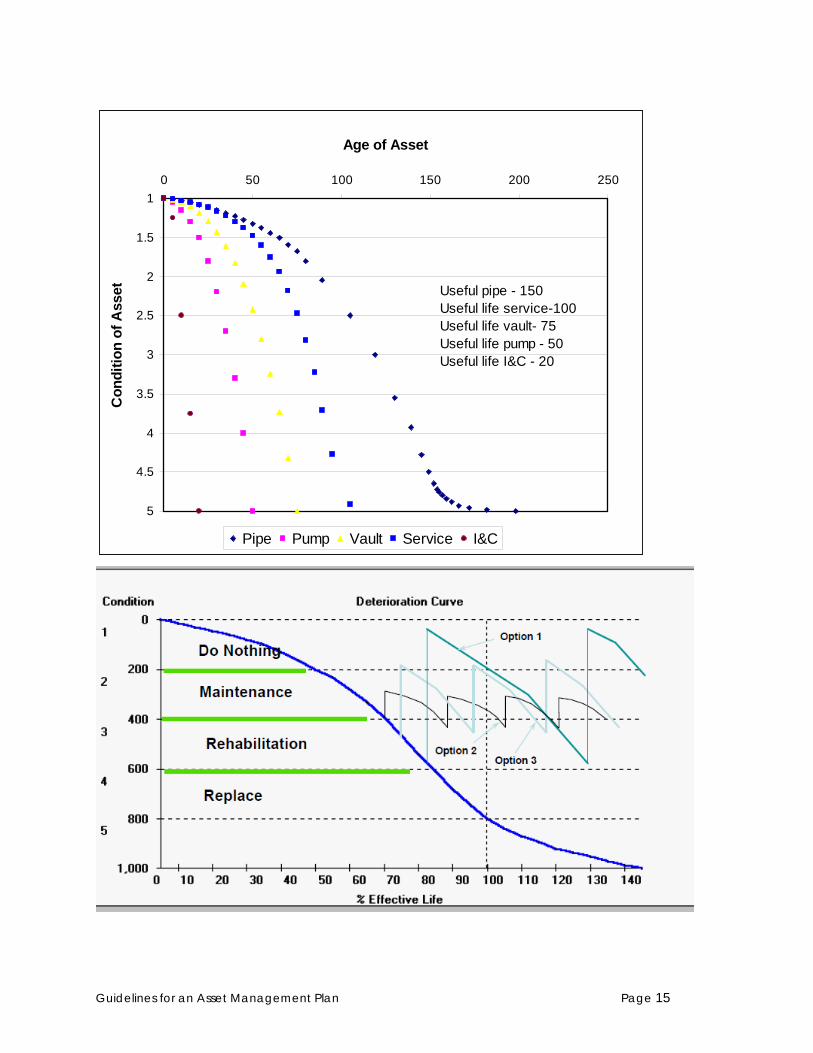
An example of the various condition curves available for forecasting asset deterioration in TEAM PLAN is shown below in Figure ___. The pipe curve is an S‐shape because there are always those few stalwart pipes that outlast all the others. Most assets follow the typical concave down shape. Short‐lived assets and those that wear relatively uniformly with use (tires for example) tend to be pretty linear in condition deterioration. For assets with maintenance or rehabilitation occurring periodically, the ongoing condition curves would follow a pattern of falling condition and restoration as shown in Figure ___. As can be seen, each time the asset is rehabilitated, the condition returns to nearly the same condition that existed prior to the refurbishment action.
Guidelines for an Asset Management Plan Page 14
1
1.5
2
2.5
3
3.5
4
4.5
5
0 50 100 150 200 250
Age of Asset
Con
ditio
n of
Ass
et
Pipe Pump Vault Service I&C
Useful pipe - 150Useful life service-100Useful life vault- 75Useful life pump - 50Useful life I&C - 20
Guidelines for an Asset Management Plan Page 15
The second figure above provides an example of potential condition changes from various types of interventions (inexpensive frequent maintenance or minor rehab at condition 3 ($400), more intense rehab at condition 3.3 ($500), a major rehab/near replacement at condition 4 ($600), or a full replacement at condition 5 ($800).
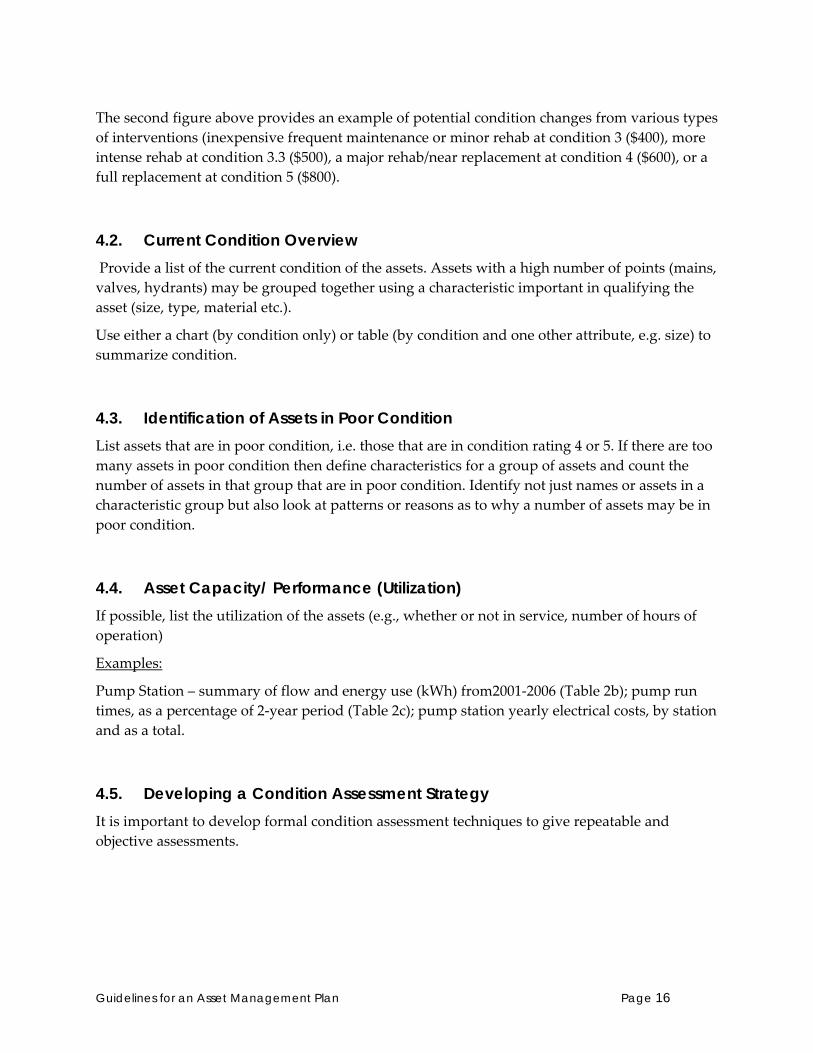
4.2. Current Condition Overview Provide a list of the current condition of the assets. Assets with a high number of points (mains, valves, hydrants) may be grouped together using a characteristic important in qualifying the asset (size, type, material etc.).
Use either a chart (by condition only) or table (by condition and one other attribute, e.g. size) to summarize condition.
4.3. Identification of Assets in Poor Condition List assets that are in poor condition, i.e. those that are in condition rating 4 or 5. If there are too many assets in poor condition then define characteristics for a group of assets and count the number of assets in that group that are in poor condition. Identify not just names or assets in a characteristic group but also look at patterns or reasons as to why a number of assets may be in poor condition.
4.4. Asset Capacity/ Performance (Utilization) If possible, list the utilization of the assets (e.g., whether or not in service, number of hours of operation)
Examples:
Pump Station – summary of flow and energy use (kWh) from2001‐2006 (Table 2b); pump run times, as a percentage of 2‐year period (Table 2c); pump station yearly electrical costs, by station and as a total.
4.5. Developing a Condition Assessment Strategy It is important to develop formal condition assessment techniques to give repeatable and objective assessments.
Guidelines for an Asset Management Plan Page 16

Guidelines for an Asset Management Plan Page 17
Condition Assessment Recommendation from Asset Management Work Plan for the Organization (WPO):
Recommendation 1: Perform overall planning for condition assessment through AMP development. This will be responsibility of the AMP Co-Leads.
All asset types should be reviewed with respect to an approach to condition assessment. This review should take place as part of the development of an Asset Management Plan, and should be scheduled in the next 2 years, in most cases.
Older and more critical assets usually require more frequent condition assessments. Typical asset condition questions to be considered when preparing an assessment strategy are:
• When was the asset constructed / rehabilitated / replaced?
• Where is the asset / component in its life cycle?
• What is the asset’s theoretical effective life?
• What is the estimated residual life until rehabilitation and/or replacement is necessary?
• Has the asset been inspected physically and by what process?
• How can the asset’s deterioration be predicted?
• How can the asset’s failure be predicted?
• How could planned maintenance prevent the asset’s failure or extend the time to failure?
• Can the asset be rehabilitated and at what cost?
• What level of service will the asset deliver once rehabilitated and for how long?
• Is the asset technically or commercially obsolete?
• Are asset condition gradings appropriate and relevant?
• Are asset condition monitoring processes effective?
Condition assessments should take account of physical integrity and address the expected failure pattern. The Distribution System Master Plan (DSMP) developed criteria for condition assessments on certain assets. Below is the criteria developed for tank condition assessment and a sample inspection sheet from the Arnold tank #1 inspection. Following is also a proposed grading scheme for valves.
The AMP Team should develop recommendations on a condition assessment strategy and state those concisely in this section

Detail Condition Criteria from DSMP
Guidelines for an Asset Management Plan Page 18

Guidelines for an Asset Management Plan Page 19

Proposed Grading Scheme for Valves
This version of the condition grading table includes a report of whether shutdown was achieved during assessment. If attempted, the response could be any of the first 3 choices listed. • YES – Shutdown Completely Successful • SOME – Shutdown Partly Successful • NO – Shutdown Not Successful • UNKNOWN – Shutdown Success Unknown • N/A – Shutdown Not Attempted
Or • SHUTDOWN SUCCESSFUL
o COMPLETE (LESS THAN X gpm LEAK BY ESTIMATED) o GOOD – SOME LEAK BY (LESS THAN Y gpm LEAK BY ESTIMATED)
• SHUTDOWN ATTEMPTED, BUT NOT SUCCESSFUL
o UNCLEAR – NOT SURE IF SHUTDOWN WAS ACHIEVED o BAD – CANNOT GET SHUTDOWN
• SHUTDOWN NOT ATTEMPTED
o N/A – SIMPLY NOT ATTEMPTED, TRY LATER o IMPOSSIBLE TO EVEN TRY, NOT RECOMMENDED
CONDITION
RATING Condition Maintenance
1 Excellent/ Very Good
New / works great. Minimal or no
maintenance necessary.
Minimal or no maintenance necessary. YES • COMPLETE NO N/A
• COMPLETE
• GOOD• UNCLEAR
• COMPLETE• GOOD• UNCLEAR • N/A
4 Poor
Valve is partially operable, has significant
deterioration or is obsolete.
Likely that valve will fail in very near future. Rehabilitate if possible. MAYBE • UNCLEAR YES TO RESTORE/
REPLACE
5Very Poor/ Inoperable/ Inaccessible
Valve has failed or could not be operated/
replacement required. Inaccessible/paved over.
Rehabilitate if possible or Replace. Provide access. NO IMPOSSIBLE YES TO RESTORE/
REPLACE
YES MAYBE TO MAINTAIN
NAMEOPERATED
(Isolation Valves)ACHIEVED SHUTDOWN
(Isolation Valves)CREATE WORK
ORDERREASON FOR
WO
2 GoodMinor defects only. More difficult to operate but still
seats.
Normal preventative maintenance/ minor corrective maintenance
necessary or to optimize performance and restore it to near
new condition
TO RESTORE3 Fair/ OperableModerate deterioration. Hard to turn, leaks or
setting waivers.
Significant corrective maintenance and/or partial
refurbishment/replacement to restoreit to good condition.
YES YES
Was valve accessible?
Was valve operated?
Was valve operable?
Guidelines for an Asset Management Plan Page 20

5. Failure Modes and Asset Life
5.1. Failure Modes In this section, consider the four key ways in which an asset will fail:
Capacity: demand for service exceeds capacity of asset or network of assets
Performance: the asset is unable to perform reliably or meet service levels (this category includes obsolescence, and failure to meet regulatory requirements)
Cost‐of‐service delivery: this category applies to assets that are unacceptably expensive to operate, and should be replaced or disposed.
Physical mortality (deterioration): the most common failure mode category. Our deterioration curves and risk of asset failure analysis are primarily developed with this failure mode category in mind.
Pump station failure modes were given two primary modes of failure, as seen in the example below:
Example of pump station failure modes:
Performance and/or physical mortality: The most common reported failures have been tabulated, in five areas: pumps, electrical system, mechanical piping, building structure, and telemetry/SCADA.
Capacity: As fire flow requirements increase and/or population density increases a pump station may be deficient in delivering the required fire flow.
The table below shows examples of different modes of failure from the CLEM analysis for various asset types.
Guidelines for an Asset Management Plan Page 21

Example failure modes for different assets – from CLEM Working Table:
Asset / Project Name Failure Mode
Mt. Tabor Reservoirs 1 & 5 PWB does not meet EPA requirements for covered terminal reservoirs because open reservoirs are still connected to potable water system
Westside Header, over I-5 at Corbett Crossing (part of Corbett-Moody?)
24" steel pipe break due to soil movement near bridge
NW Yeon - NW Nicolai to NW Kittridge bypass bridge
Multiple leaks from corrosion pitting
Vernon 270 Supply Tanks not decommissioned. Water quality issue from poor turnover.
Billing Xerox Printer Equipment failure ‐ unable to print bills for more than 15 days
5.2. Service Demands Describe the current demand loads placed on assets, if applicable. This may be more important in PS, tanks or meters but less pertinent to valves or mains. For assets where the demand is pertinent to its performance, use Load Scenario Tables (from Engineering Planning) or other data that compare capacities to the demand placed on assets for various scenarios (peak day + fire flow, for example).
Demand Forecast (for new assets; system capacity changes – potential asset failure mode)
New requirements (including new regulations)
Obsolescence (new technology – another asset failure mode).
5.3. Asset Deterioration and Condition Failure What kind of deterioration path does the asset follow? Deterioration may be linear or non‐linear (example of having slow deterioration and then deteriorating more rapidly after a certain point in time). Estimating a deterioration curve(s) is important to predicting major rehabilitations and replacements.
Guidelines for an Asset Management Plan Page 22

Sample Asset Decay Profile1
2
3
4
50% 20% 40% 60% 80% 100%
Percent Effective Life Elapsed
Con
ditio
n Sc
ore
5.4. Effective or Useful Asset Lives Establishing an effective useful life is important when estimating the benefits and costs of a proposed project and its alternatives. Therefore, use data and industry standards to estimate the useful life of an asset for PWB.
An asset’s useful life will depend on a number of factors that include material, construction method, design criteria, location, loading, pressure, environmental condition and level of maintenance. For example, concrete and steel tanks may have different life cycles and an estimate for each should be given. Even concrete tanks that are buried or above ground may be different in their expected useful life. Take into account all characteristics that may affect the longevity of an asset and estimate useful life based on those characteristics.
Assets will have failure rates that are often estimated using Weibull analysis. Figure 1 below (from the Distribution Mains AMP) shows the useful life analysis for CI pipe, comparing the break rates on pipes of different ages to Weibull failure curves. Table 4 below summarizes useful lives for different types of pipe.
Guidelines for an Asset Management Plan Page 23

Weibull curves vs CI Failure Rates
0.0000
0.0010
0.0020
0.0030
0.0040
0.0050
0.0060
0 20 40 60 80 100 120Age of Pipe
% o
f Fai
led
Segm
ents
Failure Rate on pre 1900 Pipe Failure Rate 1900-1904 Pipe Failure rate 1905-1909 PipeFailure Rate on 1910-1914 Pipe Failure Rate on 1915-1919 Pipe Failure Rate on 1920-1924 PipeFailure Rate on 1925-1929 Pipe Failure Rate on 1930-1934 Pipe Failure Rate on 1935-1939 PipeFailure rate 1940-1944 Pipe Failure Rate on 1945-1949 Pipe Failure Rate on 1950-1954 PipeFailure Rate on 1955-1959 Pipe Failure Rate on 1960-1964 Pipe
200 year, skew 3
200 year, skew 2
150 year, skew 3
150 year, skew 2
100 year, skew 2
100 year, skew 3
Anomaly - 1983 (construction-related breaks
250 year, skew 3
250 year, skew 2
175 year, skew 2
175 year, skew 3
300 year, skew 3
125, skew 2
125, skew 3
Figure 1 Weibull graph showing leak rates of CI pipe vs age of pipes.
The above curves show that the current leak rate for older CI pipe is below the Weibull failure prediction curve for a Mean time to failure (MTTF). of 200 years, skew 3. The data most closely follows the 300 year, skew 3 curve. Younger pipe is failing at a higher rate and sooner. Failures lie between the 175 and 150 year, skew 3 curves.
Table 4 (Distribution Mains AMP): Useful Lives for Various Mains Materials
Pipe Material Useful Life Estimate
CI, Constructed before 1930 250 years CI Constructed between 1930 and 1954 175 years CI, Constructed 1955 or later 125 – 150 years Concrete Cylinder Pipe (CCP), cathodically protected 200 years + DI pipe, Constructed 1955 to 1965 (transitional material) 150 – 175 years DI, Constructed 1966 or later 200 years
Guidelines for an Asset Management Plan Page 24

Asset replacement forecast. Use a chart or table or both to show when assets (or groups of assets) will be replaced. Forecast until the end of the useful life of the asset furthest out for replacement.
Is there a minimally acceptable condition? Some assets can be run to failure, while other assets should be replaced or rehabilitated long before they fail. This is usually a function of the criticality or consequence of failure. If the consequence of failure is high, e.g. the ground water pump station, then rehabilitation or replacement will occur before the asset has reached the end of its mechanical life. If the mechanical life of the pumps at ground water are 80 years (longer than normal due to low usage) but the minimum acceptable condition is a 3 due to risk, then the pumps will be replaced sooner, maybe in 30 or 40 or 50 years.
If an asset will have rehabilitations (minor and/or major), the interval for rehabilitations should be established. Cost estimates for rehabilitations and replacements is estimated in Chapter 8.
Example of pump station useful life:
Motor Rehabilitation 20 years Motor Replacement 50 years
Pump Rehabilitation 25 years Pump Replacement 80 years
Building Rehabilitation 50 years Building Replacement 80 years
5.5. Actions to Extend Useful Life Describe actions that may extend useful life including rehabilitations. A description of the action should be included, i.e. what does a motor rehabilitation entail. Other useful life extending action may not be rehabilitations per se, for example cathodic protection on pipes or steel tanks.
Provide estimates of the magnitude of that life extension. Cathodic protection may add on 40 or more years to the life of a pipe or tank. How much do these actions cost? Painting a tank periodically is likely to extend the life of the tank another 20‐25 years. Lining a pipe with cement mortar, epoxy, with an inserted pipe or other similar product could extend its life indefinitely at half the cost or less of full replacement. Joint bonding can now be done from the pipe interior for pipes 30 inches and over and possibly even down to 24 inches, so don’t assume that the only fix for a deteriorated asset is to completely replace it. Technology is advancing rapidly and there are a multitude of new products and construction techniques on the market for rehabilitation of aging assets. Be creative in thinking about the best approach for treating
Guidelines for an Asset Management Plan Page 25

various assets and under what conditions each treatment makes sense. For example the hassle associated with cutting out services and avoiding gates may make lining of a small distribution main uneconomical but installing a “pipe within a pipe” may make perfect sense for larger pipes with few connections, particularly since the older, large pipes are generally the most durably built pipes in the system.
6. Business Risk Exposure
6.1. Consequence of Failure (CoF) Recommended verbiage for starting this sub‐section:
“The Consequence of Failure (CoF) used by Asset Management ranks each asset on a scale of 1 to 5 with 1 being a {asset name} with very little consequence to the PWB, our customers or the community and 5 being a {asset name} that would have severe consequences. As with triple bottom line (TBL) methodology, we need to think not only of consequences to the PWB alone, but consequences to our customers and to the community at large. Consequences include financial, social, and environmental as well on the impact to the level of service.”
As with LoF, it may be that some assets have limited consequence and will not use the entire 1 to 5 scale that the bureau‐wide rating will use. This section will rank the consequence of failure based on importance to the asset category and then to the overall impact on the PWB. (example: a large meter that measures consumption of > 10,000 ccf/year would be a 5 when considered in the large meter category, but for the bureau as a whole the failure of this meter only ranks a 3.
The Consequence and Likelihood Evaluation Matrix (CLEM) table for consequences is given in Appendix B at the end of this document. The table lists consequences by category (water quality, supply continuity, etc.) and provides examples for events and the rating for the event. It is up to the AMP team to identify and list the most likely failure scenario(s) and the outcome of each event.
The CLEM consequence table in Appendix B is a guideline to help establish where the consequence will rate on the 1 – 5 consequence of failure scale. Not all categories have dollar values for their associated consequence, but there are theoretically similarities of dollar impact within a consequence rating. For example, a health and safety tier 3 has a consequence of between $1 million and $5 million. We can assume dollar impacts for other failure events estimated to be a tier 3 will fall within this range. The AMP team will have to decide where in
Guidelines for an Asset Management Plan Page 26

the range the particular event listed for their asset will fall if they want to narrow the range or have a single point dollar figure for their impact valuation.
For asset categories that have a maximum consequence that is less than that considered in the bureau‐wide ranking (i.e. they will have a range of 1 to 4 or narrower), then the AMP team can develop their own 1 to 5 ranking for that asset group. Having a second consequence ranking for the asset group will be useful when developing maintenance, rehabilitation and replacement strategies for that particular asset group.
TEAM PLAN relies on 1‐5 consequence ratings within a particular asset group to decide when individual assets should be replaced with respect to one another. Two of the factors that may be used to influence the consequence rating are the criticality of this individual asset in comparison to other assets within that group and the vulnerability of the asset to different natural hazards as compared to other assets in the group. TEAM PLAN includes a field for a vulnerability rating. Right now it is set up as either the asset is or is not vulnerable (1 or 0), but a scoring system could be developed. It also includes a field for a 1‐5 criticality score (1 = not critical, 5 = critical). An asset that is critical and vulnerable would have a high consequence rating. TEAM PLAN uses consequence and likelihood (or condition if likelihood isn’t populated) to establish asset risk. Maximum allowable risk trigger can be set up to cause a rehabilitation or replacement of an asset when the trigger is exceeded. Tolerable risk levels would be set lower for critical assets and higher for those that are of less importance. The risk rating triggers should be commensurate with the CLEM scale consequences between asset classes because the goal is to minimize the total system wide risk. Therefore even the most critical water service in the system should not have a risk trigger that is lower than the risk trigger established for Bull Run Dam 1, for example.
‐ ‐ ‐ ‐ ‐ ‐ ‐ ‐ ‐ ‐ ‐ ‐ ‐ ‐ ‐ ‐ ‐ ‐ ‐ ‐ ‐ ‐ ‐ ‐ ‐ ‐ ‐ ‐ ‐‐ ‐ ‐ ‐ ‐ ‐ ‐ ‐ ‐ ‐ ‐‐ ‐ ‐ ‐ ‐ ‐ ‐ ‐ ‐ ‐ ‐
List the most likely events that would happen for each asset or group of assets. Once the events are identified, the outcome of the event(s) needs to be evaluated and quantified. Examples from the CLEM Working Table is given below:
Example of consequence rating:
Asset/Project Name
Failure Mode Consequence Rating
Calvary to Greenleaf Pump Main
Pipe fails due to landslide
3 ‐ Main supply to > 1000 services. Some supply from LinWit to Willalatin; Have to deal with landslide, temporary fix in less than 72 hours, but not less than 24 (3 for out of service criteria;
Guidelines for an Asset Management Plan Page 27
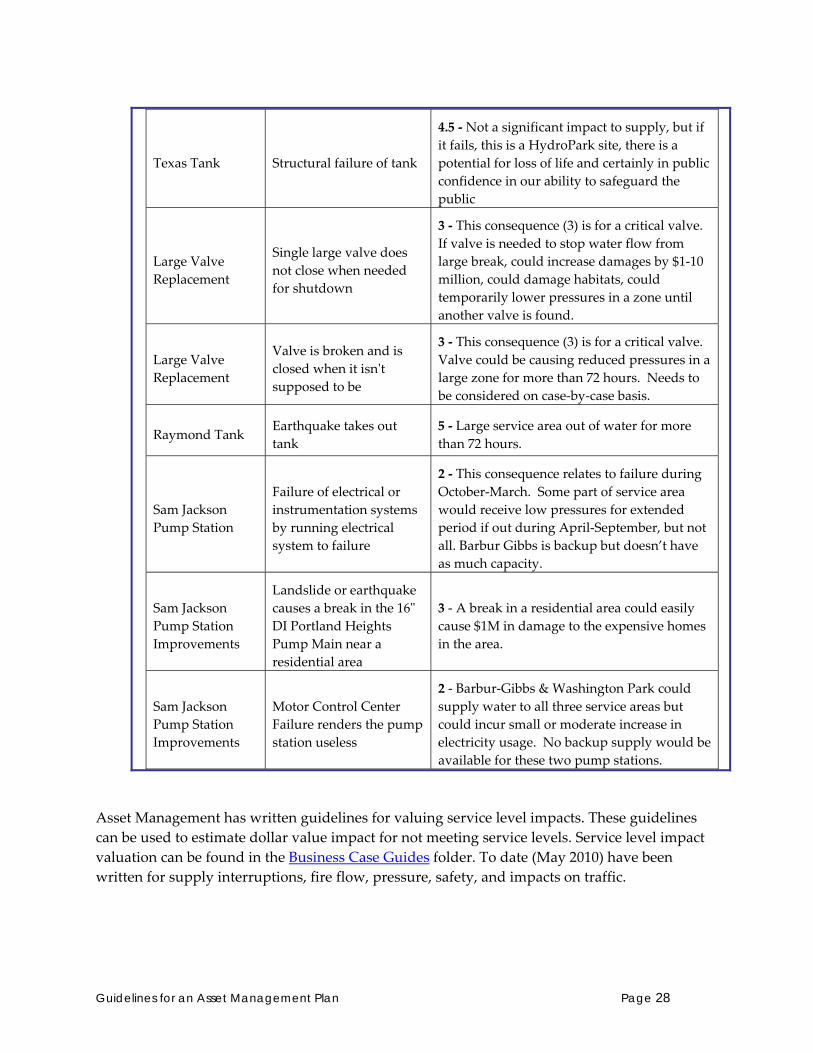
Texas Tank Structural failure of tank
4.5 ‐ Not a significant impact to supply, but if it fails, this is a HydroPark site, there is a potential for loss of life and certainly in public confidence in our ability to safeguard the public
Large Valve Replacement
Single large valve does not close when needed for shutdown
3 ‐ This consequence (3) is for a critical valve. If valve is needed to stop water flow from large break, could increase damages by $1‐10 million, could damage habitats, could temporarily lower pressures in a zone until another valve is found.
Large Valve Replacement
Valve is broken and is closed when it isnʹt supposed to be
3 ‐ This consequence (3) is for a critical valve. Valve could be causing reduced pressures in a large zone for more than 72 hours. Needs to be considered on case‐by‐case basis.
Raymond Tank Earthquake takes out tank
5 ‐ Large service area out of water for more than 72 hours.
Sam Jackson Pump Station
Failure of electrical or instrumentation systems by running electrical system to failure
2 ‐ This consequence relates to failure during October‐March. Some part of service area would receive low pressures for extended period if out during April‐September, but not all. Barbur Gibbs is backup but doesn’t have as much capacity.
Sam Jackson Pump Station Improvements
Landslide or earthquake causes a break in the 16ʺ DI Portland Heights Pump Main near a residential area
3 ‐ A break in a residential area could easily cause $1M in damage to the expensive homes in the area.
Sam Jackson Pump Station Improvements
Motor Control Center Failure renders the pump station useless
2 ‐ Barbur‐Gibbs & Washington Park could supply water to all three service areas but could incur small or moderate increase in electricity usage. No backup supply would be available for these two pump stations.
Asset Management has written guidelines for valuing service level impacts. These guidelines can be used to estimate dollar value impact for not meeting service levels. Service level impact valuation can be found in the Business Case Guides folder. To date (May 2010) have been written for supply interruptions, fire flow, pressure, safety, and impacts on traffic.
Guidelines for an Asset Management Plan Page 28

6.2. Business Risk Exposure (BRE) – Asset / Program Level
Business Risk Exposure at the Program Level vs. Business Risk Exposure at the Bureau Level
There are two levels of rating BRE. First, how important is a single asset within its class. Second is how important is a single asset to the bureau. The two rating scales for likelihood and consequence are discussed in the chapters above.
Example – a large meter failure is considered highly consequential to the Meter Shop and the meter program if that meter measures a large volume of water. However, the failure of the large meter, likely to be detected in 3 months or less, may only pose a medium or low risk to the overall bureau risk exposure.
Section 6.2 addresses risk exposure of assets at the program level. This section is optional only if the asset program ratings are different from bureau ratings and if having a separate, asset program specific BRE will help in developing maintenance and replacement strategies.
Section 6.3 addresses risk exposure of assets to the bureau. This section is mandatory as it is needed for PWB and COP for planning purposes.
Business Risk Exposure is the product of the likelihood and consequence of failure discussed in the previous sections.
Suggested text for starting this subsection, including graphic below:
“The risk (criticality) metric is a function of the consequences of failure and the probability of failure, as defined in the previous sections. The formula is defined as:”
Guidelines for an Asset Management Plan Page 29

BRE = CoF X PoF
Costs of the Consequences
of Failure
Consequence of Failue
(CoF)
Current Risk Cost
Business
Risk Exposure (BRE or
Criticality)
Probability Of
Failure (PoF)
Related to Condition,
Reliability & Redundancy
X=
(Criticality)
Implicit in the business risk exposure for the supply and distribution of water to a service area(s) is redundancy. If a pump station has a 50 year recurrence of being out of water for three days during a storm but can be supplied by another source such as a tank then the likelihood and/or consequence of the outage may change.
A BRE table will have both the likelihood and the consequence as the two axis in the matrix. As demonstrated below, the BRE rating of an asset and its identified possible failure has five levels of ranking from “Very Low” to “Extreme”.
Consequences Likelihood
1
Very low
2
Low
3
Moderate
4
High
5
Very high
Very low (1) VL VL L M M
Low (2) VL VL M M H
Moderate (3) L L H H E
High (4) L M H E E
Very high (5) L M H E E
Where: VL = Very Low M = Medium L = Low H = High M = Medium E = Extreme
Guidelines for an Asset Management Plan Page 30

Guidelines for an Asset Management Plan Page 31
Use the Likelihood of Failure (LoF) from Section 4 and the CoF from above to generate a table of the count of critical assets such as the one for Large Meters AMP Table 6.2. This example shows how meter BREs were evaluated for the 1 to 5 ranking within the meter asset program.
Business Risk Exposure: count of meters in each consequence and likelihood ranking (within the meter asset category ranking system)
Consequences Likelihood
1 2 3 4 5
Very Low (1) 2,082 995 173 20 24
Low (2) 85 936 327 56 67
Moderate (3) 0 141 147 25 26
Moderately-High (4) 0 22 54 12 12
High (5) 465 304 256 60 121
Provide a list of the critical assets identified as those “Extreme” BRE ratings. If appropriate and reasonable a list of assets with “High” ratings should also be listed. If assets are grouped into categories rather than listed individually due to their high number then the AMP can simply describe those assets that are found to be “Extreme” or “High” risk exposure.
6.3. Business Risk Exposure (BRE) – Bureau Level The Consequence and Likelihood Evaluation Matrix (CLEM) uses a likelihood and consequence of failure rating that is appropriate at the bureau‐wide level. An asset group will define its own likelihood and consequence scale of one to five that are relevant to asset failure but using the CLEM ratings will result in each asset being rated differently, as in the case of meters:
Business Risk Exposure: count of meters in each consequence and likelihood ranking (within the meter asset category ranking system)
Consequences Likelihood
1 2 3 4 5
Very Low (1) 3,088 240 16
Low (2) 1,184 700 8
Moderate (3) 758 414 2
Moderately-High (4)
High (5)
Bureau‐wide system CLEM analysis can be found in the CLEM Working Table. Below are some examples:

EXAMPLES of CLEM likelihood and consequence of failure rating system to determine risk exposure.
Asset/Project Name Failure Mode Likelihood Rating Consequence RatingCLEM Risk Rating
Risk Ranking
Recommended Next Steps
GW Transformer and Automatic Circuit Breaker
Failure of GW Transformer or Automatic Circuit Breaker during a 10 Day Turbidity Event
3 - Likely happen within the next 50 years
5 - New transformer or circuit breaker has a long lead time. City would not have water or would have to serve turbid water
Extreme 5
Forward to planning and GW Program Manager for more detailed evaluation
Westside Header, over I-5 at Corbett Crossing (part of Corbett-Moody?)
24" steel pipe break due to soil movement near bridge
3 - Soil movement already observed. Potential for landslide to take out pipe at end of bridge
5 - loss of life due to landslide on freeway Extreme 5 Forward to Planning
NW Yeon - NW Nicolai to NW Kittridge bypass bridge
Multiple leaks from corrosion pitting
4 - Pipe has had 6 leaks in past 20 years, despite adding cathodic protection in 1986. System is shorted and needs to be fixed.
3 - If the main is out of service north of NW 35th Avenue, supply to the St. Helen's Rd Industrial area from Washington Park would be reduced. These three lines feed a 24" and 16" to Saltzman, Linwit andWillalatin,
High 4
Fix shorts and isolation so that cathodic protection system works again.
Willamette Heights Tank
Loss of supply main on Thurman St. bridge
3 - 50 year event? Bridge is considered to be in poor shape and if it fails main could be unavailable for several days to several weeks.
4 - 250-1000 customers out of water for 72 hours or more. Damages/additional costs >5 million, major environmental damage probable.
High 4 Forward to Planning
Bertha Tank Tank has several water leaks 5 - Tank currently leaking
2 - Leaks will continue to get worse and may lead to eventual rebar degradation and catestrophic failure. Tank had poor visual appearance to customers/neighbors and may lead to complaints.
Medium 3 Repair Tank Leaks
Guidelines for an Asset Management Plan Page 32

7. Maintenance, Repair, and Replacement Strategies Maintenance Strategies can be divided into three categories:
• Condition assessment strategy • Preventive/predictive maintenance strategy • Reactive/responsive maintenance strategy
7.1. Current and Potential Activities Provide a list of the current and potential maintenance, repair and replacement strategies in this section. Those that are currently performed should be noted. This is an overview and more details should be provided in subsequent sub‐sections.
This section should also capture our response to high‐risk assets. Our response can involve monitoring (condition assessment), repair (e.g., a casing around an existing pipe of concern), or replacement.
This will link to section 8.4 Growth, Improvements, and New Requirements under the budget forecasting chapter.
7.2. Maintenance Strategies
7.2.1. Condition Assessment Strategies
This section should answer the following questions:
• How is it performed? How often is it needed? • Is there a different strategy for critical assets? • What is the cost of the task? What are the benefits? • What are the data collection needs and approach? • Is there a current inspection approach? • Does this document present a proposed condition assessment approach?
Example of OE valve condition assessment:
Currently, the condition of OE valves (at tank and pump station sites) are not kept in a data base and the actual condition of many valves is not known. Asset Management along with Operations will conduct a tank and pump
Guidelines for an Asset Management Plan Page 33

station valve condition assessment. The first step is a prioritization of the OE valves based on a BRE assessment. Then a plan will be developed for testing (optimally to test all sites within 5‐years) and then the valves will be tested. As an outcome of this project, a long‐term plan will be developed with budget funding and implementation guidelines and timelines.
Example of condition assessment of hydrants
Prior to 2009, the Hydrant Inspection Team worked each summer to inspect and test every hydrant in our system. Some deficiencies were resolved at that visit or follow‐up corrective work orders were created. These crews of seasonal workers with low levels of skill and knowledge reported to a Mechanic experienced in hydrant maintenance.
An evaluation of the existing program in the hydrant AMP considered:
• Not all hydrants need to operate (the key service level is that there is an operating hydrant within 500 feet of all service connections, and there is usually more than one hydrant that close), but more than 99% of hydrants do work.
• An annual inspection of all hydrants is probably unnecessary (how many hydrants have problems identified that prevent them from operating? How many of those with minor problems are not addressed and then inspected again the next year, when the same problem is identified?).
• Not all hydrants are of equal importance. About 20% of all hydrants are considered to have a higher consequence of failure because they are located near specific facilities. This ranking (where 5 is highest) has been suggested:
0 Noncritical Location is not near a critical facility.
1 Rail Location is within 50 feet of Rail: railroad, light rail, or streetcar.
3 School Location is within 500 feet of School: special education, head start, preschool & kindergarten, elementary school, middle school or other, skill centers & alternative, high school, or college or university.
5 Medical Location is within 500 feet of Medical Facility: nursing home, mental health facility, or hospital.
Guidelines for an Asset Management Plan Page 34

The recommendation is to inspect and record assessment of the non‐critical hydrants every three years (triennially), rather than annually. Inspect and record assessment of every critical hydrant annually.
One task in the AMP is to evaluate asset risks. Pipes in our distribution system have been evaluated in terms of the risk that failure poses to the water system and to society (through traffic disruption, damage to structures, environmental impacts, etc.). A service level requires that action be taken to mitigate high risks, or to better understand whether the risk is properly rated. The example below shows how this was applied to pipes with a large risk exposure:
Condition assessment of buried pipes or pipes on bridges
Pipe inspection provides a higher degree of confidence in estimates of the probability of failure. One strategy identified in the Distribution Mains AMP was to conduct a visual inspection of higher risk pipes on bridges. All pipes rating as medium, high or extreme risks are being inspected to confirm the condition. Among the results of the first condition assessment that were conducted: initially a high risk rating was assigned to the pipe on the SW 4th and I‐405 freeway crossing, but no concerns were found and the risk rating was reduced. In contrast, for the North Grand Avenue and I‐84 freeway crossing, it was originally a medium risk, but the 16” steel pipe shows signs of being under compression. It appears that a large force has been applied from the South causing the pipe segments to snake at the North end of the bridge. A work plan has been created leading to with immediate action being taken on the pipe.
7.2.2. Preventive / Predictive Maintenance Strategies
This section should answer the following questions:
• How is it performed? • How often is it needed? Is there a different strategy for critical assets? What is the cost
of the task? What are the benefits? • What are the data collection needs and approach? • Is there a current inspection approach? • Does this document present a proposed condition assessment approach?
Guidelines for an Asset Management Plan Page 35

Develop a strategy for preventive / predictive maintenance and estimate the budget needed to implement these. The budget forecast for this asset group, including all types of maintenance, rehabilitations and replacements will be collected and summarized in section 8.5 Forecasting Asset Condition and Funding Needs.
Example of pump station predictive maintenance strategies:
Current Predictive Maintenance Activities. Megger readings are conducted on motors at least once each year to check for insulation damage. Bearing temperatures are also measured and documented. Vibration readings and analysis is done to predict and solve alignment issues before the problem becomes severe enough to cause any damage. These vibration readings are taken and analyzed monthly to establish a normal baseline for each pump. The frequency of readings will probably be reduced once the baseline is clearly established and the schedule will likely reflect the relative importance of the various pumps, the type of pump it is, and the environmental conditions to which each pump is subjected. The fourth predictive maintenance activity is testing of transmission oil and filtering or changing it based on the test results.
Suggested Predictive Maintenance BMP’s. The AMP mentions the Federal Energy Management Program (FEMP) recommended maintenance regimes. A checklists for other maintenance tasks on the primary pumps and motors is also given in the AMP and includes tasks on lubrication, packing, cleaning, bearings and other work needed for a robust predictive maintenance program at pump stations. See the Pump Station AMP for full details.
Preventive Maintenance of Hydrants ‐ overhauls
A change was made in 2005 as part of the first hydrant program review by Asset Management to abandon the strategy of overhauling hydrants (replacing worn components and lubricating) proactively. Analysis showed the cost of the strategy of overhauling all hydrants on a 7.5 year cycle was about $500,000 annually, which would not avoid replacement occurring, but would avoid three types of repairs: hard to operate, stem leak, and base leaks. The total value of avoided repairs was estimated at less than $150,000 a year, far less than the cost of conducting the program.
Guidelines for an Asset Management Plan Page 36

Preventative and predictive maintenance typically occurs on a regular basis, i.e. monthly, annual, bi‐annual, etc. Some predictive maintenance may also be done for regulatory compliance.
Other example of preventative or predictive maintenance strategies:
• Tank cleanings every five years, • Regulator cleaning and overhauls every five years, • Valve exercising for large, critical valves every 2 – 4 years, • Conduit inspections.
7.2.3. Reactive / Responsive Maintenance Strategies
This section should answer the following questions:
• How is it performed? • How often is it needed? Is there a different strategy for critical assets? What is the cost
of the task? What are the benefits? • What are the data collection needs and approach? • Is there a current inspection approach? • Does this document present a proposed condition assessment approach?
Develop a strategy for reactive / responsive maintenance and estimate the budget needed to implement these. The budget forecast for this asset group, including all types of maintenance, rehabilitations and replacements will be collected and summarized in section 8.5 Forecasting Asset Condition and Funding Needs.
Guidelines for an Asset Management Plan Page 37

Example of pump station reactive maintenance strategies:
Reactive maintenance is basically the “run until it fails” maintenance mode. Little or no action is taken to maintain the equipment.
The advantages to reactive maintenance include saving money and labor in the short term by avoiding maintenance of new equipment. The downside is a harsh reality. During the period of non maintenance we are shortening the life of the equipment, resulting in an early need for replacement. If it is a critical pump station part we have to pay for a large inventory of repair parts or take the chance of a long down time.
Current Reactive Maintenance Activities. Many of the smaller pieces of equipment within a pump station are dealt with on a “run‐to‐failure” basis. Items like space heaters, air circulation fans, and sump pumps are generally not maintained but replaced when they quit functioning. Even with the current programs of preventative and predictive maintenance, there is still reactive maintenance needed for pumps and motors.
7.3. Repair Strategies This section should answer the following questions:
• How is it performed? How often is it needed? • Is there a different strategy for critical assets? • What is the cost of the task? • What are the benefits? • What are the data collection needs and approach? • Is there a current inspection approach? • Does this document present a proposed condition assessment approach?
Many assets will require repairs throughout their lives. This section should focus on the repairs of medium or significant importance and costs. A tank that is 40 years or older, for example, may periodically need some minor repairs that may cost several hundred dollars and do not significantly affect service levels or safety do not need to be detailed. But we may predict more significant repairs needed on a less frequently basis. Some general examples are given below:
Guidelines for an Asset Management Plan Page 38

General Examples of asset repair strategies:
Tanks – Depending on the tank type, location and other factors there may be repairs that we can predict will be needed throughout its life. Some tanks we know may have frequent vandalism and need painting on a more regular basis. Most tanks will need repairs to their ladders and safety equipment every 20 years. Depending whether a tank is steel or cement, buried or ground level it is reasonable to predict significant maintenance at different intervals (e.g. a steel tank at ground level may require major repairs valued at 5% ‐ 10% of its original construction cost every 20 or 30 years, or cathodic protection if it doesn’t have CP)
Large Meters – these meters need periodic testing and repairs. A maintenance strategy was developed based on several factors (total and annual consumption, previous test scores, and time since last test/repair) that established frequency of testing and repair work.
Mains – Asset Management has developed Weibull curves based on size and type of main that can be used to predict the probability of the first failure, or break, of a section of pipe. Once a section of pipe has its first break the likelihood of future breaks will increase. There is also a break‐even point of breaks per mile in which once a pipe reaches that point then replacement is the least‐cost life‐cycle alternative.
Develop a strategy for repairs and estimate the budget needed for repairs that are predicted through probability analysis or experience. The budget forecast for this asset group, including all types of maintenance, repairs, rehabilitations and replacements will be collected and summarized in section 8.5 Forecasting Asset Condition and Funding Needs.
7.4. Replacement Strategies This section should answer the following questions:
• How is it performed? • How often is it needed? • Is there a different strategy for critical assets? • What is the cost of the task? • What are the benefits? • What are the data collection needs and approach? • Is there a current inspection approach? • Does this document present a proposed condition assessment approach?
Guidelines for an Asset Management Plan Page 39

Example of large meter strategies:
Replacement of large meters is done on an economic basis. If we assume that the value of equity is equal to the dollar cost expended and revenue received, we can use a least cost life cycle approach to assess when a meter should be replaced. An economic analysis in the current AMP demonstrate that total consumption, number of repairs and the number of previously poor test results are the main criteria for identifying meter replacement strategies. When meter accuracy deteriorates more rapidly and repairs become more frequent the replacement strategy becomes one in which the future life cycle costs (including loss of revenue due to inaccuracy) are minimized.
Estimate the average useful life of an asset. This should be consistent with the deterioration curve in 5.3 above.
Example of pipe replacement strategy: A simplified decision making model for pipe replacement was applied to projects in the 903 budget program. For each project, historic leak data was assessed and used to project a number of repairs that were expected in the future. The avoided cost of those repairs were compared to the estimated replacement costs. As the figure shows, many of our proposed replacement projects are not justified in terms of the avoided cost of repair.
Example of pipe replacement strategy: A simplified decision making model for pipe replacement was applied to projects in the 903 budget program. For each project, historic leak data was assessed and used to project a number of repairs that were expected in the future. The avoided cost of those repairs were compared to the estimated replacement costs. As the figure shows, many of our proposed replacement projects are not justified in terms of the avoided cost of repair.
Guidelines for an Asset Management Plan Page 40

Develop a strategy for preventive / predictive maintenance and estimate the budget needed to implement these. The budget forecast for this asset group, including all types of maintenance, rehabilitations and replacements will be collected and summarized in section 8.5 Forecasting Asset Condition and Funding Needs.
7.5. Risk Cost Analysis Risk cost is a more precise estimate of BRE. Business cases often use risk cost analysis in their analysis (typically a part of either a benefit‐cost ratio or net present value).
In Risk Cost we assign dollar values to the consequence and express the likelihood of failure in probability terms, with a resultant dollar value on the risk cost:
Risk Cost ($) = Consequence ($) x Probability of failure (% or decimal)
Guidelines for an Asset Management Plan Page 41
Assets at the higher end of the BRE matrix (higher likelihood and consequence) should estimate the risk cost of the asset and compare the reduction in risk cost to the costs of remediation. Details of this analysis are provided in the Business Case Development Guidelines.
8. Budget Forecasting Budget forecasting pulls together information from the previous chapters. It requires knowledge of and estimations for asset condition, useful life, deterioration curves, maintenance strategies, rehabilitations and replacements.
8.1. Existing Capital Improvement Projects and Programs List the budgeted projects and associated assets. Include those in the CIP budget pipeline as well as ongoing projects and programs.
8.2. Recommended and Projected Activities for Maintenance List the recommended program activities for the asset group and associated budget. Preventative or predictive maintenance programs are likely to be on a regularly recurring rate, i.e. 12 times per year, annual, every 5 years, etc. If maintenance is not recurring annually then the recurrence interval and the years in which they will likely take place shall be estimated at intervals that best represent our best estimate of maintenance requirements. Projected program activities may include:
• condition assessment program budgets (and staff needs) • preventive/predictive maintenance program budgets (and staff needs) • reactive/responsive maintenance program budgets (and staff needs)
Maintenance activities should be listed in constant dollars. i.e. do not consider inflation for future years. However, if the units of maintenance increase (decrease) then multiply the number of units by the unit cost to get increasing (decreasing)costs over time.
8.3. Recommended and Projected Activities for Repair and Replacement From 7.3 above the predicted repairs and rehabilitations need to have cost estimates and forecast of when they will likely occur.
Estimate the useful life of the assets. This should be with the deterioration curve developed in section 5.3. Replacement cost is estimated in today’s dollars (not inflated to future replacement cost).
Guidelines for an Asset Management Plan Page 42
8.4. Growth, Improvements, and New Requirements Are there factors, external or internal, that may have an impact, positive or negative, on programs for the asset. If future demand, regulation, or other factors indicate that when an asset is replaced it may need to have its size / capacity increased then account for this in replacement cost estimates.
8.5. Forecasting Asset Condition and Funding Needs Forecasting of financial needs by predicting the rate of asset deterioration. It will become part of Team Plan and is used by PWB for budgeting purposes. The basic questions and issues to address in this section include:
• Forecasting of financial needs by predicting the rate of asset deterioration.
• How bad is the future in terms of system replacement needs?
• To what extent does that depend on what we do today in replacement and maintenance?
• Can we extend the useful life of assets by applying certain strategies?
TEAM Plan (Total Enterprise Asset Management Planning Tool) is the model we have (from GHD) to do all that. Given all the appropriate inputs, TEAM Plan is capable of developing long range budget forecasts for all operations, maintenance, rehabilitation and replacement for system assets. Currently the model is only populated to consider rehabilitation and replacement. Asset information fields, original data source, purpose of the field and whether or not the field is required to forecast capital needs effectively is shown in Table 1 in Appendix A. Table 2 in Appendix A shows the fields available and required for applying maintenance strategies to assets. These maintenance strategies tell the model what to do to an asset when it reaches a trigger point (risk too high, condition too low, etc), how much to improve the condition as a result of the intervention, etc. More detailed explanation of the use of TEAM Plan and a demonstration of how it works can be provided by Teri Liberator.
9. Performance Tracking The Water Bureau tracks and report on service levels, budget program targets, accomplishments and expenditures. Program Managers are expected to track and report on these issues.
Guidelines for an Asset Management Plan Page 43
Performance tracking is NOT part of the AMP which is only updated periodically (every couple of years). This section should describe the approach performance tracking, who is responsible for tracking performance, what the measurements or targets are (as part of the strategy developed in the AMP) and where the data is stored and maintained.
‐ ‐ ‐ ‐ ‐ ‐ ‐ ‐ ‐ ‐ ‐ ‐ ‐ ‐ ‐ ‐ ‐ ‐ ‐ ‐ ‐ ‐ ‐ ‐ ‐ ‐ ‐ ‐ ‐ ‐ ‐ ‐ ‐ ‐ ‐ ‐ ‐ ‐ ‐ ‐ ‐ ‐ ‐ ‐ ‐ ‐ ‐ ‐ ‐ ‐ ‐ ‐ ‐ ‐ ‐ ‐ ‐ ‐ ‐ ‐ ‐ ‐ ‐ ‐ ‐ ‐ ‐ ‐
A recent email from Janet Senior and Cecelia Huyhn describes the tracking and reporting for the burea:
The Water Bureau has been tracking and reporting budget program targets, accomplishments and expenditures for several years now. The ʺbudget program results reportsʺ are available at this web address: http://www.portlandonline.com/water/index.cfm?&c=46649. The most recent report covering the 1st and 2nd quarters of FY 09‐10 has been posted.
These reports have numerous purposes, including to:
1) Promote goal setting and performance tracking by bureau managers and supervisors
2) Increase information exchange and accountability within the bureau
3) Increase transparency and accountability to our stakeholders and customers (e.g., the citizen budget committee)
4) Facilitate prompt responses to inquiries from City elected officials and from the Office of Management and Finance
Nathan Walloch has been collecting the 22 program reports, compiling them into a quarterly update, and posting the update. Please let Nathan know if you have questions or need help.
The bureau‐wide ʺService Levelsʺ, as seen in the most recent Strategic Plan, also reports on the progress of meeting these service levels and results can be found at this site: http://www.portlandonline.com/water/index.cfm?c=31348&a=262337
Some of these service levels directly align with the program measures in the quarterly reports.
10. Improvement Plan and Data Requirements What data is needed for proper asset management purposes? What data is lacking. Where will the data be stored and how will it be managed. Any improvements should be specified and preferably with responsible parties and timelines.
Guidelines for an Asset Management Plan Page 44

Guidelines for an Asset Management Plan Page 45
10.1. Summary of Next Steps
10.2. Recommended Service Levels
10.3. Recommended Condition Assessment Work
10.4. Recommended Failure Modes Analysis
10.5. Recommended Risk Evaluations
10.6. Recommended Operational Changes
10.7. Recommended Maintenance Strategies
10.8. Recommended Repair and Replacement Strategies
10.9. Recommended Data Collection Actions

Appendices Example of possible appendices:
List of references – AMP guidance and AMP examples/references
Benchmarking, leading practice processes and practices
You can insert the System Hierarchy chart and other information here and/or provide hyperlinks.
See the Asset Management Template for a list of suggested and sample Appendices.
APPENDIX A – To Be Added at a Later Date
Guidelines for an Asset Management Plan Page 46

Appendix A Appendix A - Table 1. Fields in Asset Data Table in TeamPlan
Field Name Primary Data Source Explanation of Attribute Required Field?
Parent Asset
TeamPlan (sometimes = Synergen)
Sets up hierarchy of assets so that they appear under appropriate node and parent in the model screens and cost roll ups. Follows 6 major budget programs and 22 subprograms for its general structure Yes
NodeRef TeamPlan Sets up hierarchy of assets so they appear under appropriate node and parent in the model screens and cost roll ups. TeamPlan assigns
NodeRefName TeamPlan Sets up hierarchy of assets so they appear under appropriate node and parent in the model screens and cost roll ups.
TeamPlan can assign
NodeName TeamPlan Sets up hierarchy of assets so they appear under appropriate node and parent in the model screens and cost roll ups. Yes
AssetID
TeamPlan (sometimes = SynergenID and/or FACILITYIDGIS)
Needs to be a unique identifier for each asset or asset group in the hierarchy. Generally includes key attributes of group for group assets. Yes
SynergenID Synergen
Links TeamPlan asset to closest similar asset in Synergen. Not possible for grouped assets and may be for other assets, depending on how many levels Synergen has captured for a given asset type. For example, each road is one asset in Synergen; TeamPlan matches StreetSaver rating segments.
Not to run model, but yes if data linkages are desired
FACILITYIDGIS GIS
Links TeamPlan asset definitions to the closest similar asset in GIS. Not possible for grouped assets or for those that are not mapped in GIS
Yes to check for duplication.
AMID GIS
Links TeamPlan pipe assets to GIS pipe assets when FACILITYID has changed due to pipe splitting in GIS. Helps maintain synchronization between systems Yes for pipes only
MASTERSITEID OpsInfrastructure Links TeamPlan data to OpsInfrastructure assets where available.
helpful but not required
Asset Name
TeamPlan (sometimes = Synergen)
Generally matches name given to asset in OpsInfrastructure or Synergen or GIS. Since standardization hasn’t occurred between these systems for all assets, this field may be different between systems, and isn’t recommended for data matching. Use ID fields instead. Yes
Asset Description TeamPlan
Mostly unpopulated, but can be used to provide more detail about a particular asset than what is possible with its name field (for services, it spells out what is contained in a particular grouping for example). No
Address or Location OpsInfrastructure
Mostly unpopulated but through master site ID could be filled in using master site address in OpsInfrastructure. No
AssetClass
TeamPlan (sometimes matches Synergen)
A means to group assets of similar characteristics together and to select the appropriate management strategy to apply.
Yes if default management strategy uses this field
Guidelines for an Asset Management Plan Page 47
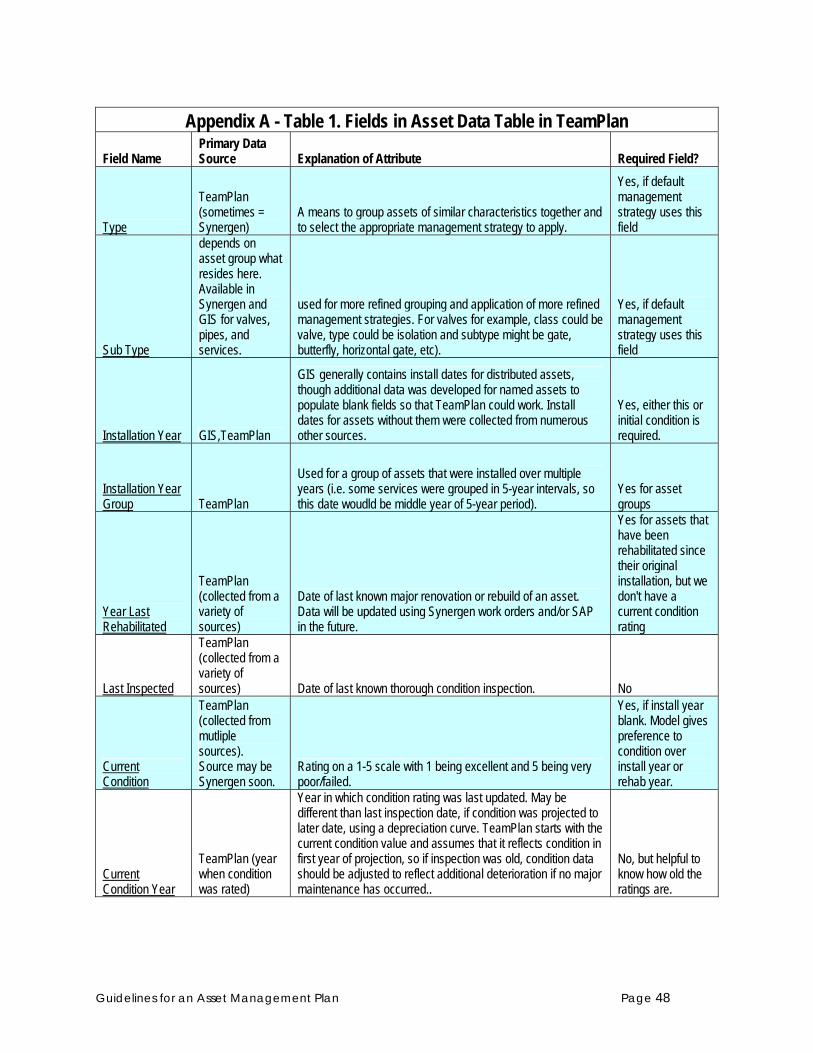
Appendix A - Table 1. Fields in Asset Data Table in TeamPlan
Field Name Primary Data Source Explanation of Attribute Required Field?
Type
TeamPlan (sometimes = Synergen)
A means to group assets of similar characteristics together and to select the appropriate management strategy to apply.
Yes, if default management strategy uses this field
Sub Type
depends on asset group what resides here. Available in Synergen and GIS for valves, pipes, and services.
used for more refined grouping and application of more refined management strategies. For valves for example, class could be valve, type could be isolation and subtype might be gate, butterfly, horizontal gate, etc).
Yes, if default management strategy uses this field
Installation Year GIS,TeamPlan
GIS generally contains install dates for distributed assets, though additional data was developed for named assets to populate blank fields so that TeamPlan could work. Install dates for assets without them were collected from numerous other sources.
Yes, either this or initial condition is required.
Installation Year Group TeamPlan
Used for a group of assets that were installed over multiple years (i.e. some services were grouped in 5-year intervals, so this date woudld be middle year of 5-year period).
Yes for asset groups
Year Last Rehabilitated
TeamPlan (collected from a variety of sources)
Date of last known major renovation or rebuild of an asset. Data will be updated using Synergen work orders and/or SAP in the future.
Yes for assets that have been rehabilitated since their original installation, but we don't have a current condition rating
Last Inspected
TeamPlan (collected from a variety of sources) Date of last known thorough condition inspection. No
Current Condition
TeamPlan (collected from mutliple sources). Source may be Synergen soon.
Rating on a 1-5 scale with 1 being excellent and 5 being very poor/failed.
Yes, if install year blank. Model gives preference to condition over install year or rehab year.
Current Condition Year
TeamPlan (year when condition was rated)
Year in which condition rating was last updated. May be different than last inspection date, if condition was projected to later date, using a depreciation curve. TeamPlan starts with the current condition value and assumes that it reflects condition in first year of projection, so if inspection was old, condition data should be adjusted to reflect additional deterioration if no major maintenance has occurred..
No, but helpful to know how old the ratings are.
Guidelines for an Asset Management Plan Page 48

Appendix A - Table 1. Fields in Asset Data Table in TeamPlan
Field Name Primary Data Source Explanation of Attribute Required Field?
Replacement Cost or Replacement Cost Formula
TeamPlan (collected from a variety of sources)
Replacement cost or unit cost formula to calculate total expected project level cost (not including indirect overhead) for each asset. Yes
RCUnit TeamPlan Establishes what RC is based on if it is a function of asset attributes (size, length etc.) rather than a fixed number Yes
Replacement Cost Year TeamPlan
Year that the RC rate was established (for escalation purposes)
No, but helpful to know when costs were last updated
Cost Source TeamPlan Who or what was used to develop the cost No
Replacement Asset (if other than original) TeamPlan
Used when CI or galvanized main is being replaced with a DI, for example
Yes if it changes MS, future costs, maximum life or rehab schedule.
Minimum Allowed Condition TeamPlan
How far down the condition scale an asset may go before rehabilitation or replacement takes place. For critical and/or vulnerable assets set to a smaller value (3 or 4) and for run to failure assets without rehabs, it would be 5. Yes
Maximum Potential Life TeamPlan
The longest period an asset can be expected to last, if all maintenance and rehabilitations are undertaken at the appropriate intervals. Yes
Rehab? TeamPlan True or False. Tells system which assets are supposed to get rehabs and which are run to failure. Yes
Maximum Number of Rehabilitations TeamPlan
Establishes how many times an asset can be rehabilitated before it must be replaced. Yes
Physical Effective Life TeamPlan
The length of time that an asset would last if it had no rehabilitations done on it. Generally set as slightly longer than the rehab interval.
Yes, if Rehab? =TRUE. Use default for type if not known
Rehabilitation Cost TeamPlan
Either a lump sum cost for an individual rehabilitation or a percent of replacement cost
Yes, if Rehab? =TRUE. Use default for type if not known
Rehab Cost Unit TeamPlan informs system whether the the Rehab cost is the total per rehab or if it is a percent of replacement
Yes, if Rehab? =TRUE. Use default for type if not known
Rehab Cost Year TeamPlan
The year of the calculation of the rehab cost (for future escalation purposes)
No, but helpful to know when costs were last updated
Operating Cost TeamPlan For assets like treatment, pump stations and tanks with significant operating costs
Not in use at this time. Populated in general terms for most pump station (power costs only)
Operating Cost Unit TeamPlan
per gpm, per KWhr, per run time hour, by percent of replacement or however costs are being reported.
Not populated. Annual figures provided for pump power use
Guidelines for an Asset Management Plan Page 49

Appendix A - Table 1. Fields in Asset Data Table in TeamPlan
Field Name Primary Data Source Explanation of Attribute Required Field?
Operating Cost Year TeamPlan Year in which operating costs were calculated.
Populated only for the pump station power costs
Maintenance Costs TeamPlan
Costs for corrective, predictive and preventative maintenance. Can be separated via the management strategy table, rather than including the total on the asset table.
Not populated. Maintenance costs for regulator rebuilds and tank painting, handled as rehabs. Maintenance here is annual, (things like changing oil or lubing bearings).
Maintenance Cost Unit TeamPlan
units in which costs are reported - annual total, per asset, per mile, etc. Not populated
Maintenance Cost Year TeamPlan Year in which maintenance costs were calculated. Not populated
Is the asset vulnerable? TeamPlan
This is a TRUE or FALSE field that can be used to influence other factors such as cost per unit, or consequence, or minimum allowed condition before replacement.
Only required for assets where this is a factor in the unit replacement cost calculation, like pipes.
CoF TeamPlan Consequence of Failure. Currently input as a 1-5 rating and only available for critical assets.
Populated only for a very small number of assets
CoF Year TeamPlan
The year in which the consequence of failure was developed. Eventually CoF will become dollar factors and this will be used for escalation.
Not being used at this time.
PoF TeamPlan Probability (likelihood) of failure. A annual percent (.01-1), or a 1-5 score.
Populated only for a very small number of assets
MinPoF TeamPlan
A preset trigger that will not allow an asset to go below a minimum probability level (1 in 100+ years, or a score of 1 on a 1-5 scale)
Populated only for a very small number of assets
Risk Value TeamPlan
Risk = PoF X CoF. For our model, typically this is a 1 to 5 rating for each value, so score ranges from 1 (lowest risk) to 25 (highest risk).
Not being used for most assets. If populated, risk trigger is first priority, followed by min condition, followed by reaching PEL/MPL.
Risk Trigger TeamPlan A maximum value of risk for a particular asset, that will trigger rehab or replacement if model is set to use it.
Not being used for most assets. If populated, model will use risk trigger as first priority, followed by min condition, followed by age-based deterioration).
Guidelines for an Asset Management Plan Page 50

Appendix A - Table 1. Fields in Asset Data Table in TeamPlan
Field Name Primary Data Source Explanation of Attribute Required Field?
Land Use Type GIS
Not currently in use much. Can be developed using GIS and used to influence costs, vulnerability, consequence, or likelihood or for selecting maintenance strategy. Not in use at this time
Count of Assets TeamPlan
Count of assets in each group based on GIS data as well as certain assumptions for assets that are missing particular fields needed to group them. Yes
Inventory Year TeamPlan Tells when the year when the data was last updated for this asset or asset group.
No, but helpful to know how old the counts are.
Inventory Source TeamPlan
Identifies the original data source used for establishing the inventory for that particular asset group. Possible values include SAP, GIS, Synergen, OpsInfrastructure, Status and Condition Report, Street Saver, or staff interviews.
No, but helpful to know where data came from
Depth GIS, Streetsaver for culverts
Mostly unpopulated, but can be used to influence cost calculations or management strategies when depth is known to be much greater than anticipated Not in use at this time
Depth Unit TeamPlan Tells whether depth is in feet or inches so calculations will work correctly
only if depth is not blank
Length
GIS, Streetsaver for culverts and roads
Length of a linear asset like a pipe, or service. Can also reflect the long side of a vault or the length of a road segment Yes for pipes.
Length Unit TeamPlan
Typically inches, feet or miles. Can use metric units if desired. Tells system what conversion needs to take place to enable calculations to be made.
Yes if a length is provided
Length Category TeamPlan
Unpopulated, but can be used to classify assets by short, medium, and long, or other groupings in the future to differentiate replacement costs better. Not in use at this time
Width various sources
Can be used in cost calculations. Currently only populated for roads and culverts, but could be used for pump station dimensions, vault dimensions, etc. to calculate costs more accurately. Not in use at this time
Width Unit TeamPlan Typically inches or feet. Tells system what conversion needs to take place to enable calculations to be made.
only if width is provided
Size various sources
Can be used by TeamPlan for unit cost calculations. Mainly from GIS for distributed assets and numerous other sources including OpsInfrastructure for facility assets. Yes
Size Unit various sources Things like hp, gpm, sq ft, cu yds, MG, etc.
Yes for assets where size is part of unit cost calculations (services, pipes, roads, use size)
Size Category TeamPlan
Small, medium, large, extralarge have been used for various asset groups, such as services or regulator vaults to establish costs.
Yes for some grouped assets like services and pipes to determine cost of replacement asset.
Guidelines for an Asset Management Plan Page 51

Appendix A - Table 1. Fields in Asset Data Table in TeamPlan
Field Name Primary Data Source Explanation of Attribute Required Field?
Material GIS
what asset is made from. Used to group assets together, such as all DI mains or CU services of a particular size and age class.
Yes for some assets like services and pipes for determining useful life
Manufacturer various sources
Not currently in use, except for vehicles. Could be used for classifying various assets into smaller subgroups, like meters, or hydrants, and apply different management strategies based on this field. No
Make various sources Not currently in use, except for vehicles. Not available in an existing digital data source for most assets No
Model various sources
Mostly unpopulated at this time, except for vehicles and regulator valves. Not generally available in any existing digital data source for most assets No
Internal Lining GIS, Streetsaver for culverts
Mostly unpopulated but could be used to assign a longer life to pipes and services known to be lined. No
External Coating GIS Mostly unpopulated but could be used to assign a longer life to pipes and services known to be coated. No
CP GIS
Tells model whether pipe has active, passive or no CP on it. Used to increase PEL/MPL of pipe and selects a different management strategy for these pipes (to model CP system maintenance). Not in use at this time
Asset Comment TeamPlan Used to make clarifying notes about asset related assumptions No
Budget Program TeamPlan Places asset in appropriate part of hierarchy Yes Budget Subprogram TeamPlan Places asset in appropriate part of hierarchy Yes
System
TeamPlan (will eventually go into GIS and Synergen) Places asset in appropriate part of hierarchy Yes, for pipes
SAPCode SAP
Tells charge account for asset. Difficult to populate because maintenance charge codes are different than capital charge codes for same asset. No
CIP Project No. SAP, ATTASK, GIS
For assets that have a scheduled replacement or rehab, this is the project number that has been assigned for that work. It is mostly unpopulated at this time, except for the few known large upcoming projects. Helps prevent assets from replacing themselves if they are already in the CIP.
For assets with known CIP project
CIP COST SAP, ATTASK The budget estimate for future replacement projects
Only for assets that we know we are going to build or replace in the near future.
CIP Completion Year ATTASK
The year in which future project is expected to be constructed
Only for assets that we know we are going to build or replace in the near future.
Guidelines for an Asset Management Plan Page 52

Appendix A - Table 1. Fields in Asset Data Table in TeamPlan
Field Name Primary Data Source Explanation of Attribute Required Field?
Installation Year ENR Index TeamPlan
The ENR CCI value (20-city average annual) in the year in which the asset was constructed
No, but helpful for future model updates
Current ENR Index 8566 TeamPlan
The ENR CCI value for the year of calculation of costs used in the model (replacement cost, rehab cost, decommission cost). Hopefully they were all developed in the same year or within a year or two of one another.
No but helpful for future model updates
Decommission Year TeamPlan, GIS
For assets that will be retired upon their replacement with a new asset or abandoned in the near future, such as the open reservoirs or the West Side Header. This is the anticipated year in which the decommissioning will occur. Assets that have already been decommissioned are not included in TeamPlan. No
Decommission Cost TeamPlan
If there are costs associated with abandonment (tank site abandonments, for example) the budget for this activity. No
Decommission cost Year TeamPlan Year when the decommissioning costs were developed No
Comments TeamPlan
Any clarifying comments about assumptions in the model that aren't asset related (like cost assumptions). Clarification about asset assumptions can be found in asset comment.
Guidelines for an Asset Management Plan Page 53

Appendix A - Table 2. Fields in TeamPlan Management Strategy Table
Field Name Primary Data Source Explanation of Attribute Required Field?
MSParentID TeamPlan
Provides level where a particular MS strategy applies. For example there is a generic management strategy for electrical assets that applies at all levels of the hierarchy (parent is CoPWB) Yes
MSID TeamPlan Aasset class to which this particular MS applies. Electrical is MSID for above example. Yes
MSHierarchy TeamPlan Node in hierarchy where MS is first applicable. TeamPlan assigns this value. Yes
FirstOfImage TeamPlan Not sure and not used No ActivityNumbers Not sure and not used No
CIPID SAP For new assets, the CIP number for construction costs (i.e. project number?)
Not currently in use as a MS "default". Project number for individual CIP’s are in Asset Table for a asset being added.
CIPMode TeamPlan
Choices for mode include dispose, mothball, new, none, Rehab, Replace, Sell. Not in use as default. CIP project is listed on an existing asset record, if existing asset gets replaced. If the CIP appears as a new asset it is a new facility. Upgrades to existing facilities are handled like new assets because RC is different from old asset.. No
CIPYr TeamPlan
Year in which a particular default MS will occur. Not in use in as a default. If a CIP project is anticipated the year appears on the asset table next to the asset being replaced or the new asset being added. No
CMMT TeamPlan Comments to explain assumptions if needed No
CMn TeamPlan
This is either TRUE or FALSE.Tells model whether to use corrective maintenance for an asset group. Not currently in use. Need to split up maintenance that is not capitalized (CMn) from Rehab which can be capitalized. No
CMnCveID TeamPlan
Tells model what shape curve to use to determine how much corrective maintenance is needed each year.Can put individual curves in on asset table for individual assets if desired rather than relying on a default. Shapes include straight line, S-shape, concave, and convex. No
CMnCveShpFtr TeamPlan Shape factor for a particular curve type. Affects rate of increase in corrective maintenance needs over time. Not in use
CMnPer TeamPlan The percentage of replacement cost to use for corrective maintenance expenses. Not in use
CoF TeamPlan Not being used in a default fashion. Only available for small number of individual assets. No
Guidelines for an Asset Management Plan Page 54

Appendix A - Table 2. Fields in TeamPlan Management Strategy Table
Field Name Primary Data Source Explanation of Attribute Required Field?
CoFRule TeamPlan
Calculation for how CoF will affect rehab or replacement schedule. A high consequence asset, for example, could have a reduced minimum acceptable condition. Not currently in use as a default. For some individual assets, the minimum condition was set to a lower value if asset was considered critical or consequential. on No
CoFType TeamPlan
Tells model whether consequence is a currency value or a score or to ignore the CoF field. Can be dollars or scores. Need to tell model which so it knows what to do with CoF.
We use 1-5 scores for those assets that have been rated.
Con TeamPlan
Default current condition value for assets without install date or condition rating Not used, except for giving new CIP assets an initial condition of 1. Current model uses default install years to establish initial condition. No
CostMat TeamPlan
Don't know what this is --not currently using it. May be a way to put in material costs as a percent of total costs to get an idea of staffing needs. No.
Count TeamPlan
Default value for assets for which count is blank. Set to 1 for our model because all other groups should have a count for the group.
Yes to guard against assets being missed in replacement value summations.
Depth TeamPlan
Default value for depth on assets where it is blank. Currently depth doesn't apply to cost equations so it isn't used. Future costs could include adjustments to rehab or replacement costs for extra deep pipes in which case they would need a default value if the field is blank. No.
DepthUnit TeamPlan Default unit, such as feet or inches. Depth is not currently being used in any calculations. No.
DispCost TeamPlan Default value for decommissioning cost. This is handled for individual assets where such a cost is anticipated. No
Ignore TeamPlan
TRUE or FALSE. If TRUE, tells model to ignore a particular management strategy for this run of the model. IF FALSE the strategy is applied.
Allows different scenarios to be developed.
IncludeRisk TeamPlan
TRUE or FALSE. Tells model whether or not to use risk as the means of determining when an asset needs rehab or replacement
Yes, must tell whether or not to use it.
InstalYear TeamPlan
Default value for install year for assets of a particular type when it is blank for the individual asset. Used mid range of install dates for like assets when year was missing.
Yes. Must have install year or current condition for every asset or group
LandUse TeamPlan Default land use to assume for assets with land use blank on the individual asset.
No. Not currently in use
Length TeamPlan Default length for assets that need length for cost calculations (currently only pipes use this field).
Yes for pipes. Default is 400 feet (average length of typical main project)
LengthUnit TeamPlan Default unit, feet for pipes. Yes.
Level TeamPlan
Default level on which to place an asset if the parent is missing. Parent has been assigned to all assets, so level isn’t needed as default. No.
Guidelines for an Asset Management Plan Page 55

Appendix A - Table 2. Fields in TeamPlan Management Strategy Table
Field Name Primary Data Source Explanation of Attribute Required Field?
LocCode TeamPlan Not sure and not used. No.
LstRhbYear TeamPlan
Default value for when last rehab occurred for assets without individual rehab dates. If no value is here and no value is on individual asset, model assumes asset hasn't been rehabbed since it was installed.
No. Provided on individual assets where known.
Make TeamPlan Default for make. Make isn't being used for anything in model and is populated only on vechicles right now. No.
Material TeamPlan
A default value is necessary for pipes to calculate cost and for pipes and services to assign a useful life. Default for pipes with no date is CI, default for services with no date is GALV when small or CI when large. Default for pipes with dates depend on the date. Yes.
MaxNoRhbs TeamPlan Default for the maximum number of times an asset can be rehabbed before needing to replace it.
Yes. Required for assets with Rehab = TRUE and that are missing an individual value for number of rehabs.
MaxPotLife TeamPlan Default for maximum potential life for an asset class.
Yes. Needed for assets that may be missing a value on their individual record.
MaxRisk TeamPlan
Default for maximum risk value that is acceptable for a particular class of assets. (i.e. Corresponds to Risk Trigger in Asset Table for individual assets).
If IncludeRisk =TRUE, need a value to use for assets where individual maxRisk values have not been assigned.
MinCon TeamPlan Default for minimum acceptable condition level for assets of a particular class and/or type.
Yes. If condition is being used, need a default for any assets that may be missing an individual minCon on their Asset record.
MnCrit Synergen (eventually)
Default value for maintenance criticality rating for a particular class of assets. Criticality is not currently populated in TeamPlan. It is available for some individual assets in other data sources. It is mainly used to prioritize maintenance actions. No
MnStrat TeamPlan
Not sure what this is for. I think it is a TRUE or FALSE setting that allows a MS to be turned on or off easily. Not in use in our model right now. No.
Model TeamPlan Default value for model for a particular class of assets. No.
MSCmmt TeamPlan Comments to explain maintenance strategy assumptions if needed No
Guidelines for an Asset Management Plan Page 56
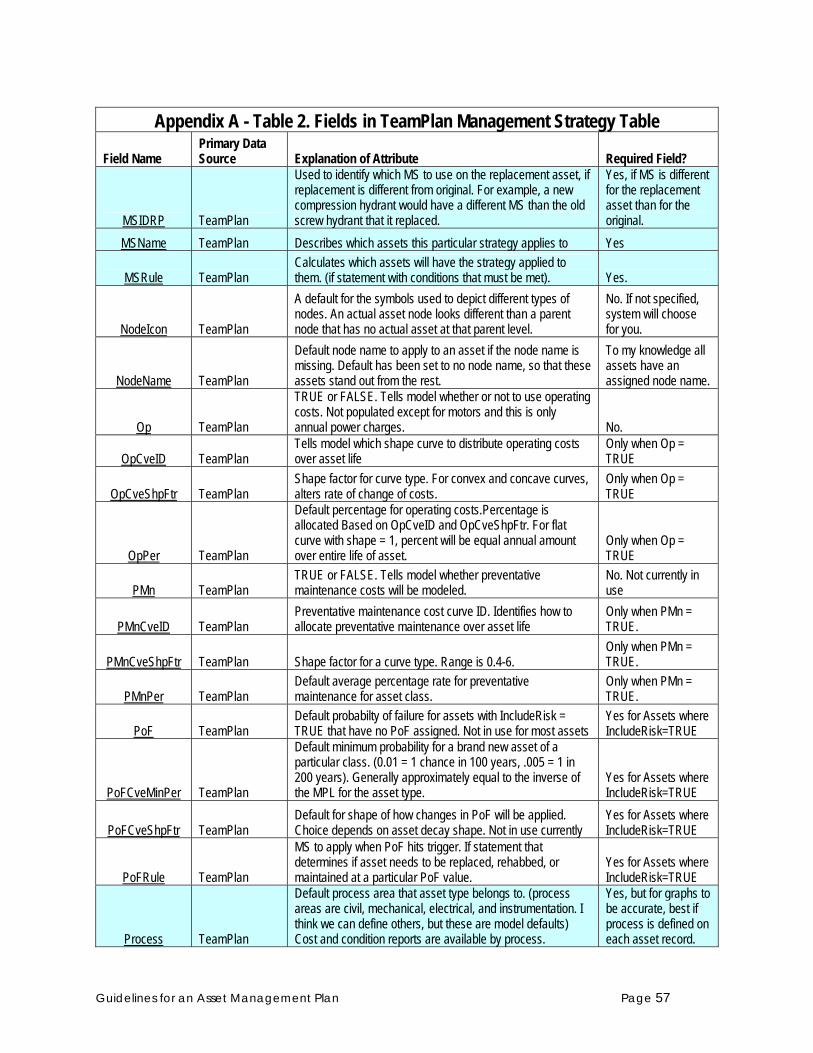
Appendix A - Table 2. Fields in TeamPlan Management Strategy Table
Field Name Primary Data Source Explanation of Attribute Required Field?
MSIDRP TeamPlan
Used to identify which MS to use on the replacement asset, if replacement is different from original. For example, a new compression hydrant would have a different MS than the old screw hydrant that it replaced.
Yes, if MS is different for the replacement asset than for the original.
MSName TeamPlan Describes which assets this particular strategy applies to Yes
MSRule TeamPlan Calculates which assets will have the strategy applied to them. (if statement with conditions that must be met). Yes.
NodeIcon TeamPlan
A default for the symbols used to depict different types of nodes. An actual asset node looks different than a parent node that has no actual asset at that parent level.
No. If not specified, system will choose for you.
NodeName TeamPlan
Default node name to apply to an asset if the node name is missing. Default has been set to no node name, so that these assets stand out from the rest.
To my knowledge all assets have an assigned node name.
Op TeamPlan
TRUE or FALSE. Tells model whether or not to use operating costs. Not populated except for motors and this is only annual power charges. No.
OpCveID TeamPlan Tells model which shape curve to distribute operating costs over asset life
Only when Op = TRUE
OpCveShpFtr TeamPlan Shape factor for curve type. For convex and concave curves, alters rate of change of costs.
Only when Op = TRUE
OpPer TeamPlan
Default percentage for operating costs.Percentage is allocated Based on OpCveID and OpCveShpFtr. For flat curve with shape = 1, percent will be equal annual amount over entire life of asset.
Only when Op = TRUE
PMn TeamPlan TRUE or FALSE. Tells model whether preventative maintenance costs will be modeled.
No. Not currently in use
PMnCveID TeamPlan Preventative maintenance cost curve ID. Identifies how to allocate preventative maintenance over asset life
Only when PMn = TRUE.
PMnCveShpFtr TeamPlan Shape factor for a curve type. Range is 0.4-6. Only when PMn = TRUE.
PMnPer TeamPlan Default average percentage rate for preventative maintenance for asset class.
Only when PMn = TRUE.
PoF TeamPlan Default probabilty of failure for assets with IncludeRisk = TRUE that have no PoF assigned. Not in use for most assets
Yes for Assets where IncludeRisk=TRUE
PoFCveMinPer TeamPlan
Default minimum probability for a brand new asset of a particular class. (0.01 = 1 chance in 100 years, .005 = 1 in 200 years). Generally approximately equal to the inverse of the MPL for the asset type.
Yes for Assets where IncludeRisk=TRUE
PoFCveShpFtr TeamPlan Default for shape of how changes in PoF will be applied. Choice depends on asset decay shape. Not in use currently
Yes for Assets where IncludeRisk=TRUE
PoFRule TeamPlan
MS to apply when PoF hits trigger. If statement that determines if asset needs to be replaced, rehabbed, or maintained at a particular PoF value.
Yes for Assets where IncludeRisk=TRUE
Process TeamPlan
Default process area that asset type belongs to. (process areas are civil, mechanical, electrical, and instrumentation. I think we can define others, but these are model defaults) Cost and condition reports are available by process.
Yes, but for graphs to be accurate, best if process is defined on each asset record.
Guidelines for an Asset Management Plan Page 57

Appendix A - Table 2. Fields in TeamPlan Management Strategy Table
Field Name Primary Data Source Explanation of Attribute Required Field?
ProgramName TeamPlan
Default assignment of the Program area to an asset where it is missing. I don’t think this is the same as Budget Program and I don’t think we are using this attribute. No.
ProgramPriority TeamPlan
Default assignment of program priority. Probably used to prioritize expenditures and maintenance actions, if an annual expenditure ceiling is set or something. Need to find out what this does. Currently unpopulated. No.
Purpose TeamPlan
Not sure what this field is used for. Probably a verbal explanation of what is being accomplished with each management strategy (i.e. what activtity is being modeled). No.
RailXing TeamPlan
TRUE or FALSE. Not in use. Pipes that cross railroads without casings are pulled out and named as vulnerable assets and costs adjusted accordingly. No.
RandomLifeFtr TeamPlan
TRUE or FALSE. If true, model uses a monte carlo or weibull style distribution to assign a maximum life to individual assets in a group. However, once assigned that life is used for all replacement assets as well instead of regenerating or applying the appropriate life for the replacement asset type. Because of this problem, the feature is not currently in use. No
RC TeamPlan
Default replacement cost for assets without one assigned. This is a total dollar value and is same for all assets to which the MS applies. Sometimes all attributes that enable a cost rule to be applied are not available, so a set cost is needed under these circumstances. Guards against a zero replacement cost result for an asset that has missing data. Yes.
RCRule TeamPlan Default calculation for replacement cost for assets that do not have an individually assigned value. Yes
Rh TeamPlan
TRUE or FALSE. Tells model whether rehabs will be done on assets to which the MS is being applied that have a blank on this field in their asset record. Setting here should match what is being used for other similar assets. Most are currently set to flat, which means unchanging over life of asset. Yes.
RhConCveID TeamPlan
Default curve for condition of a rehabbed asset, if the asset condition will decay at a different rate after it is rehabbed than before it is rehabbed.
Yes, for assets where rehab is TRUE
RhConCveShpFtr TeamPlan
Default rehab condition curve shape factor The higher the number, the slower the condition decline. One is a straight line, below one is convex, above one is concave. Range is 0.4-6. Most are currently set at either 1 or 0.74. For a straight line a value of .74
Yes, for assets where rehab is TRUE
RhCstCveID TeamPlan
Default Rehab cost curve ID. Tells model what shape to use for determining rehab costs if they are not provided. Not currently in use. Rehab costs are calculated as a percent of replacement value. No
RhCstCveShpFtr TeamPlan
Default Rehab cost curve shape factor Not currently in use. Rehab costs are calculated as a single percent of replacement value. No
Guidelines for an Asset Management Plan Page 58

Appendix A - Table 2. Fields in TeamPlan Management Strategy Table
Field Name Primary Data Source Explanation of Attribute Required Field?
RhCstMinType TeamPlan
Default for how the RhMinCst default is calculated. Value can be percentage or total .If some assets may not have all data needed to calculate a rehab cost or cost is blank, should have this default set up to make sure some cost is incurred. Yes
RhInstallFtr TeamPlan
A default factor to adjust rehab percent if the rehabbed asset's cost will be higher in future rehabs Not currently in use No
RhMinCst TeamPlan
The default minimum cost for a rehab, to be compared to the calculated value using other techniques. If the calculated value is less than this, the minimum will be used. Need if some assets may not have all the data needed to calculate the rehab cost or if there is a concern about the rehab equation resulting in too low a number for some assets. Yes
RhMinCstPer TeamPlan Default minimum percentage for a rehab, if percentages are being used. See above explanation for how variable is used Yes
RhPhysEffLife TeamPlan
Default for physical effective life for a rehabbed asset, if shorter than the original PEL for a brand new asset. . If not provided, model uses PEL for the new asset. Currently unpopulated, so model is using same PEL after a rehab as before one Yes
Risk TeamPlan Default initial risk value for assets without one. Not in use.
Yes for asset types where IncludeRisk = TRUE
RiskRule TeamPlan Tells model what to do in the event that risk reaches the trigger value.
Yes for Assets where IncludeRisk =TRUE
RoadXing TeamPlan
TRUE or FALSE. Not in use because pipes that cross freeways or major arterials without casings are pulled out and named as vulnerable assets and costs are adjusted accordingly using a separate MS strategy
No, but pipes do need to identified as such on Asset record.
RpConCveID TeamPlan Default replacement asset condition curve type.
Yes for asset with different replacement asset than original
RpConCveShpFtr TeamPlan
Replacement asset condition curve shp factor default The higher the number, the slower the condition decline. One is a straight line, below one is convex, above one is concave. Range is 0.4-6.
Yes for asset with different replacement asset than original
RpCstUntRte TeamPlan The default replacement cost for a replacement asset if it is different than the original asset.
Yes if new asset uses RC cost formula and has different rate than orig. asset.
RpInstallFtr TeamPlan
A factor to adjust the cost of a replacement asset to reflect differing installation conditions than the original asset. For example the cost to replace a pump station or building on an existing site may be much higher than the calculated replacement cost for the original asset due to space constraints and the need to keep the existing asset in service during construction.
Yes if needed to model costs of replacement assets. Not in use right now.
Guidelines for an Asset Management Plan Page 59

Guidelines for an Asset Management Plan Page 60
Appendix A - Table 2. Fields in TeamPlan Management Strategy Table
Field Name Primary Data Source Explanation of Attribute Required Field?
RpUseCALC TeamPlan
TRUE or FALSE. Tells model whether the replacement asset relies on a cost formula to calculate the replacement cost of the new asset that is different than the replacement cost of the original asset.
Yes if replacement costs for a new asset are significantly different than the one that it is replacing.
Size TeamPlan Default size value for assets where size is missing
Yes. Needed to enable costs to be assigned for pipes and services that are missing a size.
SizeUnit TeamPlan Inches, feet, miles, hp, etc. Yes for assets with size populated.
SubType TeamPlan
Default value for assets where subtype is blank and is needed for cost calculations. Preference would be to set subtype to "missing" so all the assets that require subtype can be identified and fixed.. Yes, for some assets
Treatment TeamPlan
Default value that can be used to move assets out of their modeled rehab/replacement cycle and assign them to an existing CIP project. For example, if a main project is going by an area and there are pipes in that area that were not originally part of that project but are close to needing replacement, a treatment of replace could be assigned and the model would replace the asset early under the assigned CIP Number, then recalculate the model results. Values for treatment include Do nothing, Rehabilitate, or Replace.
No. Not currently in use
TreatmentOptLst TeamPlan I'm not sure what this is. Maybe we can add treatment options to the above three? Things like add CP, or Line?
No. Not currently in use
Type TeamPlan
Default type to use for assets type blank but is needed for calculations. This is blank on our MS table because type has been assigned to all assets that need it. Several MS and Replacement cost formulas rely on type to decide which MS to apply and how to calculate cost. Prefer to make sure that assets that rely on Type for their MS strategies have type populated on their asset record.
Yes when type is blank and is needed for MS applications
UseRandomLife TeamPlan TRUE or FALSE telling model whether to generate maximum potential life using a random life generator.
No. Not currently in use
Indicates a required field

APPENDIX B – CLEM Consequence Table Portland Water Bureau – Appendix B. Consequences of Failures
Category Subcategory Above Tier 5 Tier 5 Tier 4 Tier 3 Tier 2 Tier 1
Water Quality
Large scale water system contamination that leads to multiple loss of life
Large scale water system contamination, causing a single fatality
Widespread sickness Water quality exceedance; minor health issues, such as turbidity event
Localized WQ issues such as turbidity from main break etc..
Localized WQ issue (Non-health - fall color, taste, localized turbidity problem
Illness
More than 100 hospitalized due to confirmed water-borne disease
More than 10 confirmed cases of water-borne disease; Unconfirmed reports of minor illness with symptoms related to water-borne disease
Regulations
Revocation of PWS certification Tier 1 Violation (acute), e.g. Consent Order to treat Tier 2 Notification (includes
nitrates, etc.) Monitoring/Reporting Req't No Violation
Boil water, half of city or more. Duration longer than 72 hours. Secondary MCL problem, e.g.,
manganese problems Less than 100% compliance with state and federal water quality regulations
Approaching violation
Event triggers loss of the filtration exemption Sampling violations Detects requiring notification
Supply Continuity
Supply Outage
Much of City out of water for longer than 72 hours
"Major" or "Large" service area out of water for longer than 72 hours
"Major" or "Large" service area out of water for 24-72 hours; 250 - 1000 Services out of water for longer than 72 hours; WCSL out of service for longer than 72 hours
250 - 1000 Services out of water for 24 - 72 hours; WCSL out of service for 24 - 72 hours; 50 - 250 Services out of water for longer than 72 hours
50 - 250 Services out of water for 24 - 72 hours; Up to 50 Services out of water for longer than 72 hours
Customer out of water more than 3 times per year
Service Pressures
Half or more of City receiving pressure < 20 psi for 2-4 hours; "Major" or "Large" service area receiving pressure < 20 psi for 72 hours or more
"Major" or "Large" service area receiving pressure < 20 psi for 2-4 hours or more; Up to 250 services receiving pressure < 20 psi for 72 hours or more
50 to 250 services receiving pressure < 20 psi for 2-4 hours or more
Fire Flows Supplying less than minimal fire flow to a commercial/industrial fire
Supplying less than minimal fire flow to a residential fire; Supplying minimal fire flow to a commercial/industrial fire
Supplying less than reduced fire flow to a residential fire; Supplying reduced fire flow to a commercial/industrial fire
Guidelines for an Asset Management Plan Page 61

Portland Water Bureau – Appendix B. Consequences of Failures (continued, page 2 of 3)
Category Subcategory Above Tier 5 Tier 5 Tier 4 Tier 3 Tier 2 Tier 1 Public Confidence
Supply Outage Half the city out of water for 8 hours or more Major or large service area out of
water for 8 hours 250 to 1000 services out of water for 8 hours or more
Up to 250 services out of water for 8 hours or more
Water Quality Issue Single Loss of life Boil Water Order or other public warning to half of City or more. Duration longer than 72 hours.
Boil water order to smaller service area for 72 hours or half the city for 24 hours
Discolored water Potential news report on water quality issue
Use restrictions Mandatory Curtailment Measures Request for Voluntary reduction in water use; interruption of supply to wholesalers
Security Breach Successful / proven contamination action News report on contamination
attempt
Customer Billing Equity: 30% or more of bills/accounts not paying their fair share; Accuracy: miscalculation of large number of bills, 25% error
Equity: 10% or more of bills/accounts not paying their fair share; Accuracy: miscalculation of large number of bills, 10% error
Customer Satisfaction Less than 50% give a High or Very High Rating on Auditor's SEA survey More than 7 complaints per
1000 customers per year.
Less than 75% give a High or Very High Rating on Auditor's SEA survey
Social Consequences / Health and Safety
Death/Injury Greater than 5 Lives Lost 2 - 5 Lives Lost Single Loss of Life or Critical Injury. More than three employees seriously injured
Severe Injury, >30 days off work; 2 or more employees seriously indured (broken bone, head injury, major loss of blood)
Minor to Serious Work time injury
Community financial
impact (excluding BWW direct cost)
>$20 million of losses >$10 million of losses >$5 million of losses >$1 million of losses
Environmental
Severe degradation of Bull Run watershed / loss of habitat
Release of a volume of chlorinated water that results in a major fish kill of ESA-listed species
Release of chlorinated water that results in visible die off of aquatic life in a river or stream
Release of chlorinated water that results in moderate damage to aquatic habitat
Release of chlorinated water that results in minor damage to aquatic habitat
Erosion causes major damage to sensitive aquatic or terrestrial habitats
Erosion causes moderate damage to sensitive aquatic or terrestrial habitats
Erosion causes minor damage to sensitive aquatic or terrestrial
Erosion causes mud to track into street and silt up catch basins
Conservation & Sustainability Increase in Bureau's carbon
emissions from 2007 level
Decrease in energy generated by renewable sources or Significant increase in per capita water use in retail service area
Energy Use Increases energy use significantly Increases energy use moderately Increases energy use
Guidelines for an Asset Management Plan Page 62
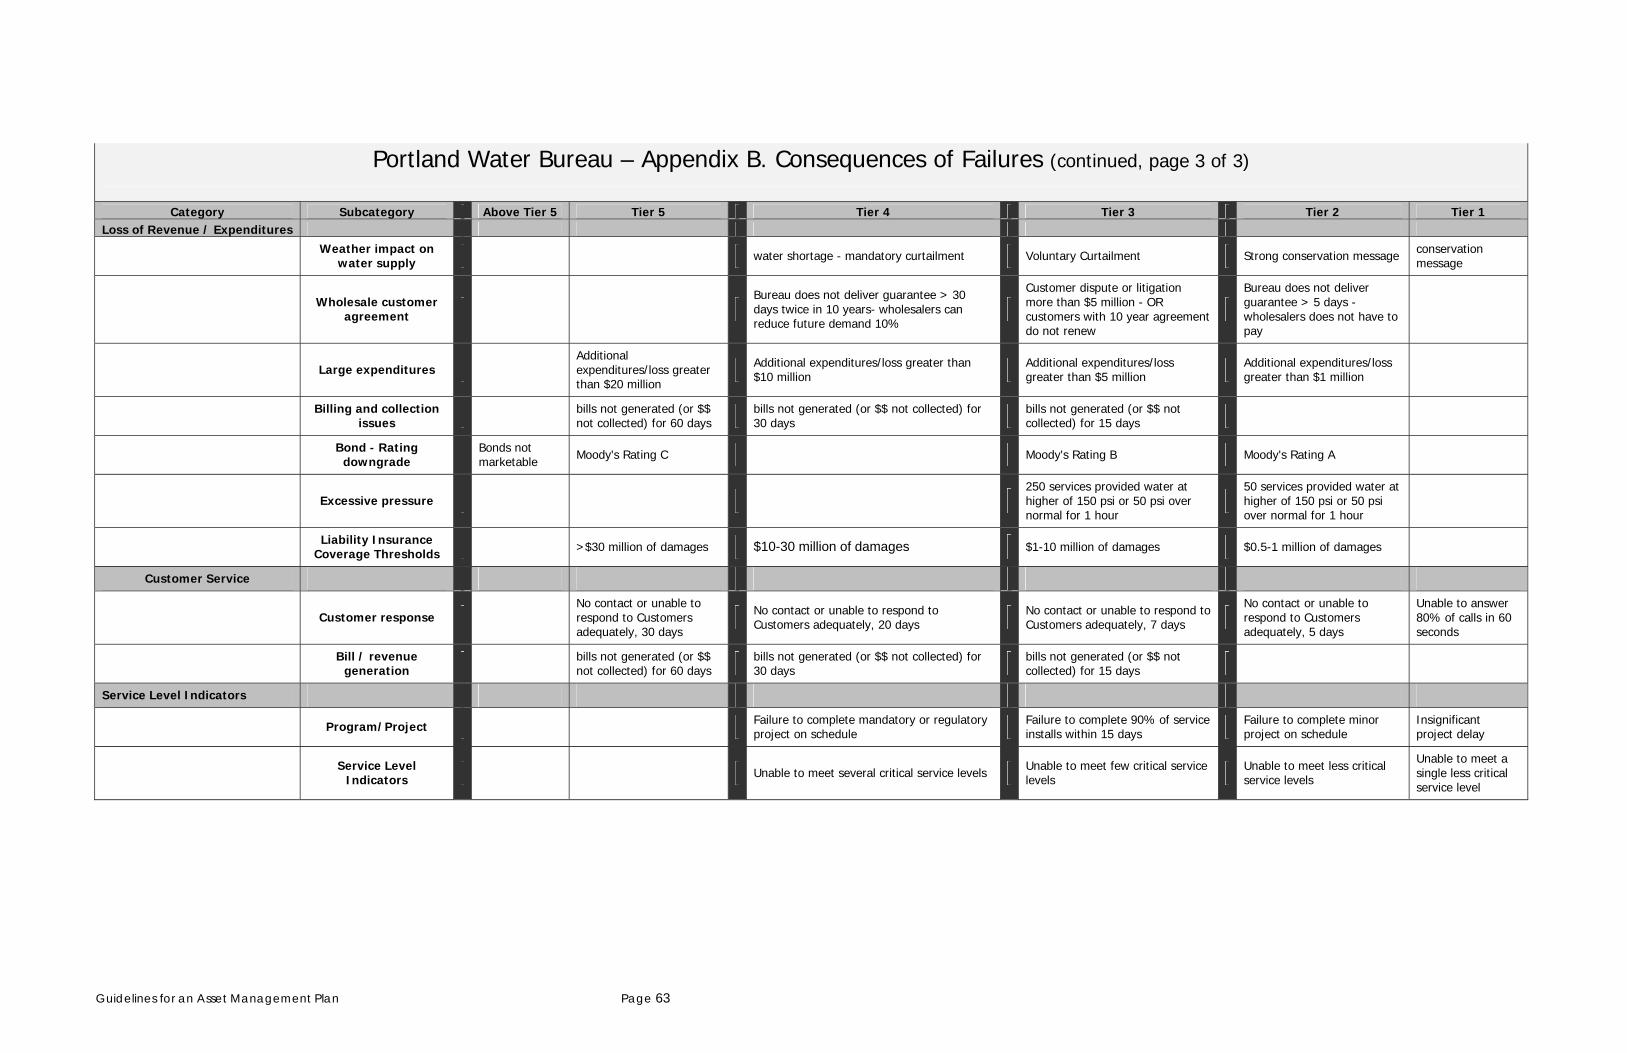
Guidelines for an Asset Management Plan Page 63
Portland Water Bureau – Appendix B. Consequences of Failures (continued, page 3 of 3)
Category Subcategory Above Tier 5 Tier 5 Tier 4 Tier 3 Tier 2 Tier 1 Loss of Revenue / Expenditures
Weather impact on water supply water shortage - mandatory curtailment Voluntary Curtailment Strong conservation message conservation
message
Wholesale customer agreement
Bureau does not deliver guarantee > 30 days twice in 10 years- wholesalers can reduce future demand 10%
Customer dispute or litigation more than $5 million - OR customers with 10 year agreement do not renew
Bureau does not deliver guarantee > 5 days - wholesalers does not have to pay
Large expenditures Additional expenditures/loss greater than $20 million
Additional expenditures/loss greater than $10 million Additional expenditures/loss
greater than $5 million Additional expenditures/loss greater than $1 million
Billing and collection issues bills not generated (or $$
not collected) for 60 days bills not generated (or $$ not collected) for 30 days bills not generated (or $$ not
collected) for 15 days
Bond - Rating downgrade Bonds not
marketable Moody's Rating C Moody's Rating B Moody's Rating A
Excessive pressure 250 services provided water at higher of 150 psi or 50 psi over normal for 1 hour
50 services provided water at higher of 150 psi or 50 psi over normal for 1 hour
Liability Insurance Coverage Thresholds >$30 million of damages $10-30 million of damages $1-10 million of damages $0.5-1 million of damages
Customer Service
Customer response No contact or unable to respond to Customers adequately, 30 days
No contact or unable to respond to Customers adequately, 20 days No contact or unable to respond to
Customers adequately, 7 days No contact or unable to respond to Customers adequately, 5 days
Unable to answer 80% of calls in 60 seconds
Bill / revenue generation bills not generated (or $$
not collected) for 60 days bills not generated (or $$ not collected) for 30 days bills not generated (or $$ not
collected) for 15 days
Service Level Indicators
Program/Project Failure to complete mandatory or regulatory project on schedule Failure to complete 90% of service
installs within 15 days Failure to complete minor project on schedule
Insignificant project delay
Service Level Indicators Unable to meet several critical service levels Unable to meet few critical service
levels Unable to meet less critical service levels
Unable to meet a single less critical service level