portland water bureau micro hydro case study
TRANSCRIPT

Portland Water
Bureau
Micro Hydro
Case Study
David Peters, PE
Bryan Robinson, PE
May 2013

Outline
• Project Background
• Site Selection and Evaluation
• Design Process Requirements
• Installation
• Lessons Learned and future considerations

Portland Water Bureau System
• Bull Run Elevation at Headworks 750 feet
• Approximately 257 active pressure regulators throughout distribution network

• 1894 Installed (2) Pelton wheel turbines
PWB Turbine History

Portland Water Bureau –
Renewable Energy Projects
• Solar Generation – 267 kW Groundwater
– 12 kW Meter Shop
– 9.8 kW Groundwater chemical
– 7.92 kW Powell Butte (In Construction)
– 100 kW Interstate Shop (In Construction)
• Hydro – 35 MW Bull Run Hydro
– 170 kW Lucid
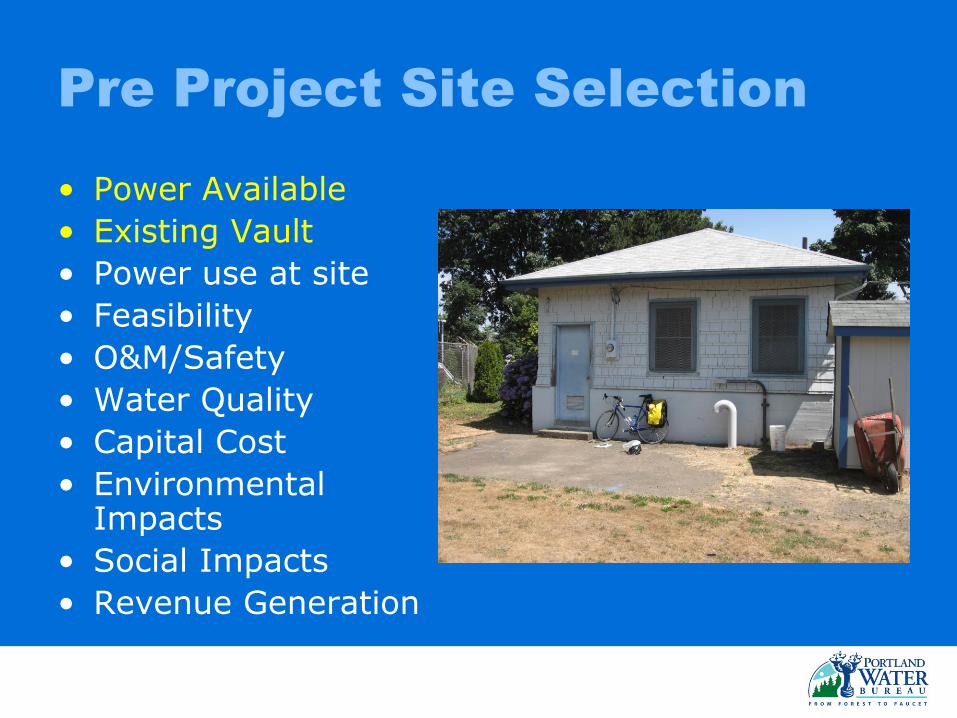
Pre Project Site Selection
• Power Available
• Existing Vault
• Power use at site
• Feasibility
• O&M/Safety
• Water Quality
• Capital Cost
• Environmental Impacts
• Social Impacts
• Revenue Generation

Vernon Site Characteristics
• 3 existing vaults
• Off street location
• 3-phase power available at the site
• High flow rate and head pressure

Vernon Site Characteristics
Vernon Flow vs. Head
4000.00
5000.00
6000.00
7000.00
8000.00
9000.00
10000.00
11000.00
12000.00
13000.00
14000.00
29-Sep-10 18-Nov-10 7-Jan-11 26-Feb-11 17-Apr-11 6-Jun-11 26-Jul-11 14-Sep-11 3-Nov-11
Date
Flo
w (
gp
m)
0.00
10.00
20.00
30.00
40.00
50.00
60.00
He
ad
Dif
fere
nc
e (
ft)
Total Flow
Head Diff (South)
Head Diff (East)

Step 1 – Obtain Permission
• Oregon Water Rights – 6 month wait
– Send letter to approximately 30 agencies inviting comments
– Public meeting at the site
• Apply for Conduit Exemption with Federal Energy Regulatory Committee – Wait
– And wait
– Proceed with design

Step 2 - Agreements
• Facility Study
• Power Purchase
• Infrastructure Connection
• Energy Trust
• American Recovery and Reinvestment Act (ARRA)
• Neighborhood Association
• State of Oregon - BETC

Step 3 – Design Requirements
• Replace 16” regulator with turbine in existing vault
• Restore 6” regulator in vault
• Maintain working clearances to meet electrical and safety codes

Step 3 - Design Requirements
• Safety Improvements
– Improved Access
– Lights in Vault
– Ventilation Fan
– Intruder Alarms

Step 3 - Turbine Selection
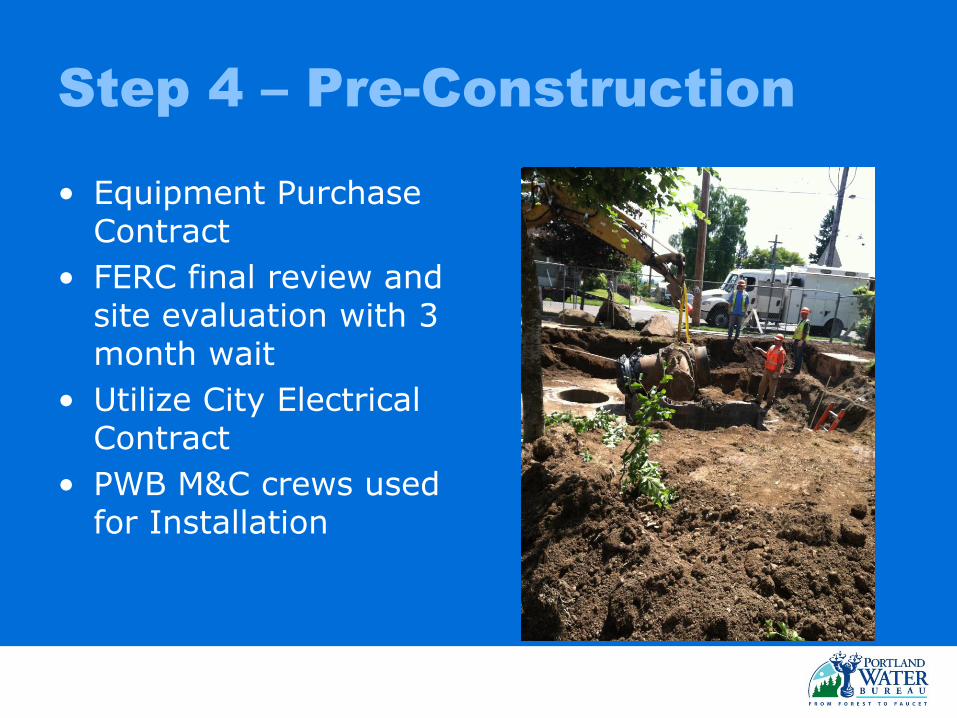
Step 4 – Pre-Construction
• Equipment Purchase Contract
• FERC final review and site evaluation with 3 month wait
• Utilize City Electrical Contract
• PWB M&C crews used for Installation

Step 5 - Construction

Final Mechanical Layout

Final Electrical
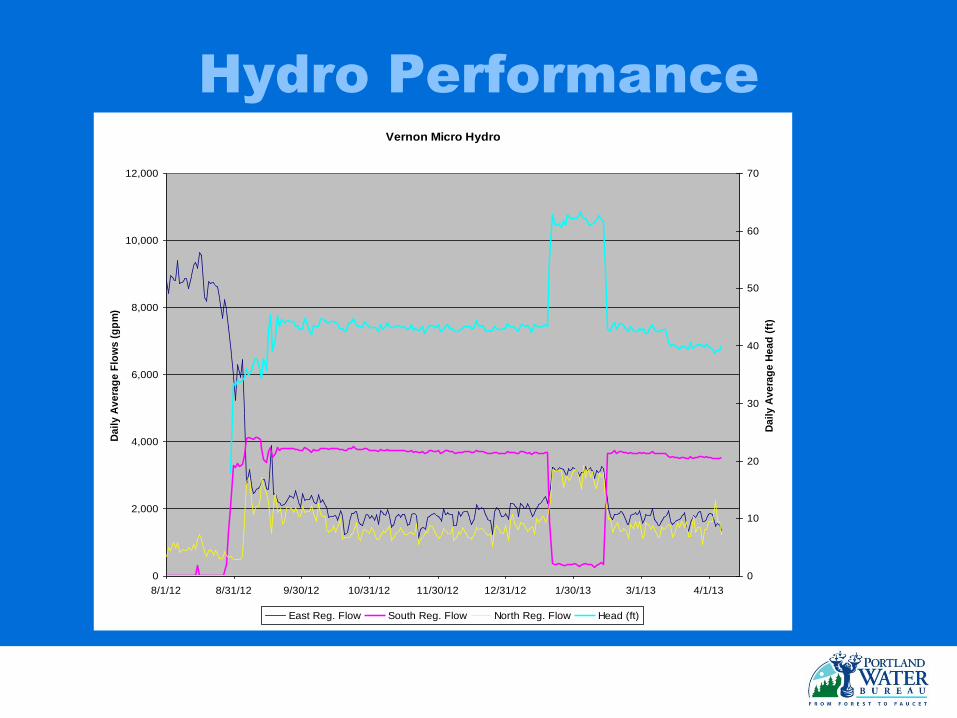
Hydro Performance
Vernon Micro Hydro
0
2,000
4,000
6,000
8,000
10,000
12,000
8/1/12 8/31/12 9/30/12 10/31/12 11/30/12 12/31/12 1/30/13 3/1/13 4/1/13
Da
ily
Av
era
ge
Flo
ws
(g
pm
)
0
10
20
30
40
50
60
70
Da
ily
Av
era
ge
He
ad
(ft
)
East Reg. Flow South Reg. Flow North Reg. Flow Head (ft)
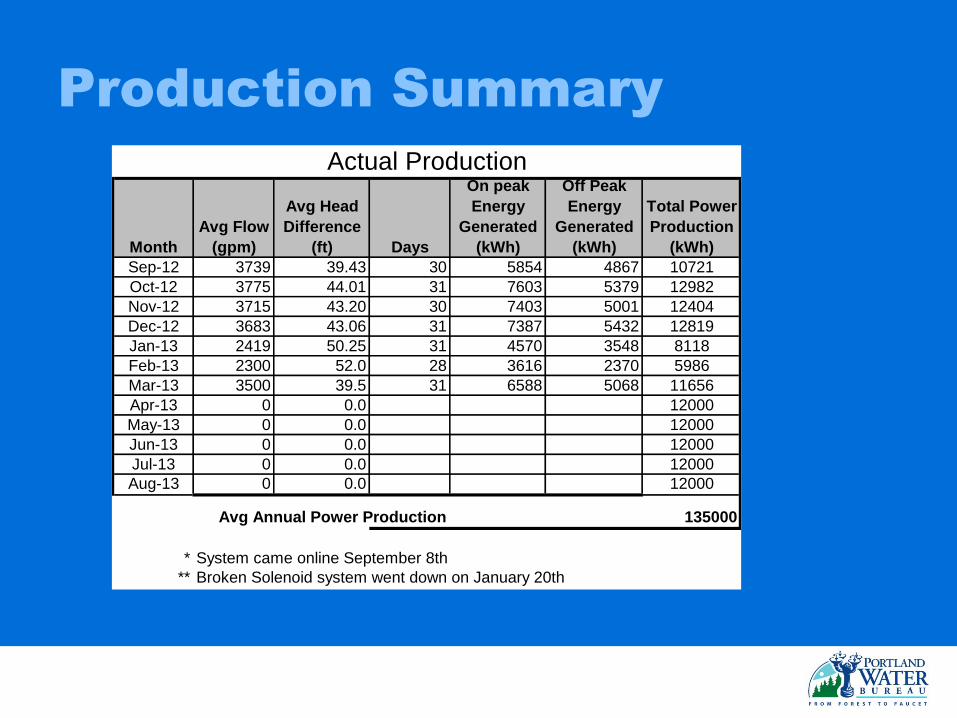
Production Summary
Month
Avg Flow
(gpm)
Avg Head
Difference
(ft) Days
On peak
Energy
Generated
(kWh)
Off Peak
Energy
Generated
(kWh)
Total Power
Production
(kWh)
Sep-12 3739 39.43 30 5854 4867 10721
Oct-12 3775 44.01 31 7603 5379 12982
Nov-12 3715 43.20 30 7403 5001 12404
Dec-12 3683 43.06 31 7387 5432 12819
Jan-13 2419 50.25 31 4570 3548 8118
Feb-13 2300 52.0 28 3616 2370 5986
Mar-13 3500 39.5 31 6588 5068 11656
Apr-13 0 0.0 12000
May-13 0 0.0 12000
Jun-13 0 0.0 12000
Jul-13 0 0.0 12000
Aug-13 0 0.0 12000
Avg Annual Power Production 135000
* System came online September 8th
** Broken Solenoid system went down on January 20th
Actual Production

PWB Energy Use
• Production Range of Vernon Micro hydro
• Minimum 112,000 kWh 66 CO2 metric tons = 0.48% offset
• Maximum 213,000 kWh 125 CO2 metric tons= 0.91% offset
• Average US home 6 CO2 metric tons

Financial Incentives
• EnergyTrust of Oregon - $65,000
• Business Energy Tax Credit - $38,000
• American Recovery and Reinvestment Act of 2009 - $65,000
• Total Cost to PWB after incentives $375,000

Cost Summary
• Cost increase of approximately $120,000 due to no 3-phase power on site
Vernon Micro Hydro Cost
35%
17%
48%
PWB Internal
Utility Connection
Turbine and Electrical Eq.

Lessons Learned Future
Design Considerations
• Understand FERC process
• Utility infrastructure in place?
• Utility willingness to participate?
• Can energy be used on site?
• What is the constructability of the site?

Acknowledgements
• EnergyTrust of Oregon
• SOAR Technologies – Mike Maloney
• PWB – David Peters – Principal Design Engineer
– Vill Villanueva – Senior Engineer
– Frank Galida – Hydropower Manager
– Keith Walker – Program Manager
– Leigh Kojiro – Electrical Design Engineer
– Ryan Nelson – Structural Engineer

Questions