status and civic best practices portland bureau of
TRANSCRIPT
Environ-
CITY OF PORTLAND2016 Citywide Assets Report
Status and Best Practices
City Asset Managers GroupSponsored by the Planning and Development Directors
Bureau of Environmental ServicesBureau of Planning and SustainabilityOffice of Management and FinancePortland Bureau of Emergency Management
Portland Parks & RecreationPortland Bureau of TransportationPortland Water Bureau
Civic
Portland Bureau ofEmergency Management
Bureau ofPlanning and Sustainability
Transportation
Water
ParksEnvironmental Services


City of Portland
2016 Citywide Assets Report
May 2017
The City of Portland is committed to providing equal access to information and hearings.
If you need special accommodation, please call 503-823-7700, the City’s TTY at 503-823-6868, or the Oregon Relay Service at 711.
To obtain a copy of this document or more information about this project, please contact: Shannon Fairchild, Senior Financial Analyst City Budget Office 1120 SW 5th Avenue, Room 1300 Portland, Oregon 97204 Phone: 503-823-6848 | Email: [email protected]

Citywide Assets Report – Acknowledgments iii
Acknowledgments
City Asset Managers Group
Aaron Beck, Office of Management and Finance
Jennifer Belknap Williamson, Bureau of Environmental Services
Claudio Campuzano, City Budget Office
Michele Crim, Bureau of Planning and Sustainability
Jessica Eden, City Budget Office
Shannon Fairchild, City Budget Office
Kim Harrell, Portland Bureau of Transportation
Alexandra Howard, Office of Management and Finance
Eric Johansen, Office of Management and Finance
Jessica Letteney, Portland Water Bureau
Karl Lisle, Office of Management and Finance
Jonna Papaefthimiou, Portland Bureau of Emergency Management
Jordan Rooklyn, Bureau of Police
Katie Shifley, City Budget Office
Chris Silkie, Portland Parks & Recreation
Faez Soud, Portland Housing Bureau
Emily Tritsch, Portland Bureau of Transportation
Mark Whitaker, Portland Fire and Rescue

Citywide Assets Report – Contents v
Contents
1. Executive Summary ................................................................................................................. 1
Purpose of the Report ............................................................................................................................................. 1
Key Findings ............................................................................................................................................................... 1
Asset Value, Condition, and Funding Varies by Bureau .......................................................................... 1
Bureaus Make Progress in Managing Assets ............................................................................................... 2
Challenges and Opportunities Continue ..................................................................................................... 3
2. Asset Management Fundamentals ........................................................................................ 4
Level of Service .......................................................................................................................................................... 5
Risk ................................................................................................................................................................................. 6
Cost ................................................................................................................................................................................ 7
3. The City Asset Managers Group ............................................................................................. 9
Collaboration and Coordination ......................................................................................................................... 9
Supporting City Resilience ................................................................................................................................. 10
4. Budget Implications .............................................................................................................. 13
5. Asset Status, Condition, and Funding .................................................................................. 15
6. Trends and Outlook ............................................................................................................... 38
Appendixes
1a: Current Replacement Value by Asset Type .................................................................................................. 42
1b: Current Replacement Value Data Sheet ....................................................................................................... 43
2a: Current Condition of Capital Assets, All Bureaus ....................................................................................... 45
2b: Current Condition of Capital Assets, Transportation ............................................................................... 46
2c: Current Condition of Capital Assets, Environmental Services ............................................................... 47
2d: Current Condition of Capital Assets, Water ................................................................................................. 48
2e: Current Condition of Capital Assets, Parks & Recreation ........................................................................ 49
2f: Current Condition of Capital Assets, Civic ..................................................................................................... 50
2g: Current Condition Data Sheet .......................................................................................................................... 51
3a: Annual Funding Gap, by Asset Group ............................................................................................................ 53
3b: Annual Funding Gap, by Type of Gap ............................................................................................................ 54

Citywide Assets Report – Contents vi
3c: Annual Non-Capacity Funding Gap, by Bureau .......................................................................................... 55
3d: Capacity-Related Annual Funding Gap, by Bureau .................................................................................. 56
3e: Annual Funding Gap Compared to Bureau Expenditures ...................................................................... 57
3f: Annual Funding Gap in Millions per Year Data Sheet ............................................................................... 58
4: Data Confidence Level Summary, All Bureaus .............................................................................................. 60
5: Definitions .................................................................................................................................................................. 61
6: Asset Management Program Core Elements ................................................................................................. 66

Citywide Assets Report – Executive Summary 1
1. Executive Summary
Purpose of the Report
This report provides information about the City of Portland’s physical assets which include parks and community facilities, water, sewer, and stormwater systems, buildings, streetlights, roads, sidewalks, emergency response equipment and technology, and other infrastructure. The report assembles key data and provides a summary of the number of assets, replacement value, condition, unmet funding needs and each bureau’s approach to asset management. In addition, the City Asset Managers Group provides a snapshot of work in three current focus areas--to outline strategies to fund sustainable service levels, maintain resilience in the face of hazards, and support the City’s equity goals. Using information contained in this report, City staff and decision-makers can make informed decisions about managing physical assets and delivering sustainable levels of service.
This report is produced by the City Asset Managers Group (CAMG). CAMG is made up of asset managers from the Bureau of Environmental Services, the Bureau of Transportation, the Office of Management and Finance, Portland Parks & Recreation, and the Portland Water Bureau, as well as members from the City Budget Office, the Bureau of Revenue and Financial Services, and the Bureau of Emergency Management. The bureaus strive to follow internationally recognized asset management principles and use best practices to develop a coordinated approach to citywide asset management. This approach includes determining key measures, identifying confidence levels for the information presented and acknowledging when information is not available.
The CAMG reports periodically to the Planning and Development Directors’ group. This group represents infrastructure, development permitting, financial, and planning bureaus. The group reviews findings of the annual assets report and makes recommendations to City Council in support of major policy decisions affecting built assets.
Key Findings
Asset Value, Condition, and Funding Varies by Bureau
Current Replacement Value
The City of Portland manages assets worth $35.8 billion. These assets include streets, sidewalks, traffic signals, bridges; wastewater treatment and stormwater systems, sanitary and combined sewers; water supply, storage, transmission, and distribution systems; parks buildings, pools, community centers, and gardens;
Citywide Assets Report – Executive Summary 2
and spectator facilities such as those at Rose Quarter and PGE Park, facilities for police, fire and rescue, and office buildings and technology for City workers.
Condition of Assets
As assets age, their condition declines and the cost of restoring them grows. In the City of Portland, the current condition of capital assets varies by asset and bureau. Overall, 72 percent of assets are in fair or better condition and 21 percent are in poor or very poor condition. A bureau’s resource mix has a significant impact on its ability to address infrastructure repair and rehabilitation at the optimal point before degradation. For example, BES and Water, rate-funded bureaus with robust asset management programs, have a high proportion of assets in very good/good condition (BES 66 percent; Water 69 percent) and a low proportion of assets in poor/very poor condition (BES 10 percent; Water 8 percent). Conversely Transportation, with an asset base similar in replacement value to BES and Water, has a lower proportion of its assets in very good/good condition (33 percent) and higher proportion of assets in in poor/very poor condition (43 percent), primarily due to inadequate and declining general transportation revenues.
Funding Gap
We measure the insufficiency of reinvestment in our assets using an annual funding gap metric. Since the cost for repairing and maintaining assets increases as the condition of assets deteriorates, every year that we do not resolve the funding gap, the gap will continue to grow. For example, $281 million more per year is needed to maintain existing assets to meet current levels of service compared to a $268 million gap last year and $242 million funding gap the year before. If the City does not take steps to close the funding gap, we will pass on these costs to future generations.
Bureaus Make Progress in Managing Assets
Asset management identifies cost-effective solutions to reduce risk and meet levels of service. In 2016, bureaus continued to advance selected business practices to accomplish this work. Some highlights discussed in the report include:
Transportation received new revenue from the Fixing Our Streets Gas Tax and Heavy Vehicle Use Tax, passed in May 2016, to help address unmet needs. The new revenue will fund the Fixing Our Streets program, which is estimated to contribute $42 million toward pavement improvements and $32 million towards safety projects over the next four years. This much-needed infusion of capital will help to address some of PBOT’s pavement backlog.
Environmental Services developed an Infrastructure Reinvestment Strategy in 2016 to guide future reinvestment work. The Infrastructure Reinvestment Strategy provides insights into improvements needed for asset inventory, condition assessment, and capital investments for BES’s major asset classes.
Citywide Assets Report – Executive Summary 3
Water has nearly completed a major study to assess the seismic performance of the water system in a magnitude 9.0 earthquake. The final study will provide recommendations for projects to achieve the recovery goals of the Oregon Resilience Plan.
Parks recently formalized an Assets at Risk business case evaluation process, completed a system-wide playground condition assessment, and shifted from a major maintenance and bond project prioritization model to a risk-based model.
Management and Finance (OMF) continued to develop five-year maintenance plans for facilities.
Challenges and Opportunities Continue
There are several challenges to advancing citywide asset management. One area CAMG focused this past year is recommending discussions to define sustainable levels of service that can balance reinvestment in assets with the service levels the City provides. The current trend of increasing service levels over time with relatively flat reinvestment in our assets will result in lower levels of service for future generations. Thus, the financial health and resilience of the City is dependent on balancing our delivery of services with long-term reinvestment in our assets.
Asset management provides a strategic road map to achieve sustainable levels of service, but it must be supported by a reinvestment strategy. In recent years, City Council and Portland voters have made strides in addressing some of the funding gaps that exist for major systems. For example, in 2014, voters approved Measure 26-159, allowing the sale of $68 million in bonds to address some of the parks, playgrounds, pools, and other recreational facilities in disrepair. In 2015, City Resolution 37107 required that 50 percent of one-time General Fund resources be set aside for major maintenance and asset replacement projects. Further, in May 2016, Portland voters passed Measure 26-173, approving a four-year motor vehicle fuel tax to fund key projects to repair and enhance the safety of Portland streets.
Despite this progress, work remains to be done to ensure we are making the appropriate and ongoing investments in our infrastructure. The decisions we make now will have long-term impacts on the quality of life in Portland.
Citywide Assets Report – Asset Management Fundamentals 4
2. Asset Management Fundamentals The City owns and manages over $35.8 billion in assets across Water, Transportation, Environmental Services, Parks, and the Office of Management and Finance (OMF), representing generations of investment by Portlanders. These assets are the foundation of the valuable services the City provides to residents, and they are essential to Portland’s economic vitality. They include:
• the roads we take to and from work, • the sidewalks our kids take to school, • the water that supports everyday life and our famous beer industry, • the parks where we play, and • the precincts that support our police officers.
These systems are critical in meeting residents’ expectations for City services. The health of these assets is integral to the quality of life that attracts new people to Portland every day.
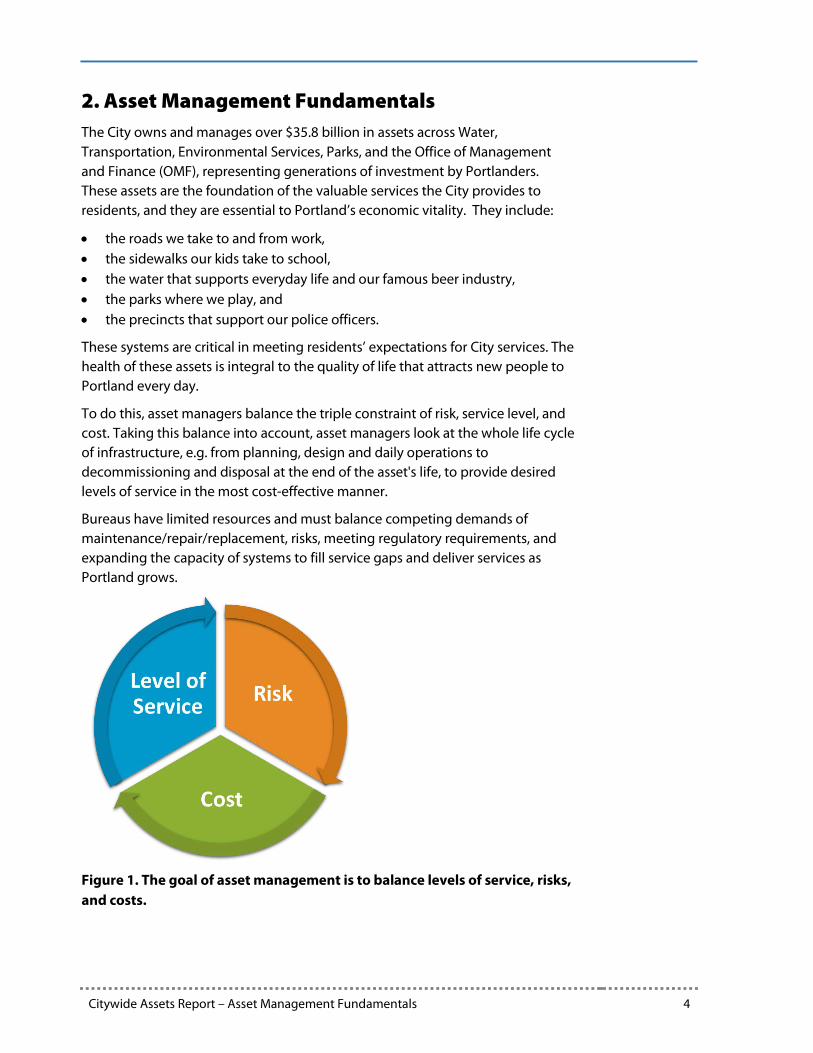
To do this, asset managers balance the triple constraint of risk, service level, and cost. Taking this balance into account, asset managers look at the whole life cycle of infrastructure, e.g. from planning, design and daily operations to decommissioning and disposal at the end of the asset's life, to provide desired levels of service in the most cost-effective manner.
Bureaus have limited resources and must balance competing demands of maintenance/repair/replacement, risks, meeting regulatory requirements, and expanding the capacity of systems to fill service gaps and deliver services as Portland grows.
Figure 1. The goal of asset management is to balance levels of service, risks, and costs.
Citywide Assets Report – Asset Management Fundamentals 5
Level of Service
Service levels are defined by community expectations, bureau experts, industry trends, and elected officials. Service levels are also informed by regulations such as the federal Clean Water and American with Disabilities Acts, and state and local laws and codes. Planning efforts, such as the Portland Plan and the 2035 Comprehensive Plan also set direction for City levels of service. Together, expert assessments, stakeholder needs, regulations, and plans articulate the service expectations for the City of Portland.
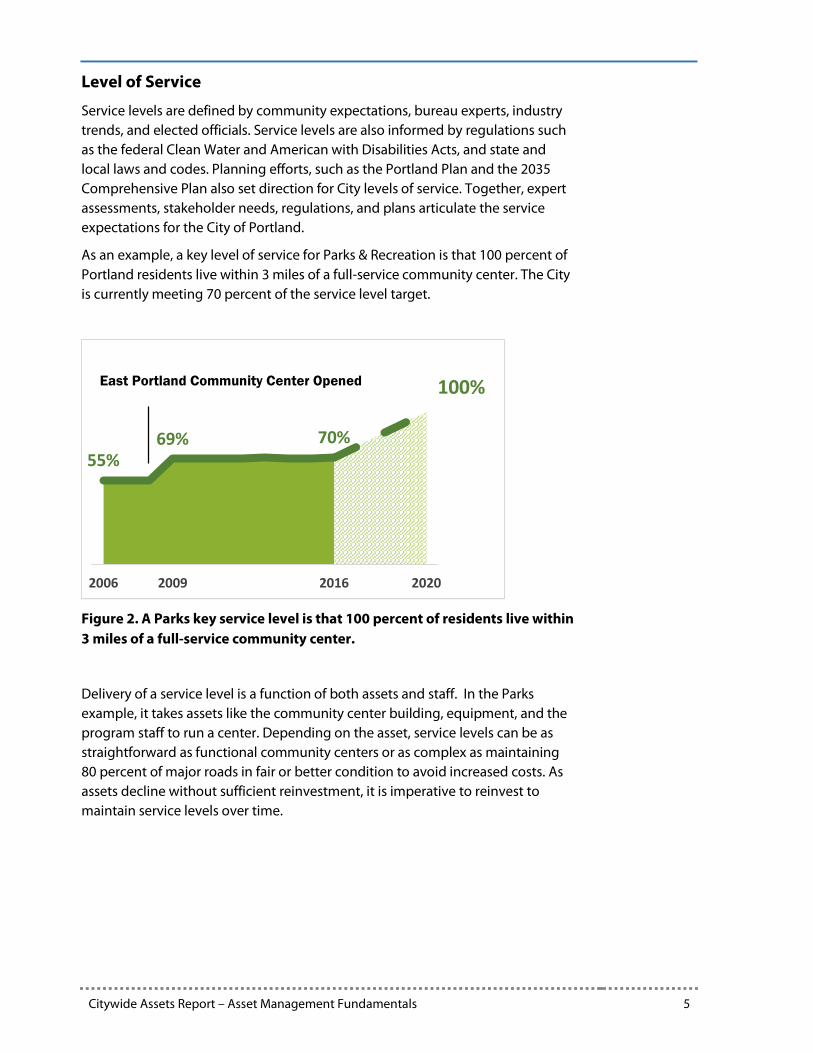
As an example, a key level of service for Parks & Recreation is that 100 percent of Portland residents live within 3 miles of a full-service community center. The City is currently meeting 70 percent of the service level target.
Figure 2. A Parks key service level is that 100 percent of residents live within 3 miles of a full-service community center.
Delivery of a service level is a function of both assets and staff. In the Parks example, it takes assets like the community center building, equipment, and the program staff to run a center. Depending on the asset, service levels can be as straightforward as functional community centers or as complex as maintaining 80 percent of major roads in fair or better condition to avoid increased costs. As assets decline without sufficient reinvestment, it is imperative to reinvest to maintain service levels over time.
55%69% 70%
100%
2006 2009 2016 2020
East Portland Community Center Opened

Citywide Assets Report – Asset Management Fundamentals 6
Risk
Risk is a combination of two factors: the consequence of asset failure, and the likelihood that the asset will fail.
The consequences of asset failure can vary. For example, a large water pipe that serves a hospital is considered more critical than a smaller pipe that serves a neighborhood. Critical pipes require more inspection, maintenance, and intervention than pipes with lower consequences of failure. Pipes with lower consequences of failure may be allowed to serve without intervention until the number of leaks or a break warrants replacement—a process called “run to failure.”
Figure 3. The approach to asset risk can vary by bureau and by asset.
Estimates of the likelihood of asset failure are based on asset condition (for example good/fair/poor). An asset in good condition has a lot of service life left; an asset in poor condition is predicted to fail in the near future. Active risk
Asset failure causes death, severe environmental damage, or significant
service impacts.
HIGH
No injuries, minimal environmental damage
LOW
CONS
EQUE
NCE
LIKELIHOOD
Extreme Risk
High Risk
Medium Risk
Low Risk

Citywide Assets Report – Asset Management Fundamentals 7
management enables asset managers to minimize service interruptions in the near term and address the potential impacts of high consequence assets over a longer time horizon. For example, the City is taking steps to improve the resilience of assets to withstand, recover from, and adapt to changes from natural hazards, severe weather, human-made disasters, climate change, economic shifts and even reduced public confidence in City systems are risks that can have widespread and long-term consequences.
All City agencies must manage the natural deterioration of assets that comes with age. Where the cost is prohibitive or the service level impact is acceptable, reducing risks for assets in poor condition may include removing the asset from service, such as shutting down a fountain. However, divestment may not be an option for bureaus with essential services and heavily regulated assets like water and wastewater treatment. For example, the Water Bureau must meet all drinking water regulations in order to be in compliance with its wholesale water sales agreement, which constitutes approximately a third of the City’s water revenues. Further, City agencies must comply with state and local building codes as well as the City’s plans which include overlapping and inter-related policies and goals for which compliance must be coordinated.
Figure 4. Bureaus must design, construct, and operate assets to meet a host of regulations.
Cost
As assets age, their condition declines and the cost of restoring them to good or better condition grows. Typically, this decline in condition is not linear; many assets degrade slowly at first, reach an inflection point, and then degrade much more rapidly. The goal of asset management is to lower life-cycle costs by restoring assets before or shortly after that inflection point. The most common example of this is the pavement life cycle. The cost to maintain a busy street in Portland in good condition is far less than repairing or repaving a road in very poor condition. In practice, this means that Transportation work crews focus on
Citywide Assets Report – Asset Management Fundamentals 8
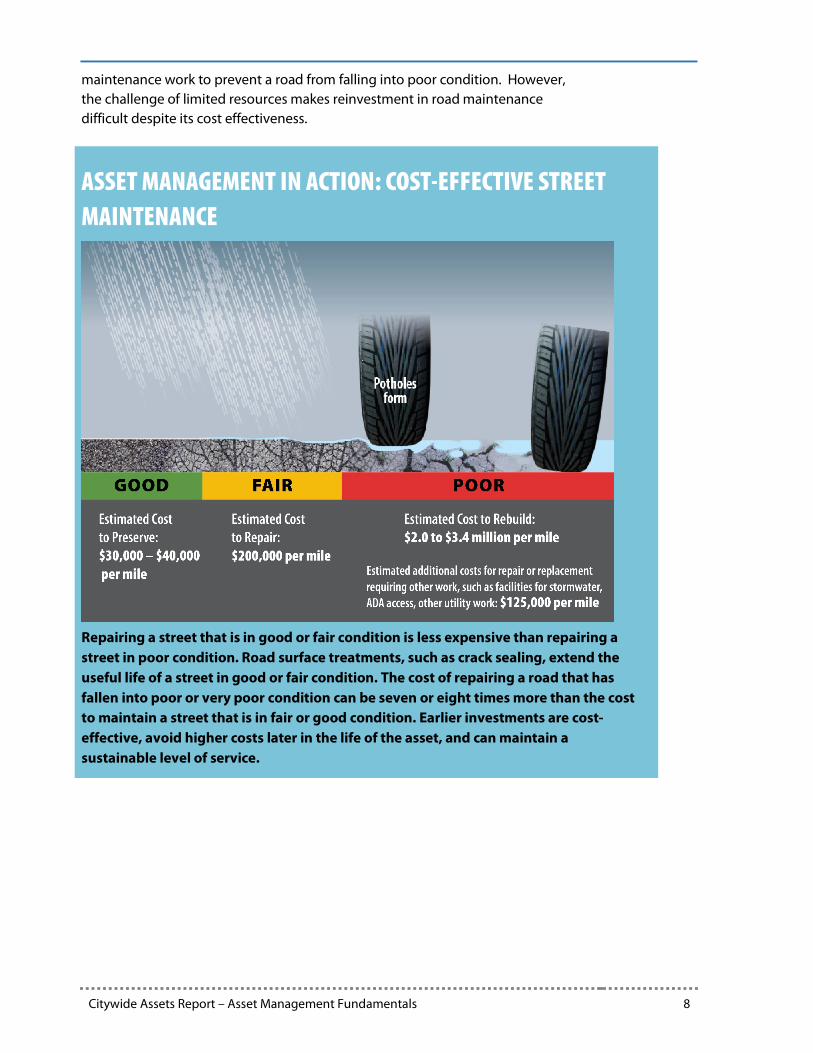
maintenance work to prevent a road from falling into poor condition. However, the challenge of limited resources makes reinvestment in road maintenance difficult despite its cost effectiveness.
ASSET MANAGEMENT IN ACTION: COST-EFFECTIVE STREET MAINTENANCE
Repairing a street that is in good or fair condition is less expensive than repairing a street in poor condition. Road surface treatments, such as crack sealing, extend the useful life of a street in good or fair condition. The cost of repairing a road that has fallen into poor or very poor condition can be seven or eight times more than the cost to maintain a street that is in fair or good condition. Earlier investments are cost-effective, avoid higher costs later in the life of the asset, and can maintain a sustainable level of service.

Citywide Assets Report – City Asset Managers Group 9
3. The City Asset Managers Group Asset management requires expertise in multiple disciplines—including engineering, economics, and finance. Asset managers collaborate with bureau leaders, strategic planners, operations staff, and customers. Applying asset-management principles and practices can—
• support the efficient delivery of services with assets that are cost-effective, well-maintained, accessible, energy-efficient, and safe;
• improve the ability to make sound business and planning decisions; • promote the effective use of resources; and • improve support and accountability.
For more than a decade, the City Asset Managers Group (CAMG) has met regularly to share best practices; policy; and approaches to plan, manage and maintain city assets. This cross-functional group includes representatives from Transportation, Environmental Services, Water, Parks & Recreation, Planning and Sustainability, Emergency Management, and Fire and Rescue as well as City Budget Office and Office of Management and Finance. The group has shared tools for condition assessment, asset valuation, maintenance and replacement prioritization, reinvestment forecasting, and funding strategies. The exchanges provide for learning across disciplines and bureaus, supporting the development of asset management programs, and delivering a citywide approach to asset management.
The CAMG reports periodically to the Planning and Development Directors’ group. This group represents infrastructure, development permitting, financial, and planning bureaus. Findings of the annual assets reports are reviewed and the Directors’ group makes recommendations to City Council during the budget process and in support of major policy decisions affecting built assets.
Collaboration and Coordination
Current collective focus areas for CAMG include:
• Strategies to fund sustainable service levels • Resilience in the face of hazards, including earthquakes and impacts of
climate change • Supporting the City’s equity goals
Table 1 provides the highlights of the bureau work related to the CAMG focus areas:
Citywide Assets Report – City Asset Managers Group 10
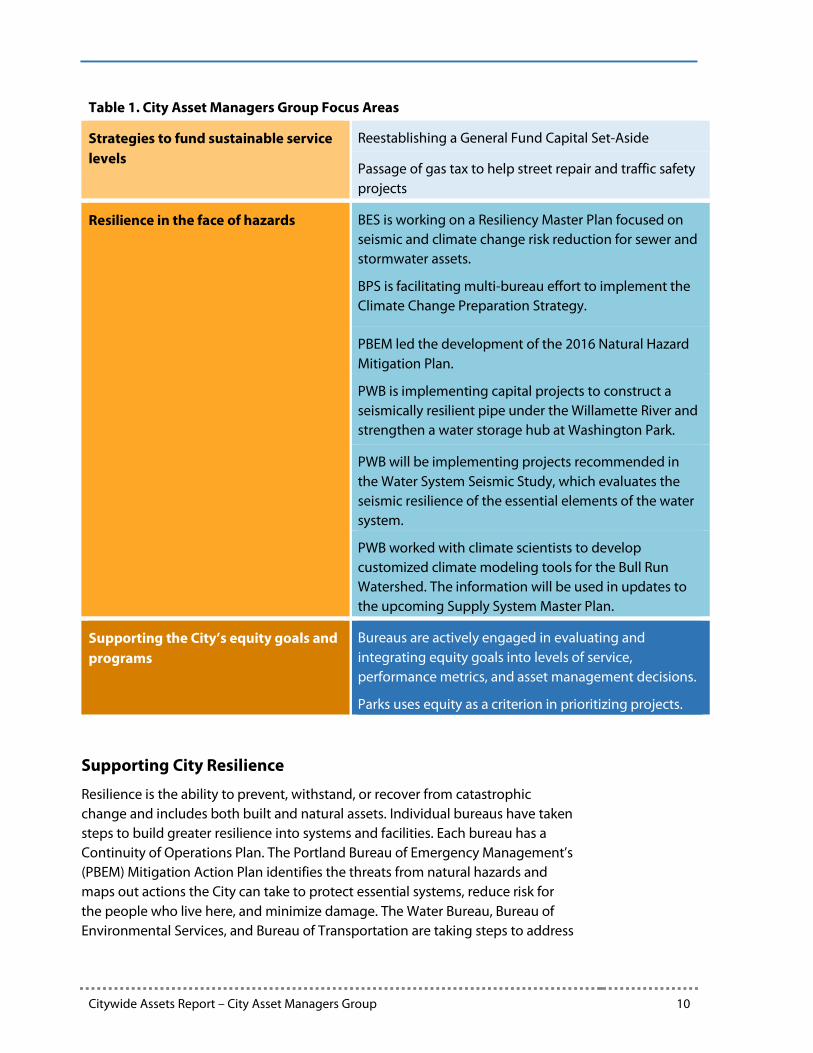
Table 1. City Asset Managers Group Focus Areas
Strategies to fund sustainable service levels
Reestablishing a General Fund Capital Set-Aside
Passage of gas tax to help street repair and traffic safety projects
Resilience in the face of hazards BES is working on a Resiliency Master Plan focused on seismic and climate change risk reduction for sewer and stormwater assets.
BPS is facilitating multi-bureau effort to implement the Climate Change Preparation Strategy.
PBEM led the development of the 2016 Natural Hazard Mitigation Plan.
PWB is implementing capital projects to construct a seismically resilient pipe under the Willamette River and strengthen a water storage hub at Washington Park.
PWB will be implementing projects recommended in the Water System Seismic Study, which evaluates the seismic resilience of the essential elements of the water system.
PWB worked with climate scientists to develop customized climate modeling tools for the Bull Run Watershed. The information will be used in updates to the upcoming Supply System Master Plan.
Supporting the City’s equity goals and programs
Bureaus are actively engaged in evaluating and integrating equity goals into levels of service, performance metrics, and asset management decisions.
Parks uses equity as a criterion in prioritizing projects.
Supporting City Resilience
Resilience is the ability to prevent, withstand, or recover from catastrophic change and includes both built and natural assets. Individual bureaus have taken steps to build greater resilience into systems and facilities. Each bureau has a Continuity of Operations Plan. The Portland Bureau of Emergency Management’s (PBEM) Mitigation Action Plan identifies the threats from natural hazards and maps out actions the City can take to protect essential systems, reduce risk for the people who live here, and minimize damage. The Water Bureau, Bureau of Environmental Services, and Bureau of Transportation are taking steps to address
Citywide Assets Report – City Asset Managers Group 11
the possibility of a major earthquake and the effects of climate change. Parks and the City Facilities Division has begun preparing for major code changes for buildings constructed of unreinforced masonry. In 2017, CAMG will conduct a workshop on disaster recovery with emergency management staff, asset managers, and other stakeholders. The goal is to develop a plan for citywide resources that takes into account local, regional, state, and federal efforts and requirements. Technical analyses and plans become part of each bureau’s risk picture and are factors in bureau capital and operational budget decision-making.
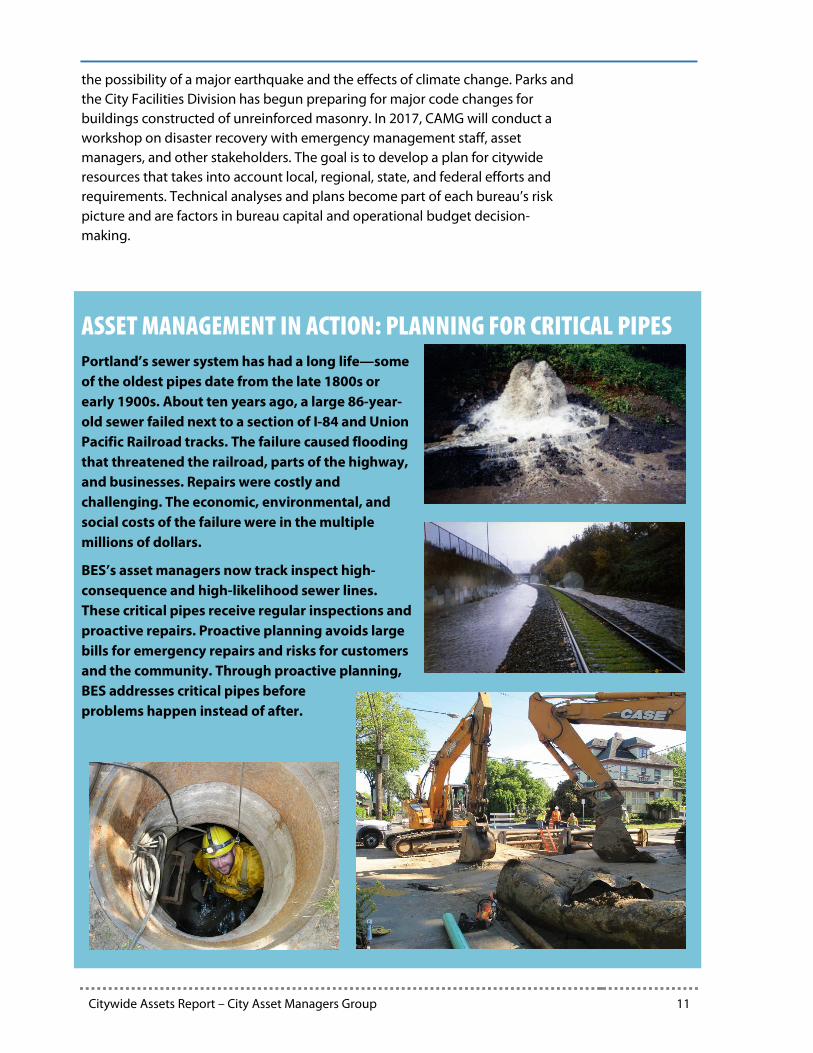
ASSET MANAGEMENT IN ACTION: PLANNING FOR CRITICAL PIPES Portland’s sewer system has had a long life—some of the oldest pipes date from the late 1800s or early 1900s. About ten years ago, a large 86-year-old sewer failed next to a section of I-84 and Union Pacific Railroad tracks. The failure caused flooding that threatened the railroad, parts of the highway, and businesses. Repairs were costly and challenging. The economic, environmental, and social costs of the failure were in the multiple millions of dollars.
BES’s asset managers now track inspect high-consequence and high-likelihood sewer lines. These critical pipes receive regular inspections and proactive repairs. Proactive planning avoids large bills for emergency repairs and risks for customers and the community. Through proactive planning, BES addresses critical pipes before problems happen instead of after.
Citywide Assets Report – City Asset Managers Group 12
CAMG member bureaus support the City’s equity goals through changes to programs, practices, and assets that will result in greater accessibility for diverse communities in Portland. All City bureaus have begun implementing Equity Plans—road maps to improving equity and access for low-income communities, communities of color, and Portlanders living with a disability. Bureau efforts include improving access to information and materials for Portlanders, making infrastructure changes to improve physical access to facilities, and using equity-based criteria to prioritize projects.
Figure 5. All CAMG member bureaus are implementing Racial Equity Plans.

Citywide Assets Report – Budget Implications 13
4. Budget Implications The goal of asset management is to define a sustainable level of service and use best practices to support service delivery at that level. Asset Management provides data and information that supports investment decision-making to reduce risks, maintain or increase service levels for the public, and manage assets at the lowest life-cycle cost, with the goal of making the best use of resources.
When these investment decisions involve dedicated resources, the decision-making is largely internal to the bureau with direction from the Commissioner-in-Charge, with input from stakeholders, oversight for some bureaus from the Portland Utility Board and the Oregon Citizens' Utility Board, as well as the approval of Council through adopted budgets, ordinances, and resolutions.
Ideally, investment decisions are made to consistently intervene and invest in assets at or before the inflection point, when making repairs, rehabilitating, or replacing the asset requires more resources. However, as presented in this report, funding gaps exist that make optimizing asset reinvestment (or early intervention) difficult.
Where funding gaps exist, solutions and opportunities are typically pursued through the citywide budget or an alternative process. Examples include ballot initiatives, Council actions, rate increases requested by utility bureaus, requests of discretionary funding from the General Fund, interagency charge increases for internal service bureaus, or construction bonds. Some of these funding mechanisms are ongoing, such as changes to rates or internal charges. Funding sources such as bonds or ballot initiatives provide a limited-duration influx of funds to address one event or issue, but do not represent a sustainable answer to perpetually underfunded programs. During the budget process, bureaus present specific funding options and investment opportunities as part of their requested budgets. The City Budget Office makes recommendations to Council, and, if adopted, those new resources and projects are budgeted.
When new General Fund resources become available in the forecast, historically, there has been tension between adding new services or enhancing existing ones. Each year, as part of the budget process, the findings of this report are brought to Council as part of the first budget work session with the goal of highlighting that, in order to provide service to the public sustainably, reinvestment in the assets is just as critical as more traditional ongoing costs such as personnel.
Ultimately, a sustainable level of service requires sustained reinvestment to match the decline in asset condition. To defer these costs past the inflection point described above is to increase life-cycle costs, potentially minimizing the resources available to future generations to fund reinvestment and operation of the assets.

Citywide Assets Report – Budget Implications 14
New or more stringent regulations may change the balance among levels of service, risk, and investment. Adopting higher levels of expectation for service— without adjusting funding to meet the service level—may also affect this balance. When funding falls short, asset managers and bureau leaders must make choices: not to meet the new level of service, meet the level of service in one area but reduce service in another, or defer maintenance or disinvest in another asset. When a level of service is expected of assets without commensurate investment in maintenance and repair, the deferred costs are passed on to future users of the asset. Long-term deferred maintenance pushes the burden of repair or replacement to future generations, who will have to pay not only for their own services, but for our failure to pay the full cost of the services we enjoy today.
Sustainable levels of service, in contrast, ensure that we are paying the full cost of the services that we are using today.

Citywide Assets Report – Asset Status, Condition, and Funding 15
5. Asset Status, Condition, and Funding This section includes profiles on each bureau’s mission, approach to asset management, summary statistics on the current asset value, condition, and funding gap, approach to funding and strategies, status of replacement forecasting, and priorities for improving asset management. Bureaus profiled include Transportation, Environmental Services, Water, and Parks. A fifth category, Civic infrastructure, includes facilities such as the Portland Building and spectator facilities, technology services, and facilities and vehicles for the Police Bureau and Portland Fire & Rescue.
West Burnside and 14th Avenue
The Portland Building
Kelly Butte Reservoir
Columbia Boulevard Wastewater Treatment Plant
Foster Floodplain Natural Area Irving Park Play Structure
Asset Status, Condition, and Funding – Transportation 16
Transportation
Profile
The Portland Bureau of Transportation (PBOT) manages transportation assets with a replacement value of over $11.5 billion. The assets that make up the transportation environment—including Portland’s 4,851 lane miles of pavement, the sidewalk system, 156 bridges, 941 signalized intersections, and 56,032 street lights—account for 94 percent ($10.8 billion) of the total replacement value. Assets that support safety and the operation of the transportation environment—including traffic-calming devices, guardrails, traffic signal computer controllers, signs, parking meters, parking garages, pavement markings, bikeways, retaining walls, the Harbor Wall, stairways, the streetcar, and aerial tram—have a replacement value of $739 million. Through data-driven management of our assets, we maintain an effective and safe transportation system that provides people and businesses access and mobility: we keep Portland moving.
Asset Management Approach
PBOT owns and maintains 13 asset classes. Discretionary revenue to operate and maintain the transportation system has been limited at the same time as the inventory of assets grows to meet the expanding needs of the system. Evaluation of asset condition, level of service targets, and unmet need indicates that PBOT does not have adequate revenue to maintain existing infrastructure. Generating new revenue to address unmet needs has been a priority that helped lead to the passage of two new taxes, one focused on motor vehicle fuels and the other on heavy vehicle use. This new revenue funds the Fixing Our Streets program, which is estimated to contribute $42 million towards pavement improvements and $32 million towards safety projects over the next four years. Even with these new funding streams, PBOT still requires $223 million per year for 10 years to meet the level of service goals of its assets.
Asset Management Highlights / Achievements
Pavement: After more than 20 years discussing street user fees, Measure 26-173 was passed by voters in May 2016. This measure introduced a ten-cent tax on motor vehicle fuels and represents both the City’s first local gas tax as well as its first funding source dedicated to street repair and traffic safety projects. The collection of the tax began on January 1, 2017, and is expected to raise an estimated $64 million over four years. A Heavy Vehicle Use Tax, also passed in May, will add approximately $10 million over the same period. The money brought in through this program, known as Fixing Our Streets, will be directed to costly rehabilitation projects, including base repair, and safety improvements, which include shoulder widening and sidewalk improvements. Twenty base repair projects have already been completed. This much-needed infusion of capital will help to bend in the curve in addressing PBOT’s pavement backlog.

Asset Status, Condition, and Funding – Transportation 17
Signals and Street Lighting: In 2013, PBOT began installing light-emitting diodes (LEDs) in street lights citywide and, by the end of 2017, almost all of the city’s 55,000 street lights are expected to employ LEDs. Implementation of this new technology extends the life of bulbs from five to 20 years and results in an energy savings of up to 50 percent. In previous years, 80 percent of the city’s street lights were maintained by Portland General Electric at a cost of $664,000 per year. By the end of 2017, street light maintenance will be performed entirely by PBOT at a cost savings to the City. Benefits of this LED conversion program include:
• Reduced energy consumption, and energy costs cut nearly in half • Reduced maintenance frequency as bulbs last longer • Reduced maintenance costs through less frequent service and by performing
work in-house • Reduced waste (fewer bulbs being thrown away) and energy efficiency
improvements
Current Asset Value and Condition
The Bureau of Transportation manages assets valued at over $11.5 billion. The majority of PBOT's paved assets (55 percent) are in poor or very poor condition (broken out by arterial/collector and local streets in Appendix 1b). The condition of sidewalks is evenly split between those in good and very good condition, and those in poor or very poor condition (35 percent each). Bridge assets are primarily in fair condition (63 percent). Signal hardware and street lights are primarily in good to very good condition at 40 percent and 78 percent, respectively.
Annual Funding Gap
PBOT’s funding gap, or unmet need, is the amount of additional resources required to bring assets to fair or better condition. The baseline unmet needs for preventive maintenance, rehabilitation, and replacement of existing assets amounts to $223 million per year over 10 years.
The bureau’s commitment to Vision Zero, Equity, and creating a complete system requires consideration not just of the current condition of existing infrastructure, but the desired condition. The funding gap for PBOT to ensure the system is complete and safe is expected to be $1.4 billion. This number is derived from the Portland Transportation System Plan and is not included in the breakout of funding gap by asset type as detailed in Appendix 3f.
Funding Approach and Strategies
In an effort to move from characterizing asset management issues to addressing them, the following bureau priorities and opportunities have been identified:
Asset Status, Condition, and Funding – Transportation 18
1. Clarify PBOT’s discretionary funding
To get a true understanding of PBOT’s position for managing over $11.5 billion of assets, there must be clarity around the funds available for this use. The majority of funding that PBOT receives has restrictions on its use; these include federal and state grants, local fuel tax dollars, parking garage revenue, fees, and service charges.
Local funding sources typically have dedicated restrictions for their expenditures, such as project purpose, scale, timing, or location. External sources tend to focus on programmatic goals (e.g., climate change or safety), target specific types of investments (e.g., streetcar) or specific geographies.
The General Transportation Revenue and limited General Fund resources provide some flexibility in how their dollars can be spent making them most useful for funding broad, over-arching operations and maintenance expenses. A large percentage of these funds are committed to maintaining basic transportation function as soon as they are awarded; for example, $6.1 million of General Fund revenue to maintain street lights, and “keep the lights on.” Beyond providing basic transportation services, some of PBOT’s budget is committed to work performed for other bureaus: in 2016, PBOT provided $23 million of services for BES and $2.4 million of services for PWB.
Considering the many demands on PBOT’s budget and uncertainty around external funding sources, it can be challenging to discern the resources available for regular asset maintenance and operation needs.
2. Identify new sources of revenue
Portland will continue to grow, which will increase demands on an already encumbered transportation system. Congestion relief, maintenance, and safety are priorities for Portlanders and will continue to be of concern in a growing city. PBOT needs to identify revenue sources that can keep pace with Portland’s growth, accommodate system expansion and its associated infrastructure maintenance needs, and ensure the system is safe for all users. Several sources of additional revenue to address PBOT’s current funding gap and potential future needs are identified below; both City and external sources are included.
2.1. City Sources
2.1.1. Leverage savings from other programs
The street light conversion to LEDs is expected to save roughly $2 million per year in maintenance and energy costs. After debt servicing for a period of nine years, PBOT can direct money from street light energy savings to capital replacement reserves in support of both street lights and signals, with Council approval.

Asset Status, Condition, and Funding – Transportation 19
2.1.2. General Fund contributions
Support for citywide efforts to fund infrastructure with innovative methods
Currently, the City holds revenue bonds for parking structures, the streetcar, parking meters, and other transportation-related facilities. Early repayment of these bonds could result in increased ongoing funding that could be re-invested (through bonding) in transportation infrastructure. Some bonding mechanisms restrict the funding to capital assets; however, PBOT already devotes a certain amount of flexible General Transportation Revenue and General Fund to capital assets. This mechanism may allow PBOT to divert existing flexible dollars into transportation infrastructure maintenance and allow the “new” bonded revenue to replace the capital asset dollars. This is an option, although one not recommended by PBOT, due to the interest associated with bonds.
2.2. External Sources
Lobby for additional gas tax revenues at the state level
Gas tax revenue is not increasing at a rate fast enough to cover cost of services, thus the maintenance and service gap of local transportation agencies persists. PBOT continues to push for additional revenue from the state’s collection of gas taxes through ongoing campaigns. It is estimated that an increase of 1 cent in statewide gas tax leads to approximately $2 million in investment in Portland’s multi-modal transportation system.
Regional investment strategies
The Portland metro region is a considerable driver of the state economy and also faces significant capital and maintenance needs. A regional approach to funding transportation infrastructure needs would ensure that Portland builds a coalition and provides a united voice on these issues. Some regional agencies are discussing a potential transportation bond measure. Efforts like these may become increasingly necessary as state and federal resources diminish.
3. Confirm priorities
Both the City Council and the bureau have been successful in implementing numerous programs targeted at improving safety and mobility across the city. New programs like Vision Zero and Biketown, as well as additional assets like buffered bike lanes and rectangular rapid flashing beacons, are among the investments made to deliver on programmatic goals such as safety. While this work is already paying dividends in increasing safety and mobility in Portland, it also has the result of drawing resources away from the asset reinvestment that is critical to addressing our transportation functions. As with other infrastructure bureaus, PBOT must find balance in resource dedication between programmatic service levels and management of assets supporting service delivery. Affirming these priorities will guide the bureau’s long-term investment strategy.
Asset Status, Condition, and Funding – Transportation 20
4. Increase inter-bureau coordination
Transportation improvements require the upgrading or installation of additional infrastructure, such as ramps to fulfill requirements of the Americans with Disabilities Act (ADA) and stormwater systems, concurrently with capital and capital maintenance projects. Stormwater improvements are among the most costly additions to transportation projects. At times, BES will provide the funding for PBOT to do needed stormwater upgrades concurrent to the BES transportation project. When this funding is not available, project costs may balloon and make a project infeasible. Improving the partnership between PBOT and BES, and better defining how and when funding will be committed on projects will help each bureau reap the benefits of delivering on project goals efficiently, effectively, and at reduced cost.
5. Balance potential trade-offs
Absent new revenue sources, PBOT will need to prioritize potential trade-offs. Lacking the resources for reinvestment in our assets, our present level of service is unsustainable. PBOT should therefore consider reducing the number assets it owns and maintains, or scaling back its level of service. City Council and the bureau should determine together what level of risk they are willing to accept should an asset fail and, based on this, determine which assets to deprioritize or remove from the bureau’s portfolio entirely. One option is to identify the asset classes or features receiving the least amount of reinvestment, and, where no law requires a set level of service, weigh the cost of continued maintenance versus the potential benefit of reinvesting these resources elsewhere.
Replacement Forecasting
PBOT’s asset replacement costs are based on the available estimates by type; actual replacement costs vary by location. PBOT’s total asset replacement cost of $11.5 billion does not include the right of way. Specific replacement values are details are included in Appendix 1b.
Asset Management Improvement Priorities
Bending the curve
The needs of our assets given their number and condition are numerous. To illustrate the size of the need, consider that PBOT is able to perform approximately 100 miles of preventive maintenance on pavement each year. With 4,851 lane miles of pavement, it would take nearly 49 years to touch each segment of road. Fixing Our Streets funding will address some of PBOT's maintenance needs and help us to bend the curve of our assets’ deterioration. Similarly, PBOT will continue to prioritize maintenance investments to ensure the right treatment occurs at the right place at the right time.

Asset Status, Condition, and Funding – Environmental Services 21
Bureau of Environmental Services The Bureau of Environmental Services (BES) Environmental Services protects public health, water quality and the environment by providing sewage and stormwater collection and treatment services to accommodate Portland's current and future needs. BES protects the quality of surface and ground waters and conducts activities that plan and promote healthy ecosystems in our watersheds.
Asset Management Approach
BES has a long history of utilizing asset management strategies to plan, prioritize and implement asset maintenance, repair and rehabilitation – in particular for the sanitary and combined collections system. BES Systems Plans incorporate asset management principles to prioritize projects to address the highest risks. The bureau’s performance measures include levels of service (LOS).
In 2016, BES developed an Infrastructure Reinvestment Strategy to guide future asset management work. The Infrastructure Reinvestment Strategy provides insight into improvements needed for asset inventory, condition assessment, and capital investments for BES’ major asset classes. Below are highlights of the asset management approaches and key topics within the major asset classes.
• BES applies asset management practices of asset inventory, condition assessment, and computerized maintenance management systems for the system components of treatment and collections systems.
• The Combined and Sanitary Systems Plans for the collections system incorporates a robust system inventory, condition assessments, GIS data, and failure records in an asset-management context to develop prioritized approaches to improving asset condition and capacity to meet levels of service. The Combined and Sanitary Systems Plans feeds into the annual planning process for the CIP. The Capacity, Management, Operation & Maintenance (CMOM) program directs maintenance priorities and investments in operational improvements.
• Maintenance, repair, and capital asset reinvestments at the wastewater treatment plants are prioritized and implemented according to Operations and Maintenance Plans and each treatment plant’s Facility Plan. Condition assessment data collection and planning analysis of reinvestment needs is underway for wastewater treatment assets.
• Asset management-focused system planning efforts are currently being developed for the stormwater system and for pump station assets. Condition assessment data and planning analysis of reinvestment needs is required for both of these asset classes.
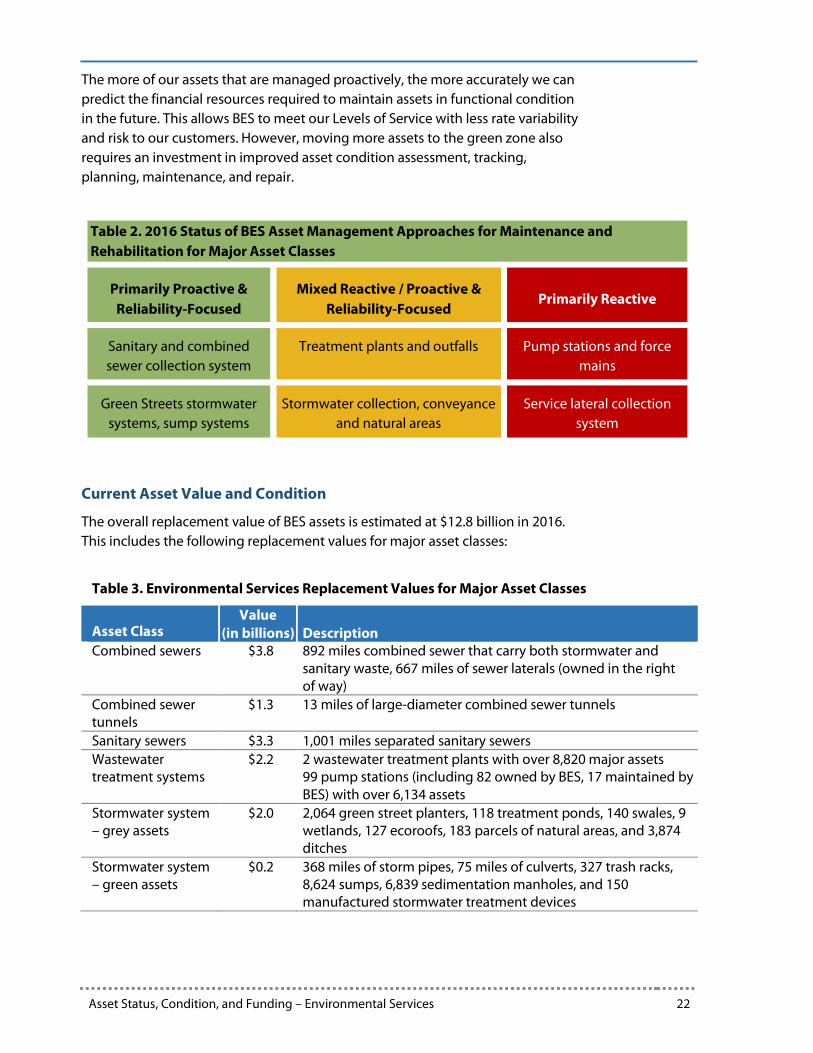
Below is a summary table showing how each of the major asset classes is currently managed for maintenance and reliability. One of the goals of BES’s Infrastructure Reinvestment Strategy is to move more asset classes to the “green zone” of Proactive and Reliability–Focused maintenance and rehabilitation.
Asset Status, Condition, and Funding – Environmental Services 22
The more of our assets that are managed proactively, the more accurately we can predict the financial resources required to maintain assets in functional condition in the future. This allows BES to meet our Levels of Service with less rate variability and risk to our customers. However, moving more assets to the green zone also requires an investment in improved asset condition assessment, tracking, planning, maintenance, and repair.
Table 2. 2016 Status of BES Asset Management Approaches for Maintenance and Rehabilitation for Major Asset Classes
Primarily Proactive & Reliability-Focused
Mixed Reactive / Proactive & Reliability-Focused
Primarily Reactive
Sanitary and combined sewer collection system
Treatment plants and outfalls Pump stations and force mains
Green Streets stormwater systems, sump systems
Stormwater collection, conveyance and natural areas
Service lateral collection system
Current Asset Value and Condition
The overall replacement value of BES assets is estimated at $12.8 billion in 2016. This includes the following replacement values for major asset classes:
Table 3. Environmental Services Replacement Values for Major Asset Classes
Asset Class Value
(in billions) Description Combined sewers $3.8 892 miles combined sewer that carry both stormwater and
sanitary waste, 667 miles of sewer laterals (owned in the right of way)
Combined sewer tunnels
$1.3 13 miles of large-diameter combined sewer tunnels
Sanitary sewers $3.3 1,001 miles separated sanitary sewers Wastewater treatment systems
$2.2 2 wastewater treatment plants with over 8,820 major assets 99 pump stations (including 82 owned by BES, 17 maintained by BES) with over 6,134 assets
Stormwater system – grey assets
$2.0 2,064 green street planters, 118 treatment ponds, 140 swales, 9 wetlands, 127 ecoroofs, 183 parcels of natural areas, and 3,874 ditches
Stormwater system – green assets
$0.2 368 miles of storm pipes, 75 miles of culverts, 327 trash racks, 8,624 sumps, 6,839 sedimentation manholes, and 150 manufactured stormwater treatment devices
Asset Status, Condition, and Funding – Environmental Services 23
The 2016 overall replacement value estimate represents a -5 percent difference (-$0.7 billion) from the 2015 estimate. Multiple factors contributed to the decrease in the system value estimate, with the primary factor being that the system value is estimated based on replacement costs. More detailed and accurate cost estimates have been available from recent projects to provide the current system replacement value.
The replacement value of all assets is based on the replacement cost of building or purchasing the assets, and does not include an estimate of the value of ecosystem benefits provided by the assets, such as the value of the clean water produced. The replacement value of green stormwater assets also does not include an estimate of the increased value of assets that have become more valuable since they were purchased or built through natural system maturity. BES does not currently have a methodology for determining the increased value.
The condition of BES assets and knowledge of condition status varies by asset type considerably. BES has the most robust asset management approaches in place for regularly assessing condition of the sanitary and combined sewers and the stormwater green street facilities.
The proportion of assets within each of the condition categories is assigned based on length for sewers; asset quantity and value for wastewater assets; length or quantity for grey storm assets; and replacement value of facilities for green storm assets. Natural areas comprise a large proportion of green assets in the category of TBD, or To-Be-Determined. The City's 2,000+ green street facilities are regularly maintained to a functional (good) condition and comprise the 29 percent of green stormwater assets in good condition.
Stormwater system assessment is ongoing, however significant data gaps exist. Sewer rehabilitation is a CIP focus, however as poor and very poor pipes are repaired, additional pipe is identified in those categories.
Annual Funding Gap
BES’ current revenue requirements largely revolve around the need to repair and maintain the collection system, address upcoming and deferred maintenance needs, address deficiencies in the stormwater system, continue to improve watershed health, and meet applicable regulatory requirements.
The financial plan includes an ambitious pipe rehabilitation program focused on pipes with the highest risk, primarily older pipes in the combined system. The financial plan also includes many, but not all, of the recommended capacity related projects from the Systems Plan to reduce the risk of surface flooding and basement sewer back-ups resulting from undersized pipes.
BES has committed to providing funds for repair of structurally deficient portions of the sewer collection system, and the long-term financial forecast anticipates significant expenditures for capital maintenance over the forecast interval. System repairs, rehabilitation, cleaning, and inspection are expected to remain the largest
Asset Status, Condition, and Funding – Environmental Services 24
component of the operating budget over the next five years, accounting for nearly 20 percent of operating expenditures.
BES’ growing portfolio of green infrastructure assets, which includes natural areas and over 2,000 green street facilities, requires an increasing amount of operations and maintenance funding to protect past capital investments and ensure stormwater management performance.
The funding gap is based on the following:
• R/R/R: The difference between the replacement value of assets in very poor condition and the amount of funding in the financial plan for rehabilitation of those assets. The gap assumes all sanitary pipe rehabilitation projects in the proposed financial plan proceed as programmed.
• The extent of stormwater system needs is unknown. The estimated gap makes assumptions about rehabilitation and capacity needs for the entire system.
• Capacity/Combined Projects: Projects recommended in the Systems Plan with positive benefit/cost ratios (primarily those that address conveyance of the 2-year storm in combination with deteriorated pipes) that are not included in the financial plan. Note that the gap does not include projects required to meet the stated level of service for conveying a 25-year storm.
• The Stormwater system valuation reflects the piped system and other constructed facilities (such as sumps and green streets) as well as natural areas purchased by BES. The valuation does not include natural systems such as the streams upon which our stormwater system relies. Neither the value of the streams nor the funding gap to address watershed health/habitat or anticipated regulatory changes related to the Municipal Separate Stormwater System (MS4) permit are represented.
Funding Approach and Strategies
BES is an enterprise bureau funded through sewer and stormwater charges, System Development Charges (SDCs), wholesale contract revenues from other jurisdictions, and reimbursements for services provided to other bureaus. The bureau’s operating and capital construction expenditures together account for about 52 percent of the funding requirements. The remainder is taken up largely by construction financing. Construction financing includes primarily principal and interest payments on the revenue bonds sold to finance capital construction activity, which constitutes 41 percent of the total. Funding the highest-priority proposed CIP and Operating Plan requirements is projected to require annual rate increases that are approximately consistent with the overall average inflation rate.
Replacement Forecasting
System rehabilitation needs are anticipated to increase significantly in the near future. More than 30 percent of the collections system is over 80 years old. Portions of the wastewater treatment plants and pump stations are also nearing the end of useful life spans or experiencing condition degradation and failures.
Asset Status, Condition, and Funding – Environmental Services 25
BES is anticipating increasing infrastructure replacement and repair needs, and has committed to providing funds in the CIP for repair of structurally deficient portions of the sewer collection system, to address capacity issues, and to repair or replace failing wastewater treatment and pumping assets. The long-term financial forecast anticipates significant capital maintenance and asset rehabilitation expenditures, and projected rates address these needs.
BES’ CIP is growing to account for regulatory-driven projects at the wastewater treatment plants and projects to address failing and poor-condition assets. The adopted fiscal year (FY) 2017–21 five-year CIP describes a program ranging from $104 million a year to $115 million a year. BES’s FY 2018–22 proposed five-year CIP is expected to grow to a range of $113–$157 million a year. In out years (FY 2023–27), the long-term financial forecast anticipates a five-year CIP in the range of $150–160 million year to provide a prudent reinvestment strategy based on asset value, age, and condition.
As the Condition Assessment program is implemented and additional data are gathered regarding asset condition, new projects and expanded scopes of existing projects will be identified in the CIP. Staffing required to deliver the CIP is likely to grow over time as well.
Asset Management Improvement Priorities
BES’s asset management priorities include:
1. Improving condition assessment for asset classes lacking adequate data and implementing the Infrastructure Reinvestment Strategy through the expanded CIP. One of the key goals of BES’s Infrastructure Reinvestment Strategy is to move more asset classes to the green zone of Proactive and Reliability–Focused maintenance and rehabilitation. BES is developing an approach to expanding its condition assessment program to include more robust and timely analysis of assets at the wastewater treatment plants, pump stations, force mains, and stormwater system assets.
2. BES is developing a Resiliency Master Plan (RMP) to identify actions to reduce BES systems’ vulnerability to risks from earthquakes and climate change. The results of the RMP will be used to identify benefits and costs of actions for resiliency; to integrate resiliency further into the BES CIP and operational practices; and to recommend a strategy for resiliency investment to protect ratepayers while managing long-term rate impacts.
3. BES will also be working to continue to connect its strategic planning work throughout the bureau with its levels of service and performance measures, ensuring measures that are tracked are meaningful for both guiding staff work and meeting customer expectations. BES is improving methods for tracking risk reduction as a result of the CIP investments.
4. BES is exploring policy options for improving sanitary service lateral condition and reliability. BES owns the portion of the lateral from the mainline pipe to the property line and manages to the curb, and the private landowner owns the portion of the lateral from the property line to the structure. Broken service

Asset Status, Condition, and Funding – Environmental Services 26
laterals can cause basement sewer backups and system infiltration that uses valuable capacity in the system. Seventy-two percent of the unplanned repair work on the sanitary and combined system occurs on service laterals. One policy option being considered to reduce service lateral failure is a point-of-sale inspection and repair policy.
BES is evaluating internal process improvements to support increasing the accomplishment rate of the CIP. In recent years, BES has not been able to deliver the full CIP planned in each fiscal year, resulting in a rollover of backlog into the next year and a compounding workload challenge. With projections for the necessary CIP work growing significantly over the next five years, BES will be focusing on organizational improvements in staffing and delivery to deliver the CIP as planned.

Asset Status, Condition, and Funding – Water 27
Portland Water Bureau
Profile
The Portland Water Bureau (bureau) delivers clean, safe, and reliable drinking water to almost one million people in the region, or one-quarter of the people in Oregon. About 65 percent of the water delivered serves retail customers in the city; the remaining 35 percent is provided on a wholesale contract basis to 19 cities, special districts, and private water company customers surrounding Portland.
The Water Bureau’s major assets include two water sources, 39 pump stations, 60 standpipes, tanks, and reservoirs, nearly 2,300 miles of pipe, more than 14,000 hydrants, 130 drinking fountains, and more than 180,000 customer service pipes, as well as facilities, vehicles, and equipment.
Asset Management Approach
The Water Bureau’s Asset Management Program continues to develop industry best practices. In a 2015 nationwide review of utilities, sponsored by the American Water Works Association, the Water Bureau scored in the top 10 percent in managing risk, developing strategies through asset management plans, evaluating benefits and costs in business cases, and using service levels to measure progress.
A focus of the bureau’s risk management program is addressing the bureau’s high-risk assets. Asset managers have led several projects to identify and assess assets with high consequences of failure, including more than 32 miles of pipe. Asset managers also collaborate with field staff to improve data-collection processes and the quality of the data, which are used for failure modes analyses and forecasting asset life. The Water Bureau is finalizing a major study to assess the seismic performance of the water system in a magnitude 9.0 earthquake. The final study will provide recommendations for projects to achieve the recovery goals of the Oregon Resilience Plan.
Bureau engineering staff have completed more than 20 asset management plans (AMPs). AMPs provide detailed assessments of asset condition and risk as well as recommended strategies for maintenance, repair, and replacement. Strategies from AMPs are evaluated and selected by a cross-functional committee of staff and managers for consideration for further study and implementation. Key capital projects that have been implemented from AMP strategies include addressing the seismic risks of tanks, using reliability centered maintenance principles to efficiently maintain pumps, strategically inspecting and strengthening high-consequence pipes, and developing a strategy for valves on high-consequence pipes.
Since 2014, asset management and engineering planning have developed business-case evaluations for more than 50 projects. The evaluations—based on triple-bottom-line factors of economic, environmental, and social

Asset Status, Condition, and Funding – Water 28
consequences—have reduced risks or avoided costs estimated at approximately $18 million.
In 2016, the Water Bureau surveyed customers on its Key Service Levels. Customers expressed expectations about the bureau’s general service; gave feedback on targets and performance in customer service, planned and unplanned outages, communication, and water quality; and provided input on directions for future investments. The data will be used in a larger project that is underway to improve service levels and performance management.
Current Asset Value and Condition
The Water Bureau manages assets valued at $8.4 billion, with mostly moderate levels of confidence in the condition assessments. The 2016 overall replacement value estimate represents a slight increase of almost 3 percent ($0.2 billion) from the 2015 estimate. The net increase in replacement value is primarily due to the inflation rate increase in the Construction Cost Index from the Engineering News-Record.
Potable water pipes are difficult and costly to inspect directly because the majority are buried underground, operated full of water and under pressure, and require sanitary inspection equipment. The Water Bureau assesses the distribution system pipes condition by checking for leaks on a seven-year recurring cycle (covering approximately 15 percent annually), and performs more in-depth inspections on critical assets when economically justified. For pipes that don’t have a strong business case to inspect, condition is estimated using parameters such as pipe age and material, leak or break history of the actual pipe or similar pipes, and environmental conditions. Condition assessment for other assets— such as tanks, pump stations, and electronic equipment—are conducted as part of scheduled maintenance.
Nearly 70 percent (69.4 percent) of water system assets are in good to very good condition; almost 8 percent (7.6 percent) are in poor or very poor condition. The highest concentration of poor assets is in the Terminal Storage program where the bureau is actively investing to strengthen the Washington Park Reservoir, a key asset.
Annual Funding Gap
The Water Bureau’s annual funding gap is $18.7 million, with the greatest gap occurring in the distribution system (estimated at $10.3 million). The funding gap is based on projects that have been identified through long-term studies, asset management plans, regulatory compliance planning, or other planning efforts. The identified projects include multiple projects to harden essential elements of the water system in the event of an earthquake or other catastrophic event; projects to accommodate improvements to roads, sewers, and other systems by local agencies; and other projects to address risk or improve water service for customers.

Asset Status, Condition, and Funding – Water 29
Funding Approach and Strategies
Water Bureau projects are funded from a combination of net proceeds from revenue bond sales, water sales revenue, interagency and other construction fund revenues such as system development charges and interest earnings. Capital program planning at the Water Bureau is a collaborative effort among CIP Planning, Asset Management, and Engineering Management teams. The asset management process also helps guide budget decisions on an effective mix of maintenance, repair, and replacement for water system components.
The primary drivers of the bureau’s capital work have been ensuring the reliable functioning of the drinking water system, replacing assets that are at or near the end of their useful lives, and achieving compliance with federal and state drinking water regulations. The current focus is strengthening the system to withstand a catastrophic event, such as an earthquake, inspecting and strengthening critical pipes and associated systems, and continuing to meet all drinking water regulations.
Replacement Forecasting
The Water Bureau is developing replacement forecasts for water system assets. The forecast planning horizon is the 50 years from 2020 to 2070. Substantial portions of the forecast will be completed later in 2017.
Asset Management Improvement Priorities
A two-year Asset Management Tactical Plan, approved by bureau leadership, guides the work of PWB’s asset management program. Current improvement priorities include:
• Forecasting replacement needs and funding requirements • Continuing to improve management of high-risk assets • Expanding risk management to incorporate analyses of organizational risk • Supporting seismic resilience projects • Implementing life-cycle asset planning • Improving maintenance, repair, and replacement strategies that optimize
asset useful life while maintaining desired level of service • Improving performance measurement and management through Key
Service Levels
Forecasting Replacement Needs and Funding Requirements
The Water Bureau is developing replacement forecasts for the major assets in the distribution, supply, support, terminal storage, transmission, and hydroelectric programs.
Improving Management of High-Risk Assets
In addition to recording and assessing more than 900 asset risks, the bureau has implemented improvements in gathering, recording, and analyzing risk data. Asset managers work with field staff that assess pipe condition to improve the

Asset Status, Condition, and Funding – Water 30
quality and reliability of the data and have estimated pipe age using data for more than 300 miles of pipe where no previous information was available.
Systematic inspection of critical pipes and related appurtenances, such as valves, have been standardized and opportunistic data collection from main breaks has yielded important failure data. The methods developed for large pipe inspection will be used in a multi-year contract to inspect the system’s largest pipes—the conduits from the Bull Run Watershed.
Incorporating Analyses of Organizational Risk
The bureau’s Asset Management Steering Committee recently determined that addressing organizational risk is a high priority for the bureau to tackle. A proposal to integrate organizational risks into the current asset risk-management program is under development.
Supporting Seismic Resilience Projects
The bureau conducted a customer survey in 2016 to investigate attitudes and opinions about the bureau’s service levels. The survey included two questions related to seismic resilience. The majority of customers (81 percent) reported being somewhat, moderately, or very concerned about a major earthquake affecting the City. A larger percentage (88.5 percent) said it was moderately or very important to invest customer dollars in water-system improvements to prepare for a major earthquake. The bureau will be using the feedback from this and other questions as it reviews and improves its service-level goals.
Implementing Life-Cycle Planning
The bureau has developed a mobile interface for the its computerized maintenance and management system (CMMS) for work orders. Development of a time and resources module for the mobile work system is nearly complete. When field staff are able to record costs, asset managers will be able to use accounting data to make more reliable estimates for asset life cycle costs.
Improving Maintenance, Repair, and Replacement Strategies
In addition to implementing the mobile CMMS system, the bureau has implemented standardized processes for developing facility drawings, gathering field failure data, performing leak tests, and analyzing the mix of proactive and reactive maintenance actions.
Improving Performance Measurement and Management
The bureau has completed a 2016 survey of bureau customers on its Key Service Levels. The results of the survey will be used, along with an audit of service levels from best-practice leaders and a review of bureau service levels and performance measurement, to improve performance measurement and management.
Specific accomplishments and the details of asset management progress are documented in an annual report, published each spring.

Asset Status, Condition, and Funding – Parks & Recreation 31
Portland Parks & Recreation
Profile
The mission of Portland Parks & Recreation is sustaining a healthy park and recreation system to make Portland a great place to live, work and play. Portland Parks & Recreation (PP&R) helps Portlanders play —providing the safe places, facilities, and programs that promote physical, mental, and social activity. We get people, especially kids, outside, active and connected to the community. As we do this, there will be an increase in the wellness of our residents and the livability of our city.
PP&R is the steward of a diverse portfolio of parks, natural areas, urban forest and recreation facilities used extensively by the city's residents and visitors. The total parkland managed by the bureau is 11,712 acres and represents about 14 percent of the geographic area within the City of Portland. Additionally, PP&R staff care for 238,000 street trees. The bureau operates 13 swimming pools, 11 community centers, three music/dance centers, six golf courses and one motor raceway, and owns steam locomotives.
Asset Management Approach
PP&R's nascent Asset Management Program includes a program of portfolio condition assessment, major maintenance prioritization, work order optimization and administration, CIP administration, and other program areas. Bureau-wide implementation of AM principles includes using business cases, divestment of surplus assets, formalized design review for maintainability, natural asset management, and level-of-service planning.
Highlights from recent asset management efforts include: disposal of the Mt. Tabor Annex Unreinforced Masonry building as non-core to PP&R's primary mission areas, formalization of an Assets at Risk business case evaluation process, completion of system-wide playground condition assessment, and shift in major maintenance and bond project prioritization to a risk-based model.
Current Asset Value and Condition
Current replacement value is estimated at $1.4 billion. An estimated 36 percent of assets (unweighted) are in Good or Very Good Condition.
Annual Funding Gap
PP*R's Major Maintenance Funding Gap is estimated at $25.8 million per year for the next ten years. An estimated $472 million is also needed to close level-of-service gaps citywide.
Funding Approach and Strategies
Bureau funding sources include City of Portland taxes, bonds, System Development Fees, and user fees for services totaling almost $150 million:

Asset Status, Condition, and Funding – Parks & Recreation 32
Figure 6. Funding sources for Portland Parks include General Fund contributions, service fees, enterprise funds, System Development Charges, and bonds. aPIR is Portland International Raceway
Replacement Forecasting
Estimates place over one-third of PP&R assets as aged beyond a normally expected service-life, with half of that portion well beyond service life. Based on industry-standard lifecycle models, an additional one-fifth of the portfolio is near the tipping-point in optimal investment: excessive risk and even more increased O&M costs can be avoided with targeted investments in the next five years. The Asset Management program seeks to specify and prioritize these high-return investments.
$25,000,00017%
$13,000,0009%
$11,000,0007%
$61,000,00042%
$25,000,00017%
$12,000,0008%Service Fees
Enterprise Funds (Golf, PIRa) System Development Charges
Parks Bond (primarily Major Maintenance)
General Fund One-Time Packages (Major Maintenance)
General Fund Ongoing
Asset Status, Condition, and Funding – Parks & Recreation 33
Asset Management Improvement Priorities
PP&R intends to expand and evolve the Asset Condition Assessment program in the coming year by completing more buildings, completing hard-surface outdoor play courts (tennis, basketball, etc.), and formalizing the processes by which condition assessment results translate to funded capital projects.
Second, in an attempt to accelerate a small portion of major maintenance investment, PP&R will pilot and then expand an Energy Savings Performance Contract. This specialized project type re-purposes wasted energy cash-flows to modernization, such as investment in energy consuming equipment and systems, thus reducing O&M, reducing deferred maintenance, and supporting Climate Action Plan goals.
Finally, PP&R has requested resources to complete system-wide seismic risk analyses of the highest-priority sites and take steps at reducing seismic event risk, both as a service provider in emergencies and as an owner of assets with a high degree of occupancy by the general public. PP&R’s capacity to identify, prioritize, and mitigate seismic risks in our substantial, dispersed, public building portfolio is completely dependent on approved funding for these activities.

Asset Status, Condition, and Funding – Civic 34
Civic
Profile
The Civic Assets asset management program includes three asset groups: Facilities, Vehicles, and Technology. The Facilities group includes facilities managed by the Office of Management and Finance (Police facilities, office buildings, other buildings, Union Station, and spectator facilities) and facilities other organizations manage (Portland Fire & Rescue [PF&R] facilities and Portland Center for the Performing Arts). The Vehicles group includes City vehicles that the Office of Management and Finance (OMF) owns and manages through its Bureau of Internal Business Services Fleet Services Division and PF&R apparatus. The Technology group includes the technology assets that OMF owns and manages through its Bureau of Technology Services (BTS) and the Enterprise Business System owned and managed by Enterprise Business Solution division.
OMF takes the lead for the Civic Assets group and coordinates with Fire and Rescue on the report.
Asset Management Approach
Asset management serves as the basis for documenting the physical and financial status of these assets, coordinating asset data, developing accurate asset inventories and producing up-to-date reports and maintenance plans. Accurate asset data allows OMF and other organizations to make informed decisions about assets. The annual and one-time funding gaps are the main indicators of financial status of these assets.
OMF uses asset management information to prepare its capital planning and budgets; develop consistent maintenance, operations, and replacement programs; fulfill City and other reporting requirements, and support financial forecasting. Applying asset management principles and practices helps to prioritize projects and allocate scarce resources.
A key component of the OMF asset management program for Facilities is the preparation of five-year maintenance plans. These plans are developed with input from internal and external customers, as well as staff who maintain the infrastructure, and are influenced by City Council’s established goals, objectives, and policies. A final step is balancing needs with resources. OMF works closely with its customers to understand their businesses and how their facilities support and serve their work objectives.
Historically, OMF’s Spectator Venues Program relied on the contracted venue operators to develop, maintain, and implement asset management efforts. Program staff has begun to work more closely with the operators to enhance these efforts within the constraints of the operating agreements.
Asset Status, Condition, and Funding – Civic 35
A key component of the OMF Asset Management program for Technology Services is the preparation of five-year maintenance and replacement plans. These plans are produced by BTS staff responsible for AM and are reviewed and refined by a management review group. Priority is given to items that support public safety, improve reliability and availability of critical data systems and improve efficiency and reduce costs through the consolidation of infrastructure.
Current Asset Value and Condition
The current replacement value of Civic assets is $1.627 billion. Conditions of Technology assets are in fair to good condition. Facilities assets are in poor to good condition. Vehicles assets are in fair to very good condition.
Annual Funding Gap
The annual funding gap for Facilities services is $6.7 million. OMF is requesting a budget note in the FY 2017-18 that will call for OMF work with CBO to phase in rental rate increases for Facilities Services-owned buildings over a five-year period to a level that annually funds major maintenance at 3 percent of replacement value. This increases overall funding from approximately $5.8 million per year to $12.2 million per year at the end of five years.
The Spectator Venues Program does not currently project a funding gap in the Spectator Venues and Visitor Activities Fund for repair and replacement needs at the portfolio properties (which do not include the performing arts assets). Funds to address the needs at the Veterans Memorial Coliseum (currently estimated at $80–$100 million) are not included in the projections.
The annual funding gap for BTS is $5.6 million for bureau-owned equipment.
The annual funding gap for PF&R facilities is roughly $3.2 million. PF&R does not have a major maintenance reserve funding mechanism for future major repair and maintenance costs.
Vehicle replacement for Fleet Services and Fire & Rescue apparatus is fully funded. For certain other Civic assets, the annual gap is not meaningful because the condition of the facility is such that major renovations are needed to first get the facility in adequate condition so that it could then be on a program of regular investment. Facilities in this category are Union Station and Veterans Memorial Coliseum.
Funding Approach and Strategies
Civic asset management projects are funded from a variety of sources:
• Vehicle replacement rates charged to bureaus through CityFleet interagency service agreements fund vehicle replacement projects.
• BTS rates and reserves fund a number of projects. Reserves are used because interagency agreement rates do not provide sufficient resources to fund all projects.
Asset Status, Condition, and Funding – Civic 36
• A major maintenance component in Facilities Services building rental rates fund a number of major maintenance projects.
• The various agreements, through which the City owned spectator and performing arts venues are operated by non-City entities, include a variety of funding mechanisms and requirements for both the City and the operator regarding repairs and capital replacement.
• A combination of the Bureau of Internal Business Services-Facilities Services major maintenance money, General Fund cash, interagency revenues, and debt will be used to fund the Portland Building Reconstruction project.
• Cash funding from City funds a BTS project to relocate the City’s data center. • Net revenues in the Spectator Venues Fund provide funding for VMC and
Providence Park projects. • General Obligation Bonds fund a PF&R apparatus replacement program
approved in 2010. General Fund discretionary appropriation provides additional funding of apparatus replacement.
• Resources for large one-time needs can include debt financing, General Fund discretionary appropriation, and one-time charges to customers.
Civic assets reside in different City funds and are funded from a variety of sources, therefore there is no ability to have funds from one program fund projects in another program. Capital planning and project prioritization are at the program level.
Asset management serves as the basis for documenting the physical and financial status of these assets, coordinating asset data, developing accurate asset inventories and producing up-to-date reports and maintenance plans. Accurate asset management data allow OMF and other organizations to make informed decisions about assets. The annual and one-time funding gaps are the main indicators of financial status of these assets.
OMF uses asset management information to prepare its capital planning and budgets; develop consistent maintenance, operations, and replacement programs; fulfill City and other reporting requirements, and support financial forecasting. Applying asset management principles and practices helps to prioritize projects and allocate scarce resources.
Over the last several years, the City has invested in the replacement of large Civic assets. These investments include the replacement of the IBIS financial system with the SAP enterprise business solution, the replacement of the Police property warehouse, and the replacement of the Auditor’s archives center. Additionally, a combination of General Fund resources approved by the Council and General Obligation bonds approved by voters in November 2010 fully funds the Public Safety Systems Revitalization Project that replaced Computer Aided Dispatch, the Portland Police Data System, and the 800 MHz radio system.
Asset Status, Condition, and Funding – Civic 37
Asset Management Improvement Priorities
The priority of Facilities Services is to implement an asset management team to identify building issues, prioritize issues according to risk, develop cost-benefit analyses of project alternatives, and scope and complete projects. The team will develop measurable objectives for each type of asset and the strategies required to meet those objectives. Those strategies will inform life-cycle (e.g., 30-year) plans for each major asset. The asset management team will develop and refine the asset listing and hierarchy, develop an inspection and preventive maintenance and component replacement regimen to turn the lifecycle plans and strategies into actions, and develop communication strategies for communicating with tenants and constituents.
PF&R is committed to identifying feasible replacement plans for its Training, Logistics, and Prevention facilities, including a funding source. PF&R’s new Strategic Plan will include a focus on facility planning so that the bureau will improve its tracking of asset condition and repairs, and also major maintenance plans for each station.
Citywide Assets Report–Trends and Outlook 38
6. Trends and Outlook For over a decade, CAMG has been sharing best practices and issuing this report annually on the status and condition of assets. This effort has helped to educate City Council and the public by transparently providing information on the city’s assets and by characterizing the successes, opportunities for improvement, and challenges the City faces. In recent years, CAMG has worked with City Council to proactively address the concerns raised in the report.
In the FY 2014-15 Adopted Budget, a budget note was passed directing the CAMG to work with the City Budget Office to develop options for funding and allocating resources to address recurring major maintenance and replacement needs of infrastructure assets.
The resulting report, Closing the Major Maintenance and Asset Replacement Funding Gap, was delivered to Council the fall of 2014. Many of these recommendations have since been implemented. Recent progress in addressing this funding gap includes the following:
• Parks Replacement Bond ($68 million, passed in 2014) • Fixing Our Streets Gas Tax & Heavy Vehicle Use Tax (estimated $74 million
over four years, passed in 2016) • Cash and debt financing for the reconstruction of the Portland Building
($195 million) • Funding of a General Fund Capital Set-Aside with 50 percent of all one-time
resources ($41.7 million since FY 2015-16, including the $9.4 million anticipated in the FY 2017-18 budget process).
• Restoration of collections for electronic equipment replacement ($1.2 million annually)
• Increases in utility rates for significant infrastructure repair, rehabilitation, and replacement
• Increasing targeted capital project construction in BES by ~30 percent (Requested CIP in FY 2017-18)
• Phased in increased rent charges to bureaus in order to increase major maintenance collections to 3 percent of replacement value (Requested in the FY 2017-18 budget)
These efforts notwithstanding, considerable resource commitments are still required to maintain sustainable level of City services the public has come to expect and to sustain these services for generations to come.
An additional recommendation made in the 2014 report was to develop ongoing General Fund current appropriation levels target options. According to the report: “Beyond operations and maintenance requirements and before major renewal or replacement, there are known and predictable recurring major maintenance requirements for many assets. Rather than having these known and predictable requirements compete with other major capital needs in order
Citywide Assets Report–Trends and Outlook 39
to keep facilities open and operating, consider funding these through increased Current Appropriation Levels. Council should direct infrastructure bureaus to identify and quantify these requirements.”
The City Budget Office will work with Council to assess the viability of implementing this recommendation and others included in this report during the FY 2017-18 budget process. In addition, the City Budget Office will continue working with Council to identify other opportunities for funding.


Citywide Assets Report–Appendix 1a: Current Replacement Value Graph 41
Appendixes
1. Current Replacement Values of City Assets
a. Current Replacement Value by Asset Type
b. Current Replacement Value Data Sheet
2. Current Condition of Capital Assets
a. Current Condition of Capital Assets, All Bureaus
b. Current Condition of Capital Assets, Transportation
c. Current Condition of Capital Assets, Environmental Services
d. Current Condition of Capital Assets, Water
e. Current Condition of Capital Assets, Parks & Recreation
f. Current Condition of Capital Assets, Civic
g. Current Condition Data Sheet
3. Annual Funding Gap
a. Annual Funding Gap, by Asset Group
b. Annual Funding Gap, by Type of Gap
c. Annual Non-Capacity Funding Gap, by Bureau
d. Capacity-Related Annual Funding Gap, by Bureau
e. Annual Funding Gap Compared to Bureau Expenditures
f. Annual Funding Gap in Millions per Year Data Sheet
4. Data Confidence Level Summary
5. Definitions
6. Asset Management Program Core Elements
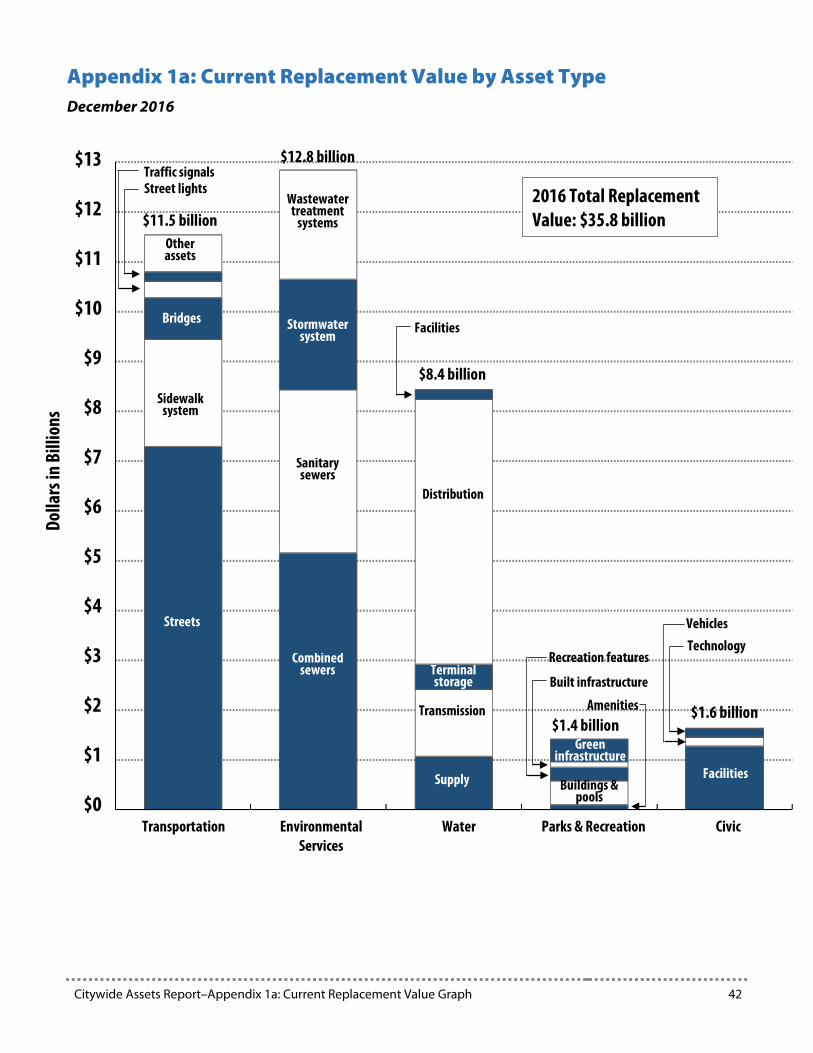
Citywide Assets Report–Appendix 1a: Current Replacement Value Graph 42
Appendix 1a: Current Replacement Value by Asset Type December 2016
$13
$12
$11
$10
$9
$8
$7
$6
$5
$4
$3
$2
$1
$0 Transportation Environmental
Services Water Parks & Recreation Civic
Streets
Sidewalk system
Bridges
Traffic signals Street lights
Other assets
$11.5 billion 2016 Total Replacement Value: $35.8 billion
Dolla
rs in
Bill
ions
$12.8 billion
Combined sewers
Sanitary sewers
Stormwater system
Wastewater treatment
systems
$8.4 billion
Distribution
Terminal storage
Transmission
Supply
Green infrastructure
Buildings & pools
Facilities
Recreation features
Facilities
Built infrastructure
Amenities $1.4 billion
$1.6 billion
Vehicles
Technology

Citywide Assets Report–Appendix 1b: Current Replacement Value Data Sheet 43
Appendix 1b: Current Replacement Value Data Sheet, December 2016
Capital Asset Class Description Value
(in millions) Confidence level Notes
Transportation Arterial & Collector Streets 1,868 lane miles $3,893.3 3- Moderate
Local Streets 2,983 lane miles $3,399.3 3- Moderate
Sidewalks 9,018,702 square yards $1,217.5 3- Moderate
Curbs 3,150 miles $623.7 3- Moderate
Corners 38,035 corners $304.3 3- Moderate
Bridges 156 bridges $844.8 4 - High
Traffic Signals (Hardware Only) 941 traffic signals $316.8 3- Moderate Street Lights 56,032 street lights $202.7 2 - Low
Support Facilities various buildings $18.3 2 to 3 - Low to Moderate
Other Transportation Assets $720.5 2 to 4 - Low to High
Total Transportation $11,541.2
Environmental Services Combined Sewers 892 miles of pipe & access structures $3,834.0 4 - High The replacement value
of the collection system has decreased slightly compared to 2015 due to improved pricing in sewer replacement work.
Combined Sewer Tunnels 13 miles of combined sewer tunnels $1,318.0 3- Moderate
Sanitary Sewers 1,001 miles of pipe & access structures $3,277.0 4 - High
Wastewater Treatment Systems 2 treatment plants; 99 pump stations $2,193.0 3 - Moderate
Stormwater System, Grey Assets 422 miles of pipe; manholes, drywells, trash racks, etc. $2,029.0 2 - Low
Stormwater System, Green Assets 2,401 water quality assets--wetlands, ponds, green streets, swales, natural areas, etc.
$185.0 2 - Low
Total Environmental Services $12,836.0
Water Supply 158 miles of roads, 1609 culverts, 12 bridges, 1 195-foot
high concrete dam, 1 145-foot high earth dam, 27 active production wells, 1 groundwater pump station (including treatment facility and storage tank), and 11 miles of groundwater collection mains
$1,076.1 3- Moderate
Transmission 60 miles of large-diameter conduits, with various supports, 9 conduit trestles and 4 conduit bridges, 9 river crossings, 90 miles of large-diameter transmission mains
$1,343.2 3- Moderate
Terminal Storage 196 million gallons finished water storage (as of June 2016), interconnecting piping, post-storage treatment facilities, and microhydro facility
$507.1 3- Moderate
Distribution 2100 miles of distribution pipes, 186,000 service lines, 48,900 valves, 178,000 meters, 14,400 hydrants, 257 active pressure-regulating stations, 38 pump stations, 54 active storage tanks
$5,315.1 4 - High
Facilities Buildings, SCADA, vehicles, construction equipment, lab equipment, computers, and infrastructure components
$182.2 3- Moderate
Total Water $8,424.0
Table continued on next page.

Citywide Assets Report–Appendix 1b: Current Replacement Value Data Sheet 44
Capital Asset Class Description Value
(in millions) Confidence level Notes
Parks & Recreation Amenities Decorative elements & furnishings $103.2 3- Moderate Buildings & Pools Community and arts centers, pools, restrooms,
maintenance facilities $475.9 3- Moderate Mount Tabor Annex
sold in 2016 Recreation Features Sports fields, courts, playgrounds, water play areas,
community gardens, skate parks, etc. $266.0 3- Moderate
Built Infrastructure Roads, major trails, utilities $118.0 3- Moderate Green Infrastructure Urban forest, turf, shrub beds, botanic gardens $449.8 2 - Low
Total Parks & Recreation $1,412.9
Civic Facilities (Buildings, Structures) Police Facilities Four precincts, Justice Center, property warehouse,
equestrian division, and vehicle storage lot $124.6 3- Moderate
Office Buildings Portland Building, 1900 Building, City Hall $214.4 3- Moderate
Other Buildings Archives and Records Center, Kerby Garage, and Portland Communications Center
$70.2 3- Moderate
PDC Facilities Train station and related buildings and Centennial Mills $49.0 3- Moderate
Spectator Facilities Memorial Coliseum, Rose Quarter parking garages, and PGE Park
$556.6 3- Moderate
Portland Center for The Performing Arts
Portland Center for the Performing Arts $130.0 2 - Low
Fueling Stations Fueling stations for use by City vehicles in various locations around city.
$13.3 3- Moderate
Fire Facilities 30 stations, administration building and support facility $118.7 3- Moderate
Vehicles
City Vehicles All City vehicles except fire apparatus $135.0 3- Moderate
Fire Apparatus Engines, trucks, other major apparatus $38.2 3- Moderate
Technology
Communications - BTS Data networks, WiFi network, 800 MHz radio system $73.6 3- Moderate
Production Services - BTS Storage area network, core servers, and email system $3.6 3- Moderate
Strategic Technology - BTS Large corporate applications, such as GIS, owned and managed by BTS
$5.0 3- Moderate
Electronic Equipment & Software - Other Bureaus
Video systems, electronic equipment, Office Suite software, bureaus PCs and laptops
$94.4 3- Moderate
Strategic Technology - Other Bureaus
Large corporate applications such as TRACS, CAD, RegJIN, CIS and EBS
$10.1 3- Moderate
Total Civic $1,636.7
Total Capital Assets $35,850.6
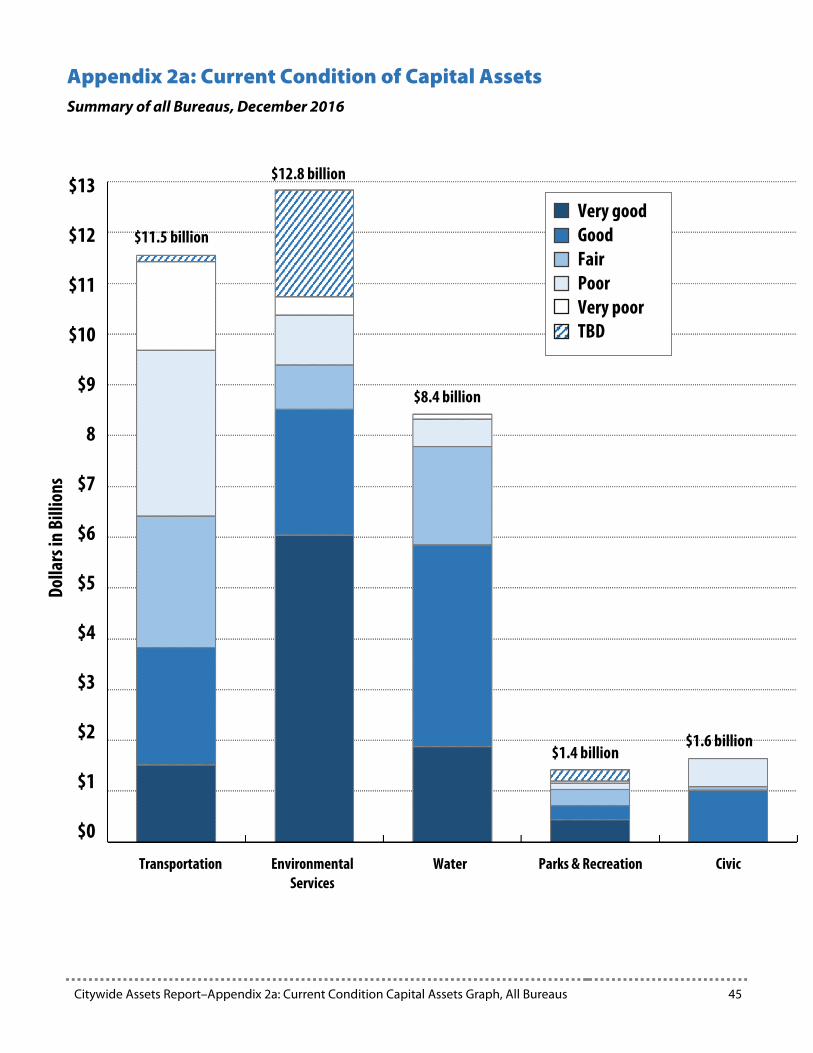
Citywide Assets Report–Appendix 2a: Current Condition Capital Assets Graph, All Bureaus 45
Appendix 2a: Current Condition of Capital Assets Summary of all Bureaus, December 2016
$13
$12
$11
$10
$9
8
$7
$6
$5
$4
$3
$2
$1
$0 Transportation Environmental
Services Water Parks & Recreation Civic
$11.5 billion Very good Good Fair Poor Very poor TBD
$12.8 billion
$8.4 billion
$1.4 billion $1.6 billion
Dolla
rs in
Bill
ions
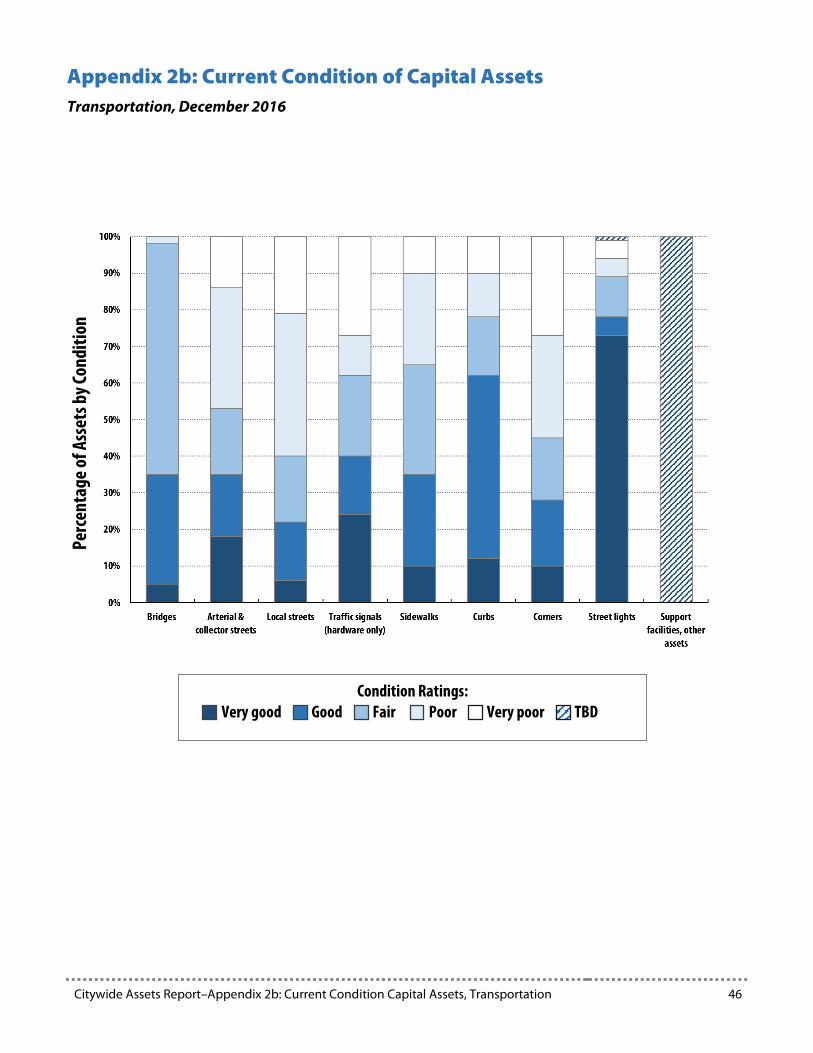
Citywide Assets Report–Appendix 2b: Current Condition Capital Assets, Transportation 46
Appendix 2b: Current Condition of Capital Assets Transportation, December 2016
Perc
enta
ge of
Ass
ets b
y Con
ditio
n
Condition Ratings: Very good Good Fair Poor Very poor TBD

Citywide Assets Report–Appendix 2c: Current Condition Capital Assets, Environmental Services 47
Appendix 2c: Current Condition of Capital Assets Environmental Services, December 2016
Perc
enta
ge of
Ass
ets b
y Con
ditio
n
Condition Ratings: Very good Good Fair Poor Very poor TBD
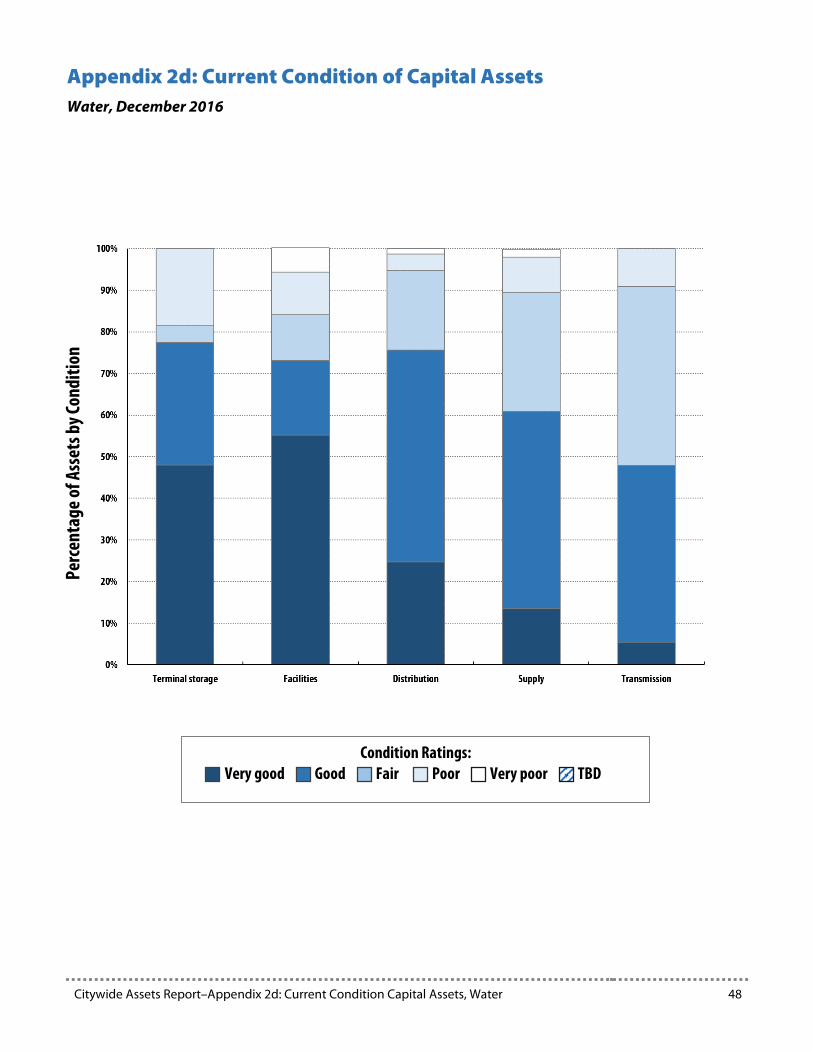
Citywide Assets Report–Appendix 2d: Current Condition Capital Assets, Water 48
Appendix 2d: Current Condition of Capital Assets Water, December 2016
Perc
enta
ge of
Ass
ets b
y Con
ditio
n
Condition Ratings: Very good Good Fair Poor Very poor TBD

Citywide Assets Report–Appendix 2e: Current Condition Capital Assets, Parks & Recreation 49
Appendix 2e: Current Condition of Capital Assets Parks & Recreation, December 2016
Perc
enta
ge of
Ass
ets b
y Con
ditio
n
Condition Ratings: Very good Good Fair Poor Very poor TBD

Citywide Assets Report–Appendix 2f: Current Condition Capital Assets, Civic 50
Appendix 2f: Current Condition of Capital Assets Civic (OMF, Police, Fire & Rescue), December 2016
Perc
enta
ge of
Ass
ets b
y Con
ditio
n
Condition Ratings: Very good Good Fair Poor Very poor TBD

Citywide Assets Report–Appendix 2f: Current Condition Capital Assets Data Sheet, All Bureaus 51
Appendix 2g: Current Condition Data Sheet, December 2016
Capital Asset Type
Current Condition (in %)a
Confidence Level Notes Very Good Good Fair Poor
Very Poor TBD
Transportation Arterial & Collector Streets 18 17 18 33 14 0 4 - High Local Streets 6 16 18 39 21 0 4 - High Sidewalks 10 25 30 25 10 0 2 - Low Curbs 12 50 16 12 10 0 2 - Low Corners 10 18 17 28 27 0 2 - Low Bridges 5 30 63 2 0 0 5 - Optimal Traffic Signals (Hardware Only) 24 16 22 11 27 0 3 - Moderate
Street Lights 73 5 11 5 5 1 2 - Low Weighted average of Option B & C lights
Support Facilities (For PBOT & BES) Condition ranges from very poor to good. 2 to 3 - Low to
Moderate
Other Transportation Assets Condition ranges from very poor to very good or TBD. 2 to 5 - Low to
Optimal
Environmental Services Combined Sewers 45 21 12 13 6 4 4 - High Condition assigned based on length
for sewers; asset quantity and value for wastewater assets; length or quantity for grey storm assets; and replacement value of facilities for green storm assets. Natural areas constitute a large proportion of green assets in TBD. The City's 2,000+ green street facilities are regularly maintained to a functional (good) condition.
Combined Sewer Tunnels 92 8 0 0 0 0 4 - High Sanitary Sewers 64 21 3 2 1 10 4 - High Wastewater Treatment Systems 27 29 12 19 4 9 3 - Moderate Stormwater System - Grey Assets 21 11 1 1 1 65 2 - Low
Stormwater System - Green Assets 0 29 0 0 0 71 2 - Low
Water Supply 14 47 29 9 2 0 3 - Moderate Transmission 5 43 43 9 0 0 3 - Moderate Terminal Storage 48 29 4 19 0 0 4 - High Distribution 25 51 19 4 1 0 3 - Moderate Facilities (Buildings & Support Facilities)
55 18 11 10 6 0 4 - High
Table continued on next page.
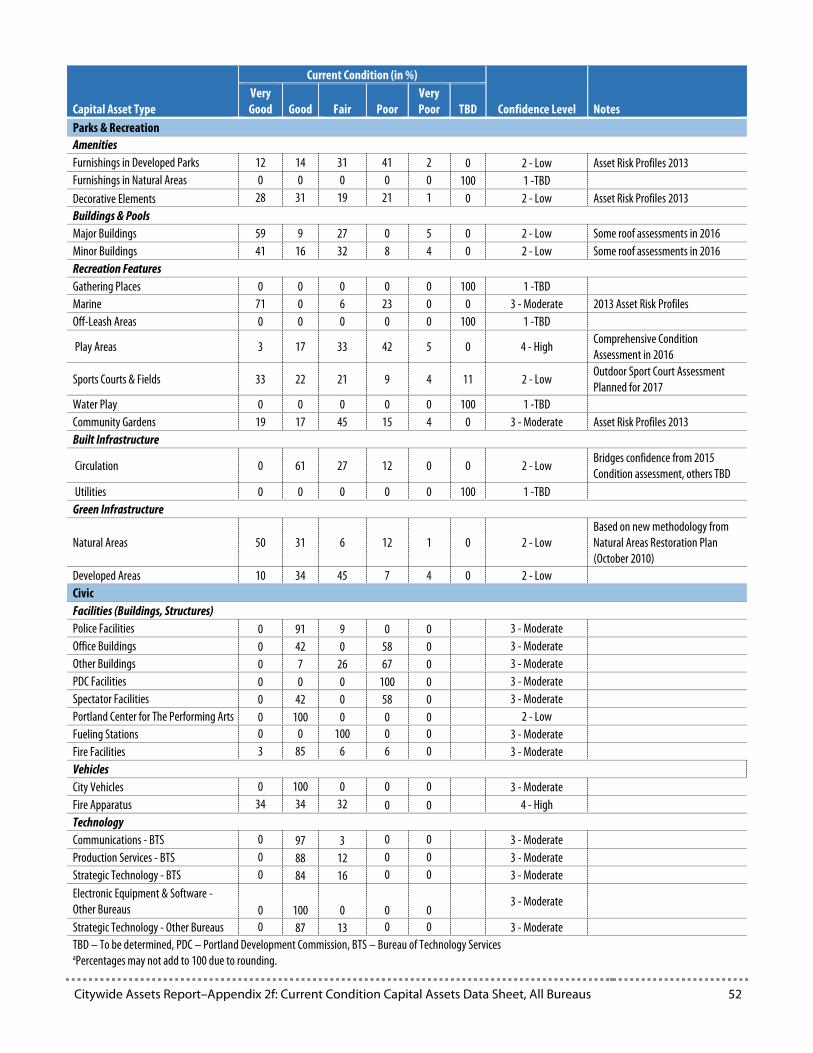
Citywide Assets Report–Appendix 2f: Current Condition Capital Assets Data Sheet, All Bureaus 52
Capital Asset Type
Current Condition (in %)
Confidence Level Notes Very Good Good Fair Poor
Very Poor TBD
Parks & Recreation Amenities Furnishings in Developed Parks 12 14 31 41 2 0 2 - Low Asset Risk Profiles 2013 Furnishings in Natural Areas 0 0 0 0 0 100 1 -TBD Decorative Elements 28 31 19 21 1 0 2 - Low Asset Risk Profiles 2013 Buildings & Pools Major Buildings 59 9 27 0 5 0 2 - Low Some roof assessments in 2016 Minor Buildings 41 16 32 8 4 0 2 - Low Some roof assessments in 2016 Recreation Features Gathering Places 0 0 0 0 0 100 1 -TBD Marine 71 0 6 23 0 0 3 - Moderate 2013 Asset Risk Profiles Off-Leash Areas 0 0 0 0 0 100 1 -TBD
Play Areas 3 17 33 42 5 0 4 - High Comprehensive Condition Assessment in 2016
Sports Courts & Fields 33 22 21 9 4 11 2 - Low Outdoor Sport Court Assessment Planned for 2017
Water Play 0 0 0 0 0 100 1 -TBD Community Gardens 19 17 45 15 4 0 3 - Moderate Asset Risk Profiles 2013 Built Infrastructure
Circulation 0 61 27 12 0 0 2 - Low Bridges confidence from 2015 Condition assessment, others TBD
Utilities 0 0 0 0 0 100 1 -TBD Green Infrastructure
Natural Areas 50 31 6 12 1 0 2 - Low Based on new methodology from Natural Areas Restoration Plan (October 2010)
Developed Areas 10 34 45 7 4 0 2 - Low Civic Facilities (Buildings, Structures) Police Facilities 0 91 9 0 0 3 - Moderate Office Buildings 0 42 0 58 0 3 - Moderate Other Buildings 0 7 26 67 0 3 - Moderate PDC Facilities 0 0 0 100 0 3 - Moderate Spectator Facilities 0 42 0 58 0 3 - Moderate Portland Center for The Performing Arts 0 100 0 0 0 2 - Low Fueling Stations 0 0 100 0 0 3 - Moderate Fire Facilities 3 85 6 6 0 3 - Moderate Vehicles City Vehicles 0 100 0 0 0 3 - Moderate Fire Apparatus 34 34 32 0 0 4 - High Technology Communications - BTS 0 97 3 0 0 3 - Moderate Production Services - BTS 0 88 12 0 0 3 - Moderate Strategic Technology - BTS 0 84 16 0 0 3 - Moderate Electronic Equipment & Software - Other Bureaus 0 100 0 0 0
3 - Moderate
Strategic Technology - Other Bureaus 0 87 13 0 0 3 - Moderate TBD – To be determined, PDC – Portland Development Commission, BTS – Bureau of Technology Services aPercentages may not add to 100 due to rounding.

Citywide Assets Report–Appendix 3a: Annual Funding Gap Graph by Asset Group, All Bureaus 53
Appendix 3a: Annual Funding Gap, by Asset Group December 2016
Dolla
rs in
Mill
ions
2016 Total: $427.8 million
$292.5 million
Capacity gap
Buildings & pools
Recreation features
Amenities
Street lights
Traffic signals (hardware only)
Bridges
Corners
Curbs
Local streets
Arterial/ collector streets
Other assets
Stormwater system
Combined sewers
Transmission
Sanitary sewers Wastewater treatment systems
$21.0 million
Distribution
Supply Terminal storage Built
infrastructure
Developed park
Green infrastructure
$18.7 million
$73.8 million
Technology
Technology
Facilities
$21.8 million
Traffic signals (hardware only)

Citywide Assets Report–Appendix 3b: Annual Funding Gap Graph by Type of Gap, All Bureaus 54
Appendix 3b: Annual Funding Gap, by Type of Gap December 2016
aThe three categories in the Funding Gap are defined in Appendix 5 of this report.
Dolla
rs in
Mill
ions
2016 Total Annual Funding Gap: $427.8 million in three categories:a Repair, rehabilitation, and replacement Mandate Capacity
$292.5 million
$21.0 million $18.7 million
$73.8 million
$21.8 million
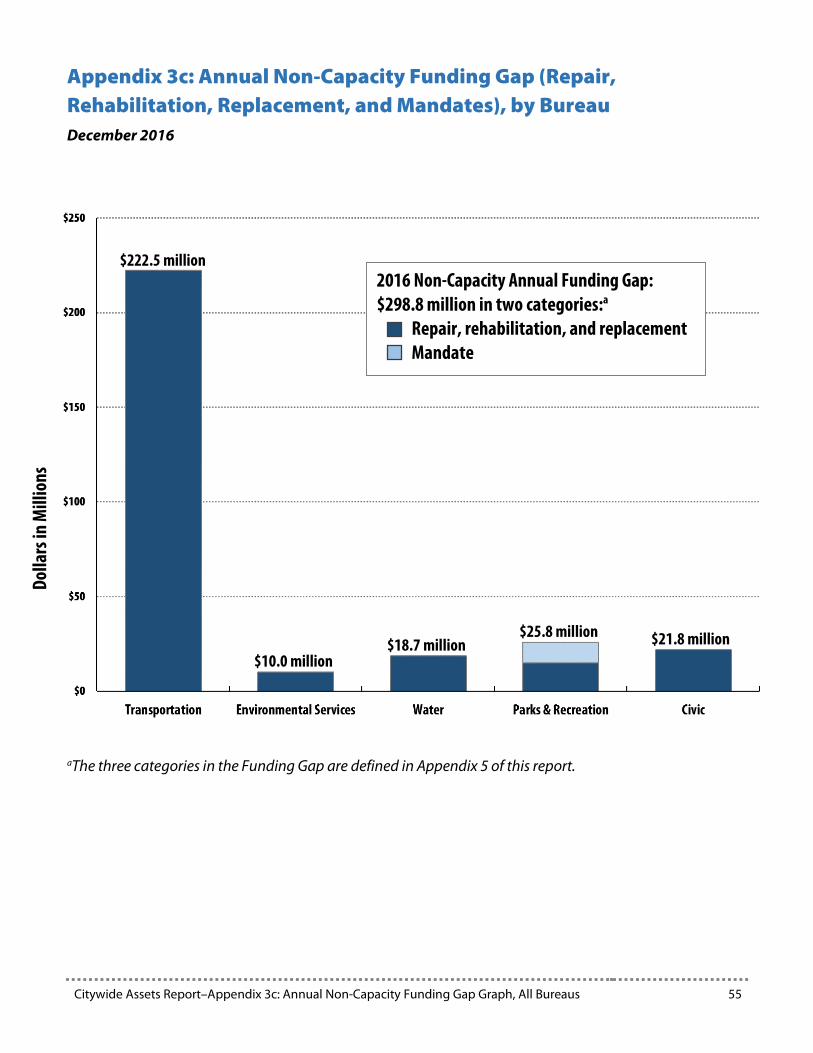
Citywide Assets Report–Appendix 3c: Annual Non-Capacity Funding Gap Graph, All Bureaus 55
Appendix 3c: Annual Non-Capacity Funding Gap (Repair, Rehabilitation, Replacement, and Mandates), by Bureau December 2016
aThe three categories in the Funding Gap are defined in Appendix 5 of this report.
Dolla
rs in
Mill
ions
2016 Non-Capacity Annual Funding Gap: $298.8 million in two categories:a Repair, rehabilitation, and replacement Mandate
$222.5 million
$10.0 million $18.7 million
$25.8 million $21.8 million
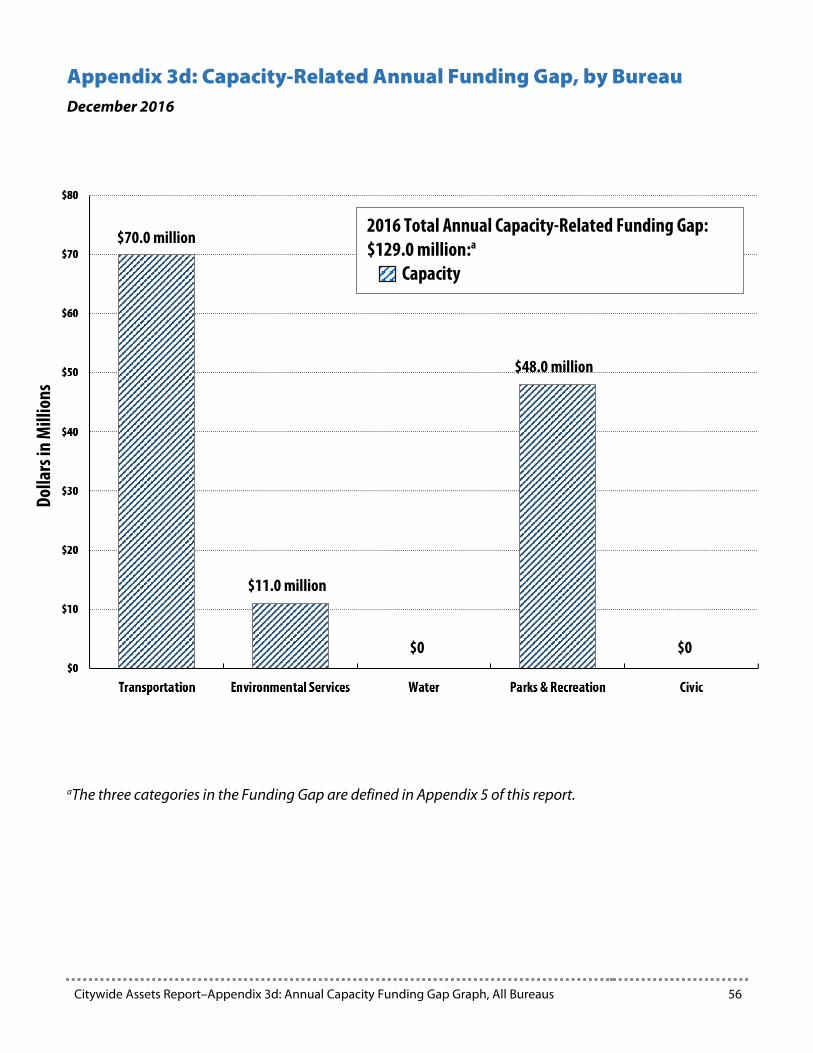
Citywide Assets Report–Appendix 3d: Annual Capacity Funding Gap Graph, All Bureaus 56
Appendix 3d: Capacity-Related Annual Funding Gap, by Bureau December 2016
aThe three categories in the Funding Gap are defined in Appendix 5 of this report.
Dolla
rs in
Mill
ions
2016 Total Annual Capacity-Related Funding Gap: $129.0 million:a Capacity
$70.0 million
$11.0 million
$0
$48.0 million
$0

Citywide Assets Report–Appendix 3e: Annual Funding Gap to Expenditures, Four Bureaus 57
Appendix 3e: Annual Funding Gap Compared to Bureau Expenditures December 2016
aComparisons available for Transportation, Environmental Services, Water, and Parks & Recreation only. bBureau expenditures are defined as Revised Budget FY 2016-17 after Fall Budget Monitoring Process adjustments and include Personnel Services, External Materials and Services, Internal Materials and Services, and Capital Outlay.
Dolla
rs in
Mill
ions
Annual funding gap Bureau expendituresa,b

Citywide Assets Report–Appendix 3f: Annual Funding Gap Data Sheet, All Bureaus 58
Appendix 3f: Annual Funding Gap in Millions Per Year Data Sheet, December 2016
Capital Asset Type Value (in millions) Confidence
Level Notes R/R/R Mandate Capacity Total
Transportation
Arterial & Collector Streets $82.0
Capacity gap not broken out by asset type;
see Transportation System Plan for
details.
Total estimated capacity gap for 20-year horizon is $1.4 billion.
$82.0 3- Moderate
Local Streets $59.0 $59.0 3- Moderate
Sidewalks N/A N/A N/A Adjacent property owners are financially responsible for repairing sidewalks
Curbs $15.9 $15.9 2-Low
Corners $7.2 $7.2 2-Low
Bridges $32.2 $32.2 4-High
Traffic Signals (Hardware Only) $18.5 $18.5 2-Low
Street Lights $4.0 $4.0 2-Low
Support Facilities $0.6 $0.6 2-Low
Other Transportation Assets $3.1 $3.1 2-Low
Total Transportation $222.5 $0.0 $70.0 $292.5
Environmental Services
Combined Sewers $2.0 $3.0 $5.0 3- Moderate Recent condition assessments have identified greater funding gaps due to aging infrastructure and capacity needs. Stormwater system needs are in the midst of ongoing assessment.
Sanitary Sewers $1.0 $1.0 3- Moderate
Stormwater System $5.0 $8.0 $13.0 2-Low
Wastewater Treatment Systems $2.0 $2.0 3- Moderate
Total Environmental Services $10.0 $0.0 $11.0 $21.0
Water
Supply $2.2 $2.2 3- Moderate
Transmission $5.0 $5.0 3- Moderate
Terminal Storage $1.2 $1.2 3- Moderate
Distribution $10.3 $10.3 3- Moderate
Facilities (Buildings, Structures) 3- Moderate
Total Water $18.7 $0.0 $0.0 $18.7
Parks and Recreation
Amenities $0.1 $0.0 $0.0 $0.1 3- Moderate
Buildings & Pools $6.3 $4.2 $20.4 $30.9 3- Moderate
Built Infrastructure $2.5 $2.9 $10.7 $16.2 3- Moderate
Developed Park $2.0 $0.1 $13.7 $15.8 3- Moderate
Green Infrastructure $1.5 $0.0 $0.4 $1.9 2-Low
Recreation Features $2.4 $3.6 $2.9 $8.9 3- Moderate Updated to reflect findings of 2016
Playground Condition Assessment.
PP&R Subtotal $14.9 $10.9 $48.0 $73.8
Subtotal Current Assets $25.8
Total Parks & Recreation $73.8
Table continued on next page.

Citywide Assets Report–Appendix 3f: Annual Funding Gap Data Sheet, All Bureaus 59
Bureau and Capital Asset Type Value (in millions) Confidence
Level Notes R/R/R Mandate Capacity Total
Civic
Facilities
Police Facilities $2.6 $0.0 $0.0 $2.6 3- Moderate
Office Buildings $2.9 $0.0 $0.0 $2.9 3- Moderate
Other Buildings $1.2 $0.0 $0.0 $1.2 3- Moderate
PDC Facilities NA NA NA $0.0 3- Moderate
Spectator Facilities NA NA NA $0.0 3- Moderate
Portland Center for The Performing Arts
TBD TBD TBD $0.0 TBD
Fueling Stations $0.4 $0.0 $0.0 $0.4 3- Moderate
Fire Facilities $3.2 $0.0 $0.0 $3.2 3- Moderate
Vehicles
City Vehicles $0.0 $0.0 $0.0 $0.0 3- Moderate
Fire Apparatus $0.0 $0.0 $0.0 $0.0 4-High
Technology
Communications - BTS $5.0 $0.0 $0.0 $5.0 3- Moderate
Production Services - BTS $0.2 $0.0 $0.0 $0.2 3- Moderate
Strategic Technology - BTS $0.5 $0.0 $0.0 $0.5 3- Moderate
Electronic Equipment & Software, Other Bureaus
$0.8 $0.0 $0.0 $0.8 3- Moderate
Strategic Technology, Other Bureaus
$5.0 $0.0 $0.0 $5.0 3- Moderate
Total Civic $21.8 $0.0 $0.0 $21.8
Total Capital Assets $287.9 $10.9 $129.0 $427.8 R/R/R – Repair, Rehabilitation, Replacement: Additional funding necessary to repair, rehabilitate, and replace existing assets to bring them up to established service levels, or replace assets considered functionally obsolete (not meeting those service levels). Mandate: Additional funding necessary to improve existing assets to meet regulatory requirements, exclusive of improvements that fall under R/R/R or Capacity. Capacity: Additional funding necessary to address existing inequities and deficiencies in levels of service for current customers and citizens. TBD – To be determined, NA – Not applicable, PDC – Portland Development Commission, BTS – Bureau of Technology Services
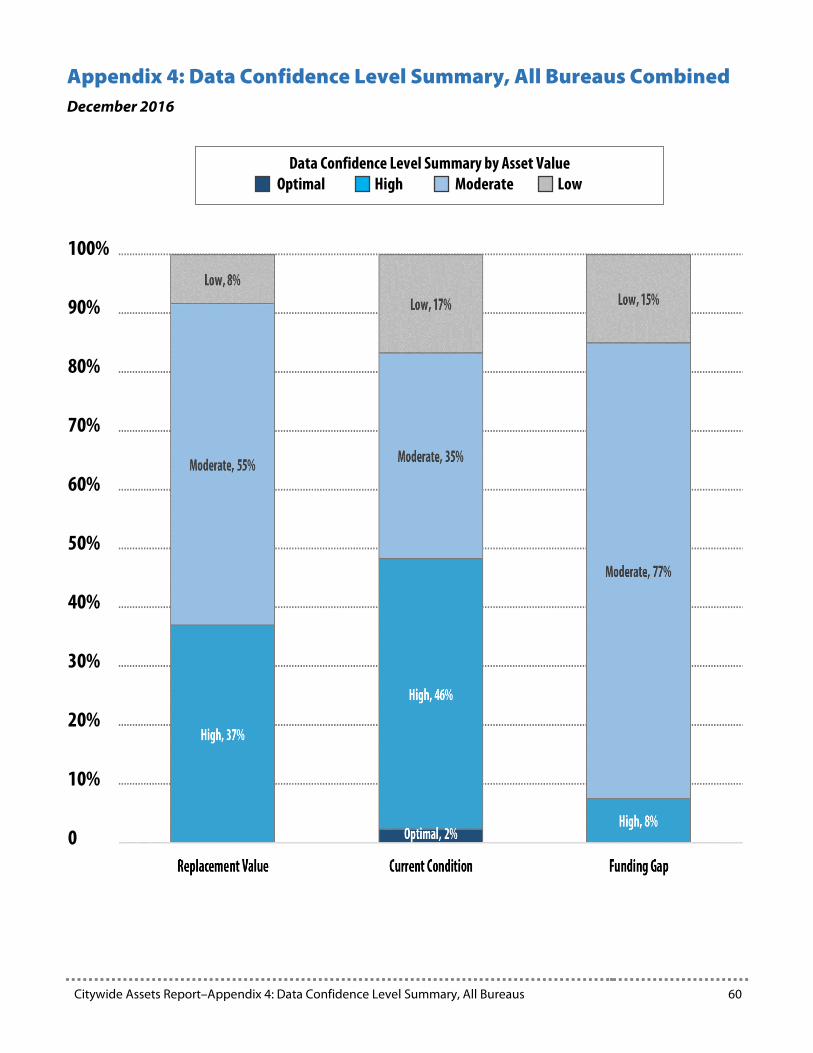
Citywide Assets Report–Appendix 4: Data Confidence Level Summary, All Bureaus 60
Appendix 4: Data Confidence Level Summary, All Bureaus Combined December 2016
100%
90%
80%
70%
60%
50%
40%
30%
20%
10%
0
Data Confidence Level Summary by Asset Value Optimal High Moderate Low
Citywide Assets Report–Appendix 5: Definitions 61
Appendix 5: Definitions The following definitions and confidence levels draw on several asset management information sources, including GHD Group Consultants (used by the Water Bureau and PBOT), trained bureau staff, and literature searches.
Asset A physical component of infrastructure or a facility that has value and an expected useful life of more than one year, that would be replaced if destroyed, and is not surplus to needs.
Asset Management The continuous cycle of asset inventory, condition, and performance assessment that has as its goal the cost-effective provision of a desired level of service for physical assets. Investment decisions consider planning, design, construction, maintenance, operation, rehabilitation, and replacing assets on a sustainable basis that considers social, economic, and environmental impacts.
Backlog The sum of deferred activities, such as maintenance, operations, and rehabilitation, needed to achieve the lowest life-cycle cost for an asset. Backlog results from lack of money, materials, or staff to perform the needed work. (See Funding Gap.)
Capacity See Funding Gap
Capital Expansion Projects or facilities that create new assets, increase the capacity of existing assets beyond their original design capacity or service potential, or increase the size and service capability of a current service area, including service to newly annexed, undeveloped, or under-served areas. Generally increases the total maintenance requirements because it is increasing the total asset base.
Civic A collection of City-owned assets, including facilities (office, police, fire, parking garages, spectator facilities, Portland Center for the Performing Arts) and technology services (800 MHz radio system, telecommunications, IT operations, strategic technology). Bureau maintenance facilities are assets of the operating bureau.
Condition Assessment The method used to quantify the deterioration rate and remaining useful life of an asset. Methods of condition assessment vary by asset classification and range from use of industry estimates for deterioration rates up to documented physical inspection regimens on established cycles that ensure optimum economic life of an asset.
Condition Measure/Rating A means of classification using information from periodic inspections or measurements to indicate the ability of an asset to deliver a particular level of service.
Confidence Levels The expression of accuracy and reliability in the areas of information (source and (in data/information) reliability), process (ad hoc or repeatable) and documentation (documented or not documented).

Citywide Assets Report–Appendix 5: Definitions 62
Confidence Levels in Data and Information
Confidence level Label Inventory completeness Condition assessment method and frequency
Process and documentation
No confidence 1-TBD No inventory No assessment method (to be determined)
No process (to be determined)
Low confidence 2-Low Partially complete inventory
Estimates used to assess condition Process not well documented
Moderate confidence
3-Moderate Inventory complete Subjective process to estimate condition estimated followed on a regular schedule
Some documentation in place
High confidence 4-High Inventory complete Condition surveys conducted on a regular schedule by well-trained personnel
Well-documented process followed
Optimal confidence 5-Optimal Inventory complete Condition surveyed on a regular schedule
Objective process followed; Accuracy of data verified and well documented
Consequence of Failure The outcome of an event expressed qualitatively or quantitatively, being a loss, injury, disadvantage or gain. There may be a range of possible outcomes associated with an event. There may be economic, social and/or environmental consequences of asset failure.
Critical Infrastructure Infrastructure assets that are essential for the functioning of society and the economy, including energy generation, transmission and distribution; telecommunications; water supply and wastewater; transportation systems; public health; and security and emergency response services.
Current Replacement Value (CRV) The total cost to replace the entire asset to meet current accepted standards and codes. For this report, the CRV excludes land value. The CRV does not match financial book value or market value.
Failure Mode The reason an asset failed to provide the function for which it was installed.
Funding Gap The difference between the funding needed to address infrastructure needs of an asset at a defined condition or level of service and the funding that is currently available. The funding gap varies with the funding level and affects the level of service. The funding gap is the amount of money needed to eliminate the backlog and/or maintain the asset to achieve its useful life. Given a certain funding level, the resulting level of service can be forecast; if a certain level of service is desired, the

Citywide Assets Report–Appendix 5: Definitions 63
funds needed to achieve it can be estimated. There are three types of funding gap:
Repair, Rehabilitation, Replacement: Additional funding necessary to repair or rehabilitate existing assets to bring them up to current service levels, or replace assets considered obsolete.
Mandate: Additional funding necessary to improve existing assets to meet regulatory requirements, exclusive of improvements that fall under Repair, Rehabilitation, Replacement or Capacity.
Capacity: Additional funding necessary to address existing inequities and deficiencies in levels of service for current customers and citizens.
Funding Types Over the life of an infrastructure asset, one-time and recurring investments are needed.
One-time investments include initial land acquisition and master planning (neither are included in Current Replacement Value, Condition or Annual Funding Gap) and asset design, development and enhancements (both are included in the key assets data).
Recurring investments can be timed to extend the useful life of assets and deliver agreed service levels at total life-cycle costs. Examples of recurring investments are roofing (every 20-30 years), rooftop HVAC systems (every 12-15 years), road resurfacing (every 30 years or so), and replastering swimming pools (12-15 years).
Green Infrastructure Infrastructure that uses natural processes, systems, or features to provide traditional infrastructure services. There are two types of green infrastructure:
Natural networks of streams, rivers, and open spaces that naturally manage stormwater, provide habitat, improve air and water quality, reduce flooding risk, and provide areas for human recreation and respite; and
Engineered facilities, such as green street treatments or eco-roofs, which use natural processes in an infrastructure setting.
High-risk Infrastructure Infrastructure assets that have a high risk of failure, based on the likelihood and consequence of that failure.
Infrastructure Consists of assets in three general networks that serve whole communities — transportation modalities (roads, rail, etc.), utilities, and parks. These are necessary municipal or public services, provided by the government or by private companies and defined as long-lived capital assets that normally are stationary in nature and can be preserved for a significant number of years. Examples are streets, bridges, drainage systems, water and sewer lines, pump stations and treatment plants, community centers and pools, and police and fire stations. Beyond transportation and utility networks, Portland includes parks, buildings,

Citywide Assets Report–Appendix 5: Definitions 64
green infrastructure, communications, and information technology as necessary infrastructure investments that serve the community.
Inventory A list of assets and their principal components.
Level of Service A defined standard against which the quality and quantity of service can be measured. A level of service can include reliability, responsiveness, environmental acceptability, customer values and cost.
Life-Cycle Cost The sum of all costs throughout the life of an asset, including planning, design, acquisition, construction, operation, maintenance, rehabilitation/renewal and disposal costs.
Likelihood of Failure The probability or possibility of an event that will cause the asset to fail.
Mandate See Funding Gap
Maintenance Activities that keep an asset operating as designed or prevent it from deteriorating prematurely, excluding rehabilitation or renewal which may extend asset life. Maintenance can be planned or unplanned. Planned maintenance is:
Preventive maintenance conducted at regular scheduled intervals based on average statistical/anticipated lifetime.
Condition-based maintenance based on objective evidence of need from tests, measurements and observations.
Deferred — the shortfall created by postponing prudent but nonessential repairs to save money or materials. Generally, a policy of continuing deferred maintenance results in higher costs when repairs are eventually made, or failure that occurs sooner than if normal maintenance had been performed.
Unplanned maintenance is:
Reactive or Emergency-corrective actions taken upon failure or obvious threat of failure, usually at a higher cost than planned or preventive maintenance.
Operations The ongoing activities that allow the use of an asset for its intended function.
Performance Indicator A qualitative or quantitative measure used to compare actual performance against a defined standard. Indicators are commonly used to measure cost, performance, or customer satisfaction.
Performance Monitoring The periodic assessments of actual performance compared to specific objectives, targets, or standards.
Rehabilitation/Renewal Maintenance performed on an asset to restore it to its original level of service or capacity and achieve its useful life, which may result in an extension of the asset’s service life.
Repair, Rehabilitation, Renewal See Funding Gap.

Citywide Assets Report–Appendix 5: Definitions 65
Retirement/Removal Decommissioning or removal of an asset through disposal, abandonment, demolition, or sale that may involve retiring deteriorated assets and recovering salvage value.
Risk The chance of something happening that will have an impact upon objectives. Risk is measured in terms of likelihood and consequences.
Risk Analysis A systematic use of available information to determine how often specified events may occur and the magnitude of their consequences.
Risk Management Strategy The systematic application of management policies, procedures and practices to the tasks of establishing the context, identifying, analyzing, evaluating, treating, monitoring and communicating risk.
Triple Bottom Line A method to categorize the benefits and impacts an organization can expect from investing in its assets. The benefits are categorized into Social, Economic, and Environmental benefits to ensure a comprehensive evaluation in the decision-making process (measure, manage and report).
Useful Life The period of time over which an asset is expected to deliver efficient service with normal or appropriate maintenance (defined as accepted industry standard or documented local experience).

Citywide Assets Report–Appendix 6: Asset Management Core Elements 66
Appendix 6: Asset Management Program Core Elements
Goals and Strategies
• An asset management policy has been promulgated or updated within the last five years. • Levels-of-service targets are published and communicated to internal and external stakeholders. • Levels of service are financially, socially, and environmentally sustainable and aligned with customer
expectations. • The asset portfolio is continually adjusted to match these sustainable levels of service. • The asset management program is leveraged to support goals for equity, resilience, and sustainability. • The bureau has a clearly defined tactical plan for achieving asset management goals and objectives. • Asset management principles and practices are widely understood and documented in the organization.
Critical Processes
• Asset data are current, accurate, and complete. • A condition assessment program exists in which the life cycle position of the majority of assets are updated
every 5 – 10 years. • Decisions are made based on asset condition, performance, utilization, location, and configuration. • Investment decisions are transparently prioritized using risk ratings as well as objectively defined and
evaluated metrics. • Project validation and decision-making includes consideration of non-asset solutions. • The vast majority of maintenance activities are proactive, planned, preventive, and predictive, and assure
reliability at the least lifecycle cost and in a manner that is least disruptive to users of the assets. • Resources are assigned to develop and carry out an asset management program at a reasonable rate of
progress.
Financial Sustainability
• The bureau forecasts major maintenance investment requirements. • The bureau forecasts realistic resource scenarios. • Forecasted resources and requirements are projected to be at equilibrium within 10 years. • Life-cycle cost is factored into acquisition, design, construction, operation, and disposal decisions.