pollutants inflow from btg ai river and delok river … inflow from btg ai...pollutants inflow from...
TRANSCRIPT
Pollutants Inflow from Btg Ai River and Delok River and Btg Ai Reservoir Outflow
and Possible Impact on Aquaculture
Wong Yik Men (25406)
A dissertation submitted in partial fulfilment of the requirement for the degree of
Bachelor of Science (Hons.)
Supervisor: Assoc. Prof. Dr. Ling Teck Yee
Co. Supervisor: Assoc. Prof. Dr. Lee Nyanti
Resource Chemistry
Department of Chemistry
Faculty of Resource Science and Technology
University Malaysia Sarawak
2012

Declaration
No portion of the work referred to in this dissertation has been submitted in support
of an application for another degree of qualification of this or any other university
or institution of higher learning.
___________________________
Wong Yik Men
Program of Resource Chemistry
Faculty of Resource Science and Technology
Universiti Malaysia Sarawak

I
Acknowledgements
I would like to express my deepest gratitude to my supervisor, Assoc. Prof. Dr. Ling
Teck Yee for her excellent guidance, care, patience, support and steadfast encouragement
towards the success completion of my research project work. Apart from that, I would
like to thank my co-supervisor, Prof. Dr. Lee Nyanti for his guidance and advices during
the sampling trips. Besides that, I would like to thank to the postgraduate students namely,
Ms Soo Chen Lin for her willingness to share and being available for direction and
guidance. Sincere thanks to all my friends for their kindness, moral support,
encouragement in facing the difficulties and obstacle of this research. Furthermore, I
would like to take this opportunity to sincerely acknowledge all the technical staffs and
lab assistants for their helpfulness, cooperation and technical support all the time. Last
but not least, my deepest gratitude goes to my beloved parents for their endless support,
encouragement and motivation for me to finish the study.

II
Table of Contents
Acknowledgements …………………………………………………………….. I
Table of Contents ………………………………………………………………. II
List of Abbreviations …………………………………………………………... IV
List of Tables and Figures ……………………………………………………… VI
Abstract ………...………………………………………………………………. 1
1.0 Introduction …………………………………………………………………. 2
1.1 Problem Statement ………………………………………………….. 3
1.2 Objective ……………………………………………………………. 3
2.0 Literature Review …………………………………………………………… 4
2.1 Water Quality Monitoring in Malaysia ……………………………... 5
2.1.1 Water Quality Status in Sarawak ……………………………... 5
2.1.2 Sources of River Pollution ……………………………………. 6
2.2 Possible Impact of Water Quality on Aquaculture ………………...... 7
2.2.1 Batang Ai Hydroelectric Dam ……………………………….... 8
2.3 Sediment …………………………………………………………….. 9
3.0 Materials and Methods ……………………………………………………… 11
3.1 Study site ……………………………………………………………. 11
3.2 Field Sampling ………………………………………………………. 13
3.3 In-situ measurement of water quality ……………………………….. 13
3.4 Ex-situ measurement of water quality ………………………………. 13
3.4.1 Chemical Oxygen Demand (COD) …………………………… 14
3.4.2 Biochemical Oxygen Demand (BOD5) ……………………….. 15
3.4.3 Total suspended solids (TSS) …………………………………. 15
3.4.4 Heavy metals ………………………………………………….. 16
3.4.5 Ammonia-N …………………………….................................... 17
3.4.6 Nitrate-N ……………………………………………………..... 18
3.4.7 Nitrite-N ………………………………………………………. 18
3.4.8 Total Kjeldahl Nitrogen………………………………………... 19
3.4.9 Soluble Reactive Phosphorus ………………………………..... 19
3.4.10 Total phosphorus …………………………………………….. 20
3.5 Sediment analysis ……………………………………………………. 21
3.5.1 Particle Size Analysis (PSA) …………………………………... 21

III
3.5.2 Sediment pH ……………………………………………………. 23
3.5.3 Total Organic Carbon …………………………………………... 24
3.5.4 Total Phosphorus ……………………………………………….. 24
3.5.5 Total Kjeldahl Nitrogen ………………………………………… 25
3.5.6 Heavy metals ………………………………………… 26
3.6 Data and Statistical analysis …………………………………………... 27
4.0 Results and Discussion ………………………………………………………... 28
4.1 In-situ water quality analysis ………………………………………….. 28
4.1.1 Temperature ……………………………………………………... 28
4.1.2 pH ……………………………………………………………….. 29
4.1.3 Dissolved Oxygen ………………………………………………. 30
4.1.4 Turbidity and transparency …………………………………….... 31
4.2 Ex-situ water quality analysis …………………………………………. 32
4.2.1 TSS ……………………………………………………………… 34
4.2.2 COD ……………………………………………………………... 34
4.2.3 BOD5 …………………………………………………………….. 35
4.2.4 Soluble reactive phosphorus (SRP) ……………………………… 36
4.2.5 TP ……………………………………………………………....... 37
4.2.6 Ammonia-N ……………………………………………………… 37
4.2.7 Nitrite-N …………………………………………………………. 38
4.2.8 Nitrate-N …………………………………………………………. 39
4.2.9 TKN …………………………………………………………….... 40
4.2.10 Total Heavy Metals …………………………………………….. 40
4.3 Sediment analysis ……………………………………………………… 42
4.3.1 Sediment pH ……………………………………………………... 42
4.3.2 PSA ……………………………………………………………..... 43
4.3.3 TOM ……………………………………………………………... 44
4.3.4 TKN …………………………………………………………….... 45
4.3.5 TP ……………………………………………………………....... 46
4.3.6 Total Heavy Metals ……………………………………………… 47
4.3.7 Loadings …………………………………………………………. 50
4.3.8 WQI ……………………………………………………………… 51
5.0 Conclusion …………………………………………………………………….. 52
6.0 References ……………………………………………………………………... 53
7.0 Appendix ………………………………………………………………………. 58

IV
List of Abbreviations
°C Degree Celcius
µg Microgram
µm Micrometer
ANOVA One-way Non-repeated Measures Analysis of Variance
BOD Biological Oxygen Demand
Ca2+
Calcium ion
CaCl2 Calcium chloride
Cd Cadmium
Cl2 Chlorine
cm Centimeter
COD Chemical Oxygen Demand
Cr Chromium
Cu Copper (Cuprum)
DO Dissolved Oxygen
DOE Department of Environment
g gram
GPS Global Positioning System
H2O2 Hydrogen peroxide
H2SO4 Sulphuric acid
ha hectare
HCl Hydrochloric acid
HClO4 Perchloric acid
HDPE High Density Polyethylene
HF Hydrogen fluoride
HMP hexametaphosphate
HNO3 Nitric acid
in inche
K2SO4 Potassium sulphate
km kilometer
L Litre

V
L.O.I. Loss-On-Ignition
M Molarity
mg kg-1
Milligram per kilogram
mg milligram
mg/L Milligram/Litre
mL Millilitre
mL/L Millilitre/Litre
mm Millimeter
N Normality
NaOH Sodium hydroxide
NH3 Ammonia
Ni Nickel
nm Nanometer
NREB Natural Resources and Environment Board
NWQSM National Water Quality Standards for Malaysia
P Phosphorus
Pb Lead (Plumbum)
pH Potential of hydrogen ion
ppm Parts per million
PSA Particle Size Analysis
SO3 Sulfur trioxide
TSS Total Suspended Solids
USEPA United States Environment Protection Agency
V Vanadium
WQI Water Quality Index
wt Weight
Zn Zinc

VI
List of Figures
Figure 1 Location of sampling stations at the study site. (http://maps.google.com)
Figure 2 Cross section of Station 1 river profile (facing upstream).
Figure 3 pH versus stations.
Figure 4 Total organic matter versus stations.
Figure 5 Correlation between TKN and TOC.
Figure 6 Total Kjeldahl nitrogen versus stations.
Figure 7 Mean Total phosphorus versus stations.
List of Tables
Table 1 Sampling stations selected for determination of water and sediment
quality.
Table 2 Values of mean and standard deviation of in-situ water quality
parameters in Delok River, Batang Ai River and Batang Ai Outflow for
1st sampling trip.
Table 3 Values of mean and standard deviation of in-situ water quality
parameters in Delok River, Batang Ai River and Batang Ai Outflow for
2nd
sampling trip.
Table 4 Values of mean and standard deviation of water quality parameters in
Delok River, Batang Ai River and Batang Ai Outflow for 1st sampling
trip.
Table 5 Values of mean and standard deviation of total heavy metals in Delok
River, Batang Ai River and Batang Ai Outflow for 1st sampling trip.
Table 6 Values of mean and standard deviation of water quality parameters in
Delok River, Batang Ai River and Batang Ai Outflow for 2nd
sampling
trip.
VII
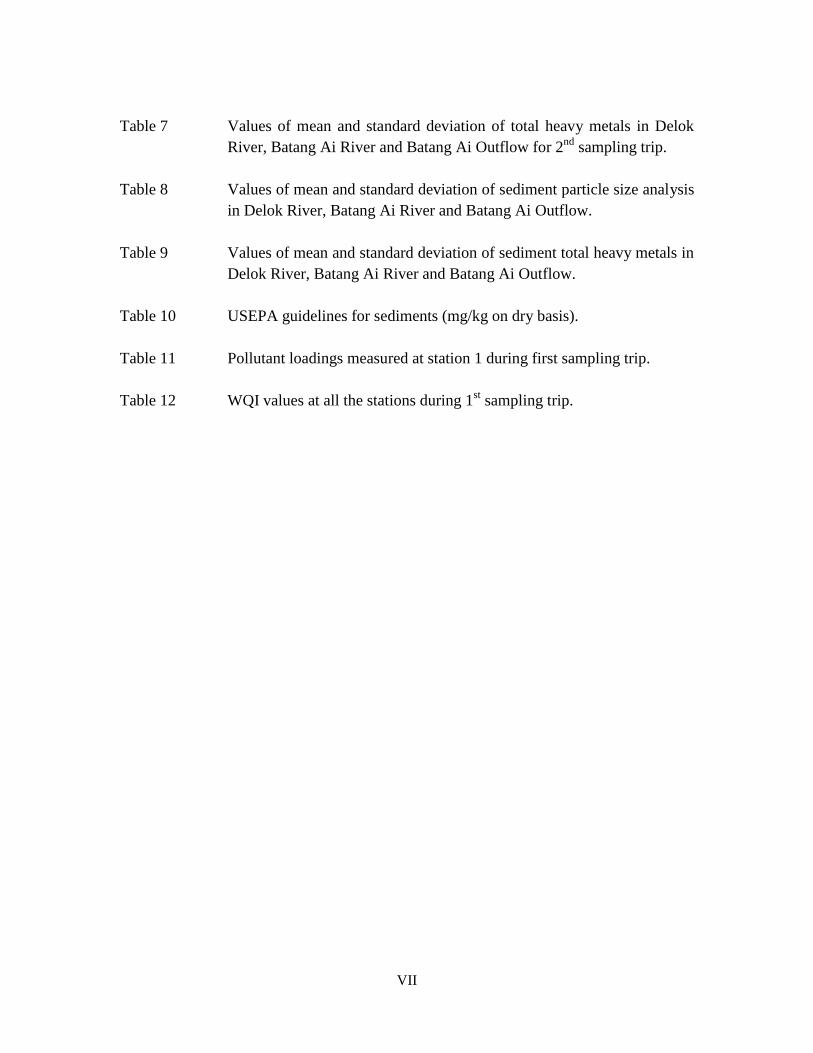
Table 7 Values of mean and standard deviation of total heavy metals in Delok
River, Batang Ai River and Batang Ai Outflow for 2nd
sampling trip.
Table 8 Values of mean and standard deviation of sediment particle size analysis
in Delok River, Batang Ai River and Batang Ai Outflow.
Table 9 Values of mean and standard deviation of sediment total heavy metals in
Delok River, Batang Ai River and Batang Ai Outflow.
Table 10 USEPA guidelines for sediments (mg/kg on dry basis).
Table 11 Pollutant loadings measured at station 1 during first sampling trip.
Table 12 WQI values at all the stations during 1st sampling trip.

1
Pollutants Inflow from Btg Ai River and Delok River and Btg Ai Reservoir Outflow and Possible
Impact on Aquaculture
Wong Yik Men
Resource Chemistry Programme
Faculty of Resource Science and Technology
Universiti Malaysia Sarawak
Abstract
Settlements and developments along the Batang Ai River and Delok River may
contribute some pollutants to the water and sediment. Besides that, maintaining water
quality and sediment quality are very important to sustain the cage aquaculture activity in
Batang Ai Reservoir. Hence, the objective of this study was to investigate the water and
sediment quality of Batang Ai River and Delok River and Batang Ai Reservoir. The
results obtained from two sampling trips at 5 selected stations indicated that the water
quality there was clean which fall in Class II of NWQSM classification. Results for ex-
situ water quality parameters are TSS (0.58-8.33 mg/L), BOD5 (3.4-6.61 mg/L), COD (32
– 53.3 mg/L), SRP (0-0.0141 mg/L), TP (0.0193-0.0439 mg/L), NH3-N (0-0.0576 mg/L),
NO2-N (0.001-0.007 mg/L), NO3-N (0.01-0.02 mg/L) and TKN (1.216-1.692 mg/L).
Nonetheless, the overall water and sediment quality was classified as not possess any
negative impacts and damages to the aquatic life and aquaculture activities in the river
and reservoir ecosystems.
Keywords: Water quality, sediment, aquaculture, river, reservoir.
Abstrak
Perumahan dan pembangunan di sepanjang Sungai Batang Ai dan Sungai Delok
mungkin menyumbang kepada sebilangan bahan pencemar terhadap air sungai dan
mendapan. Selain itu, amat penting untuk mengekalkan kualiti air dan mendapan bagi
menpertahankan aktiviti akuakultur sangkar di Empangan Batang Ai. Oleh itu, objektif
kajian ini adalah untuk menyelidik kualiti air dan mendapan di sepanjang Sungai Batang
Ai, Sungai Delok dan Empangan Batang Ai. Keputusan yang diperoleh dalam dua kali
pensampelan di 5 stesyen menunjukkan kualiti air di situ termasuk dalam Kelas II
pengelasan NWQSM, iaitu menunjukkan kualiti air adalah bersih. Keputusan ex-situ
adalah TSS (0.58-8.33 mg/L), BOD5 (3.4-6.61 mg/L), COD (32 – 203 mg/L), SRP (0-
0.0141 mg/L), TP (0.0193-0.0439 mg/L), NH3-N (0-0.0576 mg/L), NO2-N (0.001-0.007
mg/L), NO3-N (0.01-0.02 mg/L) dan TKN (1.216-1.692 mg/L). Walau bagaimanapun,
kualiti air dan mendapan secara keseluruhan dikelaskan sebagai tidak memberi ancaman
terhadap hidupan akuatik dan aktiviti akuakultur di dalam sungai dan ekosistem
empangan.
Kata kunci: Kualiti air, mendapan, akuakultur, sungai, takungan.

2
1.0 Introduction
The ecosystems of freshwater serve as the important medium for society through
provision (e.g., products and food), supporting (e.g., waster processing and supply of
clean water) and enriching or cultural (e.g., aesthetic and recreational) services (Postel &
Carpenter, 1997; Covich et al., 2004; Yang et al., 2007). However, the rapid development
of industry and agriculture has increased human activities along the water resources
which eventually deteriorate the water quality (Postel & Carpenter, 1997; Giller, 2005;
Yang et al., 2007). This situation also happens in Batang Ai Reservoir, Batang Ai River
and Delok River. Both Batang Ai River and Delok River are the major rivers that
contribute water to the upstream of Batang Ai Reservoir are potential to increase the
quantity of pollutants in the reservoir as there are longhouses situated along both rivers.
Therefore, this study is inevitable to analyze the water quality in the rivers and reservoir.
Aquaculture has become a more popular fish farming method after it has been
introduced by the government. In Sri Aman, cage aquaculture was initiated by
Department of Agriculture Sarawak in 1993 after the construction of Batang Ai
Hydroelectric Dam (ADB, 1999). Since then, it acts as an important source of freshwater
fish to the local people (Paka et al., 2009). Hence, maintaining the water quality in
Batang Ai Reservoir is vital to sustain the growth of aquatic organisms and to maintain
the production of fish all year round without fail. By conducting this research, the
possible pollutant loadings can be determined and effective measures can be figured out
to control the water quality.
Sediments are defined as the mineral and organic particles layers, often fine-
grained, that are present at the bottom of natural water bodies such as lakes, rivers, and
oceans (Baird & Cann, 2005). These sediments play the crucial role as the ultimate sink

3
for heavy metals and most of the toxic organic compounds (Baird & Cann, 2005). As a
result, sediments can remove part of the pollutants present in the body of water. If only
the water quality is being analyzed, the results shown will not represent the actual
phenomenon of the river and reservoir because the excess heavy metals, organic matter
and nutrients that present in the water body have been adsorbed on the sediments.
1.1 Problem Statement
The activities in the settlement located along the Batang Ai River and Delok
River are potential pollutant sources that may affect the water and sediment quality.
1.2 Objective
1. To investigate the water quality and sediment quality of inflow rivers Batang
Ai River and Delok River and outflow of Batang Ai Reservoir.
2. To determine the inflow quantity of pollutants.
3. To discuss the possible impact of water quality on aquaculture.
4
2.0 Literature Review
The distribution of the global water is found to be approximately 96% of saline, 3%
of frozen ice caps and glaciers, 1% of groundwater, 0.01% of lake water and only 0.001%
of river water (Readman, 2006). Water quality indicates the fitness of water usage and the
presence of pollutants. The various parameters used to measure the river water quality
plays a vital role as indicative of the presence of contaminants and are measured based on
in-situ and ex-situ analysis. The status of the river water quality in Malaysia is evaluated
by the Department of Environment (DOE) using the Water Quality Index (WQI). WQI is
used as the guideline for environment assessment of a watercourse in relation to pollution
load categorization and designation of classes of beneficial uses as provided for under the
National Water Quality Standards for Malaysia (NWQSM) to determine the status as
clean, slightly polluted or polluted (WWF-Malaysia, n.d.). The six parameters used to
determine the water quality index (WQI) are comprised of Dissolved Oxygen (DO), Total
Suspended Solids (TSS), pH, Biochemical Oxygen Demand (BOD5), Ammoniacal
nitrogen (NH3-N) and Chemical Oxygen Demand (COD).
Currently, it is about 40% of the world’s population are living in moderate to high
water stress areas (WWF-Malaysia, n.d.) due to the decrease of freshwater all over the
world. According to McAngus and Garrett (1986), any chemical can become a ‘pollutant’
if it is present at a high enough concentration. In other words, these chemical pollutants
can be described as discharges of substances both found and not found in natural water
causing it to be more than its natural levels (Turner, 1990). This means that threats to the
biota will only occur when the pollutant concentration is higher than usual. Many
chemicals are regarded as pollutants; such as inorganic ions, organic pollutants,
organometallic compounds and radioactive isotopes. In addition, most toxicity causing

5
agent in the water body was found to be related to alkyl-phenols, chlorophenols, alkyl-
substituted naphthalenes, alkyl-substituted fluorenes, atrazine and dimethyl-
benzoquinone (Readman, 2006).
2.1 Water Quality Monitoring in Malaysia
Asian rivers were reported as the “most polluted in the world, with 3 times as
many bacteria from human waste as the global average and 20 times more lead than those
from industrialized countries” (WWF-Malaysia, n.d.). As the population growth rate in
Malaysia is continuously increasing, pollution of river water will become a never ending
issue if the public is still being ignorant. In year 2006, it was reported that out of 1064
water quality monitoring stations in Malaysia, 619 (58%) were categorized as clean, 359
(34%) were categorized as slightly polluted and 86 (8%) were polluted (Water
Environment Partnership in Asia, 2010). Most of the clean categorized stations reported
were located upstream. Meanwhile, 80 river basins (55%) were found to be clean, 59
(40%) were slightly polluted and 7 (5%) polluted (Water Environment Partnership in
Asia, 2010). Each polluted river basins reported have different types of pollutant loadings
and polluted parameters. However, the river water quality was assessed according to the
NWQSM where each parameter values were compared to the standard limit and
designated classes.
2.1.1 Water Quality Status in Sarawak
In Sarawak, the Natural Resources and Environment Board (NREB) is holding
the responsibility to monitor the river water quality status of the state since 1998.
According to the Environmental Quality Report 2009 (NREB, 2009), out of 52 rivers
being monitored, 13% were found to be clean, 60% slightly polluted and 27% polluted.
6
Most of the polluted rivers reported are situated near high density of human population
and industries. Meanwhile, the slightly polluted rivers were reported located at area near
the human settlement and also the plantation and other land development activities.
NREB (2009) also indicated that the number of polluted rivers have increased from 9
rivers in 2008 to 14 rivers in 2009. This increment can be related to rapid population
growth, land development along river basin, urbanization, agricultures, aquacultures and
industrialization. These anthropogenic disturbances have generated both organic and
inorganic wastes that ultimately contaminate the water bodies (Muhammad et al., 2006).
Thus, NREB (2009) has been directed to ensure the water quality of every river in
Sarawak to be maintained at least at Class IIB of NWQSM.
On the other hand, NREB (2009) also reported the water quality status of
Batang Ai Hydroelectric Dam in year 2009 was in Class IIB of NWQSM. Each
parameter’s results were reported as follows: pH 6.69, TSS – 5.75 mg/L, DO – 5.24 mg/L,
BOD – 2.13 mg/L, COD – 4.75 mg/L and NH3-N – 0.10 mg/L.
2.1.2 Sources of River Pollution
Pollutants are categorized into point source (domestic wastewater or industrial
outfalls) and non-point sources (agrochemical run-off or deposition of atmospheric
pollutants) (Readman, 2006). The untreated or partly treated effluent and sewage from
manufacturing and agro-based industries can cause high BOD value in river whilst the
domestic sewage and livestock farming near river contribute to high NH3-N value (NREB,
2009). Besides that, Muhammad et al. (2006) reported the main pollutant sources in the
surrounding of Lake Chini in Malaysia are the residential areas, illegal logging, and
development and agricultural activities because the surface runoff and erosion from these
activities have contributed to TSS value in water bodies (NREB, 2009). Suspended solids

7
that settle on the stream bed will change the nature of the substratum from riverine into
lacustrine (Geraldes & Boavida, 1999; Lourantou et al., 2007) can smother many
organisms living within it especially the fish communities (Mason, 1990) due to severe
hydrological fluctuation. Eutrification phenomena had occurred in Lake Chini due to
nitrogen and phosphorous enrichment in wastewater runoff of oil palm plantations that
contained fertilizers, pesticides, and herbicides (Muhammad et al., 2006). Furthermore,
the untreated or partially treated discharges from residential areas contained high organic
matter and nutrients are potential to cause an over-stimulation of primary production,
eutrophication and oxygen levels depletion in the receiving water bodies (Jones et al.,
2001).
2.2 Possible Impact of Water Quality on Aquaculture
Aquaculture is estimated to reduce hunger and poverty in the world’s poorest
nations by half by 2015 if the aquaculture plays the important role as food producing
sector (Sheriff et al., 2008). Stress caused by poor water quality especially insufficient
DO in water (NREB, 2009) can caused massive fish kills, reduce growth rates and
increase the susceptibility of culture organisms to diseases (Molony, 2001). This is
because the presence of contaminants can reduce the richness and evenness of aquatic
communities (Johnston et al., 2009). Besides that, Fisheries Research Institute (2007)
reported that the decrease in salinity to less than 13 ppt with two critical parameters
showing 0.66 ppm NH3 and 0.90 ppm iron were the factors of fish mortalities in
Merchang River, Malaysia. Furthermore, alteration of river and floodplain ecosystem to
change the flow regime has been regarded as one of the main factors that affect the
aquatic community (Bunn & Arthington, 2002; Park et al., 2010). For example, the
changed in flow magnitudes and decrease in river’s variability due to the construction of

8
the dam in the Geum River basin in Republic of Korea was reported to cause a reduction
of sensitive riffle-benthic species in the riffle-pool sequences (Park et al., 2010). In
addition, Hayami et al. (2008) reported the shallow oxycline in the Cirata Reservoir (Java,
Indonesia) as the main reason for the massive fish kills because the anoxic water can be
easily moved up to affect the fish in cages.
Exposure to toxic or carcinogenic chemicals may cause accumulation of toxicity
in aquatic organisms (Margaret & John, 2007). Studies also showed that these harmful
substances are released from anthropogenic activities to cause accumulation in aquatic
organisms through the food web (Agusa et al., 2005). Coastal area of Malaysia has been
reported to contaminate with organochlorines, tributyltin, and heavy metals (Agusa et al.,
2005). However, the presence of other matters and the characteristics of the particular
water body may cause modification on these toxics (Margaret & John, 2007). For
example, the toxicity of pollutants to fish is inversely related to water hardness which is
due to the competition between Ca2+
and metal ions for binding sites in biological
systems (Margaret & John, 2007). Agusa et al. (2005) reported significant higher
concentration of V, which is rich in crude oil, was found in liver of the bigeye scads of
the west coast of Peninsular Malaysia due to the serious oil pollution in the Strait of
Malacca.
2.2.1 Batang Ai Hydroelectric Dam
Reservoirs are regarded as the environmental hybrids of lotic and lentic
systems (Lourantou et al., 2007). Based on a Batang Ai Case Study done by the
organization of Asian Development Bank (1999), the preproject conditions of Batang Ai
Dam has resulted large migratory fish species to be adapted to the fast-moving water.
Consequently, these fish species become rare and nonexistent in the reservoir and the

9
upper reaches (ADB, 1999). However, several nonmigratory fish species have been
released into the reservoir. These fish species are adapted to the reservoir condition that
makes them abundant in the reservoir, which was a success for the introduction of
floating cage culture into the reservoir. Furthermore, it was estimated to produce 20 tons
of fish per month during the Mission. The study also predicted the long-term risk that
may be posed on the fisheries there especially at the downstream and in the reservoir
because the exotic tilapia will become overpopulated if they escaped from the cage
aquaculture. Besides that, the study also revealed the poor living condition for aquatic life
below the dam because of the production of the hydrogen sulfide is poisonous and
harmful to most living things. This condition may cause the dissolved oxygen in the
reservoir greatly reduced and the reservoir can possess anoxic conditions as a result of
improper vegetation clearing and fish cage culture (ADB, 1999).
2.3 Sediment
Studies have identified the adsorption onto sinking particles as the major on
the composition of seawater over thousands to millions of years (Whitfield & Turner,
1987; Turner, 1990). This process can affect the short term fate of metal pollutants in
dynamic environments such as estuaries (Morris, 1986; Turner, 1990). Ling et al., (2009a)
concluded the study of sediment is vital as sediment plays the role of sink for organic
materials, nutrients and other pollutants; and eventually the contact of sediment could
affect the water quality after a long time. Based on the literature (Ling et al., 2009b),
organic phosphorus liberated by bacterial communities can accumulate in the upper layer
of sediment, which may in turn cause eutrophication. Microorganisms utilize oxygen to
break down organic matter being discharged into the watercourse to the detriment of the
stream biota (Mason, 1990). During the break down of organic matter, the released

10
nutrients can stimulate the growth of aquatic plants and these additional nutrients in the
water body are known as eutrophication (Mason, 1990). Zhang et al. (2006) reported the
eutrophic waters are abundant with planktons or attached algae and contain high nutrients.
Furthermore, eutrophication can cause depletion of oxygen and possess threats to aquatic
organisms (Ling et al., 2009b). According to Nelson et al. (1994), the low dissolved
oxygen was reported in Klang River, Malaysia, as a result of the high oxygen demand of
sediment that rests on the bottom during neap tides and was resuspended during spring
tides. Studies also reported that although there was a reduction of dissolved exogenous
organic matters in the land-locked embayment overlying water in Hong Kong, the soft
bottom sediment continued to act as sources of nutrients (Chau, 2002). Eventually, the
bottom sediments of the water column becomes the potential exists for remobilization of
nutrients and metals that can affect the fate and influence of pollutants through changes in
redox status (Margaret & John, 2007).
Although many studies have been done on the water quality of Batang Ai Reservoir, the
water and sediment quality of Batang Ai River and Delok River have never been studied.
These rivers are the main rivers that flow into the reservoir where cage aquaculture is the
main activity in the reservoir. The daily activities of the longhouses along the two rivers
are potential to affect the water quality in the reservoir as well. Hence, this study is vital
to determine how much effect has been impacted on the cage aquaculture.

11
3.0 Materials and Methods
3.1 Study site
Batang Ai Reservoir, Batang Ai River and Delok River are located in the Division
of Sri Aman, Sarawak. It is located some 14 km from the interior town of Lubok Antu,
close to the national boundary of Sarawak, Malaysia and Kalimantan, Indonesia. Batang
Ai dam is 85 meters high. It floods an area of 8500 ha (21,000 acres) of forest which
stretches up to Sungai Engkari and Batang Ai (Economic Planning Unit, 1996). The
Batang Ai River and Delok River flow through several settlements, where domestic
wastes are discharged from the Iban longhouses into the river. The development of
tourism and aquaculture may result in a decline to the water quality (Economic Planning
Unit, 1996). The main agricultural activities in Delok River such as shifting cultivation of
rice and cash cropping of pepper (Pipernigum L.) and rubber can possess deterioration to
the river water quality too (Mertz, 2007). There are approximately seven longhouses
situated along the Batang Ai River and Delok River as informed by the boatmen during
the sampling trip. Population recorded at the study in year 1999 were approximately 138
Iban natives (Itik, 1999).
Table 1: Sampling stations selected for determination of water and sediment quality.
Station GPS Reading Description
1 N 01° 15’ 36.1”
E 112° 02’ 33.3”
Upstream of Batang Ai River near Batang Ai
National Park
2 N 01° 13’ 53.4”
E 112° 00’ 40.1” Downstream of Delok River below the longhouses
3 N 01° 12’ 12.4”
E 111° 56’ 57.2”
Downstream of Batang Ai River (before the
confluent of Batang Ai River and Engkari River)
4 N 01° 11’ 40.8”
E 111° 55’ 32.6” Confluent of Batang Ai River and Engkari River
5 N 01° 08’ 48.9”
E 110° 52’ 44.1” Outflow of Batang Ai Hydroelectric Dam
6 (sediment) N 01° 09’ 53.1”
E 111° 54’ 44.9” No cage culture area near the reservoir inflow

12
Figure 1: Location of sampling stations at the study site (http://maps.google.com).

13
3.2 Field Sampling
Sampling was being carried out a total of two times between 25 – 26 November
2011 and 6 – 7 April 2012. Three replicates of water and soil sediments were collected
from each sampling site. Then, these samples were kept in different HDPE and
borosilicate glass bottles and stored in icebox filled with ice cubes to prevent oxidation.
Soil sediments were wrapped in aluminium foil to exclude any light penetration.
Subsequently, all the samples were transported back to the laboratory for other chemical
parameters analysis within 24 hours. The entire replicates samples were composited
before chemical analysis to reduce variation.
3.3 In-situ measurement of water quality
In-situ water quality parameters for each station were determined. The physical
parameters such as pH, temperature, turbidity and DO were measured using YSI 6600
Multiparameter Water Monitor. The flow velocity was measured by using current meter
(FLO-MATE Model 2000 Portable Flowmeter) at different depth (surface, middle and
bottom) of river. The coordinates of sampling sites were measured using GPS readers.
Width of water column was determined using range finder (Bushnell Laser rangefinder
Elite 1500). Depth of water column at different and fixed distance from the bank at each
sampling sites was determined using a depth finder (PS-7, Hondex) and water
transparency was determined by using a Wildco® Secchi disc.
3.4 Ex-situ measurement of water quality
Samples for nutrient analysis were filtered at the time of sample collection, using
Glass Microfibre GF/C Whatman filters (0.45 μm) (Whatman International Ltd, Kent,
U.K.). Glass-free filters were used for phosphorous samples. The filtered samples were
14
put in acid-rinsed bottles, transported to the laboratory in an icebox, and stored at 4°C in
the dark until analysis (maximum storage time of 24 hours).
All the ex-situ measurements of water quality and sediment quality were
conducted according to the Standard Method for the Examination of Water and
Wastewater 20th
Ed. (APHA, AWWA & WEF, 1998).
3.4.1 Chemical Oxygen Demand (COD): 5220 C. Closed Reflux, Titrimetric
Method (APHA, AWWA & WEF, 1998)
Culture tubes (16 mm) and caps were washed with 20 % H2SO4 before first
use to prevent contamination. Then, 2.5 mL of sample and 2.5 mL of deionized water
(blank) were poured into two culture tubes respectively. After that, 1.5 mL of potassium
dichromate – mercuric sulfate digestion solution was added and 3.5 mL of sulfuric acid
reagent was run down inside the vessel. The tubes were capped and inverted several
times to mix completely. Subsequently, the tubes were placed in block digester preheated
to 150°C and refluxed for 2 hours. The tubes were cooled to room temperature after the
reflux is complete. The culture tube caps were removed and small TFE-covered magnetic
stirring bar was added. Before the titration, 2 drops of ferroin indicator were added.
Titration was run with standardized 0.10M ferrous ammonium sulphate (FAS) while
magnetic stirrer is stirring rapidly. The end point is a sharp colour change from blue-
green to reddish brown. The calculation of COD was as follows:
COD as mg O2/L = (A – B) × M × 8000
mL sample
A: mL FAS used for blank
B: mL FAS used for sample
M: molarity of FAS
15
3.4.2 Biochemical Oxygen Demand (BOD5): 5210 B. 5-day BOD Test (APHA,
AWWA & WEF, 1998)
The BOD bottles were used for this measurement. Water samples were diluted
with distilled water (1:1) in 1000-mL glass measuring cylinder. It was mixed thoroughly
and then, was transferred into the BOD bottle until it overflows its brim. The DO of the
water sample was measured and recorded using a DO meter (HANNA HI 9146
Microprocessor DO meter). A stopper was placed and no air bubble trapped in the bottle
was ensured. The bottle was covered with aluminium foil to exclude light. The bottle was
placed in a BOD incubator at a temperature of 20 ⁰C. The DO value of the water in the
bottle was recorded after 5 days of incubation. Subsequently, the BOD of the water
sample was calculated.
BOD5, mg/L = D1 – D5
P
D1: DO of dilute sample immediately after preparation, mg/L
D5: DO of dilute sample after 5 days incubation at 20°C, mg/L
P: Decimal volumetric fraction of sample used
3.4.3 Total suspended solids (TSS) (APHA, AWWA & WEF, 1998)
The filtering apparatus (vacuum filtration) was setup. The membrane filter
was weighed using electronic balance. The membrane filter was placed onto the filter
support and the funnel was clamp over the membrane filter. Filter paper was dried in
oven and cooled in desiccators before weighed. Approximately 1 L of water sample was
measured into the beaker (the water was shaken well before pouring into the measuring
cylinder). Then, water in the beaker was poured into the filter funnel slowly and the
vacuum pump was switched on. The water pump was stopped once all the water has