pi : information on hand for operational...
TRANSCRIPT

1
PI : Information on hand for
Operational Analytics
Presented by: Ranjith Ramachandran
Chandra Prakash Dewangan

AGENDA
3
• Information Enhancement • ABT System. • Auto Reports. • Enhancement of data.
• Performance Monitoring, Analysis & Improvement • Plant Performance Monitoring. • Plant Performance Improvement.


Trombay Haldia Jojobera Hydro
Central PI
Enterprise Systems
Wind
PI System Integration
Mundra T&D Maithon

- Existing
- Proposed
Legend
TROMBAY SERVER
JOJOBERA SERVER
BHVP U1 U2 U3 U4 PH#6
HALDIA SERVER
U1 U3 U4 U5 U6 U7 U8
MIS / HYPERION
LD KHP
HYDRO SERVER
MAITHON SERVER
MUNDRA SERVER
BHIRA
CENTRAL PI SERVER
BELGAUM LODHIVLI ABT
T&D SERVER (DHARAVI)
SCADA DAS AMR
U2
WIND SERVER
RDBMS INTERFACE
PI System - Network
MULSHI 3MW
ENERCON SUZLON REGEN U1 U2
U5 EMS
PI-PI INTERFACE
TATA POWER WAN
U1 U2 U3 U4 U5

PI System Monitoring

PI System Monitoring

PI System Monitoring

ABT SYSTEM
2

∗Acquisition of data from ABT System deployed for Mumbai Operations.
∗Accurate, reliable and wide acceptance. ∗My SQL database in the backend. ∗Web client with limited features available for
monitoring. No tools for analysis purposes. ∗Not possible to import data into excel. ∗ Report creation facility is not available.
ABT System

∗ RDBMS Interface connectivity with PI server ∗ Immediate and time triggered data collection. ∗ Easier to import into excel sheet for analysis. ∗Displays and trend making with ProcessBook. ∗ Report creation became error free and less
time consuming ∗ Reports from PI being utilized by Load Control
Centre for planning and forecasting.
Integration of ABT System with PI

AUTOMATED REPORTS
2

Daily operational and maintenance report on E-mail Created Visual Basic application which utilizes PI DataLink to generate reports.
Reports are in MS Excel format. The values are available as static. Hence, no need of PI DataLink on the recipients computer. Reports saved on a network drive.
E-mail the report using PI notifications to a list of recipients by setting time based triggers.
Automated Reports

Automated Reports

ENHANCEMENT OF DATA QUALITY
2

Solution to Energy Meter commn. error
Energy meter communication problems during shutdown which results in error of the source data affecting calculations .
Before
TR U7 SATE 8.9014E+07KWH
15/12/2010 5:21:55 AM15/12/2010 12:00:00 AM 5.37 hours8.882E+07
8.884E+07
8.886E+07
8.888E+07
8.89E+07
8.892E+07
8.894E+07
8.896E+07
8.898E+07
8.9E+07
8.902E+07

Created a performance equation for storing the last reading of the energy meter and the same tag used for energy calculations.
After
Solution to Energy Meter commn. error
TR U7 SATE 8.9014E+07KWH
15/12/2010 5:21:55 AM15/12/2010 12:00:00 AM 5.37 hours8.88E+07
8.885E+07
8.89E+07
8.895E+07
8.9E+07
8.9029E+07

Energy Meter reset
Energy meter resets to zero after reaching the maximum of cumulative reading which affects energy calculations.
Before
Result : Negative

Added a condition in performance equations to check for a meter reset for the entire day and provided two methods of calculation using an IF clause.
After
IF (TAGVAL('TR U7 SATEC STG KWH NO ERROR','T')-TAGVAL('TR U7 SATEC STG KWH NO ERROR','Y'))<0 THEN (TAGMAX('TR U7 SATEC STG KWH NO ERROR','Y','T')-TAGVAL('TR U7 SATEC STG KWH NO ERROR','Y')+TAGVAL('TR U7 SATEC STG KWH NO ERROR','T'))/1000000 ELSE (TAGVAL('TR U7 SATEC STG KWH NO ERROR','T')-TAGVAL('TR U7 SATEC STG KWH NO ERROR','Y'))/1000000
Modified PE
Result : Accurate
Energy Meter reset

Single tag for OPC interface status based on a particular watchdog. No direct monitoring over the data received from various functional areas.
Before
OPC Server PI ICU
PI Server PI Interface
Watchdog tag OPC tag Interface status
Multiple interface status

Multiple interface status
Introduced the concept of multiple interface status tags using multiple watchdog from different functional areas.
Better monitoring over the plant. Improved the availability of plant data. Helps the plant engineers for immediate identification of the
affected area.
After
OPC Server PI ICU
PI Server PI Interface
Watchdog tag OPC tag Interface status
Watchdog tag OPC tag
Watchdog tag OPC tag
Watchdog tag OPC tag
OR

Trigger based PE
Performance equations was clock scheduled and it was consuming more computing power and memory.
It was not possible to output results at a pre defined time.
Created Triggers for the desired time.
Used triggers for event triggering of the calculated tags.
Calculations are performed only onetime in a day which greatly reduced the system load and made the results accurate.
Before After

THERMAL POWER PLANT PERFORMANCE MONITORING
2

PI Data used for Monitoring Plant Performance “Before & After” Performance Analysis Boiler & Turbine Efficiency Monitoring Monitoring of Design vs. Actual Performance Performance Analysis at different operating conditions Dashboard / Report having Last Hour, Today, Last Day &
Monthly data.
Performance Monitoring

Performance Monitoring - “Before & After” Analysis

Performance Monitoring - Boiler & Turbine Efficiency

Performance Monitoring - Design vs. Actual

Performance Monitoring – Diff. operating conditions

Performance Monitoring - Dashboard

PERFORMANCE IMPROVEMENT INITIATIVE -
SANKALP
2

SANKALP
3
• Structured, Time bound, Team based program with top management support & bottom up approach to impact the company’s bottom line with minimal investment in shortest possible time.
• Uses the creativity and energy of the people of Tata Power and all its stakeholders
• Utilizes Online Data from PI System to take informed decisions.
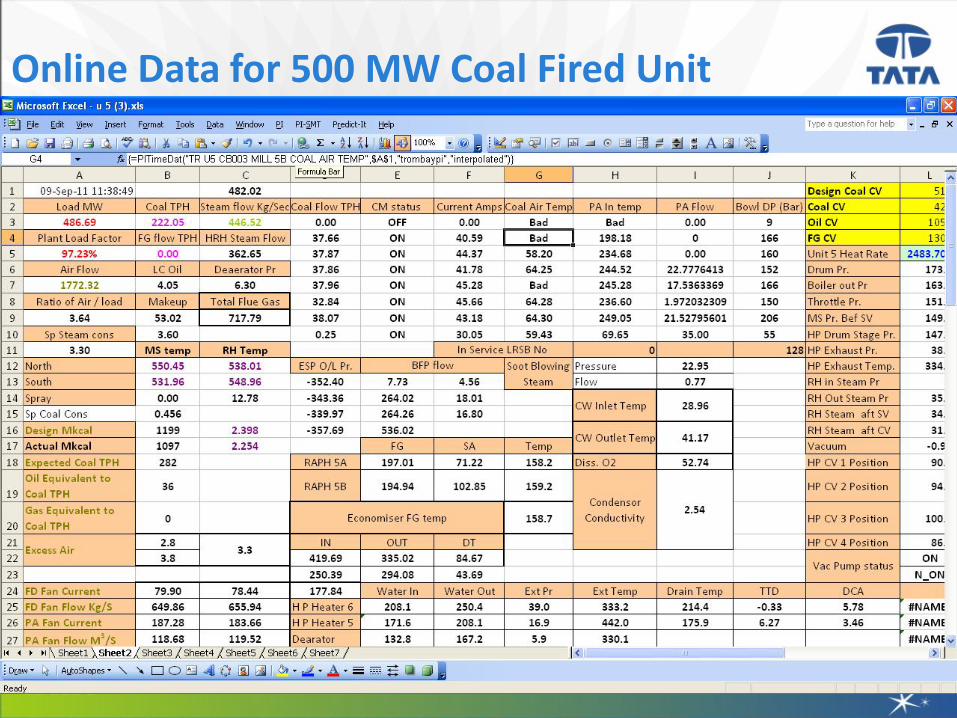
Online Data for 500 MW Coal Fired Unit

History Data for analysis

MS Temp
520.0
525.0
530.0
535.0
540.0
545.0
550.0
555.0
4:25 PM6:25 PM
8:25 PM
10:25 PM
12:25 AM2:25 AM
4:24 AM6:24 AM
8:24 AM
10:24 AM
12:24 PM2:23 PM
4:23 PM6:23 PM
8:23 PM
10:23 PM
12:22 AM2:22 AM
4:22 AM6:22 AM
8:22 AM
10:21 AM
12:21 PM2:21 PM
Date & time
Temp
0.0
2.0
4.0
6.0
8.0
10.0
12.0
SH Temp SH Temp SH Spr
Trend format for analysis

Unit 8
70.0
90.0
110.0
130.0
150.0
170.0
190.0
210.0
230.0
250.0
1 3 5 7 9 11 13 15 17 19 21 23 25 27 29 31 33 35 37 39 41 43 45 47 49 51 53 55 57 59 61 63 65 67 69 71 73 75 77 79 81 83 85 87 89 91 93 95
-400.0
-350.0
-300.0
-250.0
-200.0
-150.0
-100.0
-50.0
0.0
Load Cur Avg Suc Pr Avg
Last 100 Data only captured in Graph
Trend format for analysis
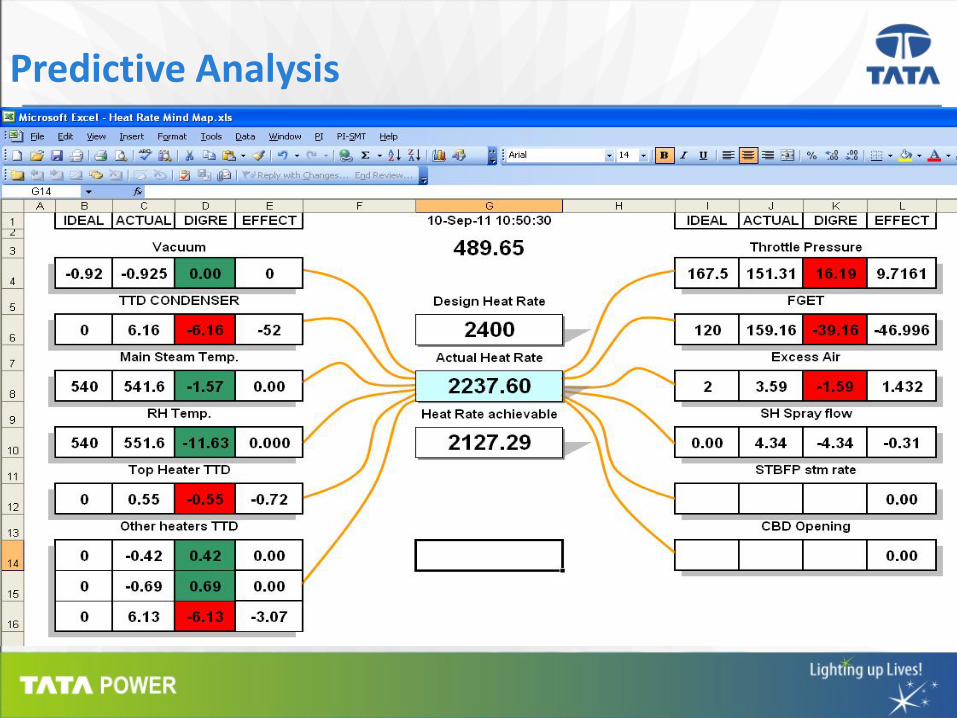
Predictive Analysis

Questions
