performance dynamics of venture-financed firms€¦ · (vc)-financed and 154 non-vc-financed firms...
TRANSCRIPT
Supervisor: Einar Bakke Master Degree Project No. 2013:59 Graduate School
Master Degree Project in Finance
Performance Dynamics of Venture-Financed Firms -An empirical study of the Swedish Venture Capital Market
Frida Lyxell and Erik Nordén

Performance Dynamics of Venture-Financed Firms - An Empirical Study of the Swedish Venture Capital Market
Frida Lyxell (860925-4845) and Erik Nordén (890118-0011)1 School of Business, Economics and Law, University of Gothenburg
Master of Science in Finance – Spring 2013
ABSTRACT
This paper investigates the performance of a sample of 154 venture capital (VC)-financed and 154 non-VC-financed firms from birth to exit on the Swedish market between the years 1998 and 2011. We find that VC-financed firms achieve higher growth rates in sales than a matched sample of non-VC-financed firms. Somewhat contradictory we also find that non-VC-financed firms show significantly higher profit margins. For a subsample of 59 firms we conclude that the profit of VC-financed firms grow at a significantly higher rate after the time of investment than before, indicating a monitoring effect provided by VC-firms. We also examine a potential relationship between the experience of VC-firm and performance of VC-financed firm but find no significant relationship.
1 The authors would like to thank supervisor Einar Bakke for his input and support during the thesis process in addition to providing access to the Creandum data set and Serrano database. We would also like to give credit to Creandum for the compilation of the data set of VC-financed firms.

1
THE VENTURE CAPITAL (VC) industry emerged in the American market in the
1960s, and during the past 30 years the VC-industry has grown by a staggering 16 thousand percent (Puri and Zarutskie, 2012). Most high profile research of VC are US based studies (e.g. Kaplan, et al., 2009, and Gompers and Lerner, 2004)
trying to determine successes factors of VC-financed firms and the role VC-investments actually play in the development of firms. However, regional differences between VC markets have been found, (Wright, et al., 2004) and
Berglund (2011) specifically found a number of differences between the US and the Scandinavian VC markets, stating that there is “substantial differences in VC activities and priorities during deal flow generation, investment, and exit”.
The Swedish VC-industry started taking an organized form in the late 1970s and has since then grown to an estimated invested amount of 1.82 billion SEK in 2012 (SVCA, 2012). In 2011 Sweden was ranked number one in the Global
Creativity Index, where factors such as R&D investments, technology, number of patents, and human capital, were evaluated in 82 nations worldwide (Goldschein, 2011). Also, Sweden is the home of some of the most successful and innovative
start-ups in recent time such as Skype, Spotify, and MySQL, all of which were backed by different VC firms in the early years of operations. Still, there is little to no research performed on the nature of the Swedish VC market.
To date, studies of the role VC-investments play in the performance of firms are often limited to examining VC-backed firms in isolation (e.g. Gompers and Lerner, 2001 and Kaplan and Schoar, 2005) or if a matched sample of VC and
non-VC-financed firms are used they typically only include companies that go public through IPO (e.g. Barry, et al.,1990 and Baker and Gompers, 1999). However, in a recent study Puri and Zarutskie (2012) added to the VC-research
by studying a matched sample of VC and non-VC-financed firms from birth to exit2 and found that VC-financed firms achieve larger scale but no higher profitability than matched non-VC-financed firms. Chemmanur et al. (2009) used
the same data set and found that VC-financed firms exhibit higher factor productivity than non-VC-financed firms. Summarizing the high profile research
2 IPO, acquisition or failure
2
there is a gap related to private firms in matched samples, especially in the
Swedish market; this paper is an attempt to start filling this gap. This paper make use of a hand-collected data set of Swedish VC-financed firms, compiled by Creandum3, and additional information collected from the
Serrano Database4 with the aim to quantify the performance and characteristics of VC-financed firms in comparison to a matched sample of non-VC-financed firms on the Swedish market from birth to exit. We study three main research
questions. First, do VC-financed firms outperform non-VC-financed firms in terms of business development? By utilizing the method of a matched sample, where a
one-to-one matching is performed, we look at growth in sales, profit, and personnel expense as well as size (number of employees) of the companies and can conclude that VC-financed firms do show superior performance in terms of
significantly faster growth in sales. However, the matched sample of non-VC financed firms display larger profit margins. In terms of size we can see a clear pattern of VC-financed firms achieving larger scale over time. This is in
accordance with previous research performed on both American and European data (e.g. Mangiart and Van Hyfte, 1999 and Puri and Zarutskie, 2012) Second, we try to determine if a monitoring effect from VC-financing is
present; we do so by looking at a subsample of 59 VC-financed firms where information on investment year is available. The question is whether VC-financed firms outperform non-VC-financed firms due to VC-firms’ (the investing
firm) ability to screen potential firms that are more likely to succeed or if the monitoring and support function that the VC-firms provide is in fact the reason for superior performance. When looking at the performance of the subsample of VC-financed firms post and prior to the VC-investment we find a significant
increase in growth in profit after the investment. This would suggest support for the monitoring ability of VC-firms, but does not rule out a simultaneous
3 Creandum is a Swedish VC-firm investing in entrepreneurs and companies in Northern Europe 4 The Serrano Database is a database with financial history on company level, financial data collected from financial statement data from the Swedish Companies Registration Office (Bolagsverket)

3
screening effect. This is in line with previous findings by Chemmanur et al.
(2009). Third, we examine if we can find a relationship between VC-financed firms’ performance and the experience (at investment year) of the VC-firm that has
made the investment. To answer this question we again look at the subsample of 59 firms where information on experience (age of VC-firm) and investment year is available. We find no significant relationship between experience of VC-firm
and performance. With these results we can conclude that VC-financed firms do achieve larger scale and increased sales but are not more profitable than non-VC-financed
firms. Due to monitoring abilities of VC-firms we can however see increased profit growth after VC-investment. We also find that the number of years in business of the VC-firms does not affect the performance outcome.
The remainder of this paper is organized as follows. In Section I we present a summary of relevant research on VC-investments. Section II describes our sample and how we constructed the dataset. In Section III we present the method
as well as the results found for each research question. In Section IV we analyze the overall results and draw conclusions.
I. Venture Capital to Date – Previous Research
“The entrepreneur and the venture capitalist “live together” for 3 to 5 years, toward the mutual goal of a public offering or sale of the entrepreneur’s business at a higher price than the management or the venture capitalist paid. Occasionally, the process works smoothly.”
(Silver, 1985)
In this section we present previous research related to the content of this paper. This will help put our findings in a context and see in which areas our
work adds to existing literature, also, it will help us to draw more substantiated conclusions. In the first section we present empirical findings of VC-financed firms outperforming non-VC-financed firms, both private and public. Second, we
discuss the concepts of screening and monitoring, and what previous research has found in this regard. Third, research in the context of the Scandinavian and

4
Swedish VC-market is discussed. Finally, we present research related to VC-firm
experience and performance.
A. Added Value from Venture Capital
Over the years a number of empirical studies have been carried out trying to show that value is added to firms that receive VC-financing. In a recent study Puri and Zarutskie (2012) found that VC-financed firms achieve larger scale
during the investment period, but are not more profitable at exit than a matched sample of non-VC-financed firms. However, they also found that cumulative failure rates are lower for VC-financed firms, mainly due to lower failure rates in
the initial years after financing. Kaplan and Schoar (2005) on the other hand suggest that VC-financed firms persistently do better in terms of investment returns and on average VC-fund returns exceed those of the S&P 500.
Other research investigating performance of VC-financed firms suggest both higher total factor productivity (TFP) (Chemmanur, et al., 2008) as well as excess return of as much as five percent relative to the aggregate public equity market5
(Ljungqvist and Richardson, 2003). Lerner (1999) evaluates the Small Business Innovation Research program6 and show that firms associated with the program grew significantly faster over a ten year period, both in terms of employment and
sales. European studies on the other hand have shown somewhat ambiguous results. Manigart and Hyfte (1999) studied 187 Belgian VC-financed firms and found
higher growth rates in total assets and cash flow for VC-financed firms. Bottazzi and Da Rin (2002) on the other hand examined 270 public European VC-financed firms and found that VC has limited effect on growth as well as job creation. This is in line with findings by Buergel et al. (2000) that found no significant effect of
VC in terms of firms’ sales and employment growth for British and German companies. Even though the research on Swedish data is scarce, Isaksson (1999) found
that Swedish VC-financed firms have a higher growth rate in terms of turnover as well as number of employees than comparable non-VC financed firms.
5 Estimated by the S&P 500 and the Nasdaq Composite Index. 6 A major public assistance initiative in the United States for high-technology firms.

5
B. Performance of VC-Financed Firms Before and After VC Investment
When the relationship between VC-financing and firm performance is evaluated a complexity to keep in mind is the fact that superior performance of VC-financed firms could be due to either the ability of VC-firms to find and invest
in firms that were stronger businesses even prior to investment (screening) or due to the support, advice and knowledge passed on from VC-firm to portfolio firm (monitoring).
Chemmanur et al. (2009) argued that the higher productivity of VC-financed firms arose from both screening and monitoring functions of VC-firms. Also, they found that high-reputation7 VC-firms have greater monitoring abilities in that
they produced higher growth rates in TFP for the firms they invested in. Hellman and Puri (2000) suggested that innovator firms8 are more likely to obtain VC-financing, suggesting that superior performance of VC-financed firms
could be due to the more innovative natures of the firms, a characteristic that was present even before the VC-financing was obtained. This is consistent with findings and conclusions drawn by Engel and Keilbach (2007); “the higher
innovativeness of venture-funded firms is due to the selection process of the venture capitalists”.
C. Scandinavian and Swedish VC-market
Most previous research concerned with VC-financing performance is conducted on the American VC-market, but VC has become a global phenomenon that has
been proven to exhibit a number of regional differences (Wright et al., 2004 and Bottazzi and Da Rin, 2002). In a recent study Berglund (2011) examined VC-financed firms in California
and Scandinavia and could discern a number of regional differences. First, Scandinavian VC-firms had less technical and organizational expertise within their company. Second, Scandinavian VC-firms were shown to have a less hands-
on approach to their portfolio companies and while they were actively involved in the management it was at an arm’s length distance and the VC-firm often 7 Where VC-firms reputation is defined by “their market share of the amount of funds raised by the VC over the prior five-year rolling window”. 8 Defined as: ”Innovators are those firms that are the first to introduce new products or services for which no close substitute is yet offered in the market”.

6
assumed a more dominant role. Californian VC-firms described themselves as
partners to their portfolio company while Scandinavian VC-firms foremost described themselves as investors. Third, Scandinavian VC-firms were often more exit oriented throughout the investment process.
Another regional difference found by Wright et al. (2004) was that European VC-firms use significantly different valuation methods compared to their American counterparts; European VC-firms are for example much less likely to
use DCF models in valuing their portfolio company. This indicates that conclusions drawn from American data can’t always be assumed to apply for the Swedish, or even European, VC industry.
D. Venture Capital-Firm Experience and Performance
Previous research examining VC-firm experience is quite diverse and a number of different methods and proxies for experience have been used.
Shepherd et al. (2003) defined experience as the number of years that decision-makers within the VC-firm had worked within the VC-industry and found a positive relationship between experience and performance, but with a decreasing
marginal effect. Cooper et al. (1994) examined experience of management and defined the variable as the prior experience of owning businesses for either the entrepreneur or for the management of the VC-firm. They found that
management experience was either weakly or not related to success (growth). Lerner (1994) defined VC-firm experience as a combination of age of the firm, the organization’s size as a percentage of total invested capital in the VC market and
prior investment in the specific industry. In our study the age of the VC-firm is used as a proxy for experience; Sorensen and Stuart (2001) stated that as VC-firms age they accumulate experiences in
evaluating business proposals and entrepreneurs, they extend their networks both within the VC-community and among entrepreneurs and also with age comes an increased likelihood that other VC-firms will bring good investment opportunities to collaborate on.
7
II. Data and Construction of the Matched Sample
The data used in this study primarily comes from three sources. Information on firms that has received VC-financing is collected from a dataset compiled by Creandum9, and this data set is presented in the first part of this section. In the
second part the database Serrano, from which information on firm characteristics and performance are collected and matched10, is presented. As a third source of information the database Retriever11 is used to complement Serrano. In the third
part of this section, we describe how the matching procedure was conducted, and in a final section a summary of the final dataset is presented.
A. Creandum Venture Capital Data Set
The Creandum VC dataset consists of 220 Swedish firms that have received VC-financing and were exited, either through IPO or acquisition, between 1996
and 2011. This is a relatively large as well as current dataset as far as VC-research is concerned. Creandum has includes all sectors except Life Science, Retail, Energy (oil and gas etc.), Environmental and Consulting. The dataset
contains, among others, information on industry, investors (VC-firms), invested amount, exit type, acquirer, and exit amount. For a few firms the investment year is included, for those where this information is missing we manually
collected this data to the extent possible. We also collect data on founding year of VC-firm from company websites and financial statements to help answer if there is a relationship between VC-firm experience and performance of VC-financed
firm. Information on year of investment and experience of VC-firm at the investment year is collected for a total of 59 VC-financed firms12. This is the subsample of firms used to help answer the second and third of our research questions. The Creandum-dataset is not complete with information for all
companies, hence, updates and some exclusion had to be made, leaving us with 197 VC-financed firms for the main analysis.
9 The Creandum data set was provided to us by thesis supervisor Einar Bakke and Per Strömberg. 10 The matching is performed in collaboration with supervisor Einar Bakke. 11 Retreiver Bussiness is a database containing information on all Swedish companies and provides the full financial statements from 2000 and onward. 12 Where more than one VC-firm invested in the first round an average of the years in business was used.

8
B. Serrano Database
The Serrano Database is used as a complementary data source for financial information on firm level. The financial data is based on financial statement data from the Swedish Companies Registration Office (Bolagsverket). In addition, it is
complemented with general company data from Statistics Sweden (SCB), bankruptcy information from the Swedish Companies Registration Office, and group data from PAR's group register. Serrano contains information from 1998
and onward. We extract information on number of employees13, sales, net profit/loss, and personnel expenses for all firms included in our sample. To be able to discern if VC-backed firms spend more on research and development
(R&D) and if this could be a contributing factor to better performance we also extract this information from Serrano. But as a consequence of lack of data on this variable in Serrano this variable later had to be dropped from the dataset.
For 49 of the firms Serrano provided data on parent company level where group level data was required to give a fair assessment of firm development. These companies were manually updated by consulting the financial statement
for each individual firm and year, accessed through Retriever. In examining the dataset and each firm in isolation we find a number of firms that had to be excluded due to either the exit taking place prior to 1998 (Serrano
does not provide information prior to this year), or having a corporate structure that does not allow us to make consistent inferences about the company’s performance and growth. Merged together with the Creandum dataset, these two
data sources provide extensive information on recent Swedish VC activity on a firm level.
C. Matching VC-Financed Firms to Non-VC-Financed Firms
With the goal of providing an answer to whether VC-financed firms outperforms non-VC-financed firms and make causal conclusion regarding value added by VC we form a one-to-one matched sample. The sample was matched on
three different firm characteristics; industry code, number of employees and sales at investment year if available, otherwise at the first year the firm appeared in
13 In Serrano the variable “Number of employees” is presented in different size categories from 0-9, see Appendix, Table VI for detailed information on the different categories.

9
Serrano. This is in accordance with previous research where a matched sample of
VC-financed and non-VC-financed firms has been used (e.g. Puri & Zarutskie, 2012 and Chemmanur, et al., 2008). By doing this we generate a sample of firms that initially are very similar in terms of business prospects (in order to minimize
selection bias). A matching procedure is used to find the firms most eligible to receive financing, i.e. most similar to those who actually receives financing. This will help us compare firms that are, from the outside, very similar except with
regards to financing. The matching procedure was mainly performed manually and is based on a weighted ranking of matched firms on three levels of restrictions14 in order to
ensure maximum consistency, i.e. at year one, matched pairs of firms are very similar in respect to industry, number of employees and sales. Our sample of VC-financed firms includes no failures, hence, we avoid including non-VC-financed
firms that failed during the observed years. Still the fact that no failures are included in the sample means there is a risk for survivorship bias15 in the results and hence, they should be considered with this in mind. However a number of
studies have found that even though there is survivorship bias present the magnitude of the effect are often small (e.g. Brown, et al., 1992 and, Amin and Kat, 2003). Also, since this study is a comparison between two samples which
both would include potential survivorship bias the comparison is still likely to be robust. One should also keep in mind the fact that the matched firms that have
survived without receiving VC-financing and support could indicate that they are inherently stronger businesses, and hence the comparison could even be skewed in favor of the matched sample.
14 Level 1: A precise match on SNI-code, in the same range of number of employees, and ranked by proximity in terms of sales. Level 2: A precise match on SNI-code, in the same, or +/- one, range of number of employees, and ranked by the proximity in terms of sales. Level 3: Matched on the first four digits in the SNI-code, in the same, or +/- one, range of number of employees, and ranked by the proximity in terms of sales 15 The performance of the sample is overestimated due to the fact that only firms performing well enough to survive is included.
10
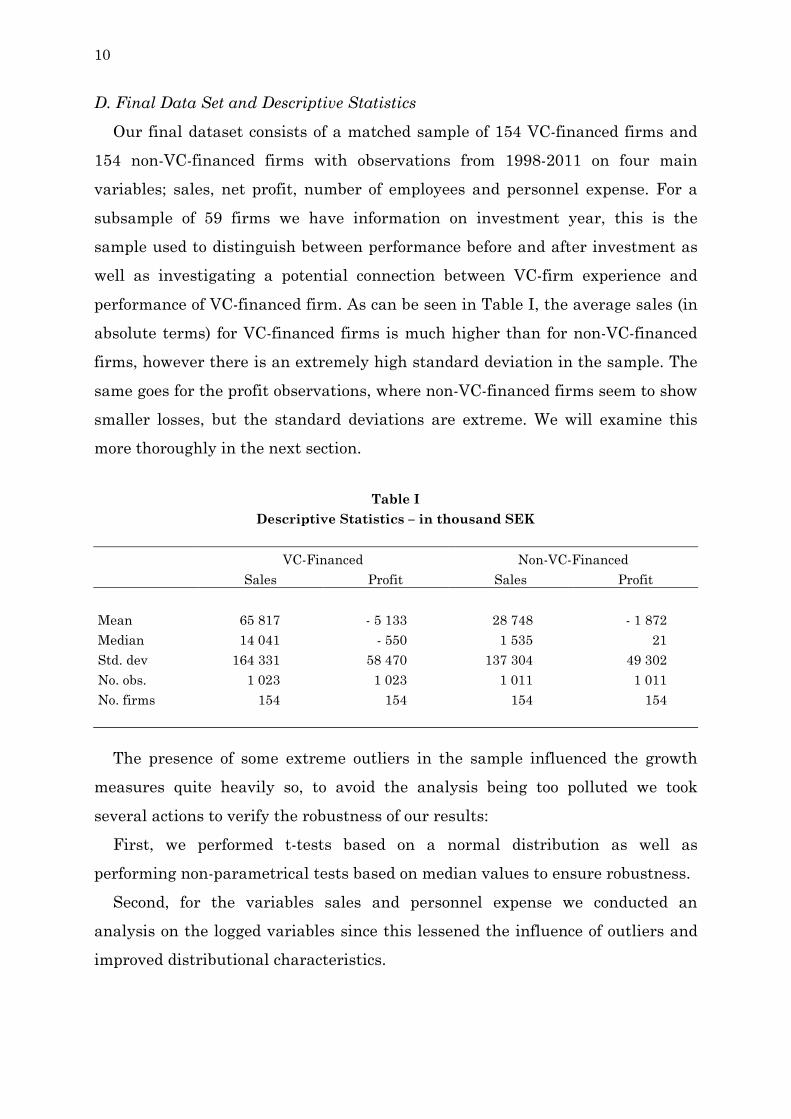
D. Final Data Set and Descriptive Statistics
Our final dataset consists of a matched sample of 154 VC-financed firms and 154 non-VC-financed firms with observations from 1998-2011 on four main variables; sales, net profit, number of employees and personnel expense. For a
subsample of 59 firms we have information on investment year, this is the sample used to distinguish between performance before and after investment as well as investigating a potential connection between VC-firm experience and
performance of VC-financed firm. As can be seen in Table I, the average sales (in absolute terms) for VC-financed firms is much higher than for non-VC-financed firms, however there is an extremely high standard deviation in the sample. The
same goes for the profit observations, where non-VC-financed firms seem to show smaller losses, but the standard deviations are extreme. We will examine this more thoroughly in the next section.
Table I
Descriptive Statistics – in thousand SEK
VC-Financed Non-VC-Financed Sales Profit Sales Profit
Mean 65 817 - 5 133 28 748 - 1 872 Median 14 041 - 550 1 535 21 Std. dev 164 331 58 470 137 304 49 302 No. obs. 1 023 1 023 1 011 1 011 No. firms 154 154 154 154
The presence of some extreme outliers in the sample influenced the growth measures quite heavily so, to avoid the analysis being too polluted we took
several actions to verify the robustness of our results: First, we performed t-tests based on a normal distribution as well as performing non-parametrical tests based on median values to ensure robustness.
Second, for the variables sales and personnel expense we conducted an analysis on the logged variables since this lessened the influence of outliers and improved distributional characteristics.
11
Third, for all variables related to profit growth, i.e. growth in profit margin
and profit, and for payroll margins the analysis was conducted on both original values and adjusted values where the outliers were removed, in the following result section these variables are presented as “adjusted”.
III. Performance of VC-Financed Firms (Method and Results)
In this section we present the method through which we reached our findings as well as the results we have found. We discuss the three research questions in
turn. First, do VC-financed firms outperform non-VC-financed firms in terms of business development? Second, we try to distinguish a monitoring effect of VC-financing by looking at performance prior to and after VC-investment. Third, we
examine if we can find a relationship between VC-financed firms’ performance and the experience of the VC-firm that has made the investment. The results show a significantly higher growth in sales and personnel
expenses, along with a lower profit margin for the VC-financed sample. A further analysis also concludes a stronger payroll margin16 expansion over time and that even though the VC-financed firms obtain a larger scale they start out smaller in
terms of sales. A comparison of performance before and after investment displays VC-financing increasing profitability and reducing personnel costs growth indicating a monitoring effect. As a final result the experience (in terms of age) of
VC-firms does not seem to be related to the firm performance.
A. VC-Financed Firms Outperform Non-VC-finance Firms
From the analysis of the matched dataset we can conclude that VC-financed firms do outperform non-VC-financed firms with significantly higher growth rates in sales. In terms of profit we cannot find that either VC-financed or non-
VC-financed firms grow at a significantly higher rate. However, quite contradictory the matched sample of non-VC-financed firms achieves a significantly higher profit margin.
In absolute terms we also find that the mean and median sales, personnel costs and size are significantly larger for VC-financed firms, whereas profit is
16 (Sales-Payroll)/Sales

12
significantly larger for non-VC-financed firms (see Table VII in Appendix). This is
consistent with the trends in growth. We also examine payroll margin (in accordance with previous research, e.g. Puri and Zarutskie, 2012) to see if VC-financed firms spend more money on staff
to achieve the higher sales growth. Payroll margin can also be viewed as an alternative measure of profitability. The results from these tests are consistent with those of the profit margin and show that both the median and mean payroll
margin is significantly higher for non-VC-financed firms. We can also see that when logged values of growth in personnel costs are examined VC-financed firms do increase their spending on personnel more than non-VC-financed firms. In
Table II details on our results can be found.
To ensure robustness of our results and since there are some extreme variations in growth from year to year, we also examine growth of the different variables from first to last year, or when available, from investment to exit. In
large, these tests indicate the same results. See Appendix, Table VIII, for details.
Table II
Firm Performance of VC-Financed Firms Compared to Non-VC-financed Firms The table compares the mean and median values of the variables in the two different groups, if a variable can be confirmed to be statistically larger than their equivalent in the other group, the significance is denoted next to the value (mean or median). This analysis is conducted on the main sample of 154 matched firms.
Mean Median VC non-VC VC non-VC Sales growth 5.4161 *** 0.9396 0.3990 *** 0.0077 ln (sales growth) 0.5408 *** 0.0167 0.3418 *** 0.0177 Profit growth - 285.7786 1.8115 * 0.0422 0.0222 * Adj. profit growth - 0.0673 0.1412 0.0896 0.0000 Personnel cost growth 3.0861 * 0.4961 0.2738 *** 0.0302 ln (personnel cost growth) 0.4390 *** 0.0199 0.2477 *** 0.0420 Profit margin - 14.3989 - 1.0363 * - 0.0742 0.0153 *** Adj. profit margin - 0.5984 0.4003 *** - 0.0330 0.0169 *** Payroll margin - 6.1942 - 1.8070 ** 0.4202 0.6296 *** Adj. payroll margin 0.2922 0.5370 *** 0.4588 0.6384 *** Size (no. of employees) 2.7390 *** 1.6647 3.0000 *** 1.0000 Size growth 0.2390 *** - 0.0597 0.0000 *** 0.0000 ***/**/* Pr. of the variable being larger than the variable in the other sample *= 10%, **= 5%, ***= 1%

13
The size, in terms of number of employees, is a variable commonly used to
explore the growth in size for companies (Puri and Zarutskie, 2012). In our sample we can see a significantly larger growth in number of employees for VC-financed firms over time as well as being larger on average. In Figure I we can
see how the VC-financed and non-VC-financed firms are similar with regards to number of employees (defined as “size category”, see Table VI in Appendix for details) at the time of matching17. The VC-financed firms then show a significant
growth over time and at year 12 they have an average number of employees between 20 and 49 while non-VC-financed firms have an average number of employees in the range between 4 and 9.
The findings of higher growth rates in sales for VC-financed firms while non-VC-financed firms show higher profitability is indicating higher costs for VC-financed firms, and as we can see, spendings on personnel is one of these higher
costs. These results are in line with earlier research by Puri and Zarutskie (2012) and Chemmanur et al. (2008) with one exception; Chemmanur et al. (2008) finds a higher productivity while we do not. Although we do not investigate
productivity directly, our results are ambigious in this regard. VC-financed firms
17 The use of size categories may lead to some under estimations since tha ranges for the different classes are not evenly distributes, for example category 2 ranges from 5-9 employees while category 6 ranges from 100-199 employees. However this does not effect the conclusions draw regarding VC and non-VC-financed firm performance.
0,00,51,01,52,02,53,03,54,0
1 2 3 4 5 6 7 8 9 10 11 12
Ave
rage
siz
e ca
tego
ry
Year
Figure I Average Size Category Over Time
Growth in number of employees in VC-financed and non-VC-financed firms over time (see Appendix, Table VI for details on
the categories).
VC-financednon-VC-financed
14
achieves significantly lower profitability but larger size indicating a lower
productivity but as will be shown in the next section VC-financing improves profitability and decreases the growth of personnel costs in the firms. Another analysis we perform is on the size differences of the VC-financed and
matched sample; this is done through a regression framework also used by Puri and Zarutskie (2012). Here we regress the firm size and profitability on a dummy variable named VC that is equal to one for VC-financed firm and zero for non-VC-
financed as well as a time variable (TimefromMatch) that measures the length in years from matching. In order to separately identify the time dimensions of each dependent variable for VC-financed firms, we include a variable that is equal to
the time variable multiplied by the VC-dummy (VC*TimefromMatch). We also include a square of TimefromMatch and VC*TimefromMatch to capture nonlinearities between the size and profitability over time. The analysis is run
through a pooled OLS with fixed effects to correct for potential firm and industry specific characteristics. In Table III the coefficients and t-statistics regression results are presented.
The three first regressions test the size of sales, employment and profitability of the firms. It can be observed that the only significant difference is that the average employment size appears to be larger for VC-financed firms. Although
one should remember that previous tests of the absolute value of sales showed that VC-financed firms grow larger and exhibit significantly lower payroll margins. On the last three regressions we can observe the growth patterns of the
variables. We can see that on all variables VC-financed firms grow faster but also at a marginally decreasing pace. What is also interesting is that the VC-financed firms appear to initially be smaller in terms of sales (although they are larger at the last (exit) year, see Table IX in Appendix).
To summarize, VC-financed firms achieve larger scale both in terms of sales and employees (even though they start smaller in terms of sales) but are not more profitable. This could indicate that VC-firms prioritize that their portfolio
companies grow large rather than profitable before exit.

15
B. Difference in Performance Before and After VC-Investment
When examining the subsample of 59 VC-financed firms for which investment
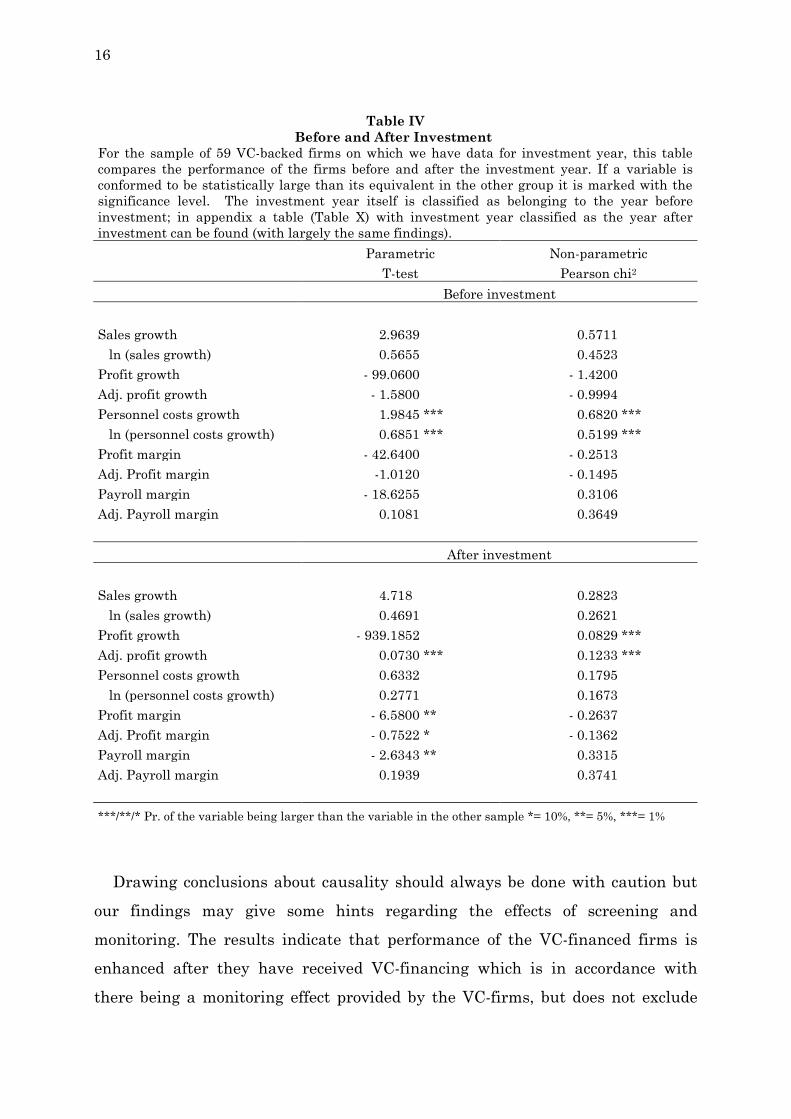
year is available we find two main results; first, personnel cost grow at a significantly higher rate before investment, and second, profits grow at a significantly higher rate after the investment. For sales growth, and profit
margins the analysis indicate better performance after the time of VC-investment, however none of the results are significant (see Table IV). These results indicate that VC-firms do in fact improve the profitability of the
VC-financed firms even though non-VC-financed firms show better profit margins, and that slowing down the growth in personnel costs is one contributing factor to improved profits.
Table III
Matched sample size and profitability regression analysis The table presents a total of six regressions on the matched sample of 154 VC-financed and 154 non-VC-financed firms. Information on the dependent variables can be found in section I.D. VC is a dummy variable equal to one for VC-financed firms. TimefromMatch measures the time in years from matching between the VC-financed and non-VC-financed firms. All regressions are pooled OLS regressions with fixed effects.
Log(Sales) Size Adj. PRM Log(Sales) Size Adj. PRM VC 1.297 1.500 *** 0.017 - 2.087 *** - 0.137 - 0.256 (1.42) (2.64) (0.10) (- 2.70) (- 0.26) (- 1.61) VC*Timefrom Match
0.732 *** 0.380 *** 0.072 *** (10.33) (8.41) (4.65)
VC*Timefrom Match2
- 0.035 *** - 0.014 *** - 0.004 *** (- 5.45) (- 3.43) (- 3.01)
TimefromMatch 0.118 ** -0.021 - 0.006 (2.42) (- 0.70) (-0.52) TimefromMatch2 - 0.008 * -0.003 0.000 (- 1.91) (- 1.04) (0.48) cons 7.866 *** 1.479 *** 0.046 8.129 *** 1.828 *** 0.094 (17.55) (5.48) (0.57) (21.28) (7.28) (1.14) N 1797 1935 1643 1797 1935 1643 R2 0.001 0.004 0.000 0.321 0.189 0.054 t statistics in parentheses * p < 0.1, ** p < 0.05, *** p < 0.01
16
Table IV
Before and After Investment For the sample of 59 VC-backed firms on which we have data for investment year, this table compares the performance of the firms before and after the investment year. If a variable is conformed to be statistically large than its equivalent in the other group it is marked with the significance level. The investment year itself is classified as belonging to the year before investment; in appendix a table (Table X) with investment year classified as the year after investment can be found (with largely the same findings).
Parametric Non-parametric T-test Pearson chi2
Before investment
Sales growth 2.9639 0.5711 ln (sales growth) 0.5655 0.4523 Profit growth - 99.0600 - 1.4200 Adj. profit growth - 1.5800 - 0.9994 Personnel costs growth 1.9845 *** 0.6820 *** ln (personnel costs growth) 0.6851 *** 0.5199 *** Profit margin - 42.6400 - 0.2513 Adj. Profit margin -1.0120 - 0.1495 Payroll margin - 18.6255 0.3106 Adj. Payroll margin 0.1081 0.3649
After investment
Sales growth 4.718 0.2823 ln (sales growth) 0.4691 0.2621 Profit growth - 939.1852 0.0829 *** Adj. profit growth 0.0730 *** 0.1233 *** Personnel costs growth 0.6332 0.1795 ln (personnel costs growth) 0.2771 0.1673 Profit margin - 6.5800 ** - 0.2637 Adj. Profit margin - 0.7522 * - 0.1362 Payroll margin - 2.6343 ** 0.3315 Adj. Payroll margin 0.1939 0.3741 ***/**/* Pr. of the variable being larger than the variable in the other sample *= 10%, **= 5%, ***= 1% Drawing conclusions about causality should always be done with caution but
our findings may give some hints regarding the effects of screening and monitoring. The results indicate that performance of the VC-financed firms is enhanced after they have received VC-financing which is in accordance with
there being a monitoring effect provided by the VC-firms, but does not exclude

17
there also being a screening effect. These results are similar to those found by
Chemmanur, et al. (2008). Due to a smaller sample size, results should be viewed with caution, 42 firms were observed before investment and 58 after. To ensure robustness all tests has
been performed with the investment year belonging to the group “before investment” as well as the group “after investment”, in large both tests showed the same results. See Table X in Appendix for these results.
In Figure II and III we can observe the operational development over time for all of the VC-financed firms as well as for the non-VC-financed firms. In comparing them we can see that revenue and profit increase over time for both
samples. So the findings of increased growth after investment for VC-financed firms should be considered with this overall positive development for all firms in mind. As can be seen in Figure III, there is a presence of outliers in the Revenue
variable. These few large firms exit in year eight, and hence the average revenue drops significantly in year nine.
-50 000
0
50 000
100 000
150 000
200 000
250 000
300 000
350 000
1 2 3 4 5 6 7 8 9 10 11 12 13
Ave
rage
Year
Figure II Operational development over time
Average operational development over time (from time of matching to exit) for VC-financed firms (SEK). Due to the the cumulative exit rate, the number of observations for the last few years drops significantly.
RevenueProfitPersonnel cost

18
To summarize, VC-financed firms are, as we saw in the previous section, less
profitable than non-VC-financed firms, however we also observed an increased growth in profit after the VC-investment. What also should be pointed out is that the higher sales growth for VC-financed firms cannot be contributed to the VC-
investment. While one should be careful drawing conclusions regarding causality, this analysis implies the following; although VC-financed firms grow larger and faster, and are less profitable, the main contribution of the VC-firm is an increased profitability.
C. Experience of VC-firm
When examining the subsample of 59 firms we find no significant relationship
between VC-firm experience and VC-financed firm performance. To be able to see if we could discern a connection between VC-firm experience and VC-financed firm performance we construct a ranking system where profit growth, sales
growth as well as profit and sales in absolute terms are weighted for firms where we have information on both investment year and founding year of VC-firm, see Table V for details. All 59 firms are ranked from “best” to “worst” performance
during the period from investment to exit. Firms are then split in three different
-20 000
0
20 000
40 000
60 000
80 000
100 000
1 2 3 4 5 6 7 8 9 10 11 12 13
Ave
rage
Year
Figure III Operational Development Over Time
Average operational development over time (from time of matching to exit) for non-VC-financed firms (SEK). In year seven and eight we see a significant spike in the average revenue, this is due to the precense
of
RevenueProfitPersonnel cost

19
top and bottom performing ranges, and t-tests as well as non-parametric tests are
performed; the test are also performed on the logged values of experience for improved distributional characteristics (see Appendix, Table XI for results). In neither of these tests the hypotheses of equal mean/median in the different
quartiles could be rejected, although one has to keep in mind the small sample size when reviewing this.
Table V
Differences in experience Differences in experience (age) of VC-firm at the year of investments for the top and bottom performing VC-firms. The analysis is run on three percentile ranges, top/bottom 25%, top/bottom 15% and top/bottom 5%. In the table the labels “Lower range” and “Upper range” denotes the percentiles. The “P-values” is the p-value of the t-statistic of there being a difference between the Lower and Upper range means. Table XI in appendix does the same analysis on logged values of age.
Percentiles range Lower range mean Upper range mean P-values
Lower range Upper range
< 25 > 75 10.7 10.1 0.8270 < 15 > 85 7.7 10.0 0.5563 < 5 > 95 6.9 6.8 0.9799
***/**/* Pr. of the variable being larger than the variable in the other sample *= 10%, **= 5%, ***= 1% In our research we use the age of the VC-firm as a proxy for experience. This is
in accordance with previous research by Lerner (1994) where age of VC-firm was included to help indicate experience of VC-firm. However, in most previous research age is only one of a few variables indicating experience. The most
common variables used to proxy experience of VC-firm is either market share of invested capital in the VC-market each year (e.g. Lerner, 1994) or experience of decision makers within the VC-firm (e.g. Shepard et al., 2003).
For the scope and time frame of this thesis, data on market share of invested capital for each VC-firm or experience of decision-makers was unfortunatly not feasible to collect. Hence, the results found in this section of the paper and the
conclusions drawn should be viewed with caution. What we find is that the age of the VC-firm does not explain performance in our data, however with a different measurement of experience such relationship could and have been be found.

20
IV. Conclusion and Implications
In this paper we make use of a hand-collected data set of 308 VC and non-VC-financed firms from birth to exit on the Swedish market between the years 1998 and 2011 to try to answer three main research questions.
First, do VC-financed firms outperform non-VC-financed firms in terms of business development? We conclude that VC-financed firms do show superior performance in terms of significantly faster sales growth. However, the matched
sample of non-VC financed firms display larger profit margins. In terms of size we can see a clear pattern of VC-financed firms achieving larger scale over time. What also should be highlighted is the superior but marginally declining growth
rate of sales, employment and payroll margin for the VC-financed firm. VC-financed firms are also on average smaller (in terms of sales) at time of matching but does grow at a significantly larger rate and are at the time of exit
significantly larger in absolute terms. Combined, these two analyses provide strong support for VC-firms prioritizing and achieving larger scales (employment and sales) for their portfolio companies rather than focusing on profitability.
Second, we try to distinguish a monitoring effect of VC-financing. Here we find support for a monitoring effect when looking at the performance of the subsample of VC-financed firms post and prior to the VC-investment. In this analysis a
significant increase in growth in profit after the investment is said to be the main finding. We can however not rule out or confirm any screening ability since we cannot conclude to what extent the difference between VC-financed and non-VC-
financed firms can be accounted for by the monitoring effect. Third, we find no support for a relationship between VC-financed firm performance and the age of the VC-firm that has made the investment. However we recommend caution when generalizing this finding to include other variables
that age, mainly due to a lack of other relevant variables such as market share of invested capital in the VC-market (a more relevant measure than age) and a small sample size.
To further paint the picture of the dynamics of the Swedish VC-market additional research is needed. A dataset including VC-financed firms that fail would exclude potential survivorship bias and conclusions about higher or lower

21
failure rates for VC-financed firms in comparison to non-VC-financed firms could
be examined. A qualitative study examining if growing large in terms of sales and employees is an intentional goal of VC-firms (since this is the finding in both this study and a paper by Puri and Zarutskie (2012)) is further research we
would be interested in reading. Also, more extensive data on experience of VC-firms, for example data on experience of decision-makers, market share of invested capital each year and industry specific experience, would paint a more
accurate picture of the relationship between experience of VC-firm and performance of portfolio companies. As a final note, we would like to present two possible theories concerning the
causality regarding the findings in this study. Is the development in VC-financed firm a characteristic of either; VC-firms prioritizing and achieving larger scales and through that increasing profitability over time, or is it VC-firms finding
businesses with inherently large growth and trying to improve the profitability of the firm?

22
References
Amin, G. S. & Kat, H. M., 2003. Welcome to the Dark Side: Hedge Fund Attrition and Survivorship Bias Over the Period 1994-2001. Journal of Alternative Investment, 6(1), pp. 57-73.
Baker, M. P. & Gompers, P. A., 1999. Executive Ownership and Control in Newly Public Firms: The Role of Venture Capitalists. Working Paper, Harvard Business School.
Barry, C. B., Muscarella, C. J., Peavey, J. W. & Vetsuypens, M. R., 1990. The Role of Venture Capital in the Creation of Public Companies: Evidence from the Going-Public Process. Journal of Finance, 27(2), pp. 447-471.
Berglund, H., 2011. Early Stage Venture Capital Investing: Comparing California and Scandinavia. Venture Capital, April, pp. 119-145.
Bottazzi, L. & Marco, D. R., 2002. Venture Capital in Europe and the Financing of Innovative Companies. Economic Policy, Volume 17, pp. 229-269.
Brown, S. J., Goetzmann, W., Ibbotson, R. G. & Ross, S. A., 1992. Survivorship Bias in Performance Studies. The Review of Financial Studies, 5(4), pp. 553-580.
Chemmanur, T. J., Krishnan, K. & Nandy, D. K., 2008. How Does Venture Capital Financing Improve Efficiency in Private Firms? A Look Beneth the Surface.. Oxford Journals, Economics & Social Science Review of Financial Studies, 24(12), pp. 4037 - 4090.
Cooper, A. C., Gimeno-Gascon, J. F. & Woo, C. Y., 1994. Initial Human and Financial Capital as Predictors of New Venture Performance. Journal of Business Venturing, Volume 9, pp. 371-395.
Engel, D. & Keilbach, M., 2007. Firm-Level Implications of Early Stage Venture Capital Investment - An Empirical Investigation. Journal of Empirical Finance, Volume 14, pp. 150-167.
Goldschein, E., 2011. http://www.businessinsider.com. [Online] Available at: http://www.businessinsider.com/most-creative-countries-in-the-world-2011-10?op=1 [Accessed 7 February 2012].
Gompers, P. A. & Lerner, J., 2004. The Venture Capital Cycle. 2nd ed. s.l.:MIT Press.
Gompers, P. & Lerner, J., 2001. The Venture Capital Revolution. Journal of Economic Perspective 15, pp. 145-168.
Hellman, T. & Puri, M., 2000. The Interaction Between Product Market and Financing Strategy: The Role of Venture Capital. The Review of Financial Studies, 13(4), pp. 959 9884.
Kaplan, S. N. & Schoar, A., 2005. Private Equity Performance: Returns, Persistence, and Capital Flows. The Journal of Finance, LX(4), pp. 1791-1823.
23
Kaplan, S. N., Sensoy, B. A. & Stromberg, P., 2009. Should Investors Bet on the Jockey or the Horse? Evidence from the Evolution of Firms from Early Business Plan to Public Companies. The Journal of Finance, 64(1), pp. 75 - 115.
Lerner, J., 1994. The Syndication of Venture Capital. Financial Management, 22(3), pp. 19- 27.
Lerner, J., 1999. The Government as Venture Capitalists: The Long R>un Impact of the SBIR Program. Journal of Business, 72(3), pp. 285-318.
Ljungqvist, A. & Richardson, M., 2003. The Cash Flow, Return and Risk Characteristics of Private Equity. Working Paper, New York University.
Mangiart, S. & Van Hyfte, W., 1999. Post-Investment Evolution of Belgian Venture-Capital Backed Companies: An Empirical Study. Paper presented at the Babson Entrepreneurship Conference.
Puri, M. & Zarutskie, R., 2012. On the Lifecycle Dynamics of Venture-Capital- and Non Venture-Capital-Financed Firms. Journal of Finance.
Shepherd, D. A., Zarcharakis, A. & Baron, R. A., 2003. VC's Decision Processes: Evidence Suggesting More Experience May Not Always Be Better. Journal of Business Venturing, Volume 18, pp. 381-401.
Silver, A. D., 1985. Venture Capital: the Complete Guide for Investors. New York: John Wiley & Sons.
Sorensen, O. & Stuart, T. E., 2001. Syndication Networks and the Spatial Distribution of Venture Capital Investments. American Journal of Sociology, 106(6), pp. 1546-1588.
SVCA, 2012. Analys av riskkapitalmarknaden, Fjärde kvartalet 2012, Stockholm: SVCA.
Wright, M. et al., 2004. Venture Capital Investors, Capital Markets, Valuation and Information: US, Eurpoe and Asia. Journal of International Entrepreneurship, Volume 2, pp. 305 - 326.

24
APPENDIX
Table VI
Number of Employees Size categories of number of employees as defined by the Serrano database. Category Range (no. of employees)
0 0 1 1-4 2 5-9 3 10-19 4 20-49 5 50-99 6 100-199 7 200-… 9 data missing
Table VII Firm Performance – Absolute Values
Mean and median firm performance of VC-backed firms compared to non-VC-backed firms. The table compares the mean and median values of the variables in the two different groups, if a variable can be confirmed to be statistically larger than their equivalent in the other group, the significance is denoted next to the value (mean or median). The analysis is conducted on the sample of 154 matched firms. The notation is in absolute values, thousands of SEK. Mean Median VC non-VC VC non-VC Sales 68 894.36 *** 27 285.66 15 497.50 *** 1 552.00 ln (Sales) 9.36 *** 7.73 9.74 *** 7.64 Profit - 4 763.39 - 447.29 ** - 675.50 22.00 *** Personnel Costs 27 339.77 *** 7 208.00 9 432.50 *** 580.00 ln (Personnel Cost) 9.05 *** 7.02 9.27 *** 6.99 Size 2.80 *** 1.65 3.00 *** 1.00
***/**/* Pr. of the variable being larger than the variable in the other sample *= 10%, **= 5%, ***= 1%

25
Table VIII Firm performance over entire time period
Firm performance of VC-backed firms compared to non-VC-backed firms. Growth over entire time period, from first to last year. The table compares the mean and median values of the variables in the two different groups, if a variable can be confirmed to be statistically larger than their equivalent in the other group, the significance is denoted next to the value (mean or median).
Mean Median VC non-VC VC non-VC Sales growth 1 675.2390 18.3546 7.8344 *** 0.0434 ln (sales growth) 2.7496 *** 0.3615 2.1851 *** 0.3119 Profit growth 366.4216 * 2.4433 0.6008 0.2273 Adj profit growth 1.2494 0.7616 0.3515 0.1799 Personnel costs 201.1202 8.5207 3.1785 *** - 0.0250 ln (personnel cost growth) 1.8783 *** 0.3370 1.4822 *** 0.2600 Size 2.6275 *** 1.6078 3.0000 *** 1.0000 Size growth 1.2026 *** - 0.3007 1.0000 *** 0.0000 ***/**/* Pr. of the variable being larger than the variable in the other sample *= 10%, **= 5%, ***= 1%
Table IX Size at exit (last) year
Firm performance of VC-backed firms compared to non-VC-backed firms at the last year they appear in the dataset (of 154 matched firms). In absolute values, thousands of SEK.
Mean Median VC non-VC VC non-VC Sales 116 519.60 *** 31 896.55 26 429.00 *** 1263.00 ln (sales) 10.08 *** 7.69 10.25 *** 7.57 Profit 4775.10 - 525.88 2.00 24.00 * Profit margin - 7.27 - 4.42 0.00 0.02 ** Adj. Profit margin - 0,19 0.02 * 0.02 0.03 * Payroll margin - 2.38 - 13.84 0.49 0.67 *** Adj. Payroll margin 0.44 0.58 ** 0.51 0.71 * Size 3.18 *** 1.38 3.00 *** 1.00
***/**/* Pr. of the variable being larger than the variable in the other sample *= 10%, **= 5%, ***= 1%

26
Table X For the sample of 59 VC-backed firms on which we have data for investment year, this table compares the performance of the firms before and after the investment year. This table has a set-up identical to Table IV except that the investment year is classified as year after investment Parametric Non-parametric T-test Pearson chi2
Before investment
Sales growth 1.9749 0.4927 ln (sales growth) 0.5839 0.4195 Profit growth - 99.8600 - 0.9898 Adj profit growth - 1.4763 - 0.8874 Personnel costs 1.7183 ** 0.5174 ** ln (personnel costs) 0.6285 *** 0.4170 ** Profit margin 9.2108 - 0.0638 *** Adj. Profit margin - 0.8505 - 0.0555 ** Payroll margin - 3.7696 0.3774 * Adj. Payroll margin 0.1923 0.4372 After investment Sales growth 4.6925 0.3094 ln (sales growth) 0.4779 0.2756 Profit growth - 820.6900 0.0000 ** Adj profit growth - 0.1362 *** 0.0479 ** Personnel costs 0.8731 0.2079 ln (personnel costs) 0.3452 0.1928 Profit margin - 23.0949 - 0.3320 Adj. Profit margin - 0.8484 - 0.1945 Payroll margin - 3.7696 0.3041 Adj. Payroll margin 0.1923 0.3540 ***/**/* Pr. of the variable being larger than the variable in the other sample *= 10%, **= 5%, ***= 1%

27
Table XI
Differences in experience (logged values) The table displays differences in experience (age) of VC-firm at the year of investments for the top and bottom performing VC-firms, using the same set-up as Table V, with the exception of using logged values to improve distributional characteristics.
Percentiles range Lower range mean Upper range mean P-values
Lower range Upper range
< 25 > 75 2.1 2.1 0.9475 < 15 > 85 1.7 2.0 0.5535 < 5 > 95 1.7 1.8 0.8309
***/**/* Pr. of the variable being larger than the variable in the other sample *= 10%, **= 5%, ***= 1%