perception of temperature and wind by users of public
TRANSCRIPT

ORIGINAL PAPER
Perception of temperature and wind by users of publicoutdoor spaces: relationships with weather parametersand personal characteristics
Henrique Andrade & Maria-João Alcoforado &
Sandra Oliveira
Received: 25 February 2010 /Revised: 6 September 2010 /Accepted: 2 October 2010 /Published online: 30 October 2010# ISB 2010
Abstract We aim to understand the relationship betweenpeople’s declared bioclimatic comfort, their personal char-acteristics (age, origin, clothing, activity and motivation,etc.) and the atmospheric conditions. To attain this goal,questionnaire surveys were made concurrently with weathermeasurements (air temperature, relative humidity, solar andlong-wave radiation and wind speed) in two open leisureareas of Lisbon (Portugal), during the years 2006 and 2007.We analysed the desire expressed by the interviewees todecrease, maintain or increase the values of air temperatureand wind speed, in order to improve their level of comfort.Multiple logistic regression was used to analyse thequantitative relation between preference votes and environ-mental and personal parameters. The preference for adifferent temperature depends on the season and is stronglyassociated with wind speed. Furthermore, a general de-crease of discomfort with increasing age was also found.Most people declared a preference for lower wind speed inall seasons; the perception of wind shows significantdifferences depending on gender, with women declaring alower level of comfort with higher wind speed. It was alsofound that the tolerance of warmer conditions is higher thanof cooler conditions, and that adaptive strategies areundertaken by people to improve their level of comfortoutdoors.
Keywords Bioclimatic comfort . Personal parameters .
Thermal environment . Outdoor spaces .Weather perception
Introduction
The assessment of bioclimatic comfort in outdoor areas is acomplex task, due to the high variability of the outdoorenvironment conditions and the influence of subjectivefactors (especially psychological and cultural) in the percep-tion of the atmospheric environment (Höppe 2002; Spagnoloand De Dear 2003; Knes and Thorsson 2006; Nikolopoulouand Lykoudis 2006; Oliveira and Andrade 2007; Lin 2009).It is currently well known that models developed to assessindoor conditions, based on the human body thermalbalance (Fanger 1972; Gagge et al. 1986; Parsons 1993),are inadequate to understand outdoor thermal comfort,since they can only be used as an approach to assess thethermophysiological component of the thermal comfort.
Recent studies on this subject combine measurements ofweather parameters with interviews, with the aim of under-standing the complex relationships between meteorologicaland personal (including psychological) factors in the percep-tion of the atmospheric environment (Ahmed 2003; Givoni etal 2003; Spagnolo and De Dear 2003; Stathopoulos et al.2004; Knes and Thorsson 2006; Lin and Matzarakis 2008).
A study on the perception of atmospheric conditions byusers of urban open spaces was carried out in Lisbon duringthe years of 2006 and 2007; its main purpose was toimprove knowledge on the relationships between outdoormicroclimatic conditions and the perception of bioclimaticcomfort, which can contribute to improving the design ofurban outdoor spaces. The first results (concerning datafrom late winter and spring of 2006) are explained inOliveira and Andrade (2007); in this initial experience, thequestionnaires were used in just one open space in Lisbon(Belem) located in the southern part of the city (Fig. 1).
All the results obtained during this 2-year study aboutthe perception of air temperature and wind speed are
H. Andrade (*) :M.-J. Alcoforado : S. OliveiraCentre of Geographical Studies, University of Lisbon,Lisbon, Portugale-mail: [email protected]
Int J Biometeorol (2011) 55:665–680DOI 10.1007/s00484-010-0379-0

presented in this paper. According to De Dear and Brager2002, there are two main aspects to consider in the thermalperception: sensation and satisfaction. Only the latter willbe analysed in this paper, according to temperature or windpreferences expressed by the interviewed people (prefer-ence votes). The goals of this study are mainly exploratoryand, unlike other research on the same topic (e.g. Hwangand Lin 2007; Lin and Matzarakis 2008), the significanceof a given thermal physiological index (SET* and PET,respectively, in the mentioned works) was not assumed apriori; the research was instead directed towards seeking thevariables or indices that related better with thermal or windpreferences votes, without any initial pre-conceived idea.Thus, the objectives pursued were: (1) to assess therelationship between bioclimatic comfort (expressedthrough preference votes) and the climatic and environ-mental conditions; and (2) to identify the personalparameters that influence the preference votes, namelytemperature and wind in outdoor environments.
Multiple logistic regression was used to model therelationship between the preference votes and environmen-tal and personal parameters. The results concerning theperception of temperature and wind speed are discussedseparately, and the main conclusions outlined.
Materials and methods
This study was based on questionnaires, surveys and measure-ments of weather parameters performed simultaneously inLisbon (Fig. 1), the capital and larger city of Portugal. Lisbonlies 30 km to the east of the Atlantic shore and right on thebank of the Tagus estuary, which is 15 km wide east ofLisbon (Fig. 1). The city has approximately 600,000inhabitants and is the centre of a metropolitan area withnearly 2.5 million inhabitants. Lisbon has a “Mediterranean”climate, with mild winters and hot and dry summers.
Study areas
The field sessionswere carried out in two open areas in Lisbon:Parque das Nações (the 1998 Expo site) that will be referredhenceforth as ‘Expo’ and Alcântara, not far away from theBelem Tower, will be referred to shortly as Belem, Fig. 1).Both study areas are open outdoor spaces by the Tagusriverside, although each one has specific characteristics:
& Belem is located in the southern part of the city and isused for promenading and some sport activities (such asjogging, football and fishing), particularly during
Fig. 1 Lisbon and the study areas
666 Int J Biometeorol (2011) 55:665–680

weekends. The area has paved sidewalks and grassedareas. There are benches facing south on both the greenand paved areas. More than half the total area is coveredby grass, but people use mainly the paved area, builtwith Portuguese limestone mosaic. The trees are around10 m tall and are exclusively deciduous (Celtisaustralis) bordering the east and west sides andcovering only about 20% of the area, which results ina low availability of shade. A total of 461 inquiries weremade in Belem.
& Expo is also located by the Tagus, but north-east of the citycentre. It offers a larger choice of leisure and commercialactivities than Belem. The site where the fieldwork tookplace is almost entirely paved (about 70% of the area),built with a mixture of concrete and gravel; it has no grass,but it has many perennial trees (Pinus pinea, with anaverage height of 8–9 m, and crowns that cover about50% of the area; Fig. 1) supplying many shaded spotsduring the whole year. There are benches and low walls,with different orientations, providing many places to sitin the shade. A total of 482 interviews were carried out atthe Expo site.
Field data collection
The field work included weather measurements, question-naires and a photographic survey, carried out simultaneous-ly. Measurements of air temperature (Ta), wind speed (v)and relative humidity (RH) were made every 30 s,concurrently with the interviews (on average, 3 measure-ments were made during each interview). Solar (K) andinfrared radiation (L) were measured every 30 min.
After the first experiment, described in Oliveira andAndrade (2007), a large number of additional measure-ments sessions and questionnaires were made in the studyareas during 2006 and 2007, in order to account fordifferent seasons and weather types.
Calculation of mean radiant temperatureand thermophysiological indices
Mean radiant temperature (Tmrt) is a parameter thatmeasures the thermal influence of the radiant fluxes in thehuman body, and it was calculated using the methoddescribed in Jendritzky and Nübler (1981); it has beenused in other works such as Spagnolo and De Dear 2003and Oliveira and Andrade (2007). For each measurementsession, radiant fluxes were measured and Tmrt wascalculated in sunshine conditions (under direct solarradiation) and in the shade.
Thermophysiological indices were calculated in order toevaluate the combined effect of atmospheric variables on
preference votes: Predicted Mean Vote (PMV; Fanger 1972;Jendritzky and Nübler 1981; Parsons 1993), StandardEffective Temperature (SET*; Parsons 1993; Chen et al.2004) and Physiological Equivalent Temperature (PET;Höppe 1999; Matzarakis et al. 1999). Tabulated values ofclothing insulation and metabolic heat production wereused for the calculation of PMV and SET* (Parsons 1993),while constant values of clothing and physical activity wereassumed for PET determination.
Several series of PMV, PET and SET* indices werecalculated using different values of Tmrt: (1) referring to thelocation of the interviews (sun or shade); (2) only with Tmrt
in the sun; and (3) only with Tmrt in the shade and iv)considering Tmrt = Ta.
Additional to the thermophysiological indices, an em-pirical coefficient (ν#), combining two wind parameterswas calculated, following the work of Oliveira and Andrade(2007); the authors found that the perception of winddepends strongly on a combination of maximum windspeed measured during each interview (vmax) and thestandard deviation of wind speed during the same period(SV); therefore, the ν# coefficient was computed asfollows: V# ¼ vmax þ SV . In this study, V# is used toevaluate the perception of atmospheric conditions insteadof wind speed alone.
Characterization of fieldwork days
The fieldwork was carried out during the afternoons of11 days of 2006 and of 2007, throughout the years.
Interviews were repeated in the summer 2007, in orderto acquire a larger diversity of data for different weathertypes. Characterization of the fieldwork days is shown inTable 1. All days had clear weather conditions (absence ofrainfall and cloudless or nearly cloudless sky), but therewas a large variety of thermal and wind conditions; thisallowed us to cover a representative sample of the different“promenade” weather conditions in Lisbon. Mean airtemperature in the studied areas (calculated for each fieldwork period that lasted for several hours during the hotterpart of the day) varied between 14.6°C and 30.6°C. Most ofthe fieldwork days had quite a high maximum airtemperature. At the meteorological station Lisboa/Geo-físico, located north of the city centre (Fig. 1), the majorityof the days under study registered maximum temperaturesthat were higher than the maximum normal (30-yearaverage), except in winter when they were slightly belowthe “normal”, and in the 2007 summer period that wasparticularly cool. Wind speed was higher in the summerperiods and, in spite of its lower average, the summer of2007 had stronger wind than the summer of 2006 (90thpercentile of wind speed 5.6 m s−1 on 22 July 2007;4.6 m s−1 on 21 July 2006).
Int J Biometeorol (2011) 55:665–680 667

The questionnaire
The questionnaire was described in detail in Oliveira andAndrade (2007). It is divided into two parts: in the first one,the personal characteristics of the interviewees (age, gender,clothing, activity, geographical origin, among others) aredescribed; in the second part, the questions aim at detectingthe personal perception of the atmospheric conditions andthe thermal and wind preferences of the interviewees. Animportant question in the first part of the questionnairerefers to the clothing worn by the interviewees. Theprocedure followed to classify clothing is explained in
Oliveira and Andrade (2007, p. 74); the estimation of thethermal resistance of clothing was based on Parsons (1993)and expressed in Clo units. In the second part, there arefour questions about the perception of the atmosphericconditions (Oliveira and Andrade 2007, p. 76); in thiswork, only the questions referring to the preference votesassociated with particular weather variables were analysed(questions 20 and 22, Table 2):
& The answers to question 20 showed which was the mostunpleasant weather parameter for the interviewees at thetime of the questionnaire;
Table 1 Characterization of the fieldwork days
Fiieldwork date Area(see Fig. 1)
Average values in the study areas Maximum airtemperatureb =difference betweenfieldwork day andmaximum monthlymean
Air temperatureTa (°C)
Relative humidityRH (%) ( m s−1)
Wind speed Global solarradiation K (W m2)
12-03-2006 Belem 20.2 64.4 1.9 595.2 +4.6
23-04-2006 Belem 26.4 45.6 2.7 620.2 +3.8
13-05-2006 Expo 26.9 43.0 a 627.0 +2.9
22-07-2006 Expo 28.4 48.1 1.3 872.5 +0.4
23-07-2006 Belem 30.6 43.6 3.0 811.2 +2.2
11-11-2006 Expo 20.8 67.9 1.8 293.1 +3.2
12-11-2006 Belem 20.7 60.7 1.3 302.8 +4.2
03-02-2007 Expo 14.6 69.0 1.2 335.0 −1.104-02-2007 Belem 14.8 71.2 2.0 304.4 −0.721-07-2007 Expo 25.5 41.6 2.9 819.8 −422-07-2007 Belem 25.3 41.8 2.7 801.4 −3.3
a No data collection due to a technical failureb At the meteorological station of Lisboa/Geofísico (Fig. 1)
Table 2 Questions 20 and 22 of the questionnaire
20. What is the most unpleasant weather parameter at this moment a. Temperature b. Humidity c. Solar radiation d. Wind e. None
22. Do you think the weather conditions would improve if you could change the following meteorological parameters: Parameters Much lower Lower The same Higher Much Higher a. Temperature b. Humidity c. Solar radiation d. Wind e. None
668 Int J Biometeorol (2011) 55:665–680

& The answers to question 22 indicated how the inter-viewees would like to modify any of the individualparameters in order to improve their satisfaction; thiscorresponds to Thermal Preference Votes or WindPreference Votes. Although a seven-point scale couldbe more correct in theory (De Dear and Brager 2001;Spagnolo and De Dear 2003), a five-point scale wasused in this study (following Stathopoulos et al. 2004),because it is likely to be more successful in streetinquiries, where time and simplicity are crucial toobtain the interviewees’ cooperation.
& Furthermore, the scale was reduced to 3 points duringthe analysis (merging points 1 and 2 as well as 4 and 5),as per the McIntyre scale (De Dear and Brager 2001;Hwang and Lin 2007; Memon et al 2008), since veryfew interviewees selected the extreme classes (muchhigher; much lower),
& The answers to this question show the subjectiveevaluation of the atmospheric conditions by the indi-viduals (Parsons 1993) that relates to their state ofcomfort (defined as the level of mental satisfaction withthe atmospheric conditions).
Data analysis
The main objective of the data analysis was to clarify therelationship between the personal characteristics of theinterviewees, their thermal or wind preferences, and themeasured values of the atmospheric parameters.
The analysis was centred on the preference votes (question22), because the answers to this question have provided themost useful information concerning the environmentalchanges necessary to create more comfortable outdoor spaces.
Through this analysis, we tried to understand theconditions that can lead the interviewees to prefer maintain-ing or changing the atmospheric conditions perceived at thatmoment. In this sense, preference votes can be considered asa dependent categorical variable (Vitinghoff et al. 2005)and atmospheric and personal conditions as independentvariables, which can also lead to a change in the answers.
Two main approaches were adopted:
1. Analysis of the relationship between specific independentvariables (personal and atmospheric) and the preferencevotes. These relationships were tested using ANOVA(relationship between quantitative variables, such as airtemperature or age) and Chi-square test (relationshipbetween other categorical variables, such as gender ortype of activity);
2. Modelling of the relationship between preference votesand the atmospheric and personal factors. For thispurpose, logistic multiple regression was used (Kleinbaum
et al. 1998; Vitinghoff et al. 2005). This method isuseful to create models that predict the probability ofoccurrence of a binary variable (coded as 1 and 0) asa function of the independent variables (predictors),that can be either continuous or categorical (binaryor not); categorization of atmospheric variables wasmade by dividing them in 10 categories of equalfrequency (Vitinghoff et al. 2005). Other advantagesof the logistic regression are that variables do not needto have a normal distribution or a constant varianceand the relationships do not need to be linear. As therelationships can be nonlinear, different transforma-tions (logarithmic, quadratic and others) were carriedout and used in the initial model.
Each of the three categories of preference votes wasconsidered, in the current analysis, as a different dependentvariable according to the wish expressed by the intervieweesto either maintain the present conditions (temperature, wind)or change them, hence increasing the value of the weatherparameter or decreasing it. The preferred option was codedas 1, while the other two types of answers were coded as 0.For example, in relation to wind speed, all the votes ofpeople who preferred to decrease wind speed were coded as1 and all the other votes (not to decrease it) were coded as 0.Therefore, for each of the atmospheric variables (temperatureand wind), three models were necessary: preference todecrease, to maintain or to increase. In each model, thebinary dependent variable was the coded vote and theindependent variables were the atmospheric parametersmeasured at the moment, or the personal characteristics.
The independent variables to be included in the modelwere selected, in each case, through a forward stepwiseprocedure. The contribution of the independent variables tothe model was evaluated using the Ward test and the changein −2 Log Likelihood (−2 LL) when the variable isremoved; the more significant contribution to the modelcorresponded to higher values of the Ward test and changein −2LL; variables with a significant contribution to themodel have a p value under 0.05. The quantitativerelationship between the probability of occurrence of thedependent variable and the different independent variablescan be expressed as:
p ¼ 1
1þ e�z
where p is the probability that the answer is given (varyingbetween 0 and 1) and z is the linear combination of theindependent variables:
z ¼ b0 þ b1x1 þ b2x2 þ :::þ bnxn
Where b0 is the intercept of the model, the xi are theindependent variables, and bi are the coefficients for each of
Int J Biometeorol (2011) 55:665–680 669

the n independent variables (Kleinbaum et al. 1998;Vitinghoff et al. 2005).
It is not possible to calculate an overall measure ofgoodness of fit for this model, comparable to the R2 in thelinear multiple regression. However, the Hosmer–Lemeshowstatistic can be used as an indicator of goodness of fit of theoverall model; it is assumed that the model fits the dataadequately when significance values associated with the chi-square are above 0.05. This condition was fulfilled in themodels applied in the current research.
Results
Characteristics of the interviewees
Women represented 53% of the sample and men 47%; thisgender distribution is very similar to the one observed inthe national population. The most frequent age group was25–34 years and the sample age structure was significantlyyounger than the national age structure (INE 2001). Nearlyall the people interviewed were in the study areas for leisurepurposes; 24% of the interviewed people were seated, 75%standing and, of these, a large majority were walkingslowly (90%) and only 5% were walking fast.
Estimated Clo values of the interviewees clothing variedbetween 0.24 and 1.75 (average 0.69), with the loweraverage values in summer (0.4) and the higher values inwinter.
There are no significant differences in Clo values inrelation to gender. However, qualitative differences exist,depending on season: women wearing skirts amounted toless than 1% in winter and autumn, but their numberincreased to around 10% in the summer. Conversely, agehas a quantitative influence in clothing; there is an
increment in the average Clo value in the age group above54 years in winter and autumn, while in spring and summer,this increment is only clear in the age group above 65 years(Fig. 2).
Assessment of air temperature conditions
General aspects of the relationship between thermalpreference votes and Ta by means of a polynomialregression
The relationship between thermal preference votes andmeasured values of Ta were significant (p<<0.001). Therelationship between the percentage of people who did notwish to change the thermal environment and the measuredair temperature was analysed first. The sample was dividedin 20 classes of equal frequency with increasing tempera-ture (Fig. 3); this parameter explains nearly 84% of thevariance of satisfaction, while a large variability wasfound in every temperature range. A total of 80% ofpeople declared “want no change” with temperaturesbetween 23 and 28°C, but, even within this temperaturerange, some individuals voted for warmer (15%) orcooler (5%) conditions. Using the polynomial function ofthe regression, we computed that the maximum percent-age of people that voted “no change” occurred at 24°C,but the percentage values of pleased people for 23 and25°C was very close to that of 24°C (only 0.1%difference).
The proportion of votes “want warmer” exceeded 50%when temperature was below 17°C, although there areindividuals that declared they were pleased even with thelowest measured temperature values. The proportion ofvotes “want cooler” was very low for temperatures between16 and 26°C (5% of interviewees) but this percentageincreases rapidly above 26°C, reaching over 50% whentemperatures were above 32°C.
The measured values of Ta and other atmosphericvariables, as well as the seasonal context, must beconsidered in the interpretation of these results.
Fig. 3 Percentage of votes “want no change” versus Ta
Fig. 2 Average Clo values by age group according to season
670 Int J Biometeorol (2011) 55:665–680

The seasonal context
Seasonal differences were analysed based on the calculationof the 5, 50 and 95 percentiles of air temperature measuredwhen people vote “want no change” in each day. As it can beexpected, people vote “want no change” under much highertemperatures in summer than in the other seasons (Fig. 4).
However, there is a difference between the summer periodsof 2006 and 2007: the latter was much cooler and windier(Table 1) and the comfort range in summer 2007 was 3–4°Cbelow that of summer 2006, and was even lower than thecomfort range in spring. In winter, the temperature rangeconsidered acceptable was between 13.1 and 17.8°C. Ascould be expected, it was confirmed that a seasonaladaptation exists, which can be partially physiologicalalthough clothing may also play a major role (Fig. 4),allowing for lower temperatures to be tolerated in winter aswell as higher ones in the summer. In addition, psychologicalfactors can also play an important role such as the satisfactionwith the first sunny and beautiful spring days (Höppe 2002).
Relation with age
The percentage of people that vote for changes in Tadecreases with age, as much under warm conditions as incool conditions, but more clearly in a lower temperaturecontext: 25% of people aged under 35 vote “want warmer”versus only 15% of those over 54 (Fig. 5). This can bepartially explained by an average increase in clothinginsulation in older people (Fig. 2). But a general decreasein sensitivity with age was also observed in hotterconditions: the lowest percentage of interviewees that votedchanges was observed in the age group 55–64 years (6%),
while 12% of people under 35 preferred a lower temper-ature; however, in the oldest group, the percentage of thesevotes increases in comparison with the younger group,which can be related to the increase in clothing insulation inthis age group in summer (Fig. 5).
Modelling thermal preferences with multiple logisticregression
The relationship between each of the 3 types of thermalpreference votes (want cooler, want no change, wantwarmer) and a set of environmental and personal variableswas tested. For each of the votes, the best fit model wasselected and validated by the Hosmer–Lemeshow Test(Kleinbaum et al. 1998; Vitinghoff et al. 2005) (Table 3);a value above 0.05 indicates a good fit, to a significancelevel of 0.95. It can be seen in Table 3 that the three modelsallow a significant fit of the data. The contribution of eachsingle variable to the model can be evaluated using theWald statistics (higher values indicate a larger contribution
Fig. 4 Indoor versus outdoor Tavalues when people voted “nochange”
Fig. 5 Relationship between votes to change with Ta and age
Int J Biometeorol (2011) 55:665–680 671
to the model; p must be <0.05 to be considered significant)and by the change in −2 Log Likelihood (Tables 4 and 5).
Thermal preference vote: “want warmer”
Only three variables have a significant relationship withthese votes: air temperature (Ta), wind (V# see above) andage. The best agreement was obtained with Ta naturallogarithm and with squared age (Table 4).
Ta is the most important variable that explains thechange of the probability of the votes “want warmer”,followed by age and V# . The probability rises both withdecreasing Ta and age and with increasing V#.
The change in the probability to vote “want warmer” withchanging Ta (Fig. 6) was simulated, for a 41-year old person(average age of the sample) using different values of V#: inthe absence of wind and with Ta under 14°C, the probabilityto vote “want warmer” exceeded 0.5 (more than a half ofpeople preferring warmer); this threshold increases to 15.5,16 and 17°C with V# above 2, 4 and 6 ms−1, respectively.The boundary above 0.75 of votes “want warmer” is onlyreached with Ta under 14°C and V# above 6 ms−1.
Influence of age combined with Ta can be seen in Fig. 7,for a constant V# of 3.4 ms−1 (average value of the sample).The threshold of the probability to vote “want warmer” >0.5is reached with Ta under 17.5°C for an individual aged 20,but only under 13.5°C to a 65-year-old; for a 20-year-oldperson, the boundary for the probability above 0.75 to vote“want warmer” is only reached at 13°C, and it is neverattained with the elderly people in the simulation.
Thermal preference vote: “want cooler”
The frequency of the votes “want cooler” was significantlyrelated with Ta, humidity and the natural logarithm of V#
(Table 5). Ta and humidity were combined using theHumidex formula (ACSE 2004; Conti et al. 2005):
Hx ¼ Taþ 5
9e� 10ð Þ
in which e is the vapour pressure in hPa. The value of e wascalculated from measured Ta and RH. The best relationshipwas obtained with the square value of Hx. The estimatedprobability of voting cooler conditions rose with increasingTa and humidity and decreased when V# increased.
The probability to vote “want cooler” was estimated forincreasing Ta, with different RH values and without wind(Fig. 8). This estimation was made up to a Ta of 40°C, wellabove the highest Ta measured (33°C). This extrapolationwas only carried out for situations without wind because,with very high Ta, the thermal influence of wind changes,increasing sensible heat transfer from the atmosphere to thehuman body, therefore rising discomfort (Steadman 1979);Givoni (1998) indicates that with Ta above 37°C anincrease in wind speed actually amplifies the sensation ofheat. This effect was not included in the model and cannotbe simulated from the measured data.
With RH=25%, the probability of votes “want cooler” >0.5was reached with Ta=35°C, but if RH increases to 50and 75%, the same probability of people voting “wantcooler” was reached at lower temperatures: respectively29 and 25°C.
An increase of wind induces a decrease on theprobability to vote “want cooler” (within the boundariesof measured Ta values, as explained above). The probabilityto vote “want cooler” was calculated for an increasing valueof V# (Fig. 9), with constant Ta and HR (respectively 30°Cand 50%). A slight increase in V# (from 0 to 0.8 m s−1) wasenough to decrease the probability of “want cooler” votebelow 0.7; conversely, when V# surpasses 4 m s−1, thedecrease of the probability of the “want cooler” vote is veryslight, never falling below 0.5.
Preference to maintain temperature: “want no change”vote
Modelling the relationship between votes “want nochange”, concerning air temperature, and the independentvariables is more complex than the previous ones, because
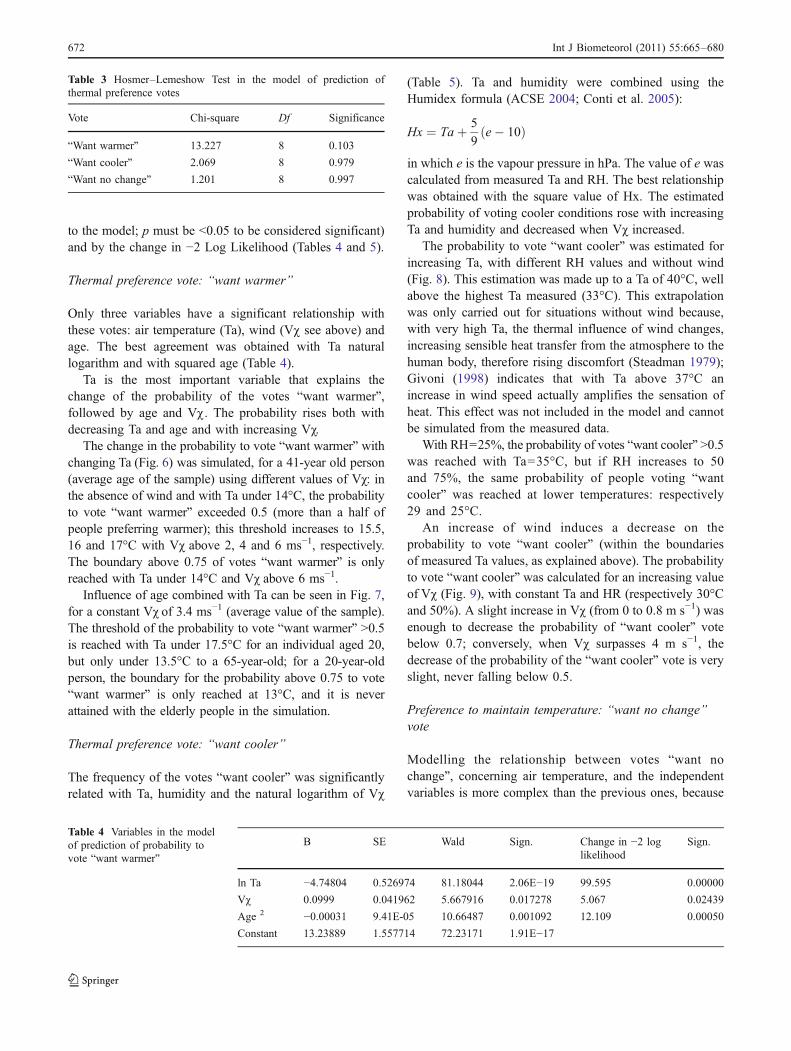
Table 3 Hosmer–Lemeshow Test in the model of prediction ofthermal preference votes
Vote Chi-square Df Significance
“Want warmer” 13.227 8 0.103
“Want cooler” 2.069 8 0.979
“Want no change” 1.201 8 0.997
B SE Wald Sign. Change in −2 loglikelihood
Sign.
ln Ta −4.74804 0.526974 81.18044 2.06E−19 99.595 0.00000
V# 0.0999 0.041962 5.667916 0.017278 5.067 0.02439
Age 2 −0.00031 9.41E-05 10.66487 0.001092 12.109 0.00050
Constant 13.23889 1.557714 72.23171 1.91E−17
Table 4 Variables in the modelof prediction of probability tovote “want warmer”
672 Int J Biometeorol (2011) 55:665–680

of the bipolar nature of discomfort (well expressed inFig. 3) and the different interactions between Ta and theother variables on both sides of the Ta curve. The bestrelationship involving the probability of votes “want nochange” was obtained with the PET values (classified in 10classes of equal frequency), calculated with Ta = Tmrt
(PETshade). It can be considered that PET calculated in thisway relates to conditions of shade, depending only onTa, wind speed and humidity. Although Tmrt measured inthe shade may be higher than Ta in an urban context, dueto multiple reflections and emissions, it should be notedthat the present study was developed in open spaces,where these features are less important. However, as anaverage difference between Tmrt measured in the shadeand Ta of 2°C was observed (Tmrt higher), the PETshadeindices were calculated for two values of Tmrt (measuredin the shade and Tmrt = Ta), but the difference was notsignificant (p>0.05). Therefore, the simplest procedure(Tmrt = Ta) was used. The only other variable thatcontributes to the probability of votes “want no change”is a binary variable separating people over 54 years of agefrom the younger ones.
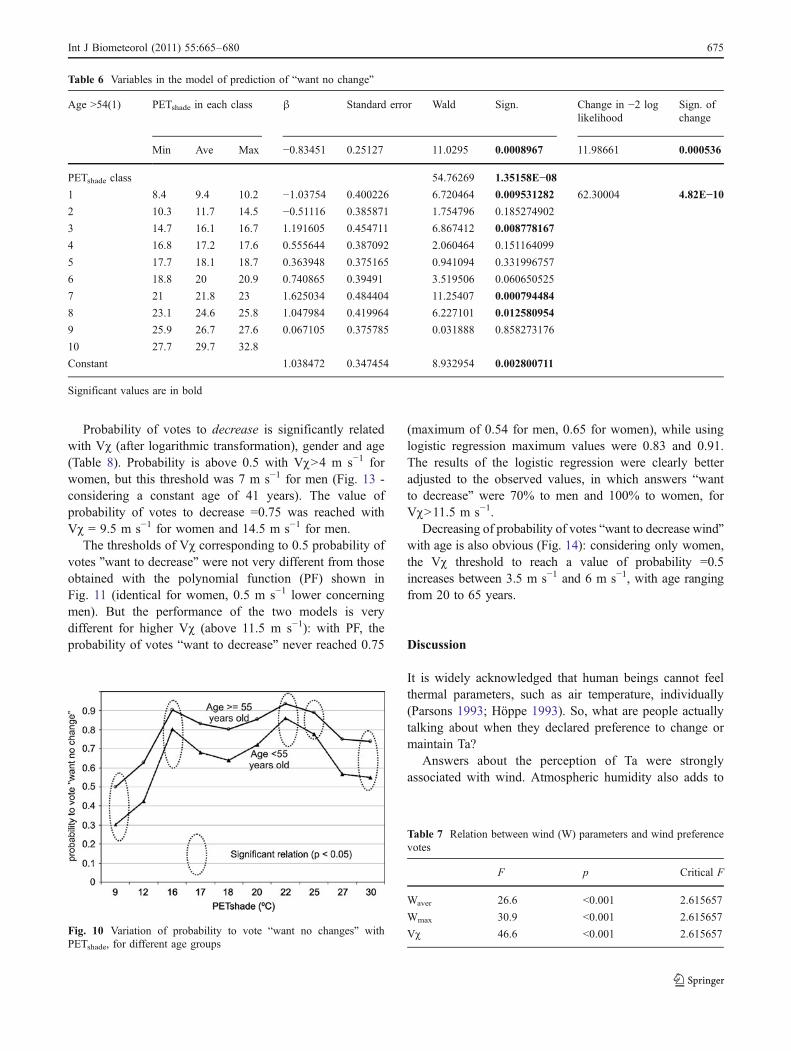
In the regression with a classified variable, the last class(in this case, the class PETshade>27.7°C) is taken as areference class. The β coefficients (Table 6) represent thevariation of the probability of votes “want no change” ineach class, relatively to the probability in the referenceclass, with the change in PETshade.
The probability of votes “want no change” is higherconcerning people over 54 years of age, in accordance withthe results presented above (Fig. 5); the average differencebetween the two age groups is 0.12 (Fig. 10).
Not all the PETshade classes differentiate significantly fromthe reference group (only those where the Wald test has asignificant value (p<0.05) in bold in Table 6). Figure 10identifies the classes in which the estimation of theprobability of votes “want no changes” is significant (p<0.05). The lowest values of the probability of individualswanting no change corresponded to the lower classes(Petshade under 14.7°C; Table 6) and a clear decrease wasalso observed in the higher Petshade class (above 27.7°C).
Maximum probability of votes “want no change” wasobserved in class 7 (PETshade between 21 and 23°C). Therewas also a decrease (not significant) in the probability ofvotes “want no changes” within classes 4 to 6 (between 16.8and 20.9°C), although the p value is always above 0.6(therefore not significant). This variation is difficult to explain.These classes related mainly to inquires made during theautumn when there was a decrease in global solar radiationvalues (referring here to K measured under sunshine) inrelation to class 3 (average global radiation value in class 3 was383 W m2, decreasing to an average value of 283 W m2 inclasses 4 and 5); in these classes, 82% of the votes “wantchange” corresponded to these conditions (autumn and lowglobal radiation). However, the effect of solar radiation wasnot recognized as significant by the regression analysis.
B S.E. Wald Sign. Change in -2 LogLikelihood
Sign. ofthe change
Hx2 0.00331 0.00038 75.789 3.16E−18 99.7938 1.69E−23Ln V# −0.78607 0.339813 5.351076 0.020709 5.747166 0.016515
Constant −4.44587 0.577821 59.2008 1.42E−14
Table 5 Variables in the modelof prediction to vote “wantcooler”
Fig. 6 Variation of probability to vote “want warmer” with Ta fordifferent V# values (41-year-old individuals)
Fig. 7 Variation of probability to vote “want warmer” with Ta, fordifferent ages at V# = 3.4 m s−1
Int J Biometeorol (2011) 55:665–680 673

Assessment of wind
General results
Wind has thermal and mechanical effects and both haveimplications on human comfort. Wind Preference Votes canbe considered as a result of the combination of both effects.
Responses to question 22 showed that votes todecrease wind speed represented 30.6% of the sample;67.1% voted for the maintenance of the values of windspeed and only 2.3% declared the preference for anincrease in wind speed.
Votes to decrease wind speed were clearly more frequentin Belem than at the Expo site (respectively 37% and 25%;the difference was significant; p<0.001). This difference isconsistent with the difference between v at the twolocations: average v was higher in Belem than at Expo(2.9 m s−1 and 2.2 m s−1, respectively), the difference alsobeing significant (p<0.001).
Wind was classified as the most unpleasant variable by21% of people, mainly in spring (22% of interviewees) andduring the summer 2007 (65%); in opposition, in summer2006, that was hotter than 2007 (Table 1), only 7% ofpeople classified v as the most unpleasant variable.
Oliveira and Andrade (2007) showed that the perceptionof wind depended not only on wind speed but also onturbulence and found a good correlation with V#. Walton etal. (2007) also highlight the importance of wind gustinesson the outdoor thermal comfort.
Likewise, the current work, for which a much widerrange of measured wind speeds (0 to 10.5 m s−1) underdifferent thermal conditions was available, found that theV# coefficient was the strongest discrimination factorbetween different wind preference votes, when com-pared with average (Waver) or maximum values (Wmax)(Table 7).
Influence of gender and age
Oliveira and Andrade (2007) found a strong correlationbetween satisfaction with V# and gender. In the current work,the percentage of people that preferred not to change windspeed was calculated separately by gender, in 20 classes ofequal frequency and increasing V#. The difference betweengender was confirmed (Fig. 11): 70% of men answered“want no change” against 61% of women. The differencewas only evident for V# above 1.4 m s−1 and was particularlylarge above 3.1 m s−1: 61% for men and 42% for women.
As with Ta, the general sensitivity to wind (more evidentfor higher values) decreased with age (Fig. 12). Thepercentage of votes to decrease was highest in the agegroup 25-34 years and minimum above 55; percentage ofvotes to increase was always very low and differences werenot significant. As in relation to Ta, part of the decreasingdissatisfaction of people with wind when age increased canbe due to heavier clothing usually worn by older people(Fig. 2), but it must be noticed that there was no significantassociation between clothing and satisfaction with wind.
Modelling wind preferences with multiple logisticregression
Logistic regression was used to model the relationshipbetween wind preferences and the environmental andpersonal conditions. The low frequency of people thatpreferred to increase wind speed did not allow the creationof a significant model. Therefore, the probability to havevotes to maintain is simply the complement of theprobability of decrease type answers:
Probability of votes “maintain wind”= 1 – (Probabilityof votes “decrease wind”)
The overall model is significant, with a Chi-square valueof 7.505 (significance of 0.4823 to 8 degrees of freedom).
Fig. 9 Variation of probability to vote “want cooler”with V# (Ta=30°C;HR=50%)
Fig. 8 Variation of probability to vote “want cooler” with Ta, withoutwind
674 Int J Biometeorol (2011) 55:665–680
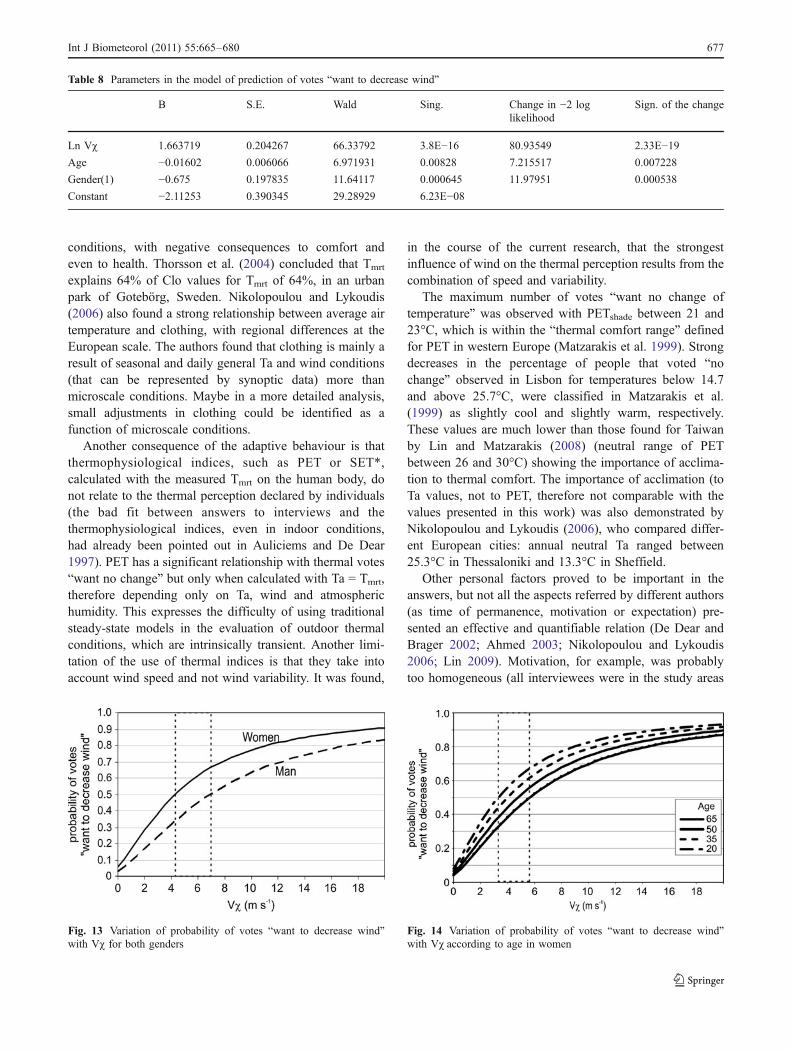
Probability of votes to decrease is significantly relatedwith V# (after logarithmic transformation), gender and age(Table 8). Probability is above 0.5 with V#>4 m s−1 forwomen, but this threshold was 7 m s−1 for men (Fig. 13 -considering a constant age of 41 years). The value ofprobability of votes to decrease =0.75 was reached withV# = 9.5 m s−1 for women and 14.5 m s−1 for men.
The thresholds of V# corresponding to 0.5 probability ofvotes ”want to decrease” were not very different from thoseobtained with the polynomial function (PF) shown inFig. 11 (identical for women, 0.5 m s−1 lower concerningmen). But the performance of the two models is verydifferent for higher V# (above 11.5 m s−1): with PF, theprobability of votes “want to decrease” never reached 0.75
(maximum of 0.54 for men, 0.65 for women), while usinglogistic regression maximum values were 0.83 and 0.91.The results of the logistic regression were clearly betteradjusted to the observed values, in which answers “wantto decrease” were 70% to men and 100% to women, forV#>11.5 m s−1.
Decreasing of probability of votes “want to decrease wind”with age is also obvious (Fig. 14): considering only women,the V# threshold to reach a value of probability =0.5increases between 3.5 m s−1 and 6 m s−1, with age rangingfrom 20 to 65 years.
Discussion
It is widely acknowledged that human beings cannot feelthermal parameters, such as air temperature, individually(Parsons 1993; Höppe 1993). So, what are people actuallytalking about when they declared preference to change ormaintain Ta?
Answers about the perception of Ta were stronglyassociated with wind. Atmospheric humidity also adds to
Fig. 10 Variation of probability to vote “want no changes” withPETshade, for different age groups
Table 6 Variables in the model of prediction of “want no change”
Age >54(1) PETshade in each class β Standard error Wald Sign. Change in −2 loglikelihood
Sign. ofchange
Min Ave Max −0.83451 0.25127 11.0295 0.0008967 11.98661 0.000536
PETshade class 54.76269 1.35158E−081 8.4 9.4 10.2 −1.03754 0.400226 6.720464 0.009531282 62.30004 4.82E−102 10.3 11.7 14.5 −0.51116 0.385871 1.754796 0.185274902
3 14.7 16.1 16.7 1.191605 0.454711 6.867412 0.008778167
4 16.8 17.2 17.6 0.555644 0.387092 2.060464 0.151164099
5 17.7 18.1 18.7 0.363948 0.375165 0.941094 0.331996757
6 18.8 20 20.9 0.740865 0.39491 3.519506 0.060650525
7 21 21.8 23 1.625034 0.484404 11.25407 0.000794484
8 23.1 24.6 25.8 1.047984 0.419964 6.227101 0.012580954
9 25.9 26.7 27.6 0.067105 0.375785 0.031888 0.858273176
10 27.7 29.7 32.8
Constant 1.038472 0.347454 8.932954 0.002800711
Significant values are in bold
Table 7 Relation between wind (W) parameters and wind preferencevotes
F p Critical F
Waver 26.6 <0.001 2.615657
Wmax 30.9 <0.001 2.615657
V# 46.6 <0.001 2.615657
Int J Biometeorol (2011) 55:665–680 675

the discomfort associated to high temperatures. It istherefore obvious that answers about Ta refer to a generalthermal feeling, integrating the influence of differentatmospheric parameters that the individuals could notisolate. The fact that people attach this feeling to Ta resultsfrom a widely spread pre-conceived idea that only Taaffects thermal comfort. The humidex formula (Hx) used asa predictor of the preference to decrease temperature(Fig. 8) lacks a theoretical basis, as opposed to the moresophisticated models (Fanger 1972; Gagge et al. 1986;Höppe 1993, 1997; Parsons 1993; Givoni 1998; Havenith2001; Van Marken et al. 2007), but it has a long empiricalconfirmation, namely in Canada (ACSE 2004) and wasrelated to mortality associated with heat waves in Italy(Bisanti et al. 2004; Conti et al. 2005). The present workshowed that the statistical relation between Humidex andthe thermal preference votes was clearly stronger than thatof the indices based on energy balance of the human body,such as PET or SET*.
The importance of humidity in the model, even withmoderate RH and Ta, is somewhat surprising, because usuallyRH is only considered important when there is a combinationof high values of both variables. The importance of humidityin thermal comfort can be strongly dependent on acclimatisa-tion: for example, in Dacca, Ahmed (2003) only found adecrease in thermal comfort with RH well above 80% whenTa is around 30°C and wind speed 1.5 m s−1; according to themodel developed for Lisbon, where hot and moist weather isvery rare (Andrade and Alcoforado 2008), nearly 100% ofpeople will declare discomfort with 30°C and 85% RH.
It is also known that radiant fluxes are very important tothe human energy balance and therefore to thermal comfort(Hodder and Parsons 2006). Givoni et al. (2003) and Hwangand Lin (2007) used volunteers under outdoor controlledconditions to evaluate the influence of solar radiation onthermal comfort. This is a very different method from the
one used in the present work, in which interviews weremade, under non-controlled conditions, with people passingby in the study area and maintaining their usual behaviour.Thorsson et al. (2004), Stathopoulos et al. (2004) and Linand Matzarakis (2008) also worked with “real users” of thestudied areas, but they considered radiant temperaturemeasured under direct solar radiation. In our case, valuesof K and Tmrt under these conditions showed a strongredundancy with Ta and they do not enhance the explan-atory capacity of the models. Assuming that people spendas much time in the shade as in the sun, K and L weremeasured in the shade and Tmrt was also calculated forshaded conditions; the inputs to the initial logistic regres-sion model were K and Tmrt under the same conditions(shade or sun) in which the individual was at the time of theinterview. Even in this case, the contribution of K and Tmrt
to the models is not significant, because people easilychange their radiant environment, by moving betweendirect K and shade, in response to the general thermalconditions. Times of permanency under these conditionsare usually short and not sufficient to create a steady-statesituation. In consequence, people exposed to direct Kdeclared more frequently feeling cool than warm discom-fort (they moved to the sun because they were cool) andpeople under the shade indicated the opposite sensation.
Clothing is one of the parameters included in the energybalance of the human body (Parsons 1993; Havenith et al.2002), and it can be a cause of thermal discomfort. Butchanging clothing is one of the individual ways of thermaladaptation (Lin 2009). In a leisure situation, in which thechoice is free, people easily change clothing as a functionof the thermal conditions and nobody wears clothing thatcauses thermal discomfort; in the models developed in thisstudy, clothing never gave a significant contribution to theexplanation for thermal discomfort. The same cannot besaid about situations in which people wear working clothesor uniforms, which can be highly inadequate to real thermal
Fig. 12 Relationsip between votes “no change”, wind and age
Fig. 11 Variation of the percentage of people that voted “no change”with increasing V#, according to gender
676 Int J Biometeorol (2011) 55:665–680
conditions, with negative consequences to comfort andeven to health. Thorsson et al. (2004) concluded that Tmrt
explains 64% of Clo values for Tmrt of 64%, in an urbanpark of Gotebörg, Sweden. Nikolopoulou and Lykoudis(2006) also found a strong relationship between average airtemperature and clothing, with regional differences at theEuropean scale. The authors found that clothing is mainly aresult of seasonal and daily general Ta and wind conditions(that can be represented by synoptic data) more thanmicroscale conditions. Maybe in a more detailed analysis,small adjustments in clothing could be identified as afunction of microscale conditions.
Another consequence of the adaptive behaviour is thatthermophysiological indices, such as PET or SET*,calculated with the measured Tmrt on the human body, donot relate to the thermal perception declared by individuals(the bad fit between answers to interviews and thethermophysiological indices, even in indoor conditions,had already been pointed out in Auliciems and De Dear1997). PET has a significant relationship with thermal votes“want no change” but only when calculated with Ta = Tmrt,therefore depending only on Ta, wind and atmospherichumidity. This expresses the difficulty of using traditionalsteady-state models in the evaluation of outdoor thermalconditions, which are intrinsically transient. Another limi-tation of the use of thermal indices is that they take intoaccount wind speed and not wind variability. It was found,
in the course of the current research, that the strongestinfluence of wind on the thermal perception results from thecombination of speed and variability.
The maximum number of votes “want no change oftemperature” was observed with PETshade between 21 and23°C, which is within the “thermal comfort range” definedfor PET in western Europe (Matzarakis et al. 1999). Strongdecreases in the percentage of people that voted “nochange” observed in Lisbon for temperatures below 14.7and above 25.7°C, were classified in Matzarakis et al.(1999) as slightly cool and slightly warm, respectively.These values are much lower than those found for Taiwanby Lin and Matzarakis (2008) (neutral range of PETbetween 26 and 30°C) showing the importance of acclima-tion to thermal comfort. The importance of acclimation (toTa values, not to PET, therefore not comparable with thevalues presented in this work) was also demonstrated byNikolopoulou and Lykoudis (2006), who compared differ-ent European cities: annual neutral Ta ranged between25.3°C in Thessaloniki and 13.3°C in Sheffield.
Other personal factors proved to be important in theanswers, but not all the aspects referred by different authors(as time of permanence, motivation or expectation) pre-sented an effective and quantifiable relation (De Dear andBrager 2002; Ahmed 2003; Nikolopoulou and Lykoudis2006; Lin 2009). Motivation, for example, was probablytoo homogeneous (all interviewees were in the study areas
Fig. 13 Variation of probability of votes “want to decrease wind”with V# for both genders
Table 8 Parameters in the model of prediction of votes “want to decrease wind”
B S.E. Wald Sing. Change in −2 loglikelihood
Sign. of the change
Ln V# 1.663719 0.204267 66.33792 3.8E−16 80.93549 2.33E−19Age −0.01602 0.006066 6.971931 0.00828 7.215517 0.007228
Gender(1) −0.675 0.197835 11.64117 0.000645 11.97951 0.000538
Constant −2.11253 0.390345 29.28929 6.23E−08
Fig. 14 Variation of probability of votes “want to decrease wind”with V# according to age in women
Int J Biometeorol (2011) 55:665–680 677

for leisure purposes) and do not allow for a differentiationbetween answers; interviewees were asked about length ofstay in the area, but it is difficult to reconstruct all theaspects of the stay, as for example the time spent in the sunor in the shade that can be important in understanding theanswers. A more detailed analysis about this topic isneeded, eventually using different methods.
The only personal factors with a significant relationshipwith declared preferences included in the logistic regressionmodels were gender (with wind preference) and age (withwind and thermal preferences). This study confirmed theimportance of gender in the perception of wind, which hadalready been observed by Oliveira and Andrade (2007).Several causes can be suggested to explain this differencebetween genders: physiological (lower average metabolicrate and body mass of women; ISO 1990; Parsons 1993) orcultural (men being more used to outdoor exposure or theirlarger reluctance to express discomfort), but it is a subjectthat cannot be fully explored in this work.
A very clear reduction of discomfort was observed withincreasing age (either in relation to temperature or to wind).This decrease can be partly ascribed to higher clothinginsulation in older people (Fig. 2), although elderlyindividuals also reported a lower discomfort under warmconditions. Therefore, in addition to differences in clothing,the general decrease of dissatisfaction with age can berelated to a lower sensitivity to temperature variations ofolder people, as mentioned by some authors (Parsons 1993;Frank et al. 2000; DeGroot et al. 2006).
Comparison with indoor comfort temperatures
Testing the application of indoor models to outdoorconditions is an important and interesting topic. AsSpagnolo and De Dear (2003) stated, it was frequentlyassumed that indoor thermal comfort standards can begeneralised to outdoor conditions. However, this general-isation should be made carefully, because of the largedifferences not only between indoor and outdoor environ-ments (outdoor is much more variable and difficult tocontrol than indoor) but also between people’s behaviourand psychological factors in the two distinct environments.
This study considered that the preferred range of outdoorTa was bounded, for each day, by the 5th and 95thpercentiles represented in Fig. 4; median can be consideredthe centre of this “comfort range”.
The equation of De Dear and Brager (2002) was used todefine an optimum comfort temperature for Lisbon:
Tconf ¼ 0:31 Taout þ 17:8
In which Tconf is the optimum comfort temperature innaturally ventilated buildings and Taout is the outdoor mean
temperature. This equation derives from a revision of theASHRAE Standard 55, in an adaptive perspective (De Dearand Brager 2002), and is applicable to naturally ventilatedbuildings. In our case, Taout was the average daily Ta in themeteorological station Lisboa/Geofisico, for each day offieldwork. The result is shown in Fig. 4.
In spring and summer, Taconf was always lower than themedian outdoor preferred Ta and below the 5th percentileon some days, as opposed to autumn and winter whenTaconf is higher than the 95th percentile of the preferredoutdoor Ta.
Besides the interference of other atmospheric variablesand subjective parameters, the difference between indoorand outdoor preferred Ta can be partly explained by theseasonal change in clothing insulation (average Cloexplains 83% of the variance of the difference betweenindoor Taconf and the median of preferred outdoor Ta). Inwinter and autumn, heavy clothing allows people to toleratemuch lower Ta values than the indoor standard, and inspring and summer lighter clothing leads to the oppositesituation.
Conclusion
Interviews of “casual” users of outdoor facilities can givevery different results from those obtained under controlledexperimental conditions. The more complex and change-able conditions found in outdoor environments increase thedifficulty of data analysis; however, this methodology ledto more realistic results, mainly concerning the relationshipwith the variables that can be easily modified, such as solarexposure and clothing. Despite the complexity of theinteractions between the declared comfort, the atmosphericconditions and the personal characteristics of the individuals,it was possible to identify patterns in these relations, usingsuitable methods; multiple logistic regression proved to be auseful tool to model the said relationships.
In accordance with the characteristics of the studiedareas (leisure places), a high level of satisfaction withthermal and wind conditions was found: 88% of interview-ees voted “no change” relative to these two parameters. Therange of acceptability of outdoor conditions found in thistype of places and activities is very wide and attainablethrough the adoption of adaptive strategies, like changes inclothing and moving between shade and full sunshine.However, it is also important to mention that 65% of peopleindicated different kinds of bioclimatic discomfort. Thisshows that an adequate planning of the open areas cansignificantly improve their microclimatic conditions and thegeneral comfort of users.
It was also evident that the acceptability of warmconditions (high temperature, low wind speed) is much
678 Int J Biometeorol (2011) 55:665–680
higher than the acceptability of cool conditions (lowtemperature—although moderate; strong wind speed).Between 23 and 28°C, 80% of people declared they werepleased, with a maximum of votes “want no changetemperature” at 24ºC. Considering PET values (with Tmrt =Ta), the comfort zone is very similar to that generallydelimitated to western Europe (18–23°C), although with ahigher base (21 instead 18°C).
Very few people declared a preference for higher windspeed, even in hot weather, and, even then, there werepeople who declared a preference for lower wind speed and(less frequently) higher temperature. Answers about Tawere in agreement with the perception that overall thermalconditions are strongly influenced by wind, and byhumidity in hot weather; humidity is important in theperception of warm conditions even with relatively lowvalues of RH. Perception of wind was always better relatedto the combination of wind speed and variability rather thanto wind speed alone. Age was the only personal factorsignificantly related with thermal preference (gender isstrongly related to wind preferences), with a generaldecrease of discomfort with increasing age (mainly in theolder classes—over 54 years).
This study shows that it is possible to define patterns ofperception and preference of outdoor microclimatic con-ditions, even with a strong influence of personal (mainlygender and age) characteristics. We believe that the currentwork gives a basis for understanding the perception ofoutdoor microclimatic conditions in leisure areas, in a citywith a moderate thermal climate like Lisbon. The contin-uation of this research will be directed towards moreconcrete topics, related for example to the impact of certainlandscape features in the bioclimatic comfort. A subsequentstep is the application of this information to help designmore comfortable outdoor leisure areas. To achieve thisaim, a strong interdisciplinary dialogue is needed betweenthe different experts involved in that task.
Acknowledgements This study was developed in the framework ofthe project “URBKLIM: Climate and urban sustainability. Perceptionof comfort and climatic risks” (POCI/GEO/61148/2004), co-financedby FCT and FEDER (Operational Programme for Science andInnovation 2010).
References
ACSE (American Society of Civil Engineers) (2004) Outdoor humancomfort and its assessment. ACSE, Reston
Ahmed KS (2003) Comfort in urban spaces: Defining the boundariesof outdoor thermal comfort for the tropical urban environments.Energy Build 35:103–110
Andrade H, Alcoforado MJ (2008) Microclimatic variation of thermalcomfort in a city-district of Lisbon (Telheiras). Night-time period.Theor Appl Climatol 92:225–237
Auliciems A, De Dear R (1997) Thermal adaptation and variable indoorclimate control. In: AuliciemsA (ed) Advances in bioclimatology - 5.Human bioclimatology. Springer, Queensland, Australia, pp 61–86
Bisanti L, Cadum E, Costa G, Michelozzi P, Perucci C, Russo A(2004) Heat waves and mortality in Italy. Epidemiology 15:97
Chen F, Kusaka H, Tewari M, Bao J-W, Hirakuchi H (2004) Utilizingthe coupledWRF/LSM/Urban Modeling System withdetailedurban classification to simulate theurban heat island phenomenaover theGreater Houston Area. 5th Conference onUrban Envi-ronment, Vancouver, BC,Canada, 23–27 August 2004
Conti S, Meli P, Minelli G, Solimini R, Toccaceli V, Vichi M, BeltranoC, Perini L (2005) Epidemiologic study of mortality during thesummer 2003 heat wave in Italy. Environ Res 98:390–399
de Dear R, Brager GS (2001) The adaptive model of thermal comfortand energy conservation in the built environment. Int JBiometeorol 45:100–108
de Dear R, Brager GS (2002) Thermal comfort in naturally ventilatedbuildings: revisions to ASHRAE Standard 55. Energy Build34:549–561
INE (Instituto Nacional de Estatística) (2001) Recenseamentos Geraisda População e da Habitação. Dados comparativos 1991-2001.Lisboa, INE (CD-ROM
DeGroot DW, Havenith G, Kenney WL (2006) Responses to mildcold stress are predicted by different individual characteristics inyoung and older subjects. J Appl Physiol 101:1607–1615
Fanger PO (1972) Thermal comfort. McGraw-Hill, New YorkFrank SM, Raja SN, Bulcao C, Goldstein (2000) DS. Age-related
thermoregulatory differences during core cooling in humans. AmJ Physiol Regul Integr Comp Physiol 279:R349–R354
Gagge AP, Fobelets AP, Berglund LG (1986) A standard predictiveindex of human response to the thermal environment. ASHRAETrans 92:709–731
Givoni B (1998) Climate considerations in building and urban design.Wileyc, New York
Givoni B, Noguchi M, Saaroni H, Pochter O, Yaacov Y, Feller N, BeckerS (2003) Outdoor comfort research issues. Energy Build 35:77–86
Havenith G (2001) An individual model of human thermoregulation forthe simulation of heat stress response. J Appl Physiol 90:1943–1954
Havenith G, Holmer I, Parsons K (2002) Personal factors in thermalcomfort assessment: clothing properties and metabolic heatproduction. Energy Build 34:581–591
Hodder S, Parsons KC (2006) The effects of solar radiation on thermalcomfort. Int J Biometeorol 51:233–250
Höppe P (1993) Heat balance modelling. Experientia 49:741–747Höppe P (1997) Aspects of human biometeorology in past, present
and future. Int J Biometeorol 40:19–23Höppe P (1999) The physiological equivalent temperature - an
universal index for the biometeorological assessment of thethermal environment. Int J Biometeorol 43:71–75
Höppe P (2002) Different aspects of assessing indoor and outdoorthermal comfort. Energy Build 34:661–665
Hwang RL, Lin TP (2007) Thermal comfort requirements foroccupants of semi-outdoor and outdoor environments in hot-humid regions. Archit Sci Rev 50:60–67
ISO (International Standards Organisation) (1990) Ergonomics of thethermal environment: estimation of metabolic heat production.International Standards Organisation, Geneva
Jendritzky G, Nübler W (1981) A model analysing the urban thermalenvironment in physiologically significant terms. Arch MetGeoph Biokl B 29:313–326
Kleinbaum DG, KupperAssistant LL, Nizam A, Muller KA (1998)Applied regression analysis and multivariable methods. Duxbury,Pacific Grove
Knes I, Thorsson S (2006) Influences of culture and environmentalattitude on thermal, emotional and perceptual evaluations of apublic square. Int J Biometeorol 50:258–268
Int J Biometeorol (2011) 55:665–680 679

Lin TP (2009) Thermal perception, adaptation and attendance in apublic square in hot and humid regions. Build Environ 44:2017–2026
Lin TP, Matzarakis A (2008) Tourism climate and thermalcomfort in Sun Moon Lake, Taiwan. Int J Biometeorol 52:281–290
Matzarakis A, Mayer H, Iziomom E (1999) Applications of auniversal thermal index: physiological equivalent temperature.Int J Biometeorol 43:76–84
Memon RA, Chirarattananon S, Vangtook P (2008) Thermal comfortassessment and application of radiant cooling: a case study. BuildEnviron 43:1185–1196
Nikolopoulou M, Lykoudis S (2006) Thermal comfort in outdoorurban spaces: analysis across different European countries. BuildEnviron 41:1455–1470
Oliveira S, Andrade H (2007) An initial assessment of the bioclimaticcomfort in an outdoor public space in Lisbon. Int J Biometeorol52:69–84
Parsons KC (1993) Human thermal environments. Taylor & Francis,London
Spagnolo J, de Dear R (2003) A human thermal climatology ofsubtropical Sydney. Int J Climatol 23:1383–1395
Stathopoulos T, Wu H, Zacharias J (2004) Outdoor human comfort inan urban climate. Build Environ 39:297–305
Steadman RG (1979) The assessment of sultriness. Part I: atemperature humidity index based on human physiology andclothing science. J Appl Meteorol 18:861–873
Thorsson S, Lindqvist M, Lindqvist S (2004) Thermal bioclimaticconditions and patterns of behaviour in an urban park inGöteborg, Sweden. Int J Biometeorol 48:149–156
Van Marken Lichtenbelt WD, Frijns AJ, van Ooijen MJ, Fiala D,Kester AM, van Steenhoven AA (2007) Validation of anindividualised model of human thermoregulation for predictingresponses to cold air. Int J Biometeorol 51:169–179
Vitinghoff E, Glidden DV, Shiboski SC, McCulloch CE (2005)Regression methods in biostatistics, linear, logistic and repeatedmeasures models. Springer, New York
Walton D, Dravitzki V, Donn M (2007) The relative influence ofwind, sunlight and temperature on user comfort in urban outdoorspaces. Build Environ 42:3166–3175
680 Int J Biometeorol (2011) 55:665–680