perceiving, remembering, and communicating structure in events · relationship of familiarity and...
TRANSCRIPT
Journal of Experimental Psychology: Genera!2001, Vol. 130, No. 1.29-58
Copyright 2001 by the American Psychological Association, Inc.0096-3445/01/S5.00 DOI: 10.1037//0096-3445.130.1.29
Perceiving, Remembering, and Communicating Structure in Events
Jeffrey M. ZacksStanford University and Washington University
Barbara Tversky and Gowri IyerStanford University
How do people perceive routine events, such as making a bed, as these events unfold in time? Researchon knowledge structures suggests that people conceive of events as goal-directed partonomic hierarchies.Here, participants segmented videos of events into coarse and fine units on separate viewings; somedescribed the activity of each unit as well. Both segmentation and descriptions support the hierarchicalbias hypothesis in event perception: Observers spontaneously encoded the events in terms of partonomichierarchies. Hierarchical organization was strengthened by simultaneous description and, to a weakerextent, by familiarity. Describing from memory rather than perception yielded fewer units but did notalter the qualitative nature of the descriptions. Although the descriptions were telegraphic and withoutcommunicative intent, their hierarchical structure was evident to naive readers. The data suggest thatcognitive schemata mediate between perceptual and functional information about events and indicate thatthese knowledge structures may be organized around object/action units.
Events unfold in time, from the mundane making of a bed to themomentous making of a war. Observers can in principle usetemporal structure to respond appropriately in real-time activity, toplan future action, to remember the past, and to coordinate withothers. In particular, events can be decomposed into temporalparts, just as objects can be decomposed into spatial parts, andthese parts can be related to each other. Are people sensitive to thisstructure, and if so, what governs the relationships they perceive?
From Planning, Reading, and Remembering to Perceiving
The ability to identify the parts of events and their relationshipsconstitutes a distinct perceptual process, which we will call eventstructure perception. An event is defined to be a segment of time
Jeffrey M. Zacks, Department of Psychology, Stanford University, andDepartment of Psychology, Washington University; Barbara Tversky andGowri Iyer, Department of Psychology, Stanford University.
Gowri Iyer is now at the University of California at San Diego and SanDiego State University in the Joint Doctoral Program in Language andCommunicative Disorders.
Preliminary analyses of a portion of these data were presented at theannual meeting of the Psychonomic Society, November 1997, Philadel-phia. This work has benefited from the support of a National ScienceFellowship and a Stanford Humanities and Sciences Dissertation Fellow-ship to Jeffrey M. Zacks and from some support from Interval ResearchCorporation.
We thank Gordon Bower, Herb Clark, and John Gabrieli for stimulatingdiscussions of this work and Yaakov Kareev for helpful comments on aprevious draft. We are grateful to Perrine Bhakshay, Caroline Carter,Crosby Grant, Mike Jahr, and Dan Maidenberg for assistance with variousaspects of the research. Our thanks to The Starving Musician for providingsaxophones for use in these experiments.
Correspondence concerning this article should be addressed to JeffreyM. Zacks, Washington University, Department of Psychology, CampusBox 1125, St. Louis, Missouri 63130-4899. Electronic mail may be sent tojzacks @artsci. wustl.edu.
at a given location that is perceived by an observer to have abeginning and an end. In particular, we are concerned here with theperception of events in mundane, goal-directed activities. Theseare activities that our experimental participants might encounter onany given day, that generally have durations of several minutes,and that are performed by people with particular goals in mind.This article describes a series of experiments that systematicallyexplored the perceptual structure of events (Experiment 1), therelationship of familiarity and expertise to that structure (Experi-ments 2 and 3), and the role of event structure in memory forevents (Experiment 4) and in communication (Experiment 5).Together, the results strongly suggest that observers are biased toperceive ongoing activity in terms of discrete events organizedhierarchically by "part-of' relationships. This disposition is re-vealed in encoding of ongoing events, memory for past events, anddiscourse about events.
We conducted these experiments to explicate the relationshipsbetween the on-line perception of events and off-line conceptionsof events. The latter are important for planning, understandingnarratives, and remembering past events—and have been exam-ined extensively through studies of those processes (Zacks &Tversky, 2001). It is to those conceptions that we now turn.
Action Planning
People often describe plans in terms of discrete steps that arerelated by an overarching structure. To explain to someone how toget from downtown Palo Alto, California, to the Golden GateBridge, one might begin, "Get on Highway 101 going north. Takeit to San Francisco. The highway will end in city streets. Followthe 101 signs." If the directee were unfamiliar with Palo Alto, thefirst step would have to be expanded: "Find University Avenue,the main drive. Drive east on University Avenue away from theUniversity. As University Avenue leaves Palo Alto, take the en-trance for Highway 101 North." That is, to further explain a givenstep, one breaks it down into a series of substeps.
29
30 ZACKS, TVERSKY, AND IYER
Newell and Simon (1972) argued that planning proceeds in thesame fashion. In their General Problem Solver (GPS), a planbegins as a high-level goal (e.g., get to the Golden Gate Bridge).Subgoals are identified whose satisfaction leads to the satisfactionof the original goal (get to the highway, take it to San Francisco,etc.). This process proceeds recursively until each of the subgoalsin the plan can be achieved by a behavioral primitive. The resultingplan has the form of a hierarchy. This hierarchical structure ex-plains how people talk about plans when explaining them toothers: "Episodes, since they are tied to goals, can be hierarchical,with one episode embedded in another" (Newell & Simon, 1972,p. 480). "Unrolling" a GPS plan into actions occurring over timegives rise to a hierarchical structure. Actions designed to satisfygoals at a given level are subdivided in time into subactionsdesigned to satisfy subgoals. The goal-subgoal relationship isacted out as a part-subpart relationship, leading to a partonomichierarchy. Vallacher and Wegner (1987) argued that goals atmultiple levels can condition action even as it is being performedand that action tends to be controlled from the highest levelavailable in the goal hierarchy.
Narrative Comprehension
Narratives are discourses that describe a set of actions. If actionscan be thought about in terms of hierarchical part structures, itstands to reason that people apply these structures to understandingnarratives. Research on schemata for stories, story grammars, andscripts abounds with support for this intuition (see, e.g., Bower,1982; Mandler & Johnson, 1977; Schank & Abelson, 1977;Thorndyke, 1977; Trabasso & Stein, 1994). Rumelhart (1977)argued that people understand stories by recourse to internalizedschemata that have a partonomic structure organized around goalsand subgoals. In his model, comprehension of a story correspondsto matching the text to a schema. Summarization can be modeledas pruning of the hierarchical representation to higher levels.Finally, recall is modeled by a two-step process. First, stored tracesfrom reading the story are located and activate the appropriateschema. Then, the schema and traces together are used to recon-struct the details of what happened in the story. Valid storyschemata correspond to a grammar that defines legal partonomicrelationships (Rumelhart, 1975).
Schank, Abelson, and their colleagues formulated a set of com-putational models based on the related notion of a script (Schank& Abelson, 1977). Scripts are a particular implementation of eventschemata designed to account for understanding of goal-directedactivities that recur in everyday life. Like Rumelhart's (1977)schemata, scripts are organized as partonomic hierarchies in whicha script consists of a set of scenes and each scene contains a set ofactions. Computer simulations based on scripts have achieved arespectable level of success in understanding newspaper storiesand simple narratives (Schank & Abelson, 1977). Furthermore, anumber of phenomena in the comprehension and memory ofnarratives support the psychological reality of the script concept(Abelson, 1981). In particular, the literature on text comprehensionand memory strongly supports the view that hierarchical represen-tations of events play a part in understanding narratives. Duringreading, larger pauses occur across higher level event boundaries(Abbott, Black, & Smith, 1985). Short narratives are read more
quickly if the higher level structure is established early in the text(Foss & Bower, 1986).
Memory for Events
Hierarchical organization seems to influence not just on-lineprocessing of narrative texts but also memory for them. Partici-pants were slower to answer questions about a text when thequestions required integrating information across higher levelevent boundaries; this was true even when distance in the text wascontrolled (Foss & Bower, 1986; but see Franklin & Bower, 1988).People sometimes falsely recognized action statements that wereomitted from a story but were implied by its script (Bower, Black,& Turner, 1979), and these inferences tended to generalize upwardin the hierarchy (Abbott et al., 1985). Investigators have explicitlytied these results to the theories of planning described previouslyby noting that hierarchies are tied to plans (Bower, 1982) and areuseful for organizing planning (Abbott et al., 1985).
Similar results obtain for memory of videotapes, a stimulus typethat is closer to live events than narrative texts. Recall of video-tapes of human activity is characterized by a hierarchical pattern ofrecall. Memory for actions that are relevant to the event schema isbetter than memory for schema-irrelevant actions. As with mem-ory for texts, the order of subevents tends to revert with time to theschema-normal order (Lichtenstein & Brewer, 1980). As withtexts, activation of a schema can lead to false recognition ofactions implied by that schema. Further, the same action is betterrecognized and better recalled when it is part of an activated eventschema than when it is not, and recall for details within an eventsegment tends to be all or none (Brewer & Dupree, 1983).
Hierarchical patterns in recall are also seen in autobiographicalmemory, that is, in memory for the narrative of one's own life.Once a given episode has been activated in memory, its subpartsare more available (Anderson & Conway, 1993). Over time, pre-sumably with deterioration of specific information, memory forautobiographical events shows an increasing influence of schemataon recall (Barsalou, 1988).
Developmentally, event structure influences recall from an earlyage. Hierarchical patterns of recall and effects of goals on memoryfor activity have been found for stories in 4-to-6-year-olds (see,e.g., Hudson, 1988; Nelson & Gruendel, 1986; van den Broek,Lorch, & Thurlow, 1996) and for simple events in infants as youngas 15 months (see, e.g., Bauer & Mandler, 1989; Travis, 1997).
Implications for Perception
A general picture emerges in which activity is thought of interms of hierarchically organized relations among "chunks" atdifferent temporal grains. This structure influences how peoplethink about planning activity, how they comprehend and remembertexts that describe activity, how they remember those texts (orvideotapes of similar narratives), and how they remember theactivity in their own lives. Does it influence perception as well?One reasonable hypothesis is that the same representations thatsupport conceptions of events would also play a role in eventperception. This leads to a prediction: People will be spontane-ously disposed to actively encode ongoing activity in terms of ahierarchical part structure. We will call this the hierarchical biashypothesis.

PERCEIVING STRUCTURE IN EVENTS 31
There are also several compelling alternatives. One possibility isthat temporal relationships of this sort may not be directly given inperception. That is, observers may be able to extract arbitrarytemporal structure from activity on request, but they do not spon-taneously track it, let alone track relationships across temporalgrains. Another possibility is that observers do spontaneously tracktemporal structure but that the structures to which they are sensi-tive are not hierarchical. For example, coarse-level segmentationmight be performed on the basis of goals and fine-level segmen-tation on the basis of perceived changes in physical activity. Theconceptual bases for segmentation might not correspond, yieldingunaligned coarse and fine units.
We know of no empirical research aimed at examining thisquestion directly. However, one line of research on the relationshipbetween event segmentation and social personality attribution ap-plies—and to the extent it does, it argues against the hierarchicalbias hypothesis.
Newtson (1973) developed a technique in which participantssegment ongoing activity while watching it on videotape by press-ing a key to mark "natural and meaningful" unit boundaries. In oneexperiment, the grain at which participants segmented the activitywas manipulated between participants: One group was asked tomake the largest natural and meaningful units, the other group thesmallest. Newtson found that points in the activity that participantsin the large-unit condition tended to agree were unit boundariesalso tended to be boundaries for the small-unit group. Conversely,points in the activity that were not marked as unit boundaries bythe small-unit participants also tended not to be marked as unitboundaries by the large-unit participants. On the basis of thisresult, Newtson concluded that participants in the small-unit con-dition identified units that were subdivisions of those identified bythe large-unit participants.
One might take these data as arguing for the hierarchical biaseffect. However, Ebbesen (1980) has argued against this viewbased on a characterization of the segmentation task as a secondarytask that does not reflect natural encoding processes. In one ex-periment, C. E. Cohen and Ebbesen (1979) asked participants tosegment a videotape using Newtson's (1973) method, under in-structions to either learn the task being performed by the actor orform an impression of the actor's personality. They found thatparticipants produced larger units under impression-formation in-structions than under task-learning instructions. However, theyreported poor within-participant agreement on the location of unitboundaries in the two conditions. On the basis of this result,Ebbesen (1980) concluded that unit boundaries "do not appear tobe hierarchically structured, as Newtson (1973) suggested" (p.188). Drawing conclusions from these studies is difficult, giventheir differing results. In addition, in C. E. Cohen and Ebbesen'sstudy, no formal test of unit-location agreement or lack thereof wasreported. These apparently conflicting patterns have no seriousimplications for the primary aims of the studies that generatedthem (which were concerned with how participants vary theirencoding patterns and how these relate to patterns of attribution).However, this uncertainty regarding the possible hierarchicalstructure of event boundaries during encoding makes a case forcareful study of the perceptual encoding process.
Moreover, even if one accepts the hierarchical segmentationpattern, one can reject the conclusion that this reflects a cognitiverepresentation of hierarchically organized events. In fact, this is
exactly the position Newtson has taken in later work, in which heargues that patterns of event segmentation are best interpreted interms of dynamical systems, as reflecting the topology of a systemthat includes the observer as well as the activity being observed(Newtson, 1993; Newtson, Hairfield, Bloomingdale, & Cutino,1987). If hierarchically organized cognitive representations areplaying a role in perceptual encoding, one should be able toobserve more than simple patterns in encoding behavior. Segmen-tation patterns should make rich contact with downstream pro-cesses such as language and memory and should be influenced byprior experience.
The experiments presented here were designed to test the hier-archical bias hypothesis, to examine the structure of event seg-mentation across time scales, and to relate perceptual processing oftemporal information to other aspects of cognition. The first goalof these experiments was to provide a stringent within-participantstest of the hypothesis that observers segment events in terms of apartonomic hierarchy. The second goal was to examine the influ-ence of prior experience with a particular activity on event seg-mentation. The third goal was to characterize the relationships ofhigher level cognitive operations such as language and memory toevent structure perception. The final objective was to examine howpeople can use hierarchical organization to communicate withothers about activity.
Experiment 1: Perception of Event Structure
To the extent that the mind makes use of hierarchically orga-nized schemata for events and these schemata influence percep-tion, one should observe a bias to encode activity in terms ofpartonomic hierarchies. However, the small amount of relevantresearch is in conflict (C. E. Cohen & Ebbesen, 1979; Newtson,1973; Newtson & Engquist, 1976). The first major goal of Exper-iment 1 was to provide a direct test of the hypothesis that observersspontaneously segment activity such that it corresponds to a par-tonomic hierarchy, that is, to test the hierarchical bias hypothesis.
Second, we wanted to test the hypothesis that descriptions ofongoing activity reflect the same structure and to elucidate itsorigins. Hierarchical segmentation is not sufficient to establish onwhat basis observers organize activity. Language analysis may beparticularly valuable in this regard, particularly given work inlinguistics arguing that language structure reflects an underlyingcognitive structure for events (Goldberg, 1995; Levin, 1993;Moens & Steedman, 1988; Narayanan, 1997; Pustejovsky, 1991;Talmy, 1975).
Finally, we wanted to test a pair of hypotheses about the factorsthat mediate the influence of structured representations on eventperception. To the extent that language and event representationsare tightly integrated online, linguistic representations of eventsshould activate, as well as be activated by, perceptual representa-tions. Producing an adequate description of ongoing action mayrequire making connections across temporal grains—even if thedescription is restricted to one temporal grain, as it was here.Talking about activity may require activation of representation ofinformation about the goals and plans of the actor(s). This leads tothe prediction that talking about activity as it happens shouldincrease the tendency to organize it in terms of relevant eventschemata.
32 ZACKS, TVERSKY, AND IYER
Event schemata can be present only for activities with which
one has had some sort of prior experience. This leads to theprediction that observers should show a greater tendency to seg-ment activity hierarchically for familiar activities than for unfa-
miliar activities.To test these hypotheses and explore their consequences, we
adapted Newtson's (1973) segmentation procedure and applied itto the perception of four everyday activities. Participants viewedvideotapes of the activities and were asked to segment and de-scribe them while watching. A control group performed only thesegmentation. Each participant segmented each activity twice, incounterbalanced order, once providing coarse units and once pro-viding fine units. Segment boundaries from these two viewingswere compared to provide an estimate of the degree to which theviewer was spontaneously encoding the activity hierarchically.The prediction of the hierarchical bias hypothesis is that, for agiven participant, each coarse-unit boundary for a given activitywould tend to fall closer to some fine-unit boundary for thatactivity than is predicted by chance. Furthermore, it was predictedthat variations in the syntactic and semantic features of the lan-guage used to describe the activity would correlate with each
participant's pattern of segmentation.
Method
Participants
A total of 40 Stanford University undergraduates participated in thisexperiment to partially fulfill a course requirement. Three additional par-ticipants were run, but their data were unusable due to technical difficul-ties, so they were replaced.
Selecting Activities for Study
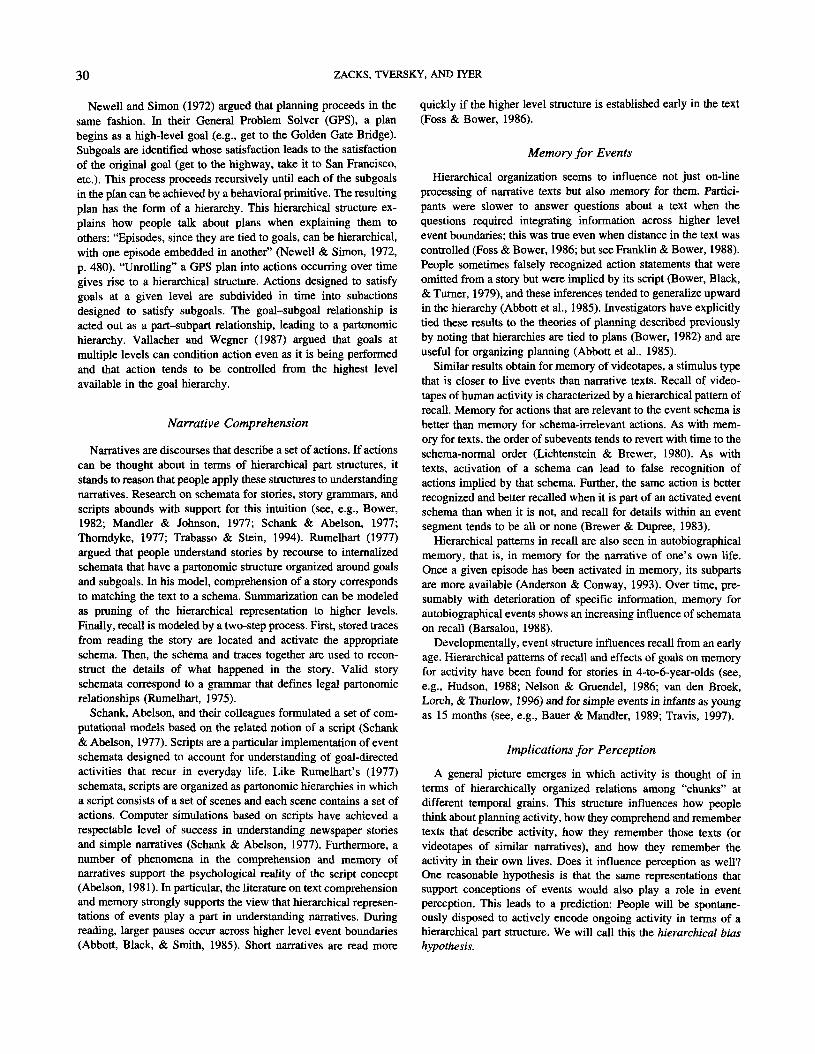
In preparation for selecting activities for the current research, we ob-tained ratings of frequency, familiarity, and knowledge of steps for 45everyday activities. These norms are described in Appendix A. From the 45activities, we selected 2 that were rated low on all three scales ("assemblinga saxophone" and "fertilizing houseplants") and 2 that were rated high onall three scales ("washing dishes" and "making a bed"). Because the threescales were highly correlated (see Appendix A), we refer to these activitiesas unfamiliar and familiar (respectively). As Figure 1 shows, both unfa-miliar activities were much lower on all three ratings than both familiar
Assembling a Saxophone
Fertilizing Houseplants
Doing the Dishes ~
Making the Bed
Figure 1. Mean ratings of familiarity, frequency of performance, andknowledge of steps for two unfamiliar and two familiar activities. Errorbars represent standard errors of the means.
|~| Familiarity
Frequency
Know Steps
activities. These four activities were used in all the experiments describedin this report.
Stimulus FilmsFor each of the four activities selected from the norms, we constructed
a script consisting of 12 discrete steps (see Appendix B). The scripts weresimply lists of 12 steps for the actors to perform, written in order toencourage similar performances by the two actors. (By constraining theperformances of the actors in this fashion, we hoped to be able to makequantitative comparisons across videotapes of the same activity. Thisproved infeasible because of substantial timing differences between ac-tors.) No relationships were established between the steps in the list otherthan their serial order, nor were any such relationships discussed with theactors during filming. These precautions were taken to avoid building thepresence of hierarchical structure into the stimuli. Two actors (one male,one female) performed each of the activities in accordance with the script.Each performance took place in a different location. Performances wererecorded with a Hi-8 videotape camera and copied to VHS tape. The videocamera was placed in a fixed head-height position, attempting to simulatethe viewpoint of an observer in the room. Each activity was recorded as asingle take, with no cuts, pans, or zooms, to minimize the effects ofcinematic conventions on participants' perceptions. The resulting tapesranged in length from 244 to 640 s. Also, a sample tape was made with athird actor (female) and another activity (ironing a shirt).
ProcedureParticipants were run individually. On entering the laboratory, each
participant in this study was seated in front of a television, near a computerkeyboard and a tape recorder. Participants were told that they would beshown a series of short videotapes and were instructed to tap the space baron the keyboard "when, in your judgment, one unit ends and anotherbegins." The 32 participants in the describe group were then told: "Eachtime, after you press the space bar, say for the tape recorder what hap-pened." For the 8 participants in the silent group, the instruction to describethe activity after each tap was omitted. The instructions made clear thatthey should tap exactly when they believed one unit ended and anotherbegan, not in the middle.
Half of the participants in each group were instructed to "mark off thebehavior of the person you'll be seeing into the smallest units that seemnatural and meaningful to you." The other half were instructed to "marie offthe behavior of the person you'll be seeing into the largest units that seemnatural and meaningful to you." This procedure was modeled after that ofNewtson (1973), with the addition of the verbal protocol. We refer to theseas fine and coarse coding conditions, respectively.
Participants first segmented the example tape and then each of the fouractivities. Each participant saw two activities performed by each actor. Theorder of activities, actors, and the pairing of actors to tapes was varied foreach participant to minimize order effects (but not fully counterbalanced,as that would have required 96 participants).
After viewing all four activities, participants engaged in an unrelatedexperiment for about 25 min. Then, they watched the same four tapes in thesame order. This time however, they were given the opposite unit-sizeinstructions: If they had been instructed to use the smallest units (finecoding condition) before, now they were told to use the largest units(coarse coding), and vice versa.
Verbal responses were recorded with a cassette recorder. Tapping timeswere recorded by a Macintosh Ilci computer connected to the keyboard,running a simple script written in PsyScope 1.1 (J. D. Cohen, MacWhin-ney, Flatt, & Provost, 1993).
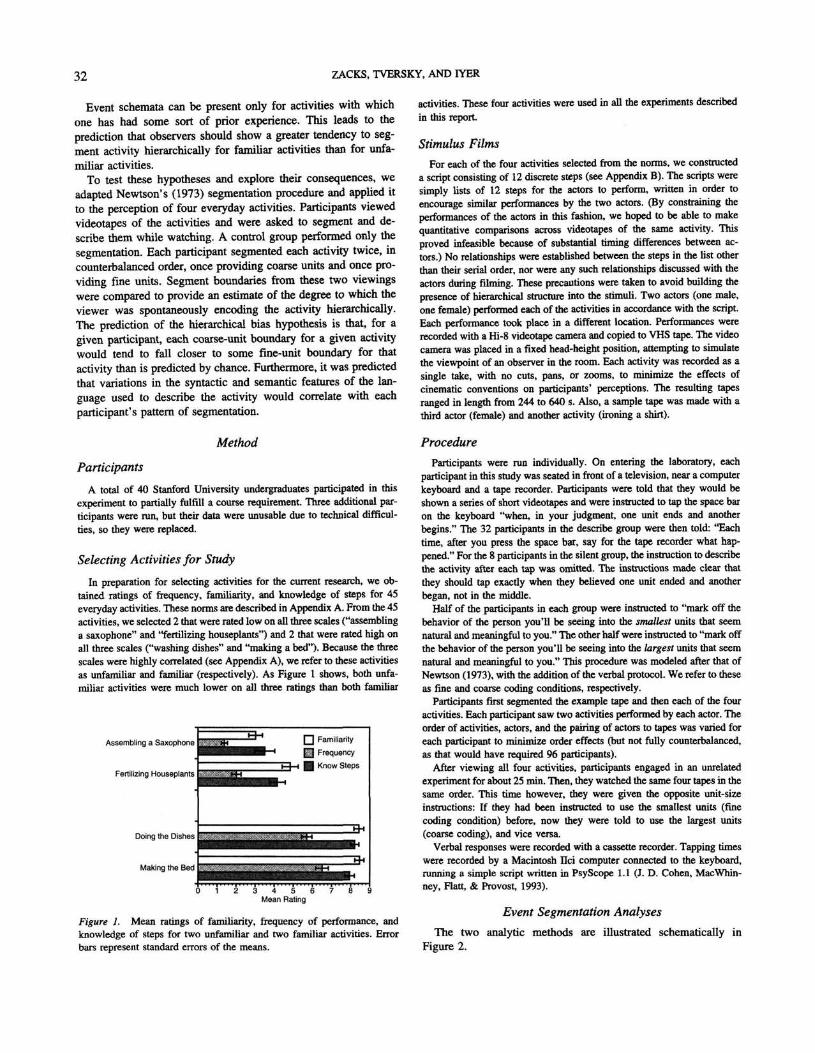
Event Segmentation Analyses
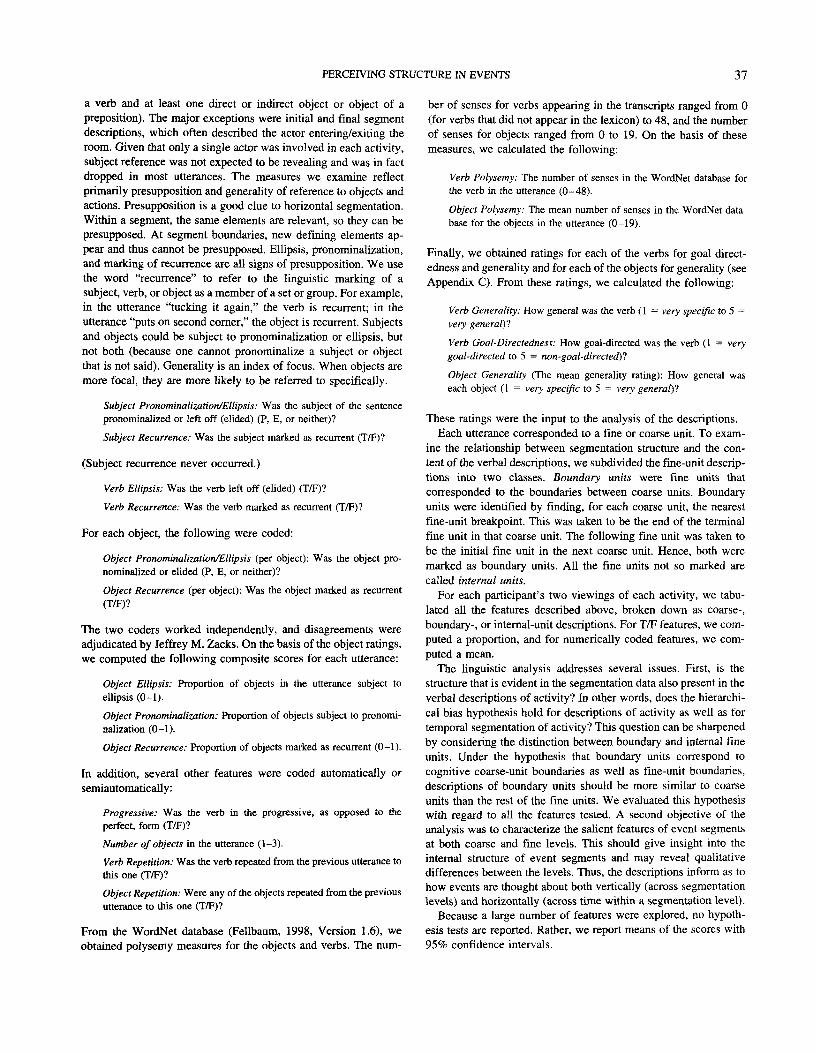
The two analytic methods are illustrated schematically inFigure 2.
PERCEIVING STRUCTURE IN EVENTS33
Time-
Coarse
Fine-f
DiscreteAnalysis
CoarseBreakpoint &
Overlap
ContinuousAnalysis
CoarseBreakpoint
Coarse-SmallestDistance
Fine- -H
FineBreakpoints
Figure 2. Schematic representations of the discrete and continuous analyses.
Discrete Analysis
Fkst, the tapping record for each participant viewing eachvideotape was divided into 1-s bins. All the results reported hereare based on 1-s bins, but to the extent we have been able to verify,they hold across bin sizes from 1 to 5 s. Following Newtson's(1973) terminology, we coded each bin as a "breakpoint" if itcontained one or more taps. Bins that were breakpoints for a givenparticipant in both the fine and coarse coding conditions werecalled overlaps. For each participant and each tape he or she saw,the following were calculated:
Bins = number of bins in the tape.
Fine = number of breakpoints in the fine coding condition.
Coarse = number of breakpoints in the coarse coding condition.
P(fine) = probability that a given bin is a fine breakpoint =Fine/Bins.
P(coarse) = probability that a given bin is a coarse breakpoint =Coarse/Bins.
Overlaps = number of bins that were breakpoints in both the fine andcoarse coding conditions.
Now, suppose there is no relationship between coarse and fineunit boundaries (i.e., they are independent). Under this assumption,the probability that a given point in a videotape contains a tap inthe fine coding condition is independent of the probability that itcontains a tap in the coarse coding condition. Under this assump-tion, the expected number of overlaps can be approximated as
Overlapso = P(coarse) x P( fine) X Bins. (1)
Equation 1 can be calculated by expanding to
Fine Coarse Fine X CoarseOverlaps,, = —.— X — x Bins = ^ . (2)
Bins Bins Bins
Equations 1 and 2 give a null model that can be compared with theactual number of overlaps. This is essentially a within-participantversion of the analysis reported by Newtson (1973).
Continuous Analysis
The discrete analysis is attractive because its statistical proper-ties are easily understood, but it has the disadvantage of dependingon an arbitrary choice of a discrete bin size. As an alternative, wealso developed a continuous analogue of the discrete analysis. Aswith the discrete analysis, this approach compares the two view-ings of each tape for each participant. Here, "breakpoint" refers tothe actual time of a tap. Breakpoints in the fine coding conditionare called fine breakpoints and breakpoints in the coarse codingcondition coarse breakpoints. For each coarse breakpoint, thedistance to the nearest fine breakpoint was calculated. Thesedistances were averaged across the coarse breakpoints for a givenparticipant watching a given tape to calculate
AvgDist = mean distance from coarse breakpoints to the nearest finebreakpoint for a given pair of viewings of an activity by a givenparticipant.
Now, as in the discrete case above, a null model is required towhich to compare these scores. In this case, one can calculate anexpectation for AvgDist given independence of the coarse and finebreakpoints. Begin by taking the location of the fine breakpoints asgiven. Generate coarse breakpoints distributed randomly and uni-formly across the tape, and measure their distance to the nearestfine breakpoint. In the limit case, this amounts to integrating the
34 ZACKS, TVERSKY, AND IYER
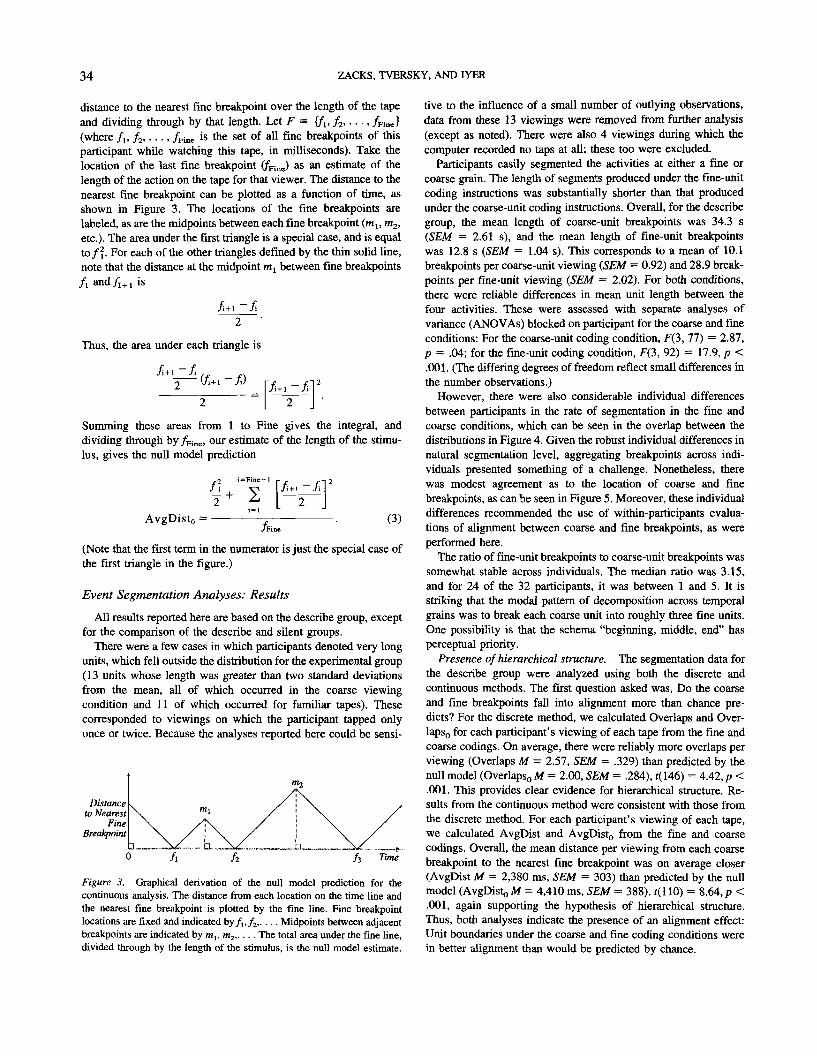
distance to the nearest fine breakpoint over the length of the tapeand dividing through by that length. Let F = {/i, /2,.. - , /Fine)(where /„ /2 /Fine is the set of all fine breakpoints of thisparticipant while watching this tape, in milliseconds). Take thelocation of the last fine breakpoint (fFine) as an estimate of thelength of the action on the tape for that viewer. The distance to thenearest fine breakpoint can be plotted as a function of time, asshown in Figure 3. The locations of the fine breakpoints arelabeled, as are the midpoints between each fine breakpoint (mlt m2,etc.). The area under the first triangle is a special case, and is equalto/i. For eacn of me otner triangles defined by the thin solid line,note that the distance at the midpoint m, between fine breakpoints
is
Thus, the area under each triangle is
^y^tt+i-/!) ™-fl
Summing these areas from 1 to Fine gives the integral, anddividing through by /Fine, our estimate of the length of the stimu-lus, gives the null model prediction
AvgDisto =
,2 i-Fme-l .- , _ f-| 2
y+ 2 V5i-l L J
/Fi(3)
(Note that the first term in the numerator is just the special case ofthe first triangle in the figure.)
Event Segmentation Analyses: Results
All results reported here are based on the describe group, exceptfor the comparison of the describe and silent groups.
There were a few cases in which participants denoted very longunits, which fell outside the distribution for the experimental group(13 units whose length was greater than two standard deviationsfrom the mean, all of which occurred in the coarse viewingcondition and 11 of which occurred for familiar tapes). Thesecorresponded to viewings on which the participant tapped onlyonce or twice. Because the analyses reported here could be sensi-
Distanceto Nearest
FineBreakpoint
Figure 3. Graphical derivation of the null model prediction for thecontinuous analysis. The distance from each location on the time line andthe nearest fine breakpoint is plotted by the fine line. Fine breakpointlocations are fixed and indicated by/,,/2>. .. . Midpoints between adjacentbreakpoints are indicated by m,, m2,... . The total area under the fine line,divided through by the length of the stimulus, is the null model estimate.
live to the influence of a small number of outlying observations,data from these 13 viewings were removed from further analysis(except as noted). There were also 4 viewings during which thecomputer recorded no taps at all; these too were excluded.
Participants easily segmented the activities at either a fine orcoarse grain. The length of segments produced under the fine-unitcoding instructions was substantially shorter than that producedunder the coarse-unit coding instructions. Overall, for the describegroup, the mean length of coarse-unit breakpoints was 34.3 s(SEM = 2.61 s), and the mean length of fine-unit breakpointswas 12.8 s (SEM = 1.04 s). This corresponds to a mean of 10.1breakpoints per coarse-unit viewing (SEM = 0.92) and 28.9 break-points per fine-unit viewing (SEM = 2.02). For both conditions,there were reliable differences in mean unit length between thefour activities. These were assessed with separate analyses ofvariance (ANOVAs) blocked on participant for the coarse and fineconditions: For the coarse-unit coding condition, F(3, 77) = 2.87,p = .04; for the fine-unit coding condition, F(3, 92) = 17.9, p <.001. (The differing degrees of freedom reflect small differences inthe number observations.)
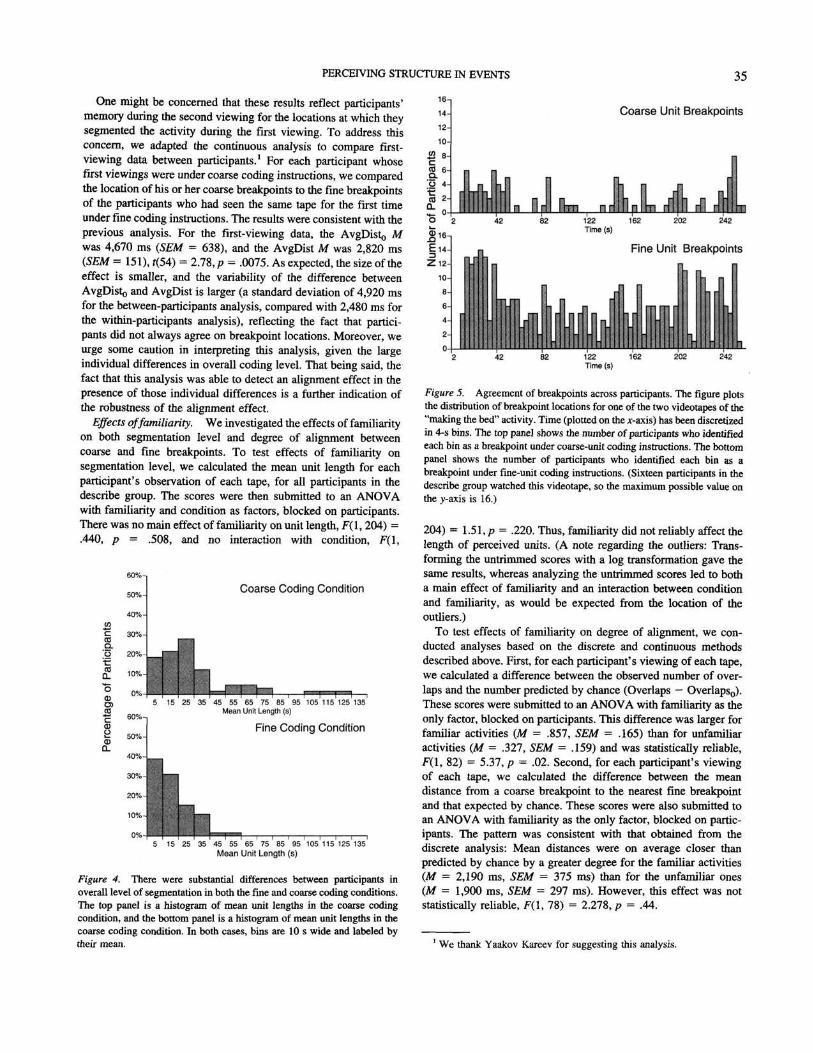
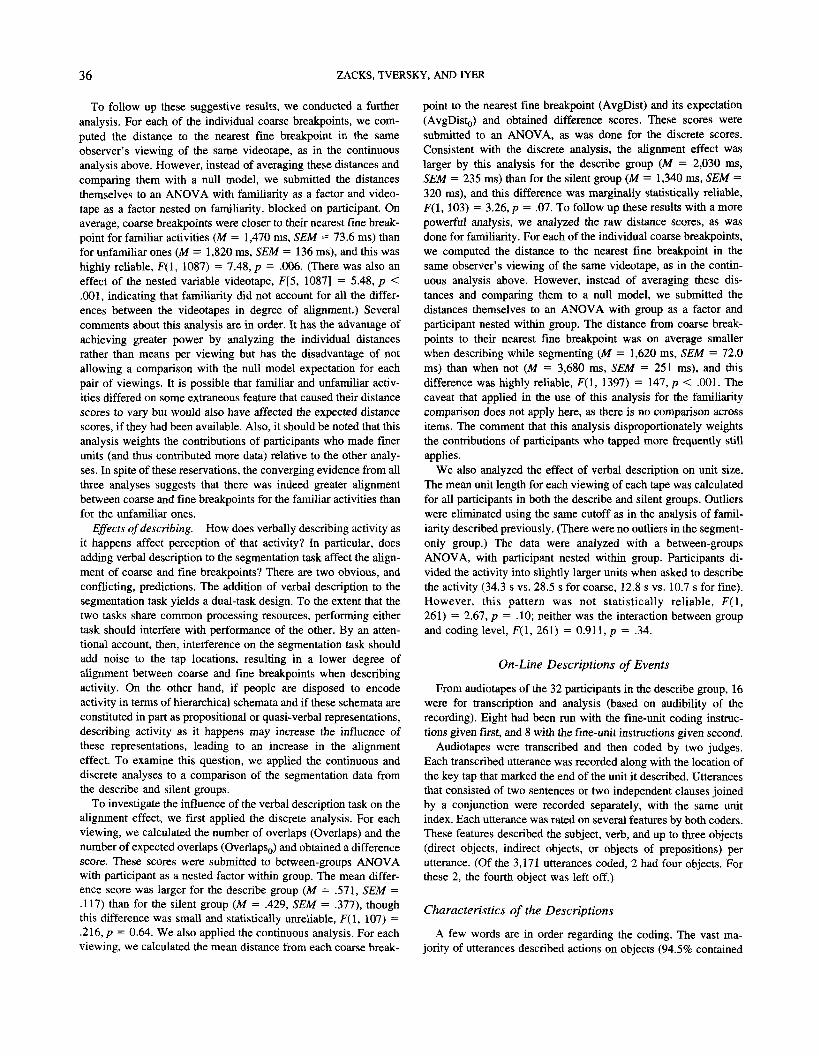
However, there were also considerable individual differencesbetween participants in the rate of segmentation in the fine andcoarse conditions, which can be seen in the overlap between thedistributions in Figure 4. Given the robust individual differences innatural segmentation level, aggregating breakpoints across indi-viduals presented something of a challenge. Nonetheless, therewas modest agreement as to the location of coarse and finebreakpoints, as can be seen in Figure 5. Moreover, these individualdifferences recommended the use of within-participants evalua-tions of alignment between coarse and fine breakpoints, as wereperformed here.
The ratio of fine-unit breakpoints to coarse-unit breakpoints wassomewhat stable across individuals. The median ratio was 3.15,and for 24 of the 32 participants, it was between 1 and 5. It isstriking that the modal pattern of decomposition across temporalgrains was to break each coarse unit into roughly three fine units.One possibility is that the schema "beginning, middle, end" hasperceptual priority.
Presence of hierarchical structure. The segmentation data forthe describe group were analyzed using both the discrete andcontinuous methods. The first question asked was, Do the coarseand fine breakpoints fall into alignment more than chance pre-dicts? For the discrete method, we calculated Overlaps and Over-Iaps0 for each participant's viewing of each tape from the fine andcoarse codings. On average, there were reliably more overlaps perviewing (Overlaps M = 2.57, SEM = .329) than predicted by thenull model (Overlaps0M = 2.00, SEM = .284), ((146) = 4.42, p <.001. This provides clear evidence for hierarchical structure. Re-sults from the continuous method were consistent with those fromthe discrete method. For each participant's viewing of each tape,we calculated AvgDist and AvgDisto from the fine and coarsecodings. Overall, the mean distance per viewing from each coarsebreakpoint to the nearest fine breakpoint was on average closer(AvgDist M = 2,380 ms, SEM = 303) than predicted by the nullmodel (AvgDisto M = 4,410 ms, SEM = 388), r(l 10) = 8.64,p <.001, again supporting the hypothesis of hierarchical structure.Thus, both analyses indicate the presence of an alignment effect:Unit boundaries under the coarse and fine coding conditions werein better alignment than would be predicted by chance.
PERCEIVING STRUCTURE IN EVENTS 35
One might be concerned that these results reflect participants'memory during the second viewing for the locations at which theysegmented the activity during the first viewing. To address thisconcern, we adapted the continuous analysis to compare first-viewing data between participants.1 For each participant whosefirst viewings were under coarse coding instructions, we comparedthe location of his or her coarse breakpoints to the fine breakpointsof the participants who had seen the same tape for the first timeunder fine coding instructions. The results were consistent with theprevious analysis. For the first-viewing data, the AvgDisto Mwas 4,670 ms (SEM = 638), and the AvgDist M was 2,820 ms(SEM = 151), »(54) = 2.78, p = .0075. As expected, the size of theeffect is smaller, and the variability of the difference betweenAvgDisto and AvgDist is larger (a standard deviation of 4,920 msfor the between-participants analysis, compared with 2,480 ms forthe within-participants analysis), reflecting the fact that partici-pants did not always agree on breakpoint locations. Moreover, weurge some caution in interpreting this analysis, given the largeindividual differences in overall coding level. That being said, thefact that this analysis was able to detect an alignment effect in thepresence of those individual differences is a further indication ofthe robustness of the alignment effect.
Effects of familiarity. We investigated the effects of familiarityon both segmentation level and degree of alignment betweencoarse and fine breakpoints. To test effects of familiarity onsegmentation level, we calculated the mean unit length for eachparticipant's observation of each tape, for all participants in thedescribe group. The scores were then submitted to an ANOVAwith familiarity and condition as factors, blocked on participants.There was no main effect of familiarity on unit length, F(l, 204) =.440, p = .508, and no interaction with condition, F(l,
Coarse Coding Condition
Coarse Unit Breakpoints
5 15 25 35 45 55 65 75 85 95 105 115 125 135Mean Unit Length (s)
Fine Coding Condition
5 15 25 35 45 55 65 75 85 95 105 115 125 135Mean Unit Length (s)
Figure 4. There were substantial differences between participants inoverall level of segmentation in both the fine and coarse coding conditions.The top panel is a histogram of mean unit lengths in the coarse codingcondition, and the bottom panel is a histogram of mean unit lengths in thecoarse coding condition. In both cases, bins are 10 s wide and labeled bytheir mean.
Figure 5. Agreement of breakpoints across participants. The figure plotsthe distribution of breakpoint locations for one of the two videotapes of the"making the bed" activity. Time (plotted on the *-axis) has been discretizedin 4-s bins. The top panel shows the number of participants who identifiedeach bin as a breakpoint under coarse-unit coding instructions. The bottompanel shows the number of participants who identified each bin as abreakpoint under fine-unit coding instructions. (Sixteen participants in thedescribe group watched this videotape, so the maximum possible value onthe y-axis is 16.)
204) = 1.51, p = .220. Thus, familiarity did not reliably affect thelength of perceived units. (A note regarding the outliers: Trans-forming the untrimmed scores with a log transformation gave thesame results, whereas analyzing the untrimmed scores led to botha main effect of familiarity and an interaction between conditionand familiarity, as would be expected from the location of theoutliers.)
To test effects of familiarity on degree of alignment, we con-ducted analyses based on the discrete and continuous methodsdescribed above. First, for each participant's viewing of each tape,we calculated a difference between the observed number of over-laps and the number predicted by chance (Overlaps — Overlaps,,).These scores were submitted to an ANOVA with familiarity as theonly factor, blocked on participants. This difference was larger forfamiliar activities (M = .857, SEM = .165) than for unfamiliaractivities (M = .327, SEM = .159) and was statistically reliable,F(l, 82) = 5.37, p — .02. Second, for each participant's viewingof each tape, we calculated the difference between the meandistance from a coarse breakpoint to the nearest fine breakpointand that expected by chance. These scores were also submitted toan ANOVA with familiarity as the only factor, blocked on partic-ipants. The pattern was consistent with that obtained from thediscrete analysis: Mean distances were on average closer thanpredicted by chance by a greater degree for the familiar activities(M = 2,190 ms, SEM = 375 ms) than for the unfamiliar ones(M = 1,900 ms, SEM = 297 ms). However, this effect was notstatistically reliable, F(l, 78) = 2.278, p = .44.
1 We thank Yaakov Kareev for suggesting this analysis.
36 ZACKS, TVERSKY, AND IYER
To follow up these suggestive results, we conducted a furtheranalysis. For each of the individual coarse breakpoints, we com-puted the distance to the nearest fine breakpoint in the sameobserver's viewing of the same videotape, as in the continuousanalysis above. However, instead of averaging these distances andcomparing them with a null model, we submitted the distancesthemselves to an ANOVA with familiarity as a factor and video-tape as a factor nested on familiarity, blocked on participant. Onaverage, coarse breakpoints were closer to their nearest fine break-point for familiar activities (M = 1,470 ms, SEM = 73.6 ms) thanfor unfamiliar ones (M = 1,820 ms, SEM =136 ms), and this washighly reliable, F(l, 1087) = 7.48, p = .006. (There was also aneffect of the nested variable videotape, F[5, 1087] = 5.48, p <.001, indicating that familiarity did not account for all the differ-ences between the videotapes in degree of alignment.) Severalcomments about this analysis are in order. It has the advantage ofachieving greater power by analyzing the individual distancesrather than means per viewing but has the disadvantage of notallowing a comparison with the null model expectation for eachpair of viewings. It is possible that familiar and unfamiliar activ-ities differed on some extraneous feature that caused their distancescores to vary but would also have affected the expected distancescores, if they had been available. Also, it should be noted that thisanalysis weights the contributions of participants who made finerunits (and thus contributed more data) relative to the other analy-ses. In spite of these reservations, the converging evidence from allthree analyses suggests that there was indeed greater alignmentbetween coarse and fine breakpoints for the familiar activities thanfor the unfamiliar ones.
Effects of describing. How does verbally describing activity asit happens affect perception of that activity? In particular, doesadding verbal description to the segmentation task affect the align-ment of coarse and fine breakpoints? There are two obvious, andconflicting, predictions. The addition of verbal description to thesegmentation task yields a dual-task design. To the extent that thetwo tasks share common processing resources, performing eithertask should interfere with performance of the other. By an atten-tional account, then, interference on the segmentation task shouldadd noise to the tap locations, resulting in a lower degree ofalignment between coarse and fine breakpoints when describingactivity. On the other hand, if people are disposed to encodeactivity in terms of hierarchical schemata and if these schemata areconstituted in part as prepositional or quasi-verbal representations,describing activity as it happens may increase the influence ofthese representations, leading to an increase in the alignmenteffect. To examine this question, we applied the continuous anddiscrete analyses to a comparison of the segmentation data fromthe describe and silent groups.
To investigate the influence of the verbal description task on thealignment effect, we first applied the discrete analysis. For eachviewing, we calculated the number of overlaps (Overlaps) and thenumber of expected overlaps (Overlaps,,) and obtained a differencescore. These scores were submitted to between-groups ANOVAwith participant as a nested factor within group. The mean differ-ence score was larger for the describe group (M = .571, SEM =.117) than for the silent group (M = .429, SEM = .377), thoughthis difference was small and statistically unreliable, F(l, 107) =.216, p = 0.64. We also applied the continuous analysis. For eachviewing, we calculated the mean distance from each coarse break-
point to the nearest fine breakpoint (AvgDist) and its expectation(AvgDisto) and obtained difference scores. These scores weresubmitted to an ANOVA, as was done for the discrete scores.Consistent with the discrete analysis, the alignment effect waslarger by this analysis for the describe group (M = 2,030 ms,SEM = 235 ms) than for the silent group (M = 1,340 ms, SEM =320 ms), and this difference was marginally statistically reliable,F(l, 103) = 3.26, p = .07. To follow up these results with a morepowerful analysis, we analyzed the raw distance scores, as wasdone for familiarity. For each of the individual coarse breakpoints,we computed the distance to the nearest fine breakpoint in thesame observer's viewing of the same videotape, as in the contin-uous analysis above. However, instead of averaging these dis-tances and comparing them to a null model, we submitted thedistances themselves to an ANOVA with group as a factor andparticipant nested within group. The distance from coarse break-points to their nearest fine breakpoint was on average smallerwhen describing while segmenting (M = 1,620 ms, SEM = 72.0ms) than when not (M = 3,680 ms, SEM = 251 ms), and thisdifference was highly reliable, F(l, 1397) = 147, p < .001. Thecaveat that applied in the use of this analysis for the familiaritycomparison does not apply here, as there is no comparison acrossitems. The comment that this analysis disproportionately weightsthe contributions of participants who tapped more frequently stillapplies.
We also analyzed the effect of verbal description on unit size.The mean unit length for each viewing of each tape was calculatedfor all participants in both the describe and silent groups. Outlierswere eliminated using the same cutoff as in the analysis of famil-iarity described previously. (There were no outliers in the segment-only group.) The data were analyzed with a between-groupsANOVA, with participant nested within group. Participants di-vided the activity into slightly larger units when asked to describethe activity (34.3 s vs. 28.5 s for coarse, 12.8 s vs. 10.7 s for fine).However, this pattern was not statistically reliable, F(l,261) = 2.67, p = .10; neither was the interaction between groupand coding level, F(l, 261) = 0.911, p = .34.
On-Line Descriptions of Events
From audiotapes of the 32 participants in the describe group, 16were for transcription and analysis (based on audibility of therecording). Eight had been run with the fine-unit coding instruc-tions given first, and 8 with the fine-unit instructions given second.
Audiotapes were transcribed and then coded by two judges.Each transcribed utterance was recorded along with the location ofthe key tap that marked the end of the unit it described. Utterancesthat consisted of two sentences or two independent clauses joinedby a conjunction were recorded separately, with the same unitindex. Each utterance was rated on several features by both coders.These features described the subject, verb, and up to three objects(direct objects, indirect objects, or objects of prepositions) perutterance. (Of the 3,171 utterances coded, 2 had four objects. Forthese 2, the fourth object was left off.)
Characteristics of the Descriptions
A few words are in order regarding the coding. The vast ma-jority of utterances described actions on objects (94.5% contained
PERCEIVING STRUCTURE IN EVENTS 37
a verb and at least one direct or indirect object or object of apreposition). The major exceptions were initial and final segmentdescriptions, which often described the actor entering/exiting theroom. Given that only a single actor was involved in each activity,subject reference was not expected to be revealing and was in factdropped in most utterances. The measures we examine reflectprimarily presupposition and generality of reference to objects andactions. Presupposition is a good clue to horizontal segmentation.Within a segment, the same elements are relevant, so they can bepresupposed. At segment boundaries, new defining elements ap-pear and thus cannot be presupposed. Ellipsis, pronominalization,and marking of recurrence are all signs of presupposition. We usethe word "recurrence" to refer to the linguistic marking of asubject, verb, or object as a member of a set or group. For example,in the utterance "tucking it again," the verb is recurrent; in theutterance "puts on second corner," the object is recurrent. Subjectsand objects could be subject to pronominalization or ellipsis, butnot both (because one cannot pronominalize a subject or objectthat is not said). Generality is an index of focus. When objects aremore focal, they are more likely to be referred to specifically.
Subject Pronominalization/Ellipsis: Was the subject of the sentencepronominalized or left off (elided) (P, E, or neither)?
Subject Recurrence: Was the subject marked as recurrent (T/F)?
(Subject recurrence never occurred.)
Verb Ellipsis: Was the verb left off (elided) (T/F)?
Verb Recurrence: Was the verb marked as recurrent (T/F)?
For each object, the following were coded:
Object Pronominalization/Ellipsis (per object): Was the object pro-nominalized or elided (P, E, or neither)?
Object Recurrence (per object): Was the object marked as recurrent(T/F)?
The two coders worked independently, and disagreements wereadjudicated by Jeffrey M. Zacks. On the basis of the object ratings,we computed the following composite scores for each utterance:
Object Ellipsis: Proportion of objects in the utterance subject toellipsis (0-1).
Object Pronominalization: Proportion of objects subject to pronomi-nalization (0-1).
Object Recurrence: Proportion of objects marked as recurrent (0-1).
In addition, several other features were coded automatically orserniautomatically:
Progressive: Was the verb in the progressive, as opposed to theperfect, form (T/F)?
Number of objects in the utterance (1-3).
Verb Repetition: Was the verb repeated from the previous utterance tothis one (T/F)?
Object Repetition: Were any of the objects repeated from the previousutterance to this one (T/F)?
From the WordNet database (Fellbaum, 1998, Version 1.6), weobtained polysemy measures for the objects and verbs. The num-
ber of senses for verbs appearing in the transcripts ranged from 0(for verbs that did not appear in the lexicon) to 48, and the numberof senses for objects ranged from 0 to 19. On the basis of thesemeasures, we calculated the following:
Verb Polysemy: The number of senses in the WordNet database forthe verb in the utterance (0-48).
Object Polysemy: The mean number of senses in the WordNet data-base for the objects in the utterance (0-19).
Finally, we obtained ratings for each of the verbs for goal direct-edness and generality and for each of the objects for generality (seeAppendix C). From these ratings, we calculated the following:
Verb Generality: How general was the verb (1 = very specific to 5 =very general)!
Verb Goal-Directedness: How goal-directed was the verb (1 = verygoal-directed to 5 = non-goal-directed)'!
Object Generality (The mean generality rating): How general waseach object (1 = very specific to 5 = very general)!
These ratings were the input to the analysis of the descriptions.Each utterance corresponded to a fine or coarse unit. To exam-
ine the relationship between segmentation structure and the con-tent of the verbal descriptions, we subdivided the fine-unit descrip-tions into two classes. Boundary units were fine units thatcorresponded to the boundaries between coarse units. Boundaryunits were identified by finding, for each coarse unit, the nearestfine-unit breakpoint. This was taken to be the end of the terminalfine unit in that coarse unit. The following fine unit was taken tobe the initial fine unit in the next coarse unit. Hence, both weremarked as boundary units. All the fine units not so marked arecalled internal units.
For each participant's two viewings of each activity, we tabu-lated all the features described above, broken down as coarse-,boundary-, or internal-unit descriptions. For T/F features, we com-puted a proportion, and for numerically coded features, we com-puted a mean.
The linguistic analysis addresses several issues. First, is thestructure that is evident in the segmentation data also present in theverbal descriptions of activity? In other words, does the hierarchi-cal bias hypothesis hold for descriptions of activity as well as fortemporal segmentation of activity? This question can be sharpenedby considering the distinction between boundary and internal fineunits. Under the hypothesis that boundary units correspond tocognitive coarse-unit boundaries as well as fine-unit boundaries,descriptions of boundary units should be more similar to coarseunits than the rest of the fine units. We evaluated this hypothesiswith regard to all the features tested. A second objective of theanalysis was to characterize the salient features of event segmentsat both coarse and fine levels. This should give insight into theinternal structure of event segments and may reveal qualitativedifferences between the levels. Thus, the descriptions inform as tohow events are thought about both vertically (across segmentationlevels) and horizontally (across time within a segmentation level).
Because a large number of features were explored, no hypoth-esis tests are reported. Rather, we report means of the scores with95% confidence intervals.
38 ZACKS, TVERSKY, AND IYER
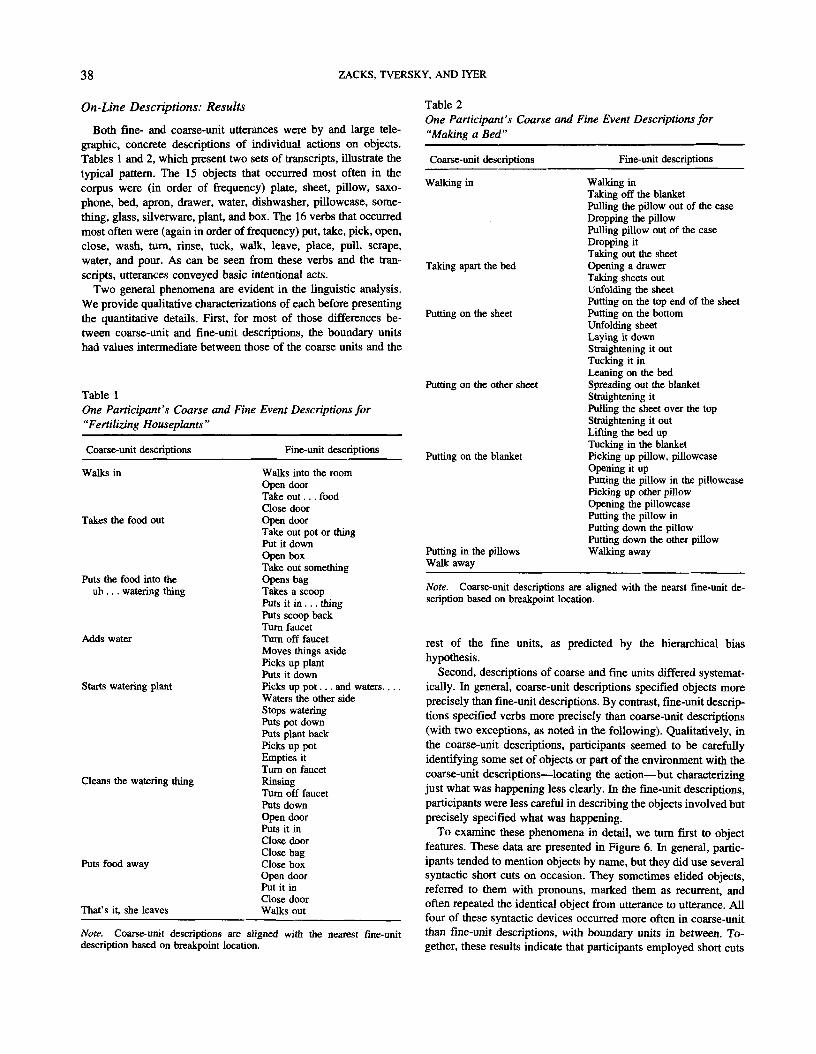
On-Line Descriptions: Results
Both fine- and coarse-unit utterances were by and large tele-graphic, concrete descriptions of individual actions on objects.Tables 1 and 2, which present two sets of transcripts, illustrate thetypical pattern. The 15 objects that occurred most often in thecorpus were (in order of frequency) plate, sheet, pillow, saxo-phone, bed, apron, drawer, water, dishwasher, pillowcase, some-thing, glass, silverware, plant, and box. The 16 verbs that occurredmost often were (again in order of frequency) put, take, pick, open,close, wash, turn, rinse, tuck, walk, leave, place, pull, scrape,water, and pour. As can be seen from these verbs and the tran-scripts, utterances conveyed basic intentional acts.
Two general phenomena are evident in the linguistic analysis.We provide qualitative characterizations of each before presentingthe quantitative details. First, for most of those differences be-tween coarse-unit and fine-unit descriptions, the boundary unitshad values intermediate between those of the coarse units and the
Table 1One Participant's Coarse and Fine Event Descriptions for"Fertilizing Houseplants"
Coarse-unit descriptions Fine-unit descriptions
Walks in
Takes the food out
Puts the food into theuh ... watering thing
Adds water
Starts watering plant
Cleans the watering thing
Puts food away
That's it, she leaves
Walks into the roomOpen doorTake out . . . foodClose doorOpen doorTake out pot or thingPut it downOpen boxTake out somethingOpens bagTakes a scoopPuts it in ... thingPuts scoop backTurn faucetTurn off faucetMoves things asidePicks up plantPuts it downPicks up pot... and waters.Waters the other sideStops wateringPuts pot downPuts plant backPicks up potEmpties itTurn on faucetRinsingTurn off faucetPuts downOpen doorPuts it inClose doorClose bagClose boxOpen doorPut it inClose doorWalks out
Table 2One Participant's Coarse and Fine Event Descriptions for"Making a Bed"
Coarse-unit descriptions Fine-unit descriptions
Walking in
Taking apart the bed
Putting on the sheet
Putting on the other sheet
Putting on the blanket
Putting in the pillowsWalk away
Walking inTaking off the blanketPulling the pillow out of the caseDropping the pillowPulling pillow out of the caseDropping itTaking out the sheetOpening a drawerTaking sheets outUnfolding the sheetPutting on the top end of the sheetPutting on the bottomUnfolding sheetLaying it downStraightening it outTucking it inLeaning on the bedSpreading out the blanketStraightening itPulling the sheet over the topStraightening it outLifting the bed upTucking in the blanketPicking up pillow, pillowcaseOpening it upPutting the pillow in the pillowcasePicking up other pillowOpening die pillowcasePutting the pillow inPutting down the pillowPutting down the other pillowWalking away
Note. Coarse-unit descriptions are aligned with the nearest fine-unitdescription based on breakpoint location.
Note. Coarse-unit descriptions are aligned with the nearst fine-unit de-scription based on breakpoint location.
rest of the fine units, as predicted by the hierarchical biashypothesis.
Second, descriptions of coarse and fine units differed systemat-ically. In general, coarse-unit descriptions specified objects moreprecisely than fine-unit descriptions. By contrast, fine-unit descrip-tions specified verbs more precisely than coarse-unit descriptions(with two exceptions, as noted in the following). Qualitatively, inthe coarse-unit descriptions, participants seemed to be carefullyidentifying some set of objects or part of the environment with thecoarse-unit descriptions—locating the action—but characterizingjust what was happening less clearly. In the fine-unit descriptions,participants were less careful in describing the objects involved butprecisely specified what was happening.
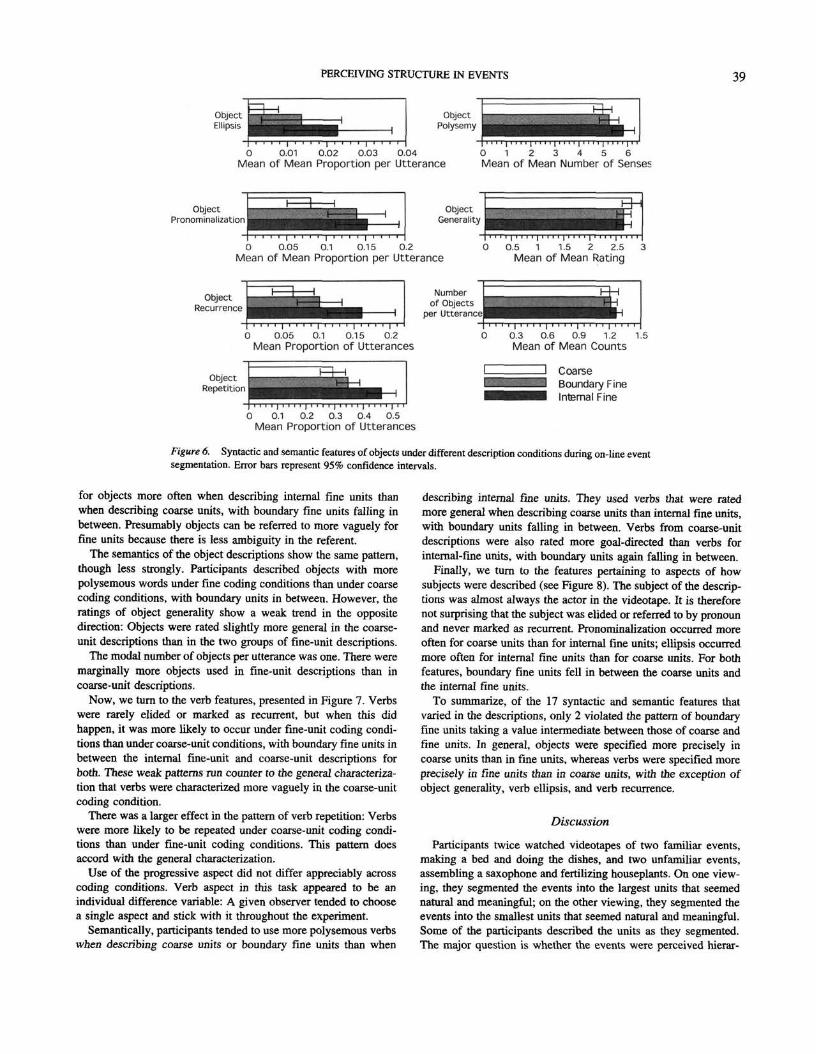
To examine these phenomena in detail, we turn first to objectfeatures. These data are presented in Figure 6. In general, partic-ipants tended to mention objects by name, but they did use severalsyntactic short cuts on occasion. They sometimes elided objects,referred to them with pronouns, marked them as recurrent, andoften repeated the identical object from utterance to utterance. Allfour of these syntactic devices occurred more often in coarse-unitthan fine-unit descriptions, with boundary units in between. To-gether, these results indicate that participants employed short cuts
PERCEIVING STRUCTURE IN EVENTS 39
ObjectEllipsis
ObjectPolysemy
0 0.01 0.02 O.03 0.04Mean of Mean Proportion per Utterance
0 1 2 3 4 5 6Mean of Mean Number of Senses
ObjectPronominalization
ObjectGenerality
O 0.05 0.1 0.15 0.2Mean of Mean Proportion per Utterance
0.5 1 1.5 2 2.5Mean of Mean Rating
ObjectRecurrence
Numberof Objects
per Utterance!
0 0.05 0.1 0.15 0.2Mean Proportion of Utterances
0.3 0.6 0.9 1.2Mean of Mean Counts
1.5
ObjectRepetition
CoarseBoundary FineInternal Fine
0 0.1 0.2 0.3 0.4 0.5Mean Proportion of Utterances
Figure 6. Syntactic and semantic features of objects under different description conditions during on-line eventsegmentation. Error bars represent 95% confidence intervals.
for objects more often when describing internal fine units thanwhen describing coarse units, with boundary fine units falling inbetween. Presumably objects can be referred to more vaguely forfine units because there is less ambiguity in the referent.
The semantics of the object descriptions show the same pattern,though less strongly. Participants described objects with morepolysemous words under fine coding conditions than under coarsecoding conditions, with boundary units in between. However, theratings of object generality show a weak trend in the oppositedirection: Objects were rated slightly more general in the coarse-unit descriptions than in the two groups of fine-unit descriptions.
The modal number of objects per utterance was one. There weremarginally more objects used in fine-unit descriptions than incoarse-unit descriptions.
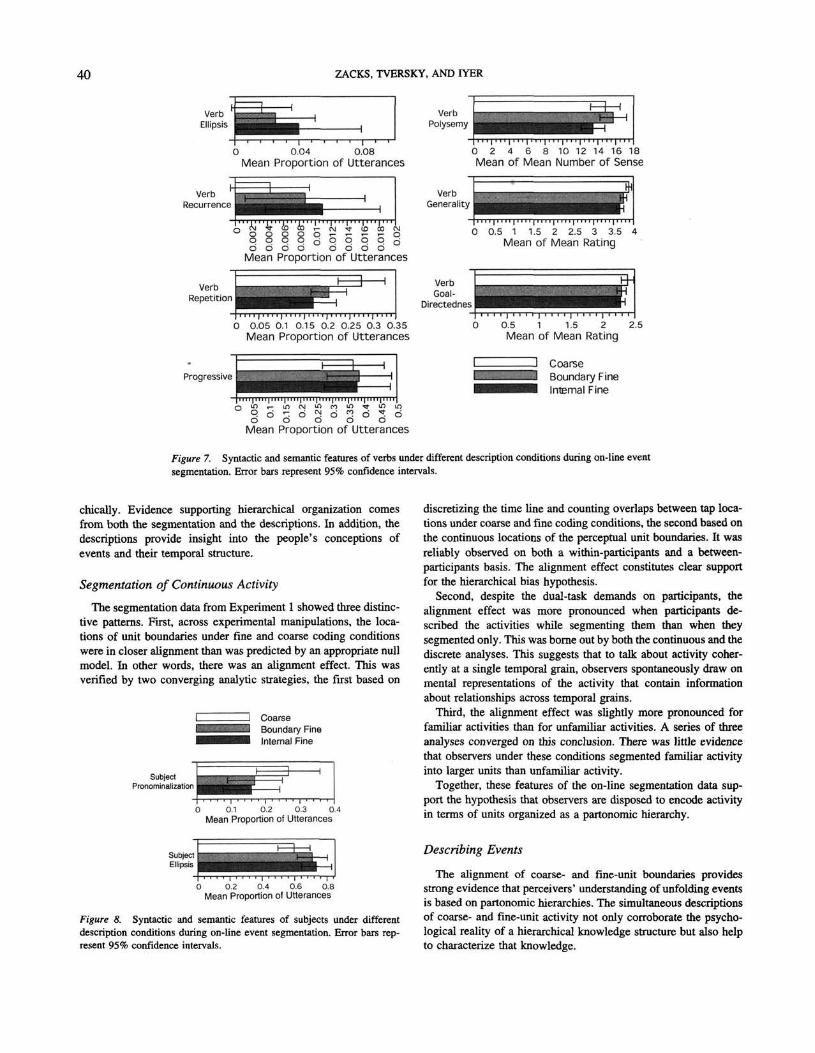
Now, we turn to the verb features, presented in Figure 7. Verbswere rarely elided or marked as recurrent, but when this didhappen, it was more likely to occur under fine-unit coding condi-tions than under coarse-unit conditions, with boundary fine units inbetween the internal fine-unit and coarse-unit descriptions forboth. These weak patterns run counter to the general characteriza-tion that verbs were characterized more vaguely in the coarse-unitcoding condition.
There was a larger effect in the pattern of verb repetition: Verbswere more likely to be repeated under coarse-unit coding condi-tions than under fine-unit coding conditions. This pattern doesaccord with the general characterization.
Use of the progressive aspect did not differ appreciably acrosscoding conditions. Verb aspect in this task appeared to be anindividual difference variable: A given observer tended to choosea single aspect and stick with it throughout the experiment.
Semantically, participants tended to use more polysemous verbswhen describing coarse units or boundary fine units than when
describing internal fine units. They used verbs that were ratedmore general when describing coarse units than internal fine units,with boundary units falling in between. Verbs from coarse-unitdescriptions were also rated more goal-directed than verbs forinternal-fine units, with boundary units again falling in between.
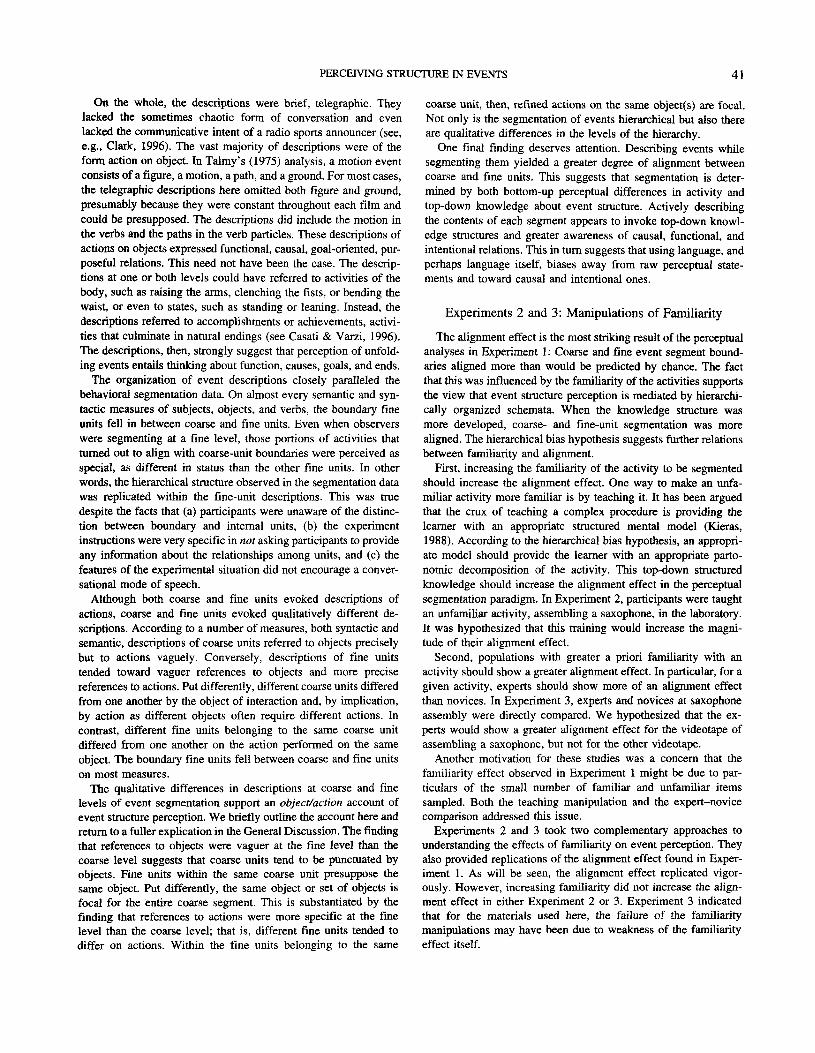
Finally, we turn to the features pertaining to aspects of howsubjects were described (see Figure 8). The subject of the descrip-tions was almost always the actor in the videotape. It is thereforenot surprising that the subject was elided or referred to by pronounand never marked as recurrent. Pronominalization occurred moreoften for coarse units than for internal fine units; ellipsis occurredmore often for internal fine units than for coarse units. For bothfeatures, boundary fine units fell in between the coarse units andthe internal fine units.
To summarize, of the 17 syntactic and semantic features thatvaried in the descriptions, only 2 violated the pattern of boundaryfine units taking a value intermediate between those of coarse andfine units. In general, objects were specified more precisely incoarse units than in fine units, whereas verbs were specified moreprecisely in fine units than in coarse units, with the exception ofobject generality, verb ellipsis, and verb recurrence.
Discussion
Participants twice watched videotapes of two familiar events,making a bed and doing the dishes, and two unfamiliar events,assembling a saxophone and fertilizing houseplants. On one view-ing, they segmented the events into the largest units that seemednatural and meaningful; on the other viewing, they segmented theevents into the smallest units that seemed natural and meaningful.Some of the participants described the units as they segmented.The major question is whether the events were perceived hierar-
40 ZACKS, TVERSKY, AND IYER
VerbEllipsis
VerbPolysemy
0 0.04 0.08Mean Proportion of Utterances
0 2 4 6 8 10 12 14 16 18Mean of Mean Number of Sense
VerbGenerality
. 0 p p p p §o o o o o o o o
Mean Proportion of Utterances
0 0.5 1 1.5 2 2.5 3 3.5 4Mean of Mean Rating
VerbRepetition
I | I . l , | . . . I | I I I I | I
0 0.05 0.1 0.15 0.2 O.25 0.3 0.35Mean Proportion of Utterances
0.5 1 1.5 2Mean of Mean Rating
ProgressiveH Coarse
Boundary FineInternal Fine
Mean Proportion of Utterances
Figure 7. Syntactic and semantic features of verbs under different description conditions during on-line eventsegmentation. Error bars represent 95% confidence intervals.
chically. Evidence supporting hierarchical organization comesfrom both the segmentation and the descriptions. In addition, thedescriptions provide insight into the people's conceptions ofevents and their temporal structure.
Segmentation of Continuous Activity
The segmentation data from Experiment 1 showed three distinc-tive patterns. First, across experimental manipulations, the loca-tions of unit boundaries under fine and coarse coding conditionswere in closer alignment than was predicted by an appropriate nullmodel. In other words, there was an alignment effect. This wasverified by two converging analytic strategies, the first based on
CoarseBoundary FineInternal Fine
SubjectPronominalization
0 0.1 0.2 0.3 0.4Mean Proportion of Utterances
SubjectEllipsis
0 0.2 0.4 0.6 0.8Mean Proportion of Utterances
Figure 8. Syntactic and semantic features of subjects under differentdescription conditions during on-line event segmentation. Error bars rep-resent 95% confidence intervals.
discretizing the time line and counting overlaps between tap loca-tions under coarse and fine coding conditions, the second based onthe continuous locations of the perceptual unit boundaries. It wasreliably observed on both a within-participants and a between-participants basis. The alignment effect constitutes clear supportfor the hierarchical bias hypothesis.
Second, despite the dual-task demands on participants, thealignment effect was more pronounced when participants de-scribed the activities while segmenting them than when theysegmented only. This was borne out by both the continuous and thediscrete analyses. This suggests that to talk about activity coher-ently at a single temporal grain, observers spontaneously draw onmental representations of the activity that contain informationabout relationships across temporal grains.
Third, the alignment effect was slightly more pronounced forfamiliar activities than for unfamiliar activities. A series of threeanalyses converged on this conclusion. There was little evidencethat observers under these conditions segmented familiar activityinto larger units than unfamiliar activity.
Together, these features of the on-line segmentation data sup-port the hypothesis that observers are disposed to encode activityin terms of units organized as a partonomic hierarchy.
Describing Events
The alignment of coarse- and fine-unit boundaries providesstrong evidence that perceivers' understanding of unfolding eventsis based on partonomic hierarchies. The simultaneous descriptionsof coarse- and fine-unit activity not only corroborate the psycho-logical reality of a hierarchical knowledge structure but also helpto characterize that knowledge.
PERCEIVING STRUCTURE IN EVENTS 41
On the whole, the descriptions were brief, telegraphic. Theylacked the sometimes chaotic form of conversation and evenlacked the communicative intent of a radio sports announcer (see,e.g., Clark, 1996). The vast majority of descriptions were of theform action on object. In Talmy's (1975) analysis, a motion eventconsists of a figure, a motion, a path, and a ground. For most cases,the telegraphic descriptions here omitted both figure and ground,presumably because they were constant throughout each film andcould be presupposed. The descriptions did include the motion inthe verbs and the paths in the verb particles. These descriptions ofactions on objects expressed functional, causal, goal-oriented, pur-poseful relations. This need not have been the case. The descrip-tions at one or both levels could have referred to activities of thebody, such as raising the arms, clenching the fists, or bending thewaist, or even to states, such as standing or leaning. Instead, thedescriptions referred to accomplishments or achievements, activi-ties that culminate in natural endings (see Casati & Varzi, 1996).The descriptions, then, strongly suggest that perception of unfold-ing events entails thinking about function, causes, goals, and ends.
The organization of event descriptions closely paralleled thebehavioral segmentation data. On almost every semantic and syn-tactic measures of subjects, objects, and verbs, the boundary fineunits fell in between coarse and fine units. Even when observerswere segmenting at a fine level, those portions of activities thatturned out to align with coarse-unit boundaries were perceived asspecial, as different in status than the other fine units. In otherwords, the hierarchical structure observed in the segmentation datawas replicated within the fine-unit descriptions. This was truedespite the facts that (a) participants were unaware of the distinc-tion between boundary and internal units, (b) the experimentinstructions were very specific in not asking participants to provideany information about the relationships among units, and (c) thefeatures of the experimental situation did not encourage a conver-sational mode of speech.
Although both coarse and fine units evoked descriptions ofactions, coarse and fine units evoked qualitatively different de-scriptions. According to a number of measures, both syntactic andsemantic, descriptions of coarse units referred to objects preciselybut to actions vaguely. Conversely, descriptions of fine unitstended toward vaguer references to objects and more precisereferences to actions. Put differently, different coarse units differedfrom one another by the object of interaction and, by implication,by action as different objects often require different actions. Incontrast, different fine units belonging to the same coarse unitdiffered from one another on the action performed on the sameobject. The boundary fine units fell between coarse and fine unitson most measures.
The qualitative differences in descriptions at coarse and finelevels of event segmentation support an object/action account ofevent structure perception. We briefly outline the account here andreturn to a fuller explication in the General Discussion. The findingthat references to objects were vaguer at the fine level than thecoarse level suggests that coarse units tend to be punctuated byobjects. Fine units within the same coarse unit presuppose thesame object. Put differently, the same object or set of objects isfocal for the entire coarse segment. This is substantiated by thefinding that references to actions were more specific at the finelevel than the coarse level; that is, different fine units tended todiffer on actions. Within the fine units belonging to the same
coarse unit, then, refined actions on the same object(s) are focal.Not only is the segmentation of events hierarchical but also thereare qualitative differences in the levels of the hierarchy.
One final finding deserves attention. Describing events whilesegmenting them yielded a greater degree of alignment betweencoarse and fine units. This suggests that segmentation is deter-mined by both bottom-up perceptual differences in activity andtop-down knowledge about event structure. Actively describingthe contents of each segment appears to invoke top-down knowl-edge structures and greater awareness of causal, functional, andintentional relations. This in turn suggests that using language, andperhaps language itself, biases away from raw perceptual state-ments and toward causal and intentional ones.
Experiments 2 and 3: Manipulations of Familiarity
The alignment effect is the most striking result of the perceptualanalyses in Experiment 1: Coarse and fine event segment bound-aries aligned more than would be predicted by chance. The factthat this was influenced by the familiarity of the activities supportsthe view that event structure perception is mediated by hierarchi-cally organized schemata. When the knowledge structure wasmore developed, coarse- and fine-unit segmentation was morealigned. The hierarchical bias hypothesis suggests further relationsbetween familiarity and alignment.
First, increasing the familiarity of the activity to be segmentedshould increase the alignment effect. One way to make an unfa-miliar activity more familiar is by teaching it. It has been arguedthat the crux of teaching a complex procedure is providing thelearner with an appropriate structured mental model (Kieras,1988). According to the hierarchical bias hypothesis, an appropri-ate model should provide the learner with an appropriate parto-nomic decomposition of the activity. This top-down structuredknowledge should increase the alignment effect in the perceptualsegmentation paradigm. In Experiment 2, participants were taughtan unfamiliar activity, assembling a saxophone, in the laboratory.It was hypothesized that this training would increase the magni-tude of their alignment effect.
Second, populations with greater a priori familiarity with anactivity should show a greater alignment effect. In particular, for agiven activity, experts should show more of an alignment effectthan novices. In Experiment 3, experts and novices at saxophoneassembly were directly compared. We hypothesized that the ex-perts would show a greater alignment effect for the videotape ofassembling a saxophone, but not for the other videotape.
Another motivation for these studies was a concern that thefamiliarity effect observed in Experiment 1 might be due to par-ticulars of the small number of familiar and unfamiliar itemssampled. Both the teaching manipulation and the expert-novicecomparison addressed this issue.
Experiments 2 and 3 took two complementary approaches tounderstanding the effects of familiarity on event perception. Theyalso provided replications of the alignment effect found in Exper-iment 1. As will be seen, the alignment effect replicated vigor-ously. However, increasing familiarity did not increase the align-ment effect in either Experiment 2 or 3. Experiment 3 indicatedthat for the materials used here, the failure of the familiaritymanipulations may have been due to weakness of the familiarityeffect itself.

42 ZACKS, TVERSKY, AND IYER
Method
The methods employed were almost identical to that of Experiment 1.Differences are noted below.
Materials
For Experiment 2, one stimulus was selected from the eight employed inExperiment 1: the videotape in which the female actor assembled a saxo-phone. It was chosen because it was the least familiar of the four activitiesstudied in Experiment 1. For Experiment 3, videotapes of all four activitiesperformed by the female actor were used. In both experiments, the sameexample stimulus (in which a woman ironed a shirt) was used.
Participants and Procedure
In Experiment 2, participants were screened to be unfamiliar with thesaxophone and randomly assigned to two different groups. One group (thetrained group) was given a short course in putting together a saxophonebefore beginning the event segmentation phase of the experiment. In thistraining, the experimenter demonstrated how to put together a saxophoneand identified all the parts of the instrument. The training was completewhen the participants were able to accurately recall all the names of thedifferent parts of the saxophone twice successively. The training procedurelasted about 8 min. The other group (the untrained group) received notraining. Twelve participants were randomly assigned to each group.
In Experiment 3, expert saxophone-assemblers were recruited from theStanford Band and compared with novices. To minimize possible con-founding variables, we also selected novices from a local musical ensem-ble: violinists from the Stanford Symphony. Sixteen participants wereselected for each group.
Participants received $8 or course credit in psychology for participating.The rest of the procedure in both experiments was essentially the same
as in Experiment 1. The instructions (including the coarse/fine manipula-tion) were identical. Participants received fine or coarse coding instruc-tions, then first segmented the example tape, and then the experimentaltape(s). They next performed an unrelated task for 25 min, after which theysegmented the experimental tape(s) again under the alternative codinginstructions. Order of coding instructions was counterbalanced within eachgroup, and order of stimulus presentation in Experiment 3 was controlledas in Experiment 1.
One feature of the procedure in Experiment 3 differed from the previousones. For this experiment, the video stimuli were presented on a computer(an Apple Macintosh equipped with an Avid Cinema video digitization/compression card), using the same PsyScope (J. D. Cohen et al., 1993)script that was used to collect the tapping data. This allowed for moreprecise timing of the breakpoint locations and automatic synchronizationbetween the video stimulus and the tapping data.
Results
The alignment effect of Experiment 1 was replicated in bothexperiments: Coarse breakpoints were on average closer to thenearest fine breakpoint than was predicted by the appropriatechance model. This was demonstrated by both the discrete andcontinuous analysis methods (see Experiment 1).
For the discrete method, there were reliably more overlaps perviewing than was predicted by the null model. In Experiment 2, thedifference was .874, f(23) = 3.4, p = .002. In Experiment 3, thedifference was 1.52, f(127) = 7.1, p < .001. For the continuousmethod, the mean distance from each coarse breakpoint was onaverage closer than predicted by the null model. In Experiment 2,
the difference was 3,420 ms, f(23) = 7.04, p < .001. In Experi-ment 3, the difference was 3,450 ms, f(127) = 12.1, p < .001.
The influence of training and expertise on the alignment effectwas tested with both the discrete and continuous analytic methods.Expected and observed scores were calculated, and the differencebetween the two was submitted to a between-participantsANOVA. The results were inconclusive. In Experiment 2, thediscrete analysis indicated an effect of training on alignmentopposite to that predicted. The difference between the observednumber of overlaps and that predicted by chance was smaller forthe trained group (M = .359, SEM = .232) than for the untrainedgroup {M = 1.39, SEM = .418), and this difference was statisti-cally reliable, F(l, 22) = 4.68, p = .04. However, the meandistance per viewing from coarse breakpoints to nearest fine break-point did not differ appreciably between the trained group(M = 3,400 ms, SEM = 902 ms) and the untrained group(M = 3,430 ms, SEM = 412 ms), F(l, 22) = 0.00, p = .97. Theresults are summarized in Figure 9.
In Experiment 3, the expert group was predicted to show anespecially large alignment effect for the "assembling a saxophone"activity, but not for the other three. This interaction betweenexpertise and activity was not observed, as can be seen in bothpanels of Figure 10. This was borne out by both the discreteanalysis, F(3, 90) = .490, p = .69, and the continuous analysis,F(3, 90) = .771, p — .51. The discrete analysis showed noindication of a main effect of group, F(l, 90) = .012, p = .91;however, by the continuous analysis, the novice group showed alarger alignment effect overall, F(l, 90) = 5.28, p = .02.
Figure 10 also indicates that the basic familiarity effect repli-cated only weakly in Experiment 3. By both analyses, there was atrend in the direction of replicating the original familiarity effect,but it was not reliable for the discrete analysis, F(l, 124) = 1.87,p = .17, or for the continuous analysis, F(l, 124) = 3.43, p = .07.
Neither training nor expertise affected the level at which par-ticipants segmented the activity. Mean unit lengths per viewingwere calculated and submitted to ANOVAs with training as abetween-participants factor, condition as a within-participants fac-
Discrete Analysis
Untrained
0.5 1 1.5 2 2.5 3 35Mean of Overlaps - Overlaps0
Continuous Analysis
1000 2000 3000 4000 5000 6000Mean of Difference AvgDistQ - AvgDist (ms)
Figure 9. Effects of training on the magnitude of the alignment effect, asmeasured by the discrete (top) and continuous (bottom) methods. Errorbars represent 95% confidence intervals.

PERCEIVING STRUCTURE IN EVENTS 43
Discrete AnalysisFamiliar
Making a Bed
Doing Dishes
UnfamiliarFertilizing Houseplants
Assembling a Saxophone
2 4Mean of Overlaps - Overlaps,,
Continuous AnalysisFamiliar
Making a Bed
Doing Dishes
UnfamiliarFertilizing Houseplants
Assembling a Saxophone
1000 2000 3000 4000 5000 6000 7000 8000Mean of Difference AvgDist0 - AvgDist (ms)
Figure 10. Effects of group and activity on the magnitude of the alignment effect, as measured by the discrete(top) and continuous (bottom) methods. Error bars represent 95% confidence intervals.
tor, and participant blocked on training. In both cases, coarse unitswere substantially larger than fine units, as expected. For Exper-iment 2, the mean of mean length per viewing was 11.8 s(SEM = 1.16 s) for the fine condition and 44.5 s (SEM = 7.13 s)for the coarse condition, F(l, 22) = 23.2, p < .001. For Experi-ment 3, the means were 14.4 s (SEM - 1.90 s) for the finecondition and 59.8 s (SEM = 4.35 s) for the coarse condition, F(l,254) = 118.6, p < .002. In Experiment 2, there was no effect oftraining, F(\, 22) = .023, p = .88, and no interaction withcondition, F(l, 22) = .506, p = .48. In Experiment 3, there was noeffect of expertise, F(l, 254) = .576, p = .45, and no interactionwith condition, F(l, 254) = .413, p = .521.
Discussion
Experiments 2 and 3 replicated the alignment effect of Experi-ment 1, further supporting the hierarchical bias hypothesis. How-ever, neither training of novices (Experiment 2) nor direct com-parison of experts and novices (Experiment 3) mediated thefamiliarity differences.
Although the groups did not differ in the degree to which theyhierarchically organized the activity in either Experiment 2 orExperiment 3, they might have differed qualitatively in where theysegmented the behavior. To investigate this possibility, we plottedprobability densities of breakpoint locations for each of the groups
in each of the coding conditions. In both experiments, the distri-butions were quite similar between the two groups, suggesting theydid not perceive qualitatively different segmentations. We alsoperformed a statistical test of the amount of disagreement acrossthe two groups for each coding condition, following the methoddescribed by Massad and his colleagues (Massad, Michael, &Newtson, 1979). Briefly, this analysis identifies the most commonbreakpoints in each group and then tests to see whether theproportion of observers who segmented the activity at each ofthese points differs across groups.2 We performed this analysis forboth Experiments 2 and 3, independently treating the coarse andfine coding conditions. There was no evidence that segmentationpatterns differed between trained and untrained novices or betweenexperts and novices. In Experiment 2, for the fine-unit breakpoints,F(l, 40) = 0.211, p = .65; for the coarse-unit breakpoints, F(l,24) = 0.480, p = .50. In Experiment 3, for the fine-unit break-points, F(l, 40) = 0.244, p = .623; for the coarse-unit breakpoints,F(l, 8) = 0.15, p = .71. Although it would be difficult to observea reliable difference in the coarse coding conditions because of thesmall number of breakpoints per observer, the fine coding condi-tions provide reasonably sensitive measures.
2 We thank an anonymous reviewer for suggesting this analysis.

44 ZACKS, TVERSKY, AND IYER
In Experiment 1, this alignment effect was shown to be moresubstantial for familiar activities than for unfamiliar ones. Wehypothesized that this difference reflected the influence of hierar-chically organized event schemata, which require prior exposure toan activity to form. The results of neither Experiment 2 norExperiment 3 support this hypothesis. However, Experiment 3 alsofailed to provide a statistically reliable replication of the originalfamiliarity effect (though there were trends consistent with theeffect). This makes interpretation of the relationship between ex-pertise, familiarity, and the alignment effect difficult. The failureto observe the predicted interactions could be taken as evidenceinconsistent with the hierarchical bias hypothesis. However, itcould also be that the familiarity effect observed in Experiment 1is simply not substantial enough to burden with additional exper-imental manipulations.
In retrospect, it seems likely that the unfamiliar event wassimply not unfamiliar enough. Even though the novices in thesestudies did not know how to assemble a saxophone, they hadextensive experience assembling other objects. It could be that themeta-knowledge about assembling objects facilitated interpreta-tion of assembling a saxophone and other unfamiliar objects,diminishing effects of instruction and experience in segmentation.
Experiment 4: Structure in Memory for Events
Patterns in perceptual encoding in Experiments 1-3 suggestedthe influence of hierarchically organized schemata for events onthe perception of ongoing activity. If such cognitive structuresguide perception, they should surely influence memory. The no-tion that schemata for events guide memory goes back at least toBartlett (1932). As was described previously, there is extensiveevidence that hierarchically organized event schemata guide recallfor written stories (Abbott et al., 1985; Bower et al., 1979; Rumel-hart, 1977) and videotapes of live-action events (Brewer & Du-pree, 1983; Lichtenstein & Brewer, 1980). It is therefore natural toexpect to find a relationship between the segmentation and lin-guistic data obtained in these perceptual experiments and laterrecall for the activities presented.
In one regard, one should expect memory for events to preservethe structure observed in the perceptual experiments. The differ-ences in Experiment 1 between descriptions of coarse, boundaryfine, and internal fine units suggested the influence of hierarchi-cally organized schemata. Given such an encoding bias, one wouldexpect these differences to be preserved in memory. We thereforeexpected to see differences between coarse and fine units inmemory similar to those that had been seen in perception. Theprimary motivation of Experiment 4 was to compare the syntacticand semantic content of event descriptions from memory, underfine and coarse coding conditions, with the descriptions obtainedduring on-line segmentation. To preserve as rich a representationto draw on as possible, we chose to study memory under very shortdelay conditions, thus focusing on the difference between narratinga live action and reporting on one in the immediate past.
In another regard, one might expect to see differences in thelevel at which participants describe activity in memory and per-ception. When recalling stories from memory, people sometimesshift to a coarser grain of description, omitting the lower levels ofthe partonomy (Rumelhart, 1977). However, given the short delay
in Experiment 4, such effects might not have time to exert aninfluence.
In short, Experiment 4 was designed to test the hypothesis thatdifferences between fine-unit and coarse-unit descriptions frommemory would replicate those of descriptions while viewing ac-tivity. We also were interested in examining possible changes inlevel of segmentation from memory.
Method
Participants
Twenty-two Stanford students participated in this experiment infulfillment of a course requirement.
Materials and Procedures
The stimuli were identical to those in Experiment 1: Eight videotapeswere used, making up performances of all four activities by the two actors.
The procedure was adapted from that of Experiment 1 with one impor-tant modification: Participants described event segments by writing themdown immediately after watching the videotape rather than describingthem as they watched. They performed no perceptual segmentation.
Participants were run in groups of 1 to 8. Upon their arrival, theexperimenter explained to them that they would be watching a videotape ofa person engaged in an activity. The experimenter explained that afterwatching the activity, they would be asked to divide the behavior of theperson into the smallest units (for the fine-unit coding condition) or largestunits (for the coarse-unit coding condition) that seemed natural and mean-ingful to them. They were told that they would be given a piece of paperand asked to write down, for each unit, what happened in that unit, andasked to use a separate line for each unit. They watched the example tapeand recorded their units on paper as instructed. They then did the same withthe four experimental activities (arranged in one of four different orders,depending on group). Next, they participated in an unrelated experimentfor approximately 20 min. Then they watched the four experimentalactivities again. This time, if they had been asked to segment the activityinto the smallest units that felt natural and meaningful before, they werenow asked to segment into the largest units that felt natural and meaningful,and vice versa.
Results
Of the 22 participants, data from 5 were not usable. Two failedto complete the experiment. Although most participants gave con-crete descriptions of the activity in the videotapes, 2 gave unre-sponsive descriptions that were deemed unanalyzable (examples:"desperate attempt of a man to ascertain his own influence over theworld and to combat the forces of chaos (I'm serious)," and"Atmosphere: somewhat bright light in the bathroom"). A singleparticipant failed to follow the instruction to record units one-per-line. Of the remaining 17 participants, 9 were given the fine-unitcoding instructions before the first viewing of the videotapes andthe coarse-unit instructions for the second; for the other 8 partic-ipants, the opposite order was employed.
Two participants, when writing coarse-unit descriptions, spon-taneously organized the descriptions hierarchically, using number-ing and indentation to indicate the partonomic relationships. Forone of these participants, the fine units were deleted prior toanalysis. The other was one of those who failed to complete theexperiment.
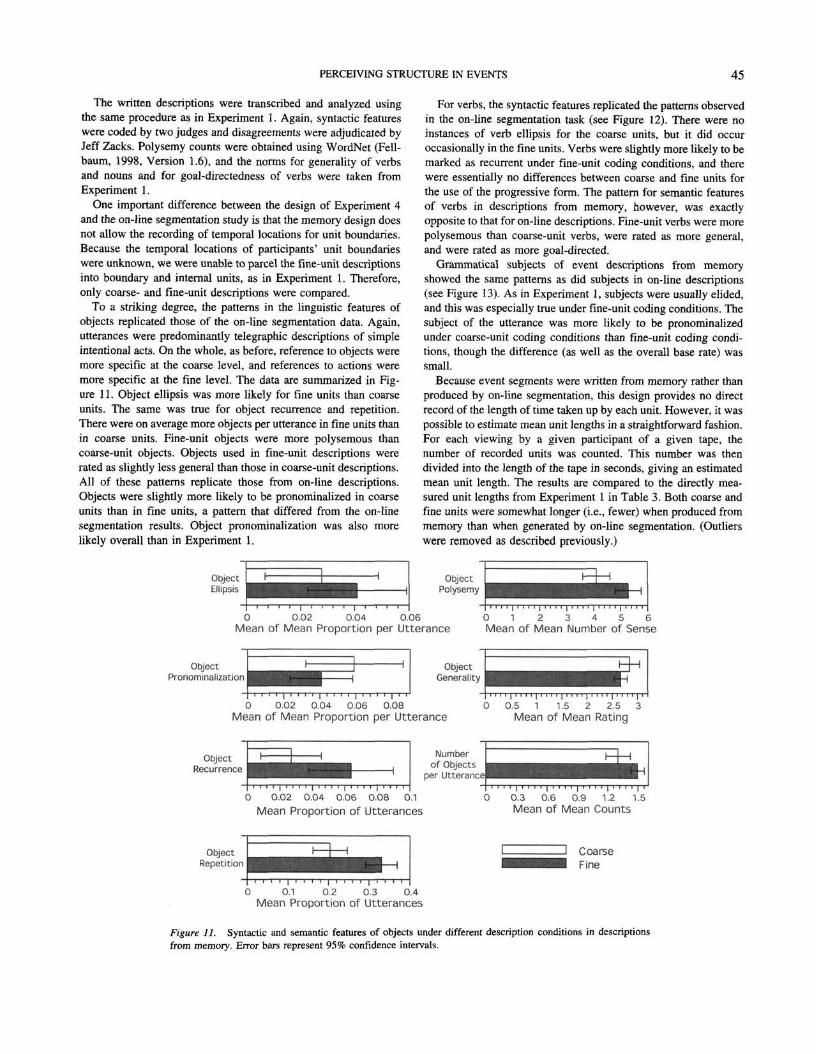
PERCEIVING STRUCTURE IN EVENTS 45
The written descriptions were transcribed and analyzed usingthe same procedure as in Experiment 1. Again, syntactic featureswere coded by two judges and disagreements were adjudicated byJeff Zacks. Polysemy counts were obtained using WordNet (Fell-baum, 1998, Version 1.6), and the norms for generality of verbsand nouns and for goal-directedness of verbs were taken fromExperiment 1.
One important difference between the design of Experiment 4and the on-line segmentation study is that the memory design doesnot allow the recording of temporal locations for unit boundaries.Because the temporal locations of participants' unit boundarieswere unknown, we were unable to parcel the fine-unit descriptionsinto boundary and internal units, as in Experiment 1. Therefore,only coarse- and fine-unit descriptions were compared.
To a striking degree, the patterns in the linguistic features ofobjects replicated those of the on-line segmentation data. Again,utterances were predominantly telegraphic descriptions of simpleintentional acts. On the whole, as before, reference to objects weremore specific at the coarse level, and references to actions weremore specific at the fine level. The data are summarized in Fig-ure 11. Object ellipsis was more likely for fine units than coarseunits. The same was true for object recurrence and repetition.There were on average more objects per utterance in fine units thanin coarse units. Fine-unit objects were more polysemous thancoarse-unit objects. Objects used in fine-unit descriptions wererated as slightly less general than those in coarse-unit descriptions.All of these patterns replicate those from on-line descriptions.Objects were slightly more likely to be pronominalized in coarseunits than in fine units, a pattern that differed from the on-linesegmentation results. Object pronominalization was also morelikely overall than in Experiment 1.
ObjectEllipsis
For verbs, the syntactic features replicated the patterns observedin the on-line segmentation task (see Figure 12). There were noinstances of verb ellipsis for the coarse units, but it did occuroccasionally in the fine units. Verbs were slightly more likely to bemarked as recurrent under fine-unit coding conditions, and therewere essentially no differences between coarse and fine units forthe use of the progressive form. The pattern for semantic featuresof verbs in descriptions from memory, however, was exactlyopposite to that for on-line descriptions. Fine-unit verbs were morepolysemous than coarse-unit verbs, were rated as more general,and were rated as more goal-directed.
Grammatical subjects of event descriptions from memoryshowed the same patterns as did subjects in on-line descriptions(see Figure 13). As in Experiment 1, subjects were usually elided,and this was especially true under fine-unit coding conditions. Thesubject of the utterance was more likely to be pronominalizedunder coarse-unit coding conditions than fine-unit coding condi-tions, though the difference (as well as the overall base rate) wassmall.
Because event segments were written from memory rather thanproduced by on-line segmentation, this design provides no directrecord of the length of time taken up by each unit. However, it waspossible to estimate mean unit lengths in a straightforward fashion.For each viewing by a given participant of a given tape, thenumber of recorded units was counted. This number was thendivided into the length of the tape in seconds, giving an estimatedmean unit length. The results are compared to the directly mea-sured unit lengths from Experiment 1 in Table 3. Both coarse andfine units were somewhat longer (i.e., fewer) when produced frommemory than when generated by on-line segmentation. (Outlierswere removed as described previously.)
ObjectPolysemy
0 0.02 0.04 0.06Mean of Mean Proportion per Utterance
0 1 2 3 4 5 6Mean of Mean Number of Sense
ObjectPronominalization
ObjectGenerality
0 0.02 0.04 0.06 0.08Mean of Mean Proportion per Utterance
0.5 1 1.5 2 2.5 3Mean of Mean Rating
ObjectRecurrence
Numberof Objects
per Utterance!
0 0.02 0.04 0.06 0.08 0.1Mean Proportion of Utterances
0.3 0.6 0.9 1.2 1.5Mean of Mean Counts
ObjectRepetition
0 0.1 0.2 0.3 0.4Mean Proportion of Utterances
J CoarseFine
Figure 11. Syntactic and semantic features of objects under different description conditions in descriptionsfrom memory. Error bars represent 95% confidence intervals.

46 ZACKS, TVERSKY, AND IYER
0 0.05 0.1 0.15 0.2 0.25 0.3 0.35Mean Proportion of Utterances
Table 3Comparison of Results of Experiments 1 and 4
Progressive CoarseFine
0 0.05 0.1 0.15 0.2Mean Proportion of Utterances
Figure 12. Syntactic and semantic features of verbs under differentdescription conditions in descriptions from memory. Error bars represent95% confidence intervals.
Discussion
When observers described activity from recent memory, theirdescriptions were quite similar to those given by observers whodescribed activity while they watched it. The same relationshipsbetween syntactic features of objects, verbs, and subjects andsegmentation level were observed, and the same relationshipsbetween semantic features of objects and segmentation level werealso present. The one exception is the relationship between seman-tic features of verbs and segmentation level. For on-line descrip-tions, coarse units were more polysemous, more general, and moregoal-directed than internal fine units. For descriptions from mem-ory, the opposite was true. The general pattern supports the hier-archical bias hypothesis, indicating that the structured representa-tions that guide perception also influence memory. Anotherstriking (though anecdotal) piece of evidence comes from the factthat 2 participants in this study spontaneously produced hierarchi-cal descriptions in Experiment 4, though explicitly instructed notto. It is as if, for these participants, a linear list of events void of
J CoarseFine
SubjectPronominalization
0 0.02 0.04 0.06 0.08 0.1 0.12Mean Proportion of Utterances
SubjectEllipsis
0 0.1 0.2 0.3 0.4 0.5 0.6 0.7 0.8 0.9 1Mean Proportion of Utterances
Figure 13. Syntactic and semantic features of subjects under differentdescription conditions in descriptions from memory. Error bars represent95% confidence intervals.
Coarse
Measure
Unit lengthDescribe on-lineDescribe from memory
Number of breakpointsDescribe on-lineDescribe from memory
M
34.358.5
10.16.18
SEM
2.617.41
0.920.36
Fine
M
12.819.6
28.917.4
SEM
1.042.38
2.020.95
Note. Participants who described activity from memory made longerunits than those who described activity on-line. Cell values representmeans of mean length per viewing in seconds or mean number of break-points per viewing. (Outliers removed as described in the text.)
hierarchical structure did not count as a good description of theactivity.
To what might the differences between verb semantics in mem-ory and in perception be due? One possibility is that they reflectthe different production constraints of verbal and written descrip-tions. Another possibility is that they reflect receding of the coarseunits from a representation closely tied to the physical activityinvolved to a more schema-influenced representation that is lessspecific about the physical actions and more related to the goalsand plans of the actor.
Overall, objects and verbs produced from memory were similarto those produced on-line in their semantic content: Both verbs andobjects were similar in their overall polysemy and generality, andverbs were similar in their overall degree of goal-directedness.(Compare Figure 6 with Figure 11, and Figure 7 with Figure 12.)
There was some evidence of schema-based consolidation in thisexperiment, reflected in a shift in the segmentation level from afiner grain to a coarser one. Observers produced fewer units frommemory than during on-line segmentation. However, these differ-ences may reflect constraints of writing as compared with speak-ing, as well as effects of memory per se. The effects of medium aredifficult to assess. On the one hand, writing certainly requires moreeffort than speaking. On the other hand, participants in the currentmemory experiment were under no time pressure in producingtheir descriptions, whereas participants in the segmentation exper-iments were constrained by the need to keep up with the activity asit happened. A better understanding of consolidation in eventmemory will require studies in which the output medium ismatched and the delay period is parametrically varied.
Comparing both the overall characteristics of descriptions andthe differences between coarse-unit and fine-unit descriptions,there is a striking similarity between descriptions from memoryand from perception. This similarity suggests that the segmentationstructure of the activity at encoding is playing an important role inmemory. This suggestion is supported by recent work examiningthe relationship between cues to segmentation structure and latermemory. In one experiment, Boltz (1992) showed observers adramatic movie with commercials placed so as to either reinforceor obscure the natural hierarchical structure. When commercialssupported the natural organization, recall memory for the dramaand recognition memory for scene order in the drama were im-proved. Placement of temporal breaks that supported the natural
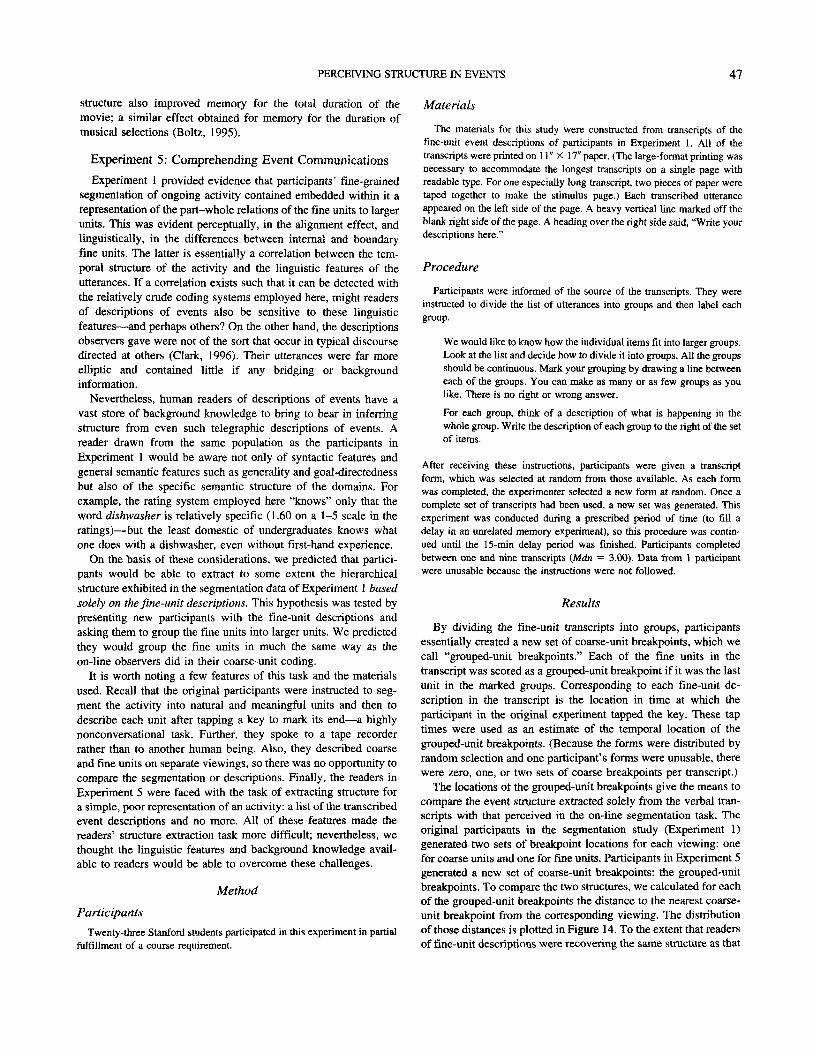
PERCEIVING STRUCTURE IN EVENTS 47
structure also improved memory for the total duration of themovie; a similar effect obtained for memory for the duration ofmusical selections (Boltz, 1995).
Experiment 5: Comprehending Event Communications
Experiment 1 provided evidence that participants' fine-grainedsegmentation of ongoing activity contained embedded within it arepresentation of the part-whole relations of the fine units to largerunits. This was evident perceptually, in the alignment effect, andlinguistically, in the differences between internal and boundaryfine units. The latter is essentially a correlation between the tem-poral structure of the activity and the linguistic features of theutterances. If a correlation exists such that it can be detected withthe relatively crude coding systems employed here, might readersof descriptions of events also be sensitive to these linguisticfeatures—and perhaps others? On the other hand, the descriptionsobservers gave were not of the sort that occur in typical discoursedirected at others (Clark, 1996). Their utterances were far moreelliptic and contained little if any bridging or backgroundinformation.
Nevertheless, human readers of descriptions of events have avast store of background knowledge to bring to bear in inferringstructure from even such telegraphic descriptions of events. Areader drawn from the same population as the participants inExperiment 1 would be aware not only of syntactic features andgeneral semantic features such as generality and goal-directednessbut also of the specific semantic structure of the domains. Forexample, the rating system employed here "knows" only that theword dishwasher is relatively specific (1.60 on a 1-5 scale in theratings)—but the least domestic of undergraduates knows whatone does with a dishwasher, even without first-hand experience.
On the basis of these considerations, we predicted that partici-pants would be able to extract to some extent the hierarchicalstructure exhibited in the segmentation data of Experiment 1 basedsolely on the fine-unit descriptions. This hypothesis was tested bypresenting new participants with the fine-unit descriptions andasking them to group the fine units into larger units. We predictedthey would group the fine units in much the same way as theon-line observers did in their coarse-unit coding.
It is worth noting a few features of this task and the materialsused. Recall that the original participants were instructed to seg-ment the activity into natural and meaningful units and then todescribe each unit after tapping a key to mark its end—a highlynonconversational task. Further, they spoke to a tape recorderrather than to another human being. Also, they described coarseand fine units on separate viewings, so there was no opportunity tocompare the segmentation or descriptions. Finally, the readers inExperiment 5 were faced with the task of extracting structure fora simple, poor representation of an activity: a list of the transcribedevent descriptions and no more. All of these features made thereaders' structure extraction task more difficult; nevertheless, wethought the linguistic features and background knowledge avail-able to readers would be able to overcome these challenges.
Method
Participants
Twenty-three Stanford students participated in this experiment in partialfulfillment of a course requirement.
Materials
The materials for this study were constructed from transcripts of thefine-unit event descriptions of participants in Experiment 1. All of thetranscripts were printed on 11" X 17" paper. (The large-format printing wasnecessary to accommodate the longest transcripts on a single page withreadable type. For one especially long transcript, two pieces of paper weretaped together to make the stimulus page.) Each transcribed utteranceappeared on the left side of the page. A heavy vertical line marked off theblank right side of the page. A heading over the right side said, "Write yourdescriptions here."
Procedure
Participants were informed of the source of the transcripts. They wereinstructed to divide the list of utterances into groups and then label eachgroup.
We would like to know how the individual items fit into larger groups.Look at the list and decide how to divide it into groups. All the groupsshould be continuous. Mark your grouping by drawing a line betweeneach of the groups. You can make as many or as few groups as youlike. There is no right or wrong answer.
For each group, think of a description of what is happening in thewhole group. Write the description of each group to the right of the setof items.
After receiving these instructions, participants were given a transcriptform, which was selected at random from those available. As each formwas completed, the experimenter selected a new form at random. Once acomplete set of transcripts had been used, a new set was generated. Thisexperiment was conducted during a prescribed period of time (to fill adelay in an unrelated memory experiment), so this procedure was contin-ued until the 15-min delay period was finished. Participants completedbetween one and nine transcripts (Mdn = 3.00). Data from 1 participantwere unusable because the instructions were not followed.
Results
By dividing the fine-unit transcripts into groups, participantsessentially created a new set of coarse-unit breakpoints, which wecall "grouped-unit breakpoints." Each of the fine units in thetranscript was scored as a grouped-unit breakpoint if it was the lastunit in the marked groups. Corresponding to each fine-unit de-scription in the transcript is the location in time at which theparticipant in the original experiment tapped the key. These taptimes were used as an estimate of the temporal location of thegrouped-unit breakpoints. (Because the forms were distributed byrandom selection and one participant's forms were unusable, therewere zero, one, or two sets of coarse breakpoints per transcript.)
The locations of the grouped-unit breakpoints give the means tocompare the event structure extracted solely from the verbal tran-scripts with that perceived in the on-line segmentation task. Theoriginal participants in the segmentation study (Experiment 1)generated two sets of breakpoint locations for each viewing: onefor coarse units and one for fine units. Participants in Experiment 5generated a new set of coarse-unit breakpoints: the grouped-unitbreakpoints. To compare the two structures, we calculated for eachof the grouped-unit breakpoints the distance to the nearest coarse-unit breakpoint from the corresponding viewing. The distributionof those distances is plotted in Figure 14. To the extent that readersof fine-unit descriptions were recovering the same structure as that
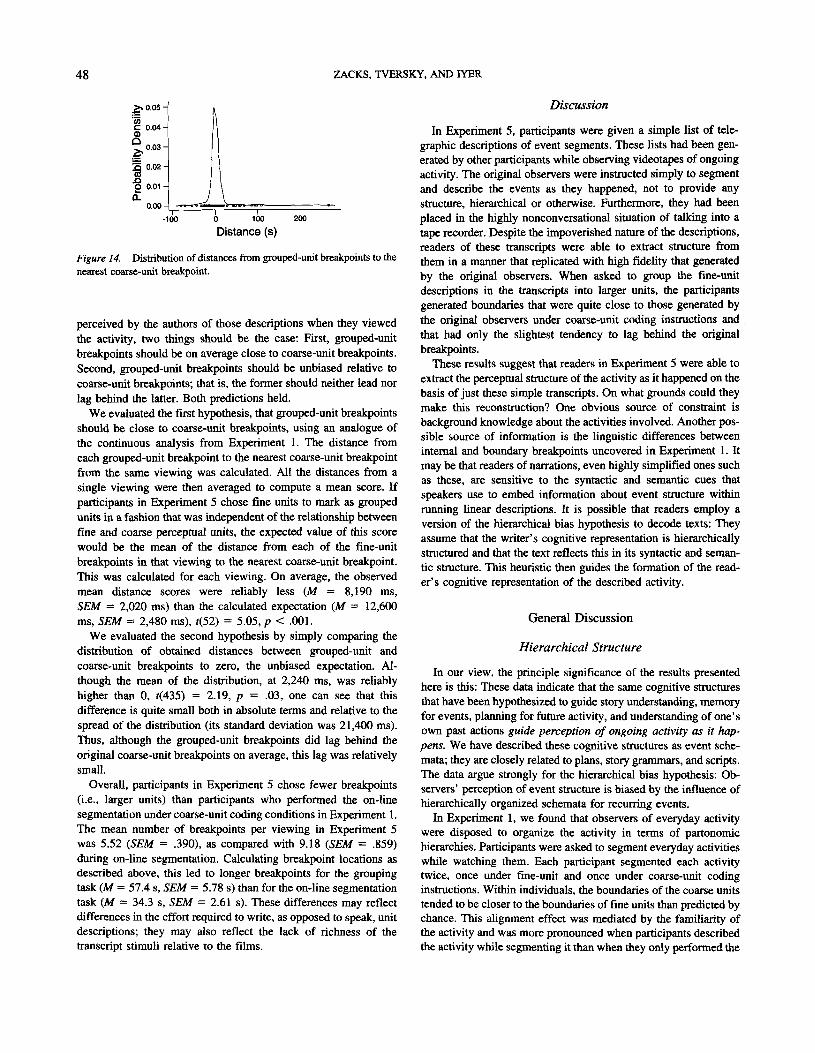
48 ZACKS, TVERSKY, AND IYER
£> 0.05 -
"55C 0 04 -
ST. 0.03 -ff3 0.02-
'g 0.01 -Q.
0.00-
// \
— v ^-
200
Distance (s)
Figure 14. Distribution of distances from grouped-unit breakpoints to thenearest coarse-unit breakpoint.
perceived by the authors of those descriptions when they viewedthe activity, two things should be the case: First, grouped-unitbreakpoints should be on average close to coarse-unit breakpoints.Second, grouped-unit breakpoints should be unbiased relative tocoarse-unit breakpoints; that is, the former should neither lead norlag behind the latter. Both predictions held.
We evaluated the first hypothesis, that grouped-unit breakpointsshould be close to coarse-unit breakpoints, using an analogue ofthe continuous analysis from Experiment 1. The distance fromeach grouped-unit breakpoint to the nearest coarse-unit breakpointfrom the same viewing was calculated. All the distances from asingle viewing were then averaged to compute a mean score. Ifparticipants in Experiment 5 chose fine units to mark as groupedunits in a fashion that was independent of the relationship betweenfine and coarse perceptual units, the expected value of this scorewould be the mean of the distance from each of the fine-unitbreakpoints in that viewing to the nearest coarse-unit breakpoint.This was calculated for each viewing. On average, the observedmean distance scores were reliably less (M = 8,190 ms,SEM = 2,020 ms) than the calculated expectation (M = 12,600ms, SEM = 2,480 ms), t(52) = 5.05, p < .001.
We evaluated the second hypothesis by simply comparing thedistribution of obtained distances between grouped-unit andcoarse-unit breakpoints to zero, the unbiased expectation. Al-though the mean of the distribution, at 2,240 ms, was reliablyhigher than 0, t(435) = 2.19, p = .03, one can see that thisdifference is quite small both in absolute terms and relative to thespread of the distribution (its standard deviation was 21,400 ms).Thus, although the grouped-unit breakpoints did lag behind theoriginal coarse-unit breakpoints on average, this lag was relativelysmall.
Overall, participants in Experiment 5 chose fewer breakpoints(i.e., larger units) than participants who performed the on-linesegmentation under coarse-unit coding conditions in Experiment 1.The mean number of breakpoints per viewing in Experiment 5was 5.52 (SEM = .390), as compared with 9.18 (SEM = .859)during on-line segmentation. Calculating breakpoint locations asdescribed above, this led to longer breakpoints for the groupingtask (M = 57.4 s, SEM = 5.78 s) than for the on-line segmentationtask (M = 34.3 s, SEM = 2.61 s). These differences may reflectdifferences in the effort required to write, as opposed to speak, unitdescriptions; they may also reflect the lack of richness of thetranscript stimuli relative to the films.
Discussion
In Experiment 5, participants were given a simple list of tele-graphic descriptions of event segments. These lists had been gen-erated by other participants while observing videotapes of ongoingactivity. The original observers were instructed simply to segmentand describe the events as they happened, not to provide anystructure, hierarchical or otherwise. Furthermore, they had beenplaced in the highly nonconversational situation of talking into atape recorder. Despite the impoverished nature of the descriptions,readers of these transcripts were able to extract structure fromthem in a manner that replicated with high fidelity that generatedby the original observers. When asked to group the fine-unitdescriptions in the transcripts into larger units, the participantsgenerated boundaries that were quite close to those generated bythe original observers under coarse-unit coding instructions andthat had only the slightest tendency to lag behind the originalbreakpoints.
These results suggest that readers in Experiment 5 were able toextract the perceptual structure of the activity as it happened on thebasis of just these simple transcripts. On what grounds could theymake this reconstruction? One obvious source of constraint isbackground knowledge about the activities involved. Another pos-sible source of information is the linguistic differences betweeninternal and boundary breakpoints uncovered in Experiment 1. Itmay be that readers of narrations, even highly simplified ones suchas these, are sensitive to the syntactic and semantic cues thatspeakers use to embed information about event structure withinrunning linear descriptions. It is possible that readers employ aversion of the hierarchical bias hypothesis to decode texts: Theyassume that the writer's cognitive representation is hierarchicallystructured and that the text reflects this in its syntactic and seman-tic structure. This heuristic then guides the formation of the read-er's cognitive representation of the described activity.
General Discussion
Hierarchical Structure
In our view, the principle significance of the results presentedhere is this: These data indicate that the same cognitive structuresthat have been hypothesized to guide story understanding, memoryfor events, planning for future activity, and understanding of one'sown past actions guide perception of ongoing activity as it hap-pens. We have described these cognitive structures as event sche-mata; they are closely related to plans, story grammars, and scripts.The data argue strongly for the hierarchical bias hypothesis: Ob-servers' perception of event structure is biased by the influence ofhierarchically organized schemata for recurring events.
In Experiment 1, we found that observers of everyday activitywere disposed to organize the activity in terms of partonomichierarchies. Participants were asked to segment everyday activitieswhile watching them. Each participant segmented each activitytwice, once under fine-unit and once under coarse-unit codinginstructions. Within individuals, the boundaries of the coarse unitstended to be closer to the boundaries of fine units than predicted bychance. This alignment effect was mediated by the familiarity ofthe activity and was more pronounced when participants describedthe activity while segmenting it than when they only performed the
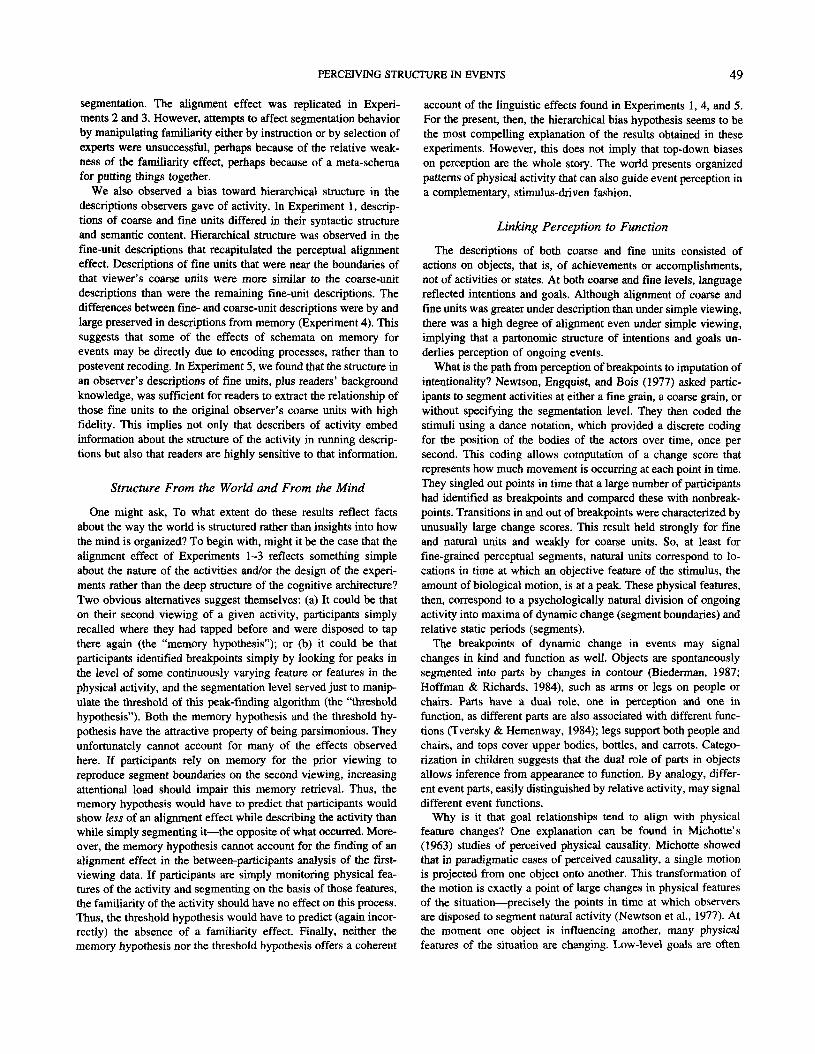
PERCEIVING STRUCTURE IN EVENTS 49
segmentation. The alignment effect was replicated in Experi-ments 2 and 3. However, attempts to affect segmentation behaviorby manipulating familiarity either by instruction or by selection ofexperts were unsuccessful, perhaps because of the relative weak-ness of the familiarity effect, perhaps because of a meta-schemafor putting things together.
We also observed a bias toward hierarchical structure in thedescriptions observers gave of activity. In Experiment 1, descrip-tions of coarse and fine units differed in their syntactic structureand semantic content. Hierarchical structure was observed in thefine-unit descriptions that recapitulated the perceptual alignmenteffect. Descriptions of fine units that were near the boundaries ofthat viewer's coarse units were more similar to the coarse-unitdescriptions than were the remaining fine-unit descriptions. Thedifferences between fine- and coarse-unit descriptions were by andlarge preserved in descriptions from memory (Experiment 4). Thissuggests that some of the effects of schemata on memory forevents may be directly due to encoding processes, rather than topostevent receding. In Experiment 5, we found that the structure inan observer's descriptions of fine units, plus readers' backgroundknowledge, was sufficient for readers to extract the relationship ofthose fine units to the original observer's coarse units with highfidelity. This implies not only that describers of activity embedinformation about the structure of the activity in running descrip-tions but also that readers are highly sensitive to that information.
Structure From the World and From the Mind
One might ask, To what extent do these results reflect factsabout the way the world is structured rather than insights into howthe mind is organized? To begin with, might it be the case that thealignment effect of Experiments 1-3 reflects something simpleabout the nature of the activities and/or the design of the experi-ments rather than the deep structure of the cognitive architecture?Two obvious alternatives suggest themselves: (a) It could be thaton their second viewing of a given activity, participants simplyrecalled where they had tapped before and were disposed to tapthere again (the "memory hypothesis"); or (b) it could be thatparticipants identified breakpoints simply by looking for peaks inthe level of some continuously varying feature or features in thephysical activity, and the segmentation level served just to manip-ulate the threshold of this peak-finding algorithm (the "thresholdhypothesis"). Both the memory hypothesis and the threshold hy-pothesis have the attractive property of being parsimonious. Theyunfortunately cannot account for many of the effects observedhere. If participants rely on memory for the prior viewing toreproduce segment boundaries on the second viewing, increasingattentional load should impair this memory retrieval. Thus, thememory hypothesis would have to predict that participants wouldshow less of an alignment effect while describing the activity thanwhile simply segmenting it—the opposite of what occurred. More-over, the memory hypothesis cannot account for the finding of analignment effect in the between-participants analysis of the first-viewing data. If participants are simply monitoring physical fea-tures of the activity and segmenting on the basis of those features,the familiarity of the activity should have no effect on this process.Thus, the threshold hypothesis would have to predict (again incor-rectly) the absence of a familiarity effect. Finally, neither thememory hypothesis nor the threshold hypothesis offers a coherent
account of the linguistic effects found in Experiments 1, 4, and 5.For the present, then, the hierarchical bias hypothesis seems to bethe most compelling explanation of the results obtained in theseexperiments. However, this does not imply that top-down biaseson perception are the whole story. The world presents organizedpatterns of physical activity that can also guide event perception ina complementary, stimulus-driven fashion.
Linking Perception to Function
The descriptions of both coarse and fine units consisted ofactions on objects, that is, of achievements or accomplishments,not of activities or states. At both coarse and fine levels, languagereflected intentions and goals. Although alignment of coarse andfine units was greater under description than under simple viewing,there was a high degree of alignment even under simple viewing,implying that a partonomic structure of intentions and goals un-derlies perception of ongoing events.
What is the path from perception of breakpoints to imputation ofintentionality? Newtson, Engquist, and Bois (1977) asked partic-ipants to segment activities at either a fine grain, a coarse grain, orwithout specifying the segmentation level. They then coded thestimuli using a dance notation, which provided a discrete codingfor the position of the bodies of the actors over time, once persecond. This coding allows computation of a change score thatrepresents how much movement is occurring at each point in time.They singled out points in time that a large number of participantshad identified as breakpoints and compared these with nonbreak-points. Transitions in and out of breakpoints were characterized byunusually large change scores. This result held strongly for fineand natural units and weakly for coarse units. So, at least forfine-grained perceptual segments, natural units correspond to lo-cations in time at which an objective feature of the stimulus, theamount of biological motion, is at a peak. These physical features,then, correspond to a psychologically natural division of ongoingactivity into maxima of dynamic change (segment boundaries) andrelative static periods (segments).
The breakpoints of dynamic change in events may signalchanges in kind and function as well. Objects are spontaneouslysegmented into parts by changes in contour (Biederman, 1987;Hoffman & Richards, 1984), such as arms or legs on people orchairs. Parts have a dual role, one in perception and one infunction, as different parts are also associated with different func-tions (Tversky & Hemenway, 1984); legs support both people andchairs, and tops cover upper bodies, bottles, and carrots. Catego-rization in children suggests that the dual role of parts in objectsallows inference from appearance to function. By analogy, differ-ent event parts, easily distinguished by relative activity, may signaldifferent event functions.
Why is it that goal relationships tend to align with physicalfeature changes? One explanation can be found in Michotte's(1963) studies of perceived physical causality. Michotte showedthat in paradigmatic cases of perceived causality, a single motionis projected from one object onto another. This transformation ofthe motion is exactly a point of large changes in physical featuresof the situation—precisely the points in time at which observersare disposed to segment natural activity (Newtson et al., 1977). Atthe moment one object is influencing another, many physicalfeatures of the situation are changing. Low-level goals are often
50 ZACKS, TVERSKY, AND IYER
satisfied or blocked by physical interactions between objects.Another source of empirical evidence for the convergence ofstructural and functional information comes from a study of mem-ory of television stories. Van den Broek and his colleagues foundthat the position in the hierarchical goal structure of a storypredicts rates of recall (van den Broek et al., 1996). This tendencyincreased from childhood to adulthood. Moreover, they found thathierarchical position of an event unit correlates with the number ofcausal connections to and from it and with its likelihood of beingembedded in a causal chain. On the basis of regression analyses,the authors argued that causal connectedness for the most partdrives the other effects.
Thus, moments at which goals are satisfied or blocked tend to bemoments at which objects are interacting causally, and thosemoments are the ones during which the most physical features arechanging. Bottom-up, perceptually driven information about thephysical features of the activity correlates with top-down, concep-tually driven information about goals, plans, and causation. Anorganism can become sensitive to these correlations through bothevolution and learning. Schemata for events are precisely a distil-lation of these patterns of redundancy that allow the observer to fillin missing information and make inferences on a given viewing ofa particular activity (Zacks & Tversky, 2001).
Qualitative Differences Between Coarse and Fine Units
Descriptions of coarse and fine units differed qualitatively. Forthe activities examined here, coarse-unit descriptions tended toprecisely specify a set of objects with which the actor interactedbut to leave vague what the particular interactions were. On theother hand, fine-unit descriptions specified the objects vaguely butwere relatively precise in specifying the actions performed onthem. It remains to be seen how well this pattern generalizes toother kinds of activity. It may reflect a general principle thatcoarse-grained actions are distinguished by the objects (or majorparts of objects, as in assembling a saxophone) they involvebecause these correlate well with the goals of the actor(s). Thisprinciple would account for the finding that object-action relation-ships emerge early, along with a focus on actors' intentions (Melt-zoff & Moore, 1995; Woodward, 1998; Woodward & Sommer-ville, 2000). Put another way, coarse units are punctuated byobjects (and by implication, actions), and fine units are punctuatedby refined actions on the same object.
These experiments have focused deliberately on everyday, goal-directed activities that include one actor and a set of objects.Within that domain, the stimuli used here sampled both familiarand unfamiliar activities, and these effects seem to hold for both.What about activities where there is no tightly specified goal?Attending a fair or playing at the beach come to mind. However,even entertainment activities such as these appear to contain pock-ets of goal-directed activity (winning the ring-toss, retrieving thefrisbee from the water). It may be harder than it seems to find trulygoal-free activity involving animate agents. If such activities canbe identified, it would be interesting to ask whether the mecha-nisms described here still apply. A goal-based event schema maysimply fail for such activity, or the perceptual mechanism may beconstructed such that it imputes goals where none objectivelyexist.
What about activities where there are multiple actors withdifferent goals or one actor with multiple goals? Intuitively, if thegoal structure corresponding to one actor can be described as astrict hierarchy (i.e., a tree), then the goal structure for a dyad orgroup of actors presumably corresponds to a more complex familyof directed graphs. One possibility is that different event units areidentified depending on the actor who forms the focus of inten-tions, and for any given focus, a strict tree is formed. The differenthierarchies would then share nodes up to some level of description,generating a MultiTree (Furnas & Zacks, 1994). Or it may be thatobservers track the goals of multiple actors in parallel, generatingmore complex structures to describe the relations among eventunits. Different classes of structure may be diagnostic of cooper-ation, competition, and independence. Explorations of the phaserelationships between event segments in multiple-actor activitiesare suggestive in this regard (Newtson et al., 1987). Similar issuesarise when one person performs multiple activities simultaneouslyor one activity that satisfies multiple goals. In these cases, activityinvolving only one actor requires representational systems morecomplex than simple hierarchies. Thus, activities with multipleactors or multiple goals may be more complex than those studiedhere but do not seem to differ in principle.
An important related question is whether people apply themechanisms observed here to activities in which there are noanimate agents. It may be that when humans observe events suchas waves washing on a beach, a volcano erupting, or a rock rollingdown a hillside, they apply the same event perception tools that areapplied to animate agents, resulting in a perceptual "intentionalstance" (Dennett, 1987).
An Object/Action Account of Event Structure Perception
With this analysis in mind, we return to the object/action ac-count of event structure perception first presented in discussingExperiment 1. Common events are segmented into a partonomichierarchy, punctuated by objects or major object parts (and con-comitant actions) at a higher level and by refined actions on thesame object at a lower level. Descriptions of segments, bothsimultaneous and retrospective, indicate that different objects areassociated with different higher level functions or goals, whereasdifferent actions on the same object are associated with morerefined functions or goals. It is intriguing that object/action unitsmay serve a pivotal role in event segmentation. In his insightfulexegesis of the art of comics, McCloud (1993) recorded the fre-quencies of different types of transitions from one frame to anotherin a sample of the work of 22 well-known American, European,and Japanese comic artists. For each, the most frequent changefrom one frame to the next was action-to-action. Second in fre-quency was a change in subject, followed by a change of scene.McCloud did not examine changes in object. Notably, moment-to-moment, within-action changes were extremely rare.
Research on animals, infants, and children indicates a privilegedstatus for interactions on objects in developing an understanding ofevents. Byrne (1999, in press) has proposed that underlying exe-cution, and especially imitation, of behavior is comprehension ofthe hierarchical organization of behavior. However, he argued thatcomprehension of events rests on detecting recurring statisticalpatterns of units of behavior, rather than on their content. Forexample, elements within a module are more tightly bound to-
PERCEIVING STRUCTURE IN EVENTS 51
gether than elements between modules. They may appear as a unitin different activities, and they are less likely to be interrupted.Byrne argued that because of these statistical regularities in be-havior, hierarchical structure of events may be extracted withoutimputation of causality or intentionality. This analysis shares re-liance on statistical properties of the input with the proposals ofAvrahami and Kareev (1994) about events, with those of Saffranand her colleagues (Saffran, Aslin, & Newport, 1996; Saffran,Newport, & Aslin, 1996; Saffran et al., 1997) on language, andwith those of Rosch (1978) about the role of correlated features inobject categories.
However, the actual case studies on animals, from black rats togorillas, suggest that event segmentation has more to go on thanjust the statistical properties of event units. Qualitative as well asquantitative information is available and seems to be influential.Specifically, the case studies implicate objects or major parts ofobjects, whether nests or food or tools or other animals, as criticaldeterminants of the junctures between segments and of the hier-archical structure as well. This view has been corroborated bylaboratory studies of interactions with artificial fruits by chimpan-zees and preschool children (Whiten, in press; Whiten & Custance,1996). Careful comparisons have shown that children are espe-cially sensitive to the hierarchical structure of events independentof sequential structure. Importantly, the correspondence of eventsegments with actions on objects seems to allow inferences, per-haps rudimentary, of intentionality. Thus, the structure withinevents complements interevent statistical relationships as a basisfor event comprehension.
Infants, too, appear to use objects to delineate events. Wood-ward (1998) trained 9-month-old babies to look at a simple eventconsisting of an action directed toward an object. In later tests,infants looked longer when the object was switched than when theaction was changed. Further research indicated that by 1 year ofage, infants are predisposed to interpret actions on objects asgoal-directed (Woodward & Sommerville, 2000). That compre-hension of events is affected more by presumed goals than bydetails of actions is supported by research on imitation in neonatesand children. Neonates modulated their own behavior, bringing itcloser to the adult model that instigated it (Meltzoff & Moore,1995). Children as young as 18 months successfully achieved agoal even after watching varying actions on objects that failed toachieve it (Meltzoff, 1995).
These findings and others have led Baldwin and Baird (1999) toargue that action analysis is central to inferring intentions and thatthe links between action and intention are especially strong atnatural breakpoints. Congruent with the position we put forth here,Baldwin and Baird maintained that objects are integral to compre-hending actions and vice versa. Our work suggests that neitherobject nor action alone is sufficient for understanding events.Whether a sheet is folded or spread, whether an apple is eaten orthrown away, whether a book is opened or packed is critical tointerpretation of the event. Similarly, whether a letter or a sheet isfolded, whether an apple or a pill is ingested, whether a book or adrawer is opened changes the meaning of the activity. It is theinteraction, the conjunction of object with action, their correlateduse in behavior, all readily apparent in perception, that enableinterpretations of events as goal-directed, purposeful, intentional.
Multiple Constraints on Event Understanding
In sum, the mind has access to a number of sources of infor-mation about structure in activity. Further, different kinds ofinformation are correlated. Goal-directed activity reflects the goalsof actors and the constrained relationships of recurring activities. Ittends to be hierarchical because goals tend to be satisfied by therecursive satisfaction of subgoals. The goal structure of activityaligns with its physical structure because the satisfaction of goalstends to give rise to distinctive physical characteristics, particularlyin the relationship of actors to objects. The distinctive physicalfeatures of causal interactions may mediate this relationship. Lan-guage in general tends to capture the features whose changes markboundaries in activity. Information from each of these domainsimposes constraints on the others.
People simultaneously keep track of physical changes, goals andplans, causes and effects, and actions and objects. It is tempting totry to explain human understanding of events in terms of one ofthese set of features. However, the fact that each of them tellssomething about the others has two consequences. First, it makestractable the problem of following what is happening in a complexdynamic world. Second, it means that an account of event under-standing must include multiple sources of information—and theirconnections.
References
Abbott, V., Black, J. H., & Smith, E. E. (1985). The representation ofscripts in memory. Journal of Memory and Language, 24, 179-199.
Abelson, R. P. (1981). Psychological status of the script concept. AmericanPsychologist, 36, 715-729.
Anderson, S. J., & Conway, M. A. (1993). Investigating the structure ofautobiographical memories. Journal of Experimental Psychology:Learning, Memory, and Cognition, 19, 1178—1196.
Avrahami, J., & Kareev, Y. (1994). The emergence of events. Cogni-tion, 53, 239-261.
Baldwin, D. A., & Baird, J. A. (1999). Action analysis: A gateway tointentional inference. In P. Rochat (Ed.), Early social cognition (pp.215-240). Hillsdale, NJ: Erlbaum.
Barsalou, L. W. (1988). The content and organization of autobiographicalmemories. In U. Neisser & E. Winograd (Eds.), Remembering recon-sidered: Ecological and traditional approaches to the study of memory(pp. 193-243). Cambridge, England: Cambridge University Press.
Bartlett, F. C. (1932). Remembering: A study in experimental and socialpsychology. New York: Macmillan.
Bauer, P. J., & Mandler, J. M. (1989). One thing follows another: Effectsof temporal structure on 1- to 2-year-olds' recall of events. Develop-mental Psychology, 25, 197-206.
Biederman, I. (1987). Recognition-by-components: A theory of humanimage understanding. Psychological Review, 94, 115-117.
Boltz, M. (1992). Temporal accent structure and the remembering offilmed narratives. Journal of Experimental Psychology: Human Percep-tion and Performance, 18, 90-105.
Boltz, M. G. (1995). Effects of event structure on retrospective durationjudgments. Perception and Psychophysics, 57, 1080-1096.
Bower, G. (1982). Plans and goals in understanding episodes. In A.Hammer & W. Kintsch (Eds.), Discourse processing (pp. 2-15). Am-sterdam: North-Holland.
Bower, G. H., Black, J. B., & Turner, T. J. (1979). Scripts in memory fortext. Cognitive Psychology, 11, 177-220.
Brewer, W. p., & Dupree, D. A. (1983). Use of plan schemata in the recalland recognition of goal-directed actions. Journal of Experimental Psy-chology: Learning, Memory, and Cognition, 9, 117-129.
52 ZACKS, TVERSKY, AND IYER
Byrne, R. W. (1999). Imitation without intentionality. Using string parsingto copy the organization of behavior. Animal Cognition, 2, 63-72.
Byrne, R. W. (in press). Seeing actions as hierarchically organized struc-tures: Great dpe manual skills. In A. Meltzoff & W. Prinz (Eds.), Theimitative mind: Evolution, development, and brain bases. Cambridge,England: Cambridge University Press.
Casati, R., & Varzi, A. C. (1996). Events. Aldershot, England: Dartmouth.Clark, H. H. (1996). Using language. Cambridge, England: Cambridge
University Press.Cohen, C. E., & Ebbesen, E. B. (1979). Observational goals and schema
activation: A theoretical framework for behavior perception. Journal ofExperimental Social Psychology, 15, 305-329.
Cohen, J. D., MacWhinney, B., Flatt, M., & Provost, J. (1993). Psy-Scope: An interactive graphic system for designing and controllingexperiments in the psychology laboratory using Macintosh comput-ers. Behavior Research Methods, Instruments, and Computers, 25,257-271.
Dennett, D. C. (1987). The intentional stance. Cambridge, MA: MITPress.
Ebbesen, E. B. (1980). Cognitive processes in understanding ongoingbehavior. In E. A. Reid Hastie (Ed.), Person memory: The cognitivebasis of social perception (pp. 179-225). Hillsdale, NJ: Erlbaum.
Fellbaum, C. (1998). WordNet: An electronic lexical database. Cambridge,MA: MIT Press.
Foss, C. L., & Bower, G. H. (1986). Understanding actions in relation togoals. In N. E. Sharkey (Ed.), Advances in cognitive science (Vol. I, pp.94-124). Chichester, England: Ellis Horwood.
Franklin, N., & Bower, G. H. (1988). Retrieving actions from goal hier-archies. Bulletin of the Psychonomic Society, 26, 15-18.
Furnas, G. W., & Zacks, J. (1994). Multitrees: Enriching and reusinghierarchical structure. In B. Adelson, S. Dumais, & J. Olson (Eds.),Human factors in computing systems: CHI '94 conference proceedings(pp. 330-336). Boston: Association for Computing Machinery.
Galambos, J. A. (1983). Normative studies of six characteristics of ourknowledge of common activities. Behavior Research Methods, Instru-ments, and Computers, 15, 327-340.
Goldberg, A. (1995). Constructions: A construction grammar approach toargument structure. Chicago: University of Chicago Press.
Hoffman, D. D., & Richards, W. A. (1984). Parts of recognition. Cogni-tion, 18, 65-96.
Hudson, J. A. (1988). Children's memory for atypical actions in script-based stories: Evidence for a disruption effect. Journal of ExperimentalChild Psychology, 46, 159-173.
Kieras, D. E. (1988). What mental model should be taught: Choosinginstructional content for complex engineered systems. In J. Psotka, L. D.Massey, & S. A. Mutter (Eds.), Intelligent tutoring systems: Lessonslearned (pp. 85-111). Hillsdale, NJ: Erlbaum.
Levin, B. (1993). English verb classes and alternations: A preliminaryinvestigation. Chicago: University of Chicago Press.
Lichtenstein, E. D., & Brewer, W. F. (1980). Memory for goal-directedevents. Cognitive Psychology, 12, 412-445.
Mandler, J. M., & Johnson, N. S. (1977). Remembrance of things parsed:Story structure and recall. Cognitive Psychology, 9, 111-151.
Massad, C. M., Michael, H., & Newtson, D. (1979). Selective percep-tion of events. Journal of Experimental Social Psychology, 15, 513—532.
McCloud, S. (1993). Understanding comics: The invisible an. Northamp-ton, MA: Kitchen Sink Press.
Meltzoff, A. N. (1995). Understanding the intentions of others: Re-enactment of intended acts by 18-month-old children. DevelopmentalPsychology, 31, 838-850.
Meltzoff, A. N., & Moore, M. K. (1995). Infants' understanding of peopleand things: From body imitation to folk psychology. In J. L. Bermudez,
A. J. Marcel, & N. Eilan (Eds.), The body and the self (pp. 43-69).Cambridge, MA: MIT Press.
Michotte, A. E. (1963). The perception of causality. New York: BasicBooks.
Moens, M., & Steedman, M. (1988). Temporal ontology and temporalreference. Computational Linguistics, 14, 15-28.
Narayanan, S. (1997). Talking the talk is like walking the walk: A com-putational model of verbal aspect. In M. G. Shafto & P. Langley (Eds.),19th Annual Meeting of the Cognitive Science Society (pp. 548-553).Stanford, CA: Ablex.
Nelson, K., & Gruendel, J. (1986). Children's scripts. In K. Nelson (Ed.),Event knowledge: Structure and function in development (pp. 21-46).Hillsdale, NJ: Erlbaum.
Newell, A., & Simon, H. A. (1972). Human problem solving. EnglewoodCliffs, NJ: Prentice Hall.
Newtson, D. (1973). Attribution and the unit of perception of ongo-ing behavior. Journal of Personality and Social Psychology, 28,28-38.
Newtson, D. (1993). The dynamics of action and interaction. In L. B. Smith& E. Thelen (Eds.), A dynamic systems approach to development:Applications (pp. 241-264). Cambridge, MA: MIT Press.
Newtson, D., & Engquist, G. (1976). The perceptual organization ofongoing behavior. Journal of Experimental Social Psychology, 12, 436-450.
Newtson, D., Engquist, G., & Bois, J. (1977). The objective basis ofbehavior units. Journal of Personality and Social Psychology, 35, 847-862.
Newtson, D., Hairfield, J., Bloomingdale, J., & Cutino, S. (1987). Thestructure of action and interaction. Social Cognition, 5, 191-237.
Pustejovsky, J. (1991). The syntax of event structure. Cognition, 41,47-81.
Rosch, E. (1978). Principles of categorization. In E. Rosch & B. Lloyd(Eds.), Cognition and categorization (pp. 27-48). Hillsdale, NJ: Erl-baum.
Rumelhart, D. E. (1975). Notes on a schema for stories. In D. G. Bobrow& A. Collins (Eds.), Representation and understanding: Studies incognitive science (pp. 211—236). New York: Academic Press.
Rumelhart, D. E. (1977). Understanding and summarizing brief stories. InD. Laberge & S. J. Samuels (Eds.), Basic processes in reading: Percep-tion and comprehension (pp. 265-303). Hillsdale, NJ: Erlbaum.
Saffran, J. R., Aslin, R. N., & Newport, E. L. (1996, December 13).Statistical learning by 8-month-old infants. Science, 274, 1926-1928.
Saffran, J. R., Newport, E. L., & Aslin, R. N. (1996). Word segmentation:The role of distributional cues. Journal of Memory and Language, 35,606-621.
Saffran, J. R., Newport, E. L., Aslin, R. N., Tunick, R. A., & Barrueco, S.(1997). Incidental language learning: Listening (and learning) out of thecorner of your ear. Psychological Science, 8, 101-105.
Schank, R. C., & Abelson, R. P. (1977). Scripts, plans, goals, and under-standing: An inquiry into human knowledge structures. Hillsdale, NJ:Erlbaum.
Talmy, L. (1975). Semantics and syntax of motion. In J. P. Kimball (Ed.),Syntax and semantics (Vol. 4, pp. 181-238). New York: AcademicPress.
Thorndyke, P. W. (1977). Cognitive structures in comprehension andmemory of narrative discourse. Cognitive Psychology, 9, 77-110.
Trabasso, T., & Stein, N. L. (1994). Using goal-plan knowledge to mergethe past with the present and the future in narrating events on line. In M.Haith (Ed.), The development of future-oriented processes (pp. 323—349). Chicago: University of Chicago Press.
Travis, L. L. (1997). Goal-based organization of event memory in toddlers.In P. W. v. d. Broek, P. J. Bauer, & T. Bovig (Eds.), Developmental

PERCEIVING STRUCTURE IN EVENTS 53
spans in event comprehension and representation: Bridging fictionaland actual events (pp. 111-138). Mahwah, NJ: Erlbaum.
Tversky, B., & Hemenway, K. (1984). Objects, parts, and cate-gories. Journal of Experimental Psychology: General, 113, 169-193.
Vallacher, R. R., & Wegner, D. M. (1987). What do people think they'redoing? Action identification and human behavior. Psychological Re-view, 94, 3-15.
van den Broek, P., Lorch, E. P., & Thurlow, R. (1996). Children's andadults' memory for television stories: The role of causal factors, story-grammar categories, and hierarchical level. Child Development, 67,3010-3028.
Whiten, A. (in press). The imitator's representation of the imitated: Apeand child. In A. Meltzoff & W. Prinz (Eds.), The imitative mind:Evolution, development, and brain bases.
Whiten, A., & Custance, D. (1996). Studies of imitation in chimpanzees andchildren. In C. M. Heyes & B. G. Galef (Eds.), Social learning in animals:The roots of culture (pp. 291-318). San Diego, CA: Academic Press.
Woodward, A. L. (1998). Infants selectively encode the goal object of anactor's reach. Cognition, 69, 1-34.
Woodward, A. L., & Sommerville, J. A. (2000). Twelve-month infantsinterpret action in context. Psychological Science, 11, 73-77.
Zacks, J., & Tversky, B. (2001). Event structure in perception and cogni-tion. Psychological Bulletin, 127, 3-21.
Appendix A
Norms for Everyday Activities
As a precursor to preparing stimuli for the event segmentation experi-ments, we collected norms for a collection of 45 activities. We selectedactivities to be goal-directed, to involve one actor, and to involve interac-tions with objects. We also selected activities that could reasonably makeup part of daily life for our target research participants (college undergrad-uates in the United States), that were short, and that could be reasonablyvideotaped. Each was rated for familiarity, for knowledge of the stepsinvolved, and for frequency of performance.
Method
Beginning with a list of activities from a set of norms collected byGalambos (1983), we generated a list of 45 activities that satisfied severalcriteria. The activities were all goal-directed, performed by a single person,and involved interactions with objects. We attempted to select activitiesthat could reasonably occur on a given day for our target participantpopulation, were relatively short, and could be reasonably videotaped.
The sampled activities were assembled into questionnaires that askedone of three questions about each of the 45 activities. The questions(following Galambos, 1982) were:
How familiar are you with each of the following activities? [HowFamiliar]
How frequently ,do you do each of the following activities? [HowFrequent]
How well do you know the steps in each of the following activities?[Know Steps]
Each questionnaire contained one of these questions, followed by a 1-9scale and instructions on how to use it, followed by the 45 activities,
listed in random order. For each question, two different random orderswere generated, giving six different questionnaires.
Booklets were printed on 8.5" X 11" paper. Equal numbers of the sixforms were assembled into booklets with other questionnaires and distrib-uted to students in an introductory psychology class at Stanford University.Students participated in the study in partial fulfillment of a course require-ment.
Results
Of the "How Familiar" questionnaires, 33 were returned; of the "HowFrequent" questionnaires, 37 were returned; and of the "Know Steps"questionnaires, 35 were returned. Respondents occasionally failed toanswer one or more of the questions; for each question, at most 2participants failed to respond for any of the activities queried. Ratingsfor the 3 questions were highly correlated, as can be seen in Table Al.The full results of the norms (Tables A2, A3, and A4) follow.
Table AlCorrelations Between Mean Ratings for Familiarity,Frequency of Performance, and Knowledge of Stepsof 45 Everyday Activities
Question How frequent Know steps
How familiarHow frequent
.85 .96.85
(Appendix continues)
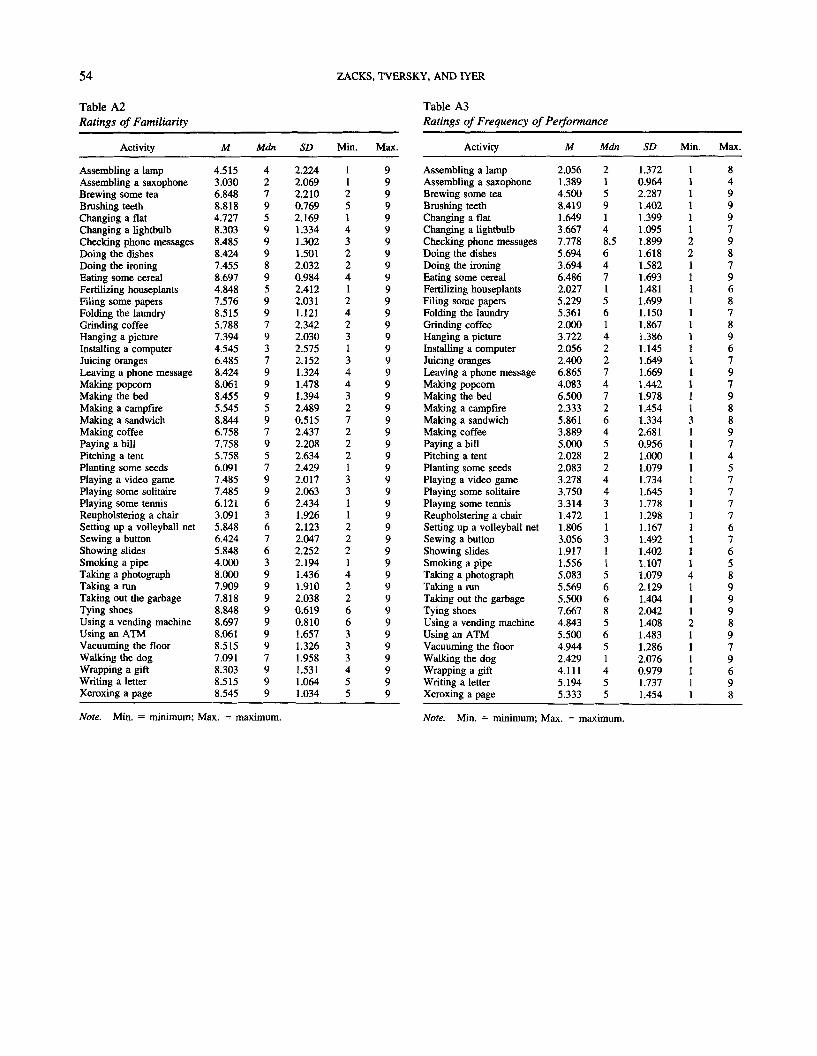
54 ZACKS, TVERSKY, AND IYER
Table A2Ratings of Familiarity
Table A3Ratings of Frequency of Performance
Activity
Assembling a lampAssembling a saxophoneBrewing some teaBrushing teethChanging a flatChanging a lightbulbChecking phone messagesDoing the dishesDoing the ironingEating some cerealFertilizing houseplantsFiling some papersFolding the laundryGrinding coffeeHanging a pictureInstalling a computerJuicing orangesLeaving a phone messageMaking popcornMaking the bedMaking a campfireMaking a sandwichMaking coffeePaying a billPitching a tentPlanting some seedsPlaying a video gamePlaying some solitairePlaying some tennisReupholstering a chairSetting up a volleyball netSewing a buttonShowing slidesSmoking a pipeTaking a photographTaking a runTaking out the garbageTying shoesUsing a vending machineUsing an ATMVacuuming the floorWalking the dogWrapping a giftWriting a letterXeroxing a page
M
4.5153.0306.8488.8184.7278.3038.4858.4247.4558.6974.8487.5768.5155.7887.3944.5456.4858.4248.0618.4555.5458.8446.7587.7585.7586.0917.4857.4856.1213.0915.8486.4245.8484.0008.0007.9097.8188.8488.6978.0618.5157.0918.3038.5158.545
Mdn
427959998959979379995979579963676399999997999
SD
2.2242.0692.2100.7692.1691.3341.3021.5012.0320.9842.4122.0311.1212.3422.0302.5752.1521.3241.4781.3942.4890.5152.4372.2082.6342.4292.0172.0632.4341.9262.1232.0472.2522.1941.4361.9102.0380.6190.8101.6571.3261.9581.5311.0641.034
Min.
112514322412423134432722213311222142266333455
Max.
999999999999999999999999999999999999999999999
Activity
Assembling a lampAssembling a saxophoneBrewing some teaBrushing teethChanging a flatChanging a lightbulbChecking phone messagesDoing the dishesDoing the ironingEating some cerealFertilizing houseplantsFiling some papersFolding the laundryGrinding coffeeHanging a pictureInstalling a computerJuicing orangesLeaving a phone messageMaking popcornMaking the bedMaking a campfireMaking a sandwichMaking coffeePaying a billPitching a tentPlanting some seedsPlaying a video gamePlaying some solitairePlaying some tennisReupholstering a chairSetting up a volleyball netSewing a buttonShowing slidesSmoking a pipeTaking a photographTaking a runTaking out the garbageTying shoesUsing a vending machineUsing an ATMVacuuming the floorWalking the dogWrapping a giftWriting a letterXeroxing a page
M
2.0561.3894.5008.4191.6493.6677.7785.6943.6946.4862.0275.2295.3612.0003.7222.0562.4006.8654.0836.5002.3335.8613.8895.0002.0282.0833.2783.7503.3141.4721.8063.0561.9171.5565.0835.5695.5007.6674.8435.5004.9442.4294.1115.1945.333
Mdn
2159148.564715614227472645224431131156685651455
SD
1.3720.9642.2871.4021.3991.0951.8991.6181.5821.6931.4811.6991.1501.8671.3861.1451.6491.6691.4421.9781.4541.3342.6810.9561.0001.0791.7341.6451.7781.2981.1671.4921.4021.1071.0792.1291.4042.0421.4081.4831.2862.0760.9791.7371.454
Min.
111111221111111111111311111111111141112111111
Max.
849997987968789679798897457777676589998979698
Wote. Min. = minimum; Max. = maximum. Note. Min. = minimum; Max. = maximum.
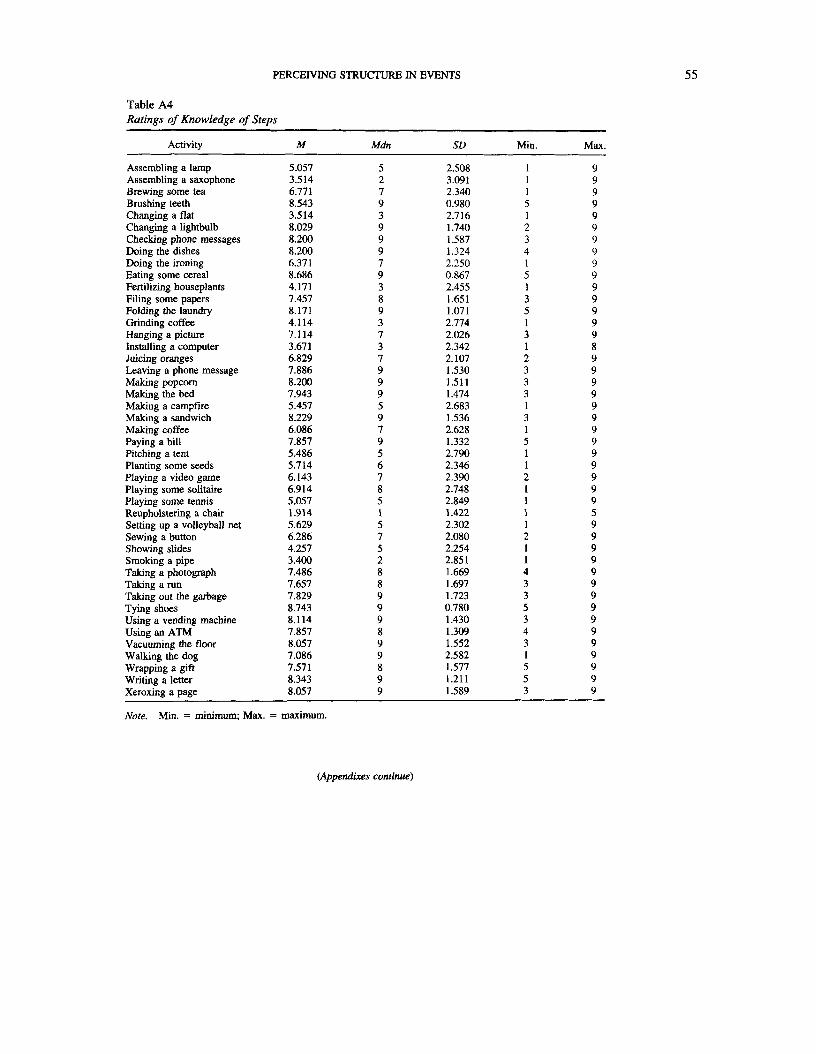
PERCEIVING STRUCTURE IN EVENTS 55
Table A4Ratings of Knowledge of Steps
Activity
Assembling a lampAssembling a saxophoneBrewing some teaBrushing teethChanging a flatChanging a lightbulbChecking phone messagesDoing the dishesDoing the ironingEating some cerealFertilizing houseplantsFiling some papersFolding the laundryGrinding coffeeHanging a pictureInstalling a computerJuicing orangesLeaving a phone messageMaking popcornMaking the bedMaking a campfireMaking a sandwichMaking coffeePaying a billPitching a tentPlanting some seedsPlaying a video gamePlaying some solitairePlaying some tennisReupholstering a chairSetting up a volleyball netSewing a buttonShowing slidesSmoking a pipeTaking a photographTaking a runTaking out the garbageTying shoesUsing a vending machineUsing an ATMVacuuming the floorWalking the dogWrapping a giftWriting a letterXeroxing a page
M
5.0573.5146.7718.5433.5148.0298.2008.2006.3718.6864.1717.4578.1714.1147.1143.6716.8297.8868.2007.9435.4578.2296.0867.8575.4865.7146.1436.9145.0571.9145.6296.2864.2573.4007.4867.6577.8298.7438.1147.8578.0577.0867.5718.3438.057
Mdn
527939997938937379995979567851575288999899899
SD
2.5083.0912.3400.9802.7161.7401.5871.3242.2500.8672.4551.6511.0712.7742.0262.3422.1071.5301.5111.4742.6831.5362.6281.3322.7902.3462.3902.7482.8491.4222.3022.0802.2542.851
.669
.697
.7230.780
.430
.3091.5522.5821.5771.2111.589
Min.
111512341513513123331315112111121143353431553
Max.
999999999999999899999999999995999999999999999
. Min. = minimum; Max. = maximum.
(Appendixes continue)
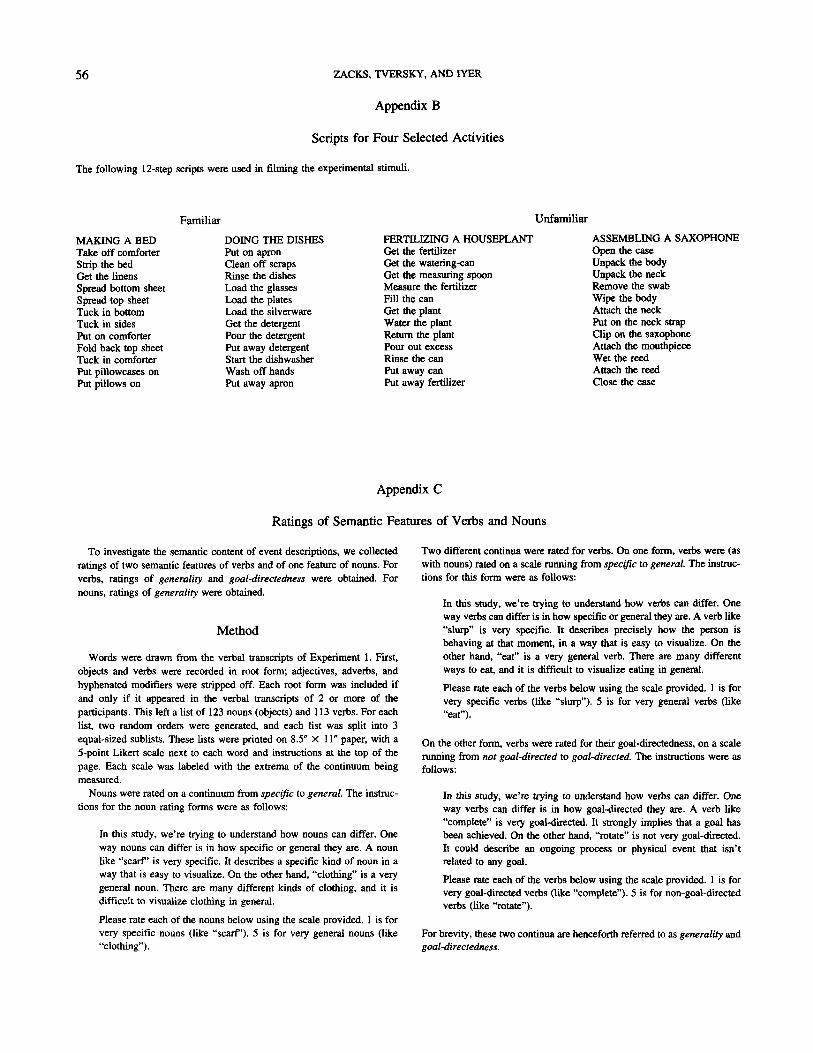
56 ZACKS, TVERSKY, AND IYER
Appendix B
Scripts for Four Selected Activities
The following 12-step scripts were used in filming the experimental stimuli.
Familiar Unfamiliar
MAKING A BEDTake off comforterStrip the bedGet the linensSpread bottom sheetSpread top sheetTuck in bottomTuck in sidesPut on comforterFold back top sheetTuck in comforterPut pillowcases onPut pillows on
DOING THE DISHESPut on apronClean off scrapsRinse the dishesLoad the glassesLoad the platesLoad the silverwareGet the detergentPour the detergentPut away detergentStart the dishwasherWash off handsPut away apron
FERTILIZING A HOUSEPLANTGet the fertilizerGet the watering-canGet the measuring spoonMeasure the fertilizerFill the canGet the plantWater the plantReturn the plantPour out excessRinse the canPut away canPut away fertilizer
ASSEMBLING A SAXOPHONEOpen the caseUnpack the bodyUnpack the neckRemove the swabWipe the bodyAttach the neckPut on the neck strapClip on the saxophoneAttach the mouthpieceWet the reedAttach the reedClose the case
Appendix C
Ratings of Semantic Features of Verbs and Nouns
To investigate the semantic content of event descriptions, we collectedratings of two semantic features of verbs and of one feature of nouns. Forverbs, ratings of generality and goal-directedness were obtained. Fornouns, ratings of generality were obtained.
Method
Words were drawn from the verbal transcripts of Experiment 1. First,objects and verbs were recorded in root form; adjectives, adverbs, andhyphenated modifiers were stripped off. Each root form was included ifand only if it appeared in the verbal transcripts of 2 or more of theparticipants. This left a list of 123 nouns (objects) and 113 verbs. For eachlist, two random orders were generated, and each list was split into 3equal-sized sublists. These lists were printed on 8.5" X 11" paper, with a5-point Likert scale next to each word and instructions at the top of thepage. Each scale was labeled with the extrema of the continuum beingmeasured.
Nouns were rated on a continuum from specific to general. The instruc-tions for the noun rating forms were as follows:
In this study, we're trying to understand how nouns can differ. Oneway nouns can differ is in how specific or general they are. A nounlike "scarf" is very specific. It describes a specific kind of noun in away that is easy to visualize. On the other hand, "clothing" is a verygeneral noun. There are many different kinds of clothing, and it isdifficult to visualize clothing in general.
Please rate each of the nouns below using the scale provided. 1 is forvery specific nouns (like "scarf"). 5 is for very general nouns (like"clothing").
Two different continua were rated for verbs. On one form, verbs were (aswith nouns) rated on a scale running from specific to general. The instruc-tions for this form were as follows:
In this study, we're trying to understand how verbs can differ. Oneway verbs can differ is in how specific or general they are. A verb like"slurp" is very specific. It describes precisely how the person isbehaving at that moment, in a way that is easy to visualize. On theother hand, "eat" is a very general verb. There are many differentways to eat, and it is difficult to visualize eating in general.
Please rate each of the verbs below using the scale provided. 1 is forvery specific verbs (like "slurp"). 5 is for very general verbs (like"eat").
On the other form, verbs were rated for their goal-directedness, on a scalerunning from not goal-directed to goal-directed. The instructions were asfollows:
In this study, we're trying to understand how verbs can differ. Oneway verbs can differ is in how goal-directed they are. A verb like"complete" is very goal-directed. It strongly implies that a goal hasbeen achieved. On the other hand, "rotate" is not very goal-directed.It could describe an ongoing process or physical event that isn'trelated to any goal.
Please rate each of the verbs below using the scale provided. 1 is forvery goal-directed verbs (like "complete"). 5 is for non-goal-directedverbs (like "rotate").
For brevity, these two continua are henceforth referred to as generality andgoal-directedness.
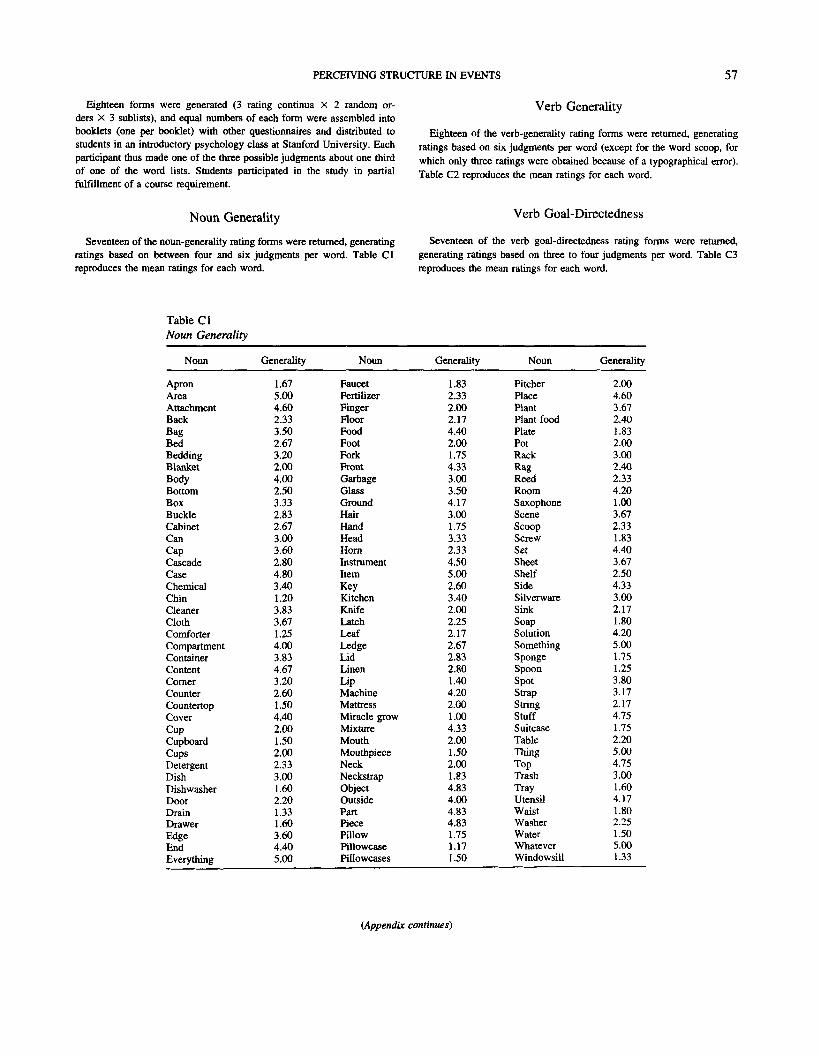
PERCEIVING STRUCTURE IN EVENTS 57
Eighteen forms were generated (3 rating continue X 2 random or-ders X 3 sublists), and equal numbers of each form were assembled intobooklets (one per booklet) with other questionnaires and distributed tostudents in an introductory psychology class at Stanford University. Eachparticipant thus made one of the three possible judgments about one thirdof one of the word lists. Students participated in the study in partialfulfillment of a course requirement.
Noun Generality
Seventeen of the noun-generality rating forms were returned, generatingratings based on between four and six judgments per word. Table Clreproduces the mean ratings for each word.
Verb Generality
Eighteen of the verb-generality rating forms were returned, generatingratings based on six judgments per word (except for the word scoop, forwhich only three ratings were obtained because of a typographical error).Table C2 reproduces the mean ratings for each word.
Verb Goal-Directedness
Seventeen of the verb goal-directedness rating forms were returned,generating ratings based on three to four judgments per word. Table C3reproduces the mean ratings for each word.
Table ClNoun Generality
Noun
ApronAreaAttachmentBackBagBedBeddingBlanketBodyBottomBoxBuckleCabinetCanCapCascadeCaseChemicalChinCleanerClothComforterCompartmentContainerContentCornerCounterCountertopCoverCupCupboardCupsDetergentDishDishwasherDoorDrainDrawerEdgeEndEverything
Generality
1.675.004.602.333.502.673.202.004.002.503.332.832.673.003.602.804.803.401.203.833.671.254.003.834.673.202.601.504.402.001.502.002.333.001.602.201.331.603.604.405.00
Noun
FaucetFertilizerFingerFloorFoodFootForkFrontGarbageGlassGroundHairHandHeadHornInstrumentItemKeyKitchenKnifeLatchLeafLedgeLidLinenLipMachineMattressMiracle growMixtureMouthMouthpieceNeckNeckstrapObjectOutsidePartPiecePillowPillowcasePillowcases
Generality
1.832.332.002.174.402.001.754.333.003.504.173.001.753.332.334.505.002.603.402.002.252.172.672.832.801.404.202.001.004.332.001.502.001.834.834.004.834.831.751.171.50
Noun
PitcherPlacePlantPlant foodPlatePotRackRagReedRoomSaxophoneSceneScoopScrewSetSheetShelfSideSilverwareSinkSoapSolutionSomethingSpongeSpoonSpotStrapStringStuffSuitcaseTableThingTopTrashTrayUtensilWaistWasherWaterWhateverWindowsill
Generality
2.004.603.672.401.832.003.002.402.334.201.003.672.331.834.403.672.504.333.002.171.804.205.001.751.253.803.172.174.751.752.205.004.753.001.604.171.802.251.505.001.33
(Appendix continues)

58 ZACKS, TVERSKY, AND IYER
Table C2Verb Generality
Verb
AddAdjustApproachArrangeAssembleAttachBangBeBendBreatheBringChangeCheckCleanClearClipCloseComeConnectDecideDiscardDoDrawDropDumpEmptyEnterExitFeedFillFitFixFlattenFluffFoldGetGoGrab
Generality
3.674.00
' 2.673.673.833.503.175.003.173.003.834.504.173.834.003.003.504.504.004.173.335.003.673.003.833.333.173.333.833.674.174.502.671.832.174.504.172.33
Verb
HandleHoldHookInsertKneelLayLeanLeaveLickLiftLoadLookMakeMeasureMixMoveOpenPickPlacePlayPolishPourPreparePullPushPutRemoveRepeatReplaceReturnRinseRotateRubRunScoopScrapeScrewScrub
Generality
3.833.333.003.002.173.332.504.332.333.504.174.004.173.172.674.333.173.333.834.831.832.833.833.503.504.673.332.833.003.502.332.503.003.172.332.171.501.83
Verb
SecureSetShakeShutSmoothSpreadStandStartStickStraightenStrapStripStuffSuckTakeThrowTieTightenTossTuckTurnUndoUnfoldUnhookUnlatchUnlockUnscrewUnsnapUntieUnzipWalkWashWaterWetWipeWrap
Generality
3.504.172.832.672.503.173.673.673.502.833.502.674.172.174.673.332.832.673.673.333.674.172.671.331.832.672.672.172.501.402.833.832.502.672.673.17
Table C3Verb Goal-Directedness
Word
AddAdjustApproachArrangeAssembleAttachBangBeBendBreatheBringChangeCheckCleanClearClipCloseComeConnectDecideDiscardDoDrawDropDumpEmptyEnterExitFeedFillFitFixFlattenHuffFoldGetGoGrab
M
2.252.002.754.001.002.002.754.002.504.001.503.001.752.202.603.001.601.753.001.002.501.252.754.332.503.203.001.752.251.252.501.002.503.331.752.251.753.25
Word
HandleHoldHookInsertKneelLayLeanLeaveLickLiftLoadLookMakeMeasureMixMoveOpenPickPlacePlayPolishPourPreparePullPushPutRemoveRepeatReplaceReturnRinseRotateRubRunScoopScrapeScrewScrub
M
2.753.202.753.332.753.402.753.753.202.502.002.251.251.673.332.252.002.003.253.672.503.003.502.001.752.502.332.752.752.252.332.753.502.502.503.253.003.25
Word
SecureSetShakeShutSmoothSpreadStandStartStickStraightenStrapStripStuffSuckTakeThrowTieTightenTossTuckTurnUndoUnfoldUnhookUnlatchUnlockUnscrewUnsnapUntieUnzipWalkWashWaterWetWipeWrap
M
2.002.674.501.333.003.672.602.003.002.002.752.403.004.331.252.003.501.674.002.203.003.252.253.502.252.002.202.672.502.502.003.254.254.502.253.00
Received June 9, 1999Revision received October 11, 1999
Accepted February 1, 2000