oyster bay-east norwich central school district dr. hughes, edu 5650 st. john’s university-2010...
TRANSCRIPT

Oyster Bay-East Norwich Central School District
Dr. Hughes, EDU 5650St. John’s University-2010Prepared by: Valerie Vacchio
A Beacon of Light In an Ocean of Educational Possibilities
Purpose of the Study
The purpose of this study was to rank 10 school districts using 4 indicators:
finance, instruction, achievement, and census.
Using these data we will be able to assess where our target district stands amongst the comparison districts in their standardized test scores. Moreover, we can discover what factors contribute directly to their ranking.

Purpose of the Study
In addition, we will be able to identify:
Where are we as a district? How far must we still go?Are we better or worse than we
think?What will it take for us to
improve?

Oyster Bay-East Norwich CSD
Mission Statement:
To maximize each student’s personal potential for tomorrow’s world in a
cost effective manner
Oyster Bay-East Norwich CSD
Target District ProfileCommunity:
Oyster Bay is located on the North Shore of Long Island approximately 35 miles east of New York City. The residents are committed to quality education as evidenced by the expenditures per child, which are among the highest in the New York Metropolitan area. The student-teacher ratio is one of the lowest in Long Island.

Oyster Bay-East Norwich CSD
Accreditations
• Recognized School of Excellence by the U.S. Department of Education
• Oyster Bay is accredited by the State of New York and the Middle States Association

Analysis of Ten Long Island School Districts
Our Vision/Our Future
Districts of Comparison
1.Locust Valley2.Carle Place3.Malverne4.Island Trees5.Seaford6.North Shore7.Plainedge8.Bethpage9.East Williston10.Oyster Bay-East Norwich
Definition of Terms• Indicators: The working definition of the term
indicator would be that “Indicators are statistics which reflect the features and performance of an institution measured or assessed. They provide answers to questions related to how well an education system is functioning within a broad standard or reference point. Indicators make a comparison over time, among jurisdiction, or against some predetermined standard or set of criteria. They provide a snapshot of current conditions by reflecting the characteristics jurisdiction relative to vision and mission and the attainment keeping in view the criteria of quality education.” (Education and Development, G. Pankajam, 2005)
Definition of Terms
• Aspiration District: a similar district that appears to be outperforming the target district
• Target District: a district that does not appear to be the best in all categories

Definition of Terms
• Intersection: the process of combined multiple data points to gain greater insight into a particular problem (Bernhardt, 2003)
• School District Almanac: a publication containing statistical, tabular, and general information…often including miscellary information
(www.almanac.cc)

• What does the data tell us?
• What do they not tell us?
• What else do we need to know?
• What “good news” is there to celebrate?
• What needs for school improvement might arise from the data?
Research Questions:
Literature Review
Using Data To Frame the Problem
The 5 C’s: Dr. Jonathan Hughes
1.Content-What do we have?2.Compare-Who are we?3.Contrast- Where do we stand?4.Context-Why are we here?5.Construct-How do we move?
Where are we going?
Literature Review
Conceptual Framework: Examining the Data(Based on the framework by Edgar Schein)
Look for THEMES:•Major trends or ideas similar across districts in ALL tables
Look for PATTERNS:•Defining trends in that they are specific to one or more tables, but not necessarily across all tables
Look for DISCREPANCIES:•Differences or aberrations that seemingly counter the themes and patterns
Methodology
Step 1: Choose the target district.
Step 2: Choose indicators.•What makes a good “indicator?” •Would these “indicators” form a good report card for the district?
Step 3: Find comparable districts using Almanac Data 2010.

MethodologyStep 4: Target these specific districts and
mine its data. – Are there others you would have liked to add to
the two indicators in each area?– Are there redundancies among the areas?
Step 5: An aspiration district was chosen which was similar to the target district, but appears to be outperforming the target district.
Step 6: Using data from the findings and make recommendations to move the target district forward.
Findings
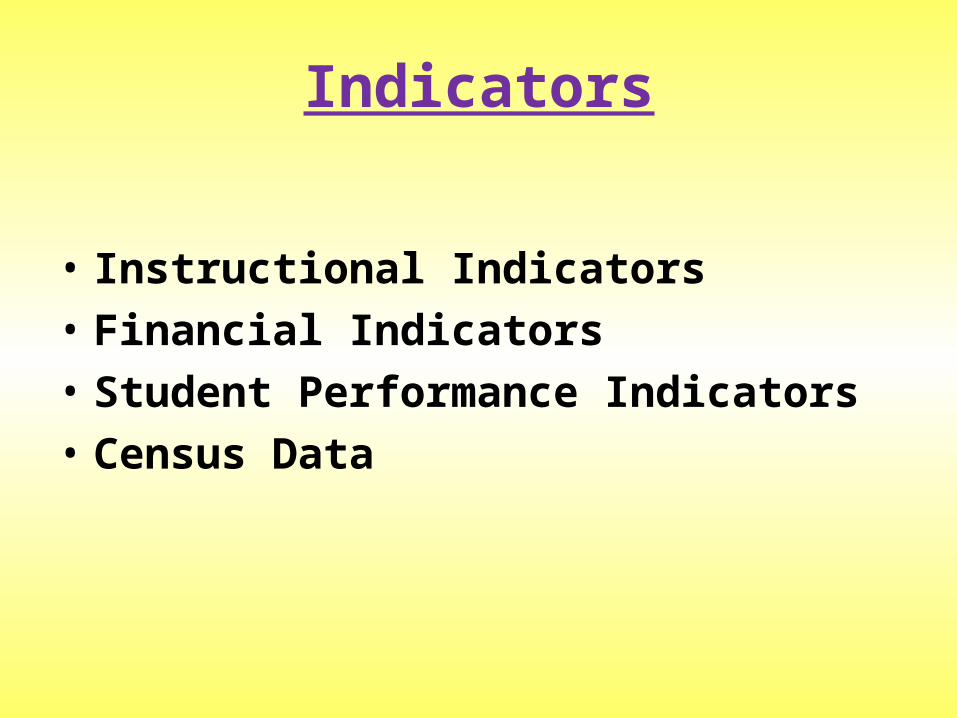
Indicators
• Instructional Indicators• Financial Indicators• Student Performance Indicators• Census Data

Instructional Indicators
• Total Enrollment vs. Number of Teachers
• Student/Teacher Ratio
• Curriculum Development Expenditures

Total Enrollment vs. Number of Teachers
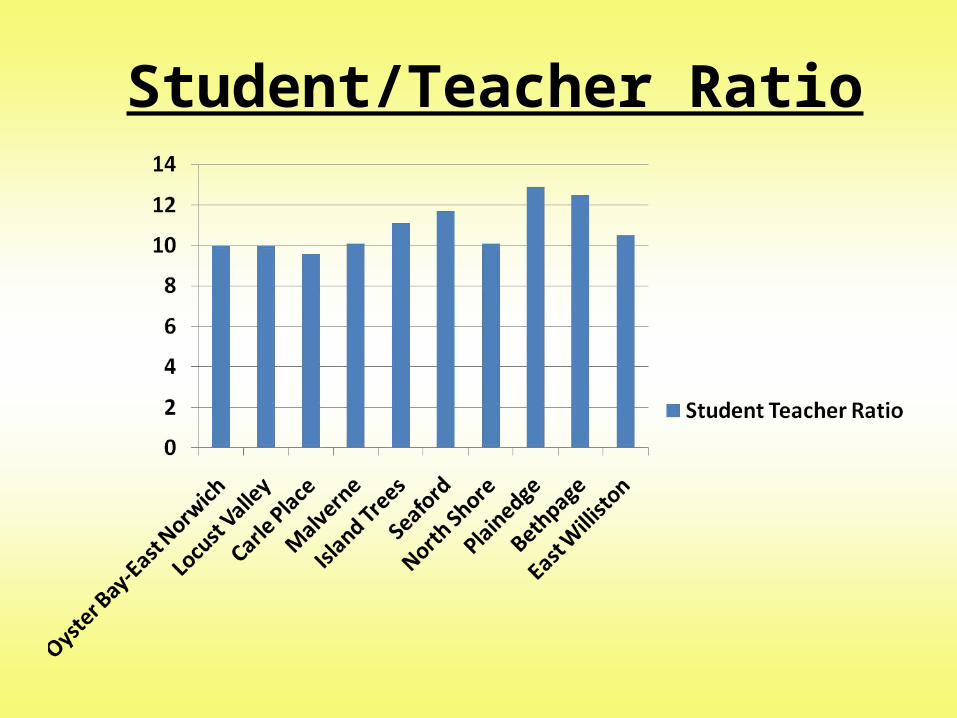
Student/Teacher Ratio

Curriculum Development Expenditures

Financial Indicators
• School Expenditures• Instructional Expenditures• Per Pupil Expenditures• Instructional Expenditures as a
Percentage of Total Expenditures
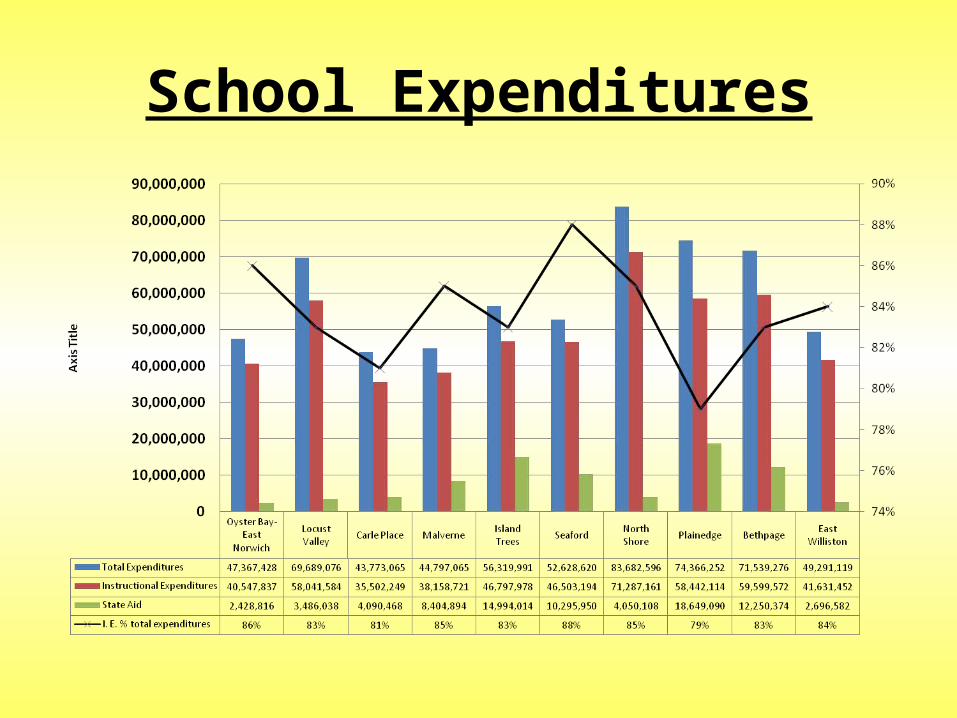
School Expenditures
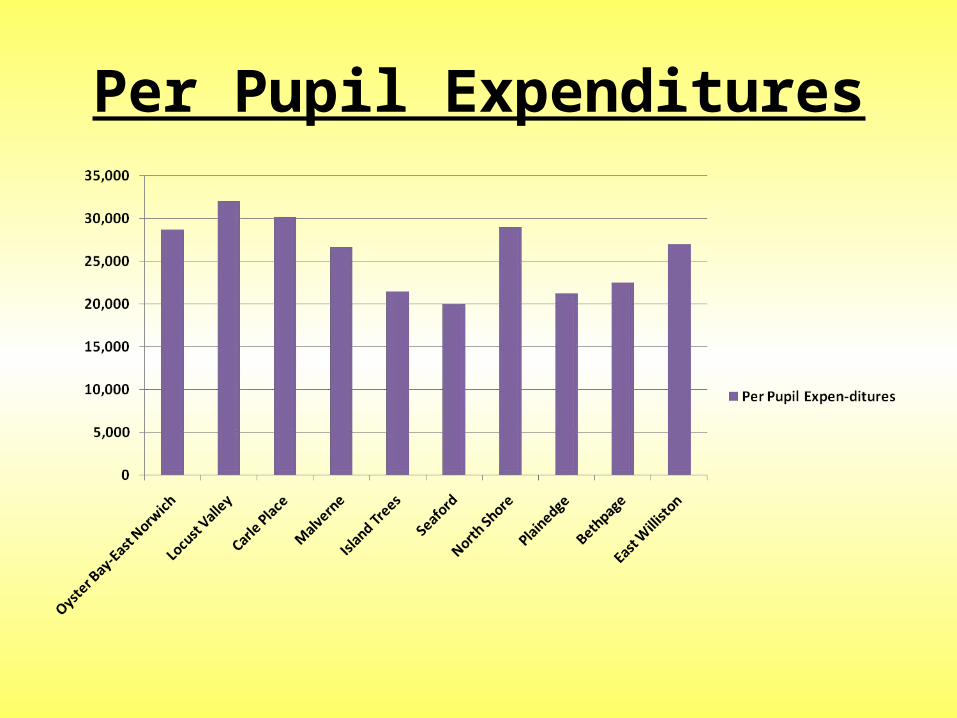
Per Pupil Expenditures
Student Performance Indicators
• ELA Grade 4 • Math Grade 4• ELA Grade 8 • Math Grade 8 • Regents Diploma (2008)


Math 4 vs. Math 8
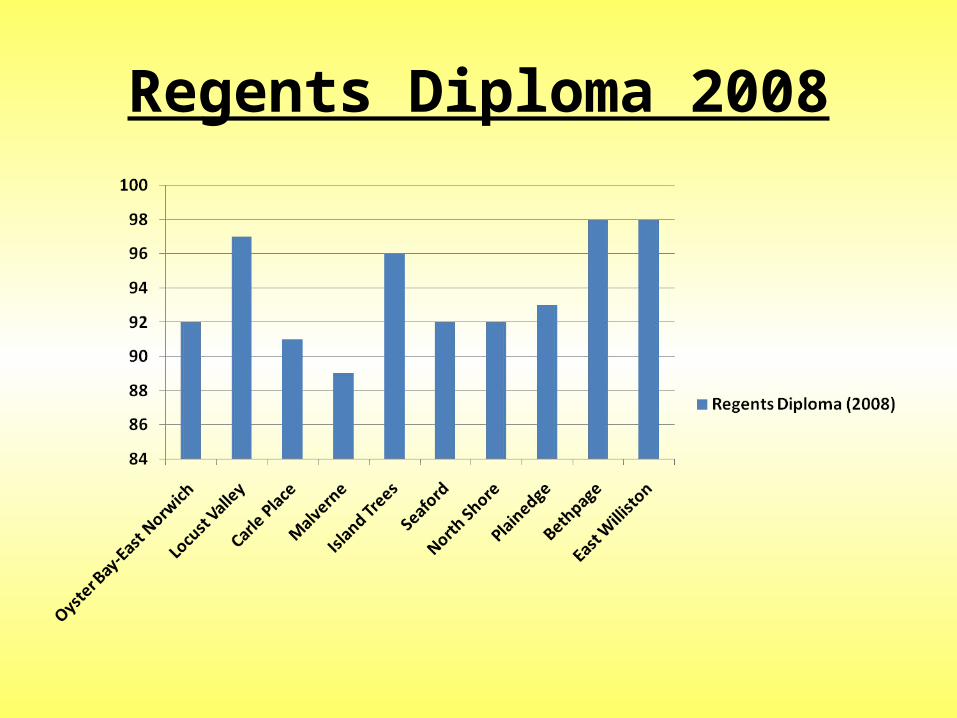
Regents Diploma 2008
Census Data
• Median Home Value• Combined Wealth Ratio • Total Population • Total Enrollment • District Enrollment as a % of
Total Population

Median Home Value
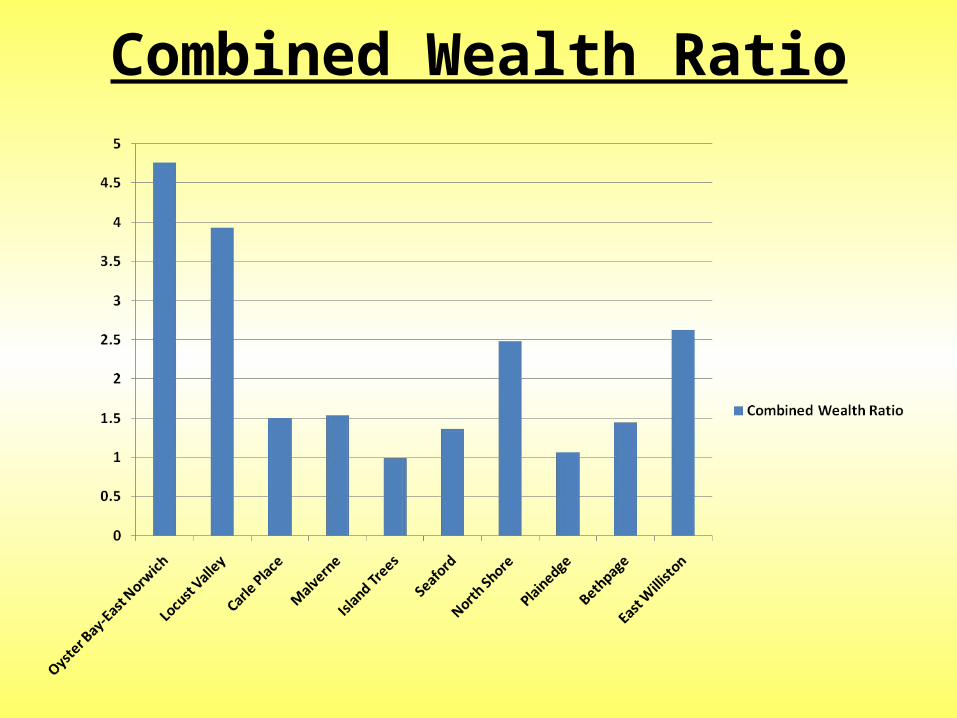
Combined Wealth Ratio
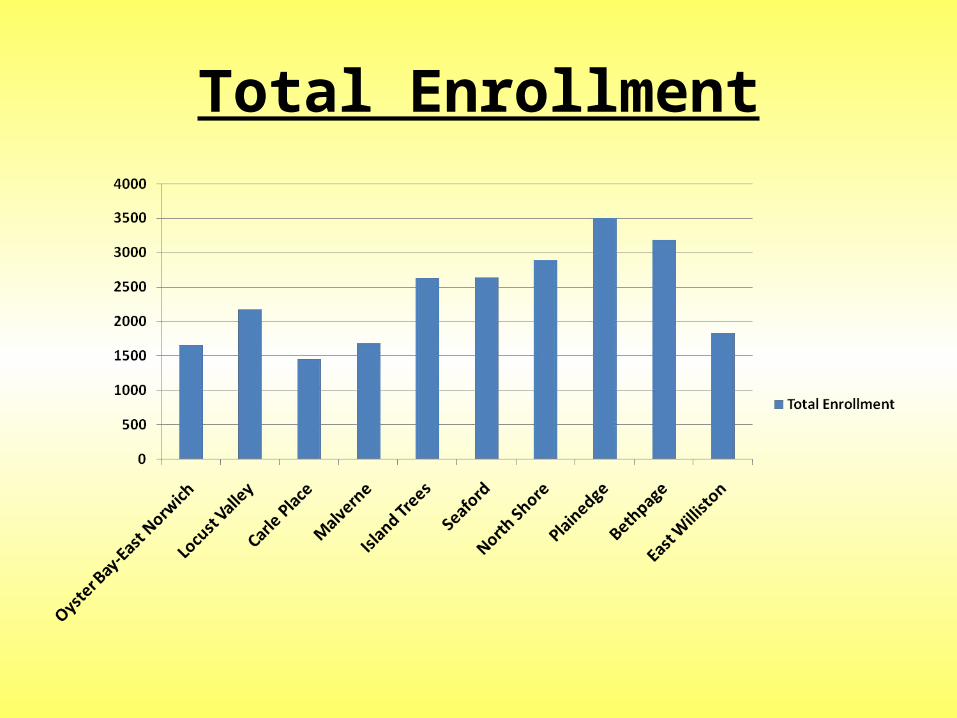
Total Enrollment

Summative MatrixStudent Performance
Instruction Indicators Financial Data Census Overall rankings
Oyster Bay-East Norwich
6 4 4 5 4
Locust Valley 3 2 7 2 1
Carle Place 5 2 1 10 3
Malverne 9 7 2 8 8
Island Trees 7 5 6 8 8
Seaford 6 9 5 6 8
North Shore 8 1 9 1 4
Plainedge 4 9 6 3 7
Bethpage 2 5 8 4 4
East Williston 1 8 2 6 2

Findings
“Good is the enemy of great.”~Jim Collins

The 5 C’s:Dr. Jonathan Hughes
1.Content-What do we have?2.Compare-Who are we?3.Contrast- Where do we stand?4.Context-Why are we here?5.Construct-How do we move?
Where are we going?

Content-What do we have?
• Oyster Bay-East Norwich CSD is a financially stable district with controlled spending and efficiencies.
• Demographic data indicates that Oyster Bay has the highest median home value of all districts analyzed.
• The combined wealth ratio is extremely high which equates to the fact that the district receives very little state aid.

Compare-Who are we?
• Oyster Bay-East Norwich CSD is a high-performing school district that is committed to excellence in education for ALL students.
• The professional staff are committed members of an accountable learning community focused on improving student achievement.
• The budget process is an annual challenge due to the fact that many students who live in the district attend private schools.
• We strive to maintain the integrity of our vision while simultaneously keeping tax implications in mind.

Compare-Who are we?
• The NYS assessment data indicates that Oyster Bay-East Norwich CSD is comparable to similar districts, often times outperforming them.
• The high school graduation rate in 2010 was 98%.
• Approximately 92% of our students graduate with a NYS Regents diploma.
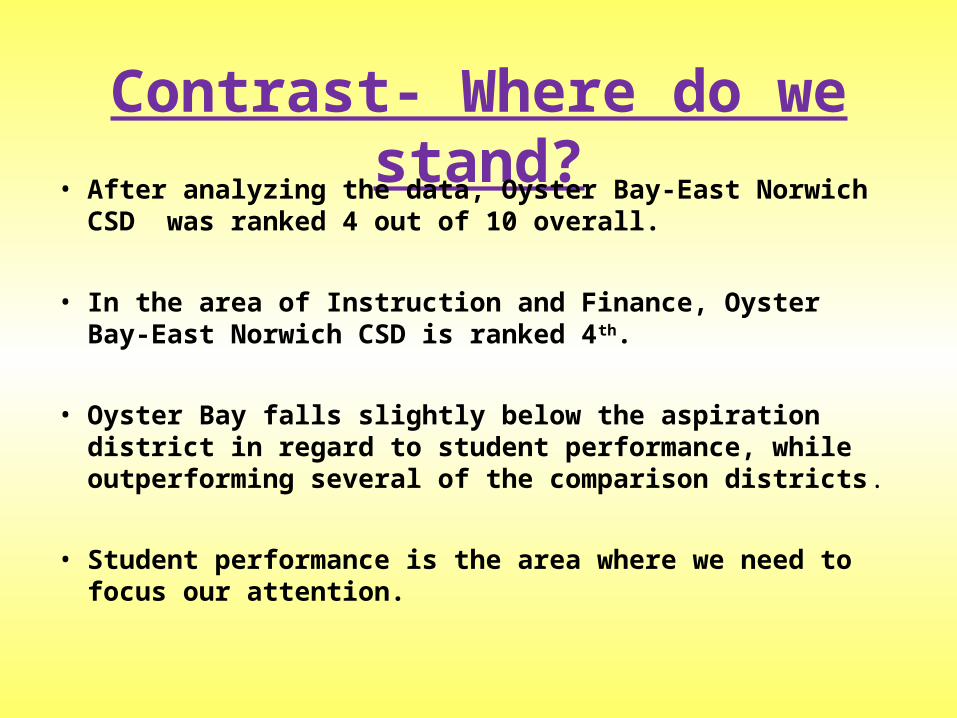
Contrast- Where do we stand?
• After analyzing the data, Oyster Bay-East Norwich CSD was ranked 4 out of 10 overall.
• In the area of Instruction and Finance, Oyster Bay-East Norwich CSD is ranked 4th.
• Oyster Bay falls slightly below the aspiration district in regard to student performance, while outperforming several of the comparison districts.
• Student performance is the area where we need to focus our attention.
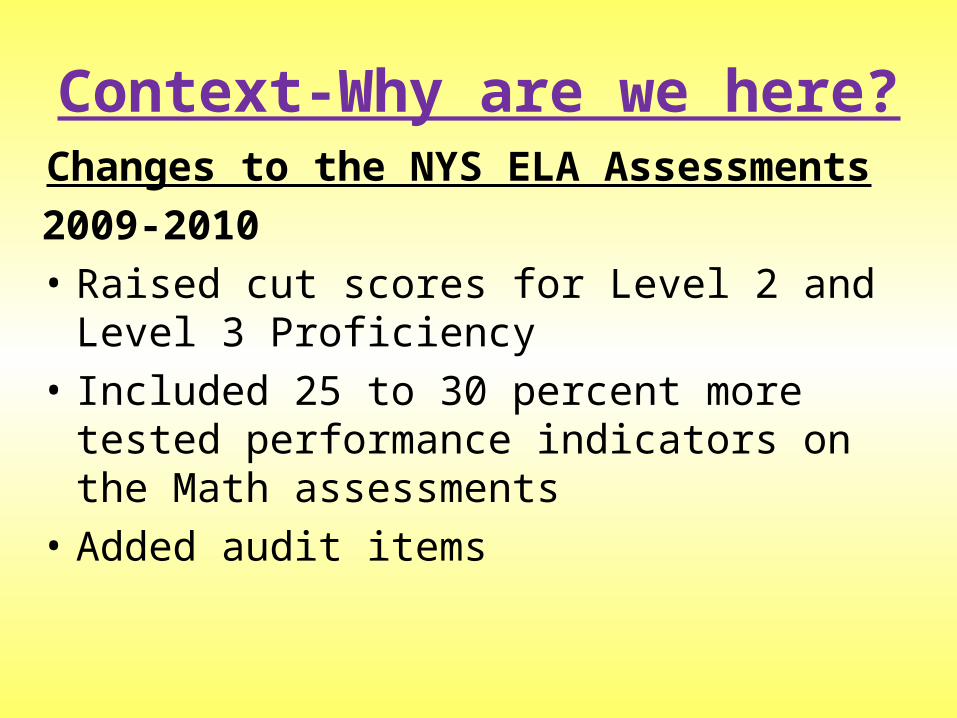
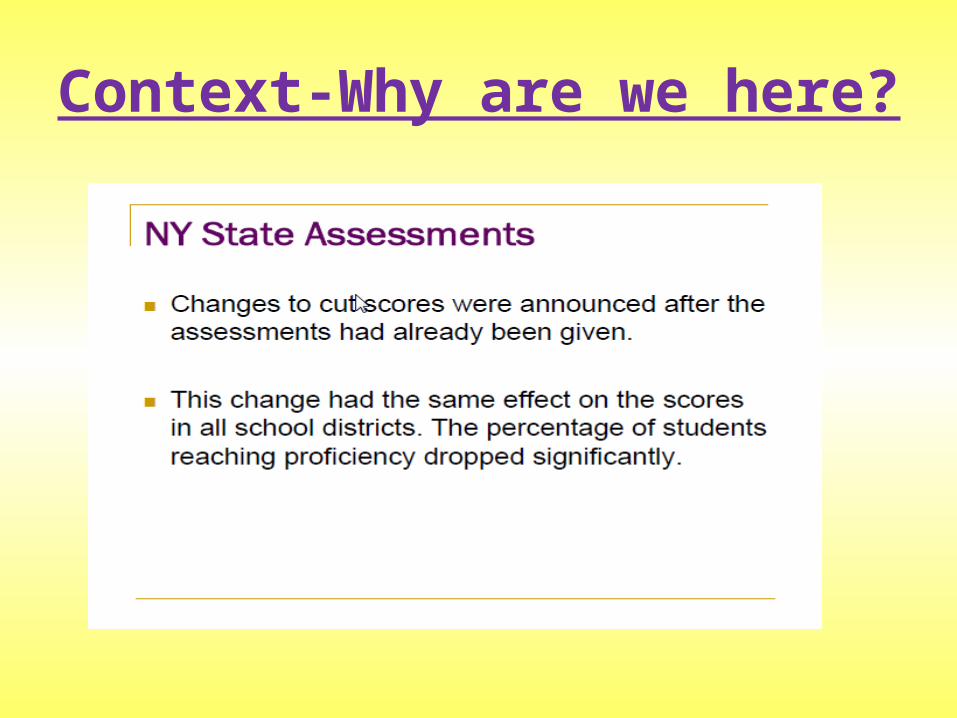
Context-Why are we here?
Changes to the NYS ELA Assessments
2009-2010• Raised cut scores for Level 2 and
Level 3 Proficiency• Included 25 to 30 percent more
tested performance indicators on the Math assessments
• Added audit items
Context-Why are we here?
Context-Why are we here?
Context-Why are we here?

Context-Why are we here?
Context-Why are we here?

Context-Why are we here?

ConstructHow do we move?
Where are we going?
As the Supervisor of English Language Arts, it is recommended that we analyze, monitor, and modify and the current K-12 English Language Arts Curriculum.
Conclusions/Next Steps . . .
What are we going to do first?
What will we do to help students meet the new proficiency standards set by
NYS?

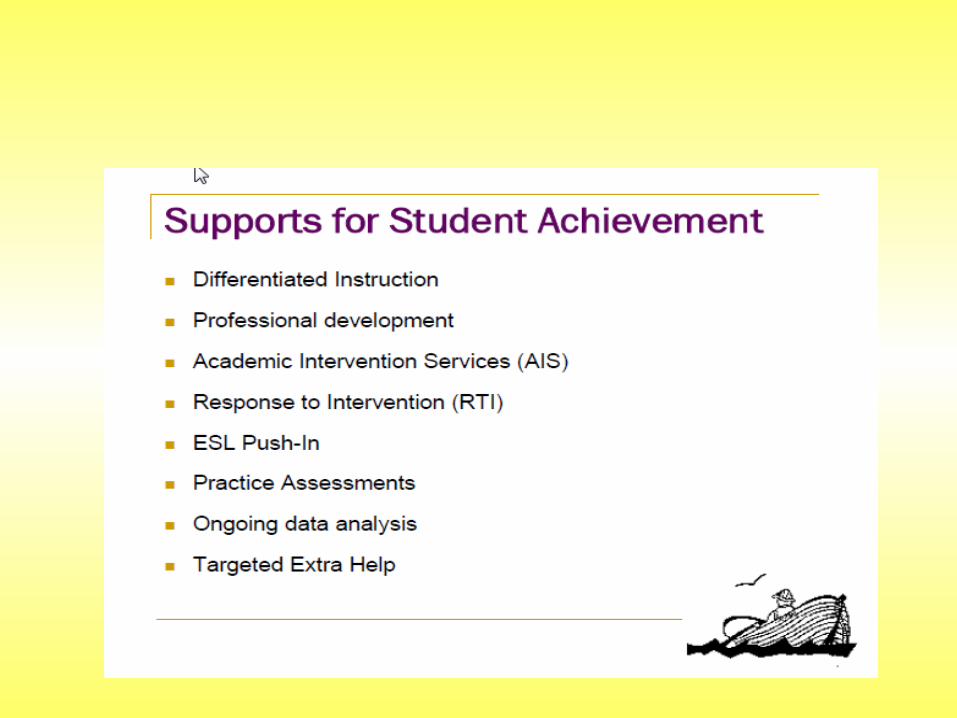
Recommendations:
• Provide Academic Intervention Services (AIS) for students at Level 2, with a school option to offer AIS to other students falling short of the new Proficiency threshold
• Review English Language Arts Curriculum (K-12) to ensure it is fully aligned with
NYS Standards and performance indicators

Recommendations:
• Begin to align the current English Language Arts Curriculum (K-12) to the Common Core State Standards (CCSS)
• Implement Response to Intervention (RTI) to all students in grades K-3 with support from regional RTI specialists
Recommendations:
• Strengthen early childhood education by aligning the
Pre-K curriculum to the Common Core State Standards (CCSS)
• Ongoing data analysis-All teachers in grades 3-8 who teach a class linked to a state exam will have an individual meeting with the Supervisor of ELA, Principal, and Assistant Superintendent for Curriculum and Instruction to review data

Recommendations
• Implement differentiated Instruction and Learning
• Share/pool special education resources & funding with general education

Thank you!
What questions do you have?