overview of industrial ccs - cslf · urea production used for eor . coffeyville. us. 2013: ......
TRANSCRIPT
Overview of Industrial CCS
CSLF Workshop – TokyoAlex Zapantis, General Manager-Asia Pacific, Global CCS InstituteSeptember 2016

Industrial processes can not simply be switched out of the global economy
• These Industrial processes produce the building blocks of modern society
• Steel, cement, fertiliser, various chemicals from coal (CTX), plastics, methane production, oil refining, hydrogen production
• Demand for these products will continue to grow through to the middle of this century:
• Global population to increase by 25%
• Global GDP to increase by 150%
• Global electricity demand to increase by 50-70%
These products are necessary inputs to the transition to a lower emissions energy system

Approximately 9Gt* or one quarter of Anthropogenic CO2 Emissions arise from Industrial Processes
Emission Trajectories for Industrial Emissions; IEA 6DS and 2DS
Source: IEA, Energy Technology Perspectives 2015 *in 2013
CCS is one of the main contributors to the innovative processes required to reduce emissions to limit warming to 2 degrees.
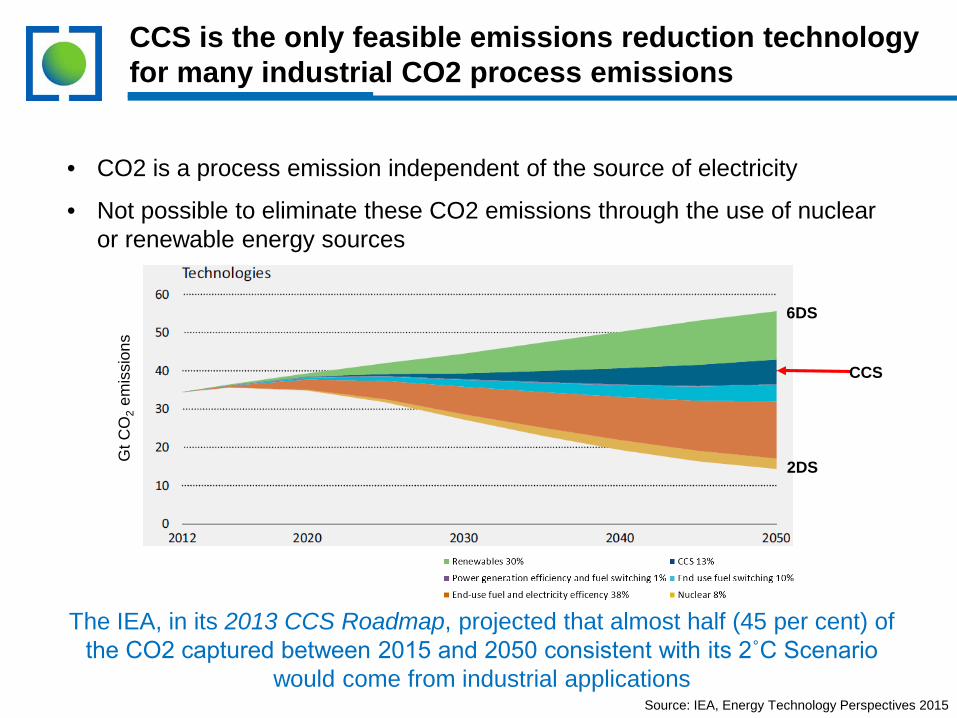
CCS is the only feasible emissions reduction technology for many industrial CO2 process emissions
• CO2 is a process emission independent of the source of electricity
• Not possible to eliminate these CO2 emissions through the use of nuclear or renewable energy sources
The IEA, in its 2013 CCS Roadmap, projected that almost half (45 per cent) of the CO2 captured between 2015 and 2050 consistent with its 2˚C Scenario
would come from industrial applications
6DS
2DS
CCS
Gt C
O2
emis
sion
s
Source: IEA, Energy Technology Perspectives 2015

Industrial CCS compared with Power Generation CCS
VS
• Can’t eliminate via substitution with nuclear/renewable energy sources
• More concentrated CO2 stream • Smaller capture cost• Tends to be higher margin
business• Smaller commercial challenge
• Can substitute nuclear/renewable• Dilute CO2 stream• Larger capture cost• Tends to be lower margin business• Larger commercial challenge
2015
EOR
Dedicated Geological
Power Generation
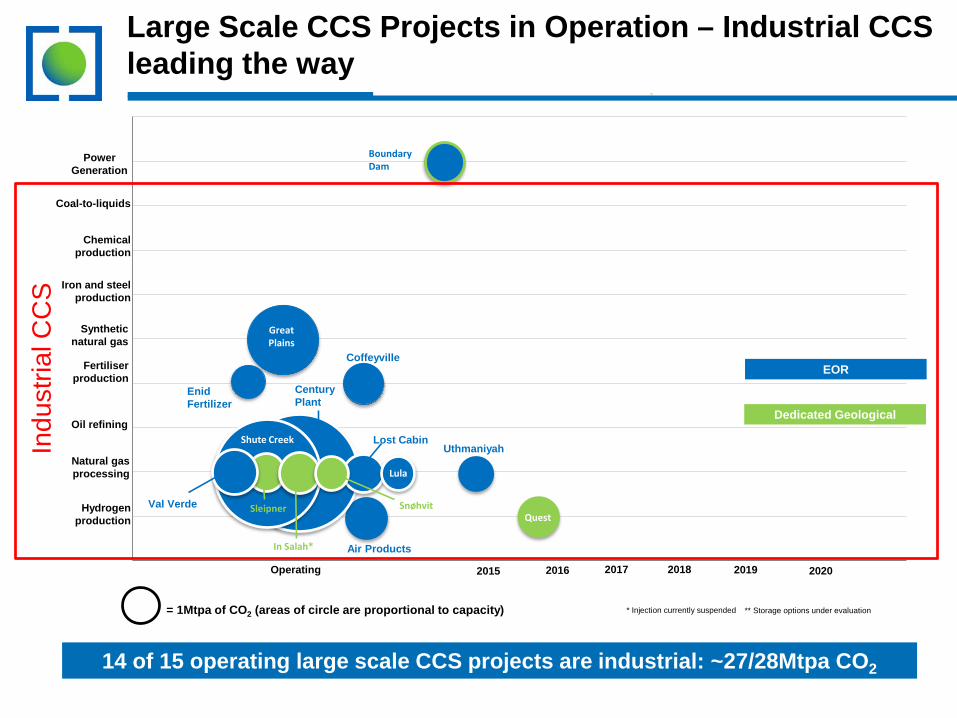
14 of 15 operating large scale CCS projects are industrial: ~27/28Mtpa CO2
Operating 20172016
Hydrogen production
Natural gas processing
Chemicalproduction
Iron and steel production
Synthetic natural gas
Fertiliser production
Oil refining
2018 2019 2020
= 1Mtpa of CO2 (areas of circle are proportional to capacity)
Coal-to-liquids
* Injection currently suspended
Boundary Dam
Medicine Bow
Coffeyville
Century Plant
Enid Fertilizer
Val Verde
Air Products
Lost Cabin
Lula
SnøhvitSleipner
Shute Creek
In Salah*
Uthmaniyah
Quest
Great Plains
** Storage options under evaluation
Large Scale CCS Projects in Operation – Industrial CCS leading the way
Indu
stria
l CC
S

2015
EOR
Dedicated Geological
Power Generation
7 more projects expected to commence operation in 2016/17: ~40Mtpa CO2
Operating 20172016
Hydrogen production
Natural gas processing
Chemicalproduction
Iron and steel production
Synthetic natural gas
Fertiliser production
Oil refining
2018 2019 2020
= 1Mtpa of CO2 (areas of circle are proportional to capacity)
Coal-to-liquids
* Injection currently suspended
Boundary Dam
Medicine Bow
Kemper
Petra Nova
Illinois Industrial
Abu Dhabi
ACTL Agrium Coffeyville
Century Plant
Enid Fertilizer
Val Verde
Air Products
Lost Cabin
Lula
SnøhvitSleipner
Shute Creek
In Salah*
Uthmaniyah
Quest
Gorgon
ACTL Sturgeon
Great Plains
** Storage options under evaluation
Large Scale CCS Projects in Operation + projects under construction
Indu
stria
l CC
S

2015
EOR
Dedicated Geological
Power Generation
Industrial CCS projects in operation by the end of 2017: ~35Mtpa CO2
Operating 20172016
Hydrogen production
Natural gas processing
Chemicalproduction
Iron and steel production
Synthetic natural gas
Fertiliser production
Oil refining
2018 2019 2020
= 1Mtpa of CO2 (areas of circle are proportional to capacity)
Coal-to-liquids
* Injection currently suspended
Boundary Dam
Medicine Bow
Kemper
Petra Nova
Illinois Industrial
Abu Dhabi
ACTL Agrium Coffeyville
Century Plant
Enid Fertilizer
Val Verde
Air Products
Lost Cabin
Lula
SnøhvitSleipner
Shute Creek
In Salah*
Uthmaniyah
Quest
Gorgon
ACTL Sturgeon
Great Plains
** Storage options under evaluation
CCS, particularly Industrial CCS, is making a contribution to emissions reduction now
Indu
stria
l CC
S
These 19 Industrial CCS projects have the capacity to store 35Mt of CO2 each year. This is approximately equivalent to the emissions abatement from:• 19GW of solar PV (if displacing coal) • More than the total installed solar PV capacity of the United Kingdom,
Australia, Greece and Switzerland in 2015.
Assumptions: PV 21% capacity factor, coal emissions intensity 1000kg/MWh. Installed PV Capacity from Solar Power Europe Global Solar Market Outlook 2016-2020
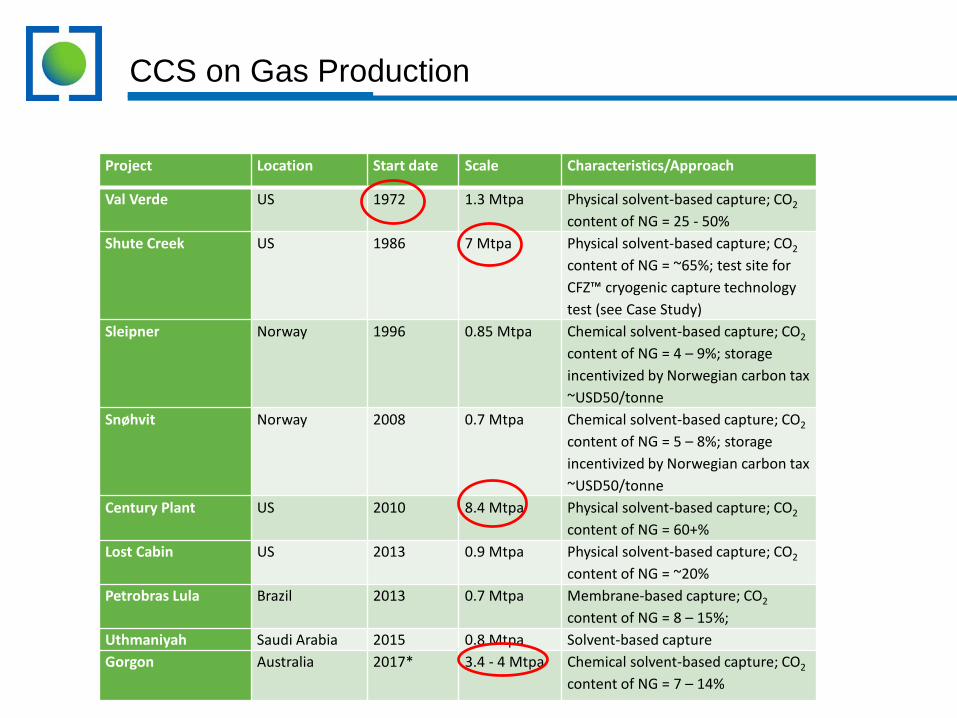
CCS on Gas Production
Project Location Start date Scale Characteristics/Approach
Val Verde US 1972 1.3 Mtpa Physical solvent-based capture; CO2
content of NG = 25 - 50%Shute Creek US 1986 7 Mtpa Physical solvent-based capture; CO2
content of NG = ~65%; test site for CFZ™ cryogenic capture technology test (see Case Study)
Sleipner Norway 1996 0.85 Mtpa Chemical solvent-based capture; CO2
content of NG = 4 – 9%; storage incentivized by Norwegian carbon tax ~USD50/tonne
Snøhvit Norway 2008 0.7 Mtpa Chemical solvent-based capture; CO2
content of NG = 5 – 8%; storage incentivized by Norwegian carbon tax ~USD50/tonne
Century Plant US 2010 8.4 Mtpa Physical solvent-based capture; CO2
content of NG = 60+%Lost Cabin US 2013 0.9 Mtpa Physical solvent-based capture; CO2
content of NG = ~20%Petrobras Lula Brazil 2013 0.7 Mtpa Membrane-based capture; CO2
content of NG = 8 – 15%;Uthmaniyah Saudi Arabia 2015 0.8 Mtpa Solvent-based captureGorgon Australia 2017* 3.4 - 4 Mtpa Chemical solvent-based capture; CO2
content of NG = 7 – 14%
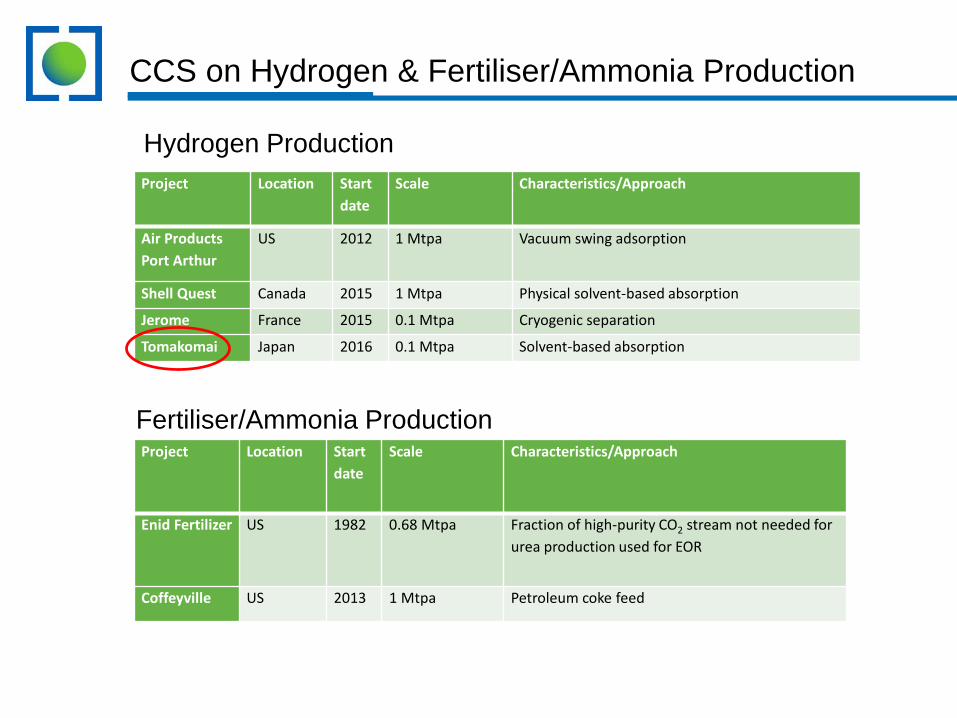
CCS on Hydrogen & Fertiliser/Ammonia Production
Project Location Start date
Scale Characteristics/Approach
Air Products Port Arthur
US 2012 1 Mtpa Vacuum swing adsorption
Shell Quest Canada 2015 1 Mtpa Physical solvent-based absorption
Jerome France 2015 0.1 Mtpa Cryogenic separation
Tomakomai Japan 2016 0.1 Mtpa Solvent-based absorption
Project Location Start date
Scale Characteristics/Approach
Enid Fertilizer US 1982 0.68 Mtpa Fraction of high-purity CO2 stream not needed for urea production used for EOR
Coffeyville US 2013 1 Mtpa Petroleum coke feed
Hydrogen Production
Fertiliser/Ammonia Production

CCS on Bioethanol Production
Project Location Start date Capture capacity
Characteristics/Approach
Arkalon US 2009 0.31 Mtpa EOR, Texas
Bonanza US 2011 0.16 Mtpa EOR, Kansas
Rotterdam Netherlands 2012 0.3 Mtpa CO2 supplied to greenhouses
Illinois industrial Project
US 2017 1 Mtpa Geological storage
Lantmännen Agroetanol
Sweden Planned 0.17 Mtpa Storage under evaluation
CPER Artenay France Planned 0,2 Mtpa Storage under evaluation
Sao Paulo Brazil Planned 0.02 Mtpa Storage under evaluation

CCS on Cement Production
Project Location Start date Capture capacity
Characteristics/Approach
ECRA studies EU 2007 Desktop study
Screening CO2 capture technologies for cement plants
ITRI pilot Taiwan 2013 1 t/h CaL pilot
Norcem’s tests Norway 2014 (ongoing)
Multiple tests
Pilot tests (amine, membranes, solid sorbents)
CEMCAPproject
EU 2015(ongoing)
Multiple tests
Oxy-fuel (burner, calciner, clinker cooler), chilled ammonia, membranes and CaL tests.
Calix pilot Belgium 2017 ~80 tpd Direct separation pilot

CCS on Iron and Steel Production
Project Location Start date
Capture capacity
Characteristics/Approach
ULCOS EU 2009 Desk study Screening of CO2 capture technologies for steel plants
COURSE 50 Japan 2011 30 tpd Chemical absorption based capture from blast furnace gas
POSCO Korea 2012 10 tpd Ammonia-base capture from blast furnace gas
Shougang Jingtang Iron and Steel
China 2014 Feasibility Study
300 tpd chemical absorption pilot, from hot blast stove and lime kiln flue gas
Abu Dhabi CCS Project UAE 2016 2400 tpd Solvent-based capture in Direct Reduction Iron unit
STEPWISE Sweden 2017 14 tpd Sorption Enhanced Water-Gas Shift (SEWGS) pilot for blast furnace gas

CCS on Oil Refining (Non- H2 Production)
Project Location Start Date Scale Characteristics/Approach
Sinopec Zhongyuan Oil Field
China 2006 360 tpd Solvent-based capture from FCC flue gas
CO2 Capture Project (CCP)
Brazil 2011 <1 tpd Oxy-firing trials on FCC
Technology Centre Mongstad
Norway 2012 240 tpd Solvent-based capture from FCC flue gas

CCS on Pulp & Paper Production
Project Location Start Date Scale Characteristics/Approach
Piteå Black Liquor Gasification
Sweden 2005 Desktop Analysis evaluating development of a 60 tpd, physical solvent-based capture system
Boise White Paper Mill Case Study
USA 2006 Desktop Study for 1 Mtpa facility using solvent-based capture
Quebec Pulp Mill Utilisation Project
Enzyme-based solvent
Planning 30 tpd Quebec, Canada

Japanese Industrial CCS Interests – 2 examples
Tomakomai CCS Demonstration Project - Hokkaido• Operating• CCS on hydrogen production unit• 100,000tpa CO2 • Onshore injection and storage in near offshore reservoir
Victoria, Australia Hydrogen Production• Concept• Gassify lignite, produce hydrogen• Store CO2 in Gippsland Basin• Potential opportunity for CarbonNet Project• Ship hydrogen to Japan

Hubs and Clusters
• Industrial CO2 sources often located in industrial complexes• Opportunity to reduce cost and risk through hubs and clusters

Southwest US CO2 Pipeline System
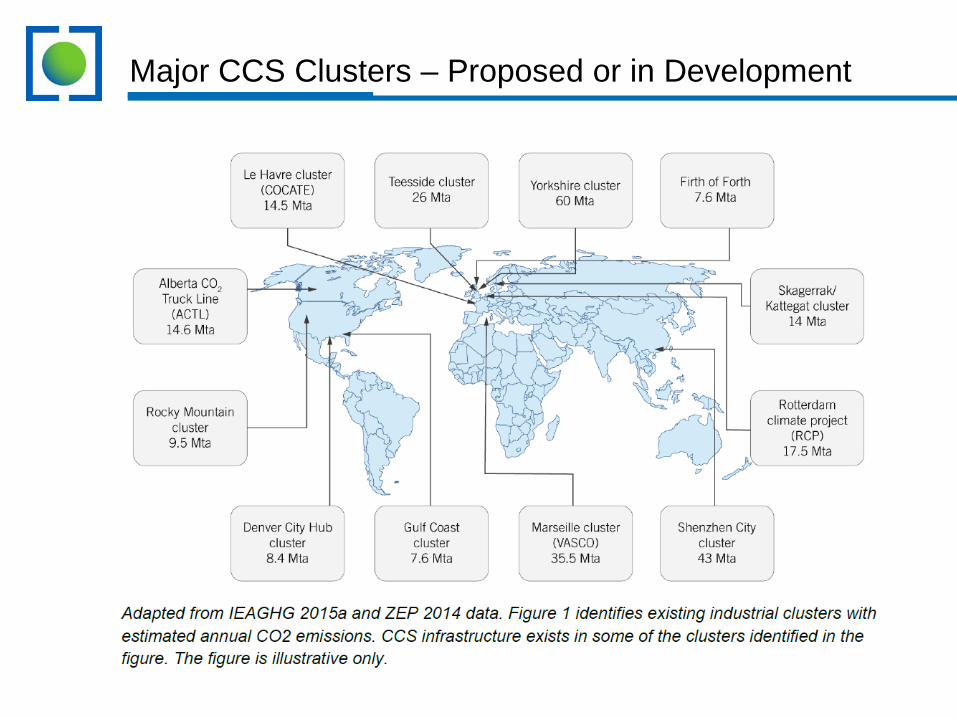
Major CCS Clusters – Proposed or in Development

CoP21 – The need for CCS will become more visible
CoP21 was a significant step forwards:
195 countries agreed a higher level of ambition; limiting global warming to1.5 - 2 degrees Celcius
Established bottom-up architecture for emission reduction targets allowing nations to determine their national contributions
Established a process of regular (5 yearly) reviews of national emission reduction targets and an expectation that targets will become more stringent
Gt C
O2
emis
sion
s
6DS
2DS
CCS

Mitigation costs more than double in scenarios with limited availability of CCS
*Percentage increase in total discounted mitigation costs (2015-2100) relative to default technology assumptions – median estimate
+ 7% + 6%
+ 64%
+ 138%
Baseline cost with all mitigation options utilized
Source: IPCC Fifth Assessment Synthesis Report, Summary for Policymakers, November 2014.
Cost increase under limited technology availability scenarios
50
100
150
Perc
enta
ge*
Nuclear phase out Limited solar/wind
Limited bioenergy
No CCS

A significant task within one generation
40 large-scale CCS projects -combined capture capacity of approximately 71 Mtpa*:
• 22 projects in operation or construction (40 Mtpa)
• 6 projects in advanced planning (6 Mtpa)
• 12 projects in earlier stages of planning (25 Mtpa)
OECDNon-OECD
~4,000 Mtpa of CO2 captured by CCS by 2040 (IEA 450
Scenario)**
40 Mtpa
Global Status of CCS
*Mtpa = million tonnes per annum
**Source: IEA, Energy Technology Perspectives (2016).

Renewables – a fantastic success story! What can we learn?
Data source: IEA, World Energy Outlook 2015
Rapid increase in renewable electricity generation
Electricity Generation from Renewable Energy

Renewables – a fantastic success story – driven by policy
Data source:IEA, World Energy Outlook 2014
Annual Subsidy provided to Renewable Energy (US$ Billion)
Significant and sustained policy support has incentivised massive private sector investment, resulting in rapid deployment and cost reductions arising from competition between suppliers and economies of scale.

Renewables – a fantastic success story! Policy parity is required for CCS to play its part in emission reductions.
Data source:IEA, World Energy Outlook 2014, Global CCS Institute
• In the period 2007 to 2016, value of global policy support for renewable energy deployment was around US$800B.
• Total value of policy support for deployment of CCS over all time is around $20B
Annual Subsidy provided to Renewable Energy (US$ Billion

Thank you for your attention

2015
EOR
Dedicated Geological
Power Generation
Looking forwards, more power projects are in the pipeline than industrial projects.
Operating 20172016
Hydrogen production
Natural gas processing
Chemicalproduction
Iron and steel production
Synthetic natural gas
Fertiliser production
Oil refining
2018 2019 2020
= 1Mtpa of CO2 (areas of circle are proportional to capacity)
Coal-to-liquids
* Injection currently suspended
Boundary Dam
Medicine Bow
Kemper
Petra Nova ROADSargas Texas
Sinopec Shengli
TCEP
Peterhead HECA**
Illinois Industrial Yanchang
Sinopec Qilu
Abu Dhabi
ACTL Agrium Coffeyville
Century Plant
Enid Fertilizer
Val Verde
Air Products
Lost Cabin
Lula
SnøhvitSleipner
Shute Creek
In Salah*
Uthmaniyah
Quest
ACTL Sturgeon
Petro China Jilin
Great Plains
FutureGen 2.0
Don Valley
White Rose
** Storage options under evaluation
Large Scale CCS Projects in Operation + projects under construction and in planning
Gorgon
Indu
stria
l CC
S