orr cp5 trackerorr.gov.uk/__data/assets/pdf_file/0007/19798/cp5-tracker-for-april... · orr cp5...
TRANSCRIPT

ORR CP5 tracker
April 2015 Commercial in confidence: the information in this report must not be disclosed to any outside party

Purpose of the CP5 tracker • The aim of this document is to provide a clear, periodic statement for the Executive and the Board on Network Rail’s delivery of its regulated
outputs and other key projects/issues.
• It will cover the following areas: o Railway operations o Asset performance o Enhancement projects o Finance and efficiency
• The tracker will look across all relevant areas to provide a genuinely joined up view on the causes of issues and risks highlighted.
• It should look to cover current failures to achieve regulated outputs and identify risks to achievement and the end of the year/control period.
• A common platform for reporting will be established enabling consistent reporting across all areas.
• It is intended that the information contained in this report could be shared (redacted as appropriate) with Network Rail and DfT at the regular tri-
lateral.
Office of Rail and Road November 2015 2

Contents Purpose of the CP5 tracker 2
Contents 3
Overview 4
Regulated outputs on a page 6
Railway operations 7
CP5 performance plan 7
Train service performance 8
TOC PPM (MAA) & CaSL (MAA) 9
Asset performance 13
Composite reliability index (CRI) 13
Renewals volumes 14
Enhancements 15
Regulated milestones tracker 15
Confidence index 16
Finance and efficiency 18
Regulatory escalator 20
Notes and definitions 22
Office of Rail and Road November 2015 3

Overview Train service performance
• The downward trend in England and Wales PPM MAA since P10 of 2011/12 (Dec 2011) appears to have been halted. Key economically important routes such as the East Coast Mainline have seen performance for the last few periods of 2014/15 higher than previously seen levels.
• Detailed analysis of actual train arrival times shows that trains arriving early are the largest portion across every operator. In addition around 5% of the national PPM failures for 2014/15 have been by less than two minutes, which if added to the current MAA of just under 90% gives optimism that performance can reach the required regulatory targets in the coming years, despite the impacts of passenger growth.
• The recovery of performance has been aided by the fact that most Routes have seen less than 50% of the delay minutes attributable to the ‘Severe Weather’ category compared to 2013/14. However the impact of London Bridge has been severe on Southern services which were 10% below the period 13 plan for PPM.
• We have initiated an investigation into whether there is a case to answer in regards to NR’s performance for Scotland, GTR and Southern and will report to the Board in May as to whether we will progress this further. Should this happen then we intend to bring a decision to the Board in June on what regulatory action should be taken. This is being managed alongside the enhancements investigation and in the same timeframes as NR’s 2015/16 business plan workstream.
Asset Management Performance
• As part of the Final Determination the ORR attached particular importance to NR being able to demonstrate the link from asset knowledge and policies through to prioritised asset based workbanks. Where we did not find this for areas such as Civils and Structures we created the Civils Adjustment Mechanism to give NR more time to develop the robust plans required. The route based asset management indicator data is information NR need to manage their own business and was meant to allow NR to demonstrate it had robust asset based management data to allow it to make informed decisions. So far the quality of the data provided across a number of areas is completely unacceptable and we wrote to Mark Carne in December 2014 setting out our specific concerns on data quality.
• Whilst the number of un-planned TSRs has halved since a high in P12 of 2013/14 and the Composite Reliability Index has shown a reduction in the number of asset failure incidents, the company has significantly failed to deliver its own plan for the volumes of renewal and maintenance work across virtually all asset areas (in some cases by over 50%), for which it was funded in 2014-15. We have concerns about both the unit cost implications and the sustainability impact of this under delivery for some elements of the asset portfolio, as well as the future train performance implication this will create.
Office of Rail and Road November 2015 4

Enhancements performance
• Some significant enhancements were delivered during the year including the work at Reading and London Bridge. However a large number of important milestones have been missed particularly on electrification projects such as North West Phase 2, Rutherglen & Coatbridge and Great Western. The evidence we have seen both at the start of the project life-cycle with the ECAM submissions as well as the end of the life-cycle, when projects have come to the ORR for authorisation into operation service have highlighted significant shortcomings in; project development, programme and project management, integrated planning and cost control as well as portfolio management. As a result we have required NR to develop an improvement plan.
• The disruption to passengers caused by the Christmas overruns at Kings Cross and Paddington was unacceptable and constituted a breach of Network Rail’s licence. As a result there was a real focus on preparation for Easter when around 3,500 Network Rail worksites were taken across circa 1,000 possessions delivering almost £60m worth of engineering work. 99.7% of possessions were handed back without impact to the operators.
• As discussed at the March Board we have initiated an investigation as to whether we think there is a case to answer on NR’s performance on enhancements and will report to the Board in May as to whether we will progress this further. Should this happen then we intend to bring a decision to the Board in June on what regulatory action should be taken. This is being managed alongside the performance investigation and in the same timeframes as NR’s 2015/16 business plan workstream.
Financial performance Network Rail’s year to date expenditure is £99m adverse to its own budget. Network Rail is currently expecting to underperform our regulatory financial performance measure by around £321m in 2014-15 due to:
• Forecast £125m adverse performance against Network Rail’s own budget (see below); • Network Rail’s budget is itself around £95m higher than our PR13 financial assumptions for 2014-15 largely due to higher assumed Schedule
8 payments and track unit costs; and • Network Rail has estimated that we will make £100m of adjustments for forecast under-delivery of regulatory output requirements for train
performance and missed enhancements milestones. We are reviewing this so the final number may be different. • Redacted s.31 (1) (g) and (2) (c) Regulatory action.
Office of Rail and Road November 2015 5

Regulated outputs on a page
Areas Monitored Areas Monitored
Train Service Reliability - unit of measurement EnhancementsPublic Performance Measure (PPM) - annual target Delivery against scheme milestones
England & Wales Health and SafetyScotland
CP5 Performance PlanFranchised TOCs PPM Network Availability
C2C Possession Disruption Index – PassengerMerseyrail Electrics 2002 Ltd Possession Disruption Index – Freight
London Overground Network CapabilityArriva Trains Wales Maintenance of capability during CP5 (in terms of track
First Scotrail mileage & layout, line speed, gauge, route availabilityEast Midland Trains and electrification type
CrossCountry StationsGreater Anglia Station Stewardship Measure (SSM) per category
Northern Rail England & WalesLondon Midland Scotland
Southeastern Asset managementChiltern Delivery of Asset Management Excellence Model
South Western (AMEM) capability for each core group - Delivery of 72%East Coast by January 2018
Virgin Trains Asset Management Strategy & PlanningFirst Great Western Asset Management Decision-Making
Southern Lifecycle Delivery ActvitiesGovia Thameslink Railway Asset Knowledge Enablers
First Transpennine Express Organisation & People EnablersRisk & Review
Cancelled and Significantly Late (CaSL)England & Wales Asset data quality for each asset type - A2 by April 2017
C2C TrackMerseyrail Electrics 2002 Ltd Signalling
London Overground TelecomsArriva Trains Wales Electrical powerEast Midland Trains Buildings
CrossCountry StructuresGreater Anglia Earthworks
Northern RailLondon Midland Delivery of ORBIS milestones
SoutheasternChiltern
South Western Improvement in confidence from previous periodEast Coast Same confidence as previous period
Virgin Trains Reduction in confidence from previous periodFirst Great Western
SouthernGovia Thameslink Railway
First Transpennine ExpressFreight Delivery Metric (FDM)
National
CP5 Performance Plan
Progress against funded plan to maximise the reduction of risk of accident at level crossings
ORR confidence level re:
Network Rail delivery of
targets
ORR confidence level re:
Network Rail delivery of
targets
Office of Rail and Road November 2015 6

Railway operations CP5 performance plan Redacted s.31 (1) (g) and (2) (c) Regulatory action. We have accepted this but require that they deliver the CP5 Performance Plan, a summary of the operator level Performance Strategies, indicating how they plan to get back on the performance trajectory. We receive quarterly updates and this section is a commentary on our assessment. At the end of the third quarter, milestones scheduled to be delivered year-to-date in England and Wales were not delivered in their entirety. Of the 137 milestones completed year to date, 21 have been completed later than planned whilst 116 milestones were delivered on time or early. Of the 262 milestones in the plan yet to be delivered, 25 are likely to be delivered late. Thirty-one milestones are on hold or have been cancelled, the majority of which are due to duplicate milestones being removed and the PPRP Programme being rebaselined. We wrote to Network Rail at the end of Quarter 2 expressing concerns that the CP5 Performance Plan did not fully show how Performance Strategies were being adjusted to reflect changing circumstances. This was particularly relevant for routes where performance was below the levels expected when the plan was produced, notably in London and the Southeast. NR has since committed to delivering additional action (176 extra milestones, 171 of which are in England and Wales) designed to bridge the performance gap. Milestones have also been added to address the CaSL shortfall during the quarter.
At the end of quarter three, of the milestones scheduled to be delivered in Scotland year to date, 14 have been completed. Of these milestones 10 have been completed late, on average by 50 days. Of the 18 milestones yet to be delivered, 6 are forecast to be delivered late. Whilst in the main the plan is being delivered, we are concerned that the benefits from completed milestones are not having the planned effect on performance.
On Track Forecast to be delivered on time (including 176 new milestones)
218
Slipped Forecast to be delivered late
31
On Hold 6 Abandoned 25 Completed 151
(31 late, 34 early, 86 on time)
Milestone progress year-to-date in England, Wales and Scotland
Office of Rail and Road November 2015 7

Train service performance
Period: 2014-15 Period 12
P12 2014-15 P12 2013-14PP to
baseline% to PS target
% to year end PS target
% to year end Reg target P12 2014-15 P12 2013-14
PP to baseline
% to PS target
% to year end PS target
% to year end Reg target
Total England & Wales 89.6 % 89.8 % 0.2 % 1.3 % 1.4 % 2.3 % 2 Total England & Wales 2.9 % 3.0 % 0.2 % 0.5 % 0.5 % 0.7 %
First Scotrail 90.7 % 91.2 % 0.5 % 1.3 % 1.3 % 1.3 % 7 First Scotrail 2.3 % 2.1 % 0.2 % 2.3 % 2.3 % 0.2 %
P12 2014-15 P12 2013-14PP to
baseline% to PS target
% to year end PS target
% to year end Reg target P12 2014-15 P12 2013-14
PP to baseline
% to PS target
% to year end PS target
% to year end Reg target
Total England & Wales 65.8 % 67.4 % 1.6 % 65.8 % 65.8 % 1.6 % 2 Total England & Wales 2.48 2.52 1.6 %
First Scotrail 58.3 % 57.6 % 0.7 % 58.3 % 58.3 % 0.7 % 7 First Scotrail 1.99 1.98 0.4 %
2014-15 2013-14% to
baseline% to PS target
% to Reg target
% to Reg target
2014-15 2013-14% to
baseline% to PS target
% to Reg target
% to Reg target
England & Wales 6,324,612 6,735,702 6.1 % 0.8 % 0.8 % 2 Scotland 439,057 423,958 3.6 % 15.8 % 15.8 %
P12 2014-15 P12 2013-14% to
baseline% to PS target
% to Reg target
% to Reg target
P12 2014-15 P12 2013-14% to
baseline% to PS target
% to Reg target
% to Reg target
FDM MAA 94.4% 93.1% 1.3 % #DIV/0! 1.9 % #DIV/0! 2 3.33 3.75 11.1 % #DIV/0! 1.9 % #DIV/0!
P12 2014-15 P12 2013-14% to
baseline% to PS target
% to Reg target
% to Reg target
P12 2014-15 P12 2013-14% to
baseline% to PS target
% to Reg target
% to Reg target
PDI-P MAA 0.73 0.69 5.9 % #DIV/0! 25.2 % #DIV/0! PDI-F MAA 0.88 0.87 1.7 % #DIV/0! 20.6 % #DIV/0!
PDI - passenger MAA
Network Rail delays to freight MAA (DP100TKM)
Network Rail passenger delays (year to date)
Right time - MAA
PPM - MAA
Freight delivery metric(awaiting P11 data)
Network Rail passenger delays (year to date)
PDI - freight MAA
Freight
Average lateness - MAA
CaSL - MAA
Against targetAgainst baseline Against baselineAgainst target
At the end of Period 12, England & Wales PPM MAA was 89.6% which was 1.3pp short of the Period 12 performance strategy target. Scotland PPM MAA was 90.7% which was 1.3pp short of the Period 12 performance strategy target. England & Wales CaSL MAA ended the period at 2.9% which was 0.5pp worse than the Period 12 performance strategy target. There is no CaSL target for First Scot Rail. It is now statistically impossible that the end of year 2014-15 performance strategy targets for England and Wales (PPM and CaSL) will be achieved. It is also statistically impossible that the year-end performance strategy target in Scotland (PPM) will be achieved. However, we are taking an input based approach to regulation of national outputs in England and Wales in the first 2 years of CP5 and we are instead monitoring Network Rail performance through the inputs specified in the CP5 Performance Plan (see previous section) along with CaSL and PPM at TOC level (see next section). Underlying performance in England & Wales is below the levels assumed when the CP5 Performance Plan was produced and we expect to see evidence of the plan being adjusted to account for this and would expect NR’s business plan for 2015-16 to reflect this underperformance. Scottish performance continues to be a regulated target during the first 2 years of CP5. FDM MAA at the end of Period 12 stood at 94.4%, 1.9pp above the annual target of 92.5%. We therefore expect Network Rail to meet its year-end regulatory target. PDI-P – at the end of Period 11 – is 8% better than the Network Rail year end forecast and PDI-F – at the end of Period 12 – is 12% better than the Network Rail year end forecast.
Office of Rail and Road November 2015 8

TOC PPM (MAA) & CaSL (MAA)
PPM (MAA)
Franchised TOCs Arriva Trains Wales 92.8% 93.4% -0.6% 93.5% -0.7%c2c 96.9% 97.0% -0.1% 97.0% -0.1%The Chiltern Railway Co Ltd 95.0% 94.9% 0.0% 94.9% 0.1%CrossCountry 88.7% 88.7% 0.0% 89.0% -0.3%East Coast 88.2% 85.9% 2.3% 86.0% 2.2%East Midlands Trains 92.0% 92.8% -0.8% 93.0% -1.0%First Great Western 88.8% 90.1% -1.4% 90.3% -1.5%First Scotrail 90.7% 92.0% -1.3% 92.0% -1.3%First Transpennine Express 88.5% 91.2% -2.6% 91.0% -2.5%Govia Thameslink Railway 85.1% 87.8% -2.7% 88.0% -2.9%Greater Anglia 91.0% 92.3% -1.3% 92.3% -1.4%London Midland 88.0% 86.9% 1.1% 87.0% 1.0%London Overground 95.3% 96.9% -1.6% 97.0% -1.7%Merseyrail Electrics 2002 Ltd 95.6% 96.0% -0.4% 96.0% -0.4%Northern Rail 90.9% 91.4% -0.5% 91.4% -0.5%South Western 90.1% 91.9% -1.8% 92.0% -1.9%Southeastern 89.0% 90.4% -1.3% 90.5% -1.5%Southern 83.6% 87.5% -3.9% 87.8% -4.2%Virgin Trains 85.1% 85.5% -0.4% 85.5% -0.4%
Open access TOCs First Hull Trains 88.2% 84.0% 4.2% 84.0% 4.2%Grand Central 87.4% 83.8% 3.7% 84.0% 3.4%Heathrow Express Ltd 92.8% 93.7% -1.0% 93.8% -1.1%
Public Performance Measure (Moving Annual Average)
Period PS target and variance
CP5 year 1 PS target and variance 2014-15 Period 12
Targets
CaSL (MAA)
Franchised TOCs Arriva Trains Wales 2.6% 2.5% 0.1% 2.4% 0.2%c2c 1.3% 1.1% 0.2% 1.1% 0.2%The Chiltern Railway Co Ltd 1.5% 1.4% 0.1% 1.4% 0.1%CrossCountry 4.3% 4.5% -0.2% 4.5% -0.2%East Coast 3.9% 5.5% -1.6% 5.4% -1.5%East Midlands Trains 2.0% 2.2% -0.1% 2.2% -0.2%First Great Western 3.0% 2.6% 0.4% 2.5% 0.5%First Scotrail 2.3% 0.0% No target 0.0% No targetFirst Transpennine Express 4.3% 3.5% 0.8% 3.5% 0.8%Govia Thameslink Railway 4.3% 3.1% 1.2% 3.0% 1.3%Greater Anglia 2.5% 1.7% 0.8% 1.6% 0.9%London Midland 2.8% 2.8% 0.0% 2.7% 0.1%London Overground 1.8% 2.0% -0.2% 2.0% -0.2%Merseyrail Electrics 2002 Ltd 2.0% 2.0% -0.1% 2.0% 0.0%Northern Rail 1.8% 1.9% -0.1% 1.9% -0.1%South Western 2.6% 2.1% 0.5% 2.1% 0.5%Southeastern 2.8% 2.5% 0.3% 2.5% 0.3%Southern 4.6% 3.0% 1.7% 2.9% 1.7%Virgin Trains 4.9% 4.0% 0.9% 4.0% 0.9%
Open access TOCs First Hull Trains 4.9% 7.0% -2.1% 6.7% -1.8%Grand Central 4.3% 7.5% -3.1% 7.5% -3.2%Heathrow Express Ltd 1.6% 1.3% 0.3% 1.3% 0.3%
Cancellations and Significant Lateness (Moving Annual Average)
Period PS target and variance
CP5 year 1 PS target and variance 2014-15 Period 12
Targets
• At the end of Period 12, TOC level performance was below the targets specified in Performance Strategies for many operators, notably Southern, FTPE, and GTR. Fifteen out of nineteen TOCs failed to meet their profiled PPM MAA targets, the largest variances being Southern (3.9pp short of target), FTPE (2.6pp short of target), and GTR (2.7pp short of target). First ScotRail PPM MAA was 1.3pp worse than target at 90.7%. Twelve out of eighteen TOCs failed to meet their CaSL target, the worst operators being Southern and GTR who were 1.7pp and 1.2pp worse than target respectively.
• Southern performance continues to be below target, with PPM MAA 3.9pp below target and CaSL MAA 1.7pp below target at the end of Period 12. It is now arithmetically impossible for Southern to meet its year-end CaSL target (+0.2pp), with a period CaSL score of -14.3% in period 13 required to meet the year one target. Year to date, Network Rail delay minutes are 27.7% worse than target, with delay minutes associated with network management and other and non-track asset failures continuing to rise in the period. TOC-on-Self delay minutes impacting Southern performance (YTD) are 7.6% worse than target. ORR also believes that it is unlikely that GTR will meet its year-end PPM and CaSL targets. It is also arithmetically impossible that GTR’s year-end CaSL target will be met (+0.2pp), requiring a period CaSL score of -9.5pp in the remaining periods of the year to meet the target (+0.2pp). Network Rail’s delivery of performance for GTR and Southern are currently the most serious performance related issues on the Regulatory Escalator.
Office of Rail and Road November 2015 9

• FTPE performance remains below target, with the operator behind both its PPM and CaSL MAA targets by 2.6pp and 0.8pp respectively. It
is now arithmetically impossible for FTPE to meet its year-end CaSL target (+0.2pp), requiring a period CaSL score of -4.4pp in the remaining periods of the year to meet the target (+0.2pp). Network Rail caused delay minutes year to date remain over target (25.9% worse than the Performance Strategy target), with the non-track asset KPI group 21.3% worse year to date than at the same point last year. TOC-on-Self delay minutes for FTPE are 52.5% worse than target year to date, with fleet issues continuing to impact performance. Network Rail’s delivery of PPM and CaSL for FTPE is currently on the Regulatory Escalator.
• Greater Anglia PPM MAA finished the period at 91%, 1.3pp below target whilst CaSL MAA finished the period at 2.5%, 0.8pp below target. It is now arithmetically impossible for AGA to meet its year-end CaSL target (+0.2pp), requiring a period CaSL score of -5.7pp in Period 13 to meet the target (+0.2pp). Year to date, Network Rail caused delay minutes at the end of Period 12 were 21.2% worse than target, with delay minutes exceeding the levels experienced in 2013-14 in the track assets, non-track assets, network management and external KPI groupings. We have met with Anglia Route in the period to discuss the on-going reasons for performance shortfalls and to discuss actions being taken to address performance recovery. Network Rail’s delivery of CaSL for AGA is currently on the Regulatory Escalator.
• Southeastern CaSL MAA finished the period at 2.8%, 0.3pp above the Performance Strategy target and an improvement on the period 11 result. Network Rail’s delivery of CaSL for Southeastern is currently on the escalator.
• FGW performance remains below target, with the operator finishing the period 1.4pp below target for PPM (MAA) and 0.4pp below target for CaSL (MAA). It is now arithmetically impossible for FGW to meet its year-end CaSL target (+0.2pp) requiring a period CaSL score of -0.9pp in Period 13 to meet the target (+0.2pp). We believe that performance of external, network management and other, and non-track assets have all contributed to the CaSL shortfall. Network Rail’s delivery of PPM for FGW’s High Speed Services and FGW CaSL is currently on the escalator.
PPM (MAA)
FGW HSS 83.5 % 87.2% -3.7% 85.0% -1.5%LSE 88.8 % 91.7% -2.9% 90.6% -1.8%Regional 90.8 % 92.9% -2.1% 91.8% -1.0%
Public Performance Measure Targets
2014-15 Period 12 Period PS target and variance
CP5 year 1 PS target and variance
• SWT finished Period 12 with a PPM MAA score of 90.1% (1.8pp below target) and a CaSL MAA score of 2.6% (0.5pp below target). It is now arithmetically impossible for SWT to meet its year-end CaSL target (+0.2pp), requiring a period CaSL score of -2.1pp in Period 13 to meet the target (+0.2pp). Network Rail’s performance delivery to SWT is currently on the escalator.
• Virgin’s PPM MAA improved slightly during the period to achieve a result of 85.1% at the end of the period (0.7pp below target). CaSL MAA performance has also improved slightly to 4.9%, 0.9pp above target. It is now arithmetically impossible for Virgin to meet its year-end CaSL target (+0.2pp), requiring a period CaSL score of -5.3pp in Period 13. Network Rail’s CaSL delivery to Virgin is currently on the escalator.
Office of Rail and Road November 2015 10
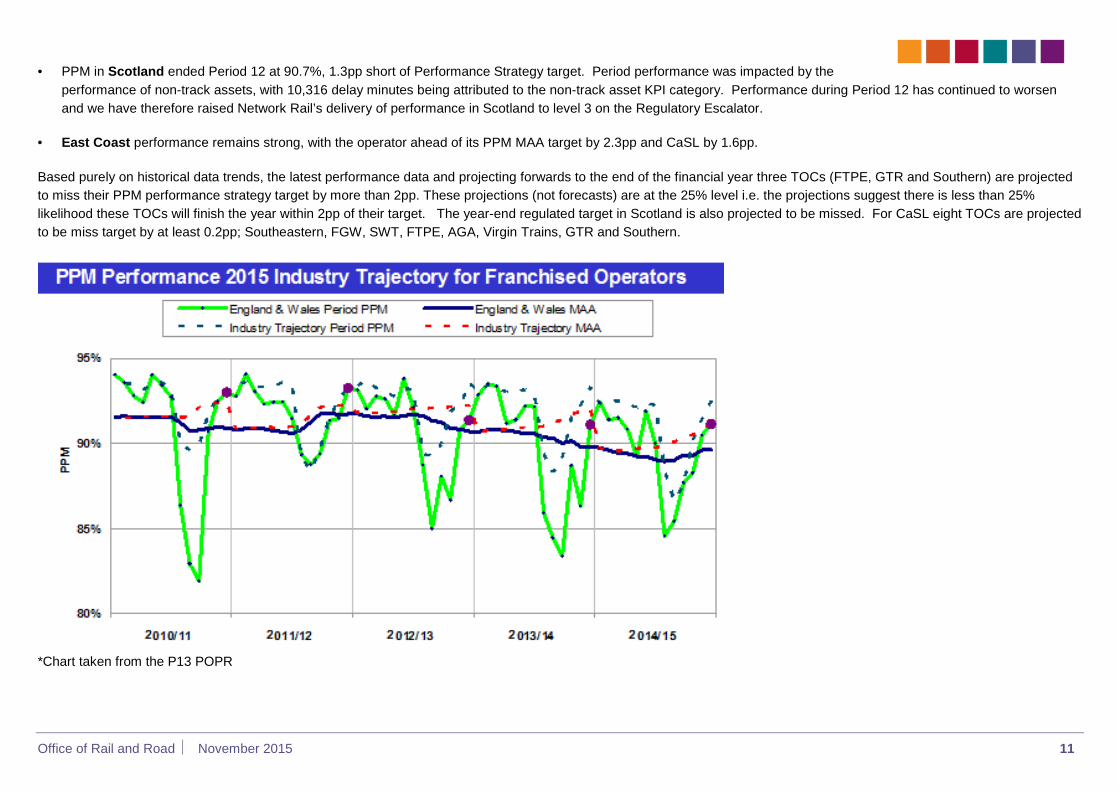
• PPM in Scotland ended Period 12 at 90.7%, 1.3pp short of Performance Strategy target. Period performance was impacted by the
performance of non-track assets, with 10,316 delay minutes being attributed to the non-track asset KPI category. Performance during Period 12 has continued to worsen and we have therefore raised Network Rail’s delivery of performance in Scotland to level 3 on the Regulatory Escalator.
• East Coast performance remains strong, with the operator ahead of its PPM MAA target by 2.3pp and CaSL by 1.6pp.
Based purely on historical data trends, the latest performance data and projecting forwards to the end of the financial year three TOCs (FTPE, GTR and Southern) are projected to miss their PPM performance strategy target by more than 2pp. These projections (not forecasts) are at the 25% level i.e. the projections suggest there is less than 25% likelihood these TOCs will finish the year within 2pp of their target. The year-end regulated target in Scotland is also projected to be missed. For CaSL eight TOCs are projected to be miss target by at least 0.2pp; Southeastern, FGW, SWT, FTPE, AGA, Virgin Trains, GTR and Southern.
*Chart taken from the P13 POPR
Office of Rail and Road November 2015 11

Office of Rail and Road November 2015 12

Asset performance Composite reliability index (CRI)
P12Composite Reliability Index 6.6% 0
Track contribution 0.7% 0Points contribution 0.9% 0Signalling contribution 0.8% 0Buildings contribution 1.2% 0Earthworks contribution 0.2% -0Electrical Power contribution 1.6% -0Structures contribution 2.4% 0Telecoms contribution -1.2% 0
1 2 3 4 5 6 7 8 9 10 11 12 13
Network Composite Reliability Index (CRI) - 2014/15 P12Return to Contents
The Composite Reliability Index (CRI) forms part of the CP5 replacement for the Asset Stewardship Indicator (ASI), along with the Composite Sustainability Index (CSI).
Scores are presented as a weighted percentage improvement on baselines taken at the end of CP4 (2013/14 P13).
More detailed breakdowns of the component measures are available in the other sheets of this report.
Direction: Higher is better
0.0%
1.0%
2.0%
3.0%
4.0%
5.0%
6.0%
7.0%
P01 P02 P03 P04 P05 P06 P07 P08 P09 P10 P11 P12 P13
Target Forecast Actual
GREEN = above target AMBER = below target but above baseline RED = below target and baseline
The period 12 Composite Reliability Index (CRI) has exceeded ‘stretch target’ with reliability continuing to improve overall although this is somewhat skewed by buildings and electrification results. The baseline is taken as at exit CP4 and any improvement above the zero (0%) mark is an indication that the reliability is improving in terms of a reduction in number of defects. The intention is that fewer defects will lead to an improvement in performance. The red line is a ‘stretch target’. The current delivery plan target is set at 3%.. Network Rail has only committed to the delivery plan target so it has achieved its objective. Apart from plain line and conductor rail renewals, all other asset groups are well behind schedule and NR is unlikely to meet year end targets. Maintenance work has been significantly under-delivered according to the RF9 report. Asset management issues account for 32 of the top 50 incidents in period 12. Track circuit failures delay minutes were up considerably (60%) when compared with the same period last year and year to date they are 10% higher than last year. Delay minutes for signal, signalling system and power supply failures (12%) and points failures (13%) are also up in the year to date.
Office of Rail and Road November 2015 13

Renewals volumes
Office of Rail and Road November 2015 14

Enhancements Regulated milestones tracker
Key: Milestones highlighted red indicate missed milestones which had a notable impact on Network Rail’s customers. Milestones highlighted yellow missed milestones which had no or some impact on Network Rail’s customers.
Office of Rail and Road November 2015 15
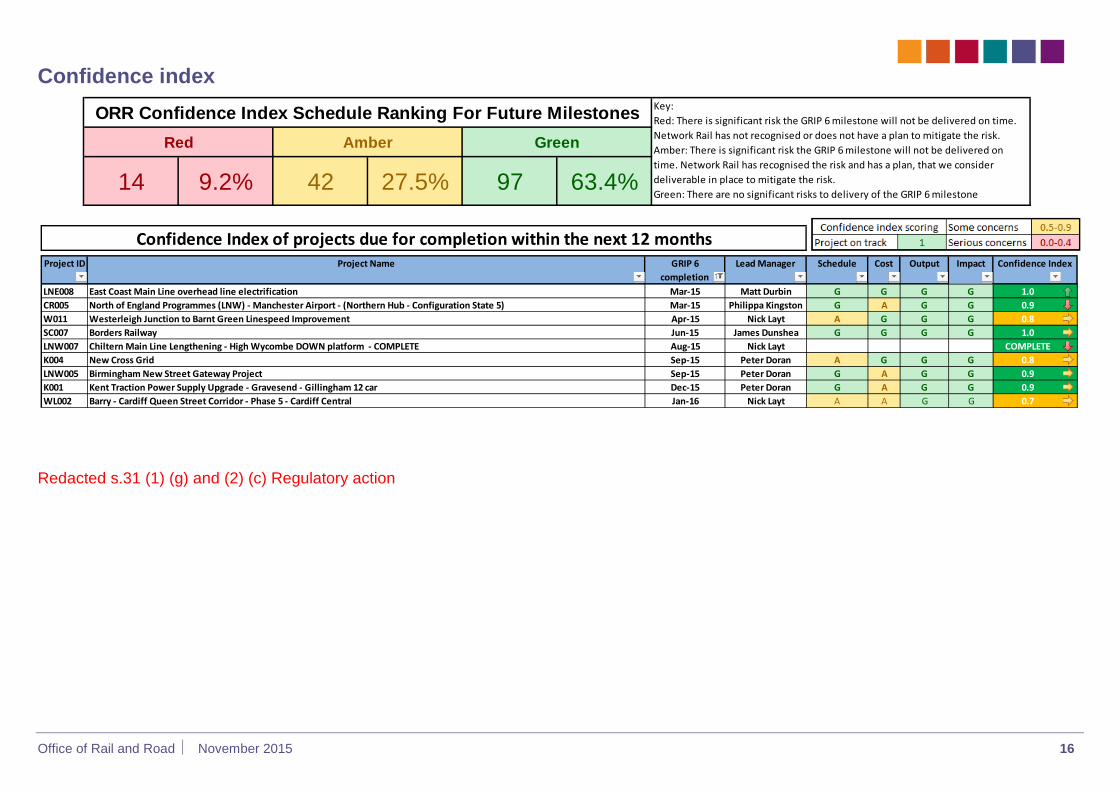
Confidence index
Key:Red: There is significant risk the GRIP 6 milestone will not be delivered on time. Network Rail has not recognised or does not have a plan to mitigate the risk.Amber: There is significant risk the GRIP 6 milestone will not be delivered on time. Network Rail has recognised the risk and has a plan, that we consider deliverable in place to mitigate the risk. Green: There are no significant risks to delivery of the GRIP 6 milestone
ORR Confidence Index Schedule Ranking For Future MilestonesRed Amber Green
14 9.2% 42 27.5% 97 63.4%
Confidence Index of projects due for completion within the next 12 monthsProject ID Project Name GRIP 6
completionLead Manager Schedule Cost Output Impact
LNE008 East Coast Main Line overhead line electrification Mar-15 Matt Durbin G G G G 1.0CR005 North of England Programmes (LNW) - Manchester Airport - (Northern Hub - Configuration State 5) Mar-15 Philippa Kingston G A G G 0.9W011 Westerleigh Junction to Barnt Green Linespeed Improvement Apr-15 Nick Layt A G G G 0.8SC007 Borders Railway Jun-15 James Dunshea G G G G 1.0LNW007 Chiltern Main Line Lengthening - High Wycombe DOWN platform - COMPLETE Aug-15 Nick Layt A G G G COMPLETEK004 New Cross Grid Sep-15 Peter Doran A G G G 0.8LNW005 Birmingham New Street Gateway Project Sep-15 Peter Doran G A G G 0.9K001 Kent Traction Power Supply Upgrade - Gravesend - Gillingham 12 car Dec-15 Peter Doran G A G G 0.9WL002 Barry - Cardiff Queen Street Corridor - Phase 5 - Cardiff Central Jan-16 Nick Layt A A G G 0.7
Confidence Index
Redacted s.31 (1) (g) and (2) (c) Regulatory action
Office of Rail and Road November 2015 16
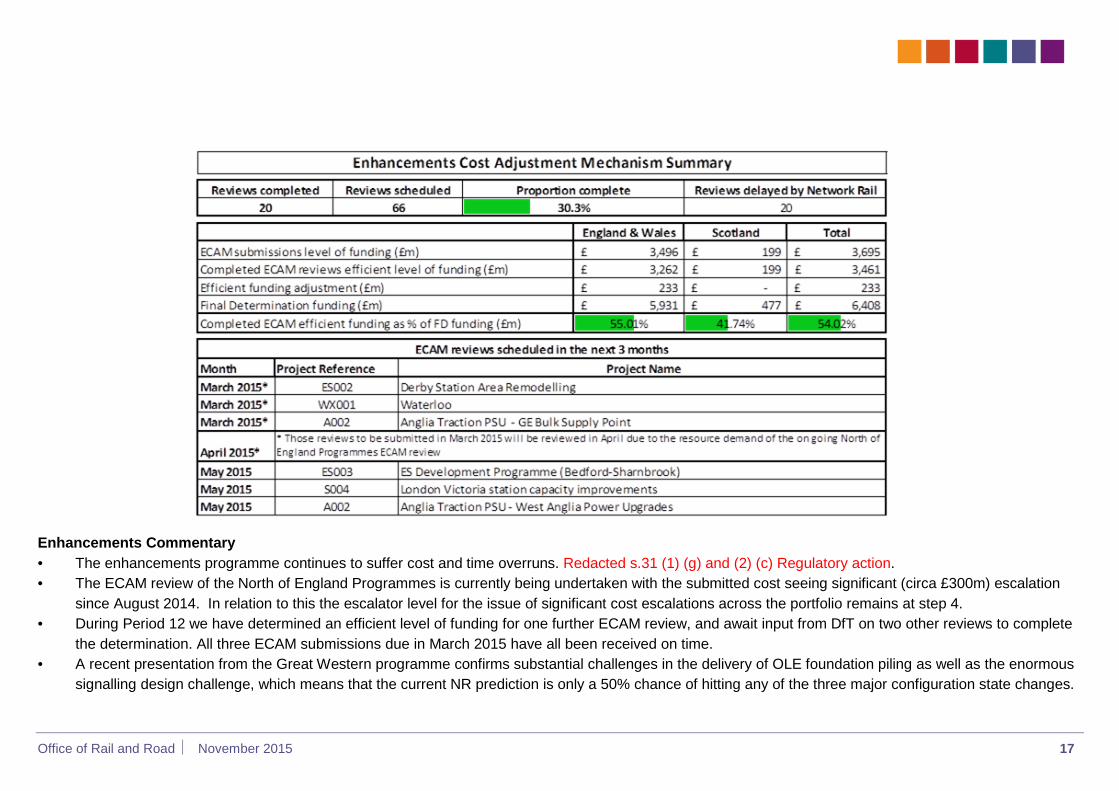
Enhancements Commentary • The enhancements programme continues to suffer cost and time overruns. Redacted s.31 (1) (g) and (2) (c) Regulatory action. • The ECAM review of the North of England Programmes is currently being undertaken with the submitted cost seeing significant (circa £300m) escalation
since August 2014. In relation to this the escalator level for the issue of significant cost escalations across the portfolio remains at step 4. • During Period 12 we have determined an efficient level of funding for one further ECAM review, and await input from DfT on two other reviews to complete
the determination. All three ECAM submissions due in March 2015 have all been received on time. • A recent presentation from the Great Western programme confirms substantial challenges in the delivery of OLE foundation piling as well as the enormous
signalling design challenge, which means that the current NR prediction is only a 50% chance of hitting any of the three major configuration state changes.
Office of Rail and Road November 2015 17

Finance and efficiency
As shown in Tables 1 and 2 Network Rail has not made a good start to its CP5 efficiency challenge. Network Rail’s year to date expenditure is £99m adverse to its own budget. Network Rail is currently expecting to underperform1 our regulatory financial performance measure by around £321m in 2014-15 due to:
a) Forecast £125m adverse performance against Network Rail’s own budget (see below); b) Network Rail’s budget is itself around £95m higher than our PR13 financial assumptions
for 2014-15 largely due to higher assumed Schedule 8 payments and track unit costs; and
c) Network Rail has estimated that we will make £100m of adjustments for forecast under-delivery of regulatory output requirements for train performance and missed enhancements milestones. We are reviewing this so the final number may be different.
Redacted s.31 (1) (g) and (2) (c) Regulatory action. Table 2: Explanatory Notes This information is from the Network Rail Period 12 Finance Pack (period end 7 Mar. 2015). Note that we are working with Network Rail on changes to the presentation of the Finance Pack to make it consistent with our PR13 Final Determination e.g. separately show operations and support costs. Please note the following in relation to the above financial information:
1. Variances that do not count for financial out/underperformance include items such as renewals that have been deferred to later in the control period.
2. The Capex performance adjustment is a 75% add back to the renewals and enhancements net overspend which counts towards the financial performance measure. This aligns with Network Rail’s financial reward/penalty for renewals and enhancements expenditure through the RAB roll forward mechanism. The capex overspend which counts towards the financial performance measure cannot easily be seen in this table because it is more than offset by the significant level of renewals and enhancements deferrals which are excluded from the measure.
3. Because Network Rail achieved lower efficiency savings in the final year of CP4 than we assumed in our PR13 determination the company has more work to do in CP5 to deliver the efficiency challenge set out in our PR13 determination.
4. The adjustment for missed regulatory outputs represents Network Rail’s estimate of anticipated ORR adjustments for not meeting the train performance target in 2014-15, based on our assessment in 2013. We will review this so the final number may be different. Network Rail has not recognised a proportion of this adjustment in the year to date figures.
1The terms financial out/(under) performance are used to compare Network Rail’s actual income and expenditure with the agreed assumptions in our periodic review determination.
Table 1: Income and expenditure for Great Britain in 2014-15 £m Year to date Full year forecast
Budget Actual Variance b/(w)
Budget Full Year Forecast
Variance b/(w)
Turnover 1,375 1,392 (17) 1,553 1,563 (10) Schedule 4 (226) (157) 69 (244) (196) 48 Schedule 8 (57) (98) (41) (50) (118) (68) Operations, support & maintenance
(1,971) (1,998) 27 (2,229) (2,217) 12
Capex – Renewals (3,104) (2,565) 539 (3,423) (2,877) 546 Capex - Enhancements (3,219) (3,058) 161 (3,532) (3,362) 170 Total (7,202) (6,484) 738 (7,925) (7,207) 674
Table 2: Regulatory financial performance measure for Great Britain in 2014-15
£m Year to date b/(w)
Full year forecast b/(w)
Income less expenditure (see Table 1) 738 674 Variances that do not count for out/underperformance (1) (1,011) (995) Capex performance adjustment (2) 174 194 Financial performance compared to Network Rail budget (99) (127) Network Rail budget compared to PR13 (3) (90) (95) Adjustments for missed regulatory outputs (4) - (100) Total financial performance (189) (321)
Office of Rail and Road November 2015 18

Network Rail’s financial performance in Scotland Year to date financial performance is broadly in line with Network Rail’s own budget. The full year forecast financial performance is £1m worse than Network Rail’s own budget due in part to worse performance across opex & maintenance and schedule 8. Redacted s.31 (1) (g) and (2) (c) Regulatory action Efficiency We are working with Network Rail to include an efficiency number in this report. Network Rail’s borrowing Network Rail is currently expecting that its debt for Great Britain at 31 March 2015 will be £37.1 billion which is £0.1 billion higher than its budget forecast. The amount of new borrowing available from DfT is limited to £30.3 billion across CP5. Network Rail currently considers that it can deliver its regulatory requirements within the borrowing limits. However, there is uncertainty due to the potential effect of the CP5 Enhancements Cost Adjustment Mechanism (ECAM), which will not be finalised until 2015-16. This issue is currently being investigated as part of the Business Plan update. Currently Network Rail expects to finish 2014-15 in line with but not exceed the annual ‘notified borrowing’ amount agreed with DfT. However Network Rail have a Treasury Management policy of targeting a cash balance of £0.3-£0.5bn which provides a level of contingency to cover unforeseen spend. Purpose of this section This section of the tracker is discussing two different ways of looking at Network Rail’s financial performance – Network Rail’s spend against its own budget2 (Table 1) and it’s spend against our regulatory financial performance3 measure (Table 2), which takes into account Network Rail’s delivery of regulated outputs and the sustainability of its asset management, in order to determine how Network Rail has performed in relation to our determination. The baseline for the regulatory performance measure is our PR13 determination and we ensure that Network Rail does not benefit where work is delayed (i.e. deferral of work to later periods). We are working with Network Rail to include an efficiency number in this report. Network Rail is currently in the process of updating its business plan. There is a separate agenda item covering this issue.
2 The table provides a summary of Network Rail’s expenditure against its own budget in order to illustrate what Network Rail has spent during the year and no adjustments are made to it for issues like deferrals as in this table we are concerned with the actual variance in expenditure.
3 We restrict the measurement of efficiency to reductions over time in core support, operations, maintenance and renewals expenditure (SOM&R). Historically, we have used the term efficiency to describe a reduction in expenditure that Network Rail needs to make whilst delivering the outputs that it is required to deliver. The Financial Performance Measure (FPM) is a more encompassing measure of total financial performance covering most items of Network; Rail’s income and expenditure.
Office of Rail and Road November 2015 19

Redacted s.31 (1) (g) and (2) (c) Regulatory action
Office of Rail and Road November 2015 20

Redacted s.31 (1) (g) and (2) (c) Regulatory action
Office of Rail and Road November 2015 21

Notes and definitions PPM Public performance measure, of trains arriving at destination, having made all booked calls, within five minutes of scheduled arrival time (ten minutes for long distance services). CaSl Cancellations and significant lateness, is a combined measure of punctuality and reliability. It captures the percentage of scheduled passenger trains which are either cancelled (including those cancelled en route), miss one or more scheduled stops or arrive at their scheduled destination 30 or more minutes late. MAA Moving annual average. The MAA for a given period is the average value of the previous 13 periods, including the period itself. Note that this is different to a centred MAA which, for a given period data point, averages the previous and future 6 periods. Unless otherwise stated, all MAAs used in ORR publications are not centred MAAs. PDI Passenger disruption index (PDI-P) – measures the impact of engineering possessions on excess journey time as experienced by passengers. This is calculated as: PDI-P = (excess journey time* ”Busyness” Factor) * (No. of passengers*time of day weighing * economic value of time) divided by (total scheduled passenger km). Freight disruption index (PDI-F) – measures the ‘unavailability’ of track for freight use, weighted by relative levels of freight traffic operated over each track section. This is calculated as: PDI-F = (Average freight tonne km per route section divided by Average freight tonne km for network) * (Track km available divided by total track km) Both indices take a base value of 1.0 in 2007/08. Values greater than 1 indicate a worsening of disruption compared to 2007/08.
FDM The calculation for deriving FDM differs from PPM as there is a uniform measure for the entire freight network; each train being 'on time' if it arrives at its final destination within 15 minutes of its scheduled arrival time. It only covers delay caused by Network Rail. Right Time Right time performance measures the percentage of trains arriving at their terminating station early on within 59 seconds of schedule. Baseline This refers to the previous year or the corresponding period in the previous year. Targets Three types of targets are used in the NPPR: (a) CP5 regulatory outputs – these are the targets for which Network Rail are
assessed against by ORR (b) Performance Strategies (PS) targets – these are targets agreed between the
operator and NR. They are usually (but not always) more stretching than CP4 targets. JPIP targets are also available at a greater level of disaggregation than CP4 targets (e.g. by delay cause or by route).
(c) NR internal targets – usually only for route level delay minutes CP5 Performance Plan Network Rail’s performance milestone tracker shows a trajectory, of milestone delivery target versus actual delivery. The critical path is shown throughout the tracker and actual delivery of actions is marked on the tracker by showing the actual number of milestones delivered on time, early or late each period in relation to the critical path. The tighter the distribution to the critical path; the more milestones are being delivered on target.
Office of Rail and Road November 2015 22

Train Service Performance (page 7): Colour schemes
TOC PPM (MAA) & CaSL (MAA) (page 8): Colour schemes
The TOCs highlighted in red are long-distance operators who were given more lenient PPM targets
Office of Rail and Road November 2015 23

Summary of enhancement projects referenced in this report A001 - Ely North Junction Capacity Improvement - The project is to provide appropriate infrastructure improvements at Ely North Junction to allow for an increase in train capacity at that location (passenger and freight using the single leads). A002 - Anglia Traction Power Supply Upgrade - The project will develop the requirements for electric traction power to provide additional power to support the capacity increases into London Liverpool Street. IT will also consider the implications associated with future service increases and rolling stock changes in CP6 (funding outside PR13). CR002 – Reading Station Area Redevelopment - the programme of work delivers a major capacity, capability and performance enhancement across the Reading station area and its approaches. CR003 – East West Rail – This project will provide the capacity for direct rail services between Oxford / Aylesbury and Milton Keynes / Bedford. CR005 – North of England Programmes (LNW) - This programme incorporates the outputs from the Northern Hub, North West Electrification and North Trans-Pennine Electrification West in LNW Route. CR006 – Mobile Maintenance System – This project will deliver bespoke maintenance trains that support a new way of working for maintenance personnel enabling delivery of core maintenance and campaign works in a more efficient manner leading to improved utilisation of track access. CR007 - Acton (Great Western Main Line) to Willesden (West Coast Main Line) Electrification - This project provides capability for electric passenger and freight train operation between the Great Western Main Line and the West Coast Main Line for timetabled and diverted services. CR009 - FTN/GSM-R inclusion of freight-only branch lines - The project accommodates all remaining (i.e. as yet without GSM-R system coverage) single-ended freight-only branch lines (i.e. those that lie north of a line drawn between the Severn Estuary and the Wash) that are operational and within Network Rail controlled infrastructure boundaries (NRCI) into the FTN/GSM-R Programme scope. EM001 - MML Long-Distance High-Speed Services Train Lengthening – This project improves infrastructure capability to enable the introduction of longer trains on the MML on selected services in order to accommodate forecast levels of
passenger growth and reduce crowding on MML LDHS between London St. Pancras and Nottingham and Sheffield. EM002 - St Pancras – Sheffield line speed improvements - This project will improve the capability of the infrastructure to enable a minimum eight minute improvement in journey times between London and Sheffield for Class 222 operated services calling at Leicester, Derby and Chesterfield. ES001- Midland Main Line Electrification - This project will extend electrification north of Bedford (Corby, Nottingham and Sheffield). ES002 – Derby Station Area Remodelling - The project will provide a remodelled track and signalling layout that will segregate services approaching Derby from the north from those services approaching Derby from the south and west, and thus remove the current bottleneck situation at Derby Station. ES003 – Electric Spine Development Programme - The ES development programme will establish a scope for, and programme for implementation of, schemes to meet the Government’s objectives the development of a major north-south rail electrification and capacity enhancement referred to as the ‘Electric Spine’. F006 –Strategic Freight Network This fund will deliver improvements identified by the industry to continue rail freight expansion in England and Wales whilst stimulating wider economic growth and environmental benefits. The current scope of works includes work at Peak Forest, Ipswich Yard, and Southampton to West Coast Main Line train lengthening. K001 - Kent Traction Power Supply Upgrade - The project will provide the power to facilitate 12 car operation on remaining routes, as per the operating plan, and consistent with the post 2018 timetable specification. K002 - Route 1 – Power Supply Enhancements - This project is required in order to provide the necessary infrastructure to facilitate the operational plan assumed with train operators to deliver the CP4 HLOS capacity metrics. K004 – New Cross Grid - This project will provide enhanced traction supply capacity to support the train lengthening and frequency requirements of train services in CP4 and beyond. LNE001 - Northern Programme (Yorkshire) - This programme will deliver infrastructure to support the illustrative train service specification supporting Northern Hub and TransPennine electrification.
Office of Rail and Road November 2015 24

LNE003 - LNE Routes Traction Power Supply Upgrade - This project will provide power supply upgrade development work to enable the delivery of required power to support growth in CP6. LNE004 - Stevenage and Gordon Hill Turnbacks - This project delivers the capacity metric into Moorgate and King’s Cross providing for efficient use of suburban rolling stock by allowing services to turnback at Stevenage and Gordon Hill hence providing efficient resourcing for peak capacity on Inner Suburban services into King’s Cross and Moorgate. LNE008 – East Coast Main Line Overhead Line Electrification – The output of this project is to reduce delay minutes to support the delivery of the route performance plan as part of the CP4/5 Long Term Performance Plan. LNW001 – Amalgamated into CR005 LNW004 - West Coast Power Supply Upgrade – This project is remitted to upgrade sections of the WCML to a 12kA autotransformer (AT) system. LNW003 – Stafford Area Improvement Scheme - The project will deliver the capability for two additional, off peak, fast line paths from London to the North West (each direction), one additional path per hour on the Birmingham-Manchester axis (each direction) and one additional freight path per hour through Stafford, again in each direction. LNW005 - Birmingham New Street Gateway Project – This project includes various station works with the main concourse due to be open for passengers in September 2015. LNW006 - Walsall to Rugeley Trent Valley Electrification - This project will provide the infrastructure to enable the running of electric rolling stock between Walsall and Rugeley Trent Valley. LNW007 - Chiltern Main Line Train Lengthening – This project will deliver the infrastructure to accommodate an additional 1000 passengers during the morning 3 hour peak into London Marylebone including platform extensions at five key stations. S003 – Uckfield Line Train Lengthening – This project will provide extra capacity between East Croydon and London Bridge, and on the Oxted Line by enabling 10-car trains to operate. S004 - London Victoria Station Capacity Improvements - The project will increase passenger capacity at London Victoria station. S005 - Balcombe to Copyhold Bi-directional Signalling Upgrade - This project provides infrastructure to enable improved engineering access, and reduced
disruption when access is taken, on the Brighton Mainline between Haywards Heath and Three Bridges through the provision of an improved bi-directional signalling functionality. SC002 - EGIP – Initial Phase Key Output 1 - This project will electrify the route between Newbridge Junction and Glasgow Queen Street and extend platform lengths. SC003 - EGIP – Initial Phase Key Outputs 2, 3 & 4 - This project will remodel Glasgow Queen Street station to permit the operation of 8 car trains on the main Edinburgh / Glasgow route and increase line speeds where appropriate to deliver a 42 minute fastest journey time between Edinburgh Waverley and Glasgow Queen Street. SC004 - EGIP – Edinburgh Gateway (Gogar) Intermodal Transport Interchange (Advance Works) - This project will complete GRIP 5 and advanced works for the new station at Edinburgh Gateway which will be delivered as part of EGIP KO1. SC006 - 2013 Advance Route Clearance Programme (Other Routes) - This project will undertake advance route clearance works at various structures to facilitate the electrification of the route to Stirling Dunbland and Alloa included in the rolling Programme of Electrification (Scotland). SC007 - Borders Railway - This project will provide a new rail route between Newcraighall and Tweedbank with 7 new stations to permit operation of a half hourly passenger service with a maximum 44 minute journey time between Newcraighall and Tweedbank. SC008 - Rolling Programme of Electrification (Scotland) - This project will electrify the routes to Stirling, Dunbland and Alloa and the Shotts Line to permit services to be operated by electric trains to contribute to Scottish government environmental targets and support the EGIP KO4 outputs. SC011 - Motherwell Area Stabling - This project will electrify the remaining ‘back of Shops’ sidings to permit the stabling of additional EMUs at Motherwell required by the electrification with a longer term target to consolidate all stabling at Motherwell on one site with appropriate cleaning and servicing facilities. SC012 - Motherwell Resignalling Enhancements - This project will, in conjunction with the renewal of Motherwell signalling assets, provide appropriate and cost effective enhancements where appropriate including reduced headways and bi-di signalling.
Office of Rail and Road November 2015 25

SC013 - ECML (North) – WCML (Carstairs) Gauge Enhancement - The project will deliver infrastructure enhancements to permit W12 gauge traffic to operate between Temple Hirst Junction and Carstairs. W001a – Great Western Electrification – This project will extend the electrification of the Great Western Main Line (GWML) from Maidenhead (the furthest extent of the Crossrail project)to Cardiff. W001b – South Wales Main Line Electrification – This project will extend the electrification of the Great Western Main Line (GWML) from Cardiff (the furthest extent of the Great Western Electrification project) to Swansea. W002b - Intercity Express Programme: Specific GWML Capacity Schemes - To provide infrastructure capacity to enable the operation of the proposed enhanced timetable on the Great Western Main Line (GWML) from May/September 2018 onwards following the delivery of the new Class 800 and Class 801 trains. W003 – Thames Valley Branches - The project will facilitate the introduction of electric train operation on the Thames Valley branches, replacing diesel trains for cascade to the West, providing additional capacity for both the Thames Valley and the West of England. W004 - Thames Valley Electric Multiple Unit Capability Works – This project will provide infrastructure capability enhancements to enable the operation of EMUs in the Thames Valley area – Paddington to Newbury, Oxford and associated branch lines. W008 - Bristol Temple Meads Station Capacity (incl. Midland Shed) – This project will provide additional access and circulation at Bristol Temple Meads and
the reinstatement of platforms within the Midland Shed capable of accommodating a 260m long 10 car SET. W011 - Westerleigh Junction to Barnt Green Linespeed Improvement - This enhancement will provide a linespeed increase to 100mph for the majority of the route, resulting in increased performance robustness. WL001 - Welsh Valley Lines Electrification - The scheme will enable the more efficient operation of passenger services on the Valley Lines network, replacing ageing diesel traction with electric trains. WL002 - Barry – Cardiff Queen Street Corridor - This project facilitates the increase of south Wales valley line services from 12 trains per hour to 14 trains per hour through the central Cardiff corridor by the end of CP4 (March 2014) and to 16 trains per hour by May 2016. WX001 – Waterloo - The primary drivers of this programme are to deliver CP5 HLOS capacity metrics, address the impacts of forecast growth into London Waterloo station on the wider South West route and facilitate continued growth expectations into future control periods. WX005 - Package 7, 10 Car South West Suburban Railway - This project allows 10 car operation on suburban services on the Wessex route into Waterloo.
Office of Rail and Road November 2015 26