assessment of network rail's cp4 and cp5...
TRANSCRIPT

Assessment of Network Rail's CP4 and CP5 Savings
Asset Management Segment
ORR Office of Rail Regulation
Hamburg / London, July 2012
12 July 2012

OR
R_R
epor
t-v10
-120
712.
pptx
©
civ
ity 2
012
///
Content
• Summary • Introduction • Synthesis of existing studies • Appraisal of Network Rail's plans • Projections • Conclusions Appendix
2
OR
R_R
epor
t-v10
-120
712.
pptx
©
civ
ity 2
012
///
Summary (1 of 7)
With a mandate from the ORR in March 2012, have undertaken a brief cross-sectional analysis of various consultants’ reports – emerging from the Value for Money Study – on Network Rail’s progress with regard to maintenance and renewal efficiency in CP4, combined with an outlook for CP5 and beyond. Whilst the initial focus was on asset management related savings a broader view was adopted for reasons of practicality.
In this report we summarise our consolidated view, based on findings from document analyses and interviews with authors of various available studies, on an extensive exchange of information with and additional material from Network Rail, complemented by our own experience with efficiency improve-ment practice at other European infrastructure organisations and indicative estimates of "frontier" efficiency targets for Network Rail on its way to international best-practice.
Recent assessments by the ORR have come to the conclusion that Network Rail is not delivering ("breach of concession") the agreed performance targets for punctuality in the freight and long-distance passenger services, which has raised doubt whether the earlier determined outputs of maintenance and renewal are being delivered.
Furthermore, the most recent ORR "Annual Efficiency and Finance Assessment of NR" from September 2011 has concluded that although Network Rail has made significant progress in key efficiency measures and even underspent in some areas as compared to the ORR’s own assumptions, there is serious concern that substantial deferral of activities is part of the reason and that there is consequently a "growing delivery challenge" putting NR at risk of not being able to deliver the expected outputs over the years to come.
3
OR
R_R
epor
t-v10
-120
712.
pptx
©
civ
ity 2
012
///
Summary (2 of 7)
All-in-all, there appears to be broad consensus among the reporters to the ORR that Network Rail may be able to achieve the "financial targets" for the end of CP4 which should result in projected total savings of 21 % over the control period. However, consultants express reservations that the "robust-
ness" of expectations in some asset categories is weaker than in others. Yet, for the most relevant cost categories, especially track structures, consultants are confident. Network Rail, in their March 2012 delivery update, have announced an outperforming savings projection of 23 % for CP4.
The longer term "sustainability" of financial efficiency, on the other hand, is quite unanimously put into question by the various consultants. This is in line with the above mentioned material concern of the ORR, that the observed deferral of projects represents a significant part of Network Rail’s reported underspent and can therefore not be counted as genuine "efficiency gains". Accordingly consultants’ ratings for Network Rail’s "sustainability" of the improvement trajectory are consensually expressing scepticism.
All consultants however point out and highly acknowledge that Network Rail are undertaking a vast number of initiatives simultaneously and are making good progress in many areas.
strongly supports this view and at the same time, in doing so, has practical concerns (see below) that the entire Network Rail organisation may be over-burdened by the complexity of the transformation, putting it at risk that ultimately less might be delivered and at a slower pace as compared to a more focused and manageable improvement program.
In the analyses available to us the current status of many initiatives is described as "work in progress" and consultants see a number of tasks still to be undertaken and furthered, among them most prominently the development of asset policies and associated whole life cost models. Consultants consistently believe that quite a number of important initiatives have not reached implementation stage yet, in effect qualifying them as running behind schedule.
4

OR
R_R
epor
t-v10
-120
712.
pptx
©
civ
ity 2
012
///
Summary (3 of 7)
Due to these missing elements, the "life-cycle-cost efficiency" (which is the third measure used by the ORR) is given low ratings throughout and considered to be still in its infancy. This obviously implies that whole life cost-optimal asset policies have not yet been fully analysed and determined by Network Rail, hence opportunities for further improvement remain.
In carrying out this analysis we have found a number of very thorough and comprehensive qualitative reports, while quantitative analyses are fewer. Those quantitative analyses that were available to us are broadly consistent in their upper savings estimates for asset management. They give projections for total annual savings in a range of under £ 20 m up to £ 200 m until the end of CP5, referring to a cost base of £ 3.5 bn for maintenance and renewal. Furthermore significant one-off savings are quoted as a result of faster or slower implementation of practices along the trajectory.
It is surprising in the first place that the minimum to maximum ranges given are so high. Further discussions with the studies’ authors show, that these variations are also due to uncertainties about degree and pace of implementation rather than discrepancies in underlying calculations only. is of the opinion that in some important areas achievable savings from asset management could be significantly higher. This applies primarily to the utilisation of possessions together with worksite optimisation and prolonged life of track-structures.
Various reports highlight the fact that there is a risk of double-counting and some initiatives require investment and precursor activities before generating benefits. Hence, some quotes of gross figures for savings need to be interpreted with caution. Clear-cut cost-benefit analyses for key measures requiring prior investment were not available to . It was not in the scope of s brief analysis to go further than this.
5
OR
R_R
epor
t-v10
-120
712.
pptx
©
civ
ity 2
012
///
Summary (4 of 7)
Looking forward into CP5, consultants are convinced that Network Rail still has to undertake significant planning and preparatory work before a solid business plan can be established. Network Rail also acknowledge that plans are still in the making, but already envisage further savings. Network Rail will hold itself accountable for achieving about half of the addressable McNulty-objective (i.e. 16 % in CP5). The balance is expected to require cross-industry cooperation in the sense of the McNulty report in order to overcome barriers that are not in Network Rail’s hand alone.
A "fundamental change" of management culture and a "new model" of delivering outputs in cooperation with contractors will – in NR’s own words – be a prerequisite to deliver these savings.
Observers and reporters express concern whether Network Rail as an organisation is ready for such wide-ranging changes, also with regard to the fact that centrally developed tools and practices, only under development now, will at the same time need to be transposed into the devolved route organisation, which is being established at present. The complexity and simultaneousness of transformation programs is a critical challenge.
Network Rail has made it clear to , that the envisaged savings for CP5 by all means require a "stretching" of internal goals. Although the underlying areas of improvement for CP5 have been identified in broad terms, further work to validate, specify and operationalise is needed.
believes there is also more work to be done to systematically assess the economic impact of improvement programmes together with aspects of likelihood and pace of implementation in order to better define priorities. This is even more important as an overwhelming number and complexity of initiatives have been launched in parallel, a situation that risks to overburden Network Rail’s management.
6

OR
R_R
epor
t-v10
-120
712.
pptx
©
civ
ity 2
012
///
Summary (5 of 7)
A closer look at the breakdown of savings by individual measures shows that relatively few initiatives account for the bulk of total results. Hence, a narrower focus on key initiatives is more than permissible without sacrificing opportunities.
Therefore and with regard to good practice in other European countries, believes that some key areas for cost savings should get more attention by Network Rail than currently highlighted in the reports. Among those are
• a paradigm shift to very high quality standards in asset management, especially for track structures (including substructures and foundations) with a resulting potential for substantially extended lifetimes leading to far lower renewal requirements,
• a similar effort for reliability-centred maintenance of train control and signalling equipment, which typically accounts for most of the system downtime (and corrective maintenance) causing train-delays (already dealt with at Network Rail),
• an industrial engineering approach aiming at much improved possession utilisations also by building on standardised "clockwork-process" work practices,
• an optimised sequencing / scheduling of work-sites, geographically and over time, in order to make best use of staff resources and capital intensive machinery (even more so for high-output plant).
The first mentioned, consistently high asset quality at the infrastructure-train operator interface is also a prime area for cross-industry cooperation in the sense of the McNulty-report. Collaborative efforts between train operating companies and infrastructure to minimise the mutually and progressively damaging effects of quality defects at the rail / wheel interface are needed and will in turn deliver solid benefits for both sides.
7
OR
R_R
epor
t-v10
-120
712.
pptx
©
civ
ity 2
012
///
Summary (6 of 7)
Network Rail considers itself to be reaching a high degree of asset management excellence towards the end of CP4 and has committed itself to be leading-edge ("efficiency frontier") by the end of CP5. Maturity of asset management capabilities and decision support systems are seen as precondition and enabler for sustainable cost savings. In this regard, Network Rail’s asset management maturity is currently perceived by consultants to have room for improvement, especially in the areas of asset information and decision support systems.
Given the claim of management excellence, Network Rail’s overall CP5 targets and an outlook beyond were gauged by ORR's International Cost Efficiency Benchmarking against a set of best performing railway infrastructure managers thus trying to provide projections for Network Rail’s remaining gap to "frontier efficiency".
As compared with 2009/2010 data ("CP4-entry"), this best-practice comparison results in a total gap of 34 % - 40 % for maintenance and renewals. Supposing that Network Rail achieves the CP4 overall target of minus 21 % at CP4-exit, the remaining gap would amount to 13 % - 19 % at the outset of CP5. According to indicative estimations, referring to a cost base of £ 3.5 bn for maintenance and renewal, this would be equivalent to a total of £ 450 m - £ 670 m per annum (thereof up to £ 200 m from asset management). To the extent that the CP4 target might only be achieved in face-value expenditure terms, i.e. not sustainably, the remaining gap would of course be wider.
Looking at the best comparators’ efforts to further improve, projections may be made, as to where the "efficiency frontier" might be pushed then.
As a matter of fact it must be said, that published LICB data broadly show that the cost average of European state-owned peers has not improved but increased in line with inflation rate as a trend since the mid-nineties (i.e. in effect keeping real expenditures just constant).
8

OR
R_R
epor
t-v10
-120
712.
pptx
©
civ
ity 2
012
///
Summary (7 of 7)
Looking at the above figures, the data clearly shows that the the best organisations in the sample set (among them some of the leading Western European railways) have achieved a consistent longer-term cost-efficiency improvement rate of up to 2 % per annum on an inflation adjusted basis. Network Rail over the recent years have outperformed this track record. It is a fair assessment that a compound figure of 21 % for Network Rail over a period of 5 years is impressive and challenging. On the other hand, it remains to be seen whether this progress – on the end of CP4 – partly has been achieved on the back of incomplete sustainability.
The best-performing peers might achieve about 15 % lower cost in 2018/2019 (i.e. during the course of CP5) themselves, were they to continue their recent track record. For Network Rail to keep pace with the best performers would therefore require to close a 28 % - 34 % gap. These comparisons and projections are in effect compatible with the McNulty-targets of 30 % for CP 5 in total and a McNulty-outlook beyond.
From ’s point of view, the consolidation of all reports and analyses provides an almost exhaustive list of measures and opportunities ("there is no lack of ideas"). is rather concerned, that the complexity and parallelism of initiatives and transformation programs overburden management and may jeopardise progress ("less is more").
It cannot be stressed enough that management of change including the qualification / training of labour and new collaborative models with contractors are among the top ingredients for success. Also, with regard to securing and accelerating implementation, a value based analysis of initiatives against criteria of economic impact, likelihood and time to implementation and required investments should be undertaken. It appears that differing perceptions regarding priorities coexist at the moment.
Explicit assessments of cost/benefits and lead time to implementation may result in a new sequence of activities with more emphasis on early gains and a learning-by-doing approach in the asset management of tools and systems, gradually leading to maturity.
9
OR
R_R
epor
t-v10
-120
712.
pptx
©
civ
ity 2
012
///
Content
• Summary • Introduction • Synthesis of existing studies • Appraisal of Network Rail's plans • Projections • Conclusions
Appendix
10
OR
R_R
epor
t-v10
-120
712.
pptx
©
civ
ity 2
012
///
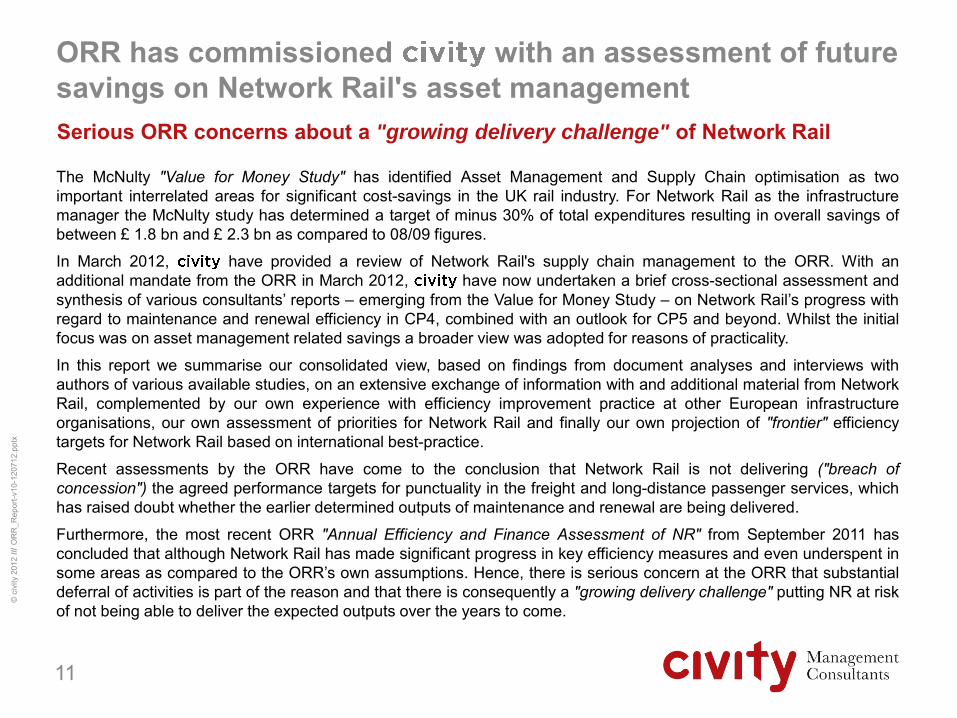
ORR has commissioned with an assessment of future savings on Network Rail's asset management Serious ORR concerns about a "growing delivery challenge" of Network Rail
The McNulty "Value for Money Study" has identified Asset Management and Supply Chain optimisation as two important interrelated areas for significant cost-savings in the UK rail industry. For Network Rail as the infrastructure manager the McNulty study has determined a target of minus 30% of total expenditures resulting in overall savings of between £ 1.8 bn and £ 2.3 bn as compared to 08/09 figures.
In March 2012, have provided a review of Network Rail's supply chain management to the ORR. With an additional mandate from the ORR in March 2012, have now undertaken a brief cross-sectional assessment and synthesis of various consultants’ reports – emerging from the Value for Money Study – on Network Rail’s progress with regard to maintenance and renewal efficiency in CP4, combined with an outlook for CP5 and beyond. Whilst the initial focus was on asset management related savings a broader view was adopted for reasons of practicality.
In this report we summarise our consolidated view, based on findings from document analyses and interviews with authors of various available studies, on an extensive exchange of information with and additional material from Network Rail, complemented by our own experience with efficiency improvement practice at other European infrastructure organisations, our own assessment of priorities for Network Rail and finally our own projection of "frontier" efficiency targets for Network Rail based on international best-practice.
Recent assessments by the ORR have come to the conclusion that Network Rail is not delivering ("breach of concession") the agreed performance targets for punctuality in the freight and long-distance passenger services, which has raised doubt whether the earlier determined outputs of maintenance and renewal are being delivered.
Furthermore, the most recent ORR "Annual Efficiency and Finance Assessment of NR" from September 2011 has concluded that although Network Rail has made significant progress in key efficiency measures and even underspent in some areas as compared to the ORR’s own assumptions. Hence, there is serious concern at the ORR that substantial deferral of activities is part of the reason and that there is consequently a "growing delivery challenge" putting NR at risk of not being able to deliver the expected outputs over the years to come.
11

OR
R_R
epor
t-v10
-120
712.
pptx
©
civ
ity 2
012
///
's brief assessment focuses on the most relevant activities and assets Focus on maintenance and renewals of track, civils and signalling
12 Source: NR; breakdown of maintenance expenditure: ORR PR13 NR efficient expenditure 2011
OPEX
Enhancements
Renewals
Maintenance
6.1
1.4
1.1
2.3
1.2
£ 3.5 bn (57 % of total)
M&R1) spending breakdown by assets £ bn
Network Rail spending (2010/11) £ bn
Civils
Signalling
Track
0.4
0.6
1.1 £ 2.1 bn (62 % of M&R)
1) Maintenance & Renewals
OR
R_R
epor
t-v10
-120
712.
pptx
©
civ
ity 2
012
///
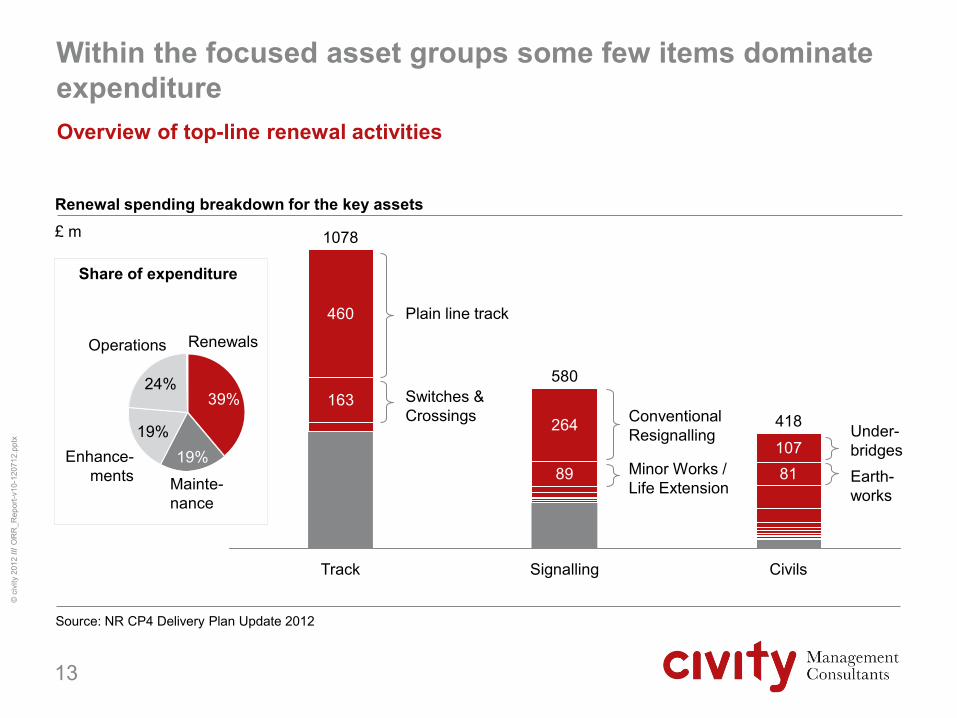
Within the focused asset groups some few items dominate expenditure Overview of top-line renewal activities
13
Source: NR CP4 Delivery Plan Update 2012
Civils
418
81 107
Signalling
580
89
264
Track
1078
163
460 Plain line track
Switches & Crossings Conventional
Resignalling Under-bridges Earth-works
Minor Works / Life Extension
24%
Operations
Enhance- ments
19%
Mainte- nance
19%
Renewals
39%
Share of expenditure
Renewal spending breakdown for the key assets £ m

OR
R_R
epor
t-v10
-120
712.
pptx
©
civ
ity 2
012
///
Steps 1-3
Analysis of existing studies
• CP4 achievability
• CP5 targets
• Outlook beyond CP5
• Network Rail's status reports
• Network Rail's self-commitment going forward
• Mirroring of Network Rail's plans with external views
The -study was conducted in a four-step approach
Project outline
14
Consolidated findings and independent appraisal
Expert interviews
Appraisal of Network Rail's plans
• Savings targets
• Way forward and recommendations
Step 4: Projections

OR
R_R
epor
t-v10
-120
712.
pptx
©
civ
ity 2
012
///
The starting point were the Value for Money Study and related consultants' reports Step 1: Analysis of existing studies
15
Document Subject Description
Sir McNulty, Rail Value for Money Study Whole industry cost structures / options for improvement
Comprehensive quantitative and qualitative analyses
AMCL, IIP 2011 Review Asset Policies of Network Rail: track (plain line / S&C), structures, earthworks, drainage, buildings and fleet
Assessment of robustness, sustainability and LCC-efficiency
AMCL, 2011 Asset Management Excellence Model Assessment
Review of Network Rail's grade of maturity
Qualitative analysis across 23 key activities
Arup, IIP 2011 Review Asset Policies of Network Rail: track (level crossings), signalling, electrical power and fixed plant, telecoms
Assessment of robustness, sustainability and LCC-efficiency
Atkins, Asset / Supply Chain Management Study
High-level assessment of GB Rail
Options for improvement, estimates on quantitative effects
RailKonsult, Gap Analysis Relative Infrastructure Managers' Efficiency
Bottom-up analysis on good practice and gap estimates
Arup, NR Bottom-Up Benchmarking Programme Audit
Network Rail's internal bench-marking for M&R activities
Assessment of work-streams, cross-sectional analysis

OR
R_R
epor
t-v10
-120
712.
pptx
©
civ
ity 2
012
///
Interviews have been conducted with Network Rail and authors of the consultants' reports Step 2: Expert Interviews
16
Entity Interviewee / Date
Network Rail Eliane Algaard / Tania Chuda (Strategic Planning), March 5th and April 3rd 2012
ORR Marius Sultan, March 5th 2012 Marius Sultan / Richard Clayton, April 4th 2012
AMCL Richard Edwards, April 2nd 2012
Atkins (Atkins was unavailable for interviews during the period of this study)
Arup Mark Rudrum, April 2nd 2012
RailKonsult Andy Clayton, April 4th 2012

OR
R_R
epor
t-v10
-120
712.
pptx
©
civ
ity 2
012
///
The study takes account of Network Rail's plans for CP4 delivery and the initial plans for CP5 Step 3: Appraisal of Network Rail's plans
17
Area Full title / version of NR documents
Asset Policy Strategic Business Plan 2007 and supporting documents
Updated asset management-policy and -strategy, issued February 2011
Track / Civils / Telecoms asset policy updates Sept 2009 - March 2010
CP4 Delivery Plan
CP4 Delivery Plan including updates until March 2012
Annual Return Reports until 2011
Network Rail EID Slides Overview (Oct 2011)
CP5 CP5 IP&AM Efficiency Review, Nov 2011
EID initiatives, Jan 2012 – material changes announced (not handed over until closing of study)
Track asset management: CP5 Benchmarking & Delivery Efficiency Review, Nov 2011
Reports on Periodic Review 2013, Progressive Assurance Process
IIP / M&R Scope and Unit Cost Efficiencies Summary and Progress Report, version 2 2011
Embedded Efficiency Reports on Signalling / Buildings / Civils, 2011
International Bottom-up M&R Railway Benchmarking, draft Nov 2011

OR
R_R
epor
t-v10
-120
712.
pptx
©
civ
ity 2
012
///
Sources
CP5 target
The study's estimates and projections of savings targets refer to CP4 / CP5 and beyond Step 4: Projections
18
CP4 target
Beyond CP5 target
Documents
• Plans & Determinations
• Delivery Expectations
• Network Rail Commitments
• External Targets & Expectations
• ORR Determination; Initial Industry Plan
• Network Rail Delivery Plan Updates; External ORR reporters
• NR PR13 Progressive Assurance Process
• External Studies / Interviews (step 1-2)
• McNulty & UK-Reporters External Targets
• ORR – Targets (upper 25 % peer group / leading edge)
• LICB – Track Records (moving with peer group progress)
• ORR International Efficiency Benchmarking
• Benchmarking Works and Studies
• Technical Strategy Advisory Group (TSAG) advisory on the path until 2038

OR
R_R
epor
t-v10
-120
712.
pptx
©
civ
ity 2
012
///
Content
• Summary • Introduction • Synthesis of existing studies • Appraisal of Network Rail's plans • Projections • Conclusions
Appendix
19
OR
R_R
epor
t-v10
-120
712.
pptx
©
civ
ity 2
012
///
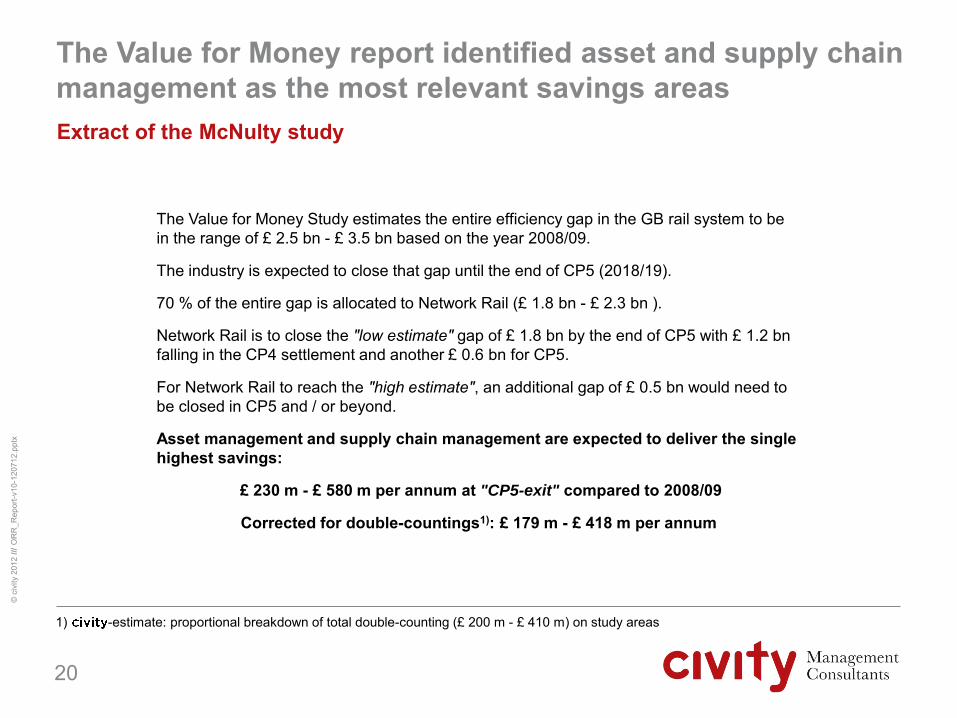
The Value for Money Study estimates the entire efficiency gap in the GB rail system to be in the range of £ 2.5 bn - £ 3.5 bn based on the year 2008/09.
The industry is expected to close that gap until the end of CP5 (2018/19).
70 % of the entire gap is allocated to Network Rail (£ 1.8 bn - £ 2.3 bn ).
Network Rail is to close the "low estimate" gap of £ 1.8 bn by the end of CP5 with £ 1.2 bn falling in the CP4 settlement and another £ 0.6 bn for CP5.
For Network Rail to reach the "high estimate", an additional gap of £ 0.5 bn would need to be closed in CP5 and / or beyond.
Asset management and supply chain management are expected to deliver the single highest savings:
£ 230 m - £ 580 m per annum at "CP5-exit" compared to 2008/09
Corrected for double-countings1): £ 179 m - £ 418 m per annum
The Value for Money report identified asset and supply chain management as the most relevant savings areas Extract of the McNulty study
20
1) -estimate: proportional breakdown of total double-counting (£ 200 m - £ 410 m) on study areas

OR
R_R
epor
t-v10
-120
712.
pptx
©
civ
ity 2
012
///
ATKINS ranks 16 asset management opportunities for aspects of cash-flow and time to implementation Extract of ATKINS Rail Value for Money Study
21
Key lever for biggest opportunities ATKINS hypotheses on savings
• AM1: Optimising enhancement and asset renewal appraisal criteria through rigorous modelling of lifecycle criteria (whole-life costs, performance, risk, condition and degradation), supported by improved asset know-ledge and information
• AM7: Better infrastructure stock management and processes
• AM6: Better industry performance measurement, resulting in strategic alignment of efforts across the industry
Sources: ATKINS, pg. 147/148
Cash flow
High > £ 1 bn p.a.
Low < £ 100 m p.a.
Short term < 1 year
Long term >2 years
Time maximum benefit realised
Medium term 1-2 years
Medium > £ 100 m – 1 bn p.a.
Potential for quick wins: Low Medium High
AM16
AM5
AM15
AM14
AM10
AM3
AM2 AM4
AM8 AM9 AM11
AM12 AM13
AM1
AM7 AM6
OR
R_R
epor
t-v10
-120
712.
pptx
©
civ
ity 2
012
///
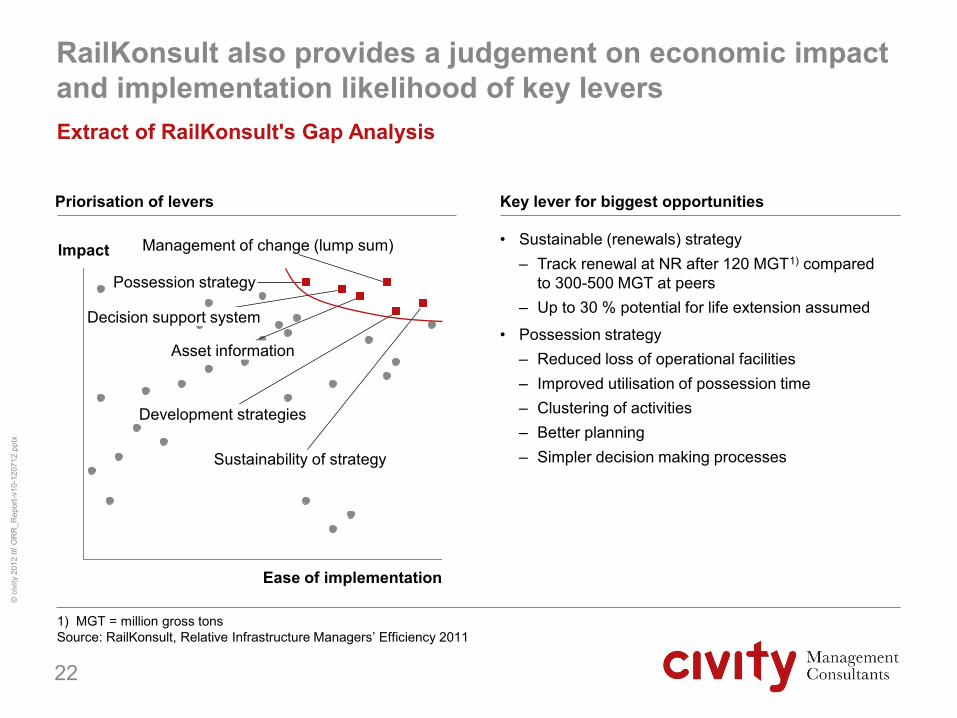
RailKonsult also provides a judgement on economic impact and implementation likelihood of key levers Extract of RailKonsult's Gap Analysis
22
1) MGT = million gross tons Source: RailKonsult, Relative Infrastructure Managers’ Efficiency 2011
Impact
Ease of implementation
Development strategies
Sustainability of strategy
Asset information
Management of change (lump sum)
Decision support system
Possession strategy
Key lever for biggest opportunities Priorisation of levers
• Sustainable (renewals) strategy – Track renewal at NR after 120 MGT1) compared
to 300-500 MGT at peers – Up to 30 % potential for life extension assumed
• Possession strategy – Reduced loss of operational facilities – Improved utilisation of possession time – Clustering of activities – Better planning – Simpler decision making processes
OR
R_R
epor
t-v10
-120
712.
pptx
©
civ
ity 2
012
///
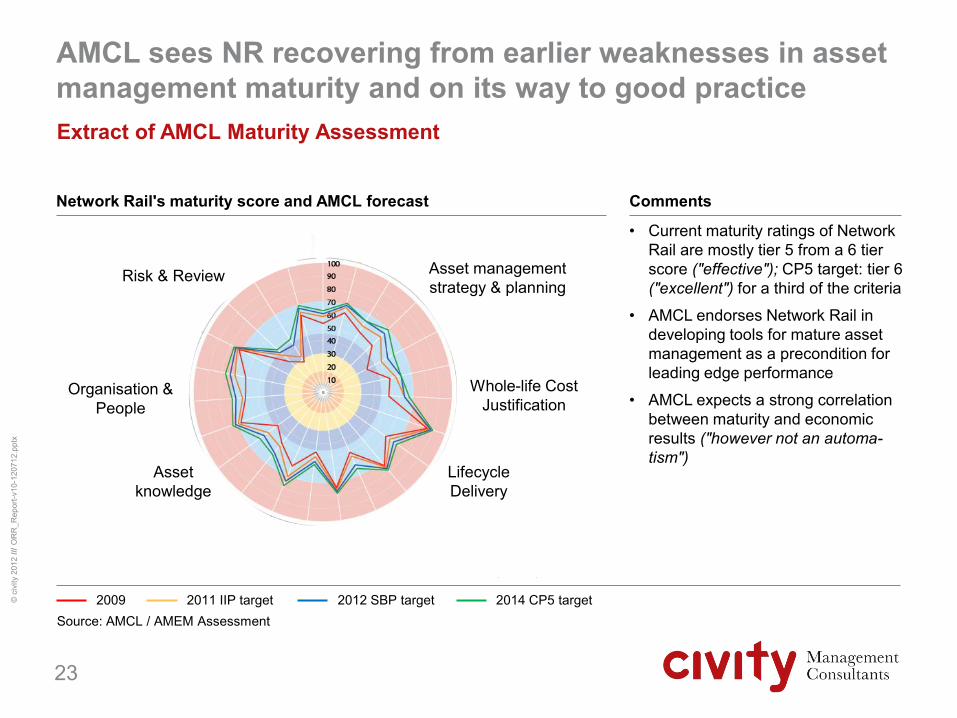
• Current maturity ratings of Network Rail are mostly tier 5 from a 6 tier score ("effective"); CP5 target: tier 6 ("excellent") for a third of the criteria
• AMCL endorses Network Rail in developing tools for mature asset management as a precondition for leading edge performance
• AMCL expects a strong correlation between maturity and economic results ("however not an automa-tism")
AMCL sees NR recovering from earlier weaknesses in asset management maturity and on its way to good practice Extract of AMCL Maturity Assessment
23
Network Rail's maturity score and AMCL forecast Comments
Source: AMCL / AMEM Assessment 2009 2011 IIP target 2012 SBP target
Asset knowledge
Risk & Review Asset management strategy & planning
Whole-life Cost Justification
2014 CP5 target
Lifecycle Delivery
Organisation & People
OR
R_R
epor
t-v10
-120
712.
pptx
©
civ
ity 2
012
///
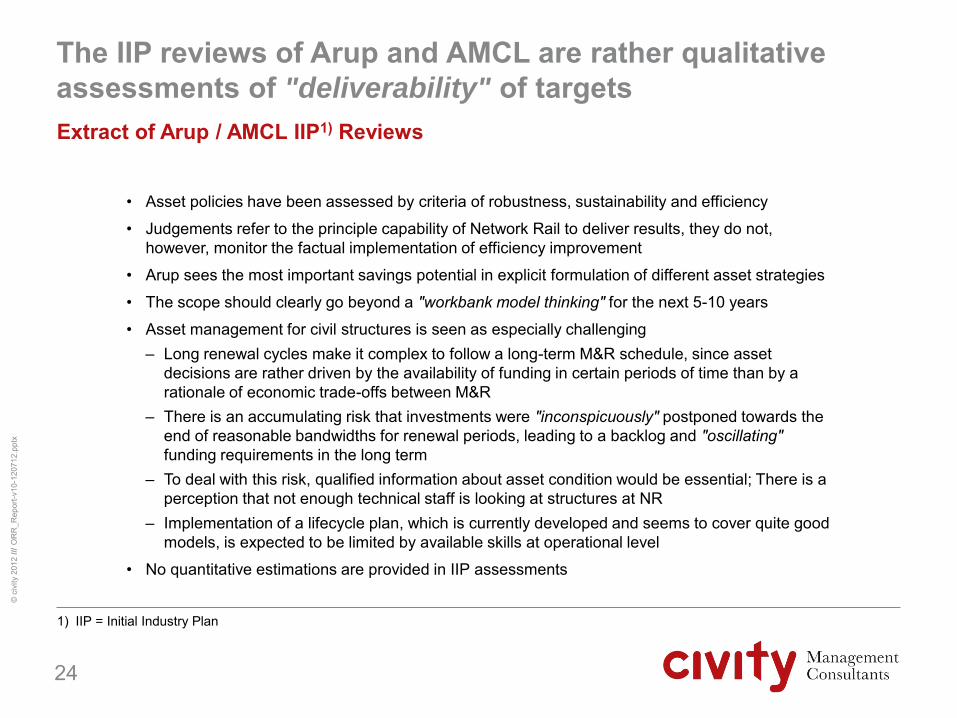
The IIP reviews of Arup and AMCL are rather qualitative assessments of "deliverability" of targets Extract of Arup / AMCL IIP1) Reviews
• Asset policies have been assessed by criteria of robustness, sustainability and efficiency
• Judgements refer to the principle capability of Network Rail to deliver results, they do not, however, monitor the factual implementation of efficiency improvement
• Arup sees the most important savings potential in explicit formulation of different asset strategies
• The scope should clearly go beyond a "workbank model thinking" for the next 5-10 years
• Asset management for civil structures is seen as especially challenging – Long renewal cycles make it complex to follow a long-term M&R schedule, since asset
decisions are rather driven by the availability of funding in certain periods of time than by a rationale of economic trade-offs between M&R
– There is an accumulating risk that investments were "inconspicuously" postponed towards the end of reasonable bandwidths for renewal periods, leading to a backlog and "oscillating" funding requirements in the long term
– To deal with this risk, qualified information about asset condition would be essential; There is a perception that not enough technical staff is looking at structures at NR
– Implementation of a lifecycle plan, which is currently developed and seems to cover quite good models, is expected to be limited by available skills at operational level
• No quantitative estimations are provided in IIP assessments
24
1) IIP = Initial Industry Plan

OR
R_R
epor
t-v10
-120
712.
pptx
©
civ
ity 2
012
///
Overall, we see some reports' recommendations leaning towards management systems – less on tangible outputs
suggests more focus on the bottom-line
25
Alternative delivery programme scenarios Comments
believes there is an imbalance between focus on achievable cost-impact and analytical efforts, i.e. over-riding attention to "soft" management issues vs. actual delivery issues ("low hanging fruit first" prioritisations).
An overwhelming focus on formal targets may hinder thinking from a business perspective. A "line-of-sight" between the asset policy level and actual decisions on maintenance and renewal is still an area of opportunity.
There was a common understanding in interviews with consultants, that investments in maturity and efficiency gains should follow each other – at least – progressively.
"Hands-on" approaches appropriate, taking "learning-on-the-job" as best "instructor" for management system development.
Delay-risks and bottom-line concerns
Hig
hLo
w
Good practiceBasic Developing
Med
ium
Management systems and maturity
Net
sav
ings
"Delivery and on-the-job based strategy"
"Mainstream path in documented analysis"
"Delievery focused strategy"
"Management systems built strategy"

OR
R_R
epor
t-v10
-120
712.
pptx
©
civ
ity 2
012
///
ATKINS analysis leads to net asset management savings in a range of £ 48 m - £ 474 m per annum ATKINS (2011): Time for implementation 5 years
26
1) Double-counting breakdown by
High estimate – savings £ m per annum
Low estimate – savings £ m per annum
48
1160
470
Reviewed Net AM/SCM/PM
18201)
474
Total Estimate AM/SCM/PM
2880
Net Estimate AM
750
Gross Estimate AM
Reviewed Net AM/SCM/PM
6801)
Total Estimate AM/SCM/PM
850
Net Estimate AM
60
Gross Estimate AM
• Estimated ATKINS net asset management savings: £ 60 m - £ 750 m per annum
• Further corrected for SCM/PM double-counting: £ 48 m - £ 474 m per annum
Gross: face-value Net: face-value corrected for double-counting AM Reviewed Net: Total corrected for double-counting
Programme Management Supply Chain Asset Management
Sources: ATKINS Rail Value for Money Study 2011, pg. 65

OR
R_R
epor
t-v10
-120
712.
pptx
©
civ
ity 2
012
///
RailKonsult targets are unspecific about CP4 or CP5 timing – upper estimate in line with ATKINS RailKonsult (2011): Hybrid of AM and some SCM
27
1) -estimate based on the average of the "10-25 %" estimated by RailKonsult
Savings estimate £ m per annum
Upper
675
75 100
405
Double-counting
Lower
215
50
75 % from key levers • Renewals strategy • Possession strategy
Comments
• Baseline for saving estimates: year 2 of CP4
• Savings targets are projected well into CP5 and even beyond, explicitly not towards the end of CP4
• The wide ranges do partly reflect uncertainty about the degree of implementation
• No explicit separation of AM and SCM items
Sustainable (renewals) strategy Development strategies Use of decision support tools Efficient collection of asset information
Possession strategy
• Gross savings: £ 215 m - £ 675 m per annum
• Median correction for double-counting1): £ 182 m - £ 561 m per annum
Source: RailKonsult, pg. 71-74
OR
R_R
epor
t-v10
-120
712.
pptx
©
civ
ity 2
012
///
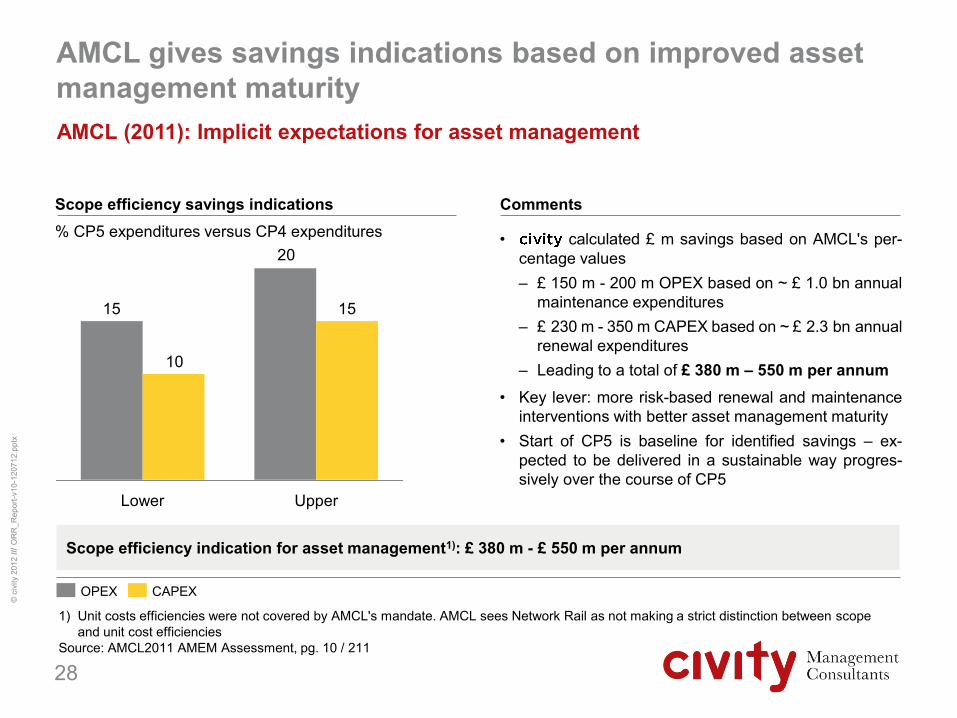
AMCL gives savings indications based on improved asset management maturity AMCL (2011): Implicit expectations for asset management
28
Comments Scope efficiency savings indications % CP5 expenditures versus CP4 expenditures • calculated £ m savings based on AMCL's per-
centage values – £ 150 m - 200 m OPEX based on ~ £ 1.0 bn annual
maintenance expenditures – £ 230 m - 350 m CAPEX based on ~ £ 2.3 bn annual
renewal expenditures – Leading to a total of £ 380 m – 550 m per annum
• Key lever: more risk-based renewal and maintenance interventions with better asset management maturity
• Start of CP5 is baseline for identified savings – ex-pected to be delivered in a sustainable way progres-sively over the course of CP5
20
15 15
10
Upper Lower
CAPEX OPEX
1) Unit costs efficiencies were not covered by AMCL's mandate. AMCL sees Network Rail as not making a strict distinction between scope and unit cost efficiencies
Source: AMCL2011 AMEM Assessment, pg. 10 / 211
Scope efficiency indication for asset management1): £ 380 m - £ 550 m per annum
OR
R_R
epor
t-v10
-120
712.
pptx
©
civ
ity 2
012
///
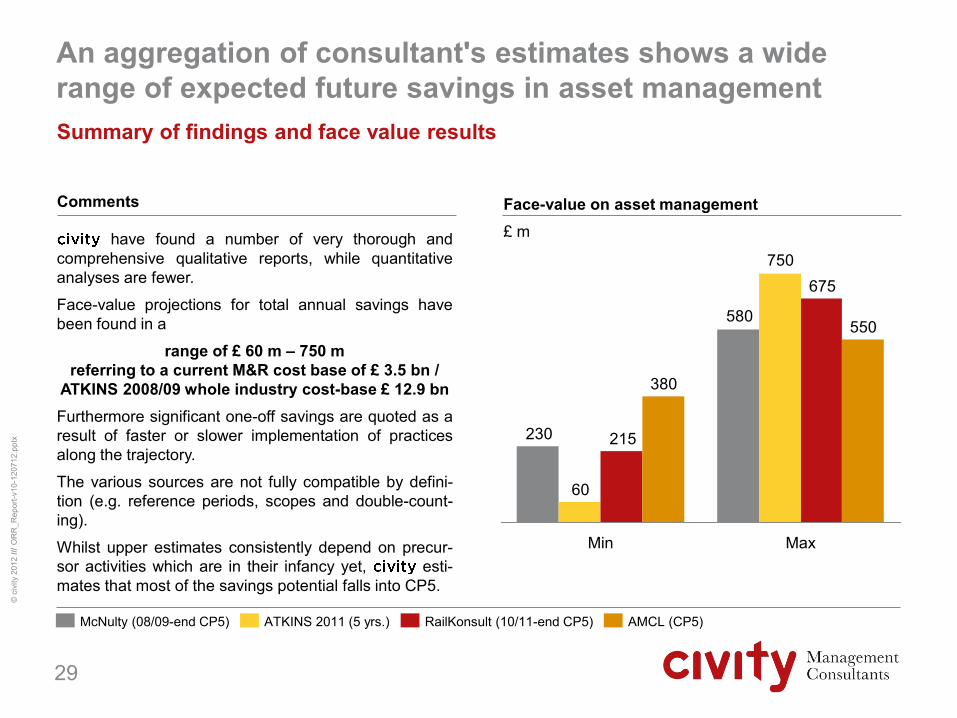
An aggregation of consultant's estimates shows a wide range of expected future savings in asset management Summary of findings and face value results
29
Face-value on asset management £ m
580
230
750
60
675
215
550
380
Max Min
AMCL (CP5) RailKonsult (10/11-end CP5) ATKINS 2011 (5 yrs.) McNulty (08/09-end CP5)
Comments
have found a number of very thorough and comprehensive qualitative reports, while quantitative analyses are fewer.
Face-value projections for total annual savings have been found in a
range of £ 60 m – 750 m referring to a current M&R cost base of £ 3.5 bn /
ATKINS 2008/09 whole industry cost-base £ 12.9 bn Furthermore significant one-off savings are quoted as a result of faster or slower implementation of practices along the trajectory.
The various sources are not fully compatible by defini-tion (e.g. reference periods, scopes and double-count-ing).
Whilst upper estimates consistently depend on precur-sor activities which are in their infancy yet, esti-mates that most of the savings potential falls into CP5.
OR
R_R
epor
t-v10
-120
712.
pptx
©
civ
ity 2
012
///
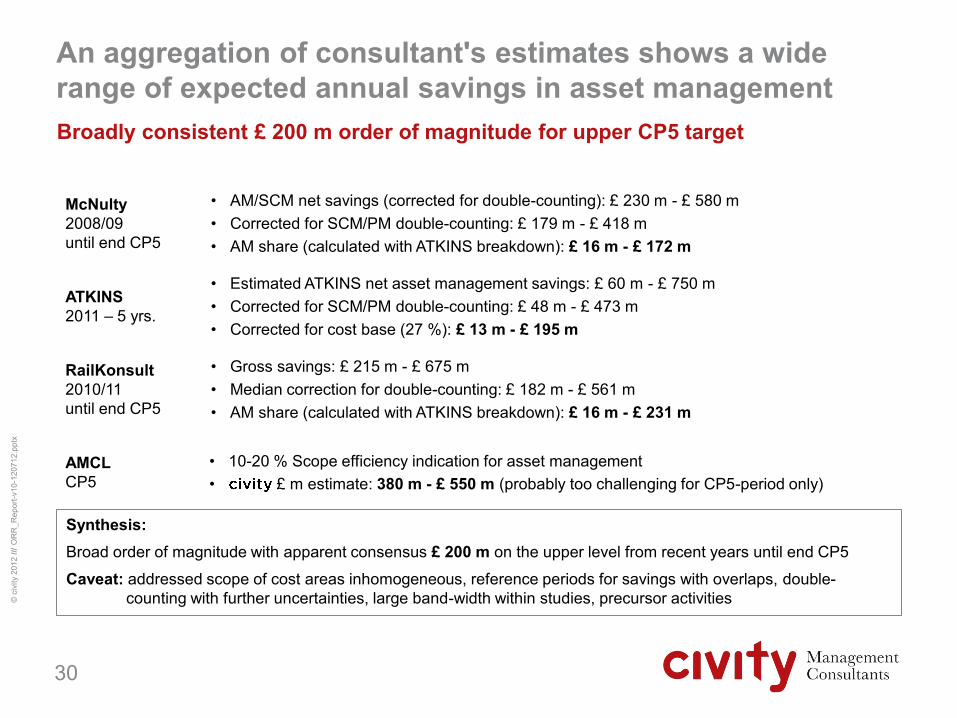
An aggregation of consultant's estimates shows a wide range of expected annual savings in asset management Broadly consistent £ 200 m order of magnitude for upper CP5 target
30
McNulty 2008/09 until end CP5
ATKINS 2011 – 5 yrs.
RailKonsult 2010/11 until end CP5
AMCL CP5
• AM/SCM net savings (corrected for double-counting): £ 230 m - £ 580 m • Corrected for SCM/PM double-counting: £ 179 m - £ 418 m • AM share (calculated with ATKINS breakdown): £ 16 m - £ 172 m
• Estimated ATKINS net asset management savings: £ 60 m - £ 750 m • Corrected for SCM/PM double-counting: £ 48 m - £ 473 m • Corrected for cost base (27 %): £ 13 m - £ 195 m
• Gross savings: £ 215 m - £ 675 m • Median correction for double-counting: £ 182 m - £ 561 m • AM share (calculated with ATKINS breakdown): £ 16 m - £ 231 m
• 10-20 % Scope efficiency indication for asset management • £ m estimate: 380 m - £ 550 m (probably too challenging for CP5-period only)
Synthesis: Broad order of magnitude with apparent consensus £ 200 m on the upper level from recent years until end CP5
Caveat: addressed scope of cost areas inhomogeneous, reference periods for savings with overlaps, double-counting with further uncertainties, large band-width within studies, precursor activities
OR
R_R
epor
t-v10
-120
712.
pptx
©
civ
ity 2
012
///
Analyses and reports available to provide a wealth of aspects, yet often very qualitative or in an indirect manner Concluding remarks on synthesis
It is surprising in the first pace that the minimum to maximum ranges given are so high. Further discussions with the studies’ authors showed, that these variations are also mostly due to uncertainties about degree and pace of implementation rather than discrepancies in underlying calculations.
ATKINS projections are related to CP4. estimates a significant share of savings not being realised in CP4 and still valid for CP5. However the upper range may need to be corrected for realised savings.
RailKonsult estimations seem too conservative in some items, e.g. a maximum of 30 % savings was calculated for prolonged track life while the gap to comparators is up to 400 %. is of the opinion that in some important areas achievable savings from asset management could be significantly higher. This applies primarily to the utilisation of possessions together with worksite optimisation and prolonged life of track-structures.
AMCL estimations referred exclusively on risk-based renewal and maintenance interventions, achievable through better developed asset management capabilities. Thus some premiums have to be added for other measures.
Also, various reports highlight the fact that there is a risk of double-counting and some initiatives require investment and precursor activities before generating benefits. Hence, some quotes of gross figures for savings need to be interpreted with caution. Clear-cut cost-benefit analyses for key measures requiring prior investment were not available to .
31

OR
R_R
epor
t-v10
-120
712.
pptx
©
civ
ity 2
012
///
Content
• Summary • Introduction • Synthesis of existing studies • Appraisal of Network Rail's plans • Projections • Conclusions
Appendix
32

OR
R_R
epor
t-v10
-120
712.
pptx
©
civ
ity 2
012
///
Network Rail currently estimates to outperform the CP4 efficiency target – sustainability questioned by consultants Synthesis of CP4 assessments (1 of 2)
33 Source: NR Annual Return / CP4 Delivery Plan update 2012
Comments
Expenditures £ bn (cash prices / CP4 12/13 prices)
2
1
3
2
1
CP 4 CP 3 CP2
Others Civils Signalling Track
Maintenance
Renewals
Network Rails claims in its recent March 2012 Delivery Update to outperform the CP4 overall efficiency target of 21 % by two percentage points. Reporters to the ORR point out that the "robustness" to achieve the "financial targets" in some asset catego-ries is weaker than in others. Yet, for the most relevant cost categories, especially track structures, consultants are confident. The longer term "sustainability" of financial efficiency, on the other hand, is quite unanimously put into question. Some claimed "scope efficiencies" are reduc-tions in renewal volumes. The"life-cycle-cost efficiency" (which is the third mea-sure used by the ORR) is given low ratings throughout and considered to be still in its infancy. This obviously implies that whole life cost-optimal asset policies have not yet been fully identified by Network Rail, hence opportunities for further improvement remain.

OR
R_R
epor
t-v10
-120
712.
pptx
©
civ
ity 2
012
///
Network Rail currently estimates to outperform the CP4 efficiency target – sustainability questioned by consultants
The longer term "sustainability" of financial efficiency, on the other hand, is quite unanimously put into question. Some claimed "scope efficiencies" are reductions in renewal volumes.
This reflects the above mentioned concern of the ORR that the observed deferral of projects represents a significant part of Network Rail's reported underspent.
All consultants however point out and highly acknowledge that Network Rail are undertaking a vast number of initiatives simultaneously and are making good progress in many areas.
strongly supports this view and at the same time, in doing so, has practical concerns (see below) that the entire Network Rail organisation may be over-burdened by the complexity of the transformation, putting it at risk that ultimately less might be delivered and at a slower pace as compared to a more focused and manageable improvement program.
In the available analyses the current status of many initiatives is described as "work in progress" and consultants see a number of tasks still to be undertaken and furthered, among them most prominently the development of asset policies and associated whole life cost models. Consultants consistently believe that quite a number of important initiatives have not reached implementation stage yet, in effect qualifying them as running behind schedule.
Due to these missing elements, the "life-cycle-cost efficiency" (which is the third measure used by the ORR) is given low ratings throughout and considered to be still in its infancy. This obviously implies that whole life cost-optimal asset policies have not yet been fully identified by Network Rail, hence opportunities for further improvement remain.
34
Synthesis of CP4 assessments (2 of 2)

OR
R_R
epor
t-v10
-120
712.
pptx
©
civ
ity 2
012
///
For CP5 Network Rail currently suggests overall mainte-nance and renewals savings of 16 % Extract of recent Network Rail CP5 plans
35
Sources: CP5 M&R Scope&Unit Cost Efficiencies summary and progress report, version 2 Arup, NR Bottom-Up Benchmarking Programme Audit
Declared CP5 savings as planned by NR (self-commitment) % versus CP5-entry
Comments
• Savings estimates for track and civils derived from a quantified breakdown from bottom-up benchmarking findings, for signalling rather qualitative
• Network Rail acknowledged additional savings could be generated by joint cross-industry approaches
Total average 16
Civils renewals
15.0
-1.0
11.0
5.0
Signalling renewals
17.0
-1.0 2.0
13.0
3.0
Track renewals
21.0
-1.0
8.0
14.0
Maintenance (total)
15.2
-1.4 3.2
9.2
4.2
Input price AIS/II Unit cost efficiency Scope efficiency
OR
R_R
epor
t-v10
-120
712.
pptx
©
civ
ity 2
012
///
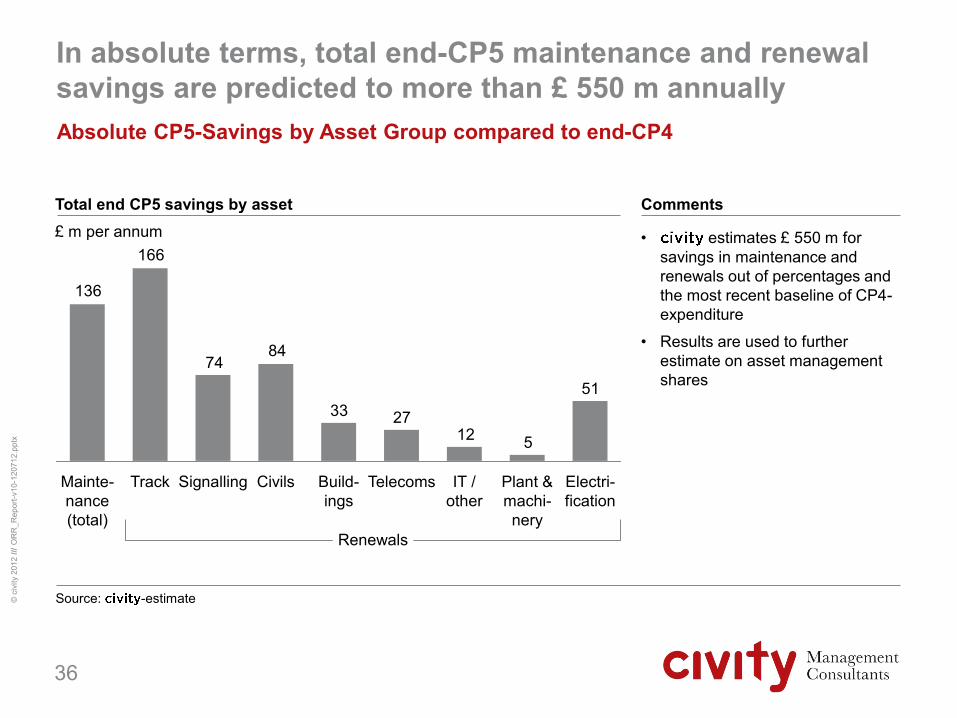
In absolute terms, total end-CP5 maintenance and renewal savings are predicted to more than £ 550 m annually Absolute CP5-Savings by Asset Group compared to end-CP4
36
Source: -estimate
Comments
• estimates £ 550 m for savings in maintenance and renewals out of percentages and the most recent baseline of CP4-expenditure
• Results are used to further estimate on asset management shares
51
5122733
8474
166
136
Signalling Track Mainte- nance (total)
Electri-fication
Plant & machi-nery
IT / other
Telecoms Build-ings
Civils
Total end CP5 savings by asset £ m per annum
Renewals

OR
R_R
epor
t-v10
-120
712.
pptx
©
civ
ity 2
012
///
As a deduction estimates asset management savings of about £ 150 m annually at the end of CP5 Absolute CP5-Asset management savings compared to end-CP4
37
Source: -estimate
Comments
• estimates an average 25 % share of asset management savings referring to the ATKINS report
– £ 60 m net AM estimate out of a total of £ 680 m reviewed net AM/SCM/PM savings (low-estimate) – 9 %
– £ 750 m net AM estimate out of £ 1,820 m reviewed net AM / SCM / PM savings (high-estimate) – 41%
• Resulting £ 140 m AM savings at end-CP5 are below the upper level of consultants estimates (see Chart 31).
2118
41
34
Civils renewals
Signalling renewals
Track renewals
Mainte- nance (total)
…
Total end CP5 asset management savings for most relevant assets £ m per annum
Total asset management savings £ 140 m

OR
R_R
epor
t-v10
-120
712.
pptx
©
civ
ity 2
012
///
Network Rail are undertaking a vast number of initiatives – timely results are questioned by consultants CP 5 asset policies
38
Underlying asset policies for calculated CP 5 savings
Comments
Network Rail are undertaking a vast number of initiatives and consultants acknowledge good progress in many areas.
Consultants are convinced that Net-work Rail still has to undertake sig-nificant planning and preparatory work before a solid business plan can be established. Network Rail acknowledges that plans are still in the making
could not identify a clear line-of-sight yet from proposed activities in asset management towards plan-ned savings.
Source: Initial Industry Plan, September 2011, pg. 54
Asset The revised policy will deliver better value for money by Track • Less complete renewal, more refurbishment, more preventative maintenance and
more track treated for an overall reduction in whole life cost and spend in CP 5 Signalling • Targeted approach to renewal rather than full resignalling
• Integration of the renewal work bank with operating strategy and ERTMS Telecoms • More effective obsolescence management and technology change
• Greater use of partial renewal intervention where appropriate Electrical Power & Fixed Plant
• Prioritised based on condition & criticality in terms of impact on service outputs
Drainage • Improved drainage asset condition on high criticality routes, maintained condition elsewhere and contribution to improved track quality with consequent reduction in delay minutes
• Improvements in overall track quality by reduced track maintenance interventions and savings in abortive renewal costs
• Reduced flooding leading to improved safety and reduced delay minutes Buildings • The ability to target the required CP5 performance outcomes – less spend on major
station train sheds, buildings and platforms and more spend on canopies • Key assets are managed in a sustainable manner, maintaining long term condition
and thereby securing the long term functionality of the asset Structures • Improved consistency in managing bridge strength & critical condition risks
• Increased emphasis on maintenance and minor works

OR
R_R
epor
t-v10
-120
712.
pptx
©
civ
ity 2
012
///
Concerns apply about cultural change at Network Rail, which is required to make full use of savings potential Appraisal of consultants's assessments on CP 5 (1 of 2)
• Precursor investments – before savings can be generated – are an issue. The Value for Money study estimates a total of £ 250 m for Asset Information Systems (AIS), condition monitoring systems, Decision Support Systems (DSS) and training. Consultants believe that – due to the share of expenditures already spent – the remaining need for remaining need for systems investments is limited. A recent DfT-source uses £ 100 m Capex for asset IT systems and £ 150 m Opex for asset surveys, reliability centred maintenance analyses and training measures. A comprehen-sive quantitative assessment has not been found by .
• A "fundamental change" and a "new model" of delivering will be – in Network Rail's own words – a prerequisite to deliver the planned savings.
• Observers and reporters express concerns whether Network Rail as an organisation is ready for such wide-ranging changes, also with regard to the fact that centrally developed tools and practices, only under development now, will at the same time need to be transposed into the devolved route organisation, which is being established at present. The simultaneousness of transformation programs is a critical challenge.
• Yet, the current status is often described as "work in progress" and consultants see a number of tasks still to be undertaken and furthered, among them prominently asset policies and associated whole life cost models. Consultants consistently believe that quite a number of important initiatives have not reached implementation stage. This reflects "life-cycle-cost efficiency" (which is the third measure used by the ORR) given low ratings throughout and considered to be still in its infancy. This obviously implies that (whole life) cost-optimal asset policies have not yet been fully identified by Network Rail, hence opportunities for further improvement remain.
39

OR
R_R
epor
t-v10
-120
712.
pptx
©
civ
ity 2
012
///
Concerns apply about cultural change at Network Rail, which is required to make full use of savings potential Appraisal of consultants assessments on CP 5 (2 of 2)
• Under the one-off item "management-of-change" RailKonsult thinks particularly about the previous unwillingness to take decisions where under aspects of personal risk avoidance people in the recent NR management culture were highly threatened for taking responsibility. This culture is embedded in all layers of NR's management and represents a major barrier for transformation. – Possession times for switch inspections are mentioned where teams show no incentive to make best use of times,
e.g. using three hours out of an eight hour possession for work on tools, and where contractors with the right contractual incentivisation would certainly provide more efficient services.
– Modular switch is another example for very slow rates of innovations (trying for 8 years to establish what is already invented in Switzerland and elsewhere)
– The ORBIS project, aiming at establishing an AIS, with a budget of about £ 350 m is an example where 18 months have already been spent resulting in the finding that existing data are not fit for purpose and a new set has to be determined.
40

OR
R_R
epor
t-v10
-120
712.
pptx
©
civ
ity 2
012
///
sees the need for focused management attention on the economic key drivers in order to achieve CP5 targets Recommendations towards CP5
• From 's point of view, the consolidation of all reports and analyses provides an almost exhaustive list of measures and opportunities (there is no lack of ideas). is rather concerned, that the complexity and parallelism of initiatives and transformation programmes overburden management and may jeopardise progress (less is more).
• A closer look at the breakdown of savings by individual measures shows that relatively few initiatives account for the bulk of total results. Hence, focus on key initiatives is permissible without sacrificing opportunities.
• believes there is more work to be done to systematically assess economic impact together with likelihood and pace of implementation in order to define priorities.
• Nethertheless, but also to suggest a clearer focus for improvement areas, has provided a list of top priorities from its own international experience (see Appendix). Among these priorities, we are convinced that the paradigm shift to quality deserves much higher attention within Network Rail’s management for good economic reason.
• Consistent asset quality at the infrastructure-train operator (rail-wheel) interface is also prime area for cross-industry cooperation in the sense of the McNulty-report. Collaborative efforts between train operating companies and infra-structure to avoid the mutually damaging effects at the rail / wheel interface are needed and will in turn deliver benefits for both sides.
41
OR
R_R
epor
t-v10
-120
712.
pptx
©
civ
ity 2
012
///
Content
• Summary • Introduction • Synthesis of existing studies • Appraisal of Network Rail's plans • Projections
– CP5 – Outlook beyond CP5
• Conclusions
Appendix
42

OR
R_R
epor
t-v10
-120
712.
pptx
©
civ
ity 2
012
///
Network Rail claims to be efficiency frontier by end of CP5 – savings projections to be gauged against best performers Baseline of CP5 assessment
• Network Rail considers itself to be reaching a high degree of asset management excellence towards the end of CP4 and has committed itself to be leading-edge ("efficiency frontier") by the end of CP5 in its asset policy.
Quote: "By the end of the current control period (March 2014) our commitment is to have developed capabilities in asset management that are demonstrably comparable with best practice elsewhere in Britain. Over the following five years we are committed to improving our business capabilities further, so that we provide the benchmark against which organisations throughout the world assess their own asset management capabilities" (Network Rail Asset Management Policy)
• Given the claim of asset management excellence, Network Rail’s CP5 targets are to be gauged against a set of best performing railway infrastructure managers. As a means to this end, ORR's International Cost Efficiency Bench-marking compares Network Rail against the sample of LICB1)-railways. It must be noted that this sample does not necessarily represent best practice globally.
Quote: "There is still likely to be a further efficiency gap considering that the comparator railways are not generally private-sector leading-edge companies, but are largely state owned or only part-privatised organisations, not subject to strong private-sector financial incentives" (Rail Value for Money Study)
43
1) LICB: Lasting Infrastructure Cost Benchmarking
OR
R_R
epor
t-v10
-120
712.
pptx
©
civ
ity 2
012
///
Updated and PR08 efficiency gaps estimated for Network Rail for 2008
Study Efficiency gap (best estimate / range)
Comments
PR08 results 38 / 28 – 44 % To frontier of peer group
35 / 22 – 41 % To upper quartile of peer group
2010 inter-national benchmarking update
34 – 40 % To frontier of peer group
29 – 37 % To upper quartile of peer group
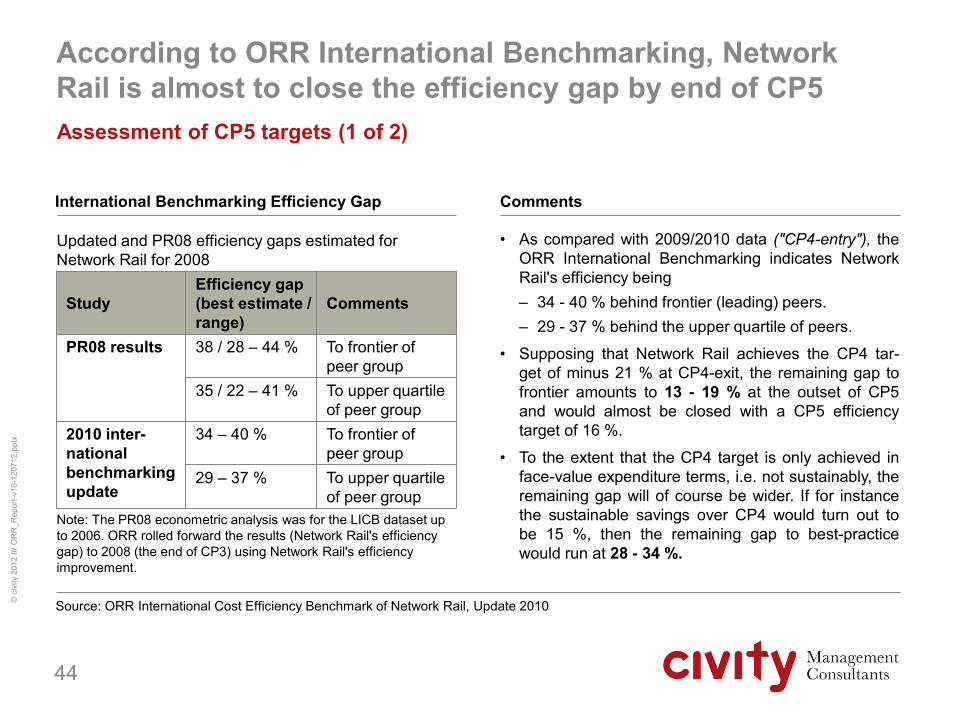
Note: The PR08 econometric analysis was for the LICB dataset up to 2006. ORR rolled forward the results (Network Rail's efficiency gap) to 2008 (the end of CP3) using Network Rail's efficiency improvement.
According to ORR International Benchmarking, Network Rail is almost to close the efficiency gap by end of CP5 Assessment of CP5 targets (1 of 2)
44
Comments International Benchmarking Efficiency Gap
• As compared with 2009/2010 data ("CP4-entry"), the ORR International Benchmarking indicates Network Rail's efficiency being – 34 - 40 % behind frontier (leading) peers. – 29 - 37 % behind the upper quartile of peers.
• Supposing that Network Rail achieves the CP4 tar-get of minus 21 % at CP4-exit, the remaining gap to frontier amounts to 13 - 19 % at the outset of CP5 and would almost be closed with a CP5 efficiency target of 16 %.
• To the extent that the CP4 target is only achieved in face-value expenditure terms, i.e. not sustainably, the remaining gap will of course be wider. If for instance the sustainable savings over CP4 would turn out to be 15 %, then the remaining gap to best-practice would run at 28 - 34 %.
Source: ORR International Cost Efficiency Benchmark of Network Rail, Update 2010

OR
R_R
epor
t-v10
-120
712.
pptx
©
civ
ity 2
012
///
considers NR's CP5 targets as challenging – room for improvement by whole-industry / beyond CP5 approaches Assessment of CP5 targets (2 of 2)
• considers the provisional targets of Network Rail as challenging on the background of – consultants' ratings of Network Rail’s asset management maturity, which is seen as precondition and enabler for
sustainable cost savings and – international experience of 2 % saving rates at leading European railways – Network Rail achieve more than 3 %
based on the 16 % target for CP5
• Hence, has doubts that significantly quicker savings can be achieved by Network Rail alone. Doubtlessly existing opportunities for further savings will probably need a longer timescale
• In doing so, is convinced that there is a variety of further saving opportunities, which should be launched during CP5 while the bulk of benefits, due to precursor work and lead-times to implementation, will not take effect during the CP5 period.
• Additional saving expectations, in 's opinion, will require cross-industry measures including further developed franchise agreements which will enable more efficient possession regimes.
Remark of the authors: Given the now well established evidence of "work-bank visibility disruption" from one control period to another and the wasteful economies implied in them ("feast to famine") a shift to a concept of rolling-forward control periods should be considered. This concept is supported by good experiences elsewhere.
45

OR
R_R
epor
t-v10
-120
712.
pptx
©
civ
ity 2
012
///
estimates a CP5 savings potential for AM in an order of magnitude of £ 200 m annually Assessment of CP5 targets – Summary
46
Comments Asset management savings projection £ m per annum • Network Rail's self-commitment (16 % amounts to
£ 550 m) would be equivalent to around £ 150 m for asset management if it is broken down by average ATKINS factors (see chart 26)
• Furthermore, it was stated that overall savings in an order of magnitude of £ 115 m p.a. are already embedded in the asset policies of Network Rail - equivalent to around £ 40 m for asset management
• Total net asset management saving of nearly £ 200 m would be in line with upper consultants' estimates (chart 30)
• Estimated double-countings with supply chain / programme management: 37 % (£ 75 m) based on ATKINS data1
• As stated on the previous page, further savings potential is available. It may however take time beyond CP5 to be implemented.
200
Est. CP5 AM savings
Remaining CP4 AM savings
?
Current M&R cost base
3500
-estimation on Asset Management (AM) savings 1) Reviewed net vs. net ATKINS AM savings estimate (chart 26)
OR
R_R
epor
t-v10
-120
712.
pptx
©
civ
ity 2
012
///
Content
• Summary • Introduction • Synthesis of existing studies • Appraisal of Network Rail's plans • Projections
– CP5 – Outlook beyond CP5
• Conclusions
Appendix
47

OR
R_R
epor
t-v10
-120
712.
pptx
©
civ
ity 2
012
///
An estimate where the efficiency frontier might be pushed to can be derived from recent peer-group track records Maintenance cost per maintrack kilometre Index 1996 = 100 %
48
Comments Sample of leading European railways
• Looking at the peer-group's on-going efforts to further improve, projections may be made, as to where the "efficiency frontier" might be pushed while Network Rail is on its way to close the gap. Published LICB data broadly show that the cost average of a leading group of Western European railways have achieved a consistent longer-term cost-efficiency improvement rate of up to 2 % per annum on an inflation adjusted basis.
• Hence, the best-performing peers would achieve about 15 % lower cost in 2018/2019 themselves, were they to continue their recent track record. For Network Rail to keep pace with the best performers and achieve its own expectations would therefore require to close a 28 % - 34 % gap, which is less than the currently suggested target of 16 %.
• Beyond the self-commitment of 16 % for CP5 Network Rail have communicated with that almost a similar magnitude could be achievable in a cross industry effort that however requires major changes to todays' work practices.
Source: Published LICB Data
1996 1998 2000 2002 2004 2006 2008 2010
1.2
1.1
1.0
0.9
0.8
0.7
0.6
1.3
0.5
1.4
0.4
-2 % pa

OR
R_R
epor
t-v10
-120
712.
pptx
©
civ
ity 2
012
///
Long term planning suggests to halve unit costs of running the railways by 2038 – asset management contribution 15 % TSLG's view on savings beyond CP5
49
Comments Contributions to TSAG cost target
• The Technical Strategy Leadership Group1) contribu-ted to Network Rail's long term planning framework with a vision until 2038
"double railway capacity to the same costs at 2038"
• Hence, unit costs related to transport load would be halved. Whole system asset management shall – as largest single lever – contribute by – a whole System Approach towards improvements, – Modular trains and infrastructure and – Optimisation Models (VTISM2) extension )
• Asset management is expected to contribute by ~ 15 % to these savings, i.e. 7 % total savings equivalent to £ 245 m based on a £ 3.5 bn costbase, which is a conservative assumption compared with 's beyond-CP5-outlook.
1) TSLG – cross-industry expert group facilitated by the Rail Safety and Standards Board (RSSB) 2) VTISM: Vehicle Track Interaction Railway Software Mode Source: TSAG input to POG, 31 March 2010
Data & communications Traffic management
Asset management
Infrastructure development
Enabling innovation
Train developments
Energy
Remaining portion of challenge

OR
R_R
epor
t-v10
-120
712.
pptx
©
civ
ity 2
012
///
estimates the long-term savings potential for asset management at over £ 500 m annually Outlook Beyond CP5 – Summary
50
Comments Asset management savings projection £ m per annum • Looking beyond CP5, e.g. by the end of the CP6
period, the best-performing peers would achieve further 10 % lower costs compared to end-CP5, were they to continue their recent track record.
• This would result in a 38 - 44 % gap compared to Network Rail's end CP4-level. Closing this gap would require 2.5 times the 16 % savings which are currently suggested by Network Rail for CP5.
• Supposed that the AM share at these savings targets could be increased towards 40%, total AM targets would be approximately £ 550 m (of which £ 350 m in CP6). This would close the gap to AMCL's upper AM scope efficiency estimation (see chart 28).
• In CP7, another 10 % gap would need to be closed if peers were to continue their recent track record. This would be additional £ 140 m and a total compared to current expenditures of £ 690 m per annum.
140
2003500350
Outlook CP7
Outlook CP6
Est. CP5 AM savings
Remaining CP4 AM savings
?
Current M&R cost
base
-estimation on Asset Management (AM) savings
Total AM savings from CP5-entry ~ £ 690 m pa
For comparison: £ 300 m - £ 400 m estimation on CP5 Supply Chain Management Savings (supply chain vs. asset management 60:40); source: 2012

OR
R_R
epor
t-v10
-120
712.
pptx
©
civ
ity 2
012
///
Content
• Summary • Introduction • Synthesis of existing studies • Appraisal of Network Rail's plans • Projections • Conclusions Appendix
51
OR
R_R
epor
t-v10
-120
712.
pptx
©
civ
ity 2
012
///
Concluding statements (1 of 2)
Network Rail is broadly expected to achieve its CP4 expenditure targets.
With performance running below expectations and substantial activity being deferred beyond CP4, not all savings can be counted as efficiency gains, a significant share thereof is not sustainable yet.
Network Rail nevertheless deserves full credit for a pace of progress that is currently at the forefront of European peers.
Network Rail’s broadly outlined plans for CP5 together with RDG-led whole industry measures could enable it to close the "efficiency gap" as postulated by the ORR International Benchmarking and bring it to current best-practice levels among European railway peers.
Given the already lagging behind "sustainability" of Network Rail’s achievements during CP4 (as compared to initial plans) it is most likely that the even more demanding ambitions for CP5 (not translated into full business plans yet) will need more time as currently planned.
52

OR
R_R
epor
t-v10
-120
712.
pptx
©
civ
ity 2
012
///
Concluding statements (2 of 2)
In a scenario where European peers can manage to maintain some of their own rate of progress over that period, the "efficiency frontier" would be pushed out by another 15 %, to be added to Network Rail’s own objectives set under the ambition to close-up to the frontier.
This appears not unreasonable to , bearing in mind that other industries have demonstrated superior supply chain and asset management practice as compared with the railway industry overall.
however have substantial doubt, whether the currently claimed and future pace of progress can live-up to the expectations under any realistic and well managed circumstances.
Network Rail as an organisation is strained and over-burdened with a multiplicity of work streams under the current transformation program, too far reaching ambition puts more progress at risk as it may support.
recommend a bold "less-is-more" streamlining of activities with a pragmatic focus on economic impact together with likelihood and time to implementation, for some breakthrough achievements cross-industry collaboration with train operators and other stakeholders is indispensable.
53

OR
R_R
epor
t-v10
-120
712.
pptx
©
civ
ity 2
012
///
Since Network Rail's ability for change is limited, setting the right priorities is of particular relevance Final remarks
• To some extent, Network Rail has been perceived as a "two-speed-organisation", with the regulatory team much more proactive than delivery units and regional route organisations.
• It cannot be stressed enough that management of change including the qualification / training of Network Rail's internal labour resources and new collaborative models with contractors are among the top ingredients for success. Also, with regard to securing and accelerating implementation, a value based analysis of initiatives against criteria of economic impact, likelihood and time to implementation and required investments should be undertaken. It appears that differing perceptions regarding priorities coexist at the moment.
• Explicit assessments of cost / benefits and lead time to implementation may result in a new sequence of activities with more emphasis on early gains and a learning-by-doing approach in the asset management of tools and systems, gradually leading to maturity.
54

OR
R_R
epor
t-v10
-120
712.
pptx
©
civ
ity 2
012
///
55
Tesdorpfstr. 11 20148 Hamburg phone: +49.40.181 22 36-50 mobile: +49.163.309 61 21 email: [email protected] www.civity.de
Dr Heiner Bente
Tesdorpfstr. 11 20148 Hamburg phone: +49.40.181 22 36-67 mobile: +49.160.706 32 25 email: [email protected] www.civity.de
Klaus Wittmeier
Tesdorpfstr. 11 20148 Hamburg phone: +49.40. 181 22 36-83 mobile: +49.171.862 88 92 email: [email protected] www.civity.de
Jens Gertsen

Appendix
56

OR
R_R
epor
t-v10
-120
712.
pptx
©
civ
ity 2
012
///
A user-oriented and resource-efficient asset management practice concentrates on three overarching objectives Scheme of objectives
57
"…balancing the performance and value of infrastructure usage with the cost and risk of providing this infrastructure"
"…de facto resource deployment requirements to be minimised"
"…efficient utilisation and high output of asset maintenance
resources of highest relevance"
The biggest waste is in ineffective / sparsely
used possessions Performance and
Ownership
Asset Management Strategy
("economies
of scope")
Delivery ("unit costs")
OR
R_R
epor
t-v10
-120
712.
pptx
©
civ
ity 2
012
///
Asset monitoring sphere
Process monitoring sphere
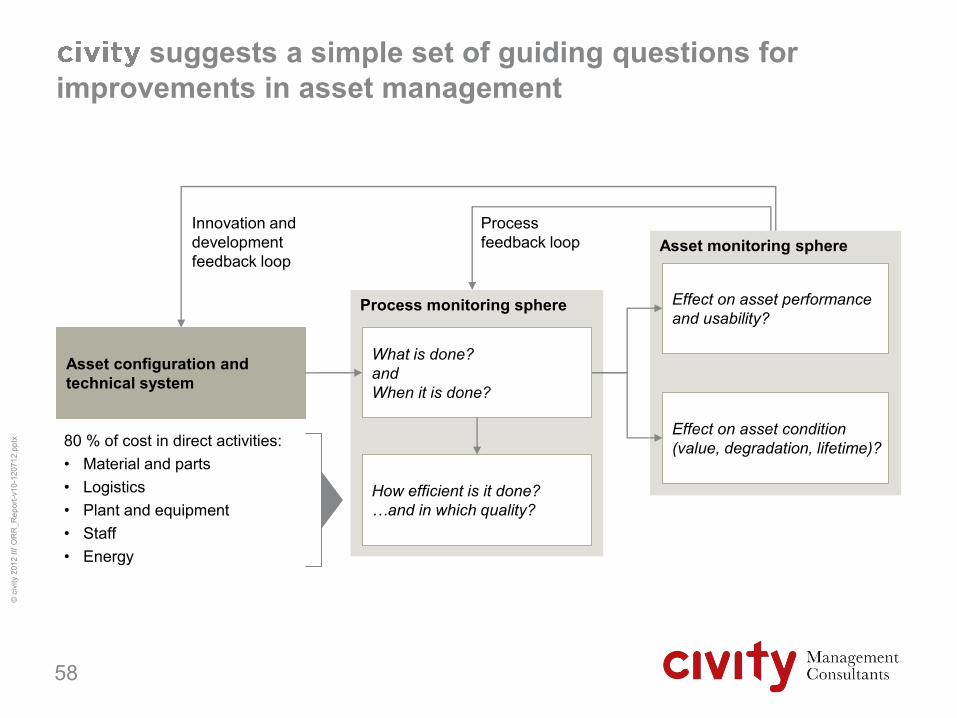
suggests a simple set of guiding questions for improvements in asset management
58
Asset configuration and technical system
What is done? and When it is done?
How efficient is it done? …and in which quality?
Effect on asset condition (value, degradation, lifetime)?
Effect on asset performance and usability?
80 % of cost in direct activities: • Material and parts • Logistics • Plant and equipment • Staff • Energy
Process feedback loop
Innovation and development feedback loop
OR
R_R
epor
t-v10
-120
712.
pptx
©
civ
ity 2
012
///
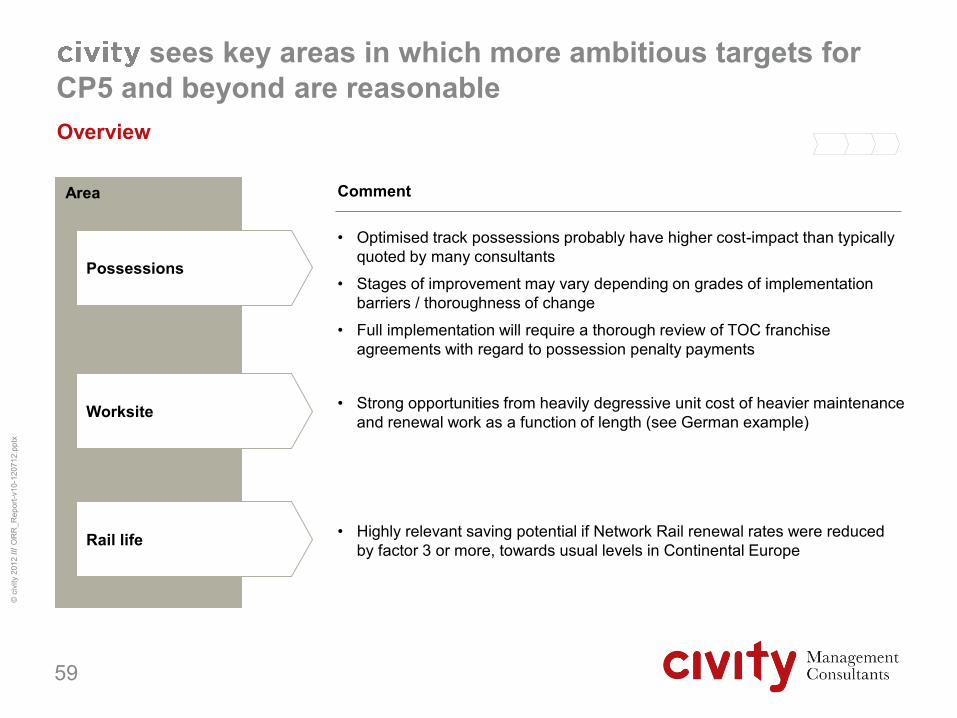
Area
Possessions
• Optimised track possessions probably have higher cost-impact than typically quoted by many consultants
• Stages of improvement may vary depending on grades of implementation barriers / thoroughness of change
• Full implementation will require a thorough review of TOC franchise agreements with regard to possession penalty payments
sees key areas in which more ambitious targets for CP5 and beyond are reasonable Overview
59
Comment
Worksite • Strong opportunities from heavily degressive unit cost of heavier maintenance and renewal work as a function of length (see German example)
Rail life • Highly relevant saving potential if Network Rail renewal rates were reduced by factor 3 or more, towards usual levels in Continental Europe

OR
R_R
epor
t-v10
-120
712.
pptx
©
civ
ity 2
012
///
From a cost of ownership perspective inefficiently used possessions have by far the most negative system impact Indicative scheme
60
2h/8h possession
7.5h/8h high-output
7.5h/8h possession
2h/8h high-output
1.5h/3h possession
Cost of Asset Maintenance (index) Productive time System opportunity cost (index)

OR
R_R
epor
t-v10
-120
712.
pptx
©
civ
ity 2
012
///
From an economic system perspective inefficiently used possessions have by far the most negative system impact
• An economic analysis of track interventions highlights that not only unit-cost of poorly utilised possessions are excessively high, but also opportunity costs for train operations and customers ("traffic hindrance") are burdensome.
• Obviously this logic does not apply to the current set-up because TOC's are compensated for any possession, whether they are used efficiently or not. To the customer of the railway system however (and ultimately the taxpayer) the economic system-view makes it strikingly clear that the current set-up is suboptimal.
• Hence it is of highest importance for the train operator and the infrastructure manager alike to use available track possessions to the best possible limit (e.g.: 7.5 out of 8 hrs). Key aspects that play together in well managed situations are – Rapid and state-of-the-art ramping-up and down of worksites in possessions – Flawless availability (and reliability) of equipment and material supplies – Standardised, "clockwork" maintenance and renewal processes with – Skilled and trained crews.
• It is evident that a ratcheting-up of productive time during an 8 hour possession from 2 hours to 7.5 hours, which is good practice in some European networks, broadly reduces the unit-cost per kilometre by a factor of 3.5 but it also implies that only one single possession of 8 hours is needed, where otherwise some 28 hours may be needed and not available for traffic.
61
Detail (1 of 2)

OR
R_R
epor
t-v10
-120
712.
pptx
©
civ
ity 2
012
///
From an economic system perspective inefficiently used possessions have by far the most negative system impact
• While some of the mentioned aspects are manageable by Network Rail and its contractors alone, there is also barriers to implementation that need a collaborative cross-industry effort in the sense of the McNulty study. This applies to safety rules, that may prevent a waste-free taking and back-handing of possessions, which are however organised differently in other European railway systems that are not under the reputation of not taking safety serious (e.g. Switzerland).
• Given this context it appears that the whole regime of possession allocation needs to be fundamentally revised in franchise agreements, not only in order to give Network Rail adequate and good-practice access conditions, but equally and probably more importantly to the system customers and the taxpayer. This clearly is another cross-industry subject that involves train operators and the government in order to make breakthroughs possible.
• The Rail Delivery Group should be best placed to handle the subject.
62
Detail (2 of 2)

OR
R_R
epor
t-v10
-120
712.
pptx
©
civ
ity 2
012
///
The saving potential of worksite length and extension appears to be still underestimated Detail
63
• There is impressive cost-analytical evidence from various countries and for various work processes, that unit cost of heavier maintenance and renewal work are strongly degressive as a function of length, especially in the range under 1 kilometre of track – DB AG in Germany, for example, has recently decided to impose a minimum of 3 kilometres length and buy work
from contractors accordingly
• Supportingly, coordinated efforts of all participating units (maintenance, renewals and internal delivery unit NDS) to provide plant and material on time are considered as major area of opportunity
• Full use would require safety rules and regulations (which are not in NR's hand) to be amended and harmonised with typical continental European procedures. NR rules and standards are often restrictive but ultimately just historically based and not derived from a real understanding of asset behaviour and safety implications.
OR
R_R
epor
t-v10
-120
712.
pptx
©
civ
ity 2
012
///
Planning and sequencing of worksites should be a priority issue due to its serious economic impact
• From an industrial engineering point of view (heavy machinery and staff as a "moving factory"), poor planning (incl. compliance with plans) and ineffective sequencing of worksites / possessions is another source of serious waste.
• Supply chain discussions with contractors in the UK and in Europe emphasise how much time is often lost unproductively with standstills and logistics ("travel time") of heavy and costly equipment from one site to the next.
• It is perceived that sequencing of work-sites is done by mere schedulers rather than engineers, who are not capable of optimising the utilisation of expensive plant. Against this background, the expensive move of NR to high-output-machinery may be a counterproductive measure, making the reliance on "clock-work-processes" even higher which however is not achieved in the UK. In general, the provision of machinery by the NDS tool and work-sites is far from optimum with regard to utilisation of expensive machinery.
• Apart from scheduling activities into tight timetables (and again adherence to the plans), it is an area for thought and current best-practice initiatives to bring worksites as far as possible into itineraries that minimise travel between sites.
• It is known to that some innovative contractor agreements under new collaborative schemes brought forward by Network Rail have already shown great success in this direction. Out of this brief analysis undertaken here, it cannot be assessed, how far these new practices have move, but it appears very likely that much room for implementation remains.
64
Detail

OR
R_R
epor
t-v10
-120
712.
pptx
©
civ
ity 2
012
///
Renewal rates at Network Rail are by factor 3 and more higher than in Continental Europe – great saving potential
• A comprehensive paradigm shift to quality based asset management, especially for track structures (including substructures and foundations) with substantially extended lifetimes leading to far lower renewal requirements may be much needed in the UK
• A different quality approach to track structures (like e.g. in Austria) could help to move towards 400 MGT rail life as in continental Europe. This however requires a gradual process and will not deliver full savings in a short period of time. As a complement to this, "split-renewals" of track structures will be a good first step into extended useful life of track components
• A similar effort for reliability-centred maintenance of train control and signalling equipment, which typically accounts for most of the system downtime (and corrective maintenance) causing train-delays
• There is a common view that the economic benefit of asset quality (initial quality and quality of intervention processes) is of far-reaching importance and is highly underestimated as a driver for cost, e.g. Austrian and Plasser experience with track alignment.
65
Detail