on the relationship between eurasian snow cover and the asian summer monsoon
TRANSCRIPT

INTERNATIONAL JOURNAL OF CLIMATOLOGY, VOL. 16,605616 (1996)
ON THE RELATIONSHIP BETWEEN EURASIAN SNOW COVER AND THE ASIAN SUMMER MONSOON
M. SANKAR-RAO* Climate Dynamics Progmm, National Science Foundation, Arlington, YA 22230, USA
e-mail smopide@nsj&v
AND
K. M. LAU AND SONG YANGt Laboratory for Atmosphem, NASAIGoddard Space Flight Centec Greenbelt, MD 20771. USA
Received 20 September 1994 Accepted I0 October 1995
ABSTRACT In this paper, we document the possible linkage between Eurasian snow cover and the Asian summer monsoon by analysing the National Oceanic and Atmospheric Administmtion snow data and the atmospheric circulation fields from the National Meteorological Center analyses. Using updated data, we confirm the inverse relationship between the Eurasian snow cover and Indian monsoon rainfall reported in previous studies. We find that the relationship becomes stronger in the partial correlation calculations excluding the El Niiio years. It is found by comparing years of more snow cover with years of less snow cover that the atmosphere is colder over land and warmer over the oceans during the winter seasons with more snow. During the summer following the winter with more snow cover, the lower atmosphere is colder over the Asian continent, especially north of India. Associated with these temperature changes, a weaker Asian monsoon circulation appears.
KEY WORDS: Eurasian snow cover; Asian monsoon; atmospheric circulation; interannual variability
1. INTRODUCTION
The possible relationship between Eurasian snow and the Asian summer monsoon has aroused much research interest. Blanford (1 884) first suggested an inverse relationship between Himalayan snow accumulation and Indian monsoon rainfall (IMR). However, research on snow-monsoon linkage had become less active for several decades since then. Limited efforts during the relatively dormant period include the works of Walker (1923, 1924) and Walker and Bliss (1932), who included snow as one of the predictors in regression equations to predict the IMR. Hahn and Shukla (1976) revived the research interest in snow-monsoon linkage by showing an inverse relationship between IMR and the precursory broad-scale Eurasian snow cover (ESC). Dey and Bhanu Kumar (1982), Dickson (1984), Khandekar (1991), and Garnett and Khandekar (1992) essentially confirmed the ESC-IMR relationship with data sets available at those respective times. Some efforts have been made to understand the relationship between snow cover and monsoon rainfall over other Asian regions. For example Lau and Li (1984) reported a positive correlation between Tibetan snow cover and the Mei-Yu. Recently, Yang and Xu (1994) examined relationships between ESC and homogeneous summer rainfall in several Chinese regions and found significant correlations which varied greatly from one region to another.
The physical mechanism envisaged for the broad-scale inverse snow-monsoon relationship, especially between ESC and IMR, is as follows (Shukla, 1987). Snow cools and stabilizes the lower atmosphere due either to the albedo effect when it covers t’le land surface or to the evaporation effect upon melting. A positive Eurasian snow anomaly
*CorresDondence address: Dr M. Sankar-Rao, Climate Dynamics Program, National Science Foundation, 4201 Wilson Boulevard, Arlington, VA 222j0, USA. TPresent address: General Sciences Corporation, A Subsidiary of Science Applications International Corporation, Laurel, MD 20707, USA.
-
CCC 0899-841 8/96/060605-12 0 1996 by the Royal Meteorological Society
606 M. SANKAR-RAO, K. M. LAU AND SONG YANG
during winter, for example, may result in lower-than-normal Eurasian temperatures during the following seasons due to albedo and soil moisture effects and thus reduce the horizontal north-south temperature gradient. A weaker temperature gradient, in turn, may result in a reduced pressure gradient, a diminished local Hadley cell, and thus a weaker monsoon. With this hypothesis in view, a number of general circulation model (GCM) experiments have been conducted (e.g. Barnett et al. , 1989; Yasunari et al. , 199 1 ; Vemekar et al. , 1995). Although different in details, all these GCM experiments also showed an inverse snow-monsoon relationship to various degrees.
However, the inverse snow-monsoon relationship needs to be further studied for a number of reasons. There are considerable differences between different observations in measuring snow extent (e.g. Robinson and Dewey, 1993). Most of the works on the snow-monsoon relationship utilized the NOAA (National Oceanic and Atmospheric Administration) snow data set. Recent studies have found that for the first 6 years (from 1967 to 1972) the NOAA data set substantially underestimates snow extent (Ropelewski et al., 1984). However, this data period has been included by many studies to examine the interannual snow-monsoon relationship. Almost all the observational studies of snow-monsoon connection are based on the relationship between the snow and monsoon rainfall only. How the antecedent snow is linked to the large-scale monsoon circulation is still unclear. Nevertheless, to understand the physical mechanisms responsible for the snow-monsoon connection, it is necessary to understand the related changes in monsoon circulation patterns.
Problems also exist in GCM simulations. The tropospheric diabatic heating rates depend on many factors, including convection, snow, and ground hydrology, that are poorly represented in GCMs. The cooling in the lower troposphere owing to the presence of snow depends critically on the hydrology parameterizations used. It is still difficult to validate model results against observations regarding these physical processes. Although an unrealis- tically large snow anomaly may cause enhanced signals in models and give rise to an inverse snow-monsoon relationship, we may not conclude simply that such a relationship is a physical reality.
In this work, we try to provide some information that is use l l for understanding the dynamical linkage between the Eurasian snow cover during cold seasons and the large-scale Asian summer monsoon system. One of our main purposes is to understand how the changes in ESC may lead to changes in the large-scale monsoon circulations. In addition to re-examining the general ESC-IMR correlations utilizing consistent available data, our focus will be placed on analysing the differences in the atmospheric circulation fields between years of more snow cover and years of less snow cover. El Niiio-Southem Oscillation (ENSO) is another important element in modulating the interannual variability of the Asian monsoon. It will be a significant advance in monsoon research if the relative importance of ENS0 and snow cover on the monsoon can be assessed. Although GCMs are useful tools for such a task (e.g. Yang and Lau, 1996; Yang et al., 1996), in this observational study, we also try to provide some useful information for separating the ENSO's impact on the monsoon from the snow cover effect.
2. DATA DESCRIPTION
The primary data set used in this study is the National Meteorological Center (NMC) Climate Diagnostics Data Base (CDDB) analyses. The monthly mean global data, in 2.5 x 2.5 grids, covers the period of time from 1979 to 1992. The data contains the horizontal components of winds (V, V), geopotential height (a, and virtual temperatures ( T,) at the levels of 1000,850,700,500,300,200, and 100 hPa. This data has provided important sources for scientific research and a more detailed description of the data can be found in many previous studies (e.g. Arlun, 1982; Trenberth and Olson, 1988; Yang and Webster, 1990). In this study, we analyse the seasonal mean fields of V, KZ, and T, at certain levels. It should be pointed out that, at higher levels and in the areas outside the tropics, T, is a very good indicator of atmospheric temperature because of the lower amount of moisture.
The snow cover data used in this study is from the NOAA NESDIS (National Environmental Satellite, Data, and Information Service) data sets. A detailed description of the data has been given by Matson and Wiesnet (1981), Dewey and Heim (1 982), and Gutzler and Rosen (1 992). We first mapped the snow data on to regular 2" x 2" grids, and then examined Eurasian snow cover for the entire period of time from 1967 to 1992. Results from principal component analyses (not shown) indicate that the data from 1967 to 1972 is not consistent with the rest of the data. The principal components 3 and 4 have large amplitudes Over mountainous regions such as the Himalayas and the Rockies. These results are in agreement with the observation of Ropelewski et al. (1 984). For our purpose in this study, we used the NOAA snow data for a time period of 20 years from 1973 to 1992. Groisman et al. (1 994)
EURASIAN SNOW COVER AND THE ASIAN MONSOON 607
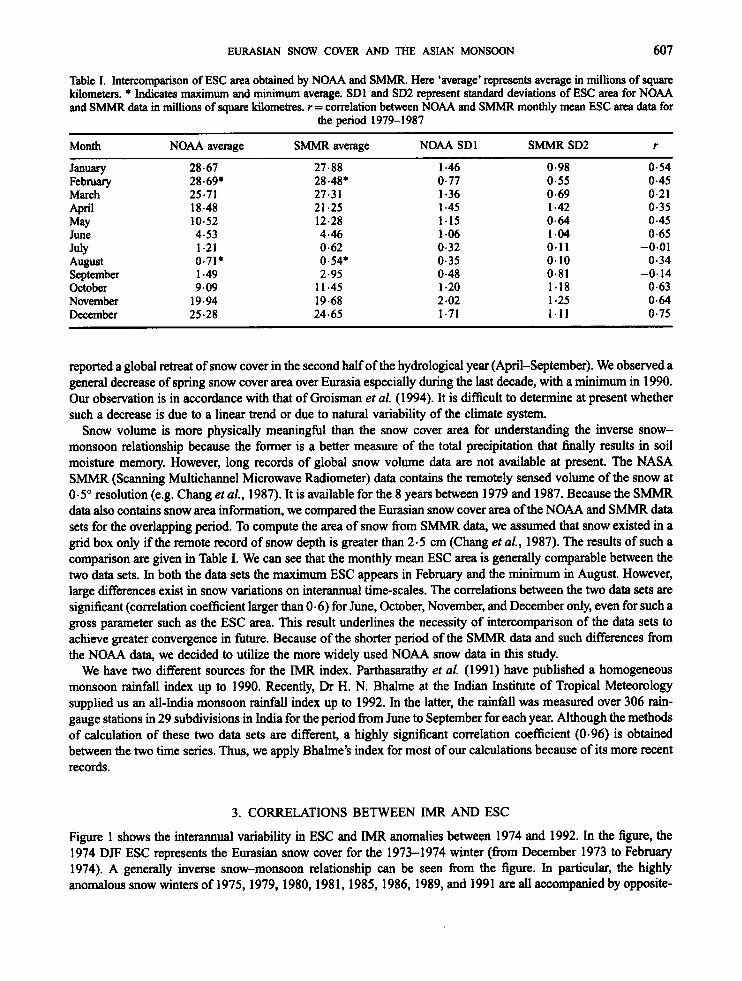
Table I. Intercomparison of ESC area obtained by NOAA and SMMR. Here ‘average’ represents average in millions of square kilometers. * Indicates maximum and minimum average. SD1 and SD2 represent standard deviations of ESC area for NOAA and SMMR data in millions of square kilometres. r = correlation between NOAA and SMMR monthly mean ESC area data for
the period 1979-1987
Month NOAA average SMMR average NOAA SDl SMMR SD2 r
January 28.67 27.88 1.46 0.98 0.54 February 28*69* 28-48* 0.77 0.55 0.45 March 25.71 27.31 1.36 0.69 0.21 April 18.48 21.25 1 *45 1 -42 0.35 May 10.52 12.28 1.15 0.64 0.45 June 4.53 4.46 1.06 1 4 4 0.65
1.21 0.62 0.32 0.1 1 -0.01 August 0.71* 0.54* 0.35 0.10 0-34 September 1.49 2.95 0.48 0.81 -0.14 October 9.09 11.45 1.20 1.18 0.63 November 19.94 19.68 2.02 1 -25 0.64 December 25.28 24.65 1.71 1 . 1 1 0.75
July
reported a global retreat of snow cover in the second half of the hydrological year (April-September). We observed a general decrease of spring snow cover area over Eurasia especially during the last decade, with a minimum in 1990. Our observation is in accordance with that of Groisman et al. (1 994). It is difficult to determine at present whether such a decrease is due to a linear trend or due to natural variability of the climate system.
Snow volume is more physically meaningful than the snow cover area for understanding the inverse snow- monsoon relationship because the former is a better measure of the total precipitation that finally results in soil moisture memory. However, long records of global snow volume data are not available at present. The NASA SMMR (Scanning Multichannel Microwave Radiometer) data contains the remotely sensed volume of the snow at 0.5” resolution (e.g. Chang et al., 1987). It is available for the 8 years between 1979 and 1987. Because the SMMR data also contains snow area information, we compared the Eurasian snow cover area of the NOAA and SMMR data sets for the overlapping period. To compute the area of snow from SMMR data, we assumed that snow existed in a grid box only if the remote record of snow depth is greater than 2-5 cm (Chang et al., 1987). The results of such a comparison are given in Table I. We can see that the monthly mean ESC area is generally comparable between the two data sets. In both the data sets the maximum ESC appears in February and the minimum in August. However, large differences exist in snow variations on interannual time-scales. The correlations between the two data sets are significant (correlation coefficient larger than 0.6) for June, October, November, and December only, even for such a gross parameter such as the ESC area. This result underlines the necessity of intercomparison of the data sets to achieve greater convergence in future. Because of the shorter period of the SMMR data and such differences from the NOAA data, we decided to utilize the more widely used NOAA snow data in this study.
We have two different sources for the IMR index. Parthasarathy et al. (1 99 1) have published a homogeneous monsoon rainfall index up to 1990. Recently, Dr H. N. Bhalme at the Indian Institute of Tropical Meteorology supplied us an all-India monsoon rainfall index up to 1992. In the latter, the rainfall was measured over 306 rain- gauge stations in 29 subdivisions in India for the period from June to September for each year. Although the methods of calculation of these two data sets are different, a highly significant correlation coefficient (0.96) is obtained between the two time series. Thus, we apply Bhalme’s index for most of our calculations because of its more recent records.
3. CORRELATIONS BETWEEN IMR AND ESC
Figure 1 shows the interannual variability in ESC and IMR anomalies between 1974 and 1992. In the fiw, the 1974 DJF ESC represents the Eurasian snow cover for the 1973-1974 winter (from December 1973 to February 1974). A generally inverse snow-monsoon relationship can be seen from the figure. In particular, the highly anomalous snow winters of 1975,1979,1980,1981,1985,1986, 1989, and 1991 are all accompanied by opposite-

608 M. SANKAR-RAO, K. M. LAU AND SONG YANG
DJF Snow Cover and IMR 3-
Snow Cover IMR
- 2.5-
Figure 1 . Year-to-year variability of December-February Eurasian snow cover and Indian monsoon rainfall
sign monsoon rainfall anomalies. However, the snow anomalies during the El Niiio winters of 1977-1978, 1982- 1983, and 1991-1992 are in phase with the following monsoon anomalies with an exception for the year of 1 9 8 6 1987.(TheDJFaveragedSouthernOscillationLndex(SOI)is -1.8, -3.9, -1.5,and -2.4forthewintersof 1977- 1978, 1982-1983, 1986-1987, and 1991-1992, respectively.)
The correlation coefficients between the IMR and ESC for different averaging periods of time are given in Table 11. In the table, PIMR stands for the IMR from Parthasarathy et al. (1 99 1) and BIMR for that from Dr H. N. Bhalme. Hereafter, D, J, F, My and A represent, respectively, the obvious months. For example, DJFM represents the months of December, January, February, and March. It can be seen from the table that all the correlation coefficients show an inverse relationship between ESC and IMR. The highest inverse correlations appear between the DJFMA ESC and IMR, with correlation coefficients slightly below the threshold that is significantly above zero at the 95 per cent confidence level.
To compare our results with previous findings, we summarize the results obtained by earlier studies in Table 111. The table shows that the inverse relationship between cold-season snow cover and the Indian monsoon rainfall is maintained in all the calculations. Although most of the correlations seem to be stronger than those obtained by our current study, it should be pointed out that the higher values of the correlation coefficients in the table may be due either to shorter data periods or to the inclusion of the 1967-1972 snow data where problems exist. Some studies, e.g., Dey and Bhanu Kumar (1 983), have reported an inverse relationship between IMR and Himalayan snow cover (HSC). However, in our computations, we found no significant inverse relationship between IMR and HSC (over the
Table 11. Correlation coefficients between IMR and ESC, where PIMR is the IMR from Parthasarathy ef al. (1991) and BIMRl and BIMR2 are IMR from Bhalme for different
time periods
DJF ESC DJFM ESC DJFMA ESC
PIMR (1973-1990) -0.25 -0.41 -0.44 DIMRl (1973-1990) -0.27 -0.38 -0.40 BIMR2 (1 973-1 992) -0.27 -0.37 -0.34

EURASIAN SNOW COVER AND THE ASIAN MONSOON 609
Table 111. Snow-IMR correlation coefficients from early studies
Parameter Authors Period DJF DJFM MAM
HSC Dey and Bhanu Kumar (1983) 1971-1980 -0.60 HSC Dickson (1984) 197 1-1 980 -0.55 ESC Garnett and Khandekar (1 992) 1967-1 990 -0.44 -0.23 ESC Dickson ( 1984) 1967-1980 -0.44 ESC Dickson (1984) 197 1-1 980 -0.58
Table n! Partial correlation coefficients for 1973-1992 (1, IMR; 2, ESC; 3, SOI)
Season r l3 r23 r12 6 2
DJF -0.30 -0.28 -0.27 -0.39 DJFM -0.25 -0.22 -0.37 -0.45 DJFMA -0.21 -0.16 -0.34 -0.39 DJFMAM 0.00 0.00 -0.20 -0.24
region of 25"N-35"N, 6WN-105"E). It should be kept in mind that even for the post-1972 period, the NOAA snow cover data may still be questionable in the Himalayan region.
Several El Niiio events occurred during the period of time between 1973 and 1992. There are a large number of studies on the linkage between El Niiio and the variability of the Indian monsoon (Pant and Parthasamthy, 198 1 ; Shukla and Paolino, 1983; Ropelewski and Halpert, 1987; among many others). However, the El Niiio-ESC relationship and the role of El Niiio in the ESC-IMR connection are not yet well understood. Does the El Niiio related change in sea-surface temperature provide an important lower boundary effect influencing both LMR and ESC? Is the El Niiio phenomenon a 'spoiler' or 'enhancer' of the snow-monsoon relationship? Assuming that SO1 is a good indicator of ENSO, and assuming that IMR, ESC, and ENSO are the three interactive elements, we computed the correlation coefficients among these indices. The results are given in Table n! in which 1 stands for IMR, 2 for ESC, and 3 for SOI. It can be seen that both ESC and SO1 show inverse relationships with IMR. (The values of the DJF SO1 prior to the monsoon are used in this computation.) To exclude the effect of ENSO on the snow-monsoon relationship, we calculated the partial ESC-IMR correlation coefficients ri2 using the following equation:
r72 = (r12 - r13 x r23)/{(1 - 43) x (1 - &)"' (1)
Equation (1) gives an estimate of the correlation between ESC and IMR after the influence of ENSO on IMR has been removed. It can be seen that, ri2 is larger than rI2 for all the cases, suggesting that the snow-monsoon correlations become stronger after the ENSO effect is removed. This is consistent with the result of Yang (1996). In particular, the ri2 for DJFM becomes significantly above zero at the 95 per cent confidence level. For DJF and DJFMA, the partial correlations are nearly at the 95 per cent confidence level. Thus, we tentatively conclude that the ESC shows a stronger inverse relationship with IMR if the El Niiio years are excluded. This needs to be confirmed by h i h e r investigations when longer records of snow data become available.
4. RELATIONSHIP BETWEEN ESC AND ATMOSPHERIC CIRCULATION
Having re-affirmed the correlation between ESC and IMR, we now turn to an examination of the anomalous large- scale monsoon circulation patterns that may be linked to the variability in Eurasian snow cover. We focus on the composite patterns of various atmospheric parameters between years with above normal ESC and years with below normal ESC. As stated in the introduction, we hope that such an analysis will provide additional information regarding the physics of the snow-monsoon connection. To obtain a physical picture of the effect of ESC on the Asian monsoon system, we need to analyse the associated changes in temperature and winds within the troposphere.
610 M. SANKAR-RAO, K. M. LAU AND SONG YANG
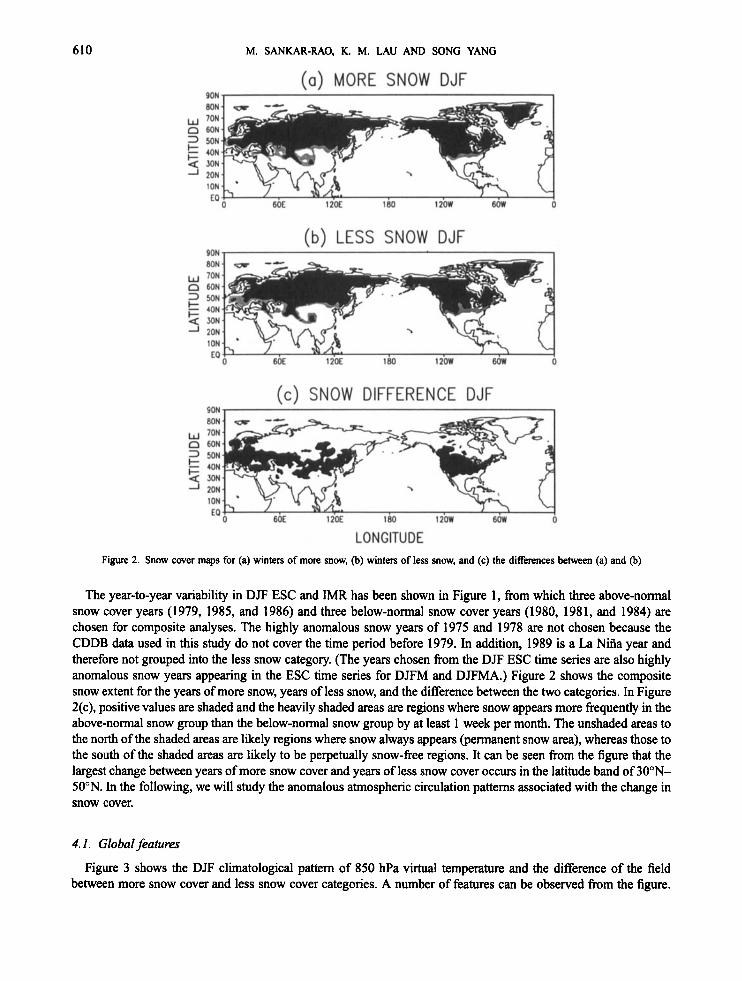
Figure 2. Snow cover maps for (a) winters of more snow, (b) winters of less snow, and (c) the differences between (a) and @)
The year-to-year variability in DJF ESC and IMR has been shown in Figure 1, from which three above-normal snow cover years (1979, 1985, and 1986) and three below-normal snow cover years (1980, 1981, and 1984) are chosen for composite analyses. The highly anomalous snow years of 1975 and 1978 are not chosen because the CDDB data used in this study do not cover the time period before 1979. In addition, 1989 is a La Niiia year and therefore not grouped into the less snow category. (The years chosen from the DJF ESC time series are also highly anomalous snow years appearing in the ESC time series for DJFM and DJFMA.) Figure 2 shows the composite snow extent for the years of more snow, years of less snow, and the difference between the two categories. In Figure 2(c), positive values are shaded and the heavily shaded areas are regions where snow appears more frequently in the above-normal snow group than the below-normal snow group by at least 1 week per month. The unshaded areas to the north of the shaded areas are likely regions where snow always appears (permanent snow area), whereas those to the south of the shaded areas are likely to be perpetually snow-free regions. It can be seen from the figure that the largest change between years of more snow cover and years of less snow cover occurs in the latitude band of 30"N- 50"N. In the following, we will study the anomalous atmospheric circulation patterns associated with the change in snow cover.
4.1. Global features
Figure 3 shows the DJF climatological pattern of 850 hPa virtual temperature and the difference of the field between more snow cover and less snow cover categories. A number of features can be observed from the figure.

EURASIAN SNOW COVER AND THE ASIAN MONSOON 61 1
(a) 850 mb Tv (DJF, Clim) 90
W
3 n 60
Fj33
60 120 180 240 300 360 0
0
LONGITUDE
Figure 3. (a) Longitude-latitude pattern of the December-February climatology of 850 hPa virtual temperature.. @) Difference in 850 hPa virtual temperature between years of more snow and years of less snow (more minus less)
During the winters of more snow, Eurasia and North America are colder, whereas oceans are correspondingly warmer. Such an inverse relationship between snow cover and surface temperature over the USA has been reported in Leathers and Robinson (1 993). We also examined the T, patterns for the levels of 1000, 500, and 200 hPa (not shown). The temperature perturbations are found to be strongest at the 1000 Wa level. The perturbations can be seen clearly up to the 500 hPa level and attenuate generally above that level. Figure 3(b) shows a strong cold anomaly over northern Eurasia between 45"N-8OoN and OoE-140"E, straddled by a strong warm anomaly over the Aleutian region to the east and a relatively weaker warm anomaly over the Black Sea region to the west. It can be observed that the maximum temperature change occurs in the middlehigh latitudes of Eurasia, where the winter stationary perturbations are generally strongest. It is not possible to say whether these temperature changes are associated with the snow changes because the NOAA snow data cannot describe snow mass variations over the permanent snow regions in winter. For MAM (not shown), the warm anomaly over the Black Sea strengthens, whereas the cold anomaly over the Asian region becomes much weaker and is confined to the south to a smaller area (compared with winter) located in the middle latitudes just north of India, between 35"N-SO"N and 60"E-10WE. At the same time, the Aleutian warm anomaly becomes weakened as well.
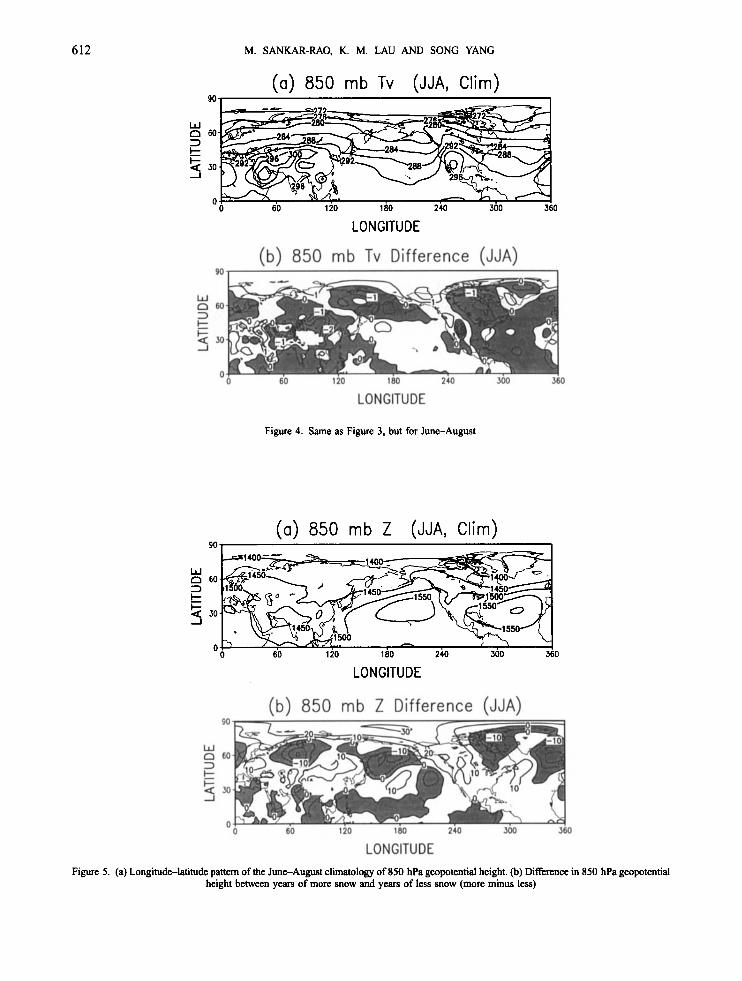
The corresponding T, pattern for JJA (Figure 4) shows negative temperature anomalies over the generally hotter regions of Asia. The largest temperature change (cooling) over Eurasia occurs in the region between 30"N-SOON and 6WE-IlWE. This region partially overlaps the region where positive change (warming) is shown during DJF (Figure 3(b)). At present we are unable to provide an explanation for such a sequence of T, change. Figure 4 shows that during JJA, colder temperatures prevail over the northern American region as well. Thus, the hotter continental regions, which are in general source regions of heating during summer, are considerably colder following the years of more snow. At the 1000 hPa level (not shown), the negative temperature perturbations during JJA were found to be as strong as those during DJF. This suggests a very strong continental scale cooling, especially during JJA over a large area of central Asia,
On the whole, Figures 3 and 4 suggest a strong cooling over Asia during years of more snow and anomalous stationary wave occurrence from DJF through to JJA. The temperature perturbations are strongest near the surface
612 M. SANKAR-RAO, K. M. LAU AND SONG YANG
(a) 850 mb Tv (JJA, Clim)
W 0 60 3 t I- 4 30
0 60 120 180 240 300 360 0
LONGITUDE
Figure 4. Same as Figure 3, but for June-August
(a) 850 mb Z (JJA, Clim)
LONGITU DE
Figure 5. (a) Longitude-latitude pattern of the June-August climatology of 850 hPa geopotential height. (b) Difference in 850 hPa geopotential height between years of more snow and years of less snow (more minus less)
EURASIAN SNOW COVER AND THE ASIAN MONSOON
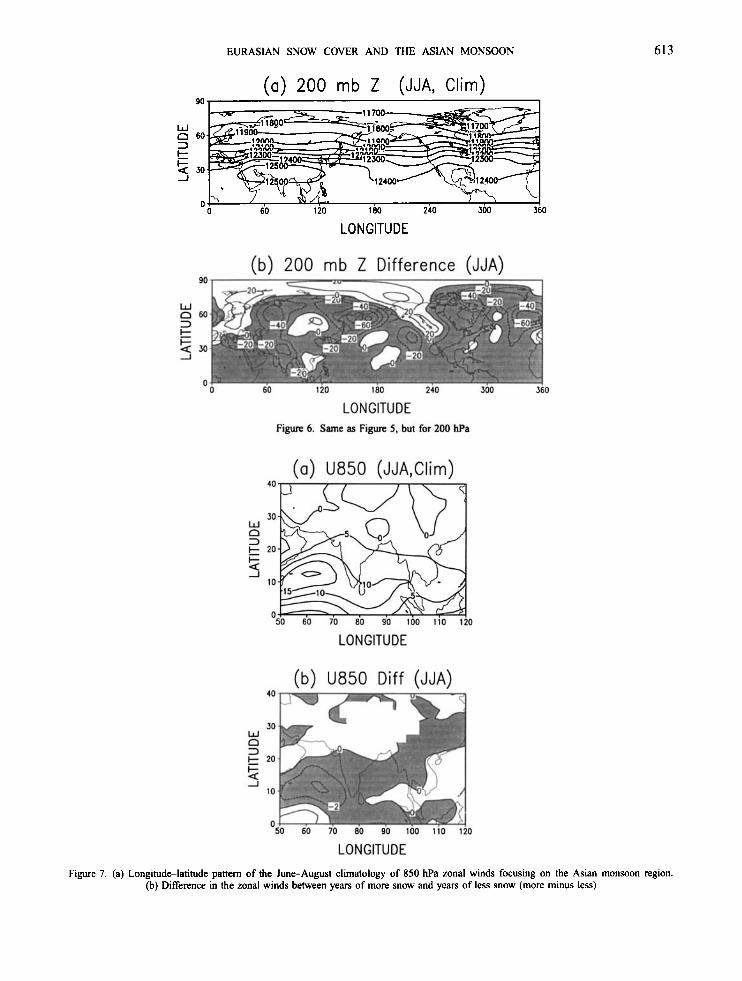
(a) 200 mb Z (JJA, Clim)
0
613
LON GlTU DE
Figure 7. (a) Longitudelatitude pattern of the June-August climatology of 850 hPa zonal winds focusing on the Asian monsoon region. (b) Difference in the zonal winds between years of more snow and years of less snow (more minus less)

614 M. SANKAR-RAO, K. M. LAU AND SONG YANG
Figure 8. Same as Figure 7, but for the meridional component of winds
and extend up to the level of 500 hPa. This is an indication that strong boundary hydrological effects, probably involving surface albedo, soil moisture, evaporation, and sensible heat flux, are in operation.
The JJA climatological pattern of geopotential height and the difference of the field between years of more snow and years of less snow are shown in Figures 5 and 6 for 850 hPa and 200 hPa, respectively. These figures are shown to highlight the changes in the monsoon heat low in the lower troposphere and the Asian high in the upper troposphere, which are the key elements in governing the interannual variability of the Asian monsoon. It can be seen from Figure 5 that the monsoon heat low over central South Asia is weakened (positive values) following the winters of more snow, indicating an adverse pressure gradient anomaly for monsoon development. At the same time, the upper tropospheric monsoon high is also weakened (negative values) significantly over a large area (Figure 6). It can also be observed from the figures that, at 200 hPa, a strong semi-permanent stationary low pressure anomaly system extends from the northern central Asian region to the Indian region. This feature also appears during MAM (not shown). As a result of these anomalies, north-westerly anomalous geostrophic winds are observed Over the north-west Indian region from MAM to JJA. All the above features are consistent with the temperature perturbations shown in Figure 4.
4.2. Regional features
Figure 7 shows the climatological pattern and change (more snow cover minus less snow cover) of the JJA zonal wind component at the 850 hPa level, zooming in the Asian monsoon region. The normal westerly Asian monsoon currents, strongest over the Arabian Sea, can be easily seen from the climatology shown in Figure 7(a). These monsoon currents become significantly weakened following the years of more snow as shown in Figure 7(b). The maximum change in the monsoon currents occurs over the Arabian Sea. The corresponding patterns of the JJA meridional component of winds at the 850 hPa level is shown in Figure 8. During summer, the near-surface Asian

EURASIAN SNOW COVER AND THE ASIAN MONSOON 615
monsoon currents are normally southerly over the Somali jet region and northerly over the south-westem Indian region. It can be seen from Figure 8(b) that both the northerly and southerly winds are weakened following the years of more snow. The consistency in the weakening of both the zonal and meridional monsoon currents shown in Figures 7 and 8 implies a large-scale reduction of the original Asian monsoon circulation after the seasons of more Eurasian snow cover. Obviously, these changes in the monsoon circulation are consistent with the changes in the fields of temperature and geopotential height shown above.
5. CONCLUSION AND DISCUSSION
In this work, we have studied the relationships of Eurasian snow cover with Indian monsoon rainfall and with the large-scale Asian monsoon circulation. Our main findings can be concluded as follows. (i) The general inverse ESC-IMR correlation is significantly above zero at the 95 per cent confidence level only if the El Niiio years are excluded. (ii) Following winters of more snow, the temperatures over Asia during summer are anomalously low in the lower troposphere. As a result, stationary perturbations with higher pressures over central Asia north of India are produced in the lower atmosphere and the following Asian summer monsoon is weaker. (iii) In the upper troposphere, lower anomalous pressure occurs during summer, weakening the upper level monsoon high. This anomalous upper tropospheric low pressure system extends from Asian middle latitudes to the Indian region, resulting in north-westerly anomalous geostrophic winds over the north-western Indian region from MAM to JJA. All these conditions are favourable for the development of a weak monsoon circulation over Asia.
ACKNOWLEDGEMENTS
We thank D. Garrett and X. Wang at NMC for assistance with the NOAA snow cover and NMC CDDB data sets and A. T. C. Chang at NASA/GSFC for providing the SMMR snow data set. M. Sankar-Rao thanks the support from UCAR for making this study possible. Constructive comments from Dr J. Shukla and an anonymous reviewer are appreciated.
REFERENCES
Arkin, F! 1982. ‘The relationship between interannual variability in the 200 mb tropical wind field and the Southern Oscillation’, Mon. Wea.
Barnett, T. F!, Dumenil, L., Schlese, U., Roeckner, E. and Latif, M. 1989. ‘The effect of Eurasian snow cover on regional and global climate
Blanford, H. F. 1884. ‘On the connexion of Hamalayan snowfall and seasons of drought in India’, Proc. R. SOC. London, 37, 3-22. Chang, A. T. C., Foster, J. L. and Hall, D. K. 1987. ‘NIMBUS-7 SMMR derived global snow cover parameters’, Ann. Glaciol., 9, 39-44, Dewey, K. F. and Heim, R. 1982. ‘A digital archive of Northem Hemisphere snow cover, November 1966 through December 1980’, Bull. Am.
Dey, B. and Bhanu Kumar, 0. S. R. U. 1982. ‘An apparent relationship between Eurasian spring snow cover and the advance period of the Indian
Dickson, R. R. 1984. ‘Eurasian snow cover versus Indian monsoon rainfall-an extension of the Hahn-Shukla results’, 1 Clim. Appl. Mereoiul.,
Garnett, E. R. and Khandekar, M. L. 1992. ‘The impact of large-scale atmospheric circulations and anomalies on Indian monswn droughts and
Groisman, F! Y., Karl, T. R., Knight, R. W. and Stenchikov, G. L. 1994. ‘Changes in snow cover, temperature, and radiative heat balance over the
Gutzler, D. S. and Rosen, R. D. 1992. ‘Interannual variability of wintertime snow cover across the Northern Hemisphere’, 1 Climate, 5, 1441-
Hahn, D. G. and Shukla, J. 1976. ‘An apparent relationship between Eurasian snow cover and Indian monsoon rainfall’, 1 Amos. Sci., 33,2461-
Khaodekar, M. L. 1991. ‘Eurasian snow cover, Indian monsoon and El Niiio/Southern Oscillation-a synthesis’, Amos. Ocean, 29,636-647. Lau, K. M. and Li, M. T. 1984. ‘The monsoon of East Asia and its global associations-a survey’, Bull. Am. Meteoiul. Soc., 65, 114125. Leathers, D. J. and Robinson, D. A. 1993. ‘The association between extremes in North American snow cover extent and United States
Matson, M. and Wiesnet, R. D. 1981. ‘New data base for climate studies’, Nature, 289,451456. Pant, G. B. and Parthasamthy, B. I98 1. ‘Some aspects of an association between the Southern Oscillation and Indian summer monsoon’, Arch.
ParhmWhy, B., Rupa Kumar, K. and Munot, A. A. 1991. ‘Homogeneous Indian monsoon rainfall: Variability and prediction’, Pmc. I d .
Rev., 110, 1393-1404.
variations’, 1 Amos. Sci., 46, 661-685.
Meteoml. Soc., 63, 1132-1 141.
summer monsoon’, J: Appl. Meteoml., 21, 1929-1932.
23, 171-173.
floods and on world grain yields-a statistical analysis’, Agric. For: Meteoml., 61, 113-128.
northern hemisphere’, 1 Climate, 7 , 1633-1656.
1447.
2462.
temperatures’, 1 Climate, 6, 1345-1355.
Meteoml. Geophys. Bioklimatol., B29, 245-252.
Acad. Sci. (Earth Planet. Sci.), 102, 121-155.

616 M. SANKAR-RAO, K. M. LAU AND SONG YANG
Robinson, D. A. and Dewey, K. F. 1993. ‘Global snow cover monitoring: an update’, Bull. Am. Meteoml. SOC., 74, 1689-1696. Ropelewski, C. F. and Halpert, M. S. 1987. ‘Global and regional precipitation pattern associated with the El Niiio/Southern Oscillation’, Mon.
Ropelewski, C. F., Robock, A. and Matson, M. 1984. ‘Comments on “An apparent relationship between Eurasian spring snow cover and the
Shukla, J. 1987. ‘Intemnnual variability of monsoons’, in Fein, J. and Stephens, l? (eds), Monsoom, Wiley Interscience, New York, pp. 399-463. ShuMa, J. and Paolino, D. 1983. ‘The Southern Oscillation and the long-range forecasting of monsoon rainfall over India’, Mon. Wen. Rev., 111,
Trenberth, K. E. and Olson, J. G. 1988. ‘An evaluation and intercomparison of global analyses from the National Meteorological Center and the
Vernekar, A. D., Zhou, J. and Shukla, J. 1995. ‘The effect of Eurasian snow cover on the Indian monsoon’, 1 Climate, 8, 248-266. Walker, G. T. 1923. ‘Correlation in seasonal variations of weather, VIII: a preliminary study of world weather’, Mem. Ind. Meteoml. Dept., 24,
Walker, G. T. 1924. ‘Correlation in seasonal variations of weather, Iv: a further study of world weather’, Mem. Ind. Meteoml. Dept., 24,275-
Walker, G. T. and Bliss, E. W. 1932. ‘World Weather V’, Mem. R. Meteoml. SOC., 4, 53-84. Yang, S. 1996. ‘ENSO-Snow-Monsoon associations and seasonal-interannual predictions’, Int. 1 Climatol., in press. Yang, S. and Lau, K. M. 1996. ‘Impact of SST variability and land surface processes on the Asian summer monsoon’, AMS Preprin?s,
Yang, S . and Webster, I? J. 1990. ‘The effect of summer tropical heating on the location and intensity of the extratropical westerly jet streams’,
Yang, S. and Xu, L. 1994. ‘Linkage between Eurasian winter snow cover and regional Chinese summer rainfall’, Znf. 1 Climafol., 14,739-750. Yang, S., Lau, K. M. and Sankar-Rao, M. 1996. ‘Recursory signals associated with the interannual variability of the Asian summer monsoon’,
Yasunari, T., Kitoh, A. and Tokioka, T. 1991. ‘Local and remote responses to excessive snow mass over Eurasia appearing in the northern spring
Wea. Rev., 115, 1606-1626.
advance period of the Indian summer monsoon”’, 1 Clim. Appl. Meteoml., 23,341-342.
1830-1 837.
European Centre for Medium Range Weather Forecasts’, Bull. Am. Meteoml. Soc., 69, 1047-1057.
75-13 1.
332.
Symposium on the Global Ocean-Ahosphere-Land System (GOALS), 28 January-2 February 1996, Atlanta, Georgia, 126-130.
J. Geophys. Res., 95, 18705-18721.
1 Climate, in press.
and summer cl imatea study with the MRI GCM’, 1 Meteoml. SOC. Jpn, 69, 473487.