occupational health and safety practices influ nce …
TRANSCRIPT
OCCUPATIONAL HEALTH AND SAFETY PRACTICES INFLUENCE ON
EMPLOYEE PERFORMANCE IN BEVERAGE MANUFACTURING FIRMS
IN NAIROBI CITY COUNTY, KENYA
PAUL SANTANA ODUOR
D58/CTY/PT/24708/2013
A THESIS SUBMITTED TO THE SCHOOL OF BUSINESS IN PARTIAL
FULFILLMENT OF THE REQUIREMENT FOR THE AWARD OF DEGREE OF
MASTER OF SCIENCE IN HUMAN RESOURCE MANAGEMENT KENYATTA
UNIVERSITY
APRIL, 2021

ii
DECLARATION
This thesis is my original work and has not been presented for a degree in any other university.
Signature………………………………………………. Date ………………………………..
Paul Santana Oduor
D58/CTY/PT/24708/2013
We confirm that the work done in this thesis was done by the candidate under our supervision.
Signature…………………………………………. Date…………………………………..
Dr. Linda Kimencu
Department of Business Administration
School of Business,
Kenyatta University.
Signature………………………………………….. Date………………………..
Dr. Jedidah Muli
Department of Business Administration
School of Business,
Kenyatta University.
02/04/2021
5th April 2021
10th April 2021

iii
DEDICATION
I dedicate this thesis to God, my family members and my sincere thanks goes to them especially
my father John Oduor, mother, Felista Akoth, brother and sister, Joseph Ochieng and Rose
Anne for their advice, financial and moral support. I would also like to give thanks to the late
Lilian Weswa my former colleague who helped me in one way or another.
God bless you all.

iv
ACKNOWLEDGEMENT
I would like to give thanks to those who assisted me towards the success of this thesis. My
sincere acknowledgement goes to my supervisor Dr. Linda Kimencu and Dr. Jedidah Muli for
the guidance and positive criticism that contributed towards the success of this thesis.

v
TABLE OF CONTENTS
Declaration……………………………………………………………………………………ii
Dedication ................................................................................................................................ iii
Acknowledgement ................................................................................................................... iv
List of Tables .............................................................................................................................x
List of Figures ......................................................................................................................... xii
Abbreviation and Acronyms .................................................................................................. xiii
Operational Definition of Terms ............................................................................................ xiv
Abstract .................................................................................................................................. xvi
CHAPTER ONE : INTRODUCTION...................................................................................1
1.1 Background of the Study………………………………………………………………….1
1.1.1 Employee Performance………………………………………………………………….2
1.1.2 Occupational Health and Safety Practices…………………………………………….....5
1.1.3 Occupational Health and Safety Law……………………………………………………9
1.1.4 Beverage Manufacturing Firms ......................................................................................13
1.1.4.1 Global Perspective of Beveragre Manufacturing Firms ……………………………..13
1.1.4.2 Regional Perspective of Beverage Manufacturing Firms…………………………….14
1.1.4.3 Local Perspective of Beverage Manufacturingfirms…………………………………15
1.1.4.4 Beverage Manufacturing Firms in Nairobi City County of Kenya……………………15
1.2 Statement of the Problem ...................................................................................................16
1.3 Objectives of the Study ......................................................................................................18
1.3.1 General Objective ...........................................................................................................18
1.3.2 Specific Objectives .........................................................................................................18
1.4 Research Hypotheses .........................................................................................................19
1.5 Significance of the Study ...................................................................................................19
1.6 Scope of the Study .............................................................................................................20
1.7 Limitation of the Study ......................................................................................................21
1.8 Organization of the Study ..................................................................................................22

vi
CHAPTER TWO : LITERATURE REVIEW ....................................................................23
2.1 Introduction ........................................................................................................................23
2.2 Theoretical Review ............................................................................................................23
2.2.1 Resource Based View Theory .........................................................................................23
2.2.2 Goal Setting Theory of Motivation .................................................................................25
2.2.3 Institutional Theory .........................................................................................................27
2.2.4 Herzberg’s Two Factor Theory of Motivation…………………………………………30
2.3 Empirical Literature Review ..............................................................................................33
2.3.1 Safety Training Practices and Employee Performance ...................................................33
2.3.2 Hazard Control Practices and Employee Performance ...................................................37
2.3.3 Workplace Safety Inspection and Employee Performance .............................................40
2.3.4 Safety Records and Employee Performance ..................................................................43
2.3.5 Moderating Effect of Occupational Health and Safety Law …………………………..46
2.4 Summary of Literature and Research Gaps .......................................................................50
2.5 Conceptual Frame Work ....................................................................................................52
CHAPTER THREE : RESEARCH METHODOLOGY AND DESIGN .........................54
3.1 Introduction ........................................................................................................................54
3.2 Research Philosophy ..........................................................................................................54
3.3 Research Design.................................................................................................................54
3.3.1 Empirical Model .............................................................................................................55
3.3.2 Moderation Model ..........................................................................................................56
3.3.3 Operationalization and Measurement of Variables .........................................................58
3.4 Target Population ...............................................................................................................63
3.5 Sampling Design ................................................................................................................63
3.6 Data Collection Instrument ................................................................................................65
3.7 Data Collection Procedures................................................................................................67
3.8 Pilot Study ..........................................................................................................................67
3.9 Validity and Reliability of of Research Instrument ...........................................................68
3.9.1 Testing Validity of Resarch Instrument ..........................................................................68
3.9.2 Testing Reliability of Resarch Instrument ......................................................................69

vii
3.10 Diagnostic Test ................................................................................................................69
3.10.1 Normality Test ..............................................................................................................69
3.10.2 Homogeneity of Variance Test .....................................................................................69
3.10.3 Multicollinearity Test…………………………............................................................70
3.11 Data Analysis and Presentation .......................................................................................71
3.12 Ethical Consideration .......................................................................................................72
CHAPTER FOUR: DATA ANALYSIS, PRESENTATION AND DISCUSSION ..........73
4.1 Introduction ........................................................................................................................73
4.2 Response Rate ....................................................................................................................73
4.3 Testing Reliability of the Measuring Instrument ...............................................................74
4.4 Validity Testing of the Measuring Instrument ...................................................................75
4.5 Demograhic Information of the Respondents ....................................................................78
4.5.1 Gender .............................................................................................................................78
4.5.2 Age ..................................................................................................................................79
4.5.3 Highest Education Level .................................................................................................80
4.5.4 Working Experience. .....................................................................................................81
4.5.5 Nature of the Business ....................................................................................................82
4.5.6 Management Level..........................................................................................................83
4.6 Descriptive Analysis ..........................................................................................................84
4.6.1 Descriptive Analysis of Occupational Health and Safety Practices .............................84
4.6.1.1 Descriptive Analysis of Safety Training Practices ......................................................84
4.6.1.2 Descriptive Analysis of Hazard Control Practices .......................................................86
4.6.1.3 Descriptive Analysis of Workplace Safety Inspection ................................................88
4.6.1.4 Descriptive Anlysis of Safety Record ..........................................................................90
4.6.2 Descriptive Anlysis of Occupational Health and Safety Law ........................................92
4.6.3 Descriptive Analysis of Employee Performance. ..........................................................94
4.6.4 Descriptive Analysis……………………………………………………………………96
4.6.4.1 Descriptive Analysis …………………………………………………………………96
4.6.4.1.1 Descriptive Analysis on the Improvement of Safety Training Practices…………..96
4.6.4.1.2 Descripitive Analysis on the Improvement of Hazard Control Practices. ................98

viii
4.6.4.1.3 Descriptive Analysis on the Improvement of Workplace Safety Inspection. ...........99
4.6.4.1.4 Descriptive Analysis on the Improvement Safety Record ......................................100
4.6.4.2 Descriptove Analysis on the Improvement of Occupational Health and Safety Law..101
4.6.4.3 Descriptive Analysis on the Improvement of Employee Performance ......................103
4.7 Diagnostic Test ................................................................................................................104
4.7.1 Normality Test .............................................................................................................104
4.7.2 Homogeneity of Variance Test .....................................................................................105
4.7.3 Multicollinearity Test....................................................................................................106
4.8 Inferential Anlysis ...........................................................................................................107
4.8.1 Correlation Analysis .....................................................................................................107
4.8.1.1 Safety Training Practices and Employee Performance ..............................................108
4.8.1.2 Hazard Control Practices and Employee Performance .............................................109
4.8.1.3 Workplace Safety Inspection and Employee Performance .......................................110
4.8.1.4 Safety Record and Employee Performance ...............................................................111
4.8.2 Multiple Linear Regression Analysis............................................................................111
4.8.3 Moderated Multiple Regression Analysis .....................................................................114
4.9 Testing of Hypotheses.....................................................................................................120
4.9.1 Testing of Hypothesis Ho1 ............................................................................................120
4.9.2 Testing of Hypothesis Ho2 ...........................................................................................121
4.9.3 Testing of Hypothesis Ho3 ............................................................................................122
4.9.4 Testing of Hypothesis Ho4 ............................................................................................123
4.9.5 Testing of Hypothesis Ho5 ............................................................................................124
CHAPTER FIVE : SUMMARY, CONCLUSION AND RECOMMENDATIONS ......126
5.1 Introduction ......................................................................................................................126
5.2 Summary of the Findings .................................................................................................126
5.2.1 Summary of Descriptive Analysis of Demographic Information of the Respondents..128
5.2.2 Summary of Descriptive Analysis of Occupational Health and Safety Practices .......129
5.2.2.1 Summary of Descriptive Analysis of Safety Training Practices ...............................129
5.2.2.2 Summary of Descriptive Analysis of Hazard Control Practices ...............................129
5.2.2.3 Summary of Descriptive Analysis of Workplace Safety Inspection .........................130

ix
5.2.2.4 Summary of Descriptive Analysis of Safety Record ................................................130
5.2.3 Summary of Descriptive Analysis of Occupational Health and Safety Law ................131
5.2.4 Summary of Descriptive Analysis of Employee Performance. ...................................131
5.2.5 Summary of Inferential Analysis ..................................................................................132
5.2.5.1 Safety Training Practices and Employee Performance……………………………..132
5.2.5.2 Hazard Control Practices and Employee Perfromance ..............................................133
5.2.5.3 Workplace Safety Inspection and Employee Performance. ......................................133
5.2.5.4 Safety Record and Employee Performance ...............................................................134
5.2.5.5 Moderating Effect of Occupational Health and Safety Law ......................................135
5.3 Conclusion ......................................................................................................................136
5.4 Recommendations ...........................................................................................................143
5.4.1 Policy ............................................................................................................................143
5.4.2 Practice ..........................................................................................................................144
5.4.3 Methodology………………………………………………………………………….144
5.4.4 Theory………………………………………………………………………………...146
5.5 Areas for Further Research ..............................................................................................147
REFERENCES.....................................................................................................................149
Appendix I : Letter of Transmission for Data collection ......................................................170
Appendix II : Questionnaire ...................................................................................................171
Appendix III: List of Beverage Manufacturing Firms in Nairobi City County, Kenya ........179
Approval Research Proposal internal memo from Kenyatta University (Graduate School).
Research authorization letter from Kenyatta University (Graduate School).
Research authorization letter from NACOSTI.
Research permit from NACOSTI.

x
LIST OF TABLES
Table 2.1 Summary of Literature and Research Gaps………………………………………50
Table 3.1 Operationalization and Measurement of Variables………………………………60
Table 3.2 Target Population of the Study…………………………………………………...63
Table 3.3 Sample Size of the Study………………………………………………………....65
Table 4.1 Response Rate……………………………………………………………………73
Table 4.2 Reliability Test for the Measuring Instrument……………………...……............74
Table 4.3 Model Summary for Multiple Linear Regression Analysis ……………………..75
Table 4.4 ANOVA for Multiple Linear Regression Analysis………………………………76
Table 4.5 Model Summary for Moderated Multiple Regression Analysis…………………77
Table 4.6 ANOVA for Moderated Multiple Regression Analysis ……………………...….77
Table 4.7 Descriptive Anlysis of Safety Training Practices………………………………...85
Table 4.8.Descriptive Analysis of Hazard Control Practices………………………………87
Table 4.9 Descriptive Analysis of Workplace Safety Inspection……………………….......89
Table 4.10 Descriptive Analysis of Safety Record ………………………………………...91
Table 4.11 Descriptive Anlysis of Occupational Health and Safety Law………………….93
Table 4.12 Descriptive Anlysis of Employee Performance ………………………………...95
Table 4.13 Descriptive Analysis on the Improvement of Safety Training Practices ……....97
Table 4.14 Descriptive Analysis on the Improvement of Hazard Control Practices ……....98
Table 4.15 Descriptive Analysis on the Improvement of Workplace Safety Inspection…....99
Table 4.16 Descriptive Analysis on the Improvement of Safety Record …………………100
Table 4.17 Descriptive Analysis on the Improvement of Occupational Health and Safety
Law…………………………………………………………………………………………102
Table 4.18 Descriptive Analysis on the Improvement of Employee Performance ……….103
Table 4.19 Normality Test ………………………………………………………………..104
Table 4.20 Homogeneity of Varinces Test ………………………………………………..105
Table 4.21 Testing Multicollinearity ……………………………………………………...106
Table 4.22 Correlation Analysis …………………………………………………………..108
Table 4.23 Multiple Linear Regression Analysis Coefficient …………………………….112

xi
Table 4.24 Model Summary for Moderated Multiple Regression Anlysis………………115
Table 4.25 Moderated Multiple Regression Anlysis Coefficient ……………………….116

xii
LIST OF FIGURES
Fig 2.1 Conceptual Frame Work…………………………………………………………...53
Fig 4.1 Gender……………………………………………………………………………...78
Fig 4.2 Age…………………………………………………………………………………79
Fig 4.3 Highest Education Level…………………………………………………………...80
Fig 4.4 Working Experience………………………………………………………………..81
Fig 4.5 Nature of the Business……………………………………………………………...82
Fig 4.6 Management Level………………………………………………………………...83

xiii
ABBREVIATION AND ACRONYMS
DOSHS Director of Occupational Safety and Health Services.
HSR Health and Safety Representative.
NACOSTI National Commission for Science, Technology and Innovation.
OHS Occupational Health and Safety.
OHSP Occupational Health and Safety Practices
OSHEA Occupational Safety and Health Act.
PPE Personal Protective Equipment.
RBV Resource Based View.
SPSS Statistical Package for Social Scientist.
USA United States of America.
UK United Kingdom.
VIF Variance Inflation Factor.

xiv
OPERATIONAL DEFINITION OF TERMS
Administrative Control These are safety policies that are aimed at limiting employees’ exposures to hazards and it includes: limiting
hours of work, safety practices, personal hygiene and rest schedules.
Beverage Manufacturing Firms
These are firms that manufacture alcoholic and non-alcoholic drinks. Alcoholic drinks include: wine, beer and distilled spirit. Non-alcoholic drinks includes: carbonated soft drinks and fruit juice.
Coaching These include number of trainer committed to offer coaching with clear goals and objectives.
Engineering Control These are number of substitution, elimination and ventilation conducted at the workplace.
Employee Performance These are measures of outcome of occupational health and safety practices and it includes: number of products labelled appropriately, number of inspection conducted on carrier vehicles, talking to customers and rewarding of good attendance.
Hazard Control Practices These are measures taken by management to protect employees from exposure to hazardous substances and the controls include: engineering control, administrative control and provision of personal protective equipment.
Occupational Health and Safety Practices
These involves keeping of safety records, number of workplaces inspection conducted, number of usage of personal protective equipment, and number of trainers committed to offer job rotation, job instruction, coaching and lecture training.
Job Instruction These include the number of job instruction having clear goals and objectives conducted at the workplace.
Job Rotation These include number of job rotation conducted at workplace and the feedback provided.
Lecture Training These include number of lecturing training conducted at the workplace and evaluated by competent trainer.

xv
Occupational Health and Safety Laws
These are number of penalties and fines imposed on person for contravening occupational health and safety law and the number of inspection and audit conducted by occupational health and safety officer.
Safety Records These include number of updates on safety records, conditions for storage of safety records and number of times classification are conducted on safety records.
Personal Protective Equipment
These include number of personal protective equipment of appropriate sizes provided to employees. .
Safety Training Practices These are number of job rotation, job instruction, coaching and lecture training conducted and evaluated at the workplace.
Workplace Safety Inspection.
These includes the number of workplace safety inspections conducted and safety inspection report handed over to management.

xvi
ABSTRACT
The employee performance in beverage manufacturing firms in Nairobi City County of Kenya have been declining in terms of poor delivery and quality production of products, and high absenteeism rate. The objectives of the study was to determine the effect of safety training practices, hazard control practices, workplace safety inspection and safety record on employee performance in beverage manufacturing firms in Nairobi City County of Kenya. And to determine the moderating effect of occupational health and safety law on the relationship between occupational health and safety practices and employee performance in beverage manufacturing firms in Nairobi City County of Kenya. The study adopted experimental research design. The target population was 483 employees working in 32 beverage manufacturing firms located in Nairobi City County of Kenya and it included: spirit, beer, wine, fruit juice and carbonated soft drinks. The 483 employees included: human resource managers, operation managers and factory floor staffs. Krejece Morgan table determined the sample size of 196 employees. A multi stage sampling technique was used to select sample size of the study. The semi structured questionnaire was used to collect qualitative and quantitative data. The statistical package for social scientist version 21 analyzed the data. The study conducted reliability and validity test of the questionnaire. The diagnostic test conducted includes: normality test, homogeneity of variance test and multicollinearity test. The qualitative data analyzed using descriptive statistics such as frequency and percentage and the information presented in form of statistical tables. The quantitative data analyzed using descriptive and inferential statistics such as mean, standard deviation, Pearson correlation of coefficient, multiple linear regression analysis and moderated multiple regression analysis. The information presented inform of pie charts, bar graphs, and statistical tables. The null hypotheses rejected or failed to reject at 0.05 level of significance. There was a weak positive relationship which was statistically significant between safety training practices and employee performance. There was a weak negative relationship which was statistically significant between hazard control practices and employee performance. There was a strong positive relationship which was statistically significant between workplace safety inspection and employee performance. There was a moderate positive relationship which was statistically significant between safety record and employee performance. The safety training practices and hazard control practices were not significant predictors of employee performance. The workplace safety inspection and safety record statistically significantly predicted employee performance. The occupational health and safety law statistically significantly moderates the relationship between occupational health and safety practices and employee performance. The study recommends that the Director of Occupational Safety and Health Services to impose heavy fines on employers who are violating occupational health and safety laws. The study recommends employer to ensure that health and safety representative frequently conducts workplace safety inspection. The study recommends the employer to keep safety records in good condition. The study recommends that experimental research design should be adopted in the study. The study recommends that the target population should be employees working in beverage manufacturing firms in Nairobi City County of Kenya. The study recommends that the following theories should be adopted in the study: resource based view theory, institutional theory, goal setting theory of motivation and Herzberg’s two factor theory of
motivation.

1
CHAPTER ONE
INTRODUCTION
1.1 Background of the Study
According to Pouliakas and Theodossiou (2003) an increase of industrialization across the
globe has led employees at the workplace to be exposed to physical, chemical, biological and
psychological hazards. These have resulted in 270 million occupational accidents and 160
million occupational diseases each year across the globe. Most countries in Africa are known
to have inadequate health and safety management practices (Puplampu & Quartey, 2004). For
instance, a study done in East Africa in gold mining reported that there was an abnormally high
concentration of mercury in the urine samples of the miners as they were exposed to mercury
vapours during the burning of gold mercury amalgams (Regional Committee for Africa, 2004).
These were further supported by Agbenorku, Owusu, and Nyador (2005) who argued that
employees who work at the mining and printing industries were exposed to a high level of
injuries, diseases, and risks.
Most African countries emphasize more on increasing productivity and profitability at the
expense of employee health and safety (Rantanen, Lehinen, & Savolainen, 2006). Katsakiori,
Sakellaropoulos, and Mantakis (2006) showed that most African countries have poor sanitation
caused by lack of accessible running water as well as inadequate toilet facilities and these have
led to the occurrence of diseases such as malaria and diarrhoea. Moreover, according to the
report of the World Health Organization Regional Office for Africa (2006) there was high
prevalence of occupational health and safety (OHS) issues in most African countries and these
2
have been attributed to inadequate attention given to OHS issues by industry and government.
This was further supported by Muchiri (2008) who identified some OHS challenges facing
African countries such as: poor OHS infrastructure, insufficient number of qualified OHS
practitioners and general lack of adequate information about occupational health and safety
practices (OHSP) amongst employees. However, Moyo, Zungu, Kgalamono, and Mwila
(2015) still believes that some African countries were improving on OHSP through OHS
education, training and collaborating with OHS research institution. In addition, Idoro (2016)
argued that industries in Nigeria were pursuing OHS initiatives such as OHS awareness,
incentives, accidents investigations and provision of personal protective equipment (PPE).
1.1.1 Employee Performance
Employee performance is the successful completion of tasks by selected individual as set
measured by the supervisor to predefined acceptable standards while efficiently and effectively
utilizing the available resource within a changing environment (Wall, Mochie, & Patterson,
2004). Other scholars such as Dwomoh, Owusu, and Addo (2005) define employee
performance as the records of outcome achieved for each job function during a specified period
of time. Stan, Merescu, Neagoe, and Teceu (2006) states that employee performance can be
measured in terms of delivery of the products, presence at work, quality of the products and
cooperativeness.
Beverage manufacturing firms across the globe have adopted different type of indicators of
employee performance for example in United States of America (USA) and United Kingdom
(UK) employee performance are measured based on quality of the products produced in terms

3
of customer taste and preference (Campell & Gillian, 2004). Other scholars such as Maruta
and Rikio (2012) argued that sometimes it may be difficult for employees to produce products
that attained customer taste and preference especially when the machines used for production
are defective. Beverage manufacturing firms in Pakistan measure employee performance
based on delivery of beverage manufacturing products to customer and number beverage
manufacturing products packed in suitable containers and labelled appropriately
(Amir, Waqar, Ali, & Zameer, 2014).
In USA employees’ performance are measured in terms of attendance and it involved
rewarding good attendance and it can be in form of financial and non-financial rewards
(Creswell, 2014). On the other hands scholars such as Sokovic, Paveletic, and Pipan (2014)
are against the practice because they believed that employees can manipulate the practice to
their advantage. Employees who are responsible for delivering beverage manufacturing
products, their performance are measured based on inspection conducted on the carrier vehicles
(Jinhui, Sarah, Zhang, Schroeder, & Roger, 2014). In India employee performance in beverage
manufacturing firms are measured in terms of number of quality of products delivered to
customers without damage, complains from the workmates and absenteeism
(Chaudhray & Sharma, 2014).
The beverage manufacturing firms across Africa continent emphasized at increasing
production, therefore employees are compensated according to the unit and quality of the
products produced per given time (Flint & Gamelgaard, 2012). However, Maras and Elliot
(2014) argued that this method of measuring employee performance was not appropriate

4
because employees can produce more units with the hope of earning more wages and in the
end the process the quality of the products are compromised. Employees who are in charge of
packaging beverage manufacturing products their performance are normally measured based
on number of products labelled and packed appropriately (Jacobsen, 2014). The employees’
performance was also measured in terms of average weekly work, complains from the
workmates, stress and job satisfaction (Nasse, 2019). Absenteeism was also another indicators
of employee performance, employees are only compensated for the hours worked, while those
who absent themselves from work without giving notice to their employer are fined or
summarily dismissed (Azar & Shafighi, 2019).
According to Karuga, Anyango, Gitu, Namu, and Upadhya (2002) beverage manufacturing
firms in Kenya measure employees’ performance based on time they arrived at the workplace.
Employees who distribute deliver beverage manufacturing products to customers, their
performance are measured on the number of products packed and labelled appropriately and
delivered to customers within the shortest time possible and also complaints from fellow
workmates (Nyambura, 2009). Those who are in charge of production process their
performance are measured in terms of quality of the products produced and time taken to
produce the products (Awino, Ogaga, & Machuki, 2017).
The employee performance was used in the study as dependent variable and it was measured
in terms of quality of the products, delivery of the products and absenteeism. According to
Kimuyu (2014) there was a decline of employee performance in beverage manufacturing firms
in Nairobi City County of Kenya and employee performance were measured in terms of quality

5
of the products, delivery and absenteeism. Therefore, the study adopted those indicators of
employee performance so as to determine what led to decline of employee performance in
beverage manufacturing firms in Nairobi City County of Kenya.
1.1.2 Occupational Health and Safety Practices
According to Kaynak, Toklu, and Elci (2003) OHSP are protocols employees adhere to when
it comes to reducing accidents, illness and injuries at the workplace and such practices
includes: safety training practices, hazard control practices, workplace safety inspection, and
safety records. Kretchmar (2003) described safety training practices as an excellent way in
which employees acquired new skills and knowledge and reinforce good practices such as
wearing PPE and identifying hazards. Other scholars such as Shehu, Subramaniam, and Johari
(2005) also refer to safety training practices as planned effort to facilitate the learning of OHS
competencies such as safe work practices, emergency procedures, and prevention.
According to Wahab, Rajab, Shaari, Rahman, and Saat (2005) safety training practices can be
classified into categories and include on job safety training and off job safety training practices.
On job safety training was practices described by Alipour and Shahnavaz (2005) as a practices
of training where the learner develops skills in the real work environment by actually using
machinery and material during training and such includes: job rotation, job instruction, and
apprentice. On the other hand, Weinstock, and Slatin (2006) define off job safety training
practices as training that are performed away from work environment and it can be conducted
through lecture training, discussion, simulation training, and case study.

6
In developed countries such USA, Canada and the UK the organization has competent internal
trainer who delivers OHS training programs to employees, but in a situation where the
organization lack internal expertise it can hire external professional consultants to deliver the
safety training program to employees (Vignoli, Punnett, & Depolo, 2008). In developing
countries such as Nigeria, South Africa and Kenya, organizations are still using traditional
methods of safety training such as lecture training but it has been modified with other safety
training techniques such as videos, DVD lecture or e-learning (Olutuase, 2008).
In terms of hazard control practices, Weyman and Clarke (2002) define hazard control
practices as a measures taken by the management to protect employees against hazards and it
includes: engineering control, administrative control and use of PPE. Countries such as USA,
UK and Canada, organization are using engineering controls to eliminate or control hazards at
the workplace and such controls includes: ventilation, automation, and isolation (Holmes,
Lingard, Yesilyurt, & De Munk, 2002). Christian, Bradley, Wallace, and Burke (2003)
mentioned that the organizations from these countries also use isolation to eliminate hazards
at the workplace and it’s achieved through containment or enclosure of hazards such as using
the wielding screen to isolate welding operations from other employees. In African countries
especially Ghana, Nigeria and Kenya, the process are automated and mechanized, but they are
not advanced as those of developed countries where conveyor belts are used to transport raw
materials and beverage products (Idubor & Oisamoje, 2004).
The workplace safety inspection was also another form of OHSP and was described by Ohdo,
Hino, and Takanashi (2005) as the regular examination of the workplace to recognize and

7
evaluate the existing and potential hazards and recommend corrective action. Nikolaos (2007)
described workplace safety inspection as a systematic way of checking the work environment
and procedures to ensure that it meets the OHS standards. In the USA, UK and Canada
workplace safety inspection are conducted internally by employer or health and safety
representative (HSR), externally by enforcement officer, insurance consultants and specialist
engineer and these may include: daily inspection of machine and equipment, initial startup
instructions and walk rounds of mobile equipment before use (Swuste, Gulijk, & Zwaard,
2008).
On the other hand, Kin and Bonaventura (2009) argued that workplace safety inspection from
these countries are conducted depending on the risks the organization faces. More ever,
Kotusoroi (2010) mentioned that if the work environment is of low risk like in administration
office then the inspection can be less, but if the work environment specific activities are of
high risks or changing rapidly then more frequent inspection may be justified, an example was
a construction project. In African countries, such as Nigeria, Ghana and Kenya, the workplace
safety inspections were conducted internally by HSR and externally by OHS officers
(Mojapelo, Mafini, & Dhurup, 2011). The HSR and OHS officers from these countries were
not adequately trained on issues related to OHS such as OHS laws, safety procedures and
processes to be inspected (Umeokafor, Isaac, Jones, & Umeadi, 2012).
The last OHSP in the study was safety records, Okoli and Onuigbo (2012) define safety records
as a record of OHSP such as safety training practices, hazard control practices, workplace
safety inspection and emergency evaluation. Taderera (2012) indicated that organization can

8
also have external safety records and such may include: material safety data sheet, external
OHS audit report and workplace monitoring reports. The safety records can be inform of paper
records or inform digital formats such as emails, word documents, spreadsheets, database, web
pages, digital photographs, scanned version of the paper document and incoming emails
(Achilike & Okwuanaso, 2013). Iacovino (2013) stated that these records have to be captured
in compliance with the record keeping system of the organization so as to ensure that they are
locatable and their access and movement can be tracked.
In addition, Duff and Harris (2013) mentioned that for identification and traceability of safety
records, the records have to be assigned unique identifiers such as alphanumeric and sequential
numbering. Furthermore, Agumba, Pretorius, and Haupt (2014) to facilitate easy retrieval of
safety records, it has to be filed and indexed. Kellerman (2014) described filing as arranging
records in convenient order for storage and was based on file type such hard copy or electronic
media and it has to be secured to prevent unauthorized access.
According to Iacovino (2014) safety records have to be kept in private and confidential areas
to prevent an unauthorized person from accessing them. These can be achieved through having
access to safety records restricted to personnel with a legitimate business, storing the hard
copies of safety records in the locked filing cabinet and using password encryption for the
electronic record (Tagbotor, Adzido, & Agbanu, 2014).
The study adopted OHSP as the independent variable and it includes: safety training practices,
hazard control practices, workplace safety inspection, and safety records. The safety training

9
practices was measure in terms of: job rotation, lecture training, job instruction, and coaching.
While hazard control practices were measured in terms of: engineering controls, administrative
control, and PPE. The workplace safety inspection was measured in terms of: observing
employees performing tasks, use of the checklist, communicating workplace safety inspection
report to management for coaching purposes, and monitoring corrective action. The safety
record was measured in terms of: accurate, relevant, accessibility, and ease of use.
The research used safety training practices, hazard control practices, workplace safety
inspection, and safety record as indicators of OHSP. It was supported by Njiha, Nzulwa, and
Kwena (2017) who argued that there have been poor OHSP in beverage manufacturing firms
in Nairobi City County of Kenya and such includes: lack of safety training programs,
inspection of the workplace, hazard control practices, and safety records.
1.1.3 Occupational Health and Safety Law
According to Barling, Loughlin, and Kelloway (2002) the International Labour Organization
requires that member countries to formulate, implement and periodically review OHS national
policy to prevent accidents and injuries to employees by minimizing workplace hazards.
Adeyemo and Smallwood (2002) argued that legislation was one of the processes by which the
government affects safety and it can be achieved through appointing qualified inspectorate to
inspect the workplace and also making sure that different labour regulations especially those
related to workplace safety are complied with.
In contrast, Ndegwa, Guyo, Orwa, Ng’ang’ a, and Murigi (2004) argues that OHS laws does
not increase safety at the workplace, because the cause of most accidents are complex

10
interaction of labour, equipment and work environment. The argument was further supported
by Idowu and Iyabo (2004) who argued that OHS laws may not prevent more than 25% of all
workplace accidents. Moreover, Kheni, Dainty, and Gibb (2005) believed that moral hazards
may reduce the level of safety because employees attempt to substitute wages for safer jobs.
The Occupational Safety and Health Act of 1970 was the preeminent federal law governing
workplace safety and health in the USA and it applies to all employers with one or more
employees except States and local government (Rabinowitz & Hager, 2006). According to
Umeokafor, Isaac, Jones, and Umeadi (2006) Nigeria has two notable OHS laws, Employee
Compensation Act of 2010 and Factory Act of 1990 which was the localized version of UK
Factory Act of 1961. Adeyemo and Smallwood (2006) states that the Factory Act of 1990 was
limited by its function because its definition was limited to the factory and therefore, excluding
other sectors. Rotich and Kwasira (2007) stated that in the year 2007 the Kenyan Parliament
enacted two OHS laws: Occupational Safety and Health Act of 2007 (OSHEA) and Work
Injury Benefit Act of 2007(WIBA). The OSHEA commenced on 26th October, 2007, while
WIBA commenced on second June of 2008. The OSHEA of 2007 applies to all workplaces
where persons at work whether permanently or temporarily, while WIBA compensate
employees who are injured in the course of work.
According to Besley and Burgess (2008) OHS of 1970 of USA clearly states that employers
and employees must comply with the act, an employer must comply both with specific
standards and general duty and violation may lead to penalties, however, employees are not
penalized for not complying with the Act. In contrast, in Kenya and Nigeria, both the

11
employers and employees have the responsibility to comply with specific duties relating to
OHS and failure to do so can lead to imprisonment or penalties (Jonathan, Mbogo, Idowu, &
Iyabo, 2008). The inspectors in the USA have the powers to inspect the workplace but with
the consent of the employer and during the inspection, the inspector can be accompanied by
HSR (Bradbury, 2009). Nigeria have inspectors to enforce OHS laws, however, they are few
in numbers and it was supported by Umeokafor et al. (2009) argued that Nigeria had 60 factory
inspectors for a population of 160 million.
In addition, Nzuve and Lawrence (2010) reported that Kenya had 71 OHS officers who were
unable to inspect estimated 140,000 workplaces and therefore employees and employers were
exposed to hazards such blood stains, viruses, wet floor and extreme temperature conditions
without interventions. In the USA every state has enacted compensation program for
employees in the scope of the job, however, the compensation program doesn’t cover all
employees it excludes, self-employed, independent contractors, agricultural casual workers,
domestic workers and small firm employees (Martimo, Shiri, & Miranda, 2011).
Nigeria had enacted the Compensation Act of 2010 to compensate employees who sustain
injuries or suffer from occupational disease or death at the workplace in the process of carrying
out their duties and it covers employees who are part-time, temporarily or casual both in public
and private institution and it also extends to the dependents of the deceased (Kalejaiye, 2013).
Kenya has WIBA of 2007 which compensate employees for work-related injuries, death and
diseases contracted in the course of their employment and it covers all employees both in public

12
and private institution and their dependents except for armed forces and any person employed
outside Kenya (Jonathan & Mbogo, 2013).
The research adopted the OHS law as a moderating variable, to moderate the relationship
between OHSP and employee performance in beverage manufacturing firms in Nairobi City
County of Kenya. The OHS law was measured in terms of: penalties and fines, awareness of
OHS law, and auditing and inspecting of workplaces. According to Adeyemo and Smallwood
(2010) the government has the responsibility to ensure that employees are provided with
conducive environment where they can be able to improve their performance and these can
only be achieved by the government enforcing OHS law through inspecting and auditing
workplace, creating awareness of OHS and imposing fines and penalties to those who are
contravening OHS law.
This was further supported by a study conducted by Ndegwa et al. (2014) legal framework as
determinant of the implementation of OHS programmes in the manufacturing sector in Kenya
where legal framework was measured in terms of government inspection and auditing,
familiarity with OHS policy, government support of implementation of occupational safety
and health act of 2007 and ease implement ability of Occupational Safety and Health Act of
2007. The study revealed that legal framework had a positive effect on the implementation of
OHS programs in the manufacturing sector in Kenya.

13
1.1.4 Beverage Manufacturing Firms
The beverage manufacturing firms were discussed in the following perspective: globally,
regionally, locally and Nairobi City County of Kenya.
1.1.4.1 Global Perspective of Beverage Manufacturing Firms
The beverage manufacturing firms consist of alcoholic and non-alcoholics, non alcoholics’
drinks include fruit juice, coffee, tea, and carbonated soft drinks, while alcoholic drinks include
wine, spirit, and beer (Dimara & Skuras, 2005). The beverage manufacturing firms have
evolved over the past centuries and these have been characterized by the number of
manufacturers, methods of production process, packaging and final products (Reisch, Eberle,
& Lorek, 2013).
The beverage manufacturing firms has evolved from local firms that produced products for the
local market to giant firms that produced products for the international market and it was
achieved through adoption of mass production technique that led to expansion (Vrontis, 2014).
Across the globe the beverage manufacturing firms have been able to employs millions of
people and also generating billions of dollar in revenue each year and furthermore, the
production process in most beverage manufacturing firms across the world are automated and
mechanized, employing skilled and semi-skilled workforce (Mesadag, 2014). According to
Amir et al. (2014) beverage manufacturing firms across the globe will go to any length to
source high quality raw materials that can be used to produce beverage products that meet the
taste and preference of customers. The beverage products are packed in aluminum containers,

14
plastic containers and aseptic packages and they are colourful and attractive and furthermore,
it protect the products against contamination (Sokovic et al., 2014).
1.1.4.2 Regional Perspective of Beverage Manufacturing Firms
The beverage manufacturing firms in Africa consist of alcoholics and non-alcoholics, they are
also different in terms of production process, packaging and final products (Sutton &
Kpeteney, 2012). In Africa, the non-alcoholic beverage manufacturing firms are dominated
by international brands such as Coca cola, Pepsi, Nestle and Unilever, while alcoholic beverage
manufacturing firms are dominated by foreign brand like Heineken (Nasse, 2019). The local
entrepreneurs in Africa have not been left behind especially in Kenya where we have Keroche
Industry, in Tanzania there is Jambo group the new entrants in beverage manufacturing firms
(Quartey, 2019).
The beverage manufacturing firms in Africa are both capital and labour intensive, the
production process are automated and mechanized and they distribute their products directly
to their consumers (Omari & Amedu, 2019). However, according to Roereceke, Obot, and
Rehm (2019) alcoholics’ beverage manufacturing firms in Africa are facing stiff competitions
from the local and illicit brews, because they are easily accessible and cheaper in price. In
addition, employees working in beverage manufacturing firms have been exposed to poor
working conditions such as defective machines, extreme temperature conditions and slippery
floors which have led to high occurrence of accidents and injuries, and contraction of diseases
(Ahmad & Sattar, 2019).

15
1.1.4.3 Local Perspective of Beverage Manufacturing Firms
The beverage manufacturing firms in Kenya consist of alcoholic and non-alcoholic,
furthermore non-alcoholic beverage manufacturing firms are dominated by international
brands such Coca Cola, and Pepsi while alcoholic beverage manufacturing firms are dominated
by local brand such Tusker (Mwangulu, 2014). There are fierce competition between
beverage manufacturing firms in Kenya and these has force some of them to diversify their
products by producing energy drinks, bottle sugar water and soda drinks without sugar
(Mutunga & Minja, 2014).
Furthermore, alcoholic beverage manufacturing firms are facing stiff competition from illicit
brews, a research conducted by Kipchumba (2017) curbing illicit brew in Kenya indicated that
the percentage consumptions of illicit brew rose from 3.8% to 4.25% of total alcohol volume
sold in the year 2015. The beverage manufacturing firms in Kenya are both capital and labor
intensive. They employ skilled and semi-skilled employees and in addition, they sell their
products to wholesalers and retailers, or directly to their consumers such as supermarket and
social joint owners (Nderitu, 2017).
1.1.4.4 Beverage Manufacturing Firms in Nairobi City County of Kenya
The beverage manufacturing firms in Nairobi City County of Kenya consist of two groups
alcoholic and non-alcoholic (Karuga, Anyang'o, Git, Namu, & Upadhya, 2002). Non-alcoholic
beverage manufacturing firms includes: carbonated soft drinks, fruit juice, tea, and coffee.
While alcoholic beverages manufacturing firms includes: wine, beer, and distilled spirit
(Nyambura, 2009). The beverage manufacturing firms are highly fragmented and these were

16
shown by the number of manufacturers, method of packaging, production process and final
products (Kimuyu, 2014). According to Nderitu (2017) beverage manufacturing firms in the
Nairobi City County of Kenya contributes toward the creation of employment, revenue
generation for the government and exportation of products to earn foreign exchange and
furthermore, the sector has witnessed immense brand and these have forced some of them to
diversify their products ranges in an effort to satisfy and retain the customers.
The beverage manufacturing firms are labour and capital intensive and therefore according to
Koopman, Pelletier, Murray, Sharda, Berger and Turpin (2016) employees in beverage
manufacturing firms perform strenuous task such manually loading and offloading raw
materials and beverage manufacturing products from long trucks using their head, shoulder
and neck and these may result to work-related stress and muscular-skeletal disorders.
Furthermore, Ahmad and Sattar (2016) noted that employees were exposed to hazards such as
collision with internal transport such as forklift and containers which causes fatal injuries,
exposure to the high level of noise which result to induced hearing loss. The study was
conducted in beverage manufacturing firms in Nairobi City County of Kenya to determine
influence of occupational health and safety practices on employee performance.
1.2 Statement of the Problem
There have been decline of employee performance in beverage manufacturing firms in Nairobi
City County of Kenya, in terms of poor delivery of the products, poor quality products being
manufactured and high absenteeism among employees (Kimuyu, 2014). The research
conducted by Kimuyu adopted descriptive survey research design, according to Peren and Lam

17
(2015) descriptive survey research design are used in studies where the research wants to
describe the current status of the phenomena. Furthermore, the data was collected from
management staff. According to Murgan (2017) where data are collected from a single source
it leads to biasness as the respondents give biased information.
In addition, Awino, Ogaga and Machuki (2017) stated that the quality of products in beverage
manufacturing in Nairobi City County of Kenya have been relatively low with 8.5% recorded
in 2015 to 2.1% recorded in 2016. More ever, according to Kimani and Kung’u (2017) in the
year 2013 over 100 employees in beverage manufacturing firms in Nairobi City County of
Kenya were granted off duties for over three months as a result of sickness. Furthermore,
Njiha et al. (2017) argued that that there have been poor OHSP at beverage manufacturing
firms in Nairobi City County of Kenya and such include: lack of safety training programs,
inspection of the workplace, hazard control practices and safety records.
A study conducted by Mwangi and Waiganjo (2017) on the influence of OHSP on employee
performance in the flower industry in Kenya: a case study of Penta Flowers Limited indicates
that OHSP influence employee performance at Penta Flower Limited. The research adopted
explanatory sequential research design, where the quantitative and qualitative data were
analyzed using descriptive statistics. In addition, the data was collected using interviews and
questionnaires and it was time consuming. Moreover, the findings of the study cannot be
generalized to beverage manufacturing firms in Nairobi City County of Kenya because, Baah
(2015) argued that the concept of OHSP and employee performance differs with respect to
region, country and industry.
18
From the study above, it seem to focus on single case study. The current study was conducted
in beverage manufacturing firms in Nairobi City County of Kenya to investigate the influence
of OHSP on employee performance. The research adopted OHS law as a moderating variable
to moderate the relationship between OHSP and employee performance. The current study
adopted experimental research design to demonstrate the cause and explain the effect between
OHSP, OHS law, and employee performance. This was achieved through conducting
inferential analysis such Pearson correlation of efficient, multiple linear regression analysis
and moderated regression analysis. Furthermore, the current study adopted sample survey
method where data was collected using semi structured questionnaires.
1.3 Objectives of the Study
1.3.1 General Objective
The general objective of the study was to investigate influence of occupational health and
safety practices on employee performance in beverage manufacturing firms in Nairobi City
County of Kenya.
1.3.2 Specific Objectives
i. To establish effect of safety training practices on employee performance in beverage
manufacturing firms in Nairobi City County of Kenya.
ii. To examine effect of hazard control practices on employee performance in beverage
manufacturing firms in Nairobi City County of Kenya.
iii. To investigate effect of workplace safety inspection on employee performance in beverage
manufacturing firms in Nairobi City County of Kenya.

19
iv. To find out effect of safety records on employee performance in beverage manufacturing
firms in Nairobi City County of Kenya.
v. To determine the moderating effect of occupational health and safety law on the relationship
between occupational health and safety practices and employee performance in beverage
manufacturing firms in Nairobi City County of Kenya.
1.4 Research Hypotheses
The research was guided by the null hypotheses.
HO1: There is no statistical significant relationship between safety training practices and
employee performance.
HO2: There is no statistical significant relationship between hazard control practices and
employee performance.
HO3: There is no statistical significant relationship between workplace safety inspection and
employee performance.
HO4: There is no statistical significant relationship between safety records and employee
performance.
HO5: Occupational health and safety law does not moderate the statistical significant
relationship between occupational health and safety practices and employee performance.
1.5 Significance of the Study
This study benefit the beverage manufacturing firms by assisting them to understand on how
to improve employee performance. These can be achieved by beverage manufacturing firms
implementing the recommendations of employee performance which have been stated in the

20
study. The research provides an insight into the ̀ state of employees’ health and safety practices
in beverage manufacturing firms in Nairobi City County of Kenya by indicating how OHSP
influenced employee performance. This can assist the government to formulate new OHS
policy or enforce the existing OHS laws so as to improve employee performance and working
conditions. The study provides OHS information to human resource manager so as to develop
OHS programs that are relevant to employees and the working environment. The research was
also significant to scholars because it forms part of the literature reference for other related
studies in future as it provides theoretical and empirical models on how employee performance
are influenced by OHSP.
1.6 Scope of the Study
The aim of the study was to investigate the influence of occupational health and safety practices
on employee performance in beverage manufacturing firms in Nairobi City County of Kenya.
The geographical of the study was limited to 32 beverage manufacturing firms located within
Nairobi City County of Kenya. The study concentrated on: safety training practices, hazard
control practices, workplace safety inspection, safety records, OHS law, and employee
performance, adopted by beverage manufacturing firms. The research adopted experimental
research design to determine and explain the causal effect between OHSP, OHS law, and
employee performance in beverage manufacturing firms in Nairobi City County of Kenya. The
study was conducted in the period of December of 2018.

21
1.7 Limitation of the Study
The study was conducted in beverage manufacturing firms and therefore, its findings cannot
be generalized to other sectors. Because different sectors have different machines and
equipment, work practices, policies and different working environment. The research used
semi structured questionnaire to collect quantitative and qualitative data and this inhibit the
research ability to collect more data for analysis and therefore, future scholars should use
additional data collection instruments such as interviews and observation.
Access to literature was one of the limitations of the study especially when it comes to
addressing research gaps in the study. The research did not have access to large range of
scientific literature and it hinders research ability to address the research gaps. However, the
problem was solved by the research accessing the available literature to address the research
gaps. There were difficulties in distributing semi-structured questionnaires to respondents
these was because different beverage manufacturing firms have different working schedules
and work stations. To overcome the situation, the research booked appointments with the
respondents requesting for their time to fill in semi-structured questionnaires.
The data was collected from a busy environment where there were many distractions as the
respondents were on rush to produce and deliver quality products. Distributing semi structured
questionnaires at these time may lead respondents to give wrongful information by casually
fill in the questionnaires. To overcome the situation, the research assistants were advised to
distribute questionnaires during early morning hours before respondents could resume their

22
duties or lunch hours when respondents will have humble time to give correct information. The
research sent emails to relevant authorities requesting to be provided with exact information
on the number of beverage manufacturing firms located within Nairobi City County of Kenya,
but they were uncooperative. To solve the situation, the research decided to use information
from the internet and other previous scholars who have done studies in the beverage
manufacturing firms in Nairobi City of Kenya.
1.8 Organization of the Study
The organization of the study provides roadmap to scholars on how each chapter of the study
was established to achieve the objective of the study. Therefore, chapter one provides: the
background of the study, statement of the problem, objectives of the study, research
hypotheses, significance of the study, the scope of the study, limitation of the study, and
organization of the study. Chapter two presents: the introduction, theoretical literature review,
empirical literature review, summary of literature and research gaps, and conceptual
framework. Chapter three deals with: research philosophy, research design, target population,
sampling design, data collection instrument, data collection procedures, pilot study, stating of
validity and reliability of the instrument, stating of data analysis and presentation, and ethical
consideration. Chapter four deals with: response rate, testing for validity and reliability of the
measuring instrument, diagnostic test, demographic information of the respondents,
descriptive and inferential analysis, and testing of hypotheses. Chapter five presents: the
summary, conclusions, recommendations and areas for further research.

23
CHAPTER TWO
LITERATURE REVIEW
2.1 Introduction
The research presents literature related to the topic of the study, theoretical literature review,
empirical review, summary of literature and research gaps, and conceptual framework.
2.2 Theoretical Literature Review
The following are theories related to the topic of the study and they included: Resource Based
View Theory, Institutional Theory, Goal Setting Theory of Motivation, and Herzberg’s Two
Factor Theory of Motivation.
2.2.1 Resource Based View Theory
Resource based view theory (RBV) was developed by Penrose in 1959 and since then it has
become one of the dominant contemporary approaches to the analysis of sustained competitive
advantage and its emphasis on firm’s resources as the fundamental determinant of competitive
advantage and performance (Gnyawali & Madhavan, 2001). Peteraf and Bergen (2003) define
resources as all the assets, capabilities, organization process, firm attributes, information and
knowledge controlled by the firm that enables it to implement strategies that can improve
efficiency and effectiveness.
According to Ana and Palis (2003) for a resource to be considered a competitive advantage, it
must be valuable, rare, and imperfectly imitable and substitutable and competitive advantage
is only achieved if the situation continues to exist after competitors’ effort to duplicate that

24
advantage have ceased. The firm can deploy its resources to the competitive environment with
the aim of generating competitive advantage and this can only be achieved when a firm create
and protect its existing resources or acquire new resources taking into account the competitive
environment (Foss & Knudsen, 2004).
The assumption of RBV theory was that the firm within the industry may be heterogeneous
with respect to bundling resources that they control and the last assumption was that resource
heterogeneity may persist over time because the resources used to implement the strategies are
perfectly mobile across the firm (Spanos & Lioukas, 2005). Barney (2007) described resource
heterogeneity as a resource which cannot be traded in factor markets and difficult to
accumulate and imitate. In contrast, Priem and Butler (2008) concluded that RBV theory
contributed to the little explanation on the prediction of competitive advantage and
recommended that scholars should address core connection between resource and
environment, because while resources represent what can be done, the competitive
environment represent what must be done to compete effectively in satisfying customer needs.
The RBV theory was relevant to the current study because it supports the independent variable
of the study which was OHSP. For an organization to have a competitive advantage over its
competitors, the OHSP such as safety training practices, workplace safety inspection, hazard
control practices, and safety records must be linked to the organization strategy (Tait & Walker,
2008). Priem and Butler (2008) mentioned that highly skilled and motivated workforce have
great potential to constitute a source of sustainable competitive advantage.

25
For instance, Alvero, Struss, and Rappaport (2008), Tait and Walker (2008), Wright and Kehoe
(2008) acknowledged that training employees on OHSP can motivate employees in such a way
that they begin to exhibit desirable behaviours such as wearing PPE, attending safety training,
identifying hazards, keeping safety records and proposing safety measures and these reduces
occurrences of accidents at the workplace and in the process improving employee performance.
In examining the human capital pool, Richard, Murthi, and Ismail (2008) used RBV theory to
examine the impact of racial diversity on organization performance and the findings of the
study indicated that diversity was positively related to productivity, return on equity and
market performance for firms engaged in a strategy
2.2.2 Goal Setting Theory of Motivation
Goal setting theory of motivation was postulated by Locke in 1968 and it emphasizes the
important relationship between goals and performances (Baum & Locke, 2004). The goal
setting theory of motivation emphasized that effective performance was only achieved when
goals are specific and challenging, especially when they are used to evaluate performance and
linked to feedback on results and create commitment acceptance (Brown, Jones, & Leigh,
2005). LePine (2005) reported that the major findings of this goal setting theory of motivation
are that individuals who are provided with specific difficult but attainable goals perform better
than those given easy and non-specific goals.
There is practical suggestion for managers to consider when attempting to use goal setting
theory motivation as a technique of enhancing motivation and performance at the workplace
and one of the practical suggestion was that the goals should be specific and quantifiable and

26
it assist employees to measure their own performance (Seijts, Latham, Tasa, & Latham, 2005).
The goals must be difficult as well as specific for employees to raise performance, however,
they must be within the capability of employees and where goals are too difficult to attain, the
organization performance suffers because the employee reject the goals as unreasonable and
unattainable (Lee, Sheldon, & Turban, 2006).
According to Yearta, Maitlis, and Briner (2006) for goals to be accepted by employees,
management must allow employees to participate in goal setting process and these enables
employees to understand the goals and therefore they are able to attain the goals. Donovan
and Williams (2008) pointed out that for goals to be attained, feedback must be provided and
these helps employees to know how they are doing in terms of goal attainment and the nature
of adjustment that are required to improve the performance. Moreover, Locke and Latham
(2008) noted that for goals to be attainable they must have deadlines which serve as a time
control mechanism and it increases the motivational impact of goals. On the other hand, Wiese
and Freund (2010) have criticized goal setting theory of motivation because it encourages bad
behaviours which may harm the organization in a long run, for instances employees having a
desire to earn a reward for achieving goals, may engage in unethical behaviours to reach the
target.
In addition, Lee et al. (2011) mentioned that when two separate goals are set at the same time
employees may focus on achieving one goal making it difficult to achieve other goals. The
goal setting theory of motivation was relevant to the study because it supports the dependent
variable, employee performance and its indicators are specific, measurable, attainable, realistic

27
and time-bound and these allow employees to measure their own progress in terms of achieving
performance. A study conducted by Asmus, Mohnene, and Reinhart (2015) on the impact of
goal setting on worker performance empirical evidence from a real effort production
experiment revealed that goal setting improve work performance by 12% to 15% compared to
the situation where goals were not defined.
2.2.3 Institutional Theory
The institutional theory was postulated by William Richard Scott and it indicates that
organization practices are either a direct reflection of or response to rules and structures built
into their larger environment (Najeeb, 2004). Greenwood, Raynard, Kodeih, Micelotta, and
Lounsbury (2006) mentioned that the larger environment act as the institutional environment
for the source of legitimization, rewards, or incentives for, as well as constraints or sanctions
on organization activities and it also embraced the view of institution from a macro perspective
seeing it as a web of cultural roles.
Whereas Gulati, Puranam, and Tushman (2007) study focused on the micro-foundations of the
institution, with the power of cognitive aspects guiding the behaviour of the individuals. Jan,
Lu, and Chou (2008) came up with a term called institutional isomorphism and described it as
a situation in which organization has similar key suppliers, resources, products, consumer, and
regulated by one regulatory agency. King, Felin, and Whetten (2009) indicated that the
institutional isomorphism can take three forms and such includes: coercive, normative, and
mimetic.
28
Coercive isomorphism is a pressure that is exerted on the organization by other organization
and it can be informal or formal depending on the cultural expectation of the society in which
they operate (Suddaby, 2009). Ahrne and Brunsson (2010) argued that these pressures are
mainly embedded in regulatory process and they can manifest themselves in different forms
depending on their degree of enforcement and they can come from trade unions and work
councils, employment legislation, and the government such as policies and they can be visible
at different levels, international, national and industry. Davis (2011) reported that pressure at
the international level may include international labour convection, and national regulatory
pressure.
According to Meyer, Buber, and Aghamanoukjan (2011) normative isomorphism is a situation
where professionalization of employees affects the nature of the management control system
and the norms and values that professional develop through formal education and professional
network increases the similarity of the skills and knowledge of the total workforce in an
organization field and these may lead to similar organization behaviour. This was supported
by Thornton (2011) who argues that if the human resource professionals work in the same
industry, receive education from the same institution and associate themselves with trade
organization that employees’ human resource professionals tend to adopt similar human
resource management practices.
Mimetic isomorphism occurs when the organization response to uncertainty by modelling itself
with other organization in the organization field which are perceived to be successful and
legitimate (Shipilov, Greve, & Rowley, 2012). This was supported by Schneiberg (2012) who

29
argued that human resource manager may imitate human resource management practices of a
competitor as a result of uncertainty and such may include adopting the human resource scores
card of the competitors so as to cope with the uncertainty or the competition.
In contrast, scholars such as Drori, Höllerer, and Walgenbach (2013) have criticized the
institutional theory because it has lost the sight of the claim of the study organization, it has
overwhelming focused on isomorphism and similarity and failing to theorize differences across
the organization. A study conducted by Decreamer and Vanderstraeten (2013) on impact of
institutional pressures on employee performance management systems in higher education in
the Low Countries, indicated that the higher institution adopted employee performance
management system in response to pressure related to institutionalization, with the
government, accreditation agencies, and research partners as a condition for doing business.
The institutional theory was relevant to the study because it supports the moderating variable,
OHS law. According to Kalejaiye (2013) employers may be reluctant to provide a safe and
healthy environment to employees due to laxity and OHS law was the only external force that
a government can use to force employers to provide a conducive working environment for
employees and these can be achieved through systematic inspection and auditing of the
workplace, penalties and creating awareness of OHS laws. Adeogun and Okafor (2013)
failure to comply with OHS laws was a criminal offence and such punishable by penalties or
imprisonment depending on the severity of such violation and it forces the employers to
comply with OHS legislation, employees are therefore provided with safe and healthy working
environment leading to improvement in employee performance.

30
2.2.4 Herzberg’s Two Factor Theory of Motivation
The Herzberg’s two factor theory of motivation anchored the study. According to Judge and
Lilies (2002) the Herzberg’s two factor theory of motivation consist of motivation factors and
hygiene factors. Judge and Lilies (2002) stated that motivation factors are intrinsic to the job
and it includes: recognition, responsibility, work itself, and advancement. According to Kacel
and Norris (2005) motivation factors lead to job satisfaction because the individual wants to
achieve self-growth and self-actualization.
In addition, Asri, Munir, Hassan, Norizan, and Hamel (2007) argued that the aim of motivation
factors is to improve job satisfaction and furthermore, the motivation factors are very effective
in creating positive effect on employee performance by propelling the individual to increase
effort in their performance. According to Malik (2008) hygiene factors are extrinsic factors
related to the job and their aims is to reduce the level of dissatisfaction among employees and
such includes: salary, working conditions, company policy, and job security.
Furthermore, Casper and Harris (2008) stated that the role of hygiene factors was to prevent
dissatisfaction at the workplace and not to increase job satisfaction. More ever, Iguisi (2009)
argued that the poor hygiene factors can cause dissatisfaction, where better hygiene factors can
reduce dissatisfaction but cannot cause job satisfaction. However, a study conducted by
Danish and Usman (2010) examining the implications of pay performance system on intrinsic
and extrinsic motivations factors and job satisfaction indicated that pay and benefits had the
strongest association with the job satisfaction.

31
Another empirical study conducted by Fauzah and Tan (2013) found out that the generations
plays an important role in determining employees’ favourability in the intrinsic and extrinsic
motivations. The study revealed that younger generations were motivated by extrinsic
motivation and demotivated by intrinsic motivation factors, while the older generation were
motivated by intrinsic motivation factors and demotivated by extrinsic motivation factors.
Scholars have also criticize the Herzberg’s two factor theory of motivation, Fang (2011) argued
that the implementation of Herzberg two factor theory of motivation was less practical in
today’s employee motivation study because most of the study conducted across the world have
revealed that extrinsic factor motivation had impact on employee’s job satisfaction. Tan and
Wahed (2011) also stated that what motivates one individual can demotivate another
individual. The Herzberg’s two factor theory of motivation was relevant to the study because
it supports the OHSP, OHS law and employee performance.
According to Kwasi and Amoako (2011) absence of hygiene factors can create dissatisfaction
leading to decrease in employee performance. Therefore, it is the responsibility of the
employer to ensure that machines and equipment are used for their intended purposes so as to
prevent injuries such as cuts, bruises and therefore, reducing absenteeism at the workplace
(Idris & Wari, 2012). The employer can also improve the hygienic factors at the workplace by
ensuring that machines used for production are well maintained to enable employees to
produce highly quality products and increase the delivery of the products and thus high
increase in employee performance (Chan &Yam, 2012).
32
The government has the responsibility of ensuring that employees work in hygienic conditions
and it can only be achieved through the government inspecting and auditing the workplaces,
imposing fines and penalties to employers who are violating OHS law, and creating OHS
awareness (Rabinowitz & Hager, 2006). The government can create OHS awareness by
training employees and employers on how to label and store chemicals in appropriate places
and therefore, preventing fire explosion and contamination of raw materials (Adeyemo &
Smallwood, 2006). The employers have the responsibility of providing safety training
practices at the workplace by training employees on how to prevent electric accidents by not
overloading the power circuit and it will prevent fire explosions and in the process reducing
injuries and accidents which increases absenteeism at the workplace as employees leave work
to seek medical attention (Ayim, 2003).
According to Kin and Bonaventura (2006) through workplace safety inspection the HSR are
able of identifying extreme cold or hot conditions at the workplace. Lai et al. (2008) employee
will be instructed to wear appropriate PPE which can protect them from extreme temperature
at the workplace, therefore providing conducive environment for employees to produce high
quality products and also increasing the delivery of the products to consumer. Swuste et al.
(2007) revealed that through workplace safety inspection the HSR are in apposition to identify
wet floors that can cause strips and slips which can lead to bone fracture leading to high
absenteeism at the workplace and thus reducing employee performance. Reinhold et al. (2009)
indicates that slips and strips at the workplace can be prevented by organization ensuring that
there is a proper drainage to drain excess water and therefore employees are provided with
hygienic conditions where they can be able to produce high quality products.

33
The task observation can also assist HSR to identify wrong working posture and recommends
the correct working posture which can increase the capacity of employees to produce high
quality products and furthermore, increasing the delivery of beverage manufacturing products
and raw materials, and thus increase in employee performance(Nikolaos, 2005). Safety records
can also be used to improve hygienic conditions at the workplace by identifying hazard such
as lifting and carrying of heavy objects using hands, back and head (Agumba et al., 2008).
HSR can recommends the use of conveyors belts and forklift machine which can prevent
skeletal disorders and furthermore, increasing the speed of delivery of beverage manufacturing
products and thus increase in employee performance (Miller, 2009).
2.3 Empirical Literature Review
2.3.1 Safety Training Practices and Employee Performance
Job training helps employees to be familiar with the existing safety policies and procedures
and therefore employees are in a better position to behave safely by wearing PPE which assist
in reducing accidents such as falling of objects which cause head injuries and thus reducing
absenteeism in the organization (Brazile, 2002). In addition, Ayim (2003) mentioned that job
rotation training provides employees with task-specific knowledge in work area that are
directly related to the job requirement and skills acquired assists employees to improve their
performance by improving the quality and delivery of the product.
On the other hand, Arthur (2003) mentioned that employees are against job rotation training
because employees do not want to do new types of job or share their knowledge and skills with
the new employees for fear of losing their jobs. Similarly, Bell (2004) also argued that

34
employees who are rotated to new station area do not possess the required skills to handle task
leading to declining in the quality of the product and increased in absenteeism as a result of
frequent accidents and injuries. A study conducted by Alquraan (2011) Job rotation and its
impact on administrative employees’ performance in United Nation Relief and Work Agency,
Gaza field office, revealed that job rotation had a positive impact on employee performance in
United Nation Relief Works Agency. However, its findings cannot be generalized to
organization located in Gaza strip and the argument was supported by Cassell, Symon,
Buehring, and Johnson (2014) who argued that case findings cannot be generalized to the entire
population because it uses small sample size which are not representative of the entire
population.
The study was a case study and the data was collected using closed ended questionnaires, and
according to Rowley (2014) using closed ended questionnaire the respondents are limited to
the stated alternatives making the data collection method to be biased and these may influence
the findings of the study. Therefore, in the current study, the data was collected using semi-
structured questionnaire and these were supported by Asendorpf, Conner, Fruyt, Houwer, and
Fiedle (2013) who reported that semi-structured questionnaire prevents biasness because it
allow the respondents to choose the stated alternatives and expressed their opinions. In the
current study, the research used sample survey method where the data was collected from large
number of respondents using semi structured questionnaire and it ensure more accurate sample
in which to draw the conclusion (Julies, 2015).

35
Coaching is a regular series of training or development sessions where experienced trainer with
considerable expertise in OHSP guide the trainee and usually on one on one basis (Agarwal,
Angst, & Magni, 2009). Allen, Smith, O’shea, Mael, and Eby (2009) mentioned that coaching
enables employees to work in good posture and these helps to reduce back pains and injuries,
and therefore employees are motivated to produce high quality products. Additionally, Gray,
Ekinci, and Goregaokar (2011) argued that coaching assist employees to maintain machines
and equipment and therefore, employees are in good position to conduct their activities without
machine and equipment stalling and thus increase in the delivery of the products.
In contrary, Gurav and Mudalkar (2011) argued that despite the growing popularity of
coaching among scholars who claimed that coaching helps in improving employee
performance, the literature still offers little empirical evidence regarding the effects of this
practice. These were further supported by Saks and Gruman (2011) who argued that there was
a need to explore coaching and its effect empirically. In addition, Leisink and Knies (2011)
stated that there was a need for research to investigate the conditions guaranteeing the
effectiveness of coaching and to determine whether firms implementing the coaching are
following the optimum procedures.
A study conducted by Murithi (2016) effects of coaching on employee performance in the
commercial bank: a Case of Standard Chartered Kenya revealed that there was a positive
correlation between coaching and employee performance. In contrast, the study was a case
study, therefore, its findings cannot be generalized to entire Kenya banking sector. According
to Halinen and Törnroos (2016) the case study results cannot be replicated because the data
36
and results are only valid for that particular institution where the case study was conducted.
The data was collected by one individual and it led to biasness in data collection and thus
influencing the findings of the result, while in the current study a sample survey method was
adopted in which semi structured questionnaires were used to collect data from large number
of respondents in the beverage manufacturing firms in Nairobi City County of Kenya and it
reduces biasness in the data collection.
The job instruction training was an informal system of training where employees learn by
practicing what they have observed from their immediate supervisor and such safety training
include: hazard identification, safety practices, and operating machine and equipment in the
actual environment (Beaumont & Coyle, 2000). Arthur, Bennet, Eden and Bell (2003)
acknowledged that job instruction training helps the learners to operate forklift machine
effectively and therefore reducing accidents and injuries and furthermore, increasing the
delivery of products and thus high increase in employee performance. On the contrary, Becker
and Morawetz (2004) argued that if the instructor was a production worker, attention to
production demand can interfere with instructor attention to safety training and therefore
employees are unable to receive the right skills leading to production of poor quality products,
increased in occurrence of accidents and injuries leading to high absenteeism among employee.
Lecture training was also another form of on job training and it involves the trainer
communicating through spoken words what they want trainee to learn and it’s involves oral
presentation covering particular topic such as use and maintenance of PPE, safety procedures,
work attitudes, safety signs, first aid procedures and personal hygiene habits (Kanu, 2015).

37
Kulkarni (2015) noted that the knowledge gain from the lecture training can assist employees
to practice good housekeeping practices such as regularly inspecting and repairing all tools,
clean all spills and maintaining clean light fixtures to improve lighting conditions at the
workplace which creates a conducive environment where employees will be motivated to work
to produce and deliver high quality products to consumer and thus increase in employee
performance.
However, Rao, Reddy, and Prakash (2016) argued that there was an inadequate transfer of
learning from the training environment to the workplace environment and this was as a result
of trainee forgetting what he or she has been taught in the classroom and employees may end
up incorrectly operating and maintaining forklift leading to accidents and delay in loading and
offloading of raw materials and beverage products leading to slow production and delivery of
the products. Moreover, Indexed and Sudhakar (2017) also mentioned that lecture training
does not provide the trainees with an opportunity to practice since the training was theoretical
and furthermore, it does not provide immediate feedback on trainee’s performance and these
can demotivate employees leading to poor production of quality products and frequent
occurrences of accidents and injuries leading to high absenteeism at the workplace.
2.3.2 Hazard Control Practices and Employee Performance
Hazards control practices are the measures taken by the organization to control or eliminate
hazards at the workplace and it includes: engineering control, administrative control, and use
of PPE (Zhang, 2003). Sheik and Sankar (2004) reported that engineering control such as
forklift and conveyor belts were the most effective hazard control practices because employees

38
do not have to use excessive force to get work done and in the process it increases the delivery
of the products and thus increase in employee performance.
On the other hand, Virkkunen (2005) argued that engineering control practices were the most
expensive hazard control practices and furthermore, it can lead to job loss and therefore most
organization do not use them. Moreover, Saari, Tissari, and Valkama (2006) also stated that
engineering control practices can sometimes fail to eliminate the hazard at the workplace and
therefore administrative control can be an alternative option. Administrative control aims at
limiting employees’ exposure to hazards and one of the practice was to maintain good
housekeeping and thus providing employees with environment that is free of hazards such as
wet floor and faulty electric equipment, therefore reducing accidents and injuries and in the
process reducing absenteeism (Reinhold, Tint, & Kiivet, 2006). On the contrary, Shehu,
Hwang, and Wang (2007) found out that administrative controls were ineffective in controlling
hazards at the workplace since they do not completely control hazards at the workplace.
According to Abdelhamid and Everett (2008) PPE was the last resort in controlling hazards at
the workplace and it protects employees against extreme weather conditions and sharp objects
and therefore reducing the frequent occurrence of accidents and injuries leading to reduced
absenteeism among employees. Huang, Xinyu, and Hinze (2008) also indicated that PPE
prevent employees from contaminating the raw materials with hazards such viruses, blood
fluid, and therefore employees are able to produce high quality products. On the other hand,
Makori, Nandi, Thuo, and Wanyonyi (2012) still believe that PPE cannot or completely
eliminate hazards at the workplace and for them to be effective they have to be used with other

39
methods such as engineering and administrative control. In addition, Konya, Akpiri, and Orji
(2013) also stated that majority of employees do not like to wear PPE because they are poorly
maintained and uncomfortable to wear especially in humid conditions and these can reduce
employee working pace and thus reduction in the delivery of beverage manufacturing products.
A study conducted by Gbadago, Amedome, and Honyenuga (2017) on the impact of OHSP
such PPE, administrative control and engineering control on employee performance at the
South Tongu District Hospital in Ghana showed that OHSP led to the improvement in
employee performance such as increase in staff morale, stress reduction, increased job
satisfaction, and reduced medical expenses. The research was descriptive in nature, according
to Samar (2017) descriptive research mainly focus on describing the current phenomenon and
does not determine the cause and explain the relationship between variables.
In the current study, the experimental research design was used to determine and explain the
causal relationship between OHSP, OHS law and employee performance. This was achieved
through research conducting correlation analysis, multiple linear regression analysis, and
moderated multiple regression analysis. The findings of the study cannot be generalized to
beverage manufacturing firms in Nairobi City County of Kenya, because the study was
conducted in the health sector and different sector have different hazards due to different
machines, equipment, and working conditions.
The study used observation method to collect data and therefore the findings of the study
cannot be reliable, because according to Murgan (2017) unforeseen factors may have interfered

40
with the observation of the task and therefore influencing the findings of the study. In the
current study, research assistants distributed semi-structured questionnaire which was used to
collect data, this was supported by Bowling (2017) who argues that when research assistants
distribute semi-structured questionnaire it reduces the contact between the researcher and
respondents and therefore, respondent have adequate time to give well thought answers.
2.3.3 Workplace Safety Inspection and Employee Performance
A workplace safety inspection was a process to identify hazards and assess risks in the
workplace ongoing basis and these involve task observation, use of a checklist, communication
of workplace safety inspection report and monitoring corrective actions (Zhang, Chi, & Yang,
2001). A checklist was a document that acts as a guide during a workplace safety inspection
and it can be reviewed regularly and revised when there are changes to equipment and tools
(Keng & Razak, 2002).
Checklist assist HSR to conduct workplace safety inspection by identifying new hazards that
exist at the workplace such as bacteria, insects, blood, and employees are in position to suggest
hazard control practices such as wearing of PPE which can be used to prevent the
contamination raw materials and therefore, employees are able to produce high quality
products (Choudhray, Fang, & Ahmed, 2003). However, Zhou and Fang (2004) argued that
in a situation where there was no checklist, HSR are unable identify new hazards that exist at
the workplace such as unguarded machines and equipment which can cause cuts and burns
leading to increase in absenteeism at the workplace as employees absent themselves from
work to seek medical attention.

41
According to Nikolaos (2005) task observation was also one of the important processes of
workplace safety inspection and it’s where HSR observe employees performing their task with
the aim of gaining further understanding of the task and identifying the hazards that arise from
the working process. Kin and Bonaventura (2006) mentioned that the HSR are able to listen
to the concern of employees and since employees know the processes and work area best, they
are in position to suggest hazard control practice such good working postures and work station
set up that can motivate employees to produce high quality products. It also creates safe
working environment for employees by preventing back pains and therefore, employees are in
good position to deliver products to consumer within the shortest time possible and thus
increase in employee performance (Ohdo, Hino, & Takanashi 2007).
In contrast, Lai, Liu and Ling (2008) stated that when HSR lack knowledge about the task,
they may end up suggesting the wrong hazard control practices such poor working posture and
work station set up which can lead to creation of new hazards at the workplace such objects
falling from overhead containers which can cause severe injuries to employees leading to high
absenteeism at the workplace as employees are forced to seek medical attention. The HSR has
the responsibility to communicate workplace safety inspection report to management so that
the information can be used for coaching purposes and it will improve employees’ confidence
to perform the tasks leading to increase in delivery of the products (Fang, 2007). On the other
hand, Bono, Purvanova, Owler, and David (2009) argued that the workplace safety inspection
report can only be effective for coaching when it's actually accurate and relevant to the working
environment.

42
The last step in workplace safety inspection was to monitor the corrective action and this can
be done by assigning responsibility to follow up to an individual and it can be effective in
detecting the effectiveness of hazard control measures because it assists in eliminating hazards
at the workplace and employees will be able to deliver products to consumers within the
shortest time possible leading to improvement of employee performance (Reinhold, Tint &
Kiivet, 2009). However, Rachiotis, Alexopoulos and Drivas (2010) argue that individuals can
only be effective in monitoring corrective actions if they have been properly trained to
undertake such task.
A study conducted by Oluoch (2015) effect of occupational safety and health programmes on
employee performance at Kenya Power Limited Company indicated that health and safety
inspection was statistically insignificant and negatively related with the employee
performance. The study adopted descriptive research design, according to Sandra (2015)
descriptive research design are adopted in the study to describe the current status of a
phenomena. While the current study experimental research design was adopted to determine
and explain the causal effect between OHSP, OHS law and employee performance in beverage
manufacturing firms in Nairobi City County of Kenya. The questionnaire were distributed
through drop off and pick up method, according to Shorna and Amy (2010) administering
questionnaire through drop off and pick up method, the respondents are not given ample time
to fill in the questionnaires and they may end up giving wrong information. While in the current
study the research assistants were appointed and trained and they assisted in administering the
semi structured questionnaires.

43
A study conducted by Okumu, Charles and Patrick (2018) the effect of occupational health and
safety inspection on employee performance in in sugar companies in Kakamega County of
Kenya, revealed that occupational health and safety inspection influence employee
performance. The employee performance was measured in terms of timeliness and job
satisfaction. According to Chaudhray and Charma (2014) job satisfaction was not a good
measure of employee performance because employees may refuse to participate in job survey,
since they are rarely conducted at the workplace and furthermore, it cannot be quantify. In the
current study, employee’s performance was measured in terms of delivery of the product,
quality of the products and absenteeism and the performance were quantify to enable
employees to measure their own performance.
2.3.4 Safety Records and Employee Performance
The safety records are vital in providing evidence to use as the basis of determining the
effectiveness of existing OHS strategies in the organization and it’s the responsibility of the
employers to keep safety records so as to comply with OHS laws of the country (Bailey &
Vidyarthi, 2002). Dirking and Kodali (2002) acknowledged that safety records can only be
effective when they are accurate, relevant, timely, and complete and ease for use.
Joseph et al. (2003) mentioned that safety records have to be complete which means that the
facts and figures should not be missing or concealed and for example record of dangerous
occurrence investigation will have to highlight job position, injury, illness and time of incident
and these can assist the management to identify hazards and initiate possible hazard control
measures such as good housekeeping practices. Gbadago et al. (2005) good housekeeping
practices such cleaning the work environment assist in controlling hazards such as wet floors,

44
unexposed electric wires and thus providing suitable working environment for employees
where they are motivated to produce and deliver high quality products to consumers and thus
increase in employee performance.
One of the good characteristics of safety records was that it has to be accurate by providing
information that are factual and theses enables the organization to establish the correct hazard
control practices such as use of conveyor belts and fork lift vehicles to handle heavy loads to
prevent fork lift accidents and therefore employees work in an environment free of accidents
and injuries leading to reduced absenteeism that are caused by sickness (Cumming, 2006 &
Kazan, 2007). Duranti (2008) and Abdullah (2008) noted that the accurate information from
safety records can be used by the organization to coach employees so that they can work safely
by observing standard operating procedures and therefore employees are able to work safely,
these will reduce the rate of accidents at the workplace leading to low absenteeism and
furthermore, employees will be capable of producing high quality products.
The safety records contain information about the type of hazards that have been identified at
the workplace and methods to control it (Agumba et al, 2008). Rabinowitz and Hager (2008)
reported that safety records can only be effective when it is relevant to the working
environment because each working environment have different hazards and these were as
result of machines, equipment and working procedures. Abudayyeh et al. (2009) stated that
safety records can be tailored to suit designated workplace group so as to ensure that existing
hazards such as chemicals can be identified and employee will be train on how to store and

45
dispose of chemicals and it will prevent fire explosion and skin burns and therefore reducing
absenteeism at the workplace.
The safety records are useful to the organization when it can be easily be accessed and it can
assist the organization to identify the hazards at the earliest opportunity and therefore,
implementing the hazard control practices so as to prevent potential risk from causing actual
injuries and these helps to improve employees’ performance by reducing absenteeism which
are associated with the frequent occurrence of accidents (Keng & Razak, 2009). Miller (2009),
SheikAllavudeen and Sankar (2009) argued that information from safety records have to be
in the inform that can be easily be understood by the user and failing to understand the
information can lead the user to implement wrong hazard control practices and these can lead
to the introduction of new hazards at the workplace creating unfavourable working
environment to employees and these can demotivates employees leading to decline in
employee performance such as increased in absenteeism and poor quality of products being
produced during production process.
A study conducted by Okoli and Onuigbo (2014) impact of record keeping on the office
managers efficiency in Nigeria University indicated that when records are effectively kept and
they helped in the effecting planning of the office manager and this eventually improve the
efficiency of the office manager. The study was a case study, according to Gumesson (2014)
case studies are subjective in nature and therefore their findings are not generally reliable. In
the current study the research adopted sample survey method. According to Miller (2014)
sample survey method enable the research to collect data from large number of respondents
46
and also respondents are able to provide accurate information because of anonymity of the
semi structured questionnaires. The findings of the study were not reliable because according
to Gerring (2014) respondents in case study often feels that they are not anonym and therefore
they may end up giving protective responses and therefore making the findings of the study to
be unreliable. In the current study, research assistants assisted in distribution of anonymous
semi-structured question to respondents in various beverage manufacturing firms located in
the Nairobi City County of Kenya.
2.3.5 Moderating Effect of Occupational Health and Safety Law on the Relationship
between Occupational Health and Safety Practices and Employee Performance
According to Diugwu, Baba, and Egila (2003) it’s the responsibility of the government to
create awareness of OHS in all workplaces through promoting education and training in OHS,
collecting and disseminating information on OHS. Ezenwa (2004) stated that when employers
are aware of their responsibilities in OHS regulations, they will provide safety training, propose
hazard control measures, keep safety records and conduct workplace safety inspection with the
aims of reducing absenteeism at the workplace. In contrast, Idubor, and Oisamoje (2005)
argued that most inspectorate departments in African countries are inadequately funded by the
government of the day and these have hindered their operations and furthermore, most African
governments always emphasize on improving and increasing profitability and productivity at
the expense of employee’s safety.
There are various ways in which the government can enforce OHS regulation at the workplace
and it can be through inspection and auditing of OHS activities and these moves forced

47
employers to comply with OHS regulations by keeping and maintaining safety records of OHS
activities such as safety training programs, workplace safety inspection report and hazard
control (Keith & Issac, 2006). Dhanraj and Parumasur (2006) mentioned that information from
safety records can be used by the organization to identify the safety training needs and therefore
the organization can be able to offer safety training programs that are relevant to the working
condition and these can boost the morale of employees and in the process employees are in
position to produce high quality products, work safely and reduce absenteeism that are caused
by accidents and injuries.
The information from safety records can be used by the management to coach employees and
these can boost their confidence, by practicing good housekeeping practices such as keeping
the floor dry and therefore preventing slips and falls which can muscle tears and therefore
employees are in good position to delivery products to consumer within the shortest time
(Bowles, Cunningham, Rosa, & Picano, 2007). On the other hand, Okolie and Okoye (2010)
argued that most African countries lack qualified inspectorate to inspect and audit the OHS
activities of the workplace and employees are exposed to hazards such as knives and faulty
heater which can cause burns and cuts, and furthermore, it reduces employee working pace in
terms of delivering products to consumers.
In addition, Makhonge (2010) also argues that inspectorate can inspect the workplace but they
may fail to avail the report to the employer and without workplace safety inspection report the
employer may find it difficult to control hazards at the workplace. The argument was further
supported by Adeogun and Okafor (2010) who stated that numbers of enforcement officers in

48
Nigeria were insignificant compared to the number of factories in Nigeria and it led to
worsening of the working conditions, employees contracting diseases and reducing their
capacity to work leading to decline in the quality of products produced and slow delivery of
the products.
According to Shibani and Saidani (2010) when employer and employees are aware of the
severity of the fines and penalties, therefore they will avoid fines and penalties by engaging in
OHSP such as providing safety training programs, conducting workplace safety inspection,
hazard control and maintaining safety records and these provide a clean and tidy environment
for employees to produce and deliver high quality products. In contrast, Adeyemo and
Smallwood (2010) indicated that where penalties are insignificant, there will be laxity in
compliance of OHS legislation as employers are exposed to hazards such as extreme hot or
cold conditions, unguarded machines, bacteria and viruses which can cause sickness and also
lowering the working pace of employees leading to slow delivery of the products and high
absenteeism at the workplace.
Moreover, Kalejaiye (2010) believes that enforcement of OHS regulation doesn’t increase
workplace safety because they are not the only steps for improving OHSP, as improving
organization culture can also improve OHSP. Furthermore, Onyeozili (2010) also stated that
the government must reduce the burden of regulation which preoccupies itself with details but
rather it can aim at shaping attitudes and creating infrastructures for a better organization of
OHS by industries own effort. In contrast, Logasakthi and Rajagopal (2011) argued that
countries with proper enforcement OHS legislation have a remarkable record in OHSP and

49
such countries include USA, UK Germany and Singapore. The argument was further supported
by Fellows and Duff (2011) believed that the main objective of OHS laws was to prevent
accidents and ill health at work and it can only be achieved through accountability in the
enforcement of OHS laws.
A study conducted by Wambui (2012) on the extent of compliance OHS regulations at
manufacturing companies in Mombasa County revealed that the majority of manufacturing
firms in Mombasa County were complying with OHS regulation. The study used descriptive
research design to describe the current status of OHS regulation at manufacturing companies
in Mombasa County, while in the current study experimental research design was adopted to
identify the extent and explain the causal relationship between OHSP, OHS law and employee
performance in beverage manufacturing firms located in Nairobi City County of Kenya.
The data was collected from OHS officer working for the manufacturing firms located within
Mombasa County, being part of the management they may not have given the true information
and these may have led to the distortion of the findings. To avoid biasness in data collection,
the current study adopted a sample survey method where semi structured questionnaire was
distributed to employers and employees. The study used closed ended questionnaire to collect
data. According to Murgan (2017) closed ended questionnaire does not allow the respondents
express their views and many options in the questionnaire confused the respondents.
The current study used semi structured questionnaire to collect data from the respondents.
According to Bowling (2017) semi structured questionnaire encourages two way of

50
communication and furthermore, the open ended questions assist the researcher to get more
information from the respondents. The study used factor analysis to show the relative
importance of the variables in the study, while in the current study, moderated multiple
regression analysis was used to indicate whether OHS law can moderate the significant
relationship between OHSP and employees’ performance in beverage manufacturing firms in
Nairobi City County of Kenya.
2.4 Summary of Literature and Research Gaps
The literature and research gaps are summarized in the table 2.1 Summary of Literature and
Research Gaps.
Table 2.1 Summary of Literature and Research Gaps
AUTHOR FOCUS OF THE
STUDY
FINDINGS KNOWLEDGE
GAPS
CURRENT
STUDY
Murithi (2016).
Alquraan (2011).
Effect of coaching on employee performance in commercial bank. A case study of Standard Chartered Bank of Kenya.
Job rotation and its impact on administrative employee performance in United Nation Relief works Agency.
There was positive correlation between coaching and employee performance.
The job rotation had positive impact on employee performance in united nation relief works agency.
Subjective in nature. Data collected by researcher
Closed ended questionnaires were used to collect data.
Small sample size was used in the study.
The current study adopted sample survey method.
Data collected by research assistants.
Semi structured questionnaire was used to collect data.
A sample survey method was adopted.

51
Data collected from a single source.
Data collected from employees and employers.
Gbadago
et al. (2017)
The Impact of Occupational Health and Safety Measures on Employee Performance.
The OHS measures led to improvement in staff morale, stress reduction, reduced injuries and illness, increased job satisfaction, and reduced medical expenses.
The research was descriptive in nature.
Data collected by observation method.
The research adopted experimental research design.
Data collected using semi structured questionnaire.
Okumu et al. (2018).
Oluoch(2015)
The effect of OHS safety inspection on employee performance in sugar companies in Kakamega County of Kenya.
Effect of occupational safety and health programmes on employee performance at Kenya Power Limited Company.
The OHS safety inspection influence employee performance.
Health and safety inspection was statistically insignificant and negatively related to employee performance.
Job satisfaction cannot be quantify.
Study adopted descriptive research design.
Questionnaires administered by drop off and pick up method.
Employee performance was quantify in terms of: quality of the products, delivery of the products and absenteeism.
Study adopted experimental research design.
Research assistants appointed, trained and assisted in administering questionnaires.
Okoli and Onguibo (2014).
Impact of record keeping on the office manager efficiency in Nigeria university
Record keeping improve employee efficiency.
Case study adopted The study used descriptive research design Lack confidentiality therefore the respondents gave
Sample survey method adopted in the study.
The study used experimental research design.
Anonymous semi structured questionnaire were used to

52
protective responses.
collect data from the respondents.
Wambui (2012).
Extent of compliance of OHS regulation at manufacturing firms companies in Mombasa County.
Majority of Manufacturing firms in Mombasa County were complying with OHS regulation.
The study used descriptive research design.
Data collected from a single source.
The study used factor analysis to analyze the data.
Closed ended questionnaire was used to collect data.
The study used experimental research design.
A sample survey method was adopted.
The study used descriptive and inferential statistics to analyze data.
Semi structured questionnaire was used to collect data.
Source: (Author, 2019).
2.5 Conceptual Frame Work
The conceptual framework is a schematic presentation of the interrelationship between
variables in the context of the problem being investigated. In this study, the independent
variable was OHSP and it included: safety training practices, hazard control practices,
workplace safety inspection, and safety records. The OHSP was used in the study to predict
the outcome of employee performance which was the dependent variable. OHS law was used
in the study as a moderating variable to moderate the relationship between OHSP and
employee performance in beverage manufacturing firms in Nairobi City County of Kenya.

53
Independent Variable Dependent Variable
`` HO5
S
Fig 2.1 Conceptual Frame Work Moderating Variable
Fig. 2.1 Conceptual Framework Moderating Variable Source: (Author, 2019).
OCCUPATIONAL HEALTH AND SAFETY PRACTICES
HO1 HO1
HO2 HO2
HO3 HO3
HO4
Safety Training Practices Job rotation. Coaching. Job instruction. Lecture. Hazard Control Practices
Engineering Control. Administrative Control. Personal Protective Equipment
EMPLOYEE PERFORMANCE Quality of the product.
Delivery of the product.
Absenteeism.
Occupational Health and Safety Law
Awareness of occupational health and safety laws.
Penalties and fines Government inspection and auditing.
Workplace Safety Inspection
Task observation. Use of checklist. Communicating workplace
safety inspection report. Monitoring correctives action.
Safety Records
Accurate. Relevant. Accessible. Ease for use

54
CHAPTER THREE
RESEARCH METHODOLOGY AND DESIGN
3.1 Introduction
This chapter presents the methodology and procedures that was adopted in accomplishing the
objectives of the study. Research philosophy, research design, empirical model,
operationalization and measurement of variables, target population, sampling design, data
collection instruments, data collection procedure, pilot study, stating reliability and validity of
measuring instrument, diagnostic test, data analysis and presentation, and ethical consideration
were presented in this chapter.
3.2 Research Philosophy
The research adopted positivism research philosophy, Alstyne and Brynjolfsson (2005)
reported that in positivism research philosophy there was stating and testing of hypotheses so
as to establish and explain the relationship between the variables in the study. In the current
study, the research stated and tested the hypothesis so as to determine and explain the
significant between OHSP, OHS law and employee performance in beverage manufacturing
firms in Nairobi City County of Kenya. The hypotheses of the study were rejected or fails to
reject at 0.05 level significance.
3.3 Research Design
Research design is the arrangement of condition for collection and analysis of data in a manner
that aims to combine relevance to the researcher purpose with the economy in mind

55
(Christopher, 2005). The research design constitutes a blueprint for the collection,
measurement and analysis of data (Alise & Teddlie, 2010). The research adopted experimental
research design. According to Oluwatayo (2012) experimental research design is where the
researcher test the hypotheses of causal relationship between variables. Therefore, in the
current study the experimental research design was adopted to test hypotheses of causal
relationship between OHSP, OHS law and employee performance in beverage manufacturing
firms in Nairobi City County of Kenya.
3.3.1 Empirical Model
The current study adopted multiple linear regression model. These were supported by Uyanık
and Güler (2013) who argued that multiple linear regression model was only used in a study
which has two or more predictors. The multiple linear regression model covered objective (i),
(ii), (iii) and (iv) of the study.
Key
Y = Employee performance
Bo = Regression constant
X1= Safety training practices
X2= Hazard control practices
X3= Workplace safety inspection
X4= Safety Records
B1, B2, B3 and B4= Regression coefficient associated with X1, X2, X3 and X4
e= Residual

56
The multiple linear regression model is shown below
Y = BO + B1X1+ B2X2+ B3X3 + B4X4+ e………………………………………………….....3.1
The assumptions of multiple linear regression model were as follows. The multiple linear
regression model assumed that there was a linear relationship between independent variables
and the dependent variable (Jaccard, Ramos, Johansson, & Bouris, 2006). Another assumption
was that there should be nonexistence of multicollinearity between independent variables,
where there is the existence of multicollinearity, it can result to misleading and unusual results,
inflated standard errors and reduced power of regression coefficient (Osborne & Waters,
2012). The variables of the study should also have a normal distribution (Ernst & Albers,
2013). This model also assumed that there was homoscedasticity where there was an equal
variance of errors across all the level of independent variables (Alexopoulos, 2014).
3.3.2 Moderation Model
The research adopted moderated multiple regression model because the study has moderation
variable (OHS law) and research wants to determine its moderating effect on the relationship
between OHSP and employee performance in beverage manufacturing firms in Nairobi City
County of Kenya. These involve the introduction of an interaction term, which involves
multiplying moderating variable (OHS law) with values of OHSP and the value of interaction
term was then introduced to multiple linear regression analysis (Louis, 2008). The moderated
multiple linear regression model covered objective (v) of the study.

57
Key
Y = Employee performance
Bo = Regression constant
X1= Safety training practices
X2= Hazard control practices
X3= Workplace safety inspection
X4= Safety Records.
M= Moderating variable (OHS Law)
X1X2X3X4M= Interaction term.
B1,B2, B3, B4, B5 = Regression coefficient associated with X1, X2 , X3, X4 and Interaction term
e= Residual.
The moderated multiple regression model is shown below.
Y = Bo + B1X1 + B2X2 + B3X3 + B4X4 + B5X1X2X3X4M + e ……………………………….3.2
The assumptions of moderated multiple regression model were as follows. The moderated
multiple regression models assume that there is a linear relationship between independent
variables and the dependent variable (Mackinnon, 2010). An interaction term should be
created by multiplying the moderated variable with the independents' variables (Frazier, Tix,
& Barron, 2011). The moderator variable and independent variables should not be related
because if they are related it will reduce the power of detecting moderation effect (Edwards &
Lambert, 2011). The regression coefficient of the interaction term should also be significant
to indicate that the interaction term moderates the relationship between independent variables
and dependent variable (Judd, Kenny, & McClelland, 2011).

58
3.3.3 Operationalization and Measurement of Variables
The employee performance, OHS law, safety training practices, hazard control practices,
workplace safety inspection and safety records were operationalized as follows. Employee
performance was measured as number of: products packed in suitable containers, products
labelled appropriately, inspection conducted on carriers vehicles, talking to customers to
determine their taste and preferences, adhering to the production process, changing working
schedules to accommodate differing employee need and rewarding good attendance. OHS law
was operationalized as number of: OHS training conducted by OHS officers, inspection and
auditing conducted by OHS officers, workplace safety inspection report handed over to
employer and penalties imposed on the employer for contravening OHS law.
Safety training practices were operationalized in terms of, number of : job rotation, coaching,
job instruction and lecture method conducted at the workplace, evaluation of job rotation,
lecture training, coaching, and job instruction conducted at the workplace, coaching, job
rotation, job instruction and lecture training have clear goals and objective, coaching, job
instruction, job rotation and lecture training offered by a competent trained trainer, trainers
committed to offer job rotation, job instruction, coaching and lecture training, and feedback
provided. Hazard control practices was operationalized as follows, number of : substitution,
elimination and ventilation conducted at the workplace, safe work practices, rest schedules,
personal hygiene and limiting hours of work used to control hazards, usage of PPE, training
conducted on the usage and maintenance of PPE and PPE provided that are appropriate in
sizes.

59
Workplace safety inspection was measured as follows, number of: workplace safety inspection
conducted, observation of the task, time a checklist is used, workplace safety inspection report
handed over to management and monitoring corrective action conducted. Safety records were
operationalized as follows, number of: keeping of safety records, updates on safety records,
classification conducted on safety records, conditions of storage for safety records, and record
officers are trained on record management skills.
The employee performance, OHS law, safety training practices, hazard control practices,
workplace safety inspection and safety records were all measured in nominal scale. The
research decided to use nominal scale in the study because it was easy to generate responses
from the open and closed ended questions and it was achieved through using unique label to
identify the items. Furthermore, large amount of questions can be collected and therefore
increasing the reliability of the measuring instrument. The operationalization and
measurement of employee performance, OHS law, safety training practices, hazard control
practices, workplace safety inspection and safety records are shown in the table 3.1
operationalization and measurement of variables.

60
Table 3.1 Operationalization and Measurement of Variables
VARIABLE TYPE INDICATOR OPERATIONALIZATION MEASUREMENT QUESTION NUMBER
Safety Training Practices.
Independent Job rotation.
Coaching.
Job instruction.
Lecture training.
Number of job rotation, coaching, job instruction and lecture training conducted at the workplace.
Number of evaluation of job rotation, lecture training, coaching, and job instruction conducted at the workplace.
Coaching, job rotation, job instruction and lecture training have clear goals and objective.
Number of Coaching, Job instruction, job rotation and lecture method offered by a competent trained trainer.
Number of trainers Committed to offer job rotation, job instruction, coaching and lecture training.
Number of feedback provided in job rotation, job instruction, coaching and lecture training.
Nominal scale 6 items
Five point Likert scale
Section A
Q7-12 & Qualitative Q13
Hazard Control Practices
Independent Engineering control.
Administrative control.
Number of Substitution, elimination and ventilation conducted at the workplace.
Safe work practices, rest schedules,
Nominal scale 5 items
Five point Likert scale

61
Personal protective equipment.
personal hygiene and limiting hours of work used to control hazards.
Number of usage of PPE.
Number of Training conducted on the usage and maintenance of PPE.
Number of PPE provided to employees that are appropriate in sizes.
Section B
Q14-18 & Qualitative Q19
Workplace safety inspection.
Independent Task observation.
Use of checklist.
Communication of workplace safety inspection report.
Monitoring corrective action.
Number of workplace safety inspection conducted.
Observation of the task.
Number of time a checklist is used during workplace safety inspection.
Number of workplace safety inspection report handed over to management.
Number of monitoring corrective action conducted.
Nominal scale 5 items
Five point Likert scale
Section B
Q20-24 & Qualitative Q25
Safety record Independent Accurate.
Relevant.
Accessible.
Ease to use.
Keeping of safety records.
Number of updates on safety records.
Number of time classification are conducted on safety records.
Conditions of storage for safety records.
Nominal scale 5 items
Five point Likert scale
Section B
Q26-30 & Qualitative Q31
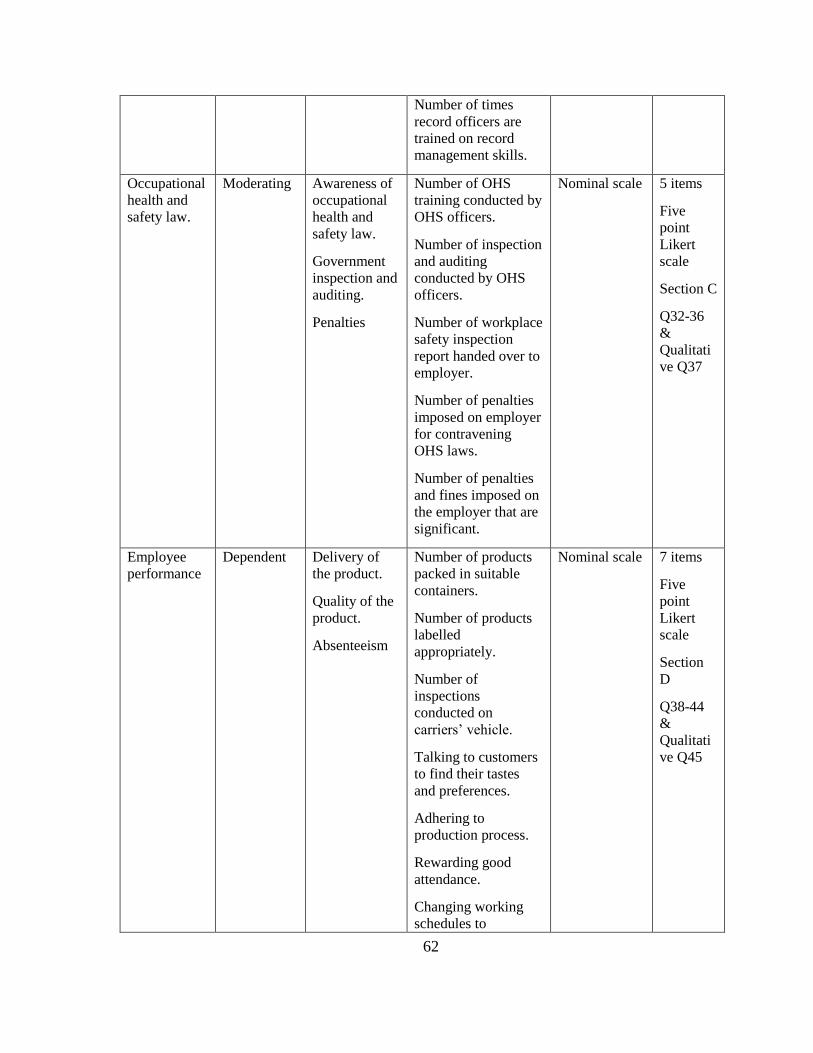
62
Number of times record officers are trained on record management skills.
Occupational health and safety law.
Moderating Awareness of occupational health and safety law.
Government inspection and auditing.
Penalties
Number of OHS training conducted by OHS officers.
Number of inspection and auditing conducted by OHS officers.
Number of workplace safety inspection report handed over to employer.
Number of penalties imposed on employer for contravening OHS laws.
Number of penalties and fines imposed on the employer that are significant.
Nominal scale 5 items
Five point Likert scale
Section C
Q32-36 & Qualitative Q37
Employee performance
Dependent Delivery of the product.
Quality of the product.
Absenteeism
Number of products packed in suitable containers.
Number of products labelled appropriately.
Number of inspections conducted on carriers’ vehicle.
Talking to customers to find their tastes and preferences.
Adhering to production process.
Rewarding good attendance.
Changing working schedules to
Nominal scale 7 items
Five point Likert scale
Section D
Q38-44 & Qualitative Q45

63
accommodate differing employee need.
Source: (Author, 2019). 3.4 Target Population
The target population is a complete set of individual, cases or objects with some common
observable characteristics (Eldredge & Weagel, 2014). The target population of the study was
shown in the table 3.2 target population of the study.
Table 3.2 Target Population of the Study
BEVERAGE MANUFACTURING
FIRMS
MANAGEMENT LEVEL
HUMAN RESOURCE MANAGER
OPERATION MANAGER
FACTORY FLOOR STAFF
TOTAL
Spirit 11 11 120 142
Beer 2 2 50 54
Fruit juice 11 11 121 143
wine 4 4 63 71
Carbonated Soft drinks
4 4 65 73
TOTAL 32 32 419 483
Source: (Kenya Revenue Authority, 2015 & Nderitu, 2016).
3.5 Sampling Design
According to Lameck (2010) sampling design was a technique or the procedure the researcher
adopted in selecting items for the sample. Teddlie and Yu (2010) also define sampling design

64
as a framework that serves as a basis for the selection of a survey sample. The sample size of
the study was determined by Krejce Morgan table for sample size. According to Kemper and
Teddlie (2010), Krejce Morgan table for sample size indicates that a population between 400
and 499 with a confidence of 95% and a margin error of 5% should have a sample size of 196.
Therefore, the sample size of the study was 196.
The research used a multi-stage sampling technique to select sample size from the target
population. These were supported by Miller, Johnston, Dunn, Fry, and Degenhardt (2010)
who argued that multi-stage sampling technique can be used to draw a sample from a
population which is not a homogeneous group and also ensuring that certain segments of the
population are not over represented or under represented.
The sample was divided into strata based on the type of beverage manufacturing firms. The
beverage manufacturing firms were randomly selected from each stratum. The beverage
manufacturing firms were further classified into subgroups based on the management level
such as human resource managers, operation manager and factory floor staff and the samples
were randomly selected from each of the strata. A total sample size of 196 was selected for
the study these included; 19 human resource managers, 19 operation managers and 158 factory
floor staff.
The sample size was good for the study, this was because the target population was
heterogeneous and therefore a large sample was required to obtain a given level of precision.
In addition, the sample size was within the budget of the study and these were supported by

65
Ahrens and Zaščerinska (2014) who acknowledged that budget constraints should be taken
into consideration when deciding the sample size so as to reduce the cost of sampling estimate.
The sample size of the study was shown in the table 3.3 sample size of the study.
Table 3.3 Sample Size of the Study
STRATA
MANAGEMENT LEVEL
TOTAL
HUMAN RESOURCE MANAGER
OPERATION MANAGER
FACTORY FLOOR STAFF
Spirit 7 7 41 55
Beer 1 1 16 18
Fruit Juice 7 7 42 56
wine 2 2 28 32
Carbonated Soft drinks
2 2 31 35
TOTAL 19 19 158 196
Source: (Author, 2019).
3.6 Data Collection Instrument
The study used a semi-structured questionnaire to collect qualitative and quantitative data. The
questionnaire was divided into four sections. Section A comprised of demographic
information such as: gender, age, education level, working experience, types of beverage
manufacturing firms and management level. Section B, C and D respectively have questions
related to OHSP, OHS law and employee performance. The open ended questions permitted

66
free responses from the respondents without providing or suggesting any structure for the
replies while the closed ended questions helped respondents to give responses which are
limited to the stated alternative. Likert scale of five point scales (5) Strongly Agree, (4) Agree,
(3) Neutral, (2) Disagree, (1) Strongly Disagree, were used to measure respondent’s opinions,
perception, feelings and attitudes.
3.7 Data Collection Procedure
The research received the authorization letter from Kenyatta University and it was submitted
to National Commission for Science, Technology and Innovation (NACOSTI) and Nairobi
City County of Kenya for the issuance of research permit. The research proceeded with the
data collection after receiving an authorized research letter from the Ministry of Education,
State Department of Early Learning and Basic Education. The semi-structured questionnaire
was used to collect primary and secondary data which included qualitative and quantitative
data. The research received secondary data from human resource records and such data
included: gender, age, level of education, working experience and nature of the business. While
on the other hand, qualitative data was collected from open ended questions and quantitative
data was collected from closed questions.
The semi structured questionnaire had authorization letter from Kenyatta University, research
permits issued by National Commission for Science, Technology and Innovation, and Nairobi
City County of Kenya, an authorized research letter from Ministry of Education, State
Department of Early Learning and Basic Education. The semi structured questionnaire had a
cover letter explaining the purpose of the study, significance of the study, assuring the

67
anonymity of the respondents and it also indicated the specific deadline dates by which
completed questionnaires were supposed to be returned.
In each beverage manufacturing firms selected for the study, research assistants were
appointed. The research assistants were trained on ethics related to research such as
maintaining the confidentiality of the respondents, seeking the consent of the respondents
before distributing questionnaires, not influencing views of respondents and also maintaining
minimum contacts with respondents. The research assistants assisted in the distribution and
collection of questionnaires. The data were collected from 483 employees working in 32
beverage manufacturing firms located within Nairobi City County of Kenya. They included:
32 human resource managers, 32 operation managers and 419 factory floor staffs. While
beverage manufacturing firms included: 11 spirits, 2 beers, 11 fruit juice, 4 wines and 4
carbonated soft drinks.
3.8 Pilot Study
Piloting was conducted in one of the beverage manufacturing firms located within Nairobi City
County of Kenya to find out if the measuring instrument can work in real world and also
ensuring that everyone in the sample of the study understand questions that are posted in the
questionnaire and also to find how long the respondents can take to complete filling in the
semi-structured questionnaire.

68
3.9 Validity and Reliability of the Research Instrument
The validity of the research instrument was measured in terms of content validity, construct
validity and criterion validity. The reliability of the measuring instrument was analyzed using
Cronbach alpha.
3.9.1 Validity of Research Instrument
According to Oliwatayo (2012) validity is the extent to which a test measures what it actually
intends to measures or the ability of the research instrument to measure what is purported to
measure. In addition, Riege (2013) also define validity as the degree to which research
instrument measures what is supposed to measure. To achieve content validity, the research
provided adequate coverage for each of the variables in the study.
According to AlHeresh, LaValley, Coster, and Keysor (2017) construct validity is how a test
or experiment measures up to its claims. To achieve construct validity, multiple linear
regression analysis and moderated multiple regression analysis were performed and the results
were presented in chapter four. The criterion-related validity was defined by AlHeresh et al.
(2017) as the ability of the measuring instrument to predict some outcome or estimate the
existence of some current conditions. Deniz and Alsaffar (2017) also define criterion related
validity as the ability of the questionnaire to forecast future events, behaviours and attitudes.
This was assessed using multiple linear regression analysis and moderated multiple regression
analysis and the results were also presented in chapter four.
69
3.9.2 Reliability of the Research Instrument
Reliability is the degree of consistency of a measuring instrument to produce the same result
when used by someone else or when used again and again on the same respondents (Ng’ang’a
& Kosgei, 2009). The reliability of the questionnaire was conducted using Cronbach Alpha
and the results presented inform of statistical table in chapter four.
3.10 Diagnostic Tests
These involves testing normality, homogeneity of variances and multicollinearity.
3.10.1 Normality Test
The research split the data into variables such as: safety training practices, hazard control
practices, workplace safety inspection, safety records, OHS law and employee performance.
The research tested the normality of each variable using the Shapiro Wilk Test (Oztuna &
Tucacar, 2006). According to Ghasemi, Syedmoradi, Zahediasl, and Azizi (2010) where the
significant value of Shapiro –Wilk test is P> 0.05 it indicates that the data is normal, but if the
value is <0.05 it shows that the data is significant deviates from a normal distribution. The
results were presented inform of statistical tables in chapter four.
3.10.2 Homogeneity of Variances Test
According to Gastwirth, Gel, and Miao (2009) homogeneity of variance is when variability in
each sample of the groups are of the same nature. Jamshidian and Jalal (2010) define
homogeneity of variances as a statistical procedure which assume that variables of the
population from different samples drawn are equal. Jamshidian and Yuan (2013) states that

70
Levene’s test can be used to test whether variances of two or more samples drawn from a
population are approximately equal.
According to Srivastava and Dolatabadi (2013) Levene’s test was based on two decision rule:
where the result p-value of Levene’s test was greater than the significant value of 0.05, the
variances was not statistically significantly different, so equal variances are assumed to be
equal. But where the result of p- value of Levene’s test was less than the significant value of
0.05, the variances were statistically significantly different, so equal variances were not
assumed to be equal. The homogeneity of variance of data are always tested so as to reduce
the possibility of falsely rejecting the null hypothesis of the study (Wang & Romano, 2017).
The results were presented inform of statistical table in chapter four.
3.10.3 Multicollinearity Test
The research used SPSS version 21 to test multicollinearity between independent variables and
dependent variables such as safety training practices, hazard control practices, workplace
safety inspection, safety records and employee performance. According to Rong (2014) a
good multiple regression analysis should not have multicollinearity because it will be difficult
to know which independent variable affects the dependent variable. The value of variance
inflation factor (VIF) was used to indicate whether independent variables have
multicollinearity effect. Where VIF values lie between 1-10 it indicates that there was no
multicollinearity, but if the value of VIF <1 or > 10 it indicates that there was multicollinearity
(Fleten, Nystad, Stigum, Lawlor, Davey, & Naess, 2014). The results were presented inform
of statistical table in chapter four.

71
3.11 Data Analysis and Presentation
The research used SPSS version 21 to analyze the data. Marks, Jennings, Farrell, Kaulbach,
Jorgenson, Sharpe, and Whaite (2014) described qualitative data as data related to concepts,
opinion, values and behaviours of people in a social context. The qualitative data were
analyzed using frequency and percentage, and the information presented in form of statistical
table. The quantitative data were analyzed using descriptive and inferential statistics such as:
percentages, mean, standard deviation, Pearson correlation of coefficient, multiple linear
regression analysis and moderated multiple regression analysis. The information presented
inform of pie charts, bar graphs and statistical tables.
The research used inferential statistics such as correlation analysis and conducted using
Pearson correlation of coefficient. Its aims were to establish whether there was a linear
relationship between independent variable OHSP such as (safety training practices, hazard
control practices, workplace safety inspection and safety records) and dependent variable
(employee performance) at 5% significance level. The value of (r) was used to indicate the
type of relationship and it ranges from 0 to 1. 0.0-0.3 indicates a weak relationship, 0.4-0.6
indicates moderate relationship, 0.7 and above indicates strong relationship. On the other hand,
if the p-value is less than the level of significance 0.05 (P<0.05) then it’s statistically
significant. But if p-value is greater than the level of significance 0.05 (P>0.05) then it was
not statistically significant. The null hypotheses were rejected or fail to reject at 0.05 level of
significance.

72
3.12 Ethical Consideration
The study ensured that there was an equal selection of respondents. This was achieved through
gender representation. No one was forced to participate in the study, participation was on a
voluntary basis. Confidentiality and anonymity of the respondent were adhered to and it was
achieved by distributing anonymous semi questionnaires. Furthermore, the semi
questionnaires were destroyed after the completion of analyzing data. The study seeks the
consent of the respondents before distributing the questionnaires so that they are aware of what
they were expected to do.

73
CHAPTER FOUR
DATA ANALYSIS, PRESENTATION AND DISCUSSION
4.1 Introduction
This chapter presents response rate, testing for validity and reliability of the measuring
instrument, demographic information of the respondents, descriptive analysis, diagnostic tests,
inferential analysis and testing of null hypotheses.
4.2 Response Rate
The results are presented in the table 4.1 response rate.
Table 4.1 Response Rate
BEVERAGE MANUFACTURING FIRMS TOTAL PERCENTAGE Response
rate Spirit Fruit
juice Wine Beer Soft
carbonated drinks
Returned 41 50 29 14 26 160 82%
Unreturned 14 6 3 4 9 36 18%
Total 55 56 32 18 35 196 100%
Source: (Author, 2019). The data was collected from 19 beverage manufacturing firms located within Nairobi City
County of Kenya. The table 4.1 response rate indicates that out of 196 semi structured
questionnaires administered to respondents in beverage manufacturing firms in Nairobi City
County of Kenya. A total of 160 complete filled in questionnaires were returned representing
82% of response rate, while 36 semi structured questionnaires were unreturned representing
18% of the unresponsive rate. According to Jack (2008) a response rate of 50% was adequate

74
for data analysis and reporting; a response rate of 60% was good and a response rate of 70%
and above was excellent. Based on the above argument, the response rate of the study was
excellent.
4.3 Testing Reliability of the Measuring Instrument
A Pilot study was conducted in one of the beverage manufacturing firms located within Nairobi
City County of Kenya to determine the reliability of the questionnaire. The reliability of the
questionnaire was conducted using Cronbach Alpha and the results were shown in the table
4.2 reliability test for the measuring instrument.
Table 4.2 Reliability Test for the Measuring Instrument
VARIABLE NO.OF ITEMS CRONBACH ALPHA
Workplace Safety Inspection 5 0.891
Safety Training Practices 6 0.871
Hazard Control Practices 5 0.870
OHS Law 5 0.787
Employee Performance 7 0.781
Safety Records 5 0.764
Mean Average 0.827
Source: (Author, 2019).
The table 4.2 reliability test for the measuring instrument indicates that the workplace safety
inspection had the highest reliability of 0.891, while safety records had the lowest reliability
of 0.764. The mean average values for the six variables was greater than 0.7 and therefore the
research concludes that the measuring instrument was strong and more reliable. According to

75
Janice, Michael, Maria, Karin, and Jude (2002) a measuring instrument which has a reliability
of 0.7 and above was considered to be strong and reliable.
4.4 Validity Testing of the Measuring Instrument
The validity of the measuring instrument was tested using multiple linear regression analysis
and moderated multiple regression analysis. The results are presented in the table 4.3 model
summary for multiple linear regression analysis between occupational health and safety
practices and employee performance. And table 4.5 model summary for moderated multiple
regression analysis between occupational health and safety practices, occupational health and
safety law and employee performance.
Table 4.3 Model Summary for Multiple Linear Regression Analysis between
Occupational Health and Safety Practices and Employee Performance
Model R R Square Adjusted R Square Std. Error of the Estimate
1 .857 .735 .728 2.23704
Source: (Author, 2019).
The table 4.3 model summary for multiple linear regression analysis between occupational
health and safety practices and employee performance. The multiple correlation coefficient R
is 0.857 and its closer to one, therefore it indicates that there was a strong relationship between
OHSP (safety training practices, hazard control practices, workplace safety inspection and
safety records) and employee performance. These indicates that the measuring instrument
measures up to it claims and thus how construct validity was achieved.

76
The value of adjusted R2 was 0.728, this show that 72.8% proportion of the variance in
employee performance were explained by safety training practices, hazard control practices,
workplace safety inspection and safety records. Therefore, it means that the other OHSP not
studied in this research contributed to 27.2% of the proportion of the variance in employee
performance. Therefore, further research should be conducted to examine other OHSP that
influence employee performance in beverage manufacturing firms in Nairobi City County of
Kenya.
Table 4.4 ANOVA for the Multiple Linear Regression Analysis
Model Sum of Squares df Mean Square F Sig.
1
Regression 2153.698 4 538.424 107.591 .000b Residual 775.677 155 5.004
Total 2929.375
159
Source: (Author, 2019).
The table 4.4 ANOVA for the multiple linear regression analysis test whether the overall
multiple linear regression model was good for prediction and the result were as follows, F
(4,155) =107.591, p=0.000<0.05. It has a p-value of 0.00 which was less than the significance
level of 0.05. It shows that OHSP; safety training practices, hazard control practices, workplace
safety inspection, and safety records statistically significantly predicted employee performance
and thus how criterion-related validity of the measuring instrument was achieved.

77
Table 4.5 Model Summary for Moderated Multiple Regression Analysis between
Occupational Health and Safety Practices, Occupational Health and Safety Law and
Employee Performance
Model R R Square
Adjusted R Square
Std. Error of
the Estimate
Change Statistics
R Square Change
F Change
df1 df2 Sig. F Change
1 .857a .735 .728 2.23704 .735 107.591 4 155 .000
2 .865b .748 .740 2.18957 .013 7.794 1 154 .006
Source: (Author, 2019).
The research used table 4.5 to test construct validity of the measuring instrument. The research
used model (2) and it shows that multiple correlation coefficient (R) was 0.865 and it is closer
to one and therefore it indicated that there was strong relationship between OHSP, OHS law
and employee performance. The measuring instrument was able to measure up to it claims and
thus how construct validity of the measuring instrument was achieved.
Table 4.6 ANOVA for Moderated Multiple Regression Analysis between Occupational Health and Safety Practices, Occupational Health and Safety Law and Employee Performance
Model Sum of Squares df Mean Square F Sig.
1 Regression 2153.698 4 538.424 107.591 .000b Residual 775.677 155 5.004
Total 2929.375 159
2 Regression 2191.066 5 438.213 91.405 .000c Residual 738.309 154 4.794
Total 2929.375 159
Source: (Author, 2019).

78
The research used table 4.6, model (2) to determine the criterion related validity of the
measuring instrument. The table shows that the overall model was statistically significant in
predicting the moderating effect of OHS law on the relationship between OHSP and employee
performance, this was because the p- value of 0.000 was less than the significance level of 0.05
and the results were shown as follows F (5, 154) =91.405, p=0.000<0.05. That’s how criterion
related validity of the measuring instrument was achieved.
4.5 Demographic Information of the Respondents
The demographic data of the respondents comprised of gender, the age group in years, the
highest level of education, working experience, nature of the business and management level.
The data were analyzed using descriptive statistics such as percentages and the information
presented in the form of pie charts and bar graphs.
4.5.1 Gender
The result presented in the figure 4.1 gender.
Fig 4.1 Gender
Source: (Author, 2019).
Female, 39%Male , 61%
Gender

79
The figure 4.1 age of the respondents shows that the majority of the respondents who
participated in the study were male representing 61%, while few of the respondents 39% were
female. A study conducted by Akinola and Akinboloa (2014) on motivational strategies and
enhancement of employees’ performance in Nigeria beverage industry showed that 58.1% of
the respondents were male, while 41.9% were female. The findings of the study were further
supported by Kimani, Gatebe and Kungu (2016) who argued that manufacturing industry
attracts more males than females because most of the activities are manual and requires
masculinity.
4.5.2 Age
The result presented in the figure 4.2 age.
Fig 4.2 Age
Source: (Author, 2019).
0%5%
10%15%20%25%30%35%
18-25Years
26-35Years
36-45Years
46 Yearsand above
23%
33%28%
17%
Per
cent
age
Age in Years
Age

80
According to figure 4.2 it indicates that the majority of respondents 33% who participated in
the study were in the age group between 26-35 years, while the few of the respondents 17%
were in the age group of 46 years and above. The finding of the study was supported by
Ndegwa et al. (2014) who argues that majority of manufacturing firm’s employee young and
energetic people who can perform masculinity work.
4.5.3 Highest Education Level
The result presented in the figure 4.3 highest level of education.
Fig 4.3 Highest Education Level
Source: (Author, 2019).
In the fig 4.3 in terms of the highest level of education, the findings of the study indicated that
majority of the respondents 34% who participated in the study had a diploma as their highest
level of education, while few of the respondents had master degrees as their highest level of
0%5%
10%15%20%25%30%35% 24%
34%26%
13%
2%Per
cent
age
Educaction level
Highest Education Level

81
education represented by 2%. The findings of the study were supported by Kimani et al. (2016)
who revealed that majority of the respondents in beverage manufacturing firms had a college
education and above.
4.5.4 Working Experience
The result presented in the figure 4.4 working experience.
Fig 4.4 Working Experience.
Source: (Author, 2019).
The findings of the study according to fig 4.4 shows that the majority of the respondents 35%
who participated in the study had working experience between 2-5 years, while few of the
respondents 17% had below 1 year working experience. The findings are in contrast to a study
conducted by Kimeto, Kiiyuka, and Makhonge (2015) Occupational Safety and Health
Awareness among factory workers of Kenya Tea Development Agency in region five which
0%5%
10%15%20%25%30%35%
Below 1Year
Between 2-5Years
Between 6-10 Years
Above 11Years
17%
35%
27%
21%
Per
cena
tge
Working Experience in Years
Working Experience

82
revealed that majority of the respondents had working experience between 6-10 years. An
experienced worker will work cautiously than the newly employed employee because they are
aware of the hazards and risk they encounter at the workplace (Umoh & Torbira, 2013).
4.5.5 Nature of the Business
The result presented in the figure 4.5 nature of the business.
Fig 4.5 Nature of the Business.
Source: (Author, 2019).
The respondents were also asked to indicate the nature of their business and the responses were
as follows. According to fig 4.5 the research findings indicated that the majority of the
respondents 26% who participated in the study were from spirit manufacturing firms, while
few of the respondents 14% were from the beer manufacturing firms. The findings of the study
were supported by the report of Kenya Revenue Authority (2015) and Nderitu (2016) which

83
indicated that spirit manufacturing firm’s accounted to more than 50% of beverage
manufacturing firms in Kenya.
4.5.6 Management Level
The results are presented in the figure 4.6 management level.
Fig 4.6 Management Level
Source: (Author, 2019).
The figure 4.6 indicates that majority of the respondents 79% who participated in the study
were factory floor staff, while the few of the respondents represented by 9% were human
resource managers. The findings of the study were supported by Akinola and Akinboloa
(2014) who argued that manufacturing was the core function of beverage manufacturing firms
and therefore it has more workers than any other department in the organization.
Human Resource
Manager, 9%
Operation Manager, 12%
Factory Floor Staff, 79%
Management Level
Human Resource Manager Operation Manager Factory Floor Staff

84
4.6 Descriptive Analysis
The quantitative data of OHSP, OHS law and employee performance were analyzed using
descriptive statistics such as mean, standard deviation, and the results presented in the form
of statistical tables.
4.6.1 Descriptive Analysis of Occupational Health and Safety Practices
The study analyzed the OHSP and it includes: safety training practices, hazard control
practices, workplace safety inspection and safety record. The data were analyzed using
descriptive statistics such as mean, standard deviation, and results presented in form of
statistical tables.
4.6.1.1 Descriptive Analysis of Safety Training Practices
The respondents were asked to rate the statements by indicating the extent to which they apply
to their organization in 5 point Likert scale as shown on (appendix II). 5. Strongly Agree (SA),
4. Agree (A), 3. Neutral (N), 2. Disagree (D) and 1. Strongly Disagree (SD). The results
presented in the table 4.7 descriptive analysis of safety training practices.

85
Table 4.7 Descriptive Analysis of Safety Training Practices
VARIABLE N Minimum Maximum Mean Standard Deviation
Safety Training Practices
Job rotation, coaching, job instruction and lecture method as a safety training practices are conducted at the workplace.
160 1 5 3.66 0.917
Job rotation, coaching, job instruction and lecture training are evaluated at the workplace.
160 1 5 3.13 1.032
Job rotation, coaching, job instruction and lecture training have clear goals and objectives.
160 1 5 3.17 1.089
There is a commitment of trainer to offer job rotation, job instruction, coaching and lecture training.
160 1 5 3.16 1.043
There is a provision of feedback on job rotation, job instruction, coaching and lecture training.
160 1 5 3.23 0.966
The job rotation, coaching, job instruction and lecture training are offered by competent trainers.
160 1 5 3.09 1.069
Aggregate Score: Safety Training Practices
3.24 1.0195
Source: (Author, 2019).
The table 4.7 descriptive analysis of safety training practices indicates that in terms of safety
training practices the results were as follows; job rotation, coaching, job instruction lecture
training conducted at the workplace had the highest mean with a standard deviation (M=3.66,

86
SD=0.197). While job rotation, coaching, job instruction and lecture training offered by
competent trainer had the lowest mean with a standard deviation (M=3.09, SD=1.0195). The
aggregate score for safety training practices was (M=3.24, SD=1.0195).
The findings indicated that the majority of respondents in beverage manufacturing firms in
Nairobi City County of Kenya were neutral when it comes to safety training practices. The
findings of the study were supported by Wahab et al. (2005) who argues that employers do not
want to provide employees with safety training programs because they see it as an additional
cost. Furthermore, Weinstock and Slatin (2006) also argued that employees do not want to
attend safety training programs because they see it as a waste of time. On the contrary, Kanu
(2015) argued that safety training practices enables employees to work safely by using the
machines and equipment for the right job and therefore reducing accidents and injuries at the
workplace.
4.6.1.2 Descriptive Analysis of Hazard Control Practices
The respondents were asked to rate the statements by indicating the extent to which they apply
to their organization in 5 point Likert scale as shown on (appendix II). 5. Strongly Agree (SA),
4. Agree (A), 3. Neutral (N), 2. Disagree (D) and 1. Strongly Disagree (SD). The results
presented in the table 4.8 descriptive analysis of hazard control practices.

87
Table 4.8 Descriptive Analysis of Hazard Control Practices
Variable N Minimum Maximum Mean Standard Deviation
Hazard Control Practices
Organization is using engineering controls such as ventilation, substitution and elimination to control hazards at the workplace
160 1 5 2.85 1.255
Organization is using administrative controls such as safe work practices, rest schedules, personal hygiene and limiting hours of work to control hazards at the workplace.
160 1 5 3.69 1.070
The organization is using personal protective equipment to protect employees against hazards.
160 1 5 3.59 1.178
The organization is training employees on how to use and maintain personal protective equipment.
160 1 5 3.48 1.176
The organization provides employees with personal protective equipment that are appropriate in size.
160 1 5 3.46 1.197
Aggregate Score: Hazard Control Practices.
3.14 1.1752
Source: (Author, 2019).
The findings from table 4.8 shows that administrative control had the highest mean with a
standard deviation (M=3.69, SD=1.070), while engineering control had the lowest mean with
a standard deviation (M=2.85, SD=1.255). The aggregate score for hazard control practices

88
was (M=3.14, SD=1.1752). The findings show that majority of the respondents were neutral
when it comes to hazard control practices. The findings of the study were supported by Akmal
(2011) who revealed that majority of the firms do not want to control hazards at the workplace
because they see it as an additional cost in terms of buying PPE and training employees on
how to maintain and use them. In addition, Konya et al. (2012) argued that employees do not
like to wear PPE because they are poorly maintained and uncomfortable to wear especially in
humid conditions and these tend to slow their performance. On the other hand, Gbagbo et al.
(2013) states that hazard control practices such as good housekeeping practices and wearing
of PPE eliminate and control hazards such as viruses, extreme conditions, slips, pesticides, and
falling of objects and therefore employees are provided with conducive environment where
they can increase their performances.
4.6.1.3 Descriptive Analysis of Workplace Safety Inspection
The respondents were asked to rate the statements by indicating the extent to which they apply
to their organization in 5 point Likert scale as shown on (appendix II). 5. Strongly Agree (SA),
4. Agree (A), 3. Neutral (N), 2. Disagree (D) and 1. Strongly Disagree (SD). The results
presented in the table 4.9 descriptive analysis of workplace safety inspection.

89
Table 4.9 Descriptive Analysis of Workplace Safety Inspection
VARIABLE N Minimum Maximum Mean Standard Deviation
Workplace Safety Inspection
The health and safety representative frequently conduct workplace safety inspection at the workplace.
160 1 5 3.46 1.069
The health and safety representative use checklist during workplace safety inspection.
160 1 5 3.36 0.999
The health and safety representative use task observation to understand the working processes so as to be able suggest hazard controls methods.
160 1 5 3.26 1.130
The health and safety representative communicate workplace safety inspection report to management for coaching purposes.
160 1 5 3.28 1.058
The organization is monitoring corrective action by assigning responsibility to an individual.
160 1 5 3.22 1.136
Aggregate Score : Workplace Safety Inspection
3.32 1.078
Source: (Author, 2019).
The table 4.9 indicates that HSR frequently conducts workplace inspection at the workplace
had the highest mean with a standard deviation (M=3.46, SD=1.069), while organization

90
monitoring corrective action by assigning responsibility to an individual had the lowest mean
with a standard deviation (M=3.22, SD=1.136). The workplace safety inspection had an
aggregate score of (M=3.32, SD=1.078). These indicates that majority of the respondents were
neutral when it comes to workplace safety inspection at the workplace. The workplace safety
inspection can only be effective when it’s conducted frequently by trained HSR and monitoring
the corrective actions which have been put in place and it assist in detecting effectiveness in
hazard control practices (Umeakafor et al., 2012).
4.6.1.4 Descriptive Analysis of Safety Records
The respondents were asked to rate the statements by indicating the extent to which they apply
to their organization in 5 point Likert scale as shown on (appendix II). 5. Strongly Agree (SA),
4. Agree (A), 3. Neutral (N), 2. Disagree (D) and 1. Strongly Disagree (SD). The results
presented in the table 4.10 descriptive analysis of safety records.

91
Table 4.10 Descriptive Analysis of Safety Records
VARIABLE N Minimum Maximum Mean Standard Deviation
Safety Records
There are safety records in your organization.
160 1 5 3.51 0.997
There is frequent update of safety records.
160 1 5 3.04 1.089
There is classification of safety records.
160 1 5 3.03 1.049
The safety records are kept in proper conditions
160 1 5 2.95 0.970
Record Officers are trained on record Management skills.
160 1 5 2.94 0.916
Aggregate score : Safety Records
3.09 1.00
Source: (Author, 2019).
The table 4.10 shows that keeping of safety records in the organization had the highest mean
with a standard deviation (M=3.51, SD=0.997), while record officers trained on record
management skills had the lowest mean with a standard deviation (M=2.94, SD=0.916). The
aggregate score for the safety record was (M=3.09, SD=1.00). These shows that majority of
the respondents were neutral about safety records in beverage manufacturing firms in Nairobi
City County of Kenya. The safety record can only be effective in controlling hazards at the
workplace when they are factual and related to the working environment (Duff & Harris, 2013).

92
The aggregate score for OHSP was (M=3.20, SD=1.0682) and it indicates that majority of the
respondents were neutral when it comes to OHSP in beverage manufacturing firms in Nairobi
City County of Kenya. The study findings were supported by Rantanen et al. (2006) who
stated that most African countries emphasize on increasing profitability and productivity at the
expense of employees’ health and safety. In addition, Katsakiori (2006) stated that most
African countries have challenges when it comes to implementation of OHSP and such may
include poor OHS infrastructures and general lack of adequate information about OHSP
amongst employers and employees. However, Moyo et al. (2015) still believes that some
African countries were improving OHSP through OHS education, training and collaborating
with OHS research institutions. Furthermore, Idoro (2016) argued that industries in Nigeria
were pursuing OHS initiatives such OHS awareness, incentives, accidents investigations and
provision of PPE.
4.6.2 Descriptive Analysis of Occupational Health and Safety Law
The respondents were asked to rate the statements by indicating the extent to which they apply
to their organization in 5 point Likert scale as shown on (appendix II). 5. Strongly Agree (SA),
4. Agree (A), 3. Neutral (N), 2. Disagree (D) and 1. Strongly Disagree (SD). The results
presented in the table 4.11 descriptive analysis for occupational health and safety law.
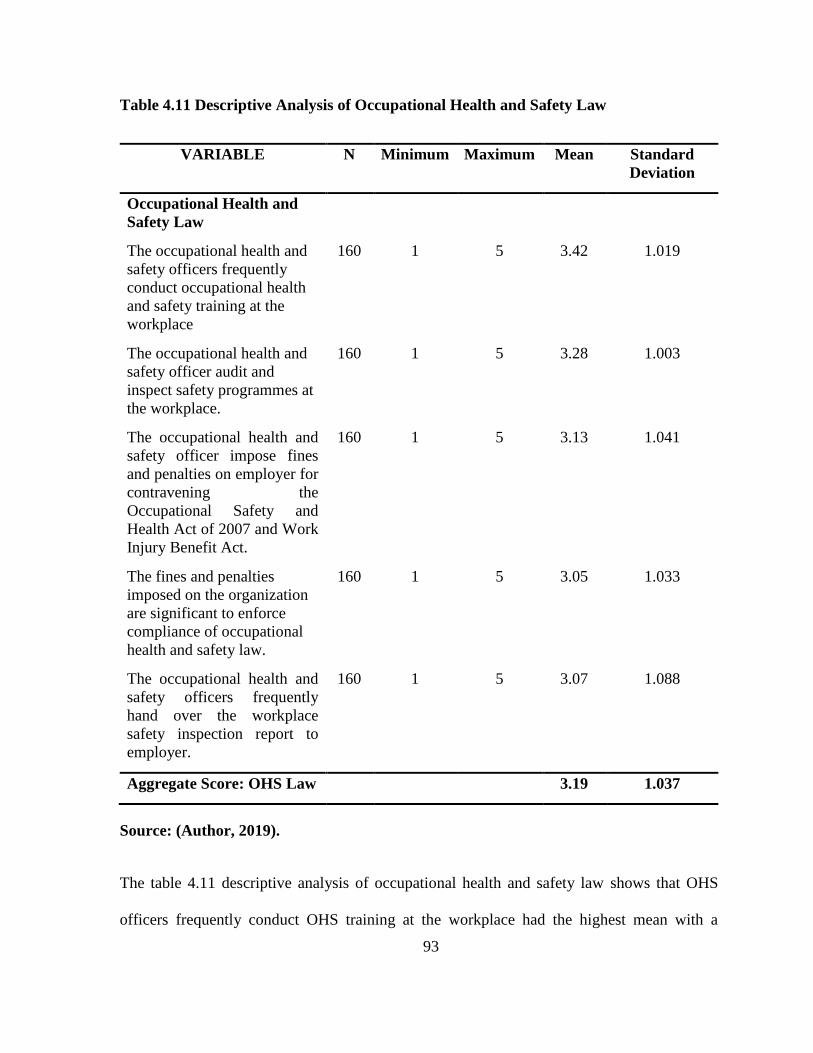
93
Table 4.11 Descriptive Analysis of Occupational Health and Safety Law
VARIABLE N Minimum Maximum Mean Standard Deviation
Occupational Health and Safety Law
The occupational health and safety officers frequently conduct occupational health and safety training at the workplace
160 1 5 3.42 1.019
The occupational health and safety officer audit and inspect safety programmes at the workplace.
160 1 5 3.28 1.003
The occupational health and safety officer impose fines and penalties on employer for contravening the Occupational Safety and Health Act of 2007 and Work Injury Benefit Act.
160 1 5 3.13 1.041
The fines and penalties imposed on the organization are significant to enforce compliance of occupational health and safety law.
160 1 5 3.05 1.033
The occupational health and safety officers frequently hand over the workplace safety inspection report to employer.
160 1 5 3.07 1.088
Aggregate Score: OHS Law 3.19 1.037
Source: (Author, 2019).
The table 4.11 descriptive analysis of occupational health and safety law shows that OHS
officers frequently conduct OHS training at the workplace had the highest mean with a

94
standard deviation (M=3.42, SD=1.019), while fine and penalties imposed on organization
were significant to enforce compliance of OHS law had the lowest mean with a standard
deviation (M=3.05, SD=1.033). The OHS law had an aggregate score (M=3.19, SD=1.037).
These show that majority of the respondents were neutral when it comes to OHS law in
beverage manufacturing firms in Nairobi City County of Kenya. The findings of the study
were supported by Idubor and Oisampje (2005) who argues that most African countries lack
qualified inspectorate to inspect and audit OHS activities at the workplaces. In addition,
Jonathan and Mbogo (2008) stated that most African inspectorate departments were
inadequately funded by the government of the day. On the other hand, Kalejaiye (2010)
believed that the enforcement of OHS law doesn’t increase workplace safety because OHS law
is not the only step for improving OHSP as improving organization culture can also improve
OHSP.
4.6.3 Descriptive Analysis of Employee Performance
The respondents were asked to rate the statements by indicating the extent to which they apply
to their organization in 5 point Likert scale as shown on (appendix II). 5. Strongly Agree (SA),
4. Agree (A), 3. Neutral (N), 2. Disagree (D) and 1. Strongly Disagree (SD). The results
presented in the table 4.12 descriptive analysis of employee performance.
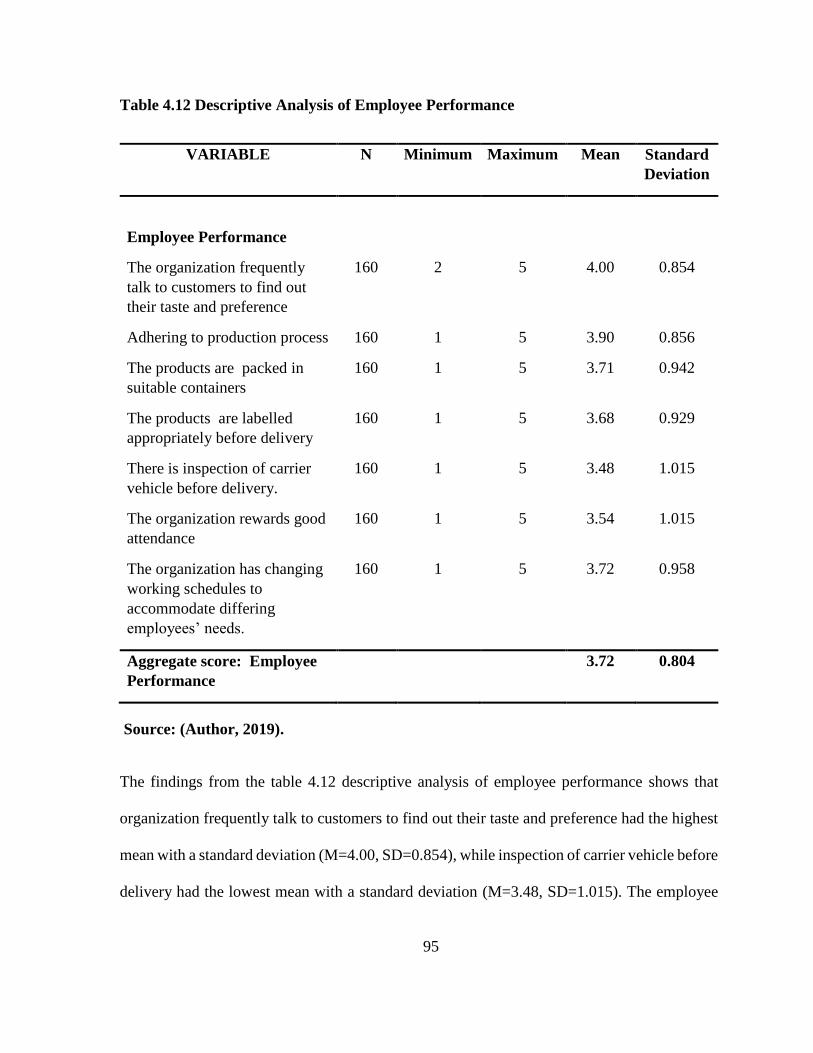
95
Table 4.12 Descriptive Analysis of Employee Performance
VARIABLE N Minimum Maximum Mean Standard Deviation
Employee Performance
The organization frequently talk to customers to find out their taste and preference
160 2 5 4.00 0.854
Adhering to production process 160 1 5 3.90 0.856
The products are packed in suitable containers
160 1 5 3.71 0.942
The products are labelled appropriately before delivery
160 1 5 3.68 0.929
There is inspection of carrier vehicle before delivery.
160 1 5 3.48 1.015
The organization rewards good attendance
160 1 5 3.54 1.015
The organization has changing working schedules to accommodate differing employees’ needs.
160 1 5 3.72 0.958
Aggregate score: Employee Performance
3.72 0.804
Source: (Author, 2019).
The findings from the table 4.12 descriptive analysis of employee performance shows that
organization frequently talk to customers to find out their taste and preference had the highest
mean with a standard deviation (M=4.00, SD=0.854), while inspection of carrier vehicle before
delivery had the lowest mean with a standard deviation (M=3.48, SD=1.015). The employee

96
performance had an aggregate score (M=3.72, SD=0.804). These show that majority of the
respondents were neutral when it comes to employees’ performance in beverage manufacturing
firms in Nairobi City County of Kenya. The study findings were supported Kimuyu (2014)
who stated that employee performance in beverage manufacturing firms in Nairobi City
County of Kenya was declining.
4.6.4 Descriptive Analysis on the Improvement of Occupational Health and Safety
Practices, Occupational Health and Safety Law and Employee Performance
The qualitative data on the improvement of OHSP, OHS law and employee performance were
analyzed using frequency and percentages, and the information presented in the form of
statistical tables.
4.6.4.1 Descriptive Analysis on the Improvement of Occupational Health and Safety
Practices
The qualitative data on the improvement of OHSP such as safety training practices, hazard
control practices, workplace safety inspection and safety record were analyzed using
descriptive statistics such as frequency and percentage and the information presented in the
form of statistical tables.
4.6.4.1.1 Descriptive Analysis on the Improvement of Safety Training Practices
The qualitative data on the improvement of safety training practices were analyzed using
frequency and percentages and the information presented in the table 4.13 descriptive analysis
on the improvement of safety training practices.

97
Table 4.13 Descriptive Analysis on the Improvement of Safety Training Practices
SAFETY TRAINING PRACTICES FREQUENCY PERCENT (%)
Evaluation for safety training practices 19 12%
Training practices should have clear objectives 26 16%
Provision of feedback 59 37%
Conduct training need analysis before training 39 24%
Safety training practices should be offered by competent trainer
17 11%
TOTAL 160 100%
Source: (Author, 2019).
In regard to improvement of the safety training practices, the table 4.13 indicated that majority
of the respondent 37% agreed that there should be provision of feedback in safety training
practices, while few of respondents 11% agreed that safety training practices should be offered
by competent trainer. Brazile (2002) acknowledged that safety training programs are effective
when there are provisions of feedback to employees who attend safety training programs and
it enables employees to be aware of their progress in safety training programs. Ayim (2003)
mentioned that safety training programs can be effective in the organization especially when
it’s offered by a competent trainer and it ensure there was an easy transfer of safety knowledge
and skills to employees. Bell (2004) reported that safety programs should enable trainees to
know what they are supposed to achieve at the end of training and these can only be achieved
where safety training programs have clear goals and objectives.

98
4.6.4.1.2 Descriptive Analysis on the Improvement of Hazard Control Practices
The qualitative data on the improvement of hazard control practices were analyzed using
frequency and percentages, and the information presented in table 4.14 descriptive analysis on
the improvement of hazard control practices.
Table 4.14 Descriptive Analysis on the Improvement of Hazard Control Practices
Hazard Control Practices Frequency Percent (%)
Use administrative control. 52 33%
Use engineering control. 48 30%
Train employees on use and maintenance of PPE. 42 26%
Provide appropriate PPE. 18 11%
TOTAL 160 100%
Source: (Author, 2019).
The table 4.14 indicated that majority of the respondents 33% agreed that the management
should use administrative control as one of the hazard control practices to control or eliminate
hazards at the workplace, while few of the respondents 11% agreed that management should
provide appropriate PPE. The organization can use administrative control to eliminate and
control hazards and such practices may include: safe work practices, rest schedules and
limiting hours of work (Zhang, 2003). However, Shehu et al. (2007) argued that administrative
controls were ineffective in controlling hazards since they don’t completely eliminate hazards.
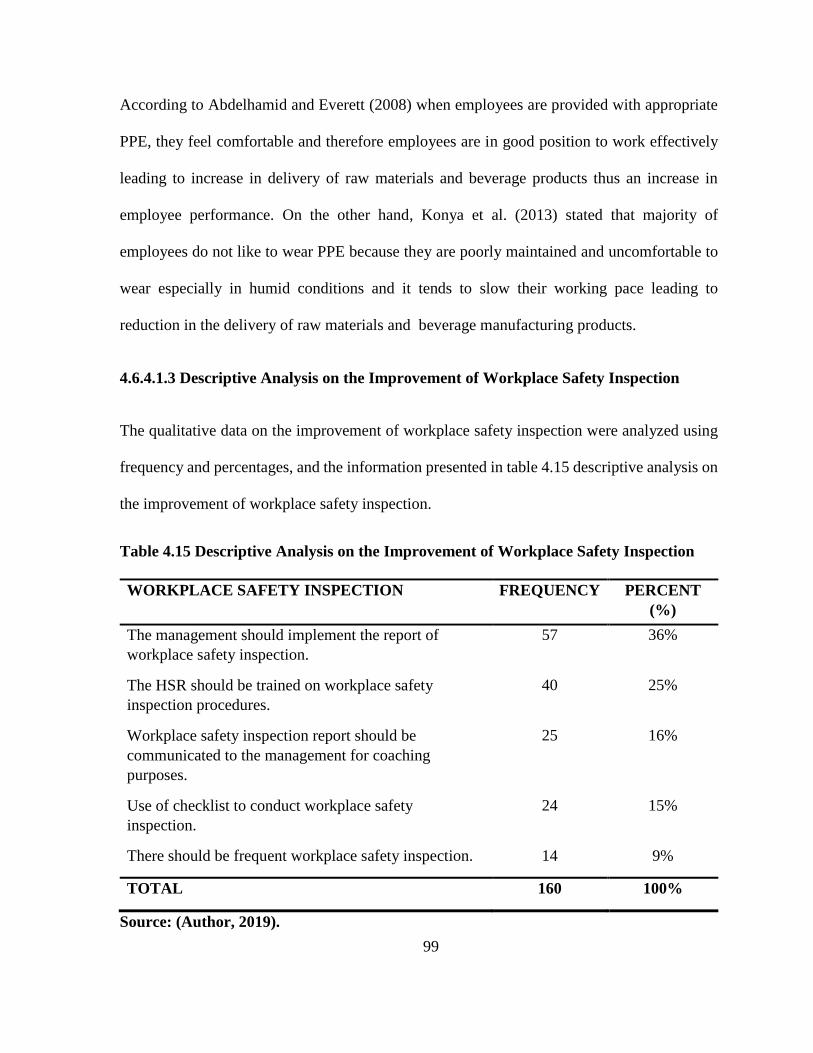
99
According to Abdelhamid and Everett (2008) when employees are provided with appropriate
PPE, they feel comfortable and therefore employees are in good position to work effectively
leading to increase in delivery of raw materials and beverage products thus an increase in
employee performance. On the other hand, Konya et al. (2013) stated that majority of
employees do not like to wear PPE because they are poorly maintained and uncomfortable to
wear especially in humid conditions and it tends to slow their working pace leading to
reduction in the delivery of raw materials and beverage manufacturing products.
4.6.4.1.3 Descriptive Analysis on the Improvement of Workplace Safety Inspection
The qualitative data on the improvement of workplace safety inspection were analyzed using
frequency and percentages, and the information presented in table 4.15 descriptive analysis on
the improvement of workplace safety inspection.
Table 4.15 Descriptive Analysis on the Improvement of Workplace Safety Inspection WORKPLACE SAFETY INSPECTION FREQUENCY PERCENT
(%)
The management should implement the report of workplace safety inspection.
57 36%
The HSR should be trained on workplace safety inspection procedures.
40 25%
Workplace safety inspection report should be communicated to the management for coaching purposes.
25 16%
Use of checklist to conduct workplace safety inspection.
24 15%
There should be frequent workplace safety inspection. 14 9%
TOTAL 160 100%
Source: (Author, 2019).

100
The table 4.15 indicates that the majority of the respondents 36% agreed that management
should implement the report of workplace safety inspection, while few of the respondents 9%
agreed that there should be frequent workplace safety inspection. Zhou and Fang (2004)
argued that workplace safety inspection are frequently conducted at the workplace and it can
assist the organizations to identify new existing hazards such sharp knives and blades and
therefore organizations are able provide PPE to protect employees against injuries and cuts.
The workplace safety inspection can only be effective when the management implements the
report of workplace safety inspection and it can be achieved by management assigning
responsibilities to an individual to detect the effective measures of hazard control practices
which have been put in place (Nikolaos, 2005).
4.6.4.1.4 Descriptive Analysis on the Improvement of Safety Record
The qualitative data on the improvement of safety record were analyzed using frequency and
percentages, and the information presented in table 4.16 descriptive analysis on the
improvement of safety record.
Table 4.16 Descriptive Analysis on the Improvement of Safety Record
SAFETY RECORD FREQUENCY PERCENT (%)
There should be classification of safety records. 55 34%
The OHS records should be kept in proper conditions. 53 33%
Safety record officers should be trained on record management skills.
35 22%
There should be frequent update of safety records. 17 11%
TOTAL 160 100%
Source: (Author, 2019).

101
The findings from the table 4.16 shows that majority of the respondent 34% agreed that there
should be classification of safety records, while few of the respondent 11% agreed that there
should be frequent update of safety records. Duranti and Abdullah (2008) stated that record
officer can be trained on record management skills which can assist them to classify, update
and keep safety records in good conditions. However, Miller et al. (2009) argued that
information from safety record have to be in a form that can easily be understood by user and
failing to understand the information can lead to wrong implementation of hazard control
practices which can further introduce hazards at the workplace that can cause accidents and
injuries.
4.6.4.2 Descriptive Analysis on the Improvement of Occupational Health and Safety Law
The qualitative data on the improvement of occupational health and safety law were analyzed
using frequency and percentages, and the information presented in table 4.17 descriptive
analysis on the improvement of occupational health and safety law.

102
Table 4.17 Descriptive Analysis on the Improvement of Occupational Health and Safety law OCCUPATIONAL HEALTH AND SAFETY LAW FREQUENCY PERCENT
(%)
Imposing fines and penalties on employers violating OHS law.
51 32%
Penalties and fines should be significant. 38 24%
OHS officers should frequently inspect and audit OHS programmes.
32 20%
OHS officers should frequently hand over report of workplace safety inspection to employers.
31 19%
OHS officer should frequently conduct OHS training at the workplace.
8 5%
TOTAL 160 100%
Source: (Author, 2019).
The table 4.17 shows that majority of the respondents 32% agreed that the DOSHS should
impose fines and penalties on employers who are violating OHS law, while few of the
respondents 5% agreed that OHS officer should frequently conduct OHS training at the
workplace. Ezenwa (2004) stated that heavy fines and penalties will force the employers to
comply with OHS law by conducting workplace safety inspection, eliminating and controlling
hazards at the workplace and thus providing a conducive working environment for employees
leading to improvement in employee performance. On the contrary opinion, Onyeozili (2010)
believed that the government must reduce the burden of regulation which preoccupies itself
with details but rather it can aim at shaping attitudes and creating infrastructures for a better
organization of OHS by industries own effort.

103
4.6.4.3 Descriptive Analysis on the Improvement of Employees Performance
The qualitative data on the improvement of occupational health and safety law were analyzed
using frequency and percentages, and the information presented in the table 4.18 descriptive
analysis on the improvement of employee performance.
Table 4.18 Descriptive Analysis on the Improvement of Employee Performance EMPLOYEE PERFORMANCE. FREQUENCY PERCENT
(%) Organization should reward good attendance. 33 21%
There should be inspection of carrier vehicle before delivery.
31 19%
Products should be packed in suitable containers. 27 17%
Products should be labelled appropriately before delivery.
25 16%
The organization should have working schedules to accommodate differing employee’s needs.
19 12%
The organization should adhere to production process. 16 10%
The organization should find out the taste and preference of customers before producing products.
9 5%
TOTAL 160 100%
Source: (Author, 2019).
The table 4.18 indicates that the majority of the respondents 21% agreed that organization
should reward good attendance, while few of the respondent 5% agreed that the organization
should find out the taste and preference of customers before producing the products. Stan
(2006) stated that for the organization to reduce absenteeism at the workplace, organization
can introduce a reward program where they can reward employees financially or non-
financially. However, Thao (2007) argued that there have to be a policy in place to ensure that

104
such systems are not abused by the management and employees. Wei (2007) also mentioned
that organization should have flexible working hours which can accommodate employees
differing needs and it will give employees ample time to attend to their personal issues.
4.7 Diagnostic Test
These involves testing normality, multicollinearity and homogeneity of variances.
4.7.1. Normality Test
The normality was tested using Shapiro Wilk Test and the result was shown in the table 4.19.
Table 4.19 Normality Test for Safety Training Practices, Hazard Control Practices,
Workplace Safety Inspection, Safety Records and Employee Performance
Variables Kolmogorov-Smirnova Shapiro-Wilk
Statistic df Sig. Statistic df Sig.
Safety Training Practices .091 160 .109 .934 160 .136 Hazard Control Practices .148 160 .134 .971 160 .177 Workplace Safety Inspection .101 160 .132 .982 160 .189 Safety Records .070 160 .122 .971 160 .230 Employee Performance .095 160 .109 .986 160 .190 OHS Law .070 160 .112 .983 160 .118
Source: (Author, 2019).
The table 4.19 normality test for safety training practices, hazard control practices, workplace
safety inspection, safety records and employee performance indicated that safety record had
the highest significant value of the Shapiro Wilk test 0.230, while OHS law had the lowest
significant value of the Shapiro Wilk test 0.118. The findings indicated that all six variables

105
had significant value of the Shapiro Wilk Test greater than 0.05 and therefore the research
concludes that the data was normal.
4.7.2 Homogeneity of Variances Test
The homogeneity of variances between independent variables (safety training practices, safety
records, workplace safety inspection and hazard control practices) and dependent variable
(employee performance) were analyzed using Levene’s test of equality of error variances and
the results presented in table 4.20 homogeneity of variance test.
Table 4.20 Homogeneity of Variances Test
Variables Levene Statistic df1 df2 Sig.
Employee Performance .706 16 141 .784
Safety Training Practices 1.002 16 141 .458
Hazard Control Practices 1.658 16 141 .062
Workplace Safety Inspection .799 16 141 .685
Safety Records 2.562 16 141 .482
Source: (Author, 2019).
The table 4.20 indicated that employee performance had the highest significant value of 0.784,
while hazard control practices had the least significant value of 0.062. From the results above,
it shows that p-values of all the variables were greater than significance level of 0.05, therefore
the variance were not statistically significantly different, so equal variances were assumed to
be equal across the variables.
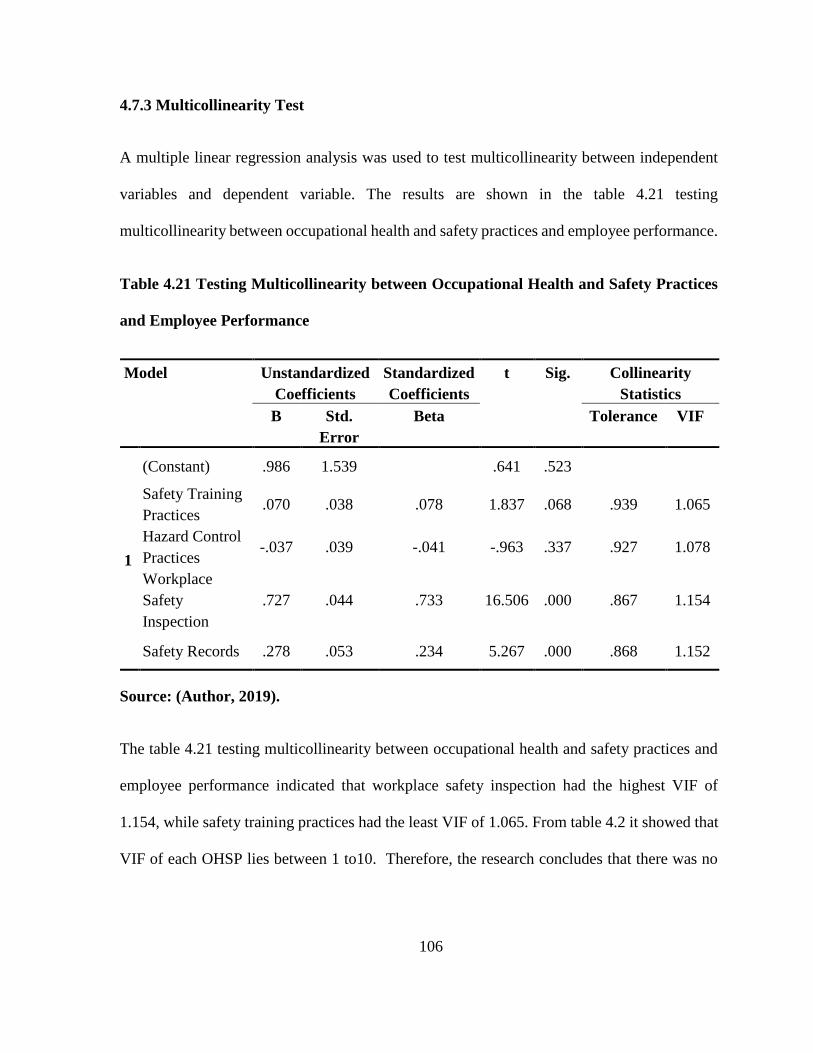
106
4.7.3 Multicollinearity Test
A multiple linear regression analysis was used to test multicollinearity between independent
variables and dependent variable. The results are shown in the table 4.21 testing
multicollinearity between occupational health and safety practices and employee performance.
Table 4.21 Testing Multicollinearity between Occupational Health and Safety Practices
and Employee Performance
Model Unstandardized Coefficients
Standardized Coefficients
t Sig. Collinearity Statistics
B Std. Error
Beta Tolerance VIF
1
(Constant) .986 1.539
.641 .523
Safety Training Practices
.070 .038 .078 1.837 .068 .939 1.065
Hazard Control Practices
-.037 .039 -.041 -.963 .337 .927 1.078
Workplace Safety Inspection
.727 .044 .733 16.506 .000 .867 1.154
Safety Records .278 .053 .234 5.267 .000 .868 1.152
Source: (Author, 2019).
The table 4.21 testing multicollinearity between occupational health and safety practices and
employee performance indicated that workplace safety inspection had the highest VIF of
1.154, while safety training practices had the least VIF of 1.065. From table 4.2 it showed that
VIF of each OHSP lies between 1 to10. Therefore, the research concludes that there was no

107
multicollinearity effect between independent variables (safety training practices, hazard
control practices, workplace safety inspection, safety records) and employee performance.
4.8 Inferential Analysis
The correlation analysis, multiple linear regression analysis and moderated multiple regression
analysis were used to analyzed the data and the information presented inform of statistical
tables.
4.8.1 Correlation Analysis
Correlation analysis was conducted using Pearson correlation of coefficient. Its aims were to
establish whether there was a linear relationship between independent variable OHSP such as
(safety training practices, hazard control practices, workplace safety inspection and safety
records) and dependent variable (employee performance) at 5% significance level. The results
presented in the table 4.22 correlations analysis between occupational health and safety
practices and employee performance.

108
Table 4.22 Correlations Analysis between Occupational Health and Safety Practices and
Employee Performance
Safety
Training Practices
Hazard Control Practices
Workplace Safety Inspection
Safety Records
Employee Performance
Safety
Training
Practices
Pearson
Correlation 1 .082 .220** .015 .240**
Sig. (2-tailed) .300 .005 .852 .002
N 160 160 160 160 160
Hazard
Control
Practices
Pearson
Correlation .082 1 -.109 -.248** -.173*
Sig. (2-tailed) .300 .170 .002 .029
N 160 160 160 160 160
Workplace
Safety
Inspection
Pearson
Correlation .220** -.109 1 .289** .822**
Sig. (2-tailed) .005 .170 .000 .000
N 160 160 160 160 160
Safety
Records
Pearson
Correlation .015 -.248** .289** 1 .457**
Sig. (2-tailed) .852 .002 .000 .000
N 160 160 160 160 160
Employee
Performance
Pearson
Correlation .240** -.173* .822** .457** 1
Sig. (2-tailed) .002 .029 .000 .000
N 160 160 160 160 160
*. Correlation is significant at the 0.05 level (2-tailed). Source: (Author, 2019).
4.8.1.1 Safety Practices and Employee Performance
The table 4.22 shows that there was a weak positive relationship which was statistically
significant between safety training practices and employee performance at beverage

109
manufacturing firms in Nairobi City County of Kenya (r=0.240, p=0.002<0.05). These shows
that an increase in safety training practices led to an increase in employee performance at
beverage manufacturing firms in Nairobi City County of Kenya, however, the relationship was
weak. The correlation analysis concurs with a case study that was conducted by Alquiran
(2011) which indicated that job rotation had a positive impact on employee performance in
United Nation Relief Works Agency in Palestine. The correlation analysis also concurs with
a case study that was conducted by Murithi (2016) which indicated that there was a positive
correlation between coaching and employee’s performance at Standard Chartered Bank of
Kenya. The research findings were also supported by Indexed and Sudhakar (2017) who
argued that safety training enables employees to understand the causes of the accidents and
how they can be prevented and therefore employees work safely leading to reduction in the
occurrence of accidents and thus reduction in absenteeism.
4.8.1.2 Hazard Control Practices and Employees Performance
The table 4.22 indicated that there was a weak negative relationship which was statistically
significant between hazard control practices and employee performance in beverage
manufacturing firms in Nairobi City County of Kenya (r=-0.173, p=0.029<0.05). These
showed that an increase in hazard control practices leads to decrease in employee performance
in beverage manufacturing firms in Nairobi City County of Kenya. The findings are in contrast
with a study conducted by Gbadgo et al. (2017) on the impact of OHS measures on employee
performance in Tongu District Hospital in Ghana which revealed that PPE, administrative
control and engineering controls led to the improvement of employee performance such as
increased in staff morale, job satisfaction and reduced medical expenses.

110
When hazards are not eliminated or controlled at the workplace, it creates unfavorable working
conditions which demotivates employees leading to decline of employee performance
(Izudi, Ninsima & Alege, 2017).
4.8.1.3 Workplace Safety Inspection and Employee Performance
The table 4.22 indicates that there was a strong positive relationship which was statistically
significant between workplace safety inspection and employee performance in beverage
manufacturing firms in Nairobi City County of Kenya (r=0.822, p=0.000<0.05). It indicates
that an increase in workplace safety inspection led to an increase in employee performance at
beverage manufacturing firms in Nairobi City County of Kenya. The research findings are in
contrast with a study conducted by Oluoch (2015) on effect of occupational safety and health
programmes on employee performance at Kenya Power Limited Company which indicated
that health and safety inspection was statistically insignificant and negatively related with the
employee performance.
However, the research findings were supported by a study conducted by Okumu et al. (2018)
the effect of occupational health and safety inspection on employee performance in sugar
companies in Kakamega County of Kenya which revealed that workplace safety inspection
influenced employee performance. Furthermore, the finding were also supported by Holmes,
Lingard and Yesilyurt (2017) who argued that workplace safety inspection assists the HSR to
identify and scrutinize all the potential hazards at the workplace and eliminate them thus
ensuring conducive working environment for employees leading to improvement in employee
performance.

111
4.8.1.4 Safety Record and Employee Performance
The table 4.22 shows that there was a moderate positive relationship which was statistically
significant between safety records and employee performance in beverage manufacturing firms
in Nairobi City County of Kenya (r=0.457, p=0.000<0.05). This showed that an increase in
safety records led to an increase in employees’ performance in beverage manufacturing firms
in Nairobi City County of Kenya, however, the relationship was moderate.
The finding of the study concurs with a case study that was conducted by Okoli and Onuigbo
(2014) which revealed that record keeping helps to improve the efficiency of record officers
in Nigerian University. The research findings were also further supported by Bailey and
Vidyarthi (2016) who argued that employees have the right to access safety records that are
relevant to their working environment, these assists employees to know the kind of hazards
and risk likely to encountered at the workplace and therefore employees are in good position
to behave safely leading to reductions of accidents and thus low absenteeism rate at the
workplace. From the table 4.22 correlation analysis between OHSP and employee
performance, the research concludes that workplace safety inspection influences employee
performance in beverage manufacturing in Nairobi City County of Kenya most, while hazard
control practices influence the least.
4.8.2 Multiple Linear Regression Analysis
The multiple linear regression analysis was undertaken to determine whether OHSP such as
safety training practices, hazard control practices, workplace safety inspection and safety
record) can predict employee performance in beverage manufacturing firms in Nairobi City
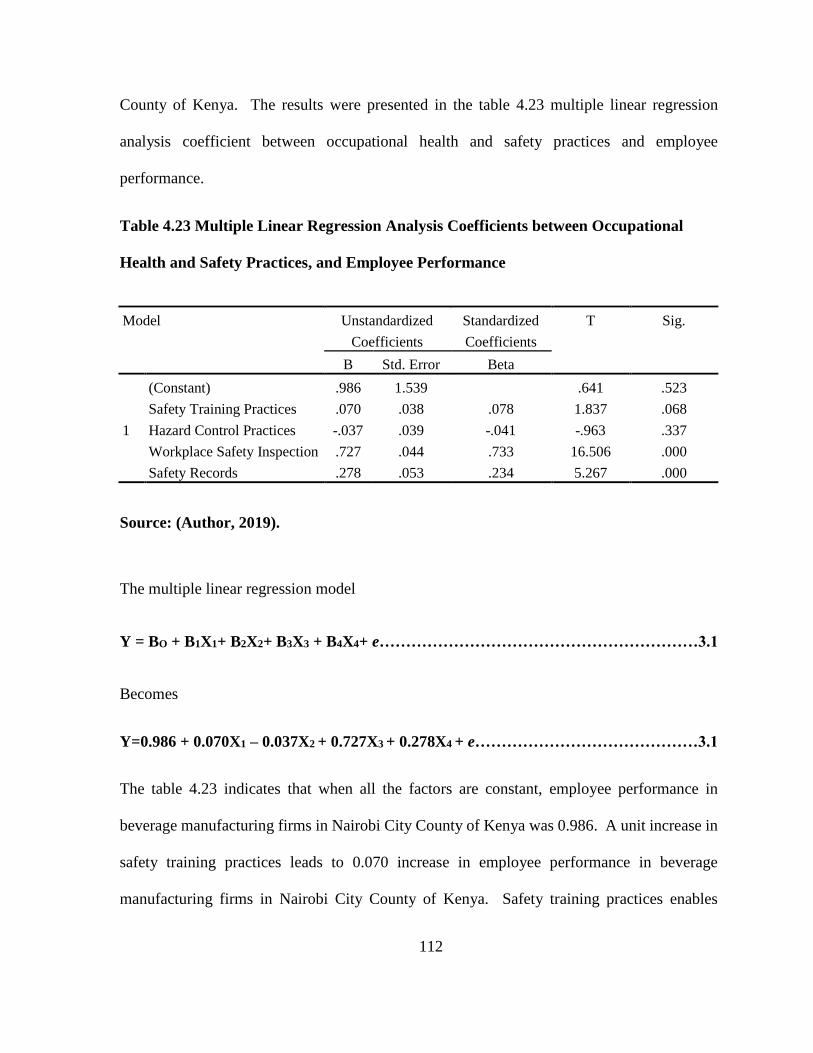
112
County of Kenya. The results were presented in the table 4.23 multiple linear regression
analysis coefficient between occupational health and safety practices and employee
performance.
Table 4.23 Multiple Linear Regression Analysis Coefficients between Occupational
Health and Safety Practices, and Employee Performance
Model Unstandardized
Coefficients
Standardized
Coefficients
T Sig.
B Std. Error Beta
1
(Constant) .986 1.539 .641 .523
Safety Training Practices .070 .038 .078 1.837 .068
Hazard Control Practices -.037 .039 -.041 -.963 .337
Workplace Safety Inspection .727 .044 .733 16.506 .000
Safety Records .278 .053 .234 5.267 .000
Source: (Author, 2019).
The multiple linear regression model
Y = BO + B1X1+ B2X2+ B3X3 + B4X4+ e……………………………………………………3.1
Becomes
Y=0.986 + 0.070X1 – 0.037X2 + 0.727X3 + 0.278X4 + e……………………………………3.1
The table 4.23 indicates that when all the factors are constant, employee performance in
beverage manufacturing firms in Nairobi City County of Kenya was 0.986. A unit increase in
safety training practices leads to 0.070 increase in employee performance in beverage
manufacturing firms in Nairobi City County of Kenya. Safety training practices enables

113
employees to operate conveyor belts and forklift safely and therefore reducing accidents and
injuries and furthermore, increasing the delivery of the raw materials and beverage products
and thus increase in the level of employee performance (Ayim, 2003). Furthermore, Bell
(2004) argued that safety training practices provides employees with necessary safety skills
which can enable them to repair and maintain machines and equipment and therefore reducing
accidents and injuries that are caused by defective machines and equipment. However, Kanu
(2015) stated that when safety training are offered by incompetent trainer employees will be
equipped with unnecessary safety skills especially where employees operate machines and
equipment inappropriate manner leading to high occurrences of accidents and injuries, and
thus high absenteeism at the workplace.
A unit increase in hazard control practices leads 0.037 decrease in employee performance in
beverage manufacturing firms in Nairobi City County of Kenya. When employees are
provided with oversized PPE, it will reduce their working pace, thus reduction in the
production of the quality of the product and delivery of the products (Abdelhamid & Everett,
2008). However, Huang et al. (2008) stated that PPE prevent employees from contaminating
raw materials and therefore employees are in position to produce high quality products and
thus increase in employee performance.
A unit increase in workplace safety inspection leads to 0.727 increase in employee
performance in beverage manufacturing firms in Nairobi City County of Kenya. Workplace
safety inspection enables HSR to identify blood fluids, bacteria and viruses and therefore HSR
are able to suggest hazard control practices such as wearing of PPE and maintaining good

114
house practices and it will ensure that the raw materials are not contaminated and therefore,
employees are capable of producing high quality products (Choudhray et al., 2003). However,
Zhou, and Fang (2004) argued that in a situation where the HSR are unable identify new
hazards that exist at the workplace it can lead to accumulation of hazards such as wet floor,
exposed electric wires and unlabeled chemicals and these can lead to frequent occurrences of
accidents and injuries at the workplace leading to increase in absenteeism among employees.
A unit increase in safety records leads to 0.278 increase in employee performance in beverage
manufacturing firms in Nairobi City County of Kenya. Duranti and Abdullah (2008) noted
that the accurate information from safety records can be used by the organization to coach
employees and therefore they will work safely by observing standard operating procedures,
these will reduce the rate of accidents at the workplace leading to low absenteeism. The
research concludes that workplace safety inspection contributed most to employee
performance, while hazard control practices contributed the least.
4.8.3 Moderated Multiple Regression Analysis
The moderated multiple regression analysis was undertaken to determine whether the
moderating variable (OHS Law) statistically significantly moderates the relationship between
OHSP and employee performance in beverage manufacturing firms in Nairobi City County of
Kenya.

115
Table 4.24 Model Summary for Moderated Multiple Regression Analysis between
Occupational Health and Safety Practices, Occupational Health and Safety Law, and
Employee Performance
Model R R Square
Adjusted R Square
Std. Error of the
Estimate
Change Statistics
R Square Change
F Change
df1
df2 Sig. F Change
1 .857a .735 .728 2.23704 .735 107.591 4 155 .000
2 .865b .748 .740 2.18957 .013 7.794 1 154 .006
Source: (Author, 2019). The table 4.24 model summary for moderated multiple regression analysis between
occupational health and safety practices, occupational health and safety law and employee
performance shows that value of R2 change was 0.13 (0.13*100%=1.3%) which was the
percentage increase in the variation explained by the addition of interaction term. Furthermore,
the significance F change value was 0.006 which was less than the significance level of 0.05.
Therefore, the research concludes that OHS law statistically significantly moderated the
relationship between OHSP and employee performance in beverage manufacturing firms in
Nairobi City County of Kenya (R2 change=1.3%, F (1,154) =7.794, p=0.006<0.05).
The findings of the study were supported by a study conducted by Wambui (2012) on the extent
of compliance OHS regulations at manufacturing companies in Mombasa County of Kenya
which revealed that majority of manufacturing firms in Mombasa County of Kenya were

116
complying with OHS regulation. Furthermore, Kheni, Dainty, and Gibb (2012) also argued
that when employers comply with OHS laws, employees are definitely going to be provided
with the safe working environment where they are motivated to work leading to increase in
product delivery and also reducing absenteeism at the workplace.
Table 4.25 Moderated Multiple Regression Analysis Coefficient between Occupational
Health and Safety Practices, Occupational Health and Safety Law, and Employee
Performance
Model Unstandardized Coefficients
Standardized Coefficients
t Sig. 95.0% Confidence
Interval for B
Collinearity Statistics
B Std. Error
Beta Lower Bound
Upper Bound
Tolerance VIF
1
Model 1 (Constant)
.986
1.539
.641
.523
-2.054
4.027
Safety Training Practices
.070 .038 .078 1.837 .068 -.005 .146 .939 1.065
Hazard Control Practices
-.037 .039 -.041 -.963 .337 -.113 .039 .927 1.078
Workplace Safety Inspection
.727 .044 .733 16.506 .000 .640 .814 .867 1.154
Safety Records
.278 .053 .234 5.267 .000 .174 .382 .868 1.152
2
Model 2 (Constant)
5.949
2.330
2.553
.012
1.346
10.552

117
Safety Training Practices
-.026 .051 -.029 -.513 .608 -.127 .075 .508 1.970
Hazard Control Practices
-.128 .050 -.143 -2.569 .011 -.227 -.030 .531 1.883
Workplace Safety Inspection
.668 .048 .674 13.937 .000 .574 .763 .700 1.428
Safety Records
.170 .065 .143 2.636 .009 .043 .297 .557 1.797
Interaction Term
.007 .000 .220 2.792 .006 .000 .000 .264 3.794
Source: (Author, 2019).
The moderated multiple linear regression model
Y = Bo + B1X1 + B2X2 + B3X3 + B4X4 + B5X1X2X3X4M + e ……………………………….3.2
Becomes
Y=5.949 - 0.026X1 - 0.128X2 + 0.668X3 + 0.170X4 + 0.007X1X2X3X4M + e………………3.2
The table 4.25 moderated multiple regression analysis coefficient between occupational health
and safety practices, occupational health and safety law and employee performance, model (2)
indicated that when all factors were held constant, employee performance in beverage
manufacturing firms in Nairobi City County of Kenya was 5.949. A unit increase in safety
training practices leads to 0.026 decrease in employee performance in beverage manufacturing
firms in Nairobi City County of Kenya. Brazile (2002) argued that when employees failed to
attend safety training programs, they subject themselves to unsafe working behaviuors such as
failing to wear PPE can lead an individual to be hit by a falling object which can cause severe
118
injuries leading to high absenteeism as employees seek medical attention. Contrary, Athur
(2003) argued that safety training practices enables employees to operate forklift safely and
these enables them to load and unload beverage manufacturing products within the shortest
time and therefore, increasing the delivery of the products and thus increase in employee
performance.
A unit increase in hazard control practices leads to 0.128 decrease in employee performance
in beverage manufacturing firms in Nairobi City County of Kenya. According to Zhang
(2003) engineering control such as machine guards may fail to protect employees against
accidents and injuries leading to high absenteeism at the workplace as employees absent
themselves from work to seek medical attention. On the other hand, Reinhold, Tint and Kiivet
(2006) stated that administrative control limit employee exposure to hazards and it’s achieved
through good housekeeping practices such as keeping the floor dry to prevent slip which can
cause accidents and injuries and therefore reducing absenteeism.
A unit increase in workplace safety inspection leads to 0.668 increase in employee
performance in beverage manufacturing firms in Nairobi City County of Kenya. The HSR has
the responsibility to communicate workplace safety inspection report to management for
coaching purposes and it will assist employees to perform the tasks safely leading to reduced
absenteeism at the workplace and improvement in the delivery of the product (Mahalingam &
Levitt, 2007). On the other hand, Bono et al. (2009) argued that the workplace safety
inspection report can only be effective for coaching purposes when it's actually accurate and
relevant to the working environment.

119
A unit increase in safety record leads to 0.170 increase in employee performance in beverage
manufacturing firms in Nairobi City County of Kenya. Bailey and Vidyarthi (2002) noted that
the accurate information from safety records can be used by the organization to coach
employees and therefore they will work safely by observing standard operating procedures and
in the process producing high quality products. In contrast, Dirking and Kodali (2002) stated
that safety records can only be effective when they are accurate, relevant, timely, complete and
ease for use.
A unit increase in interaction term (OHS Law) leads to 0.007 increase in employee
performance in beverage manufacturing firms in Nairobi City County of Kenya. Shibani and
Saidani (2010) believed that when employers are aware of the severity of the fines and
penalties, they will avoid fines and penalties by providing safety training programs, conducting
workplace safety inspection, hazard control and maintaining safety records and these provide
a clean and tidy environment for employees and therefore, it assist employees to produce and
deliver high quality products. In contrast, Adeyemo and Smallwood (2010) indicated that
where penalties are insignificant, there will be laxity in compliance of OHS legislation,
employers will not provide conducive environment for employees leading frequent occurrence
of accidents and injuries and thus high absenteeism among the employees. The research
concludes that the workplace safety inspection contributed most to employee performance,
while hazard control practices contributed the least.

120
4.9 Testing for Research Hypotheses
The research hypotheses were formulated and analyzed using multiple linear regression
analysis and moderated multiple regression analysis. The hypotheses HO1, HO2, HO3 and HO4
were analyzed using table 4.23 multiple linear regression analysis coefficient between
occupational health and safety practices and employee performance. While hypothesis HO5 was
analyzed using table 4.24 model summary for moderated multiple regression analysis between
occupational health and safety practices, occupational health and safety law and employee
performance. The null hypotheses were rejected or fails to reject at 0.05 level of significance.
4.9.1 Testing for Research Hypothesis HO1
HO1: There is no statistical significant relationship between safety training practices and
employee performance.
The table 4.23 shows the results for safety training practices, (b=0.070, t (160) =1.837,
p=0.068>0.05). The p-value was 0.068 which was greater than the significance level of 0.05,
therefore, the study failed to reject null hypothesis. It therefore, showed that there was no
statistical significant relationship between safety training practices and employee performance.
These implies that safety training practices does not predict employee performance in beverage
manufacturing firms in Nairobi City County of Kenya.
According to Kretchmar (2003) states that when organization conduct safety training practices
that are irrelevant to employees and their working environment, employees may end up
working unsafely by failing to observe standard operating procedures leading to poor quality

121
production of products and therefore reducing employee performance. On the other hand,
Shehu et al. (2005) argued that safety training practices enables employee to acquire safety
skills such as safely handling and disposing off chemicals at the workplace to prevent fire
explosion and thus reducing accidents and injuries at the workplace and furthermore, reducing
absenteeism at workplace. In addition, Alipour and Shahnavaz (2005) stated that where safety
training programs are conducted at the workplace employees will acquire safety skills such as
wearing strip resistant shoes which prevent strip and therefore reducing accidents and injuries
and thus decrease in absenteeism at the workplace.
4.9.2 Testing for Research Hypothesis HO2
HO2: There is no statistical significant relationship between hazard control practices and
employee performance.
The table 4.23 indicates the results for hazard control practices (b=-0.037, t(160)=-0.963,
p=0.337>0.05). The p-value was 0.337 was greater than the significance level of 0.05, therefore
the study failed to reject null hypothesis. It shows that there was no statistical significant
relationship between hazard control practices and employee performance. These implies that
hazard control practices does not predict employee performance in beverage manufacturing
firms in Nairobi City County of Kenya. According to Christian et al. (2003) organization do
not want to control hazards because they see it as additional cost and therefore raw materials
are contaminated with hazards such bacteria and blood fluids and in the process employees’
end up producing low quality products and thus decrease in employee performance. Hazard
control practices such as overheard conveyors sometimes when left unguarded can snag

122
employee clothing or body parts leading to severe injuries which can cause absenteeism as
employees absent themselves from workplace to seek medical attention (Virkkunen, 2005).
However, Saari (2006) stated that automation such as overhead conveyors and forklift
completely eliminate hazards such lifting of heavy objects at the workplace and therefore
reducing back pains among employees and also increasing the speed of delivery of raw
materials and beverage manufacturing products and thus increase in employee performance.
4.9.3 Testing for Research Hypothesis HO3
HO3: There is no statistical significant relationship between workplace safety inspection and
employee performance.
The table 4.23 revealed that workplace safety inspection results (b=0.727, t (160) =16.506,
p=0.000<0.05). The p- value was 0.000 was less than the significance level of 0.05 and
therefore, the study rejected the null hypothesis. It indicates that there was a statistical
significant relationship between workplace safety inspection and employee performance.
These implies that workplace safety inspection statistically significantly predicted employee
performance in beverage manufacturing firms in Nairobi City County of Kenya.
Workplace safety inspection enables employees to identify hazards such as improper labelling
and storage of chemicals and therefore the organizations are in position to label and store
chemicals in proper way therefore preventing fire explosion at the workplace and thus reducing
absenteeism which is associated with accidents and injuries (Keng & Razak, 2002). In contrast,
Zhau and Fang (2004) stated that where workplace safety inspections are conducted by

123
incompetent person, wrong hazard control practices will be implemented leading to
accumulation of new hazards such as viruses and bacteria and employees will fall sick as a
result of contracting diseases leading to high absenteeism at the workplace and thus reduction
in employee performance.
4.9.4 Testing for Research Hypothesis HO4
HO4: There is no statistical significant relationship between safety records and employee
performance.
The table 4.23 indicates the result of safety record (b=0.278, t(160)=5.267, p=0.000<0.05).
The p-value was 0.00 was less than the significance level of 0.05 and therefore, the study
rejected the null hypothesis. It shows that there was a statistical significant relationship
between safety records and employee performance. Therefore, it implies that safety records
statistically significantly predicted employee performance in beverage manufacturing firms in
Nairobi City County of Kenya.
One of the good characteristics of safety records was that it has to be accurate by providing
information that are factual and theses enables the organization to establish the correct hazard
control practice to eliminate or control hazards and therefore employees work in conditions
that are free of accidents and injuries leading to reduced absenteeism that are caused by
sickness and furthermore, employees are able to deliver products to consumer (Cumming, 2006
& Kazan, 2007). On the other hand, Rabinowitz and Hager (2008) reported that safety records
can only be effective when they are relevant to the working environment because each working

124
environment have different hazards and these were as result of machines, equipment and
working procedures.
4.9.5 Testing for Research Hypothesis HO5
The results of the table 4.24 model summary of the moderated multiple regression analysis
between OHSP, OHS law and employee performance were used to test below hypothesis.
HO5: Occupational health and safety law does not moderate the statistical significant
relationship between occupational health and safety practices and employee performance.
The table 4.24 shows the results for interaction term which was the moderating variable (OHS
Law), (R2 change =1.3%, F (1,154) =7.794, p=0.006<0.05). The 1.3% was the percentage
increase in the variation explained by the addition of the interaction term and the increase was
statistically significant (p=0.006<0.05). Therefore, the study rejected the null hypothesis. It
shows that OHS law moderates the statistical significant relationship between OHSP and
employee performance. These implies that OHS law statistically significantly moderates the
relationship between OHSP and employee performance in beverage manufacturing firms in
Nairobi City County of Kenya.
According to Shibani and Saidani (2010) when employer and employees are aware of the
severity of the fines and penalties, they will avoid fines and penalties by engaging in OHSP
such as providing safety training programs, conducting workplace safety inspection, hazard
control and maintaining safety records and these provide a clean and tidy environment for
employees and therefore, employees will be able to produce and deliver high quality products.

125
In contrast, Adeyemo and Smallwood (2010) indicated that where penalties are insignificant,
there will be laxity in compliance of OHS legislation, employers will not provide a conducive
environment for employees leading frequent occurrence of accidents and injuries and thus high
absenteeism among the employees. Moreover, Kalejaiye (2010) believes that enforcement of
OHS regulation doesn’t increase workplace safety because they are not the only steps for
improving OHSP, as improving organization culture can also improve OHSP. Furthermore,
Onyeozili (2010) also stated that the government must reduce the burden of regulation which
preoccupies itself with details but rather it can aim at shaping attitudes and creating
infrastructures for a better organization of OHS by industries own effort.

126
CHAPTER FIVE
SUMMARY, CONCLUSION AND RECOMMENDATIONS
5.1 Introduction
This chapter presents, summary, conclusions, recommendations and areas for further research.
5.2 Summary of the Findings
The purpose of the study was to investigate the influence of occupational health and safety
practices on employee performance in beverage manufacturing firms in Nairobi City County
of Kenya. The target population of the study were 483 employees working in 32 beverage
manufacturing firms located within Nairobi City County of Kenya. The employees included:
32 human resource managers, 32 operation managers and 419 floor staffs. While 32 beverage
manufacturing firms included: 11 spirits, 2 beers, 11 fruit juice, 4 wines, and 4 carbonated soft
drinks. A Krejce Morgan table for sample size was used to determine a sample size of 196. A
multi-stage sampling technique was used to select the sample and it included: 19 human
resource managers, 19 operation managers and 158 factory floor staffs.
A sample survey method was adopted where the semi structured questionnaire was used to
collect qualitative and quantitative data from the respondents. The semi structured
questionnaire was divided into four sections. Section A comprised of demographic information
such as: gender, age, education level, working experience, types of beverage manufacturing
firms and management level. Section B, C and D respectively have questions related to OHSP,
OHS law and employee performance.

127
The research received the authorization letter from Kenyatta University and submitted to
NACOSTI and Nairobi City County of Kenya for the issuance of research permit. The research
proceeded with the data collection after receiving an authorized research letter from the
Ministry of Education, State Department of Early Learning and Basic Education. Piloting was
conducted in one of the beverage manufacturing firms located within Nairobi City County of
Kenya to find out if the measuring instrument can work in real world.
The reliability of the measuring instrument was tested using Cronbach Alpha and the average
reliability of the measuring instrument was 0.827 showing that it was strong and reliable. The
content validity was achieved by providing adequate coverage for each variable in the
measuring instrument. The construct validity achieved through multiple linear regression
analysis and moderated multiple regression analysis. Where the values of multiple correlation
coefficients (R) were 0.857 and 0.865 respectively. The values were closer to one and it shows
that there was a strong relationship between OHSP and employee performance and that is how
construct validity was achieved. The results for the ANOVA test for the relationship between
OHSP and employee performance F (4,155) =107.591, p=0.000<0.05. The p-value was less
than the significant value 0.05, therefore the model was fit for prediction and thus criterion
validity was achieved.
The results for ANOVA for moderated multiple regression analysis between OHSP, OHS law
and employee performance, F (5, 154) =91.405, p=0.000<0.05. The p-value was less than the
level of significance 0.05, therefore the research concludes that the model was fit for prediction
and thus how criterion validity was achieved. The statistical package for social scientist

128
version 21 analyzed the data. The qualitative data analyzed using frequency and percentage
and the information presented in form of statistical tables. The quantitative data analyzed using
frequency, percentage, mean, standard deviation, Pearson correlation coefficient, multiple
linear regression analysis and moderated multiple regression analysis and the information
presented inform of pie charts, bar graphs and statistical tables. The null hypotheses were
rejected or fails to reject at 0.05 significance level.
5.2.1 Summary Descriptive Analysis of Demographic Information of the Respondents
The findings of the research shows that the majority of the respondents who participated in the
study were male representing 61%, while few of the respondents 39% were female. The study
also indicated that the majority of respondents 33% who participated in the study were in the
age group between 26-35 years, while the few of the respondents 17% were in the age group
of 46 years and above. In terms of the highest level of education, the findings of the study
indicated that majority of the respondents 34% who participated in the study had a diploma as
their highest level of education, while few of the respondents had master degrees as their
highest level of education represented by 2%.
The findings of the study indicated that the majority of the respondents 35% who participated
in the study had working experience between 2-5 years, while few of the respondents 17% had
below 1 year working experience. The findings of the research shows that the majority of the
respondents 26% who participated in the study were from spirit manufacturing firms, while
few of the respondents 14% were from the beer manufacturing firms. In terms of management
level, the study indicates that majority of the respondents 79% who participated in the study

129
were factory floor staff, while the few of the respondents represented by 9% were human
resource managers.
5.2.2 Summary of Descriptive Analysis of Occupational Health and Safety Practices
The OHSP such as safety training practices, hazard control practices, workplace safety
inspection, safety record and their improvements were summarized in this section. The
aggregate score for OHSP was (M=3.20, SD=1.0682).
5.2.2.1 Summary of Descriptive Analysis of Safety Training Practices
The research findings indicated that job rotation, coaching, job instruction lecture training
conducted at the workplace had the highest mean with a standard deviation (M=3.66,
SD=0.197). While job rotation, coaching, job instruction and lecture training offered by
competent trainer had the lowest mean with a standard deviation (M=3.09, SD=1.0195). In
addition, the aggregate score for safety practices was (M=3.24, SD=1.0195). When it comes
to improvement of safety training practices, the research findings indicated that majority of the
respondent 37% agreed that there should be provision of feedback in safety training practices,
while few of respondents 11% agreed that safety training practices should be offered by
competent trainer.
5.2.2.2 Summary of Descriptive Analysis of Hazard Control Practices
The findings of the research indicated that administrative control practices had the highest
mean with a standard deviation (M=3.69, SD=1.070), while engineering control practices had
the lowest mean with a standard deviation (M=2.85, SD=1.255). The aggregate score for
hazard control practices was (M=3.14, SD=1.1752). When it comes to improvement of hazard

130
control practices, the research findings indicated that majority of the respondents 33% agreed
that the management should use administrative control, while few of the respondents 11%
agreed that management should provide appropriate PPE.
5.2.2.3 Summary of Descriptive Analysis of Workplace Safety Inspection
The study findings indicated that HSR frequently conducts workplace inspection at the
workplace had the highest mean with a standard deviation (M=3.46, SD=1.069), while
organization monitoring corrective action by assigning responsibility to an individual had the
lowest mean with a standard deviation (M=3.22, SD=1.136). The workplace safety inspection
had an aggregate score of (M=3.32, SD=1.078). When it comes to improvement of workplace
safety inspection, the study indicates that the majority of the respondents 36% agreed that
management should implement the report of workplace safety inspection, while few of the
respondents 9% agreed that there should be frequent workplace safety inspection.
5.2.2.4 Summary of Descriptive Analysis of Safety Records
The study indicates that keeping of safety records in the organization had the highest mean
with a standard deviation (M=3.51, SD=0.997), while record officers trained on record
management skills had the lowest mean with a standard deviation (M=2.94, SD=0.916). The
aggregate score for the safety record was (M=3.09, SD=1.00). On the improvement of safety
records, the findings of the study showed that majority of the respondent 34% agreed that there
should be classification of safety records, while few of the respondent 11% agreed that there
should be frequent update of safety records.

131
5.2.3 Summary of Descriptive Analysis of Occupational Health and Safety Laws
The findings of the study indicated that OHS officers frequently conduct OHS training at the
workplace had the highest mean with a standard deviation (M=3.42, SD=1.019), while fine
and penalties imposed on organization are significant to enforce compliance of OHS law had
the lowest mean with a standard deviation (M=3.05, SD=1.033). On the improvement of OHS
law, the findings of the research indicated that majority of the respondents 32% agreed that
OHS officers should impose fines and penalties on employers for violating OHS law, while
few of the respondents 5% agreed that OHS officer should frequently conduct OHS training at
the workplace.
5.2.4 Summary of Descriptive Analysis of Employee Performance
The findings of the study show that organization frequently talk to customers to find out their
taste and preference had the highest mean with a standard deviation (M=4.00, SD=0.854),
while inspection of carrier vehicle before delivery had the lowest mean with a standard
deviation (M=3.48, SD=1.015). The employee performance had an aggregate score of
(M=3.72, SD=0.804). On the improvement of employees’ performance, the findings indicated
that the majority of the respondents 21% agreed that organization should reward good
attendance, while few of the respondent 5% agreed that the organization should find out the
taste and preference of customers before producing the products.

132
5.2.5 Summary of Inferential Analysis between Occupational Health and Safety
Practices, Occupational Health and Safety Law and Employee Performance
These involves summarizing the correlation analysis, multiple linear regression analysis and
moderated multiple regression analysis between the variables in the study.
5.2.5.1 Safety Training Practices and Employee Performance
A correlation analysis was performed using Pearson correlation of coefficient and it indicates
that there was a weak positive relationship which was statistically significant between safety
training practices and employee performance in beverage manufacturing firms in Nairobi City
County of Kenya (r=0.240, p=0.002<0.05). A regression analysis was performed using
multiple linear regression analysis and it indicated that there was a strong relationship between
safety training practices and employee performance with a multiple correlation coefficient of
R=0.857. The adjusted R2 =72.8% indicates that 72.8% of the variation in employee
performance was explained by safety training practices. The findings also indicated that safety
training practices was not a significant predictor of employee performance in beverage
manufacturing firms in Nairobi City County of Kenya, (b=0.070, t(160)=1.837,
p=0.068>0.05). The table 4.23 multiple linear regression analysis coefficient also indicated
that taking all the factors constant, a unit increase in safety training practices leads to 0.070
increase in employee performance in beverage manufacturing firms in Nairobi City County of
Kenya.

133
5.2.5.2 Hazard Control Practices and Employee Performance
A Pearson correlation of coefficient shows that there was a weak negative relationship which
was statistically significant between hazard control practices and employee performance in
beverage manufacturing firms in Nairobi City County of Kenya (r=-0.173, p=0.029<0.05).
The Multiple linear regression analysis coefficient between OHSP and employee performance
also indicated that there was a strong relationship between hazard control practices and
employee performance with a multiple correlation coefficient of R=0.857. The adjusted
R2=72.8% of the variation in employee performance was explained by hazard control practices.
The findings also showed that hazard control practices were not significant predictor of
employee performance in beverage manufacturing firms in Nairobi City County of Kenya
(b=-0.037, t (160) =-0.0963, p=0.337>0.05). The table 4.23 multiple linear regression analysis
coefficient between OHSP and employee performance also shows that taking all the factors
constant, a unit increase in hazard control practices leads to 0.037 decrease in employee
performance in beverage manufacturing firms in Nairobi City County of Kenya.
5.2.5.3 Workplace Safety Inspection and Employee Performance
The findings of the study showed that there was a strong positive relationship which was
statistically significant between workplace safety inspection and employee performance at
beverage manufacturing firms in Nairobi City County of Kenya (r=0.822, p=0.000<0.05). A
multiple linear regression analysis coefficient between OHSP and employee performance
showed that there was a strong relationship between workplace safety inspection and employee
performance with a multiple correlation coefficient of R=0.857. It also indicated adjusted R2

134
=72.8% of the variation in employee performance that can be explained by workplace safety
inspection.
The findings also indicated that the workplace safety inspection statistically significantly
predicted employee performance in beverage manufacturing firms in Nairobi City County of
Kenya (b=0.727, t(160)=16.506, p=0.000<0.05). The table 4.23 multiple linear regression
analysis coefficients between OHSP and employee performance also indicated that taking all
the factors constant, a unit increase in workplace safety inspection leads to 0.727 increase in
employee performance in beverage manufacturing firms in Nairobi City County of Kenya.
5.2.5.4 Safety Record and Employee Performance
The research findings indicated that there was a moderate positive relationship which was
statistically significant between safety records and employee performance in beverage
manufacturing firms in Nairobi City County of Kenya (r=0.457, p=0.000<0.05). The multiple
linear regression analysis coefficients between OHSP and employee performance also
indicated that there was a strong relationship between safety records and employee
performance in beverage manufacturing firms in Nairobi City County of Kenya with a multiple
correlation coefficient of R=0.857. The multiple linear regression analysis coefficients
between OHSP and employee performance also shows that adjusted R2=72.8% of the variance
in employee performance was explained by safety records.
The results also indicated that safety records statistically significantly predicted employee
performance in beverage manufacturing firms in Nairobi City County of Kenya (b=0.278,

135
t(160)=5.267, p=0.000<0.05). The table 4.23 multiple linear regression analysis coefficients
between OHSP and employee performance indicates that taking all the factors constant, a unit
increase in safety records leads to 0.278 increase in employee performance in beverage
manufacturing firms in Nairobi City County of Kenya.
5.2.5.5 Moderating Effect of Occupational Health and Safety Laws on the Relationship
Between Occupational Health and Safety Practices and Employee Performance
The results from moderated multiple regression analysis between OHSP, OHS law and
employee performance indicated the value of R2 change was 1.3% which is the percentage
increase in the variation explained by the addition on interaction term (OHS law). In addition,
the significant F. change value for interaction term was 0.006 less than the significance level
of 0.05. Therefore, it shows that interaction term (OHS Law) statistically significantly
moderates the relationship between OHSP and employee performance in beverage
manufacturing firms in Nairobi City County of Kenya (R2 change=1.3%, F (1,154) =7.794,
p=0.006<0.05).
The table 4.25 moderated multiple regression analysis coefficients between OHSP, OHS law
and employee performance, model (2) indicates that when all factors were held constant,
employee performance in beverage manufacturing firms in Nairobi City County of Kenya was
5.949. A unit increase in safety training practices leads to 0.026 decrease in employee
performance in beverage manufacturing firms in Nairobi City County of Kenya. A unit
increase in hazard control practices leads to 0.128 decrease in employee performance in
beverage manufacturing firms in Nairobi City County of Kenya. A unit increase in workplace

136
safety inspection leads to 0.668 increase in employee performance in beverage manufacturing
firms in Nairobi City County of Kenya. A unit increase in safety record leads to 0.170 increase
in employee performance in beverage manufacturing firms in Nairobi City County of Kenya.
A unit increase in interaction term (OHS Law) leads to 0.007 increase in employee
performance in beverage manufacturing firms in Nairobi City County of Kenya.
5.3 Conclusion
In terms of demographic information of the respondents. The research concludes that the
majority of the respondents who participated in the study were male, while few of the
respondents were female. These were attributed by manufacturing industry attracting more
males than females because most of the activities are manual and requires masculinity. The
study concludes that the majority of respondents who participated in the study were in the age
group between 26-35 years, while the few of the respondents were in the age group of 46 years
and above. These were attributed by majority of manufacturing firm’s employing young and
energetic people who can perform masculinity work.
The study concludes that majority of the respondents who participated in the study had a
diploma as their highest level of education, while few of the respondents had master degrees
as their highest level of education. The study concludes that the majority of the respondents
who participated in the study had working experience between 2-5 years, while few of the
respondents had below 1 year working experience. An experienced worker will work
cautiously than the newly employed employee because they are aware of the hazards and risk
they encounter at the workplace.

137
The research concludes that the majority of the respondents who participated in the study were
from spirit manufacturing firms, while few of the respondents were from the beer
manufacturing firms. The study concludes that there were more spirit manufacturing firms in
Nairobi City County of Kenya. The study concludes that majority of the respondents who
participated in the study were factory floor staff, while the few of the respondents were human
resource managers. The study concludes that manufacturing was the core function of beverage
manufacturing firms and therefore, it has more workers than any other department in the
organization.
Safety training practices, the study concludes that the majority of the respondent agreed that
job rotation, coaching, job instruction and lecture training were conducted at the workplace.
While few of the respondents agreed that job rotation, coaching, job instruction and lecture
training were offered by competent trainers. The research concludes that average score for
safety training practices was neutral indicating that majority of respondents in the beverage
manufacturing firms in Nairobi City County of Kenya had different opinions regarding safety
training practices. Furthermore, when it comes to improvement of safety training practices,
the study concludes that majority of the respondent agreed that there should be provision of
feedback in safety training practices, while few of respondents agreed that safety training
practices should be offered by competent trainer.
The study concludes that there was a weak positive relationship which was statistically
significant between safety training practices and employees’ performance in beverage
manufacturing firms in Nairobi City County of Kenya. These shows that an increase in safety

138
training practices leads to an increase in employee performance in beverage manufacturing
firms in Nairobi City County of Kenya. However, the study failed to reject the null hypothesis.
It shows that there was no statistical significant relationship between safety training practices
and employee performance. The research concludes that safety training practices does not
predict employee performance in beverage manufacturing firms in Nairobi City County of
Kenya.
These were contributed by lack of feedback which demotivated employees to attend safety
training programmes, therefore, they were unable to acquire skills and knowledge leading to
decline in their performance. The objective and goals of the safety training practices were not
clear therefore, employees were provided with specifics skills and knowledge that were
indirectly related to their job requirement leading to a decline in their employee performance.
The majority of the trainers were not committed to offer safety training practices because they
were production worker and these interfered with their attention to provide safety training to
employees and therefore, employees were not equipped with right skills and knowledge leading
to declining in employee performance.
In terms of Hazard control practices, the research concludes that majority of the respondents
agreed that administrative control practices were used at the workplace to control hazards,
while few of the respondents agreed that engineering control practices were used to control or
eliminate hazards at the workplace. The aggregate score for hazard control practices was
neutral, indicating that majority of the respondents were neutral when it comes to hazard
control practices in the beverage manufacturing firms in Nairobi City County of Kenya. When

139
it comes to improvement of hazard control practices, the study concluded that majority of the
respondents agreed that the management should use administrative control, while few of the
respondents agreed that management should provide appropriate PPE.
The research also concludes that there was a weak negative relationship which was statistically
significant between hazard control practices and employee performance in beverage
manufacturing firms in Nairobi City County of Kenya. It shows that an increase in hazard
control practices led to decrease in employee performance in beverage manufacturing firms in
Nairobi City County of Kenya. In addition, the study failed to reject the null hypothesis and
therefore, it implies that there was no statistical significant relationship between hazard control
practices and employee performance. The research therefore, concludes that hazard control
practices does not predict employee performance in beverage manufacturing firms in Nairobi
City County of Kenya. These were contributed by beverage manufacturing firms not providing
employees with PPE to protect them against workplace hazards such as extreme weather
conditions, wet floors and sharp objects which lead to high occurrence of accidents at the
workplace leading to high absenteeism rate at the workplace.
Workplace safety inspection, the study concludes that majority of the respondents agreed that
HSR frequently conducts workplace inspection at the workplace, while few of the respondents
agreed that the organization monitored the corrective action by assigning responsibility to
individuals. The study concludes that the aggregate score for the workplace safety inspection
was moderate indicating that majority of the respondents were neutral regarding workplace
safety inspection in beverage manufacturing firms in Nairobi City County of Kenya. When it

140
comes to improvement of workplace safety inspection, the study concludes that the majority
of the respondents agreed that management should implement the report of workplace safety
inspection, while few of the respondents agreed that there should be frequent workplace safety
inspection.
The research also concludes that there was a strong positive relationship which was statistically
significant between workplace safety inspection and employee performance in beverage
manufacturing firms in Nairobi City County of Kenya. This shows that an increase in
workplace safety inspection lead to increase in employee performance in beverage
manufacturing firms in Nairobi City County of Kenya. The study rejected the null hypothesis,
it shows that there was a statistical significant relationship between workplace safety
inspection and employee performance. Therefore, the research concludes that workplace safety
inspection statistically significantly predicted employee performance in beverage
manufacturing firms in Nairobi City County of Kenya. These were achieved through beverage
manufacturing firms conducting a workplace safety inspection, communicating workplace
safety inspection report to management, use of a checklist and task observation during
workplace safety inspection. Furthermore, the beverage manufacturing monitored corrective
action. Therefore, the research concludes that employees in beverage manufacturing firms in
Nairobi City County of Kenya were provided with suitable working conditions and therefore,
they were motivated to work leading to increase in their performance.
Safety record, the research concludes that majority of the respondent agreed that there was
keeping of safety records in the organization, while few of the respondent agreed that record

141
officers were trained on record management skills. The aggregate score for the safety record
was moderate indicating that majority of the respondent had different opinions regarding safety
record in beverage manufacturing firms in Nairobi City County of Kenya. On the
improvement of safety records, the research concludes that majority of the respondents agreed
that there should be classification of safety records, while few of the respondent agreed that
there should be frequent update of safety records.
The study also concludes that there was a moderate positive relationship which was statistically
significant between safety records and employee performance in beverage manufacturing firms
in Nairobi City County of Kenya. It implies that an increase in safety record lead to an increase
in employee performance in beverage manufacturing firms in Nairobi City County of Kenya.
The study rejected the null hypothesis, it indicates that there was a statistical significant
relationship between safety records and employee performance. The research concludes that
safety records statistically significantly predicted employee performance in beverage
manufacturing firms in Nairobi City County of Kenya. These were contributed by the frequent
recording of OHS activities, updating and classification of safety records. The safety records
were also kept in good conditions and record officers were trained on record management
skills. The research concludes that workplace safety inspection contributed most in employee
performance, while hazard control practices contributed the least. The aggregate score for
OHSP was moderate and the study concludes that majority of respondents were neutral when
it comes OHSP in beverage manufacturing firms in Nairobi City County of Kenya.

142
The OHS law, the study concludes that majority of the respondents agreed that OHS officers
frequently conduct OHS training at the workplace, while few of the respondents agreed that
fine and penalties imposed on organization were significant to enforce compliance of OHS
law. The aggregate score of OHS law had a neutral score. Therefore, the research concludes
that majority of the respondents were neutral when it comes to OHS law in beverage
manufacturing firms in Nairobi City County of Kenya. On the improvement of OHS law, the
study concludes that majority of the respondents agreed that OHS officers should impose fines
and penalties on employers who are violating OHS law, while few of the respondents agreed
that OHS officer should frequently conduct OHS training at the workplace.
The research rejected the null hypothesis, these indicates that OHS law statistically
significantly moderates the relationship between occupational health and safety practices and
employee performance. The research concludes that OHS law statistically significantly
moderates the relationship between OHSP and employee performance in beverage
manufacturing firms in Nairobi City County of Kenya. These were contributed by OHS
officers conducting safety training programs and imposing fines and penalties on employers
who were violating OHS laws. Moreover, the fines and penalties imposed on employers for
violating OHS laws were significant and therefore employers were forced to provide a
conducive working environment for employees and in return, it boosted employee
performance. The OHS officers frequently hand over the report of workplace safety inspection
to management, therefore the management was in a position to eliminate and control hazards
at the earliest time possible and these prevented the occurrences of accidents leading to
reduction of absenteeism at the workplace. The research concluded that workplace safety
143
inspection contributed most to employee performance, while safety training practices
contributed the least.
In terms of employee performance, the study concludes that majority of the respondents agreed
that organization frequently talk to customers to find out their taste and preference, while few
of the respondent agreed that there was inspection of carrier vehicle before delivery. The study
concludes that aggregate score for employee performance was neutral indicating that majority
of the respondents were neutral when it comes to employee performance in beverage
manufacturing firms in Nairobi City County of Kenya. When it comes to improvement of
employee performance, the research concludes that the majority of the respondents agreed that
organization should reward good attendance, while few of the respondent agreed that the
organization should find out the taste and preference of customers before producing the
products.
5.4 Recommendations
There are several recommendations for practice, policy, methodology and theory.
5.4.1 Policy
The study recommends that DOSHS should impose heavy fines and penalties on employers
who are violating OHS law. The DOSHS should also ensure that fines and penalties imposed
on employers for violating OHS law are significant. The study also recommends that the
DOSHS should ensure that OHS officers frequently hand over report of workplace safety

144
inspection to the employer. The DOSHS should ensure that OHS officers frequently conduct
OHS training programs at the workplaces.
5.4.2 Practice
The study also recommends that the employer should ensure that HSR frequently conducts
workplace safety inspection. The employers should ensure that HSR use checklist during
workplace safety inspection. The employers should also ensure that workplace safety
inspection report is communicated to the management for coaching purposes. The employers
should train HSR on workplace safety inspection procedures and implement the report of
workplace safety inspection. The employer should ensure frequent update and classification of
safety records. The study recommends that the employer should ensure that safety records are
kept in proper conditions and record officers train on record management skills.
The study also recommends that the employer should reward good attendance and inspect
carrier vehicles before delivery. The employers should ensure that products are packed in
suitable containers and labelled appropriately before delivery. The employers should have
working schedules to accommodate differing employee need. The employer should adhere to
the production process and also talk to customers to find out their taste and preferences.
5.4.3 Methodology
The study recommends that experimental research design should be adopted in the study. The
variables of the study such as, workplace safety inspection, safety records, OHS law and
employee performance should be operationalized so that they can be measured quantitatively.

145
The study recommends that the target population should be employees working in beverage
manufacturing firms located in Nairobi City County of Kenya and such includes: Human
resource managers, operation managers and factory floor staff. The beverage manufacturing
firms should include: carbonated soft drinks, fruit juice, beer, wine and spirit manufacturing
firms. The study recommends that Krejce Morgan table should determined the sample size of
the respondents. The study also recommends that multi stage sample technique should be used
to select sample size of the study.
The study recommends that sample survey method should be adopted when distributing semi
structured questionnaire to respondents in beverage manufacturing firms in Nairobi City
County of Kenya. Before data collection, the study recommends that an authorized letter
should be obtained from Kenyatta University and submitted to NASCOSTI and Nairobi City
County of Kenya for the issuance of research permit. The research also recommend that a pilot
study should be conducted before the actual study. Furthermore, the study recommends that
reliability and validity of the measuring instrument, and diagnostic tests should be conducted
before analyzing the data.
The research recommends that quantitative data from demographic information of the
respondents should be analyzed using descriptive statistics such as percentages and the
information should be presented inform of pie charts and bar graphs. The study recommends
that the qualitative data on the improvement of workplace safety inspection, safety record,
OHS law and employee performance should be analyzed using descriptive statistics such as
frequency, percentage and the information should be presented inform of statistical tables.

146
The research also recommends that quantitative data from workplace safety inspection, safety
record, OHS law and employee performance should be analyzed using descriptive and
inferential statistics such as mean, standard deviation, Pearson correlation of coefficient,
multiple linear regression analysis and moderated multiple regression analysis. And the
information should be presented in form of statistical tables. The research recommends that
the null hypotheses should be rejected or fail to reject at 0.05 significance level. The research
also recommends that there should be equal gender representation in the research and
furthermore, no one should be forced to participate in the study. The study recommends that
confidentiality of respondents should be adhered to by distributing anonymous semi structured
questionnaires.
5.4.4 Theory
The research recommends that the following theories should be adopted in the study: resource
based view theory, institutional theory, goal setting theory of motivation and Herzberg’s two
factors theory of motivation. The research recommends that theories should be linked to the
variables of the study: workplace safety inspection, safety record, OHS law and employee
performance. The study recommends that Herzberg two factor theory of motivation should
anchor the study. The research recommends that theories adopted in the study should have
assumptions. The research also recommends that there should be a critique for each theory
adopted in the study and furthermore, each theory should be supported by empirical studies.

147
5.5 Areas for Further Research
The research was limited to OHSP and employee performance in beverage manufacturing
firms in Nairobi City County of Kenya. The study brought out four factors of OHSP and such
includes: safety training practices, hazard control practices, workplace safety inspection and
safety records. Future scholars should focus on other OHSP that influence employee
performance and such may include: employee wellness programs, OHS policies, emergency
procedures, provision of health services, health and safety committees, safety procedures,
safety supervision and risk assessment analysis.
The study also brought out three factors of OHS laws: awareness of OHS laws, penalties and
fines, and government inspection. Future scholars should focus on other factors of OHS laws
and such includes: skills of OHS officers, political influence, government funding the activities
of OHS officers, bribery and corruption, and provision of OHS information by the government
of the day. The study also brought out three indicators of employee performance and such
includes: quality of the product, delivery of the product and absenteeism. The future scholars
should focus on other indicators of employee performance such as: staff morale, stress, job
satisfaction, medical expenses, labour turnover, complaints from workmates and averagely
week work. Future scholars should also focus on the type and quality of machines used in
firms that influence employee performance. The study was limited to beverage manufacturing
firms located within Nairobi City County of Kenya, future scholars should conduct similar
studies to other beverage manufacturing firms located in various counties in Kenya.

148
Furthermore, the future scholars should also conduct similar studies to other sectors such as
the construction sector, energy sector, mining sector and transport sector.

149
REFERENCES
Abdelhamid, T. S., & Everett, J. G. (2008). Identifying root causes of construction accidents. Journal Construction Engineer Management, 126(1), 52–60.
Awino, Z.B., Ogaga, B.J., & Muchuki, V.N. (2017). Corporate strategy and performance of Kenya companies. Archives of Business Research, 5(2) 37-51.
Abudayyeh, O., Fredericks, T. C., Butt, S. E., & Shaar, A. (2006). An investigation of management’s commitment to construction safety. International Journal of Project Management, 24(1), 167–174.
Achilike, A. N., & Okwuanaso, S. (2001). Competencies expected of national diploma accounting graduates of polytechnics as perceived by employers of labour. Journal of Business and Office Education, 1(20), 44–48.
Adeogun, B. K., & Okafor, C. C. (2013). Occupational health and safety envronment trend in Nigeria. International of Environment and Engineering Research, 2(1), 24–29.
Adeogun, B. K., & Okafor, C. C. (2010). Occupational health safety and environment (HSE) trend in Nigeria. International Journal of Environmental Science, Management and Engineering Research, 2(1), 24–29.
Adeyemo, O., & Smallwood, J. (2010). Impact of occupational health and safety legislation on performance improvement in the Nigerian construction industry. Procedia Engineering, 196(2), 785–791.
Agarwal, R., Angst, C., & Magn, M. (2009). The performance effects of coaching: a multilevel analysis using hierarchical linear modeling. The International Journal of Human Resource Management, 20(10), 2110–2134.
Akinola, G.O., & Akinboloa, A. (2014). Motivational strategies and enhancement of employee performance in the Nigerian beverage industry. Global Journal of Management and Business Research, Adminstration and Management 14(6), 27-89.
Akssou, J.A.Y., & Palm, R. (2013). Impact of data structure on the estimators r-square adjusted r-square in linear regression. International Journal of Mathematics and Computation, 20(3), 85-91.
Agbenorku, P., Graft, J., Owusu, N., & Esenam, A. (2005). Traumatic injuries among printing press workers in Kumasi, Ghana. Journal of Medicine and Medical Sciences, 1(9), 426–
432.

150
Agerfalk, P. J. (2002). Getting pragmatic. European Journal of Information Systems, 19(3), 251–256.
Agumba, J., Pretorius, J. H., & Haupt, T. (2014). Health and safety management practices in small and medium enterprises in the South African construction industry. International Journal of Academic Research in Accounting, Finance and Management Sciences, 5(2), 66–88.
Ahrens, A., & Zaščerinska, J. (2014). Factors that influence sample size in educational research. Education in a Changing Society, 1(20), 19–32.
Ahrne,G., & Brunsson, N. (2005). Organizations and meta-organizations. Scandinavian Journal of Management, 44(9), 708–740.
Akmal, K., Lumpur, K., Norzaimi, M., Ani, C., & Lumpur, K. (2011). Investigation the effective of the hazard identification, risk assessment and determining control ( HIRADC ) in manufacturing process. International Journal of Innovative Research In Advanced Engineering , 2(8) 1-6.
Alexopoulos, E. C. (2014). Introduction to multivariate regression analysis. Quarterly Medical Journal, 14(1), 23–88.
AlHeresh, R., LaValley, M. P., Coster, W., & Keysor, J. J. (2017). Construct validity and scoring methods of the World Health Organization. Health and work performance questionnaire among workers with arthritis and rheumatological conditions. Journal of Occupational and Environmental Medicine, 59(6), 112–118.
Alipour, M., & Shahnavaz, A. (2005). A Study of on the job training effectiveness : empirical
evidence of Iran. International Journal of Business Management, 4(11), 63–68.
Alise, M. A., & Teddlie, C. (2012). A continuation of the paradigm wars prevalence rates of methodological approaches across the social behavioral sciences. Journal of Mixed Methods Research, 4(2), 103–126.
Allen, T.D., Smith, M.A., O’shea, P.G., Mael, F.A., & Eby, L. T. (2009). Organization level
mentoring and organizational, performance within substance abuse centers. Journal of Management, 35(2), 1113–1128.
Alquraan, F. I. (2011). Job rotation and its impact on administrative employees performance in UNRWA-Gaza Field Office (Unpublished research project) Islamic University of Gaza.
Ahmad,I., & Sattar, A. N. (2016). occupational health and safety in industries in developing world. Gomal Journal of Medical Sciences, 14(4), 223–227.

151
Alstyne, M., & Brynjolfsson, E. (2005). Global Village or cyber balkans modeling and measuring the integration of electronic communities. Management Sciences, 51(6), 851–
868.
Alvero, A. M., Struss, K., & Rapport, E. (2008). Measuring safety performance: a comparison of whole, partial, and momentary time-sampling recording methods. Journal of Organizational Behavior Management, 27(4), 1–28.
Ana, G., & Palis, P. A. Q. (2003). Value in the resource-based view of the firm: a contribution to the debate. The Academy of Management Review, 26(4), 114.
Asendorpf, J.B., Conner, M., De Fruyt, F., De Houwer, J., Fiedler, K., & Perugini, M. (2013). Recommendations for increasing replicability in psychology. European Journal of Personality, 27(1), 108 – 119.
Asmus, S., Karl, F., Mohnen, A., & Reinhart, G. (2015). The impact of goal-setting on worker performance - empirical evidence from a real-effort production experiment. Procedia CIRP, 26(2), 127–132.
Azar, P., & Shafighi, A. (2013).The effect of work motivation on employess job performance. International Journal of Academic Research in Business and Social Sciences, 3(9).20-90.
Amir, M., Nisar, W., Ali, S., & Zameer, H. (2014). The impact of motivation on employees performance in beverage industry in Pakistan. International Journal of Academic Research in Accounting, Finance and Management Science, 14(1), 293-298.
Asr, A., Zikri,M., Hassan,N.K., Norizan,N., & Junaimah, J. (2007). Employee organisation commitment in smes:evidence from manufacturing sector in Malaysia, International Review of Business Research Paper, 3(2), 12-26.
Adela, Y., Noreen, E., & Thomas, J. (2012). A descriptive study of research published in scientific nursing journals from 1985 to 2010. International Journal of Nursing Studies, 49(9), 12–21.
Bailey, S., & Vidyarthi, J. (2010). Human-computer interaction: the missing piece of the records management puzzle. Records Management Journal, 20(3), 279–290.
Barling, J., Loughlin, C., & Kelloway, K. (2002). Development and test of a model linking safety-specific transformational leadership and occupational safety. Journal of Applied Psychology, 87(1), 488–496.
Barney, J. B. (2007). Is the resource-based view a useful perspective for strategic management research. Academy of Management Review, 26(1), 41–56.

152
Basden, A. (2002). The critical theory of herman dooyeweerd. Journal of Information Technology, 17(4), 257–269.
Baskerville, R., & Myers, M. D. (2004). Special issue on action research in information systems: making IS research relevant to practice foreword. MIS Quarterly, 28(3), 329–
335.
Baah, D. (2010). Occupational health and safety: key issues and concerns in Ghana. International Journal of Business and Social Science, 2(14), 1–8.
Baum, J.R., & Locke, E. A. (2004). The relationship of entrepreneurial traits, skill, and motivation to subsequent venture growth. Journal of Applied Psychology, 89(1), 587–
598.
Behm, M. (2010). Environmental research safety, health and environmental research managing editor. Journal of Safety, Health and Environmental Research, 7(1), 1–35.
Besley, T., & Burgess, R. (2008). Can labour regulation hinder economic performance evidence from India. Quaterly Journal of Economics, 119(1), 91–134.
Bono, J., Purvanova, R.K., Owler, A.J., & David, B. (2009). A survey of executive coaching practices. Personnel Psychology, 62(2), 361–404.
Bowles, S., Cunningham, C.J.L., Rosa, G.M.D., & Picano, J. (2007). Coaching leaders in middle and executive management: goals, performance, buy-in. Leadership and Organization Development Journal, 25(8), 300–388.
Bowling, A. (2017). Mode of questionnaire administration can have serious effects on data quality. Journal of Public Health, 3(1), 281–291.
Bradbury, J. C. (2009). Regulatory federalism and workplace safety: evidence from OSHA enforcement, 1981-1995. Journal of Regulatory Economics, 29(2), 211–224.
Brown, S.P., Jones, E., & Leigh, T. (2005). The attenuating effect of role overload on relationships linking self-efficacy and goal level to work performance. Journal of Applied Psychology, 90(1), 972–979.
Caelli, K., Ray, L., & Mill, J. (2003). Clear as mud toward greater clarity in generic qualitative research. International Journal of Qualitative Methods, 2(2), 1–49.
Cassell, C., Symon, G., Buehring, A., & Johnson, P. (2014). The role and status of qualitative methods in management research, an empirical account. Management Decision, 44(2), 290–303.

153
Choudhray, R. M., Fang, D., & Ahmed.S.M. (2003). Safety management in construction: best practices in Hong Kong,. Journal of Professional Issues in Engineering Education and Practice, 56(2), 20–32.
Christian, M. S., Bradley, J. C., Wallace, J. C., & Burke, M. J. (2003). Workplace safety: a meta-analysis of the roles of person and situation factors. Journal of Applied Psychology, 94(1), 1103–1127.
Christopher, M. (2005). Meaningful motivation for work motivation theory. Journal of Management Review, 1(2), 235–238.
Choudhray, N., & Sharma, B. (2014). Impact of employee motivation on employee performance in private Organisation. International Journal of Business Trends and Technology, 2(4), 1-7.
Chan, A., & Yam, M. (2012). Emperical study to investigate the difficulties of implementing safety practices in the repair and maintenace sector in Hong Kong. Journal of Construction Engineering and Management, 138(7), 844-877.
Campbell, A., & Gillian,M.(2004). Flowing through the process:flow charts provide a visualised represenattion of an organisation process. Quality Magazine, 43(6),6-50.
Casper,W.J., & Harris,C.M.(2008). Work life benefits and organisational attachement: self interest utility and signaling theory models, Journal of Vactional Behaviour,72(3), 95-109.
Davis, G. F. (2011). The rise and fall of finance and the end of the society of organizations. Academy of Management Perspectives, 23(3), 27–44.
Decreamer, A., Smolders, C., & Vanderstraeten, A. (2012). The impact of institutional pressures on employee performance management systems in higher education in the low countries. British Journal of Management, 23(1), 88–103.
Deniz, M. S., & Alsaffar, A. (2017). Assessing the validity and reliability of a questionnaire on dietary fibre-related knowledge in a Turkish student population. Journal of Health, Population and Nutrition, 31(4), 497–503.
Dhanraj, D., & Parumasur, S. B. (2006). Perceptions of the impact of job rotation on employees productivity, the organization and on job security. Corporate Ownership and Control, 11(4), 682–691.
Dirking, B., & Kodali, R. (2008). Strategies for preparing e discovery. Information Management Journal, 42(3), 56–61.
Diugwu, I. A., Baba, D. L., & Egila, A. E. (2003). Effective regulation and level of awareness: an expose of the Nigeria’s construction industry. Open Journal of Safety Science and Technology, 2(1), 140–146.

154
Donovan, J.J., & Williams, K. J. (2008). Missing the mark: effects of time and causal attributions on goal revision in response to goal performance discrepancies. Journal of Applied Psychology, 88(4), 379–390.
Drori, G. S., Höllerer, M. A., & Walgenbach, P. (2013). The globalization of organization and management:issues, dimensions, and themes. Themes and Local Variations in Organization and Management Perspectives on Globalization, 7(1), 3–23.
Duff, W. M., & Harris, V. (2013). Stories and names: archival description as narrating records and constructing meanings. Archival Science, 2(3), 263–285.
Dunn, M. B., & Jones, C. (2013). Institutional logics and institutional pluralism: the contestation of care and science logics in medical education. Administrative Science Quarterly, 55(9), 114–149.
Duranti, L. (2011). The information society : an international journal concepts, principles, and
methods for the management of electronic records concepts, principles, and methods. An International Journal, 23(2), 37–41.
Dwomoh, G., Owusu, E. E., & Addo, M. (2005). Impact of occupational health and safety policies on employees’ performance in the Ghana’s timber industry: evidence from
Lumber and Logs Limited. International Journal of Education and Research, 1(12), 1–
14.
Dimara,E., & Skuras, D.(2005). Consumer demand for informative labelling of quality food and drink products: European Union Study. Journal of Consumer Market, 22(2),90-100.
Danish,Q.D., & Usman, A.(2010). Impact of reward recognition on job satisfaction and motivation: an emperical study from Pakistan. International Journal of Business and Management ,5(2), 159-167.
Edwards, J. (2011). Methods for integrating moderation and mediation: a framework using moderated path analysis. Psychological Methods, 12(1), 1-22.
Eldredge, J., & Weagel, E. (2014). Population : CTSA-Affiliated Faculty Members. National Institute of Health, 26(7), 5–11.
Ernst, A. F., & Albers, C. J. (2013). Regression assumptions in clinical psychology research practice a systematic review of common misconceptions. National Institute of Health, 6(1), 1–116.
Ezenwa, A. O. (2004). A Study of fatal injuries in Nigerian factories. Society of Occupational Medicine, 51(8), 485–489.

155
Farooqui, R. U., Ahmed, S. M., Panthi, K., & Azhar, S. (2011). Addressing the issue of compliance with personal protective equipment on construction worksites : a workers
perspective. The International Journal of Construction Education and Research, 3(1), 1–
10.
Fleten, C., Nystad, W., Stigum, H., Skjaerven, R., Lawlor, D. A., Davey, S. G., & Naess. (2014). Parent-offspring body mass index associations in the Norwegian mother and child cohort study: a family-based approach to studying the role of the intrauterine environment in childhood adiposity. American Journal of Epidemiology, 176(2), 83–92.
Foss, N. J., & Knudsen, T. (2004). The resource-based tangle: towards a sustainable explanation of competitive advantage. Journal of Managerial and Decision Econmics, 24(4), 291-307.
Fellows, D., & Duff, H.(2011).Well safety measures and occupational hazards in indigenous construction firms. International Journal of Project Management, 20(5), 26–40.
Frazier, P. A., Tix, A. P., & Barron, K. E. (2011). Testing moderator and mediator effects in counseling psychology research. Journal of Counseling Psychology, 51(1), 115.
Flint,D., & GammelGaard, B. (2012). Qualitative research in logistics and supply chain management:beyond justification for using qualitative methods, International Journal of Physical Distribution and Logistic Management, 42(9), 721-725.
Fauziah, W.Y., & Tan,S.K. (2013). Generation differences in work motivation from developing country perspective. International Journal of Economy Management and Social Sciences, 2(4), 97-103.
Gbadago, B. P., Amedome, S. N., & Honyenuga, B. Q. (2017). The impact of occupational health and safety measures on employee performance at the South Tongu District Hospital. Double Blind Peer Reviewed International Research Journal, 17(5), 1–8.
Gerring, J. (2014). What is a case study and what is it good for. American Political Science Review, 98(2), 341-354.
Ghasemi, A., Syedmoradi, L., Zahediasl, S., & Azizi, F. (2010). Pediatric reference values for serum magnesium levels in Iranian subjects. Scandinavian Journal of Clinical and Laboratory Investigation, 70(6), 415–420.
Gnyawali, D. R., & Madhavan, R. (2001). Cooperative networks and competitive dynamics: a structural embeddedness perspective. Academy of Management Review, 26(3), 431–445.
Goles, T., & Hirschheim, R. (2000). The Paradigm is dead long live the paradigm: the legacy of Burrell and Morgan. The International Journal of Management Science, 28(1), 249–
268.

156
Gray, D.E., Ekinci, Y., & Goregaokar, H. (2011). Coaching SME managers: business development or personal therapy. A mixed methods study. The International Journal of Human Resource Management, 22(4), 863–882.
Greenwood, R., Raynard, M., Kodeih, F., Micelotta, E. R., & Lounsbury, M. (2006). Institutional complexity and organizational responses. Academy of Management Annals, 5(7), 317–371.
Gulanowski, J. (2014). Qualitative content analysis. Analysis of web-portals exemplified by the analysis of Polish conservative. Methods and Techniques of Cyberspace Research Theory and Practice, 41(2), 1-153
Gulati, R., Puranam, P., & Tushman, M. (2007). Meta-organization design: rethinking design in interorganizational and community contexts. Strategic Management Journal, 33(5), 571–586.
Gumesson, E. (2014). Qualitative research in marketing: road map for a wilderness of complexity and unpredictability. European Journal of Marketing, 39(4), 309–327.
Gurav, A.M., & Mudalkar, P. K. (2011). A critical study of human resource practices in selected sugar factories. Journal of Management Research, 10(1), 1–46.
Gastwirth, L.J., Gel, R. Y., & Miao. W. (2009). The impact of Levine’s test of equality of
variances on statistical theory and practice. Journal of Statistical Sciences. 24(3), 343–360.
Halinen, A., & Törnroos, J.Å. (2016). Using case methods in the study of contemporary business networks. Journal of Business Research, 58(9), 1279–1285.
Holmes, N., Lingard, H., Yesilyurt, Z., & De Munk, F. (2002). An exploratory study of meanings of risk control for long term and acute effect occupational health and safety risks in small business construction firms. Journal of Safety Research, 30(4), 251–261.
Holmes, N., Lingard, H., Yesilyurt, Z., & De Munk, F. (2017). An exploratory study of meanings of risk control for long term and acute effect occupational health and safety risks in small business construction firms. Journal of Safety Research, 30(4), 251–261.
Hoyt, W. T., Leierer, S., & Millington, M. J. (2003). Analysis and interpretation of findings using multiple regression techniques. Rehabilitation Counseling Bulletin, 49(4), 223–233.
Huang, X., & Hinze, J. (2008). Owners' role in construction safety. Journal of Construction, Engneering and Management, 132(2), 164–173.
Iacovino, L. (2004). Trustworthy shared electronic health records: record keeping requirements and health connect. Journal of Law and Medicine, 12(1), 40–59.

157
Idoro, G. I. (2016, December 1-5). The effect of globalization on safety in the construction industry in Nigeria. In Proceedings of International Symposium on Globalozation and Construction Bangkok, Thailand.
Idowu, O. M., & Iyabo, O. V. (2008). Ensuring a safe working environment in Nigeria reality
or Myth. American Journal of Environmental and Resource Economics, 2(3), 107–115.
Idubor, E. E., & Oisamoje, M. D. (2004). An Exploration of health and safety management issues in Nigeria’s efforts to industrialize. European Scientific Journal, 9(12), 154–169.
Indexed, S., & Sudhakar, R. (2017). Perspectives and the factors influencing effectiveness of training and development on employees performance. International Journal of Civil Engineering and Technology, 8(9), 135–141.
Izudi, J., Ninsiima, V., & Alege, J. B. (2012). Use of personal protective equipment among building construction workers in Kampala, Uganda. Journal of Environmental and Public Health, 2(3), 1-6.
Inguisi,O. (2009). Motivation related values across cultures. African Journal of Business Management,Vol.3(4), 141-150.
Indris, A., & Wan, F.(2012). Does motivational factors influnece organisation commitment and effectiveness. a reveiew of literature, Journal of Business Management and Economics, 3(1), 1-9.
Jaccard, J., Guilamo,R, V., Johansson, M., & Bouris, A. (2006). Multiple regression analysis in clinical child and adolescent psychology. Journal of Clinical Child and Adolescent Psychology, 35(3), 456–479.
Jamshidian, M., & Jalal, S. (2010). Tests of homoscedasticity, normality, and missing completely at random for incomplete multivariate data. Psychometrika, 75(4), 649–674.
Jamshidian, M., & Yuan, K.H. (2013). Data-driven sensitivity analysis to detect missing data mechanism with applications to structural equation modelling. Journal of Statistical Computation and Simulation, 83(7), 1344–1362.
Jan, P. T., Lu, H. P., & Chou, T. C. (2008). The adoption of e-learning: an institutional theory perspective. Turkish online Journal of Educational Technology, 11(3), 326–343.
Jonathan, G., & Mbogo, R. (2008). Maintaining health and safety at workplace: employee and employer’s role in ensuring a safe working environment. Journal of Education and Practice, 7(29), 1–7.

158
Janice,M.,Michael,B.,Karin,O.,Mariam,M.,&Jude,S.(2002).Verification strategies for establishing reliability and validity in qualitative research. International Journal of Qualitative Method, 2(1), 13-22.
Joseph, P., Debowski, S., & Goldschmidt, P. (2012). Paradigm shifts in recordkeeping responsibilities: implications for ISO 15489’s implementation. Records Management Journal, 22(1), 57–75.
Judd, C. M., Kenny, D. A., & McClelland, G. H. (2001). Estimating and testing mediation and moderation in within-subject designs. Psychological Methods, 6(2), 115.
Jacobsen, J.(2012, February 13). Warehouse coping with the growing pains. Sku proliferation increased effecincy in impact storage. Bevarage Industry.
Jinhui,W., Sarah,W., Zhang, H., Dongli, Z., Shroeder, P., & Rogers, P.(2014). Customization of quality practices, the impact of quality culture. The Interantionl Journal of Quality and Reliability Management, 28(2), 263-279.
Judge,T.A., Heller,D., & Mount,K. (2002). Five factor model of personality and job satisfaction: a meta analysis. Journal of Applied Pschology , 87 (1), 530-541.
Jack,E.F.(2008).Response rate and responsiveness for surveys, standards and journal. American Journal of Pharmaceutical Education, 72(2), 43-50.
Judge,T.A., & Llies, R. (2002). Relationship of personality to performance motivation : a meta analysis reveiew. Journal of Applied Psychology , 87(3), 797-807.
Kalejaiye,P.O.(2010). Occupational health and safety: issues, challenges and compensation in Nigeria. Peak Journal of Public Health and Management., 1(2), 16–23.
Karuga, J., Nyong’o, N., Gitu, M. E. O., Namu, A., & Upadhyaya, M. L. O. (2002). regulating competition in Kenya’s beverages industry: issue No.53. Institute of Economic Affairs.
Kheni, N. A., Dainty, A. R., & Gibb, A. (2012). Health and safety management in developing countries: a study of construction SMEs in Ghana. Construction Management and Economics, 26(11), 1159–1169.
Kenya Revenue Authority (2015). Public notice, ISO 9001:2008. Alcoholic beverages manufacturers licensed by Kenya Revenue Authority for the year 2015.
Kanu, R. (2015). Methods of training and development. Innovative Journal of Business and Management, 3(2), 35–41.

159
Katsakiori, P., Sakellaropoulos, G., & Manatakis, E. (2010). Towards an evaluation of accident investigation methods in terms of their alignment with accident causation models. Safety Science, 47(7), 1007–1015.
Kazan, H. P.(2012). Performance evaluation in research and development, intellectual capital, and firm infrastructure projects as intangible assets. African Journal of Business Management, 6(5), 1872–1888.
Kellerman, T. (2014). What are the characteristics of records. International Journal of Public Information Systems, 1(21), 1–22.
Keng, T. A., & Razak, N. A. (2014). Case studies on the safety management at construction site. Journal of Sustainability Science and Management, 9(2), 90–108.
Kheni, N. A., Dainty, A. R., & Gibb, A. (2005). Health and safety management in developing countries: a study of construction SMEs in Ghana. Construction Management and Economics, 26(11), 1159–1169.
Keith, D., & Issac, N. U. (2006). Enforcement of occupational health and safety regulations in Nigeria. European Scientific Journal, 12(1), 93–104.
Kimani1, J. G., & Kung’u, E. G. M. (2017). The status of occupational safety and health and
effectiveness of contractor management programs at Kenya Breweries. Journal of Environment and Earth Science, 6(2), 116.
Kimuyu, G. M. (2014). Factors influencing employee retention a case study of Nairobi Bottlers Ltd (Unpublished research project) The Management University of Africa.
Kin, D., & Bonaventura, H. W. H. (2006). Safety management practices in the Bhutanese construction industry. Journal of Construction in Developing Countries, 11(2), 53–75.
King, B. G., Felin, T., & Whetten, D. A. (2009). Finding the organization in organizational theory: a meta- theory of the organization as a social actor. Organization Science, 21(5), 290–305.
Konya, R. S., Akpiri, R. U., & Orji, N. P. (2013). The use of personal protective equipment (PPE) among workers of five refuse disposal companies within Port Harcourt Metropolis, Rivers State, Nigeria. Asian Journal of Applied Sciences, 1(5), 171–178.
Koopman, C., Pelletier, K. R., Murray, J. F., Sharda, C. E., Berger, M. L., Turpin, R. S., & Bendel, T. (2016). Stanford presenteeism scale: health status and employee productivity. Journal of Occupational and Environmental Medicine, 44(1), 14–20.

160
Kemper, E., & Teddlie, C. (2010). Mandated site based management in Texas: exploring implementation in urban high schools. Teaching and Change, 7(1), 172-200.
Kulkarni, P. (2013). A Literature review on training & development and quality of work life. International Refereed Research Journal, 4(2), 136–143.
Kipchumba,E.H.(2017). Curbing illicit brew in Kenya. International Journal of Law Humanities and Social Sciences, 1(2), 51-57.
Kacel,B., Miller, M., & Norris, D.(2005). Measurement of nurse practioner job satisfaction in mid western state, Journal of American Academy of Nurse Practioners,17(1),27-32.
Kwasi,D., & Amoaki, K.G.(2011). Application of Fredrick Two Factor's Theory in assessing and understanding employee motivation at work, Ghanian perspective, European Journal of Business Management, 3(2), 2-17.
Lameck, W. U. (2016). Sampling design, validity and reliability in general social survey. International Journal of Academic Research in Business and Social Sciences, 3(7), 212–
218.
Lee, F.K., Sheldon, K.M., & Turban, D. (2006). Personality and the goal- striving process: the influence of achievement goal patterns, goal level, and mental focus on performance and enjoyment. Journal of Applied Psychology, 88(2), 256–265.
Leach, L. F., & Henson R. K. (2007). Impact of data structure on the estimators R-square and adjusted R-Square in linear regression. International Journal of Mathematics and Computation 33(1) 1-11.
Lee, F.K., Sheldon, K.M., & Turban, D. (2011). Personality and the goal- striving process: The influence of achievement goal patterns, goal level, and mental focus on performance and enjoyment. Journal of Applied Psychology, 88(1), 256–265.
Leisink, P., & Knies, E. (2011). Line managers’ support for older workers. The International Journal of Human Resource Management, 22(9), 1902–1917.
LePine, J. A. (2005). Adaptation of teams in response to unforeseen change: effects of goal difficulty and team composition in terms of cognitive ability and goal orientation. Journal of Applied Psychology, 90(2), 1153–1167.
Locke, E.A., & Latham, G. P. (2008). Building a practically useful theory of goal setting and task motivation: A 35-year odyssey. American Psychologist, 57(1), 705–717.
Logasakthi, K., & Rajagopal, K. (2011). Study on employee health, safety and welfare measures of chemical industry in the view of Salem Region. International Journal of Research in Business Management, 1(1), 1–10.

161
Louis, W. R. (2008). Moderated multiple regression: work notes and syntax version 5. School of Psychology, 2(1),1-4.
Lindah,E.(2012). Quality investigation of goods in the beverage industry. A case study on continous quality improvement in a warehouse (Unpublished master's thesis) Blekinge Institute of Technology.
Lusweti, S., & Ngugi, P. K. (2014). Determinants of health and safety regulations implementation in sugar manufacturing industry in Kenya. International Journal of Innovative Health care Research, 2(1), 34–50.
Mackinnon, D. P. (2010). A General model for testing mediation and moderation effects. Prevention, 10(2), 87–99.
Marks, P. Z., Jennings, B., Farrell, B., Kennie-Kaulbach, N., Jorgenson, D., Sharpe, J. P., & Waite, N. (2014). I gained a skill and a change in attitude: A case study describing how an online continuing professional education course for pharmacists supported achievement of its transfer-to-practice outcomes. Canadian Journal of University Continuing Education, 40(2), 1-18.
Martimo, K. P., Shiri, R., Miranda, H., Ketola, R., Varonen, H., & Viikari-Juntura, E. (2009). Self-reported productivity loss among workers with upper extremity disorders. Scandinavian Journal of Work, Environment and Health, 35(4), 301–308.
Meyer, M.,Buber, R., & Aghamanoukjan, A. (2011). In search of legitimacy: managerialism and legitimation in civil society organizations.’ Ternational Journal of Voluntary and Nonprofit Organizations, 24(7), 167–193.
Miller, P. G., Johnston, J., Dunn, M., Fry, C. L., & Degenhardt, L. (2010). Comparing probability and non-probability sampling methods in ecstasy research: Implications for the Internet as a research tool. Substance Use & Misuse, 45(3), 437–450.
Miller, R. (2006).Get a grip: strategies and insights for managing electronic records. EContent, 29(8), 38–43.
Murithi,W.C. (2016). Effect of coaching on employee performance in commercial banks : a
case of Standard Chartered Bank of Kenya Limited (Unpublished research project) United States International University Africa.
Mojapelo, J., Mafini, C., & Dhurup, M. (2011). Employee perceptions of occupational health and safety standards in the steel industry. international journal of social sciences and humanity studies online. International Journal of Social Sciences and Humanity Studies, 8(2), 1309–8063.

162
Morwabe, L. B., & Atambo, W. N. (2016). Influence of occupational health and safety practices on employee productivity in Kenya Tea Development Agency: a case of KTDA managed factories in Nyamira County of Kenya. Imperial Journal of Interdisciplinary Research, 2(7), 1-10.
Moyo, D., Zungu, M., Kgalamono, S., & Mwila, C. D. (2015). Review of occupational health and safety organization in expanding economies: the case of Southern Africa. Annals of Global Health, 81(4), 495–502.
Muchiri, F. K. (2008). Occupational health and development in Africa challenges and the way forward. African Newsletter on Occupational Health and Safety, 13(2), 44–46.
Murgan, M. G. (2017). A critical analysis of the techniques for data gathering in legal research. Journal of Social Sciences and Humanities, 1(3), 266–274.
Mwangi, J. W., & Waiganjo, E. (2017). Influence of occupational health and safety on employee s’ performance in the flower industry in kenya: a case study of penta flowers
limited, Thika Sub-County, The Strategic Journal of Business and Change Management, 4(1), 191–208.
Maruta, M., & Rikio, J. (2012). Maximising knowledge work productivity: a time constarined and activity visualised PDCA cycle, Wiley Online Library,19(4), 2013-214.
Mwangilu,J.A.(2014). Factors influencing marketing of alcoholic beverages in Kenya. European Journal of Business and Social Sciences, (2), 51-57.
Mesadag,M.(2014).Culture sensitve adoption of global standardisation the direction usage of hypothese. International Journal Marketing Review, 17(1), 1-60.
Mawoli, A., & Abudsalam,D.(2012). Motivation and job performance of academic staff of state universities in Nigeria. The case of Ibrahim Badamasi Babaginda University , Laipai Niger State. International Journal of Business Management,7(14), 20-40.
Manzoor,Q.A. (2010). Impact of employee motivation and organisational effectiveness .European Journal of Business and Management,3(3), 34-44.
Malik, E. (2008). A study of motivational factors of faculty members at University of Balochistan. Serbian Journal of Management, 5(1), 143-149.
Nderitu,A.M. (2016). Green supply chain management and organisational performance of food and beverage manufacturing firms in Kenya (Unpublised research project) University of Nairobi.
Najeeb, A. (2014). Institutional theory and human resource management, being practical with theory. A Window into Business Research, 3(1), 25–30.

163
Njihia,E., Nzulwa,J., & Kwena,R. (2017). Influence of occupational safety and health on employee productivity in the manufacturing sector in Kenya, Journal of Business Management, 4(4), 1-18.
Ndegwa, P. W., Guyo, W., Orwa, G., Ng’ang’a, R., & Murigi, E. M. (2014). Legal framework as a determinant of implementation of occupational health and safety programmes in the manufacturing sector in Kenya. International Journal of Human Resource Studies, 4(4), 21-35.
Nikolaos, G. (2005). The Measurement of health and safety conditions at work theoretical approaches, tools and techniques a literature review. International Research Journal of Finance and Economics, 36(2), 87–95.
Nyambura, M.C. (2009). Change management practices in the soft drink industry in Kenya: A case of firms operating within Nairobi (Unpublished research project) University of Nairobi.
Nzuve, S. N. M., & Lawrence, B. A. (2012). The extent of compliance with occupational safety and health regulations at registered workplaces in Nairobi. International Journal of Business, Humanities and Technology, 2(2), 115–120.
Nasse.T.(2019). Internal equity and customer relationship management in developing countries: a quantitative and comaprative study of three private companiess in Burkina Fasso. African Journal of Business Management, 13(1), 37-47.
Ohdo, K., Hino, Y., & Takanashi, H. (2007). Study on fall protection from scaffolds by scaffold sheeting during construction. Procedia Engineering, 14(2), 2179–2186.
Okoli,B.E., & Onuigbo,F.N. (2014).Impact of records keeping on office managers’ efficiency
in Nigerian Universities. International Journal of Education Learning and Development, 2(3), 25–31.
Oluoch, E,O. (2015). Effect of occupational health and safety practices on employee performance: a case of Kenya Power Limitedd Company (Unpbulished research project) University of Nairobi.
Okolie, K. C., & Okoye, P. U. (2010). Assessment of national cultural dimensions and construction health and safety climate in Nigeria. Science Journal of Environmental Engineering Research, 2(1), 1–6.
Olutuase, S. O. (2008). A study of safety management in the Nigerian construction industry. Journal of Business and Management, 16(3), 2319–7668.
Onyeozili, E. C. (2010). Obstacles to effective policing in Nigeria. African Journal of Criminology and Justice Studies, 1(1), 32–54.

164
Osborne,W.J., & Walters, E. (2012). Four assumptions of multiple regression that researchers should always test. Practical Assessment Research and Evaluation, 8(2), 1-6.
Omari,R., & Abdallah,M.(2020). Employement potential of the food and beverage sector in Ghana .FARA Research Report, 5(14), 46.
Okumu,J,O., Charles,Y.T., & Patirck,B,O.(2018). The effect of occupational health and safety inspection on employee performance in in sugar companies in Kakamega County of Kenya. Journal of Business Management, 20(9), 5-11.
Oluwatayo,J.(2012).Validility and reliability issues in educational resarch. Journal of Educational and Social Research, 2(1),391-400.
Onyeozili,E.C.(2011).Obstacles to effective policing in Nigeria. African Journal of Criminology and Justice Studies, 2(1), 32-54.
Perren, L., & Ram, M. (2015). Case-study method in small business and entrepreneurial research. International Small Business Journal, 22(1), 83–101.
Pouliakas, K., & Theodossiou, I. (2003). An inquiry into the theory, causes and consequences of monitoring indicators of health and safety at work. European Scientific Journal, 3(9), 120-149.
Priem, R. L., & Butler, J. E. (2001). Is the resource-based view a useful perspective for strategic management research. Academy of Management Review, 26(1), 22–40.
Puplampu, B. B., & Quartey, S. H. (2004). Key issues on occupational health and safety practices in Ghana. International Journal of Business and Social Science, 3(19), 151-155.
Peteraf, M., & Bergen, M.(2003). Scanning dynamic competitive landscape. A market based and resource based framework. Strategic Management Journal, 24(1), 1027-1041.
Quartey,E.T,& Darkwah.S.(2019). Factors affecting the use of modern technologies in agro processing in Ghana. Academia Journal of Agriculture,3(7), 99-115.
Rabinowitz, R. S., & Hager, M. M. (2000). Designing health and safety: workplace hazard regulation in the United States and Canada. Cornell International Law Journal, 33(2), 374–434.
Rachiotis, G., Alexopoulos, C., & Drivas, S. (2010). Occupational exposure to noise, and hearing function among electro production workers. Auris Nasus Larynx, 33(2), 381–385.
Ramazan,K., Kaynak,U, Tuygun, T., & Meral, T. (2016). Effects of occupational health and safety practices on organizational commitment, work alienation, and job performance: using the PLS-SEM approach. International Journal of Business and Management, 11(5), 1–20.

165
Rantanen, J., Lehtinen, S., & Savolainen, K. (2006). The opportunities and obstacles to collaboration between the developing and developed countries in the field of occupational health. Toxicology, 198(2), 63–74).
Rattray, J., & Jones, M. C. (2009). Essential elements of questionnaire design and development. Journal of Clinical Nursing, 16(2), 234–243.
Reinhold, K., Tint, P., & Kiivet, G. (2009). Risk assessment in textile and wood processing industry. International Journal of Reliability, Quality and Safety Engineering, 13(2), 115–125.
Reynolds, M. R., & Keith, T. Z. (2007). Spearman’s law of diminishing returns in hierarchical
models of intelligence for children and adolescents. Intelligence, 35(3), 267–281.
Richard, O. C., Murthi, P. S., & Ismail, K. (2007). The impact of racial diversity on intermediate and long-term performance: The moderating role of environmental context. Strategic Management Journal, 28(12), 1213–1233.
Riege, A. M. (2013). Validity and reliability tests in case study research: a literature review with hands‐on applications for each research phase. Qualitative market research: An International Journal, 6(2), 75–86.
Rotich, L. C., & Kwasira, J. (2007). Assessment of success factors in the implementation of occupational health and safety programs in tea firms in Kenya: A case of Kaisugu Tea Factory. International Journal of Economics, Commerce and Management, 3(5), 797–
812.
Rowley, J. (2014). Designing and using research questionnaires. Management Research Review, 37(3), 308–330.
Reisch,L., Eberle,U.,& Lorek,S.(2013). Sustainable food consumption: an overview of contemporary issue and policies. Sustainability: Science Pratice and Policy,9(2), 7-25.
Roercecke,M.,Obot.I., & Rehm, J.(2019). Volume of alcohol consumption,patterns of drinking and burden of diesaes in Sub Saharan Africa. Africal Journal of Drugs and Alcohol Studies,7(1), 22-29.
Saari, A., Tissari, T., & Valkama, E.S. (2006). The effect of a redesigned floor plan, occupant density and the quality of indoor climate on the cost of space, productivity and sick leave in an office building. Building and Environment, 41(2), 1961–1972.
Saks, A.M.,& Gruman, J. A. (2011). Organizational socialization and positive organizational behaviour: implications for theory, research, and practice. Canadian Journal of Administrative Sciences Revue Canadienne Des Sciences de l’Administration, 28(2), 14–
26.

166
Schneiberg, M. (2012).What’s on the path dependence, organizational diversity and the problem of institutional change in the U.S. economy. Socio-Economic Review, 5(1), 47–
80.
Seijts, G.H., Latham, G.P., Tasa, K., & Latham, B. W. (2005). Goal setting and goal orientation: An integration of two different yet related literatures. Academy of Management Journal, 47(1), 227–239.
Shehu, M., Subramaniam, C., & Johari, J. (2016). The effect of safety training and workers involvement on healthcare workers safety behavior : the moderating role of consideration
of future safety consequences. International Journal of Business Management, 1(2), 46–
81.
Sheik,S., & Sankar,S.P. (2004). Hazard identification, risk assessment and risk control. International Journal of Industrial Engineering, 2(3), 1–4.
Shehu, J.J., Hwang, J.S.,& Wang, J.D. (2005). Diagnosis and momentary quantification of occupational injuries by indices related to human capital loss: analysis of a steel company as an illustration. Accident Analysis and Prevention, 32(2), 435–443.
Shipilov, A. V., Greve, H. R., & Rowley, T. J. (2012). When do interlocks matter Institutional logics and the diffusion of multiple corporate governance practices. American Journal of Sociology, 101(7), 993–1027.
Spanos, Y. E., & Lioukas, S. (2005). An examination into the causal logic of rent generation: contrasting Porter’s competitive strategy framework and the resource-based perspective. Strategic Management Journal, 22(10), 907–934.
Srivastava, M. S., & Dolatabadi, M. (2009). Multiple imputation and other resampling schemes for imputing missing observations. Journal of Multivariate Analysis, 100(9), 1919–1937.
Stan, L., Mərəscu-Klein, V., Neagoe, L., & Tecəu, A. (2006, April 19-21). KPI performance indicators for evaluating employees on industrial production lines. Proceedings of the International Conference of DAAAM Baltic. Tallinn, Estonia.
Suddaby, R. (2009). Challenges for institutional theory. Journal of Management Inquiry, 19(1), 14–20.
Swuste, P., Gulijk, C. Van., & Zwaard, W. (2008). Safety metaphors and theories, a review of the occupational safety literature of the US, UK and The Netherlands, till the first part of the 20th century. Safety Science, 48(8), 120-140.
Sokovic, M., Pavlectic,D., & Kern, P.K.(2010). Quality improvement methodologies PDCA cycle radax matrix DMAIC and DFSS. Journal of Achievement in Materials and Manufacturing Enginering, 43(1) , 476-48.3

167
Sutton,J., & Kpteney,B.(2012). Arise of middle class in East and Southern Africa: implications for food system transformation, Journal of International Development , 27(5),628-646.
Taderera, H. (2012). Occupational health and safety management systems: institutional and regulatory frameworks in Zimbabwe. International Journal of Human Resource Studies, 2(4), 99.
Samar,R. (2017). Research design methods: a systematic review of resrach paradigms , sampling issues and instrument develoment. International Journal of Economics and Management Sciences, 6(2), 1-6.
Shibani, M. A., & Saidani, M. A. (2010). Health and safety influence on the construction project performance in United Arab Emirates. Journal of Civil Engineering and Construction Technology, 4(2), 32–44.
Tagbotor, D. P., Adzido, R. Y. N., & Agbanu, P. G. (2014). Analysis of records management and organizational performance. International Journal of Academic Research in Accounting, Finance and Management Sciences, 5(2), 1–16.
Tait, R., & Walker, D. (2008). Motivating the workforce: the value of external health and safety awards. Journal of Safety Research, 31(4), 243–251.
Teddlie, C., & Yu, F. (2010). Methods sampling. Journal of Mixed Methods Research, 1(1), 77–100.
Thao, T. L. T., & Hwang, C. J. (2007). Factors affecting employee performance evidence from petrovietnam engineering. Journal of Management Research, 21(3), 21–33.
Thornton, P. H. (2011). The rise of the corporation in a craft industry: conflict and conformity in institutional logics. Academy of Management Journal, 45(5), 81–101.
Turóczy, Z., & Marian, L. (2012). Multiple regression analysis of performance indicators in the ceramic industry. Procedia Economics and Finance, 3(12), 509–514.
Tan,T., & Waheed. A. (2011). Herzberg motivation hygiene theory and job satisfaction on Malaysia Retail Industry Sector: the mediating effect of love of money. Asian Academy of Management Journal,16(1), 73-94.
Umeokafor, N., Isaac, D., Jones, K., & Umeadi, B. (2012). Enforcement of occupational safety and health regulations in Nigeria: an Exploration. European Scientific Journal, 3(1), 1857–7881.
Umeokafor, N., Umeadi, B., Jones, K., & Igwegbe, O. (2012). Compliance with occupational safety and health regulations in Nigeria’s public regulatory entity. International Journal of Scientific and Research Publications, 4(1), 2250–3153.

168
Uyanık, G. K., & Güler, N. (2013). A study on multiple linear regression analysis. Procedia Social and Behavioral Sciences, 106(3), 234–240.
Vignoli, M., Punnett, L., & Depolo, M. (2008). How to measure safety training effectiveness towards a more reliable model to overcome evaluation issues in safety training. Chemical Engineering Transactions, 36, 67–72.
Virkkunen, H. K.T. (2005). Long-term effect of occupational noise on the risk of coronary heart disease, Scandinavian Journal of Work, Environment and Health ,31(4), 291–299.
Vrontis,D.(2014). Intergrating adoption and standardisation in international marketing, the adopt standard modelling process. Journal of Market Managemnt, 19(1), 283-305.
Wahab, S. R. A., Rajab, A., Shaari, R., Rahman, S.A., & Saat, M. M. (2005). Manipulation of safety training practices on organizational safety performance: an evidence in Malaysia’s
Automotive Industry. International Journal of Trade, Economics and Finance, 5(1), 110–
113.
Wall, T. D., Michie, J., Patterson, M., Wood, S. J., Sheehan, M., Clegg, C. W., & West, M. (2004). On the validity of subjective measures of company performance. Personnel Psychology, 57(1), 95–118.
Wei, L. Q., & Lau, C. M. (2007). Market orientation, HRM importance and competency: Determinants of strategic HRM in Chinese firms. International Journal of Human Resource Management, 16(10), 1901–1918.
White,D,M. (2014). ISO 15489 a tool for records management in mergers. Information Management Journal, 38(5), 39–44.
Wiese, B.S., & Freund, A. M. (2010). Goal progress makes one happy, or does it longitudinal findings from the work domain. Journal of Occupational and Organizational Psychology, 78(2), 1–19.
Williams, M., Grajales, C. A. G., & Kurkiewicz, D. (2013). Assumptions of multiple regression: Correcting two misconceptions. Practical Assessment, Research and Evaluation, 18(11), 1–14.
Woods, S., & Holman, D. (2008). Human resource management and performance in UK Call Centres. British Journal of Industrial Relation, 44(1), 99–124.
Wambui, A. G. (2012). The extent of compliance with occupational safety and health regulations at manufacturing companies in Mombasa County (Unpublished research project) University of Nairobi.
World Health Organisation Regional Office for Africa. (2005). Occupational health and safety in the African Region . Congo Brazzaville.

169
Wright, P. M., & Kehoe, R. R. (2008). Human resource practices and organizational commitment: a deeper examination. Asia Pacific Journal of Human Resources, 46(1), 6–
20.
Wang, Y., & Romano, L. R. (2017). Comparing the performance of approaches for testing the homogeneity of variance assumption in one-factor ANOVA models. Journal of Educational and Psychological Measurement, 77(2), 305–329.
Weyman, A.K., & Clarke, D. D.(2002). Invsetigating the influence of organisation role on perceptions of risk in deep coal mines, Journal of Applied Psychology,88(2), 404-412.
Yearta, S. K., Maitlis, S., & Briner, R. B. (2006). An exploratory study of goal setting in theory and practice: a motivational technique that works. Journal of Occupational and Organizational Psychology, 68(2), 237–252.
Yapadithaya, P.S., & Stewart, J.(2003). Corporate training and development policies and practices: a cross sectinal national study of India and Britain. International Journal of Training and Development, 7(2), 108-123.
Zaugg, R., & Thom, N. (2008). Excellence through implicit competencies: human resource management organisational development knowledge creation. Journal of Change Management, 3(3), 199–211.
Zhang, H., Chi, S., & Yang, J. (2001). Development of a safety inspection framework on construction sites using mobile computing. Journal of Management in Engineering, 33(3), 20–55.
Zhang, Y., Wang, K., & Zhang, R. (2011). Theoretical research on hazards and accident prevention. Procedia Engineering, 26, 16–24.
170
Appendix 1
Letter of Transmission for Data Collection
Dear respondent,
I am a post graduate student at Kenyatta University pursuing Master of Science in Human
Resource Management in the department of Business Administration, School of Business. I
am carrying out a research on the Occupational Health and Safety Practices Influence on
Employee Performance in Beverage Manufacturing Firms in Nairobi City County of
Kenya. The aim of the study is to investigate effect of occupational health and safety practices
on employee performance in beverages manufacturing firms in Nairobi City County of Kenya.
Your organization has been identified as one of the respondents for my research. You are
therefore kindly requested to fill in the questionnaire and the information given will be used
for academic purpose only and it will be treated with confidentiality. The filled questionnaires
should be returned within one week of submission.
Yours faithfully
Paul Santana
+254711461446 or +254782138631
D58/CTY/PT/24708/2013

171
Appendix II
Questionnaire
SECTION A: GENERAL BACK GROUND INFORMATION
Please answer the following questions by ticking appropriately.
1. Gender Female
Male
2. Age groups in years
a) 18-25
b) 26-35
c) 36-45
d) 46 and above
3. Highest level of education
a) Certificate
b) Diploma
c) Higher National Diploma
d) Bachelor Degree.
e) Master’s Degree
4. How long have you worked for the organization?
a) Below 1 year
b) Between 2-5 years
c) Between 6-10 years
d) Above 11 years

172
5) Please indicate the nature of your business
a) Spirit manufacturing firm
b) Fruit juice manufacturing firm
c) Wine manufacturing firm
d) Beer manufacturing firm
e) Carbonated soft drinks
6) Which level of management do you belong to?
a) Human resource manager
b) Operation manager
c) Factory floor staff
SECTION B: INDEPENDENT VARIABLE, OCCUPATIONAL HEALTH AND SAFETY PRACTICES.
Please rate the following statement by indicating the extent they apply to your organization by ticking in the appropriate box.
Key 5= Strongly Agree
4= Agree
3= Neutral
2= Disagree
1= Strongly Disagree
SAFETY TRAINING PRACTICES 5 4 3 2 1
7. Job rotation, coaching, job instruction and lecture practices are conducted at the workplace.
8. Job rotation, coaching, job instruction are evaluated at the workplace.
9. Job rotation, coaching, job instruction and lecture training have clear goals and objectives.
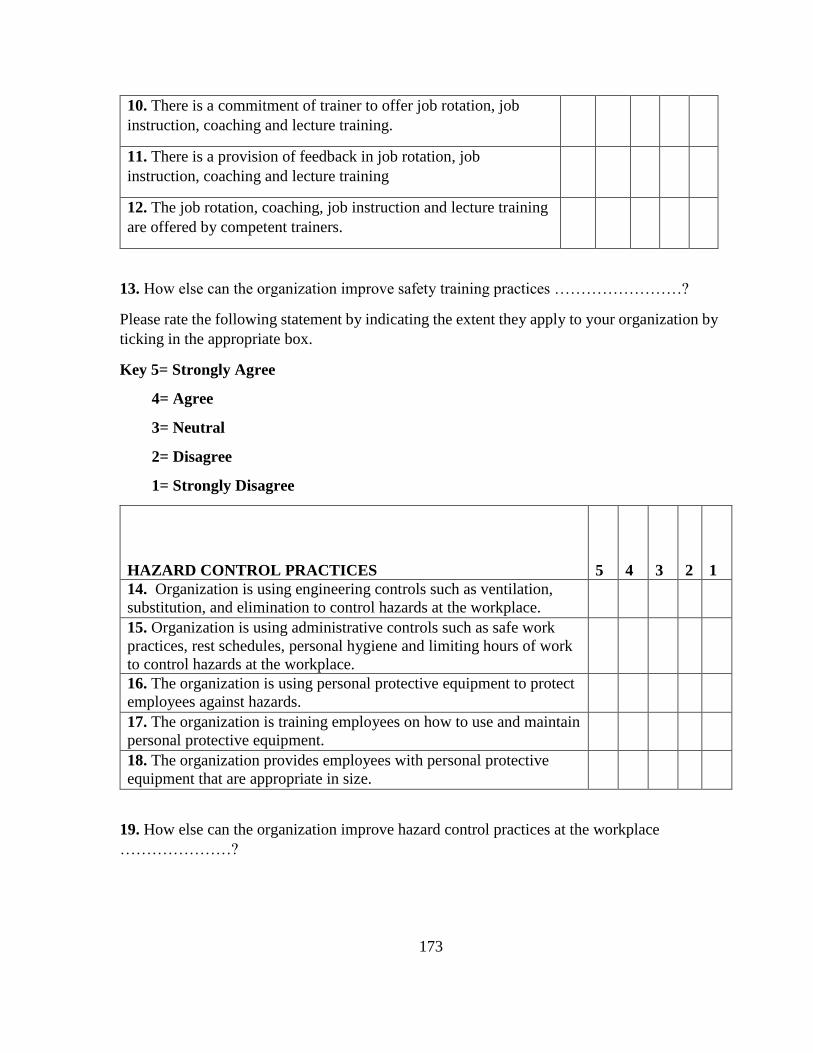
173
10. There is a commitment of trainer to offer job rotation, job instruction, coaching and lecture training.
11. There is a provision of feedback in job rotation, job instruction, coaching and lecture training
12. The job rotation, coaching, job instruction and lecture training are offered by competent trainers.
13. How else can the organization improve safety training practices ……………………?
Please rate the following statement by indicating the extent they apply to your organization by ticking in the appropriate box.
Key 5= Strongly Agree
4= Agree
3= Neutral
2= Disagree
1= Strongly Disagree
HAZARD CONTROL PRACTICES
5
4
3
2
1
14. Organization is using engineering controls such as ventilation, substitution, and elimination to control hazards at the workplace.
15. Organization is using administrative controls such as safe work practices, rest schedules, personal hygiene and limiting hours of work to control hazards at the workplace.
16. The organization is using personal protective equipment to protect employees against hazards.
17. The organization is training employees on how to use and maintain personal protective equipment.
18. The organization provides employees with personal protective equipment that are appropriate in size.
19. How else can the organization improve hazard control practices at the workplace …………………?
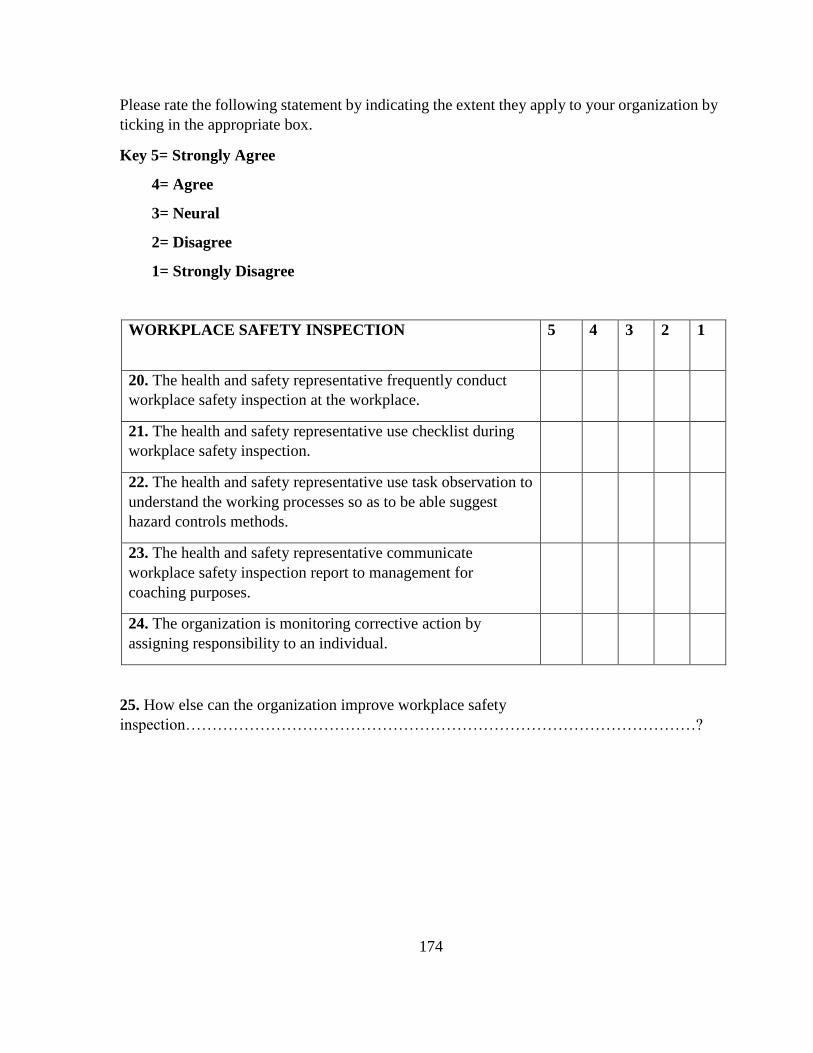
174
Please rate the following statement by indicating the extent they apply to your organization by ticking in the appropriate box.
Key 5= Strongly Agree
4= Agree
3= Neural
2= Disagree
1= Strongly Disagree
WORKPLACE SAFETY INSPECTION 5 4 3 2 1
20. The health and safety representative frequently conduct workplace safety inspection at the workplace.
21. The health and safety representative use checklist during workplace safety inspection.
22. The health and safety representative use task observation to understand the working processes so as to be able suggest hazard controls methods.
23. The health and safety representative communicate workplace safety inspection report to management for coaching purposes.
24. The organization is monitoring corrective action by assigning responsibility to an individual.
25. How else can the organization improve workplace safety inspection……………………………………………………………………………………?

175
Please rate the following statement by indicating the extent they apply to your organization by ticking in the appropriate box.
Key 5= Strongly Agree
4= Agree
3= Neutral
2= Disagree
1= Strongly Disagree
31. Suggest ways of improving safety records in your organization …………………………?
SAFETY RECORDS 5 4 3 2 1
26. There are safety records in your organization.
27. There is frequent update of safety records
28. There is classification of safety records in your organization
29. The safety records are kept in a proper conditions.
30. The record officers are trained on record management
skills.

176
Please rate the following statement by indicating the extent they apply to your organization by ticking in the appropriate box.
Key 5= Strongly Agree
4= Agree
3= Neutral
2= Disagree
1= Strongly Disagree
SECTION C: MODERATING VARIABLE
OCCUPATIONAL HEALTH AND SAFETY LAW 5 4 3 2 1
32. The occupational health and safety officers frequently
conduct occupational health and safety training at the workplace.
33. The occupational health and safety officer audit and inspect safety programmes at the workplace.
34. The occupational health and safety officer impose fines and
penalties on employer for contravening the Occupational Safety
and Health Act of 2007 and Work Injury Benefit Act.
35. The fines and penalties imposed on employers are significant
to enforce compliance of occupational health and safety law.
36. The occupational health and safety officers frequently hand
over the workplace safety inspection report to employer.

177
37. Suggest ways of improving occupational health and safety laws in your
organization…………?
Please rate the following statement by indicating the extent they apply to your organization by ticking in the appropriate box.
Key
5= Strongly Agree
4= Agree
3= Neutral
2= Disagree
1= Strongly Disagree
SECTION D: DEPENDENT VARIABLE
EMPLOYEE PERFORMANCE 5 4 3 2 1
38. The organization frequently talk to customers to find about
their tastes and preferences.
39. The organization adhere to production process.
40. Products are usually packed in suitable containers.
41. Products are labelled appropriately before delivery
42. There is inspection of carriers’ vehicles before delivery.
43. The organization rewards good attendance.
44. The organization has been changing working schedules to
accommodate differing employee needs.

178
45. Suggest ways of improving employee performance in your organization………………?
THANK YOU ALL FOR YOUR COOPERATION.

179
Appendix III
List of Beverage Manufacturing Firms in Nairobi City County, Kenya
Source: (Kenya Revenue Authority, 2015 & Nderitu, 2016).
NO. NAME OF THE COMPANY PRODUCT 1 Africa spirit ltd Spirit 2 London Distillers Spirit 3 Platinum Distillers Spirit 4 Patiala Distillers Spirit 5 Zheng Hong Kenya Spirit 6 UDV(Kenya) ltd Spirit 7 Elle Kenya Ltd Spirit 8 Victoria Distillers Spirit 9 Eagle Distillers Spirit 10 Spectre International Ltd Spirit 11 Zesta Industries Spirit 12 East African Breweries Ltd Beer 13 Top Rank Industries Ltd Beer 14 Coca cola juices ltd Fruit Juice 15 Excel chemicals ltd Fruit Juice 16 Kenafric Industries ltd Fruit juice 17 Crown food ltd Fruit juice 18 Miritini Kenya ltd Fruit Juice 19 True food ltd Fruit Juice 20 Premier food industries Ltd Fruit Juice 21 Tri Clover (Kenya) Ltd Fruit Juice 22 Victoria juice ltd Fruit Juice 23 Twin Oaks Ltd Fruit juice 24 Razo Ltd Fruit Juice 25 Kenya Wine Agency Wine 26 Nairobi Vinters Ltd Wine 27 Crywan Enterprises Wine 28 Montana Beverages Wine 29 Nairobi Bottlers Ltd Carbonated Soft drinks 30 Pepsi Cola (East Africa) Ltd Carbonated Soft drinks 31 Anspar Beverages Ltd Carbonated Soft drinks 32 Metro bottling Ltd Carbonated Soft drinks

180

181

182

183

184