novel equations for bioimpedance spectroscopy to calculate
TRANSCRIPT

Yashiro and Kotera Renal Replacement Therapy (2019) 5:7 https://doi.org/10.1186/s41100-019-0203-1
RESEARCH Open Access
Novel equations for bioimpedancespectroscopy to calculate body fluidvolume based on the agreement betweenbody weight and extracellular waterchange before and after hemodialysis as aguide
Masatomo Yashiro* and Hirohisa KoteraAbstract
Background: MLT-550N is a device to measure the body fluid volume based on bioimpedance spectroscopy.When extracellular water (ECW) or total body water (TBW) is measured with MLT-550N before and afterhemodialysis, the change in ECW (ΔECW) or TBW (ΔTBW) is markedly larger than the change in body weight (ΔW).Good agreements between ΔECW and ΔTBW calculated by Moissl equations with ΔW were reported. The aim ofthis study was to develop novel equations to calculate the body fluid volume by modifying Moissl equations.
Methods: A total of 466 measurements of 351 hemodialysis patients were used to develop the novel equations.The equations were based on the agreement between ΔECW and ΔW as a guide. The volume of intracellular waterwas postulated to be constant during hemodialysis. For evaluation of the equations, 5485 measurements of 627patients were used. Agreements between values of two groups were assessed with Lin’s concordance correlationcoefficients. The normal edema ratio (ER = ECW/TBW) corrected with the fat ratio (fcER) according to the parametersof normally hydrated lean and adipose tissues was used as the reference for normal hydration. The fluid status atdry weight was considered to be close to normal. The absolute values of the deviated ratio of actual ER (aER) fromfcER (dER = (aER−fcER)/fcER) were compared. In this study, 1 L of body water corresponded to 1.02 kg of body fluidaccording to a previous report.
Results: The concordance correlations between ΔW and 1.02∙ΔECW or 1.02∙ΔTBW with the novel equations werehigher than with the MLT method or Moissl equations (0.896, 0.596 vs. 0.411, 0.375 or 0.813, 0.411, respectively). Themedian value of dER with the novel equations was the lowest (0.062) compared with those of the MLT methodand Moissl equations (0.164 and 0.144) (p < 0.001).
Conclusions: The agreements between ΔECW or ΔTBW and ΔW were improved by the novel equations comparedwith the MLT method or Moissl equations. Based on the relation between aER and fcER at dry weight, the fluidvolume calculated using the novel equations may be more adequate than those with the MLT method or Moisslequations.
Keywords: Bioimpedance spectroscopy, Body fluid volume, Hemodialysis, MLT-550N
* Correspondence: [email protected] of Medical Engineering, Faculty of Medical Care Sciences, HimejiDokkyo University, Kamiohno 7-2-1, Himeji City, Hyogo 670-8524, Japan
© The Author(s). 2019 Open Access This article is distributed under the terms of the Creative Commons Attribution 4.0International License (http://creativecommons.org/licenses/by/4.0/), which permits unrestricted use, distribution, andreproduction in any medium, provided you give appropriate credit to the original author(s) and the source, provide a link tothe Creative Commons license, and indicate if changes were made. The Creative Commons Public Domain Dedication waiver(http://creativecommons.org/publicdomain/zero/1.0/) applies to the data made available in this article, unless otherwise stated.

Yashiro and Kotera Renal Replacement Therapy (2019) 5:7 Page 2 of 11
BackgroundAccurate assessment of the fluid status of hemodialysis(HD) patients poses great challenges for physicians.Bioimpedance spectroscopy (BIS) is a safe, convenient,and non-invasive method to evaluate the fluid status [1–3]. The basic theory of BIS for body fluid volume mea-surements was previously reported [4, 5]. Since extracel-lular (ECW) and intracellular (ICW) water contain ions,they are conducting and measurement of their volume isbased on their resistance (Re and Ri, respectively). In thewhole-body bioimpedance method, the human body isapproximated as a cylinder. From the resistance-volumerelationship for a single cylinder and Hanai’s mixtureconductivity theory [6] on the effect of non-conductingtissues embedded in the body fluid, ECW is calculatedas:
ECW ¼ Ke∙H2∙W 1=2
Re
� �2=3
ð1Þ
where H is height (cm) and W is body weight (kg).The details of the basic theory and the derivation ofEq. 1 are described in Appendix 1. Some previous re-ports assumed Ke as a constant according to sex [5]. InMoissl equations, personalized Ke is estimated from thebody mass index (BMI) irrespective of sex [7]. A numberof volume equations converting measured resistance andreactance to the body fluid volume have been publishedover the years [4, 5, 7–9]. However, the accuracy of thebody fluid volume values given by these equations hasnot been established.MLT-550N (SK Medical Electronics Co., LTD., Shiga,
Japan) is one of the BIS devices commonly used inJapan. This device provides information on the bodycomposition using whole-body BIS at 140 frequenciesvia electrodes placed on the wrist and ankle. The volumeequations of the MLT method were developed using thefat-free mass determined by dual-energy X-ray absorpti-ometry as a reference [10] (Appendix 2). This device isalso utilized for assessment of the fluid or nutritionalstatus of HD patients. However, when ECW or totalbody water (TBW) is measured with MLT-550N beforeand after a HD session, it is frequently noted that thechange in ECW (ΔECW) or TBW (ΔTBW) is markedlylarger than the change in body weight (ΔW) [11]. Thisquestions the reliability of fluid volume measurementwith MLT-550N in HD patients. As a rule, equations forcalculation of the fluid volume are appropriate for thepopulation in which they were developed, but they areinappropriate for subjects with a different underlyingpathology or variable hydration status [12]. Therefore, itmay be necessary to develop novel equations for the de-termination of the fluid volume using BIS measured byMLT-550N for Japanese HD patients.
It was reported previously that the ultrafiltration volume(UFV), which corresponds to ΔW, closely agrees with thechange in ECW (ΔECW) [13]. In this study, the equationsto calculate ECW and intracellular water (ICW) reportedby Moissl et al. [7] provided better estimation of the bodyfluid volume. Based on this report, we aimed to developnovel equations to calculate the body fluid volume usingbioelectrical impedance data measured via MLT-550N bymodifying the Moissl equations. We only used the agree-ment between ΔW and ΔECW as a guide for the novelequations. This retrospective study was approved by theInstitutional Ethical Review Board of the Himeji DokkyoUniversity (No. 17–04).
MethodsStudy designFirstly, we developed novel equations to calculate thebody fluid volume via BIS using MLT-550N based onthe following assumptions. As mentioned above, we as-sumed that UFV closely agreed with the change in extra-cellular fluid (ECF) before and after hemodialysis (HD)and that intracellular fluid was constant during HD [13,14]. UFV corresponds to the change in body weight (ΔW(kg)). In this study, extracellular fluid (ECF (kg)) was dis-criminated from extracellular water (ECW (L)), becausebody fluid contains minerals and proteins. Based on aprevious report [15], ΔECF is equal to 1.02∙ΔECW.Therefore, the following equation was assumed:
ΔW ¼ ΔECF ¼ 1:02∙ΔECW ð2Þ
where Δ stands for the change before and after HD.Secondly, the actual agreements between ΔECW and
ΔTBW calculated using the novel equations with ΔWwere evaluated. Thirdly, the adequacy of assessment ofthe fluid status at the post-dialysis dry weight (DW) withthe novel equations was compared with that with theMLT method or Moissl equations. DW was determinedclinically by attending physicians based on the physicalsigns, blood pressure, cardiothoracic ratio, serum con-centrations of atrial natriuretic peptide, and othermethods used routinely. It was postulated that the fluidstatus at clinically determined DW was close to the nor-mal hydration status.
Data analysis and statisticsStatistical analyses were performed using EZR [16] basedon R commander. Values are presented as means ±standard deviations or medians with the first and thirdquartiles. Agreements between values of two groupswere assessed with Lin’s concordance correlation coeffi-cients (ρ) [17]. Correlation was estimated by Pearson’scorrelation coefficients (R). Differences between twopaired groups were examined by the paired t test or

Yashiro and Kotera Renal Replacement Therapy (2019) 5:7 Page 3 of 11
Wilcoxon’s signed rank test, if indicated. Differencesamong three corresponding groups were examined bythe Friedman test. Post hoc analysis was performed bythe Bonferroni test.
MeasurementsBioimpedance data were measured using MLT-550N be-fore and after HD. Measurement was performed accord-ing to the attached manual of MLT-550N by experiencedmedical engineers and nurses. The data of the patientstreated in various schedules (morning, afternoon, andnight) of HD were incorporated taking the actual clinicaluse of this device into account. Therefore, the intervalfrom the meal to BIS measurements was not consistent.
Principal for development of novel equationsCalculation of extracellular waterA total of 466 measurements of 351 patients collectedfrom four collaborating institutions were used. The basaldata are shown in Table 1.As expected, 1.02∙ΔECW of the MLT method was mark-
edly greater than ΔW (ρ = 0.320, R = 0.772, Fig. 1a). Theagreement of 1.02∙ΔECW of Moissl equations with ΔWwas confirmed to be higher than that of MLT (ρ = 0.826,R = 0.828, Fig. 1b). Therefore, we decided to develop novelequations by modifying Moissl equations [7] as our pre-liminary plan. Moissl equations were as follows:
ECW Moð Þ ¼ Ke∙H2∙W
12
Re
!23
ð3Þ
Ke ¼ 0:188BMI
þ 0:2883 ð4Þ
Table 1 Patient profile for developing novel equations
Total number of data 466
Total number of patients (male/female) 351 (221/130)
Age (years old) 67.3 (12.3)
Height (cm) 160.7 (10.0)
Dry weight (kg) 57.86 (13.39)
ΔW (kg) 2.42 (1.02)
R0pre (Ω) 480.8 (77.2)
Rinfpre (Ω) 378.4 (69.9)
R0post (Ω) 594.3 (93.7)
Rinfpost (Ω) 440.3 (77.0)
%ECWpre, MLT/Moissl 23.7 (5.4) / 28.3 (3.1)
%ECWpost MLT/Moissl 16.9 (5.2) / 25.3 (3.0)
Subscript indicates the phase of measurement (pre- & post-hemodialysis)Average values (standard deviation) are indicatedΔW body weight change between pre- and post-hemodiaysis, R0 impedanceat zero frequency, Rinf impedance at infinite frequency, %ECW extracellularwater as a percentage of body weight
ICW Moð Þ ¼ Ki∙H2∙W
12
Ri
!23
ð5Þ
Ki ¼ 5:8758BMI
þ 0:4194 ð6Þ
BMI is the body mass index. The value of ECW as a per-centage of W was reported to be from 12.5 to 27% [18].Because ECW calculated with Moissl equations(ECW(Mo)) as a percentage of the body weight is close tothe upper limit even in the post-dialysis phase, as shownin Table 1, Ke was reduced by a coefficient of m (m < 1):
Ke mð Þ ¼ m∙Ke ð7Þ
ECW mð Þ ¼ Ke mð Þ∙ H2∙W12
Re
!23
ð8Þ
This value of m was determined to minimize the valueof Eq. 9.
X466i¼1
1:02∙ΔECW mð Þi−ΔWiΔWi
� �2
ð9Þ
where ΔECW(m)i is the change in ECW(m)i before andafter HD. The “i” stands for data number. The deter-mined value of m was 0.8285. Since the coefficient of malso reduced ΔECW(m) compared with ΔW, a correctedfactor of c for the post-dialysis phase was introduced toincrease ΔECW(m):
Ke cð Þpost ¼ Ke mð Þpost−c ð10Þ
The subscript stands for the phase of each variable(pre- and post-HD). The corrected factor of c was deter-mined by regression analysis using a logarithmically con-verted value of ΔW:
creg ¼ 0:0205∙ ln ΔW þ 0:983ð Þ−0:0162;R¼ 0:525 ð11Þ
The “reg” stands for a regression equation.Thus, the novel equations for ECW were as follows:
ECW novelð Þpre ¼ Ke mð Þpre∙H2∙W pre
1=2
Repre
!2=3
ð12Þ
ECW novelð Þpost ¼ Ke mð Þpost−creg� �
∙H2∙W post
1=2
Repost
!2=3
ð13ÞIt must be noted that ECW(novel)post can be calcu-
lated independently from ECW(novel)pre. Thus, BIS

Fig. 1 The relation between extracellular water change (ΔECW) and body weight change (ΔW) before and after hemodialysis in the data fordevelopment of the novel equations (MLT method (a), Moissl equations (b))
Table 2 Patient profile for evaluation
Total number of data 5485
Total number of patients (male/female) 627 (395/232)
Age (years old) 68.2 (12.4)
Height (cm) 160.9 (9.9)
Dry weight (kg) 57.68 (13.36)
ΔW (kg) 2.44 (1.08)
R0pre (Ω) 484.2 (77.3)
Rinfpre (Ω) 383.5 (70.1)
R0post (Ω) 584.6 (87.1)
Rinfpost (Ω) 437.6 (71.4)
%ECWpre, MLT/Moissl/novel 23.8 (5.5) / 28.2 (3.0) / 23.4 (2.5)
%ECWpost MLT/Moissl/novel 17.8 (5.6) / 25.6 (3.1) / 20.6 (2.7)
Subscript indicates the phase of measurement (pre- & post-hemodialysis)Average values (standard deviation) are indicatedΔW body weight change between pre- and post-hemodialysis, R0 resistance atzero frequency, Rinf resistance at infinite frequency, %ECW extracellular wateras a percentage of body weight
Yashiro and Kotera Renal Replacement Therapy (2019) 5:7 Page 4 of 11
measurement pre-HD is not necessary to calculateECW(novel)post.The reference value of ICW was not available in the
current study. In this study, ICW was postulated to beconstant during HD. Based on this postulation, the fol-lowing equations were derived for ICW:
ICW novelð Þpre ¼ 0:8029� ICW Moð Þpreþ 4:3248;R
¼ 0:988 ð14Þ
ICW novelð Þpost ¼ 0:7981� ICW Moð Þpostþ 3:7856;R
¼ 0:988 ð15Þ
The details of development of the above Eqs. 12–15,are shown in Appendix 3.
Evaluation of novel equationsSupplemental data were collected after developing thenovel equations for evaluation. The software providedwith MLT-550N gives the fat mass (F). F for Moissl andthe novel equations were calculated using the bodyweight, ECW, and TBW according to a previous report[15]. However, some clearly unrealistic data with a nega-tive fat mass were included in these supplemental data(44 with the MLT method, 120 with Moissl equations inthe pre-HD phase, and 21 with the MLT method, 144with Moissl equations in the post-HD phase). These datawere excluded, and a total of 5485 data from 627 pa-tients including the original data for developing thenovel equations were used for evaluation. The basic pro-file of these data is shown in Table 2. The agreementsbetween 1.02 ∙ ΔECW or 1.02 ∙ ΔTBW and ΔW werecompared among the MLT method, Moissl equations,and novel equations.
The ratio of ECW to TBW (ECW/TBW) is often calledthe edema ratio (ER). It has been used as the measure offluid overload [19]. The normal value of ER varies with achange in the fat ratio (f = F/W). The normal ER corre-sponding to each f value was termed the fat ratio-correctednormal ER (fcER). The relation between ER and f was de-rived using hydration parameters of normally hydrated leantissue and adipose tissue [15] (Appendix 4). The absolutevalue of the deviation ratio of actual ER (aER) from fcER atDW was calculated according to the following Eq. 16(dER), and they were compared among the MLT method,Moissl equations, and novel equations:
dER ¼ aER−fcERfcER
�������� ð16Þ

Table 3 Correlation and concordance correlation coefficientsbetween body weight and fluid volume change before andafter hemodialysis session in the data for evaluation
1.02 × ΔECW 1.02 × ΔTBW
ρ R ρ R
MLT 0.411 0.769 0.373 0.764
Moissl 0.815 0.832 0.414 0.517
Novel 0.898 0.910 0.597 0.675
ΔECW extracellular water change, ΔTBW total body water change; ρconcordance correlation, R Pearson’s correlation
Yashiro and Kotera Renal Replacement Therapy (2019) 5:7 Page 5 of 11
ResultsThe values of ECWpost as percentages of W (%ECWpost)were significantly different among the three groups(MLT method, Moissl equations, and the novel equa-tions) (p < 0.001) (Table 2).%ECW values with the MLT method were the lowest
and those with Moissl equations were the highest. Therelations between ΔW and 1.02∙ΔECW with the MLTmethod, Moissl equations, and novel equations in theevaluated data are shown in Fig. 2. The concordancecorrelation (ρ) and Pearson’s correlation coefficient (R)between ΔW and 1.02∙ΔECW or 1.02∙ΔTBW of MLTmethod, Moissl equations, and the novel equations areshown in Table 3. The value of ρ using the novel equa-tions was the highest and that using the MLT methodwas the lowest. The value of R with the novel equationswas the highest for 1.02∙ΔECW but R using the MLTmethod is the highest for 1.02∙ΔTBW.As the fluid distribution in the body is potentially in-
fluenced by age and sex, the effects of these factors onthe value of ρ between 1.02∙ΔECW using the novel equa-tions and ΔW were examined. For age, the patients weredivided into three groups (younger: under 65 years old,middle: from 65 to under 75 years old, older: equal to orover 75 years old). The numbers of data for each groupwere 1782, 1866, and 1837, respectively. The values of ρin younger, middle, and older groups were 0.924, 0.867,and 0.849, respectively. The values of ρ in males and fe-males were 0.908 and 0.847, respectively.The relations between fcER or aER and f at DW are
shown in Fig. 3. Because the fluid status at DW is con-sidered to be close to normal hydration, aER is expectedto be close to fcER if the fluid volume is adequately cal-culated. The median values (first quartile, third quartile)of dER using the MLT method, Moissl equations, andnovel equations were as follows: 0.164 (0.076, 0.291),
Fig. 2 The relation between extracellular water change (ΔECW) and bodyevaluation of the novel equations (MLT method (a), Moissl equations (b), a
0.144 (0.074, 0.211), and 0.062 (0.028, 0.110), respect-ively. They were significantly different from each other(p < 0.001). The aERs at DW with the novel equationswere closer to fcERs compared with those using theMLT method or Moissl equations. The trends of aERsand fcERs along with f were reverse with the MLTmethod. Based on the relationship with fcERs, aERsusing the novel equations were underestimated com-pared with those using Moissl equations in the lower frange. On the other hand, aERs with Moissl equationswere markedly overestimated compared with those usingthe novel equations in the higher f range.
DiscussionIn this study, we developed novel equations to calculatethe body fluid volume from BIS data of MLT-550N.These equations were specialized for both HD patientsand the device. The equations for pre-HD and post-HDphases were distinct. The change in ECW calculatedwith the novel equations closely agreed with the bodyweight change before and after HD compared with thatcalculated with the MLT method or Moissl equations.We postulated that the fluid status at clinically deter-mined DW was close to normal. The values of %ECW-
post were significantly different among the MLT
weight change (ΔW) before and after hemodialysis in the data fornd novel equations (c))

Fig. 3 The relation between the fat ratio-corrected normal edema ratio (fcER: red dots) or actual edema ratio (aER: black dots) and fat ratio (f) atdry weight of the data for evaluation (MLT method (a), Moissl equations (b), and novel equations (c))
Yashiro and Kotera Renal Replacement Therapy (2019) 5:7 Page 6 of 11
methods, Moissl equations, and novel equations. Theaverage value of %ECWpost of the novel equations wasthe closest to the average normal value (20%) [18], andthat of the MLT method was underestimated, and thatof Moissl equations was overestimated. Based on thepostulation that patients had a normal fluid status atDW, actual edema ratios (aERs) of the patients wereconsidered to be close to the fat ratio-corrected normaledema ratios (fcERs). As indicated in this study, aERs atDW with the novel equations were closer to fcERs com-pared with those using the MLT method or Moissl equa-tions. These findings indicate that the body fluid volumeof the novel equations was closer to the actual valuecompared with the MLT method or Moissl equations.Appropriate estimation of total-body and limb muscle
mass (TBMM) is crucial for evaluating the frailty of HDpatients. TBMM is often calculated using the equationreported by Kaysen et al. [20]. Based on this equation,separating excess fluid mass from the body weight is ne-cessary for accurate estimation of TBMM. The close es-timation of the actual fluid volume of the novelequations may enable a more accurate estimation ofTBMM.The agreements between the changes in ECW and
body weight before and after HD were lower in the olderage group and females, although the reasons could notbe clarified in this study. The equations developed foreach sex or the equations incorporating the factor of agemay achieve higher-level accuracy. However, since theMoissl equations that we used as the basis of the novelequations do not take these factors into consideration,we did not add these factors to the novel equations.Generally, equations for calculation of the body fluid
volume from BIS were developed by comparing imped-ance values with the corresponding reference fluid vol-ume measured by the standard dilution method using
reagents such as bromide [21] or deuterium oxide [22].In this study, we used ΔW as the reference volume ofΔECW and compared this value with the change of im-pedance before and after HD. Owing to using thismethod, it was not necessary to administer any reagentsto evoke possible deleterious adverse effects. Only datareadily available in daily clinical services were used inthis study.The calculation of ECW with Moissl equations was
based on relatively robust electrochemical basis [7]. Al-though we developed novel equations by modifyingMoissl equations, our equations were based on an em-pirical approach. We introduced the “c” factor related toΔW subtracted from Ke(m)post. This approach did nothave any electrochemical basis. However, the followingexplanation may be possible. The impedance of bodyfluid is affected by the electrolyte composition. Whenthe contents of electrolytes increase, the impedance ofsame-volume solutions decreases [23]. Therefore, whenan identical value of Ke determined only from BMI isused to calculate ECW with higher electrolyte contents,the calculation results in an overestimation of ECW.Hyponatremia is often encountered in the pre-HD phase[24] due to dilution by ingesting free water in the inter-dialytic period. The effect of dilution may become moreintense along with an increase of water ingestion result-ing in an increase of ΔW. Because hyponatremia is cor-rected with HD, the contents of sodium are expected toincrease post-HD. These considerations may support theutilization of reduced Ke (Ke(c)post) in the post-HDphase. However, as it is necessary to take the change ofother electrolytes or diverse trends of patient-specificelectrolyte compositions into consideration, the explan-ation is just one possibility. We used the corrected factor“c” for the reduction of Ke(m)post as the logarithmic re-gression equation of ΔW (creg) only on the basis of

Yashiro and Kotera Renal Replacement Therapy (2019) 5:7 Page 7 of 11
graphical approximation. This approach also lacks a ro-bust physiological basis. In Moissl equations, Ke or Kimay be graphically approximated by linear regressionequations of 1/BMI. These empirical approaches may beinevitable to develop equations for calculating the fluidvolume from BIS.As indicated in Fig. 2, relatively marked deviation of
1.02∙ΔECW from ΔW in the range of negative ΔW wasnoted for the novel equations. Negative ΔW means bodyweight gain after hemodialysis. Such cases were not in-cluded in the data for developing the novel equations.The novel equations may be inappropriate for calcula-tion of the body fluid volume in the post-HD phasewithout a significant ultrafiltration volume.In this study, there were no means to develop equations to
calculate ICW. Although the MLT method and Moissl equa-tions to calculate ICW were based on a different electricalequivalent model, calculated ICW volumes closely agreedwith each other. We considered that this high-level agree-ment supported the reliance of these ICW values. As statedin the “Methods” section, we used the regression analysis be-tween ICW calculated with Moissl equations and that of theMLT method due to the need to use the same electricalequivalent model as that used for ECW calculation (Moisslmodel). The lack of means to develop unique equations forICW was a limitation of this study. Because ICW of thenovel equations still markedly fluctuated between pre- andpost-HD phases, the agreements of the novel equations be-tween ΔTBW and ΔW were weaker than those betweenΔECW and ΔW. However, the same tendency was noted forthe MLT method and Moissl equations. Significant fluctua-tions of ICW measured soon after HD were reported previ-ously, and the fluctuations became smaller after 30 to 120min [14]. They reported that measurements taken soon afterHD should be avoided, and the weaker agreement betweenΔTBW and ΔW might be attributable to the measurementssoon after HD used in this study.The ratio of ECW to TBW, the edema ratio (ER) in
this study, has been used as a measure of fluid overload.As there is a positive correlation between ER and age,ER is often corrected by age [19]. Instead of the correc-tion, we used fat-ratio correction based on a previous re-port [15] in this study. This report argued that thecomposition of normally hydrated lean tissue and nor-mally hydrated adipose tissue were the same irrespectiveof the age, sex, degree of obesity, and basal pathologicalcondition. According to their report, the change in ERalong with the change in age can be attributed to thechange in the fat ratio. Therefore, we used the fatratio-corrected normal edema ratio as a reference of thenormal fluid status.In this study, the interval from meals to BIS measure-
ments was not consistent. Although measurement ofbody fluid via BIS may be affected by meals, the actual
measurement in daily clinical settings is conducted withvarious intervals from meals. Therefore, measured dataunder various conditions were included in the data fordevelopment or evaluation of the current equations.Moreover, there is a report that although there were sig-nificant changes in body composition estimates aftermeals, these were small and within the imprecision ofthe impedance technique and so are unlikely to be ofclinical significance [25]. Based on this report, we con-sidered that the various intervals from meals to mea-surements might not have a significant impact on theresults.The agreements between ΔECW and ΔW or constant
ICW before and after HD were the principal postula-tions in the current approach. These were based on pre-vious reports [13, 14, 26]. However, there were someconflicting reports [27]. If these postulations are foundto be erroneous, our approach will lose credibility. Thisis a major limitation of this study.Although we postulated that clinically determined DW
of each patient was adequate and their fluid status wasclose to normal, this postulation was not necessarilyvalid. The appropriateness of fluid volume calculationusing the novel equations must be confirmed by com-parisons with the fluid status evaluated by othermethods, such as atrial natriuretic peptide levels [28],diameter of the inferior vena cava [29], or blood volumemeasurement during HD [30], in a future study.The data with a negative fat mass were excluded from
the additional data for evaluation of the novel equations.However, as shown in Fig. 3, some data with a markedlylow or high fat ratio that was not realistic were still in-cluded. Because the adequate cut-off range for reason-able exclusion could not be determined, all data wereused for evaluation, being another limitation of thisstudy.
ConclusionsThe novel equations for MLT-550N to calculate the fluidvolume for hemodialysis patients were developed bymodifying Moissl equations. The agreements betweenthe change in extracellular water or total body water andbody weight change were improved with the novel equa-tions compared with the MLT method or Moissl equa-tions. Based on the relation between the actual edemaratio and fat ratio-corrected normal edema ratio at dryweight, the fluid volume calculated by the novel equa-tions may be more adequate than those by the MLTmethod or Moissl equations.
Appendix 1The basic theory of BIS and the derivation of Eq. 1The simple circuit model of a human body representsthe current path into two parallel branches, one through

Yashiro and Kotera Renal Replacement Therapy (2019) 5:7 Page 8 of 11
ECW and the other through ICW. The simplest elec-trical equivalent model is shown in Fig. 4a. The path ofECW is considered purely resistive while the intracellu-lar path includes the capacitive effects in the cell mem-brane (Cm). Owing to these capacitive effects, themagnitude of impedance of the intracellular path isdependent on the frequency. For technical reasons, im-pedance measured using surface electrodes is limited toa frequency range of 5–1000 kHz. The locus of imped-ance data at multi-frequencies in theresistance-reactance plane lies on a semicircle with itscenter below the horizontal axis according to the Colemodel [31]. Total resistance at 0 (R0) and infinite (Rinf )frequencies can be described as:
R0 ¼ Re ð17Þ
Rinf ¼ Re∙RiReþ Ri
ð18Þ
Re and Ri can be calculated from Eqs. 17 and 18, whenR0 and Rinf are estimated. These values (R0 and Rinf )cannot be measured directly, but they can be estimatedby extrapolation of the Cole-Cole semicircle [31].In the whole-body bioimpedance method, the human
body is approximated as a cylinder. Theresistance-volume relationship for a single cylinder is:
R ¼ Kb∙ρ∙H2
Vbð19Þ
where R is the resistance of the human body (Ω), Kb is ashape factor (dimensionless), ρ is resistivity (Ωcm), H isthe height (cm), and Vb is the body volume (cm3). Whenthe effect of non-conducting tissues embedded in ECWand ICW, which increases their resistivity, is taken intoaccount, the actual resistivity (ρa) is calculated as Eq. 20,based on Hanai’s mixture conductivity theory [6]:
Fig. 4 The electrical equivalent model for bioimpedance spectroscopy. The
ρa ¼ ρ
1−rð Þ3=2ð20Þ
where r is the volume fraction of non-conducting tis-sues. At 0 frequency, the current is considered to passexclusively through the extracellular space, and the vol-ume fraction of non-conducting tissues is equal to:
r ¼ 1−103∙ECW
Vbð21Þ
where ECW is the volume of extracellular water (L).Using Eqs. 20 and 21, ρa is written as:
ρa ¼ ρe∙Vb
103∙ECW
� �3=2
ð22Þ
where ρe is the resistivity of ECW. Vb is written as:
Vb ¼ 103∙WDb
ð23Þ
where W (kg) is the body weight and Db (kg/L) is itsdensity. Using Eq. 23, Eq. 22 is written as:
ρa ¼ ρe∙W
ECW∙Db
� �3=2
ð24Þ
Using Eqs. 17, 23, and 24, Eq. 19 at 0 frequency can bewritten as:
Re ¼ R0 ¼ Kb∙ρe∙ WECW∙Db
� �3=2∙H2
103∙WDb
ð25Þ
Thus, ECW is written as:
ECW ¼ 10−2∙Kb∙ρe
Db1=2
� �2=3
∙H2∙W 1=2
Re
� �2=3
ð26Þ
The first half of the right of Eq. 26 can be regarded asa constant:
simplest model (a) and the model of MLT-550N (b)
Yashiro and Kotera Renal Replacement Therapy (2019) 5:7 Page 9 of 11
Ke ¼ 10−2∙Kb∙ρ
Db1=2
� �2=3
ð27Þ
Thus, ECW is calculated as Eq. 1 in the main text.
Appendix 2Equations of MLT methodThe electrical equivalent model for the MLT methodcontains the resistance of the cell membrane (Rm,Fig. 4b) and is distinct from the simplest circuit model.The equations of MLT method are as follows:
1R0
¼ 1Re
þ 1Rmþ Ri
ð28Þ
1Rinf
¼ 1Re
þ 1Ri
ð29Þ
Ri ¼−Rmþ Rm2 þ 4β
� �12
n o2
ð30Þ
Re ¼ 11
Rinf−1Ri
ð31Þ
β ¼ Rm
1Rinf
−1R0
ð32Þ
LTM ¼ P∙H2
Reþ Q∙
H2
Riþ R∙Hα ð33Þ
ECW ¼ P∙Ht2
Reþ S∙LTM ð34Þ
ICW ¼ Q∙Ht2
Riþ 2S∙LTM ð35Þ
TBW ¼ ECW þ ICW ð36Þ
BMC ¼ 0:021∙H þ 0:021∙W−0:011∙age−1:63 ð37Þ
F ¼ W−LTM−BMC ð38Þ
Rm = 400(male), 300(female).Male, P = 0.3879, Q = 0.3153, R = 0.0001453, S =
0.05117 α = 2.3Female, P = 0.3675, Q = 0.2219, R = 0.0007983, S =
0.10227 α = 2
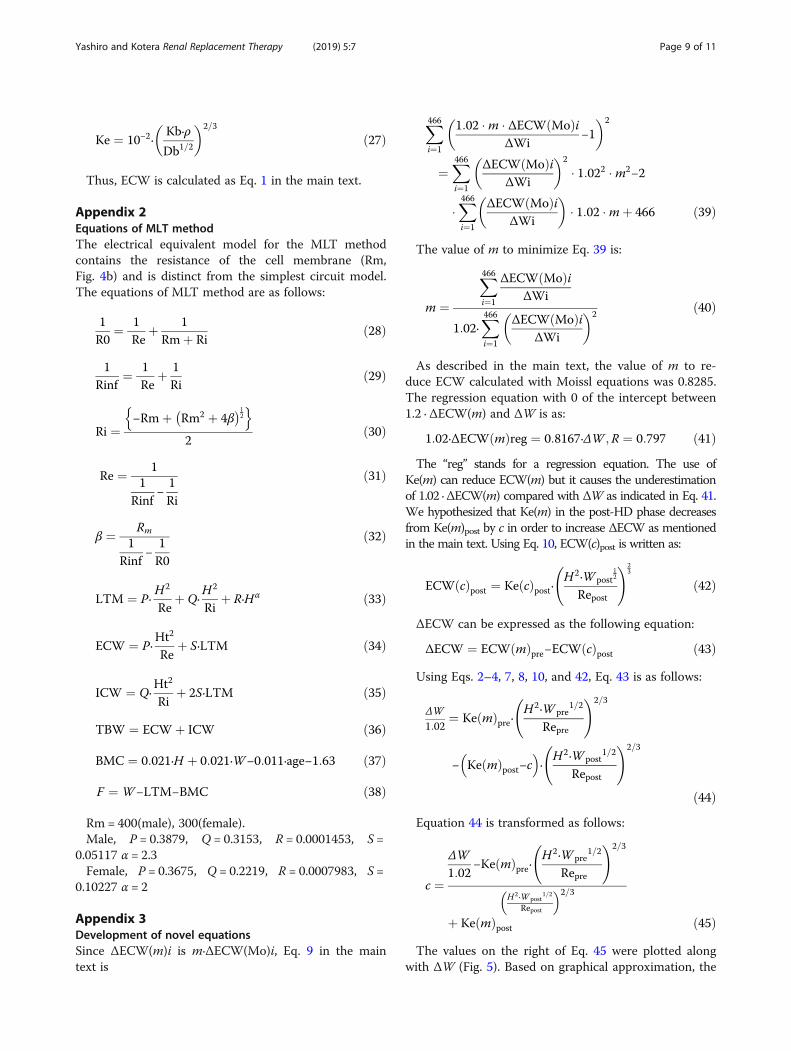
Appendix 3Development of novel equationsSince ΔECW(m)i is m∙ΔECW(Mo)i, Eq. 9 in the maintext is
X466i¼1
1:02 �m � ΔECW Moð ÞiΔWi
−1� �2
¼X466i¼1
ΔECW Moð ÞiΔWi
� �2
� 1:022 �m2−2
�X466i¼1
ΔECW Moð ÞiΔWi
� �� 1:02 �mþ 466 ð39Þ
The value of m to minimize Eq. 39 is:
m ¼
X466i¼1
ΔECW Moð ÞiΔWi
1:02∙X466i¼1
ΔECW Moð ÞiΔWi
� �2ð40Þ
As described in the main text, the value of m to re-duce ECW calculated with Moissl equations was 0.8285.The regression equation with 0 of the intercept between1.2 ∙ ΔECW(m) and ΔW is as:
1:02∙ΔECW mð Þreg ¼ 0:8167∙ΔW ;R ¼ 0:797 ð41ÞThe “reg” stands for a regression equation. The use of
Ke(m) can reduce ECW(m) but it causes the underestimationof 1.02 ∙ ΔECW(m) compared with ΔW as indicated in Eq. 41.We hypothesized that Ke(m) in the post-HD phase decreasesfrom Ke(m)post by c in order to increase ΔECW as mentionedin the main text. Using Eq. 10, ECW(c)post is written as:
ECW cð Þpost ¼ Ke cð Þpost∙H2∙W post
12
Repost
!23
ð42Þ
ΔECW can be expressed as the following equation:
ΔECW ¼ ECW mð Þpre−ECW cð Þpost ð43ÞUsing Eqs. 2–4, 7, 8, 10, and 42, Eq. 43 is as follows:
ΔW1:02
¼ Ke mð Þpre∙H2∙W pre
1=2
Repre
!2=3
− Ke mð Þpost−c� �
∙H2∙W post
1=2
Repost
!2=3
ð44ÞEquation 44 is transformed as follows:
c ¼
ΔW1:02
−Ke mð Þpre∙H2∙W pre
1=2
Repre
!2=3
H2 ∙W post1=2
Repost
� �2=3þ Ke mð Þpost ð45Þ
The values on the right of Eq. 45 were plotted alongwith ΔW (Fig. 5). Based on graphical approximation, the

Fig. 5 The relation between the corrected factor c in the post-dialysis phase and body weight change (ΔW)
Yashiro and Kotera Renal Replacement Therapy (2019) 5:7 Page 10 of 11
regression equation to calculate c (creg) from logarith-mically converted values of ΔW was determined basedon a fitting method as Eq. 11. The correlation coefficientbetween c and ΔW in logarithmic regression analysiswas higher than that in linear regression analysis (R =0.510). Finally, ECW was calculated as Eqs. 12 and 13.The reference value of ICW was not available in the
current study. The concordance correlation coefficients (ρ)between ICW of the MLT method (ICW(MLT)) and thatof Moissl equations (ICW(Mo)) are relatively high in bothpre- and post-HD phases (ρ = 0.937 and ρ = 0.961, respect-ively). Based on high-level agreement between ICW(MLT)and ICW(Mo), we considered that both were close to theactual ICW value. In this study, ICW was postulated to beconstant during HD. The changes in ICW during HD werecompared between MLT (ΔICW(MLT)) and Moissl(ΔICW(Mo)). The values of ΔICW(MLT)2 were signifi-cantly lower than those of ΔICW(Mo)2 based on Wilcox-on’s signed rank test (p < 0.001). Therefore, we consideredthat ICW(MLT) is more compatible with the postulation ofICW constancy during HD than ICW(Mo). However, theelectrical equivalent model of the MLT method containingresistance of the cell membrane is distinct from the Moisslmodel. We decided to calculate ICW from ICW(Mo) usinga linear regression equation between ICW(Mo) andICW(MLT) in the current approach instead of the directutilization of ICW(MLT), because a consistent electricalequivalent model (Moissl model) must be used for bothECW and ICW. Thus, Eqs. 14 and 15 in the main text werederived using regression analysis.
Appendix 4Calculation of fat ratio-corrected normal edema ratioK = 1.328, A = 0.266, M = 0.127, B = 0.703, N = 0.197 [9].
a ¼ K ∙F ð46Þl þ a ¼ W ð47ÞA∙l þM∙a ¼ ECW ð48ÞB∙l þ N ∙a ¼ TBW ð49Þ
Equations 48 and 49 can be written by substituting land a with K, F, and W using Eqs. 46 and 47:
A∙ W−K ∙Fð Þ þM∙K ∙F ¼ ECW ð50ÞB∙ W−K ∙Fð Þ þ N ∙K ∙F ¼ TBW ð51Þ
The edema ratio (ECW/TBW) can be written asfollows:
ECWTBW
¼ A∙ W−K ∙Fð Þ þM∙K ∙FB∙ W−K ∙Fð Þ þ N ∙K∙F
¼ A∙ 1−K ∙F=Wð Þ þM∙K ∙F=WB∙ 1−K ∙F=Wð Þ þ N ∙K ∙F=W
ð52Þ
Equation 52 can be written as follows by substitutingF/W with the fat ratio (f = F/W):
ECWTBW
¼ A−K ∙ A−Mð Þ∙ fB−K ∙ B−Nð Þ∙ f ð53Þ
The actual values were substituted for the parametersrespectively. This edema ratio was denoted as thefat-ratio corrected normal edema ratio (fcER):
fcER ¼ 0:266−0:185∙ f0:703−0:672∙ f
ð54Þ
AbbreviationsA: Fraction of extracellular water in normally hydrated lean tissue; a: Mass ofnormally hydrated adipose tissue (kg); aER: Actual edema ratio; B: Fraction oftotal water in normally hydrated lean tissue; BIS: Bioimpedance spectroscopy;BMC: Bone mineral content (kg); BMI: Body mass index; DW: Dry weight (kg);ECF: Extracellular fluid (kg); ECW: Extracellular water (L); ER: Edema ratio(ECW/TBW); F: Fat mass (kg); f: Fat ratio; fcER: Fat ratio-corrected normaledema ratio; H: Height (cm); HD: Hemodialysis; ICW: Intracellular water (L);K: Ratio of mass of normally hydrated adipose tissue to fat mass; I: Mass ofnormally hydrated lean tissue (kg); LTM: Lean tissue mass (kg); M: Fraction ofextracellular water in normally hydrated adipose tissue; N: Fraction of totalwater in normally hydrated adipose tissue; R0: Impedance at zero frequency(Ω); Re: Resistance of extracellular water (Ω); Ri: Resistance of intracellularwater (Ω); Rinf: Impedance at infinite frequency (Ω); Rm: Resistance of cellmembrane (Ω); TBW: Total body water (L); UFV: Ultrafiltration volume (L);W: Body weight (kg); Δ: Standing for the change of before and after HD
AcknowledgementsWe appreciate the collaboration for data collection of Nozatomo Clinic(Hyogo), Honma Hospital (Yamagata), Hakuyuchiyoda Clinic (Osaka), andIwakura Hospital (Aichi). We thank Dr. Ishii Y, Kobayashi S (Nozatomo Clinic),Dr. Sugawara T, Igarashi K (Honma Hospital), Dr. Okada N, Imamura M(Hakuyuchiyoda clinic), Dr. Takada M, and Nagao H (Iwakura Hospital) fortheir support.
FundingThis study was supported by funds provided by Toray Medical Co., Ltd.

Yashiro and Kotera Renal Replacement Therapy (2019) 5:7 Page 11 of 11
Availability of data and materialsThe datasets of the patients generated and/or analyzed during the currentstudy are not publicly available because there is no approval other than forthe utilization of the datasets of the patients for this current study. Thedatasets are available from the corresponding author on reasonable requestif approval from the collaborating institutions is given.
Authors’ contributionsMY developed the novel equations, organized the study, and prepared themanuscript. HK made significant recommendations for the study andmanuscript and performed the preliminary study. Both authors read andapproved the final manuscript.
Ethics approvalThis retrospective study was approved by the Institutional Ethical ReviewBoard of Himeji Dokkyo University (No. 17–04).
Consent for publicationAll data were anonymized in this study. Consent for publication wasobtained thorough collaborating institutions.
Competing interestsThe authors declare that they have no competing interests.
Publisher’s NoteSpringer Nature remains neutral with regard to jurisdictional claims inpublished maps and institutional affiliations.
Received: 12 October 2018 Accepted: 4 February 2019
References1. Davies SJ, Davenport A. The role of bioimpedance and biomarkers in
helping to aid clinical decision-making of volume assessments in dialysispatients. Kidney Int. 2014;86:489–96.
2. Spiegel DM, Bashir K, Fisch B. Bioimpedance resistance ratios for theevaluation of dry weight in hemodialysis. Clin Nephrol. 2000;53:108–14.
3. Chamney PW, Krämer M, Rode C, Kleinekofort W, Wizemann V. A newtechnique for establishing dry weight in hemodialysis patients via wholebody bioimpedance. Kidney Int. 2002;61:2250–8.
4. Jaffrin MY, Morel H. Body fluid volumes measurements by impedance: areview of bioimpedance spectroscopy (BIS) and bioimpedance analysis (BIA)methods. Med Eng Phys. 2008;30:1257–69.
5. De Lorenzo A, Andreoli A, Matthie J, Withers P. Predicting body cell masswith bioimpedance by using theoretical methods: a technological review. JAppl Physiol. 1997;82:1542–58.
6. Hanai T. Theory of the dielectric dispersion due to the interfacialpolarization and its application to emulsions. Colloid Polym Sci. 1960;171:23–31.
7. Moissl UM, Wabel P, Chamney PW, Bosaeus I, Levin NW, Bosy-WestphalA, Korth O, Müller MJ, Ellegård L, Malmros V, Kaitwatcharachai C,Kuhlmann MK, Zhu F, Fuller NJ. Body fluid volume determination viabody composition spectroscopy in health and disease. Physiol Meas.2006;27:921–33.
8. Matthie JR. Second generation mixture theory equation for estimatingintracellular water using bioimpedance spectroscopy. J Appl Physiol. 2005;99:780–1.
9. Van Loan MD, Withers P, Matthie J, Mayclin PL. Use of bioimpedancespectroscopy to determine extracellular fluid, intracellular fluid, total bodywater, and fat-free mass. Basic Life Sci. 1993;60:67–70.
10. Tanaka K, Okuno J, Fujimoto T, Wada M, Uehara K, Ri H, Watanabe H,Nakadomo F. The utility for evaluation of body composition by multi-frequency bioimpedance spectroscopy – based on comparisons betweenDEXA and method of body fluid. Himankennkyu. 2000;6:68–75 (inJapanese).
11. Kotera H, Yashiro M, Kita T, Nishitani Y, Tanaka H, Sakai R. The evaluation ofaccuracy of body fluid volume measure using bioimpedance spectroscopyaccording to the change in body weight before and after hemodialysis. JJpn Soc Dial Ther. 2014;47 suppl 1:665 (in Japanese).
12. Kyle U, et al. Bioelectrical impedance analysis part i: review of principles andmethods. Clin Nutr. 2004;23:1226–43.
13. Dou Y, Liu L, Cheng X, Cao L, Zuo L. Comparison of bioimpedance methodsfor estimating total body water and intracellular water changes duringhemodialysis. Nephrol Dial Transplant. 2011;26:3319–24.
14. Wabel P, Rode C, Moissl U, Chamney P, Wizemann V. Accuracy ofbioimpedance spectroscopy (BIS) to detect fluid status changes inhemodialysis. Nephrol Dial Transplant. 2007;22(6(suppl)):Vi129.
15. Chamney PW, Wabe K, Moissl UM, et al. A whole-body model to distinguishexcess fluid from the hydration of major body tissues. Am J Clin Nutr. 2007;85:80–9.
16. Kanda Y. Investigation of the freely available easy-to-use software ‘EZR’ formedical statics. Bone Marrow Transplant. 2013;48:452–8.
17. Lin LI. A concordance correlation coefficient to evaluate reproducibility.Biometrics. 1989;45:255–68.
18. Mount DB. Fluid and electrolyte imbalances. In: Long DL, Fauci AS, HauserSL, Jameson JL, Loscalzo J, editors. Harrison’s principles of internal medicine,18th ed., 4th Japanese ed., Tokyo: Medical Sciences International, Ltd; 2013.p. 288–305 (in Japanese).
19. Lopot F, Nejedlý B, Novotná H, Macková M, Sulková S. Age-related extracellularto total body water volume ratio (Ecv/TBW)--can it be used for "dry weight"determination in dialysis patients? Application of multifrequencybioimpedance measurement. Int J Artif Organs. 2002;25:762–9.
20. Kaysen GA, Zhu F, Sarkar S, Heymsfield SB, Wong J, Kaitwatcharachai C,Kuhlmann MK, Levin NW. Estimation of total-body and limb muscle mass inhemodialysis patients by using multifrequency bioimpedance spectroscopy.Am J Clin Nutr. 2005;82:988–95.
21. Miller ME, Cosgriff JM, Forbes GB. Bromide space determination usinganion-exchange chromatography for measurement of bromide. Am J ClinNutr. 1989;50:168–71.
22. Schloerb PR, Friis-Hansen BJ, Edelman IS, Solomon AK, Moore FD. Themeasurement of total body water in the human subject by deuteriumoxide dilution; with a consideration of the dynamics of deuteriumdistribution. J Clin Invest. 1950;29:1296–310.
23. Scharfetter H, Wirnsberger GH, Holzer H, Hutten H. Influence of ionic shiftsduring dialysis on volume estimations with multifrequency impedanceanalysis. Med Biol Eng Comput. 1997;35:96–102.
24. Zhang R, Wang S, Zhang M, Cui L. Hyponatremia in patients with chronickidney disease. Hemodial Int. 2017;21:3–10.
25. Androutsos O, Gerasimidis K, Karanikolou A, Reilly JJ, Edwards CA. Impact ofeating and drinking on body composition measurements by bioelectricalimpedance. J Hum Nutr Diet. 2015;28:165–71.
26. Schneditz D, Roob J, Oswald M, et al. Nature and rate of vascular refillingduring hemodialysis and ultrafiltration. Kidney Int. 1992;42:1425–33.
27. Kumar S, Khosravi M, Massart A, Potluri M, Davenport A. Haemodiafiltrationresults in similar changes in intracellular water and extracellular watercompared to cooled haemodialysis. Am J Nephrol. 2013;37:320–4.
28. Plum J, Grabensee B. Atrial natriuretic peptide in dialysis patients undervarious conditions of volume homeostasis. J Intern Med. 1991;229:209–16.
29. Ando Y, Yanagiba S, Asano Y. The inferior vena cava diameter as a marker ofdry weight in chronic hemodialyzed patients. Artif Organs. 1995;19:1237–42.
30. Rodriguez HJ, Domenici R, Anne D, Goykhman I. Assessment dry weight bymonitoring changes in blood volume during hemodialysis using Crit-Line.Kidney Int. 2005;68:854–61.
31. Cole KS, Cole RH. Dispersion and absorption in dielectrics. I. Alternatingcurrent characteristics. J Chem Phys. 1941;9:341–51.