bioimpedance of soft tissue under compression
TRANSCRIPT

Bioimpedance of soft tissue under compression
This article has been downloaded from IOPscience. Please scroll down to see the full text article.
2012 Physiol. Meas. 33 1095
(http://iopscience.iop.org/0967-3334/33/6/1095)
Download details:
IP Address: 141.211.173.82
The article was downloaded on 26/06/2013 at 15:16
Please note that terms and conditions apply.
View the table of contents for this issue, or go to the journal homepage for more
Home Search Collections Journals About Contact us My IOPscience
IOP PUBLISHING PHYSIOLOGICAL MEASUREMENT
Physiol. Meas. 33 (2012) 1095–1109 doi:10.1088/0967-3334/33/6/1095
Bioimpedance of soft tissue under compression
R E Dodde, J L Bull and A J Shih
Biomedical Engineering Department, University of Michigan, Ann Arbor, MI, USA
E-mail: [email protected]
Received 13 December 2011, accepted for publication 24 April 2012Published 24 May 2012Online at stacks.iop.org/PM/33/1095
AbstractIn this paper compression-dependent bioimpedance measurements of porcinespleen tissue are presented. Using a Cole–Cole model, nonlinear compositionalchanges in extracellular and intracellular makeup; related to a loss of fluid fromthe tissue, are identified during compression. Bioimpedance measurementswere made using a custom tetrapolar probe and bioimpedance circuitry. As thetissue is increasingly compressed up to 50%, both intracellular and extracellularresistances increase while bulk membrane capacitance decreases. Increasingcompression to 80% results in an increase in intracellular resistance andbulk membrane capacitance while extracellular resistance decreases. Tissuescompressed incrementally to 80% show a decreased extracellular resistanceof 32%, an increased intracellular resistance of 107%, and an increasedbulk membrane capacitance of 64% compared to their uncompressed values.Intracellular resistance exhibits double asymptotic curves when plotted againstthe peak tissue pressure during compression, possibly indicating two distinctphases of mechanical change in the tissue during compression. Based on thesefindings, differing theories as to what is happening at a cellular level duringhigh tissue compression are discussed, including the possibility of cell ruptureand mass exudation of cellular material.
Keywords: bioimpedance, spleen, soft tissue, compression, strain
(Some figures may appear in colour only in the online journal)
1. Introduction
Tissue undergoes compression in a variety of physiological, clinical, and research experiencesand on a large range of scales. Physiological examples include the result of pressure exerted onvessel walls during the cardiac cycle (Fung 1993), blunt trauma and traumatic brain injuries(Eaton 2005), and at the cellular level mechanotransduction (Demou 2010, Ingber 2006).Clinical and research examples are very diverse, including edema monitoring (pitting edema)in dialysis patients (Berry et al 2008), the use of electrosurgical forceps while coagulatingtissue (Dodde et al 2008), and optical clearing techniques for increasing the depth of fieldusing optical imaging techniques (Rylander et al 2006).
0967-3334/12/061095+15$33.00 © 2012 Institute of Physics and Engineering in Medicine Printed in the UK & the USA 1095
1096 R E Dodde et al
Much research has been performed on the mechanical response of soft tissue undercompression (Tamura et al 2002, Rosen et al 2008, Abramowitch 2004). Depending on thetissue being tested, various models have been used to explain the measured phenomenonusing viscoelastic, poroelastic, and biphasic theories (Mow et al 1980, Fung 1993, Pena et al1998). However, it proves difficult to relate the mathematical parameters to the physiologicalconsequences during tissue strain.
Additionally, little within the literature has been published regarding material propertychanges tissue experiences while undergoing compression. It is generally assumed that amongthese changes is a loss of fluid from the tissue space (Rylander et al 2006). More specifically,the fluid loss has been postulated to come primarily from the extracellular compartmentsof the compressed tissue (Gonzalez-Correa 2005). In theory, bioimpedance techniques candistinguish between intracellular fluid, extracellular fluid, and the bulk capacitance of thecellular membranes and thus offer a methodology for a more complete understanding of thechanges occurring within tissue during compression.
Previous literature has noticed a change in bioimpedance readings with an increase inpressure applied to measurement devices. Gonzalez-Correa et al (Gonzalez-Correa 2005)showed that for various tissues the resistivity increases as pressure is increased to themeasurement probe. Keshtkar et al (Keshtkar 2008) showed that independent of pressurereadings, the ratio of probe size to effective electrode size must be considered as well. Largerprobes tend to report lower impedance readings than their smaller counterparts given a constantpressure and electrode size.
In both cases it is asserted that the loss of extracellular fluid is responsible for the increasein electrical impedance readings; however, only the real part of the impedance is shown.Without knowledge of the complex impedance, including the imaginary component, it cannotbe determined if it is a loss of interstitial fluid, intracellular fluid, or a combination of both.
The goal of this research is to identify the effect tissue compression has on bioimpedancereadings to gain insight into the intracellular and interstitial fluid distribution in tissue. Thestandard Cole–Cole model (Cole and Cole 1941) is extended to incorporate strain-dependentvalues is suggested for analysis of compressed tissue due to the changes in both the locidiameter and position along the real axis. As the components of the Cole–Cole model can bemapped to the intracellular and extracellular fluid compartments of tissue, a hypothesis for whathappens to the tissue’s cellular material during compression is discussed based on comparisonsto peak pressures developed within the tissue during incremental tissue compression.
2. Materials and methods
For this study, bioimpedance measurements were collected using a standard tetrapolartechnique (Bouty 1884, Schwan 1968b, Jakosky 1961, Ackmann 1993) on porcine spleenunder incremental compressive strains once the tissue was seen to relax from the initialcompressive stress. Spleen tissue was chosen for its uniform thickness throughout the organ aswell as its general isotropy (Bowdler 2002). Bioimpedance measurements were conditioned toremove circuitry effects and experimental stray capacitance before fitting the measurements to aCole–Cole model. Details for the experimental setup, experimental method, data conditioning,and Cole–Cole fitting are given below.
2.1. Experimental setup
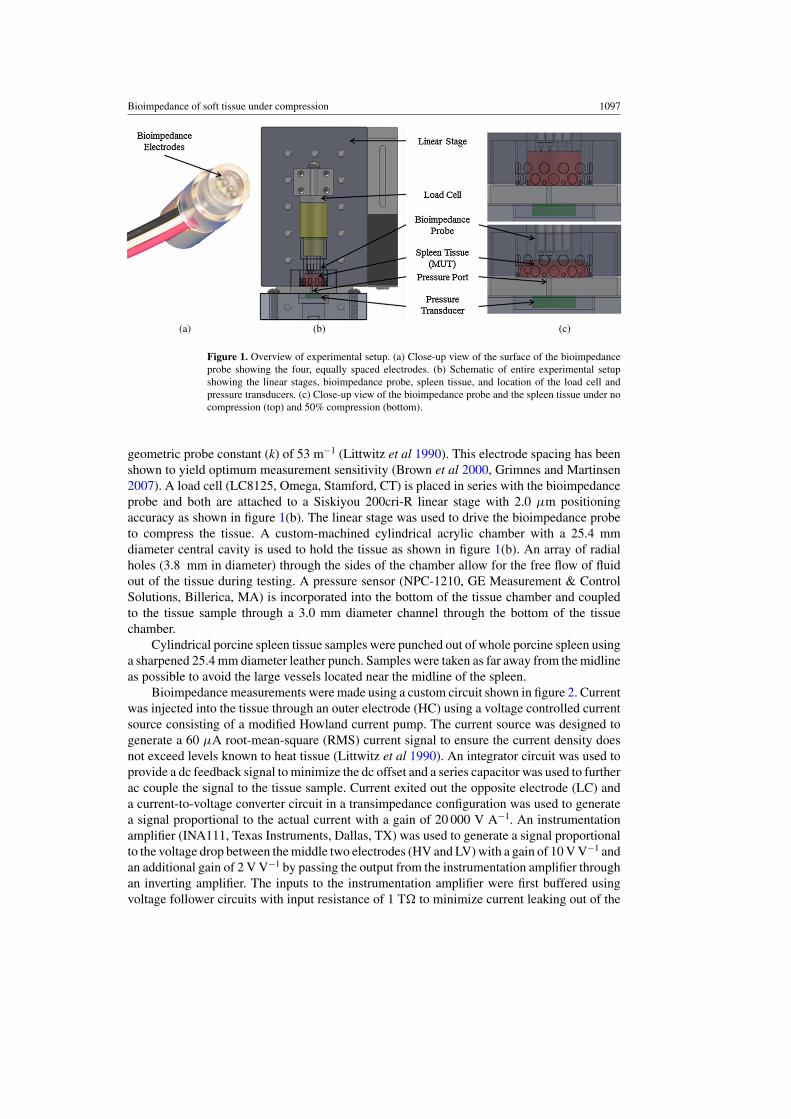
The bioimpedance probe uses four 0.25 mm diameter platinum electrodes and is 19 mm indiameter as shown in figure 1(a). The electrodes are equally spaced 3.0 mm apart resulting in a
Bioimpedance of soft tissue under compression 1097
(a) (b) (c)
Figure 1. Overview of experimental setup. (a) Close-up view of the surface of the bioimpedanceprobe showing the four, equally spaced electrodes. (b) Schematic of entire experimental setupshowing the linear stages, bioimpedance probe, spleen tissue, and location of the load cell andpressure transducers. (c) Close-up view of the bioimpedance probe and the spleen tissue under nocompression (top) and 50% compression (bottom).
geometric probe constant (k) of 53 m−1 (Littwitz et al 1990). This electrode spacing has beenshown to yield optimum measurement sensitivity (Brown et al 2000, Grimnes and Martinsen2007). A load cell (LC8125, Omega, Stamford, CT) is placed in series with the bioimpedanceprobe and both are attached to a Siskiyou 200cri-R linear stage with 2.0 μm positioningaccuracy as shown in figure 1(b). The linear stage was used to drive the bioimpedance probeto compress the tissue. A custom-machined cylindrical acrylic chamber with a 25.4 mmdiameter central cavity is used to hold the tissue as shown in figure 1(b). An array of radialholes (3.8 mm in diameter) through the sides of the chamber allow for the free flow of fluidout of the tissue during testing. A pressure sensor (NPC-1210, GE Measurement & ControlSolutions, Billerica, MA) is incorporated into the bottom of the tissue chamber and coupledto the tissue sample through a 3.0 mm diameter channel through the bottom of the tissuechamber.
Cylindrical porcine spleen tissue samples were punched out of whole porcine spleen usinga sharpened 25.4 mm diameter leather punch. Samples were taken as far away from the midlineas possible to avoid the large vessels located near the midline of the spleen.
Bioimpedance measurements were made using a custom circuit shown in figure 2. Currentwas injected into the tissue through an outer electrode (HC) using a voltage controlled currentsource consisting of a modified Howland current pump. The current source was designed togenerate a 60 μA root-mean-square (RMS) current signal to ensure the current density doesnot exceed levels known to heat tissue (Littwitz et al 1990). An integrator circuit was used toprovide a dc feedback signal to minimize the dc offset and a series capacitor was used to furtherac couple the signal to the tissue sample. Current exited out the opposite electrode (LC) anda current-to-voltage converter circuit in a transimpedance configuration was used to generatea signal proportional to the actual current with a gain of 20 000 V A−1. An instrumentationamplifier (INA111, Texas Instruments, Dallas, TX) was used to generate a signal proportionalto the voltage drop between the middle two electrodes (HV and LV) with a gain of 10 V V−1 andan additional gain of 2 V V−1 by passing the output from the instrumentation amplifier throughan inverting amplifier. The inputs to the instrumentation amplifier were first buffered usingvoltage follower circuits with input resistance of 1 T� to minimize current leaking out of the

1098 R E Dodde et al
Figure 2. Schematic of the circuit developed to measure soft tissue bioimpedance using thetetrapolar method. The three main components of the circuit are a voltage controlled current sourcewhich injects current into the tissue through the signal line HC, an instrumentation amplifier tomeasure differential voltage signals in the tissue measured at HV and HC, and a current-to-voltageconverter to monitor the current passing through the tissue from signal LC. Note that the output ofthe current source into the tissue has an additional series capacitor used to further remove any dcoffset in the signal.
tissue sample through the signal lines. Circuit characterization is discussed in section 2.3.1.The cable shields for the output of the current source and the input to the voltage buffers inthe IA were driven by low impedance voltages held slightly lower than the signal line voltageby passing the driving signal through a voltage divider.
An Agilent 33120A function generator was used to generate the input signal to thecircuit and a National Instruments PXI-5114 oscilloscope was used to record the outputsignals from the instrumentation amplifier and current-to-voltage converter circuits at 100times the input signal frequency. Pressure and load measurements were collected at 100 Hzusing a PXI-6221 DAQ card. A PXI-7340 motion controller was used to control the linear
Bioimpedance of soft tissue under compression 1099
stage. A Labview program was used to control the instrumentation hardware and record theexperimental measurements.
2.2. Experimental procedure
Eight porcine spleen samples were tested from three animals. For each trial, the bottom ofthe tissue chamber was determined by lowering the bioimpedance probe into the empty tissuechamber until a load is detected by the load cell. The tissue sample was placed inside thetissue chamber and the bioimpedance probe was lowered until continuity was measured acrossthe outer electrodes indicating the top of the tissue. A 60 μARMS current at 13 frequenciesfrom 100 Hz to 1 MHz (100 Hz, 200 Hz, 500 Hz, 1 kHz, 2 kHz, 5 kHz, 10 kHz, etc) waspassed through the tissue and bioimpedance measurements were recorded using a PXI-5044oscilloscope. Measurements at frequencies above 100 kHz were used only to characterize straycapacitance in the experimental setup. The tissue was then compressed using the bioimpedanceprobe to a 10% strain level at a rate of 1.5 mm s−1 while recording the resultant pressure on thetissue. Once the tissue had relaxed (pressure measurement decreased less than 5 kPa min−1)additional bioimpedance measurements were recorded. This cycle of compressing the tissue,recording the resultant tissue stress, and taking bioimpedance measurements after the tissuehas relaxed was repeated in 10% strain increments until an 80% strain level had been reached.
It is well known that the electrical conductivity of tissue exhibits a temperature dependenceof approximately 2%/◦C (Schwan and Foster 1980). Both high current densities and high strainrates can potentially increase tissue temperature and influence impedance measurements.Current densities were maintained low enough to avoid temperature increases in the tissue(Littwitz et al 1990). Also, the linear stage velocity did not exceed 1.5 mm s−1 in order tomaintain low strain rates and avoid unwanted development of thermal energy due to frictionduring compression. Bioimpedance measurements were taken after the tissue had reacheda point near relaxation, allowing for any thermal energy generated during compression todissipate.
2.3. Data conditioning
Various factors are known to influence bioimpedance measurements and should be removedbefore analysis is performed. For this study, the recorded data is conditioned to removeinfluences from the operational amplifiers in the circuitry, distance of the bioimpedanceelectrodes to the bottom of the tissue chamber, and stray capacitance.
2.3.1. Characterization of the bioimpedance circuitry. The output signal produced by acircuit can be influenced in unintended ways due to issues such as input capacitance, bandwidth,slew rate limitations, and input/output impedances of the operational amplifiers used in thecircuit and must be accounted for (Wojslaw and Moustakas 1986).
To characterize the response of the current-to-voltage converter circuitry, a known currentwas generated by passing a voltage signal through a known load placed in series with the inputto the circuit. The input signal was compared to the output signal for gain and phase shift tocharacterize the circuit.
To characterize the voltage-controlled current source circuit, the current output was passedthrough resistances in the range of interest (100 to 100 k�) which were then placed in serieswith the current-to-voltage converter circuit. While the impedance of the tissue was notexpected to be greater than 5 k�, contact impedance at low frequencies must also be drivenby the current source so a larger load is tested to ensure adequate capabilities of the current
1100 R E Dodde et al
source at low frequencies. The measured output current versus frequency for each load wascharacterized.
To characterize the instrumentation amplifier circuitry, a differential voltage signal inthe range of interest (3 to 300 mVRMS) was input into the front-end buffers using a functiongenerator. Considering a current input of 60 μARMS, this differential voltage range covers thedifferential voltage signal expected from impedances ranging from 50–5 k�. The input signalwas compared to the output signal for gain and phase shift to characterize the circuit. Anydetected phase shift was subsequently subtracted from the measured phase shift when takinga bioimpedance measurement.
2.3.2. Characterization of the influence of bioimpedance probe proximity to the bottom ofthe tissue chamber. As the tissue is compressed, the bioimpedance probe gets closer to thebottom of the acrylic tissue chamber which has much higher impedance than the tissue. It haspreviously been shown that impedance measurements are dependent on the distance of theprobe to other dissimilar materials, especially as the change in impedance between differinglayers increases (Tsai 2000, Kottam 2004, Steendijk et al 1993).
To characterize the experimental setup for this influence, the impedances of three knownsaline solution concentrations (0.9%, 0.125% and 0.01%) covering the region of interest forexpected loads (50–5 k�) were measured as a function of h. In this study, h is defined asthe distance (mm) between the bioimpedance probe electrodes and the bottom of the tissuechamber. No changes in the impedance magnitude (|Z|) were noticed when increasing h beyond11 mm, so all saline impedance data were normalized to the measurement made at h = 11 mm,denoted as |Z|∗. The influence h has on |Z| during a tissue test is removed by dividing themeasured |Z| by the corresponding |Z| at the same h measured in the saline tests normalizedto |Z|∗.
2.3.3. Characterization of Hook effect. Stray capacitance to ground is a known concern whenperforming bioimpedance measurements (Scharfetter 1998, Bolton et al 1998, McEwan et al2007). Sources of stray capacitance include the coaxial cables connecting the bioimpedancecircuit to the bioimpedance probe, traces on the bioimpedance circuit PCB board, and routesto ground through the acrylic tissue chamber. The methodology of Buendıa et al (2010)for removing the effect of stray capacitance on bioimpedance measurements is used in thisexperiment. Due to the negligible susceptance (Im|Y |, where Y = 1/Z) of tissue at highfrequencies, the stray capacitance (Cp) is estimated by the slope of the graph of susceptanceplotted against natural frequency (ω, where ω = 2π f ). Susceptance values from bioimpedancemeasurements taken at 200 kHz, 500 kHz and 1 MHz were plotted against ω and a linear fitcalculated to estimate Cp. Its influence on the measurement reading was removed using thefollowing relationship:
Zc = Zme−log(1−jωCpZm) (1)
where Zc is the conditioned impedance measurement after removing Cp, Zm is the measuredimpedance and j is
√−1 (Buendıa, et al 2010).
2.4. Cole–Cole model parameter fitting
The real part of the conditioned data was fit to a Cole–Cole model using a non-linear leastsquares fitting trust-region algorithm as discussed by Ayllon et al (2009):
R(ω) = R∞ +(R0 − R∞)
(1 + (
ωωc
)αcos
(απ2
))
1 + 2(
ωωc
)αcos
(απ2
) + (ωωc
)2α, (2)
Bioimpedance of soft tissue under compression 1101
(a) (b)
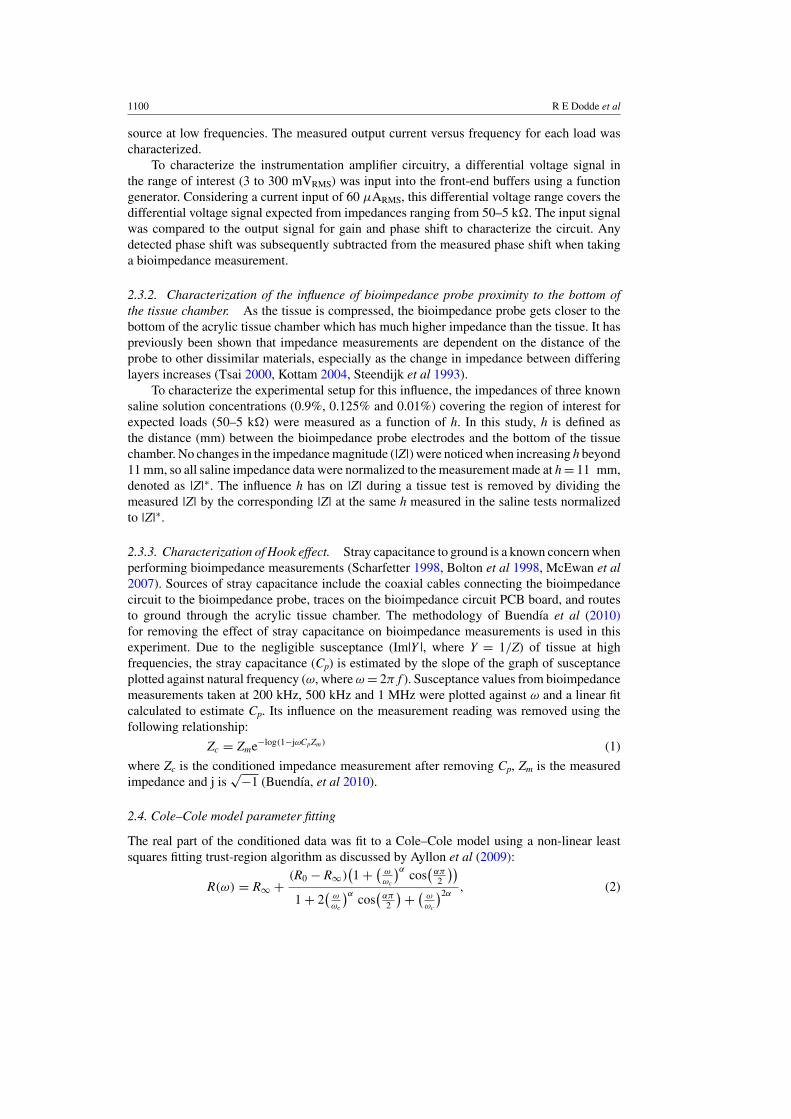
Figure 3. Results from the experimental characterization. (a) Plot of phase shift (degrees) versusfrequency (Hz) for varying differential voltage inputs into the instrumentation amplifier. Negligiblephase shift is seen for frequencies up to 10 kHz with increasingly negative phase shifting after thatwith increasing frequency. Phase shifts at 100 kHz and 1 MHz were measured at −5.9◦ and −54.4◦,respectively. (b) Plot of measured impedance magnitude (|Z|) as a function of the bioimpedanceprobe depth (h) for saline solutions of 0.9%, 0.125%, and 0.01% concentrations at 10 frequencypoints from 100 Hz–100 kHz. All data points were normalized to the |Z| at h = 11 mm (|Z|∗). Errorbars in (b) are standard error (n = 30). The plot shows that as the bioimpedance probe approachesthe bottom of the tissue chamber (decreasing h), the measured |Z| increases in a consistent mannerwhich is frequency and load independent.
where R(ω) is the real part of the bioimpedance measurement at frequency ω, R∞ isthe resistance at infinite frequency, R0 is the resistance at zero frequency (dc), ωc is thecharacteristic frequency, and α is the dispersion coefficient. The extracellular resistance (Rext),intracellular resistance (Rint), and bulk membrane capacitance (Cm) can be extracted from thefitted data using the following equations:
Rext = R0 (3)
Rint = R∞R0
R∞ − R0(4)
Cm = 1
ωc(Rint + Rext). (5)
3. Results
Findings for the experimental setup characterization, compression-dependent bioimpedancemeasurements, and the relationship between peak pressure and intracellular resistance aregiven below.
3.1. Characterization of experimental setup
Factors influencing the bioimpedance measurements were found to come from the IA circuitry,distance between the bioimpedance electrodes and the bottom of the tissue chamber, and straycapacitance within the experimental setup. Future versions of the bioimpedance circuitry willtake these influences into account and condition the data in real-time. In this study, theseinfluences were removed during post-processing.
Figure 3(a) shows the influence of frequency on the phase reading form the IA circuitryat differential input voltage signals of 3, 30, and 300 mVRMS. In an ideal instrumentation

1102 R E Dodde et al
Figure 4. Nyquist plot of the absolute value of the imaginary part of the impedance (Reactance)against the real part of the impedance (Resistance) showing the development of the measured datafrom raw data (Zraw) to conditioned data (Zcon) to final fitted data (Zfit) in the Cole–Cole model.The figure shows that the findings during the experimental characterization do not affect the lowfrequency data points (points further to the right in the figure) but have an increasingly importantrole in the measured raw data at high frequencies (points further to the left in the figure). The blackdashed arrows show the change to the impedance at 100 kHz from the raw data (blue star) to theconditioned data (blue solid circle) to the fitted data (black solid circle).
amplifier, there would be zero phase shift between the input and output signal. For the IAcircuitry in this study, negligible phase shift is seen for frequencies up to 10 kHz with anincreasingly negative phase shift with increasing frequency beyond 10 kHz. Phase shifts at100 kHz and 1 MHz were measured at −5.9◦ and −54.4◦, respectively. The phase shiftis independent of the differential input voltage over a range of 3–300 mV and is thereforeindependent of the tissue sample impedance in the range of 50–5 k�. The gain for the IAcircuitry is constant at 26 dB (gain of 20 V V−1) over the frequency range of interest (100 Hz–100 kHz).
Average measurements and standard error (n = 30) of |Z| for frequencies between 100–100 kHz and 0.01%, 0.125%, and 0.9% saline concentrations as a function of h are shown infigure 3(b). The data for each saline concentration was normalized to |Z|∗ before averagingto show the influence of h independent of the saline concentration. The figure shows thath influences |Z| in a consistent manner over a large range of saline concentrations and isconsistent with finite element calculations performed to mirror this situation. The measured|Z| increases as the h decreases; however, the increase is independent of saline concentration,and therefore impedance, over the frequency range of 100 Hz–100 kHz. This result is consistentwith results published by Tsai (Tsai 2000) which show that as a bioimpedance probe gets closerto a second material, in this case the bottom of the acrylic tissue chamber, the electric fieldbecomes increasingly influenced by its presence resulting in a change in the apparent voltagedrop measured by the bioimpedance probe. The average uncompressed tissue thickness was9.2 mm (standard error 0.46 mm and n = 8). At 80% compression, the tissue is 1.8 mm thickwhich results in an apparent increase in |Z| of 2.29 times the |Z| measured at an h of 11 mm.There was no influence of h on the measured phase shift.
The average calculated stray capacitance, Cp, was 404 pF (standard error of 40 pF andn = 72). As frequency increases, the electrical current is increasingly able to use this straycapacitance pathway to ground without being measured by the current-to-voltage convertercircuitry which influences both the magnitude and phase of the measured bioimpedancemeasurement. In a Nyquist plot, this results in a characteristic tail developing on the left sideof the impedance loci (see Zraw in figure 4) which can be compensated for using equation (1).
Both the current-to-voltage converter and the voltage-controlled current source circuitsperformed as expected. The current-to-voltage converter was able to measure 60 μARMS for
Bioimpedance of soft tissue under compression 1103
impedances ranging from 50 �–100 k� over the frequency range of interest (100 Hz–100 kHz) with negligible phase shift induced on the output signal compared to the inputsignal. The voltage-controlled current source was able to drive a 60 μARMS current signalwith an output impedance of 950 k� through 100. These loads are large enough to driveboth the tissue and anticipated contact impedances over the frequency range of interest(Schwan 1968a).
The frequency-dependent phase shift from the IA, change in |Z| due to h, and straycapacitance are each removed from the raw bioimpedance measurement (Zraw) as discussedabove. After data conditioning is performed to account for these influences, the circuitry iscapable of measuring tissue bioimpedance in the frequency range of 100 Hz–100 kHz and arange of impedance loads 100 �–5 k� as discussed below in section 3.2.
3.2. Compression-dependent bioimpedance measurements
Figure 4 shows a Nyquist plot of the Zraw, conditioned measurement (Zcon), and a least squaresfit to a Cole–Cole model (Zfit) of a porcine spleen tissue sample. The measurement was takenat 50% compression and a height (h) of 6.20 mm, or a tissue with an uncompressed heightof 12.40 mm. Zraw is conditioned for the effects of the circuitry, h, and stray capacitance asdescribed above in section 3.1. This conditioned data (Zcon) is fit to a Cole–Cole model (Zfit) asdescribed in section 2.4 and is plotted at each experimental frequency point (black solid circle)and as a continuous function (black line). The average root mean squared error (RMSE) forthe fitting of Zcon to the Cole–Cole model was 18.7 � (standard error = 1.1 � and n = 72).The figure shows that the experimental characterization performed primarily affects the dataat frequencies of 5 kHz and higher (points further to the left in the figure). The black dashedarrows show the change to the impedance data point measured at 100 kHz from the raw data(blue star) to the conditioned data (blue solid circle) to the fitted data (black solid circle).
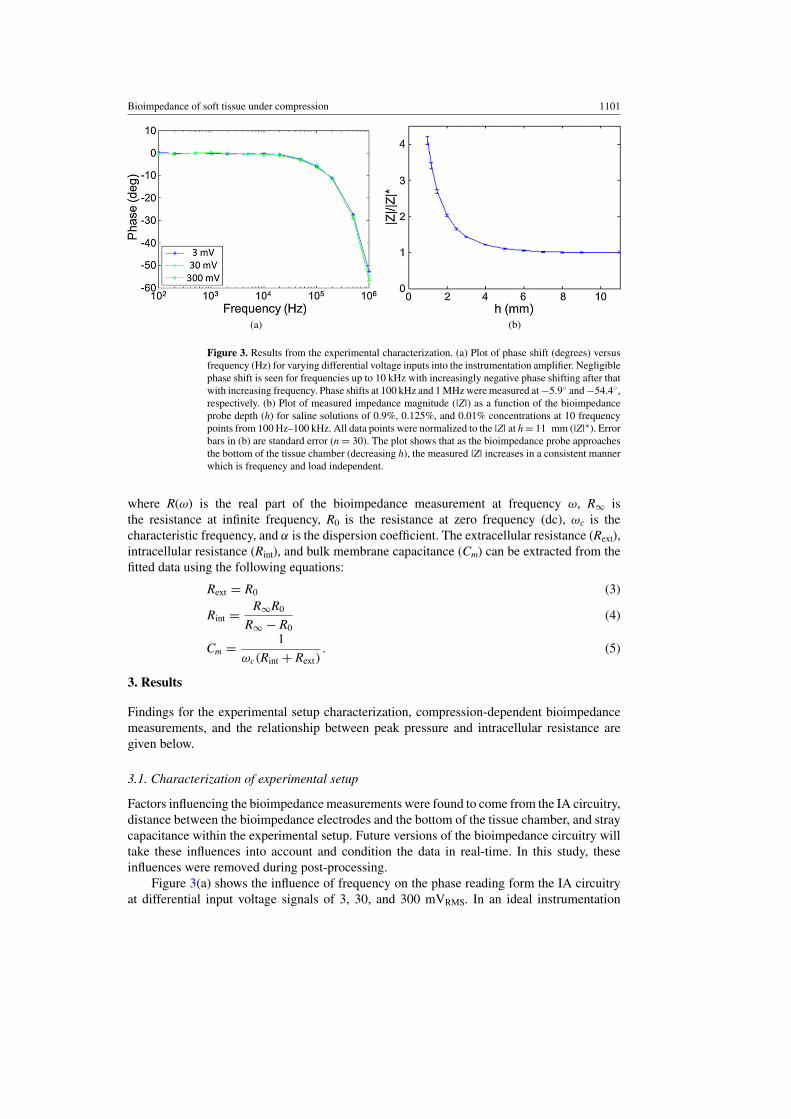
Changes to the Cole–Cole fitted impedance loci for a sample porcine spleen tissueundergoing compression from 0–80% are shown together in a Nyquist plot in figure 5. Atcompression levels of up to 50% the loci diameters decrease slightly while the center of theloci shifts to the right along the real axis as compression is increased, correlating to an increasein the real component of impedance at each frequency. At compression levels greater than50%, the loci diameters collapse more dramatically while shifting back to the left along thereal axis with increasing compression, indicating a decrease in interstitial resistance (from theshift in the loci to the left along the real axis) and an increase in intracellular resistance (fromthe decrease in loci diameter).
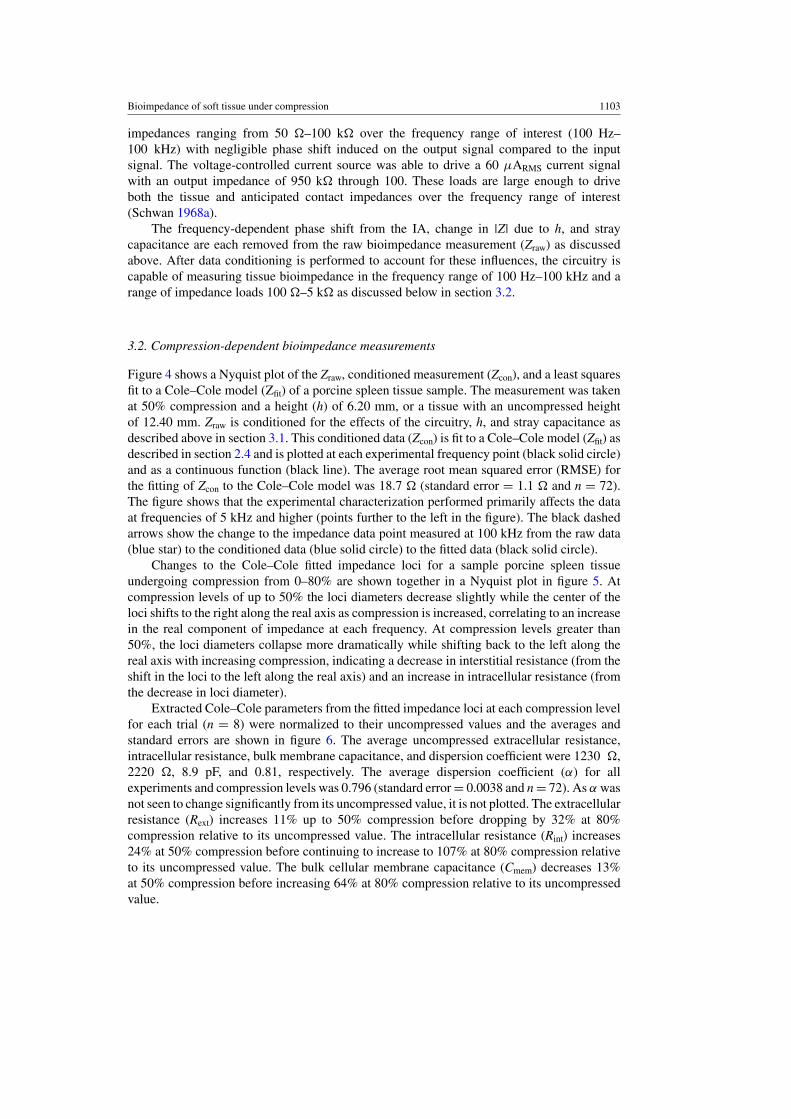
Extracted Cole–Cole parameters from the fitted impedance loci at each compression levelfor each trial (n = 8) were normalized to their uncompressed values and the averages andstandard errors are shown in figure 6. The average uncompressed extracellular resistance,intracellular resistance, bulk membrane capacitance, and dispersion coefficient were 1230 �,2220 �, 8.9 pF, and 0.81, respectively. The average dispersion coefficient (α) for allexperiments and compression levels was 0.796 (standard error = 0.0038 and n = 72). As α wasnot seen to change significantly from its uncompressed value, it is not plotted. The extracellularresistance (Rext) increases 11% up to 50% compression before dropping by 32% at 80%compression relative to its uncompressed value. The intracellular resistance (Rint) increases24% at 50% compression before continuing to increase to 107% at 80% compression relativeto its uncompressed value. The bulk cellular membrane capacitance (Cmem) decreases 13%at 50% compression before increasing 64% at 80% compression relative to its uncompressedvalue.
1104 R E Dodde et al
Figure 5. Nyquist plot of the absolute value of the imaginary part of the impedance (Reactance)against the real part of the impedance (Resistance) showing the development of the fitted impedanceloci measured in porcine spleen tissue for 0–80% tissue compression. At lower compression levels(<50%), the figure shows the loci shifting to the right along the real axis while the loci diameterdecreases slightly indicating an increase in intracellular and interstitial resistances. At highercompression levels (>50%), the figure shows a more dramatic shift to the left along the real axisof the loci with a corresponding collapse of the loci diameter indicating a decrease in interstitialresistance (loci shifting to the left along the real axis)along with a continuing increase in intracellularresistance (loci diameter collapse).
(a) (b) (c)
Figure 6. Summary of compression-dependent Cole–Cole parameter values normalized to theirvalues at zero strain. (a) Plot of the interstitial resistance (Rext) as a function of percent compression.The plot shows an increase in Rext at low compression levels (<50%) and a subsequent decrease inRext as compression is increased beyond 50%. (b) Plot of intracellular resistance (Rint) as a functionof percent compression. The plot shows a steady increase in Rint with increasing compressionresulting in a doubling of Rint at 80% compression. (c) Plot of bulk tissue capacitance (Cmem) asa function of percent compression. The plot shows a decrease in Cmem at low compression levels(<50%) and a subsequent increase in Cmem as compression is increased beyond 50%. Error barsare standard error (n = 8).
3.3. Peak pressure versus intracellular resistance
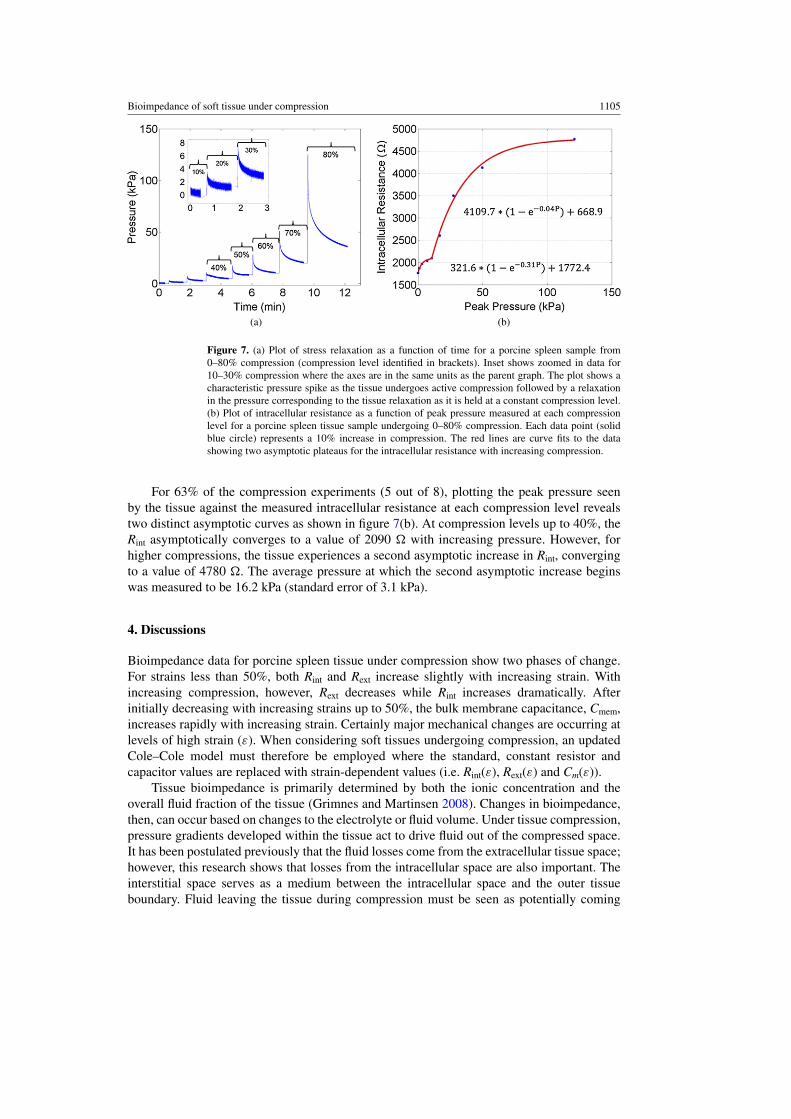
The experimentally measured stress relaxation during one test from 0–80% compression isshown in figure 7(a). As the porcine spleen is compressed, a large pressure spike develops inthe tissue before relaxing to a steady-state pressure higher than the pressure value just prior tocompression typical of visco- and poro-elastic materials.
Bioimpedance of soft tissue under compression 1105
(a) (b)
Figure 7. (a) Plot of stress relaxation as a function of time for a porcine spleen sample from0–80% compression (compression level identified in brackets). Inset shows zoomed in data for10–30% compression where the axes are in the same units as the parent graph. The plot shows acharacteristic pressure spike as the tissue undergoes active compression followed by a relaxationin the pressure corresponding to the tissue relaxation as it is held at a constant compression level.(b) Plot of intracellular resistance as a function of peak pressure measured at each compressionlevel for a porcine spleen tissue sample undergoing 0–80% compression. Each data point (solidblue circle) represents a 10% increase in compression. The red lines are curve fits to the datashowing two asymptotic plateaus for the intracellular resistance with increasing compression.
For 63% of the compression experiments (5 out of 8), plotting the peak pressure seenby the tissue against the measured intracellular resistance at each compression level revealstwo distinct asymptotic curves as shown in figure 7(b). At compression levels up to 40%, theRint asymptotically converges to a value of 2090 � with increasing pressure. However, forhigher compressions, the tissue experiences a second asymptotic increase in Rint, convergingto a value of 4780 �. The average pressure at which the second asymptotic increase beginswas measured to be 16.2 kPa (standard error of 3.1 kPa).
4. Discussions
Bioimpedance data for porcine spleen tissue under compression show two phases of change.For strains less than 50%, both Rint and Rext increase slightly with increasing strain. Withincreasing compression, however, Rext decreases while Rint increases dramatically. Afterinitially decreasing with increasing strains up to 50%, the bulk membrane capacitance, Cmem,increases rapidly with increasing strain. Certainly major mechanical changes are occurring atlevels of high strain (ε). When considering soft tissues undergoing compression, an updatedCole–Cole model must therefore be employed where the standard, constant resistor andcapacitor values are replaced with strain-dependent values (i.e. Rint(ε), Rext(ε) and Cm(ε)).
Tissue bioimpedance is primarily determined by both the ionic concentration and theoverall fluid fraction of the tissue (Grimnes and Martinsen 2008). Changes in bioimpedance,then, can occur based on changes to the electrolyte or fluid volume. Under tissue compression,pressure gradients developed within the tissue act to drive fluid out of the compressed space.It has been postulated previously that the fluid losses come from the extracellular tissue space;however, this research shows that losses from the intracellular space are also important. Theinterstitial space serves as a medium between the intracellular space and the outer tissueboundary. Fluid leaving the tissue during compression must be seen as potentially coming
1106 R E Dodde et al
from both the intracellular and extracellular spaces. Understanding where this fluid comesfrom can play an important role in determining the underlying mechanisms for changes intissue under compression. Bioimpedance can be used to decipher between these two changesand is therefore a promising technique to be used in studying compressive tissue injuriessuch as blunt trauma and traumatic brain injury. Additionally, considering the sensitivity ofbioimpedance to the volume fraction of fluid in tissue, bioimpedance could theoretically beused to quantify hydration status in edematous patients such as in dialysis.
The intracellular impedance of porcine spleen tissue under compression experiences twoasymptotic increases when plotted against its peak pressure seen during each level of inducedstrain (figure 7(b)). It is hypothesized that the asymptotic increase at low pressures may bedue to intracellular fluid losses to the extracellular space through the cell membrane, possiblythrough aquaporin activation (Ishibashi et al 2009). The increase may also be in part due tothe reshaping of cells from a spherical to oblong orientation. The reshaping of cells undercompression has been documented previously (Demou 2010, Haudenschild et al 2009) andmay lead to an apparent intracellular impedance change due to the shifting of field lines throughcells. Additionally, the decreasing Cmem could initially result from cell membranes contactingeach other resulting in a serializing of the cell membranes and decreasing capacitance.
There are at least two distinct physiological phenomena that can explain the secondasymptotic intracellular impedance increase observed at higher pressures. The first theoryconsiders the case of cell rupture. Whereas at low increasing strains both interstitial andintracellular spaces see a decrease in conductance (or increased resistance), during increasingstrains over 50% the conductance of the interstitial space begins to increase. The fluidic andionic flux of the intracellular space during compression depends on losses to the outside as wellas any gains/losses from the intracellular space. Cell membrane rupture results in intracellularcontents from ruptured cells entering into the interstitial space creating a simultaneous dropin Rext while increasing Rint. The increase in Cmem at higher strains would result from the lossof the cell membrane during cell rupture. This would be the equivalent of removing a seriescapacitor, creating a more parallel system and increasing Cmem.
The second theory involves the mass exudation of cellular material from the compressedspace. In this scenario, cell membranes may not rupture, but increasing stress from compressioneventually overcomes the proteinaceous adhesive bonds between the cell and other cells (cell-cell adhesion) and between the cell and the extracellular matrix (cell-ECM adhesion) (Ingber2006). Radial pressure gradients may force the cells out of the measurement space of thebioimpedance probe, leaving behind mostly fluid. At high compression levels, what wouldbe left behind is a lower intracellular volume resulting in an increased Rint and an increasedCmem due to the loss of ‘series’-ness in the cellular membranes.
These two theories, however, are not mutually exclusive. It is possible that both cellrupture and adhesion force breakdown may occur simultaneously. Further research is neededto determine which, if either, of these two theories is occurring at high tissue compression.
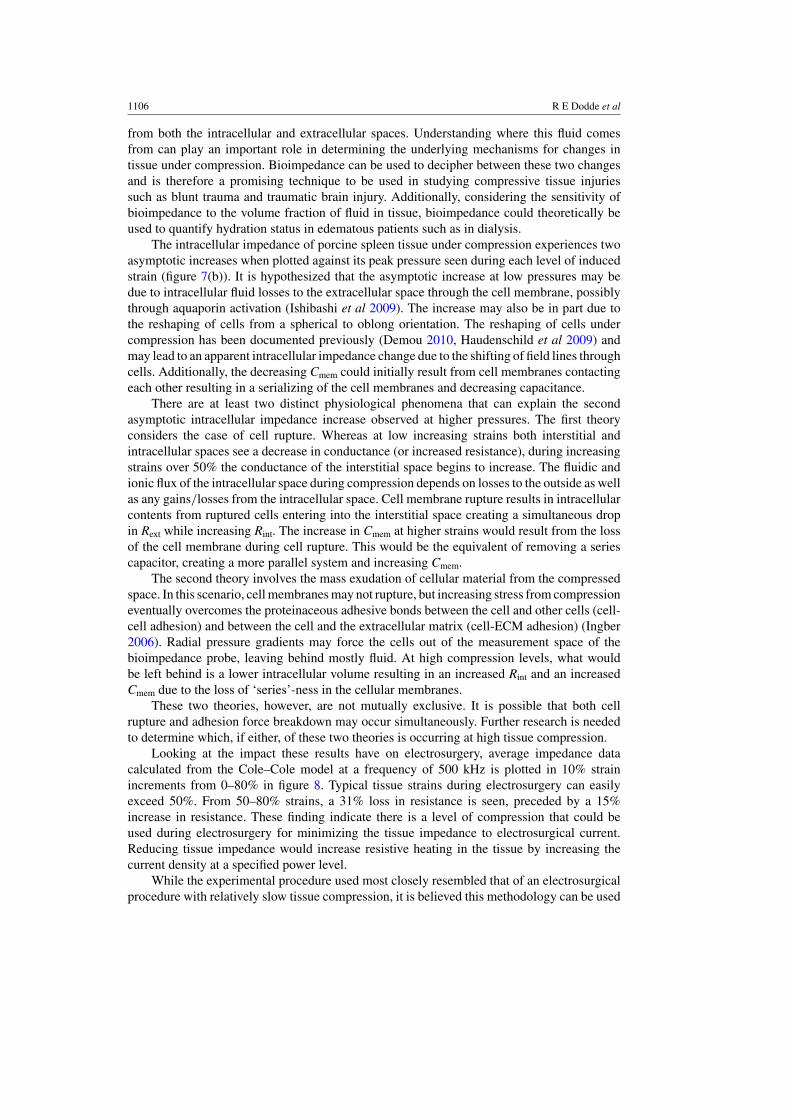
Looking at the impact these results have on electrosurgery, average impedance datacalculated from the Cole–Cole model at a frequency of 500 kHz is plotted in 10% strainincrements from 0–80% in figure 8. Typical tissue strains during electrosurgery can easilyexceed 50%. From 50–80% strains, a 31% loss in resistance is seen, preceded by a 15%increase in resistance. These finding indicate there is a level of compression that could beused during electrosurgery for minimizing the tissue impedance to electrosurgical current.Reducing tissue impedance would increase resistive heating in the tissue by increasing thecurrent density at a specified power level.
While the experimental procedure used most closely resembled that of an electrosurgicalprocedure with relatively slow tissue compression, it is believed this methodology can be used
Bioimpedance of soft tissue under compression 1107
Figure 8. Plot of the measured tissue impedance |Z| at standard electrosurgical frequency of 500kHz as a function of tissue compression. Error bars are standard error (n = 8). The plot showsan initial increase in |Z| through 50% compression with a subsequent decline in impedance ascompression is increased further.
to analyze more complex phenomenon such as traumatic brain injury where tissue compressionoccurs on the order of milliseconds. Acquiring bioimpedance measurements over the entirecycle of tissue relaxation following a traumatic event may allow for analysis of how thecellular structure of tissue changes during as well as in the short and long term after suchan event. However, care will need to be exercised in the analysis of real-time bioimpedancemeasurements using the tetrapolar technique due to the complex distribution of measurementsensitivity when using this approach. The appearance of negative sensitivity regions could giverise to erroneous conclusions as relative increases in impedance in these regions would yieldmeasurements of decreasing impedance (Grimnes and Martinsen 2007). Under quasi-staticconditions such as those employed in the current study, this impact is assumed to be averagedout by the tissue reaching a point of relaxation. However, in the dynamic case, this assumptioncannot be made.
Analysis of the bioimpedance data could be aided by performing histology. However,initial histology performed on the compressed tissue samples in this study proved inconclusivein determining the cellular level changes in tissue at high compression. This is believed due tothe natural relaxation of the tissue after the strain was removed. Additionally, while adequatesteps were taken to prevent thermal effects from influencing the data, the addition of thermalmonitoring to the experimental setup would allow for any thermal effects to be accounted forin the results.
5. Conclusions
This research quantified the impact that tissue compression has on bioimpedancemeasurements. At strains of 80% intracellular resistance increased 107%, bulk membranecapacitance increased 64%, and interstitial resistance decreased 32% relative to theiruncompressed values. As opposed to previous assumptions that the loss of fluid duringtissue compression is primarily from the extracellular space, these findings suggest thatintracellular fluid losses are a critical component. Histology performed on the tissue sampleswas inconclusive as to the exact nature of change in the highly compressed tissue, but giventhe appearance of relatively unharmed cellular structures, cell rupture is believed to notbe the major physiological phenomena responsible for the increase in Rint. However, an

1108 R E Dodde et al
exudation of cellular material after adhesion forces are broken at higher pressures may besatisfactory to explain the bioimpedance changes seen in the tissue. Performing histologyon tissue samples while still under compression could aid in determining the underlyingmechanism of bioimpedance change seen in this data and is a future research direction. Theability for bioimpedance measurements to distinguish intracellular and extracellular events intissue during compression may also have uses in quantifying the changes in the fluid phaseof poroelastic materials and in understanding injury mechanisms in cases such as traumaticbrain injury.
References
Abramowitch S D 2004 An improved method to analyze the stress relaxation of ligaments following a finite ramptime based on the quasi-linear viscoelastic theory J. Biomech. Eng. 126 92
Ackmann J J 1993 Complex bioelectric impedance measurement system for the frequency range from 5 Hz to 1 MHzAnn. Biomed. Eng. 21 135–46
Ayllon D, Seoane F and Gil-Pita R 2009 Cole equation and parameter estimation from electrical bioimpedancespectroscopy measurements—a comparative study Conf. Proc. IEEE Eng. Med. Biol. Soc. 2009 p 3779
Berry G P, Bamber J C, Mortimer P S, Bush N L, Miller N R and Barbone P E 2008 The spatio-temporal strainresponse of oedematous and nonoedematous tissue to sustained compression in vivo Ultrasound Med.Biol. 34 617–29
Bolton M P, Ward L C, Khan A, Campbell I, Nightingale P, Dewit O and Elia M 1998 Sources of error in bioimpedancespectroscopy Physiol. Meas. 19 235
Bouty E 1884 Sur la conductibilite electrique des dissolutions salines tres etendues J. Phys. 3 325–55Bowdler A J 2002 The Complete Spleen: Structure, Function, and Clinical Disorders (Totowa, NJ: Humana Press)Brown B H, Wilson A J and Bertemes-Filho P 2000 Bipolar and tetrapolar transfer impedance measurements from
volume conductor Electron. Lett. 36 2060–2Buendıa R, Seoane F and Gil-Pita R 2010 A novel approach for removing the hook effect artefact from electrical
bioimpedance spectroscopy measurements J. Phys.: Conf. Ser. 224 012126Cole K S and Cole R H 1941 Dispersion and absorption in dielectrics: I. Alternating current characteristics J. Chem.
Phys. 9 341–51Demou Z N 2010 Gene expression profiles in 3D tumor analogs indicate compressive strain differentially enhances
metastatic potential Ann. Biomed. Eng. 38 3509–20Dodde R E, Miller S F, Geiger J D and Shih A J 2008 Thermal-electric finite element analysis and experimental
validation of bipolar electrosurgical cautery J. Manuf. Sci. Eng. 130 021015Eaton J 2005 Kinetics and mechanics of injury Principles and Practice of Trauma Nursing ed R A O’Shea (Edinburgh:
Elsevier) pp 15–35Fung Y C 1993 Biomechanics: Mechanical Properties of Living Tissues (New York: Springer-Verlag)Gonzalez-Correa C A 2005 Electrical bioimpedance readings increase with higher pressure applied to the measuring
probe Physiol. Meas. 26 S39Grimnes S and Martinsen Ø G 2007 Sources of error in tetrapolar impedance measurements on biomaterials and other
ionic conductors J. Phys. D: Appl. Phys. 40 9–14Grimnes S and Martinsen Ø G 2008 Bioimpedance and Bioelectricity Basics (London: Academic)Haudenschild A, Hsieh A, Kapila S and Lotz J 2009 Pressure and distortion regulate human mesenchymal stem cell
gene expression Ann. Biomed. Eng. 37 492–502Ingber D E 2006 Cellular mechanotransduction: putting all the pieces together again FASEB J. 20 811Ishibashi K, Hara S and Kondo S 2009 Aquaporin water channels in mammals Clin. Exp. Nephrol. 13 107–17Jakosky J J 1961 Exploration Geophysics (Newport Beach, CA: Trija Pub. Co.)Keshtkar A 2008 The effect of applied pressure on the electrical impedance of the bladder tissue using small and
large probes J. Med. Eng. Technol. 32 505–11Kottam A 2004 Electric field penetration depth of myocardial surface catheters and the measurement of myocardial
resistivity Biomed. Sci. Instrum. 449 155–60Littwitz C, Ragheb T and Geddes L 1990 Cell constant of the tetrapolar conductivity cell Med. Biol. Eng.
Comput. 28 587–90McEwan A, Cusick G and Holder D S 2007 A review of errors in multi-frequency EIT instrumentation Phys.
Meas. 28 S197–215
Bioimpedance of soft tissue under compression 1109
Mow V C, Kuei S C, Lai W M and Armstrong C G 1980 Biphasic creep and stress relaxation of articular cartilage incompression—theory and experiments J. Biomech. Eng. 102 73–84
Pena A, Bolton M D and Pickard J D 1998 Cellular poroelasticity: a theoretical model for soft tissue mechanicsPoromechanics 475–80
Rosen J, Brown J D, De S, Sinanan M and Hannaford B 2008 Biomechanical properties of abdominal organs in vivoand postmortem under compression loads J. Biomech. Eng. 130 021020
Rylander C G, Stumpp O F, Milner T E, Kemp N J, Mendenhall J M, Diller K R and Welch A J 2006 Dehydrationmechanism of optical clearing in tissue J. Biomed. Opt. 11 041117
Scharfetter H 1998 A model of artefacts produced by stray capacitance during whole body or segmental bioimpedancespectroscopy Physiol. Meas. 19 247
Schwan H 1968a Electrode polarization impedance and measurements in biological materials Ann. N. Y. Acad.Sci. 148 191–209
Schwan H P 1968b Four-electrode null techniques for impedance measurement with high resolution Rev. Sci.Instrum. 39 481–5
Schwan H P and Foster K R 1980 RF-field interactions with biological systems: electrical properties and biophysicalmechanisms Proc. IEEE 68 104–13
Steendijk P, Baan J, Mur G and Van Der Velde E T 1993 The four-electrode resistivity technique in anisotropic media:theoretical analysis and application on myocardial tissue in vivo IEEE Trans. Biomed. Eng. 40 1138–48
Tamura A, Omori K, Miki K, Lee J B, Yang K H and King A I 2002 Mechanical characterization of porcine abdominalorgans Stapp Car Crash J. 46 55
Tsai J Z 2000 Dependence of apparent resistance of four-electrode probes on insertion depth IEEE Trans. Biomed.Eng. 47 41–8
Wojslaw C F and Moustakas E A 1986 Operational Amplifiers: the Devices and Their Applications (New York:Wiley)