nielsen podcast insights - radioink.com the connection between consumer purchase behavior and...
TRANSCRIPT

NIELSEN PODCAST INSIGHTS A MARKETER’S GUIDE TO PODCASTING Q1 2018
Copyright © 2018 The Nielsen Company (US), LLC. All Rights Reserved.

2
BRUCE SUPOVITZ SVP, SALES DIRECTORNIELSEN AUDIO
More and more advertisers are investigating and experimenting with podcast advertising. In this report, we turn the spotlight on three new product categories from Nielsen’s Fanlinks Survey: Juice, milk and cereal. These are not niche products. These are mainstream products that nearly all U.S. consumers buy on a frequent basis. Just the kind of brand-level advertisers that the medium of podcasting needs to attract.
This report also looks at the increasing role of Smartphones in podcast usage along with a summary of Nielsen’s Brand Lift studies conducted specifically for Podcast networks. We encourage you to share this report with clients or add this data to your own presentations. Please contact your Nielsen rep for more information.
BRUCE
ADVANCING PODCASTSA lot can change in a year. The medium of podcasting continues to evolve as it engages and entertains growing audiences. Nielsen’s Fanlinks Survey asks households to rate their interest in overall podcasting as well as various genres of podcasts. The highest scores are tagged as “avid podcast fans.” In the fall of 2016, there were 13 million homes who identified as “avid fans.” In the fall of 2017, the number of homes who consider themselves “avid fans” surged to 16 million. Not only is the podcast audience growing, but the level of engagement is increasing.
AVID PODCAST FANS
2016
2017
1 MILLION HOUSEHOLDS =

Copyright © 2018 The Nielsen Company (US), LLC. All Rights Reserved. 3
SMARTPHONES DRIVE PODCAST USAGEIN THE PAST 30 DAYS, WHICH DEVICE HAVE YOU USED TO WATCH, LISTEN OR DOWNLOAD A PODCAST?
Source: Nielsen Scarborough USA+, Release 2 2014 - 2017, Adults 18+, watch, listen or download a podcast in past 30 days
SMARTPHONE
COMPUTER
TABLET
OTHER DEVICE
MILL
IONS
OF U
SERS
18+
2014 2015 2016 2017
1.0 1.1 1.01.7
3.9 4.4 4.6 5.0
9.5
13.0
17.0
23.9
9.3
9.8 9.8 10.4
157%INCREASE SINCE 2014
More than 23 million adults in the U.S. have listened to a podcast in the past month on a smartphone. That’s double the amount who listened on a computer in 2017. Three years ago, the computer is where the largest podcast audience could be found. From 2014 to 2017, the podcasting audience on smartphones increased by 157%. The growth of podcasting is being driven by smartphones.
While the Android operating system may be the most popular smartphone OS among all users, Apple’s legacy of podcasting gives it the upper hand among podcast listeners. 54% of the US podcast audience is on the Apple IOS ecosystem.
PODCAST LISTENERS ARE LOYAL TO THE APPLE ECOSYSTEM
42%
51%
54%
43%
ALL USERS PODCAST LISTENERS
IOS
ANDROID
OTHER
SMAR
TPHO
NE O
PERA
TING S
YSTE
M

MAKING THE CONNECTIONBETWEEN CONSUMER PURCHASE BEHAVIOR AND PODCAST AUDIENCES
4
BY MATCHING PURCHASE BEHAVIOR IN THE NIELSEN HOMESCAN PANEL TO FANS OF PODCASTS, NIELSEN IS ABLE TO QUANTIFY THE VALUE OF CONSUMERS WHO LISTEN TO PODCASTS.

5Copyright © 2018 The Nielsen Company (US), LLC. All Rights Reserved.
AUDIO VIDEO TAPES – CLEANING IMPLEMENT AND SUPPLY – DOG LITTER – FROZEN BAGELS – HAIR CARE ACCESSORIES – AUTOMOTIVE – CLEANING PAD SPONGE AND CLOTH – DRIED
FRUIT – FROZEN BAKED GOODS – HAIR COLORING – BABY ACCESSORY – CLOTHING DYE – DRY PASTA – FROZEN BREADED CHICKEN – HAIR GROWTH PRODUCT – BABY FOOD – COCKTAIL
MIXERS – DRY POTATO TOPPING – FROZEN BREAKFAST ENTREE – HAIR SPRAY AND HAIR STYLING PRODUCT –BABY FORMULA AND CHILD NUTRITIONAL DRINK – COFFEE – EAR DROP
AND MEDICATION – FROZEN BREAKFAST SANDWICH – HAIR TONIC –BABY HBC – COFFEE CREAMERS – EGG SUBSTITUTE – FROZEN CREAMERS – HAND AND BODY LOTION – BAKED
BREAD – COFFEE FILTER – EGGS – FROZEN EGG SUBSTITUTE – HARDWARE – BAKING MIXES – COFFEE MUGS AND FILTERS – ETHNIC BEAUTY CARE – FROZEN ENTREES – HERB AND
SPICE SEASONING – BAKING SUPPLIES – COMPUTER ACCESSORY – EXTRACTS – FROZEN FRUIT – HERBAL TEA – BAR AND LIQUID SOAP – COMPUTER SOFTWARE – EYE CARE – FROZEN
GRAVY AND SAUCE – HOME AND OUTDOOR WEATHER SUPPLY – BATH PRODUCTS – COOKIES – FABRIC SOFTENER – FROZEN JUICE – HOME AND SCHOOL AND OFFICE SUPPLY – BATH
TISSUE – COOKING SAUCE – FABRIC TREATMENTS – FROZEN PASTA – HOME DRY CLEANING KIT – BATTERIES – COOLERS – FACIAL CLEANSER AND MOISTURIZER – FROZEN PIZZA
– HOME HEALTH TESTING – BATTERY CHARGERS – COSMETICS – FACIAL TISSUES – FROZEN PIZZA CRUST – HOME PERMANENT PRODUCT – BEER AND MALT BASED BEVERAGES –
CRACKERS – FAMILY PLANNING – FROZEN POTATOES AND ONION RINGS – HOME TESTING KIT – BEER AND WINE MAKING KIT – CREAM – FEMININE HYGIENE – FROZEN SANDWICHES
– HONEY – BIRD ACCESSORIES – CREAM CHEESE – FILM – FROZEN SAUSAGE – HOT CEREAL – BIRD FOOD – DELI SALADS – FIRST AID – FROZEN SEAFOOD – HOT COCOA – BLEACH – DELI
TRAY – FIRST AID COTTONS AND SWABS – FROZEN SOUP CHILI STEW – HOT DOG – BOWLS – DEODORIZER AND FRESHENER AND SCENT – FIRST AID HOT AND COLD – FROZEN SWEET
GOODS – HOUSE AND CARRIERS – BOXED PREPARED DINNERS – DEPILATORY – FIRST AID OTHER – FROZEN TOASTER PASTRIES – HOUSEHOLD AREA ALLERGEN CONTROL – BREADING
AND STUFFING – DESSERTS – FISH CARE – FROZEN VEGETABLES – HOUSEHOLD CLEANING – BREAKFAST MEAT – DIABETIC – FISH FOOD – FROZEN WAFFLES PANCAKES AND FRENCH
TOAST – HOUSEHOLD PLASTICS – BUTTER – DIARRHEA REMEDY PRODUCT – FLASHLIGHT – FROZEN WHIPPED TOPPING – ICE – CAMPING – DIP DAIRY REFRIGERATED – FLEA AND
TICK PET PRODUCT – FRUIT – ICE CREAM – CANDLES – DIP DELI – FLORAL – FRUIT AND VEGETABLE WASH – ICE CREAM CONES – CANDY – DIP FROZEN – FLOUR AND MEAL – FRUIT
ENROBING KIT – ICE CREAM TOPPINGS – CANNED HAMS – DIPPING SAUCE – FOOD COLORING – GARDEN AND PATIO – IN STORE MEAL – CANNING SUPPLIES – DISH DETERGENT – FOOD
STORAGE AND LUNCH BAG – GLAZE MEAT – INSECT REPELLENT PRODUCT – CAT FOOD – DISPOSABLE BAGS – FOOD STORAGE AND WRAPS – GLOVES – INSECTICIDE AND PESTICIDE
– CAT LITTER – DISPOSABLE DIAPER AND TRAINING PANT – FOOT CARE – GRAIN AND DRY BEANS – INSTANT BREAKFAST – CATSUP – DISPOSABLE DISH – FRAGRANCES – GRAIN
CAKES – INSTANT TEA AND TEA DRINK MIX – CHARCOAL LOGS AND ACCESSORIES – DOG CONTROL – FRESH DESSERTS – GUM – INSULATED CONTAINERS – CHEESE – DOG FOOD –
FROZEN APPETIZER – GUM WITH PREMIUM – ISOTONIC BEVERAGE – JAM AND JELLY AND PRESERVES – MILK MODIFIERS – PICKLE AND RELISH – REFRIGERATED WRAPS – SOUR CREAM –
JOCK ITCH PRODUCT – MOTH PREVENTATIVE – PIE CRUSTS MIXES AND PREPARED – RICE – SPECIALTY GRAIN – KITCHEN ACCESSORY – MOTION SICKNESS – PIE FILLING – RODENTICIDE
AND TRAP – SPORTING GOODS – KITCHEN MATCH – MUSTARD – PIEROGIE FROZEN – RTE CEREAL – STOMACH UPPER G.I. – LAUNDRY AND IRONING ACCESSORY PRODUCT – NEW AGE
BEVERAGE – PIZZA KITS – SALAD DRESSING – SUGAR – LAUNDRY DETERGENT – NOVELTY – PIZZA SAUCE – SALAD TOPPING – SUNBURN TREATMENT – LAWN AND SOIL FERTILIZER
AND TREATMENT – NUTRITIONAL – POULTRY FRESH – SALTY SNACKS – SUNTAN PRODUCTS – LICE TREATMENT – NUTS – POULTRY FROZEN – SALTY SNACKS DIP – SUSHI – LIGHT
BULBS – OLIVES – POWDERED INSTANT DRINKS – SAUCE MIX GRAVY MIX AND SEASONING MIX – TEA PACKAGED AND BAGS – LIQUID COFFEE – ORAL HYGIENE – PREMIXED ALCOHOL
COCKTAIL – SAUSAGE FRESH – TELEPHONE AND ACCESSORY – LIQUID TEA – ORIENTAL SAUCE – PREPARED BEANS – SCRAPBOOK ACCESSORIES – TOASTER PASTRY – LIQUOR – OTHER PET
ACCESSORIES – PREPARED FOODS – SEASONAL – TOBACCO ALTERNATIVES – LITTER SUPPLIES – OVEN COOKING BAG – PREPARED STUFFING FRZ – SEWING NOTIONS – TOMATO PASTE
AND SAUCE – LUNCH COMBINATION – PAIN RELIEF – PRODUCE DIP – SHAMPOO AND CONDITIONER – TOYS – LUNCHMEAT – PAIN RELIEVING DEVICE – PRODUCE SNACKS – SHAVING
NEEDS – TRADITIONAL TOBACCO – MAGAZINES – PANCAKE MIX – QUICHE REFRIGERATED – SHELF STABLE AND DRY POTATO MIX – TRIAL SIZE – MAJOR APPLIANCES – PANCAKE
SYRUP – RAMEN NOODLES – SHELF STABLE CHOCOLATE DRINK – UNDERARM DEODORANT – MARGARINE AND SPREAD – PAPER NAPKIN – READY TO EAT DESSERTS – SHELF STABLE
CONVENIENT BREAKFAST – UPPER RESPIRATORY MEDICINE – MARINADES – PAPER TOWEL – RECREATION AND HOBBY – SHELF STABLE DRY SOUP AND CHILI MIX – VEGETABLES AND
HERBS – MARSHMALLOWS – PARTY SUPPLIES – REFRIG DOUGHS AND WRAPS – SHELF STABLE FISH – VIDEO PRODUCTS PRERECORDED – MAYONNAISE – PASTA SAUCE – REFRIG SALAD
DRESSING – SHELF STABLE FRUIT – VINEGAR AND COOKING WINE – MEAL STARTERS FROZEN – PASTA SAUCE MIX – REFRIGERATED APPETIZER – SHELF STABLE GRAVY – VITAMINS AND
SUPPLEMENTS – MEAL STARTERS REFRIGERATED – PEANUT BUTTER – REFRIGERATED BAKED GOODS – SHELF STABLE JUICES AND DRINKS – WATER – MEAT AND FISH SAUCE – PENDING
FOR ASSIGNMENT – REFRIGERATED BREAD – SHELF STABLE LIQUID SOUP – WATER CONDITIONERS – MEAT FRESH – PERSONAL CARE APPLIANCE – REFRIGERATED BREAKFAST ENTREE –
SHELF STABLE MEAT – WATER FILTRATION – MEAT FROZEN – PET BRUSH – REFRIGERATED CONDIMENTS – SHELF STABLE MILK – WHIPPED TOPPINGS – MEAT IMITATION FROZEN – PET
FOOD OTHER ANIMALS – REFRIGERATED JUICE DRINKS – SHELF STABLE VEGETABLE – WHOLESOME SNACKS – MEDICAL ACCESSORY – PET GROOMING – REFRIGERATED LIQUID TEA –
SHOE CARE – WINE – MEDICATIONS – PET MEDICINE – REFRIGERATED MEALS – SHORTENING AND OILS – WRITING INSTRUMENTS – MEXICAN FOOD – PET REPELLENT – REFRIGERATED
PASTA AND SAUCE – SMALL APPLIANCES – YOGURT – MEXICAN SAUCE – PET TOYS – REFRIGERATED PIZZA – SMOKING CESSATION – – MEXICAN SAUCE MIX – PET TREATMENTS
EXTERNAL OTHER – REFRIGERATED SANDWICHES – SNACK CAKE – – MEXICAN TORTILLA – PETROLEUM JELLY – REFRIGERATED SEAFOOD – SNOW REMOVAL – MILK – PHOTOGRAPHIC
SUPPLIES – REFRIGERATED SIDE DISHES – SOFT DRINKS – SOUR CREAM – SPECIALTY GRAIN – SPORTING GOODS – STOMACH UPPER G.I. – SUGAR – SUNBURN TREATMENT – SUNTAN
PRODUCTS – SUSHI – TEA PACKAGED AND BAGS – TELEPHONE AND ACCESSORY – TOASTER PASTRY – TOBACCO ALTERNATIVES – TOMATO PASTE AND SAUCE – TOYS – TRADITIONAL
TOBACCO – TRIAL SIZE – UNDERARM DEODORANT – UPPER RESPIRATORY MEDICINE – VEGETABLES AND HERBS – VIDEO PRODUCTS PRERECORDED – VINEGAR AND COOKING WINE
– VITAMINS AND SUPPLEMENTS – WATER – WATER CONDITIONERS – WATER FILTRATION – WHIPPED TOPPINGS – WHOLESOME SNACKS – WINE – WRITING INSTRUMENTS – YOGURT
CATEGORY SPOTLIGHT JUICE, MILK AND CEREAL
OVER 300 CATEGORIES OF ADVERTISERS MEASURED
JUICE
MILK
CEREAL

6
JUICE 92 MILLION HOUSEHOLDS / 74% OF ALL HOUSEHOLDS
ALLHOUSEHOLDS
PODCAST FANS
AVID* PODCAST FANS
Dollars Spent Annually $37.98 $39.44 $41.32
Number of Trips 8.5 8.6 8.7
Amount Spent Per Trip $4.44 $4.58 $4.76
Buying Households 91,716,135 50,946,483 12,496,779
AVID* PODCAST LISTENERS SPEND MORE PER YEAR ON REFRIGERATED JUICE
74% of all households in Nielsen’s Homescan Panel have purchased refrigerated juice in 2017. That is nearly 92 million homes in the U.S. 51 million of these homes indicated that someone in the home is a fan of podcasts. That is more than half of all juice-buying households. 12.5 million of these homes are avid fans of podcasts. Roughly one quarter of these podcast homes are avid fans. Avid podcast fans are also heavier consumers of juice. The average podcast household spends $39.44 per year on juice, while avid podcast fans spend $41.32 per year on juice.
In total, podcast households in the U.S. spent $2 billion in 2017 on juice.
+8.8%
+3.8%
THE PODCASTING AUDIENCE INFLUENCES $2,009,139,283 OF REFRIGERATED JUICE SALES ANNUALLY
OF JUICE HOUSEHOLDS ARE PODCAST FANS56% OF PODCAST LISTENERS ARE
AVID* PODCAST FANS25%
* Avid fans are those who consider themselves extremely interested in a certain genre of podcasts (interest level 6 or 7 on a 7 point scale)
Source: Nielsen Homescan Panel, Fanlinks 2017 survey, total U.S., Latest 52 weeks, week ended 1/13/18

Copyright © 2018 The Nielsen Company (US), LLC. All Rights Reserved. 7
PODCAST GENRE DETAIL JUICE CATEGORY AMONG PODCAST FANS
Households Buying Juice
Music 47,124,947
TV & Movies 46,577,383
Comedy 46,079,124
Technology 45,344,853
Health & Living 45,286,897
Science 44,195,042
Society & Culture 44,074,420
Games & Hobbies 44,048,215
News & Politics 43,853,187
Arts 42,250,805
Kids & Family 40,904,614
Business 40,017,686
Sports 38,847,119
Religion & Spirituality 38,052,154
How to Read: There are 47,124,947 households buying juice who are fans of music podcasts
% of Households Buying Juice
Sports 78.0%
Kids & Family 77.9%
Religion & Spirituality 77.5%
Society & Culture 77.2%
Arts 77.2%
Health & Living 77.2%
Music 77.1%
Games & Hobbies 77.0%
TV & Movies 77.0%
Technology 77.0%
Comedy 77.0%
News & Politics 76.9%
Science 76.9%
Business 76.9%
How to Read: Juice is bought in 78% of all households who are fans of sports podcasts
Source: Nielsen Homescan Panel, Fanlinks 2017 survey, Total U.S., latest 52 weeks, week ended 1/13/18
Annual Spend Per Household
Business $ 40.77
Technology $ 40.22
Health & Living $ 39.98
Science $ 39.95
Sports $ 39.79
Society & Culture $ 39.78
Games & Hobbies $ 39.73
News & Politics $ 39.71
Arts $ 39.64
Kids & Family $ 39.62
Music $ 39.61
Religion & Spirituality $ 39.58
TV & Movies $ 39.40
Comedy $ 39.26
How to Read: Fans of Business podcasts spend $40.77 a year on juice per household
8
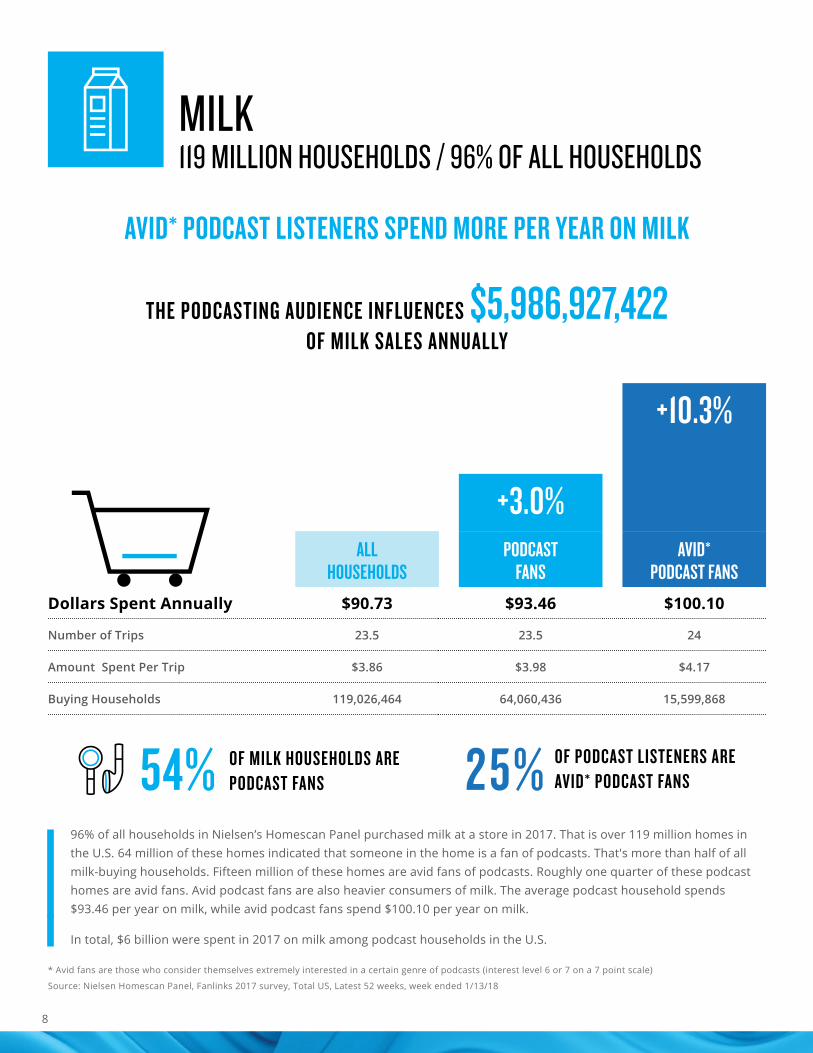
MILK 119 MILLION HOUSEHOLDS / 96% OF ALL HOUSEHOLDS
ALLHOUSEHOLDS
PODCAST FANS
AVID* PODCAST FANS
Dollars Spent Annually $90.73 $93.46 $100.10
Number of Trips 23.5 23.5 24
Amount Spent Per Trip $3.86 $3.98 $4.17
Buying Households 119,026,464 64,060,436 15,599,868
AVID* PODCAST LISTENERS SPEND MORE PER YEAR ON MILK
96% of all households in Nielsen’s Homescan Panel purchased milk at a store in 2017. That is over 119 million homes in the U.S. 64 million of these homes indicated that someone in the home is a fan of podcasts. That's more than half of all milk-buying households. Fifteen million of these homes are avid fans of podcasts. Roughly one quarter of these podcast homes are avid fans. Avid podcast fans are also heavier consumers of milk. The average podcast household spends $93.46 per year on milk, while avid podcast fans spend $100.10 per year on milk.
In total, $6 billion were spent in 2017 on milk among podcast households in the U.S.
+10.3%
+3.0%
THE PODCASTING AUDIENCE INFLUENCES $5,986,927,422 OF MILK SALES ANNUALLY
OF MILK HOUSEHOLDS ARE PODCAST FANS54% OF PODCAST LISTENERS ARE
AVID* PODCAST FANS25%
* Avid fans are those who consider themselves extremely interested in a certain genre of podcasts (interest level 6 or 7 on a 7 point scale)
Source: Nielsen Homescan Panel, Fanlinks 2017 survey, Total US, Latest 52 weeks, week ended 1/13/18

Copyright © 2018 The Nielsen Company (US), LLC. All Rights Reserved. 9
Households Buying Milk
Music 59,181,265
TV & Movies 58,588,830
Comedy 57,949,133
Technology 56,964,813
Health & Living 56,774,034
Science 55,505,147
Games & Hobbies 55,395,262
News & Politics 55,164,116
Society & Culture 55,148,679
Arts 52,935,730
Kids & Family 51,021,868
Business 50,276,258
Sports 48,253,017
Religion & Spirituality 47,505,047
How to Read: There are 59,181,265 households buying milk who are fans of music podcasts
% of Households Buying Milk
Kids & Family 97.1%
Sports 96.9%
Games & Hobbies 96.8%
TV & Movies 96.8%
Music 96.8%
Comedy 96.8%
Religion & Spirituality 96.8%
Health & Living 96.8%
Arts 96.8%
News & Politics 96.8%
Technology 96.7%
Society & Culture 96.6%
Business 96.6%
Science 96.6%
Annual Spend Per Household
Kids & Family $ 95.86
Games & Hobbies $ 93.74
Religion & Spirituality $ 93.58
Music $ 93.58
TV & Movies $ 93.58
Health & Living $ 93.41
News & Politics $ 93.32
Comedy $ 93.30
Sports $ 93.27
Technology $ 93.20
Science $ 93.03
Society & Culture $ 92.52
Business $ 92.48
Arts $ 92.47
How to Read: Fans of kids & family podcasts spend $95.86 a year on milk per household
PODCAST GENRE DETAIL MILK CATEGORY AMONG PODCAST FANS
How to Read: Milk is bought in 97.1% of all households who are fans of kids & family podcasts
Source: Nielsen Homescan Panel, Fanlinks 2017 survey, Total U.S., latest 52 weeks, week ended 1/13/18

10
CEREAL 115 MILLION HOUSEHOLDS / 93% OF ALL HOUSEHOLDS
93% of all households in Nielsen’s Homescan Panel have purchased breakfast cereal in 2017. That is nearly 115 million homes in the U.S. 62 million of these homes indicated that someone in the home is a fan of podcasts. That is more than half of all cereal-buying households. 15 million of these homes are avid fans of podcasts. Roughly one quarter of these podcast homes are avid fans. Avid podcast fans are also heavier consumers of cereal. The average podcast household spends $72.51 per year on cereal while avid podcast fans spend $77.93 per year on cereal.
In total, $4.5 billion was spent in 2017 on cereal among podcast households in the U.S.
ALLHOUSEHOLDS
PODCAST FANS
AVID* PODCAST FANS
Dollars Spent Annually $68.71 $72.51 $77.93
Number of Trips 12.1 12.4 13
Amount Spent Per Trip $5.67 $5.84 $5.99
Buying Households 114,878,684 62,074,126 15,084,735
AVID* PODCAST LISTENERS SPEND MORE PER YEAR ON CEREAL
+13.4%
+5.5%
THE PODCASTING AUDIENCE INFLUENCES $4,500,717,485 OF CEREAL SALES ANNUALLY
OF CEREAL HOUSEHOLDS ARE PODCAST FANS54% OF PODCAST LISTENERS ARE
AVID* PODCAST FANS25%
* Avid fans are those who consider themselves extremely interested in a certain genre of podcasts (interest level 6 or 7 on a 7 point scale)
Source: Nielsen Homescan Panel, Fanlinks 2017 survey, Total U.S., Latest 52 weeks, week ended 1/13/18

11Copyright © 2018 The Nielsen Company (US), LLC. All Rights Reserved.
PODCAST GENRE DETAIL CEREAL CATEGORY AMONG PODCAST FANS
Annual Spend Per Household
Kids & Family $ 75.32
Religion & Spirituality $ 73.93
Sports $ 73.14
News & Politics $ 72.94
Games & Hobbies $ 72.81
Comedy $ 72.74
Health & Living $ 72.71
Music $ 72.69
Society & Culture $ 72.60
Arts $ 72.54
TV & Movies $ 72.33
Technology $ 72.32
Science $ 72.26
Business $ 72.24
How to Read: Fans of Kids & Family podcasts spend $75.32 a year on cereal per household
% of Households Buying Cereal
Kids & Family 94.4%
Religion & Spirituality 94.3%
Sports 94.1%
Games & Hobbies 94.0%
Health & Living 93.8%
TV & Movies 93.8%
Comedy 93.7%
Music 93.7%
News & Politics 93.7%
Arts 93.7%
Technology 93.6%
Science 93.6%
Society & Culture 93.6%
Business 93.4%
Households Buying Cereal
Music 57,274,911
TV & Movies 56,768,450
Comedy 56,114,628
Technology 55,149,696
Health & Living 55,047,054
Games & Hobbies 53,781,064
Science 53,770,483
News & Politics 53,409,523
Society & Culture 53,397,354
Arts 51,239,534
Kids & Family 49,595,221
Business 48,601,252
Sports 46,846,284
Religion & Spirituality 46,264,094
How to Read: There are 57,274,911 households buying cereal who are fans of music podcasts
How to Read: Cereal is bought in 94.4% of all households who are fans of kids & family podcasts
Source: Nielsen Homescan Panel, Fanlinks 2017 survey, Total U.S., latest 52 weeks, week ended 1/13/18

12
PODCASTADVERTISINGEFFECTIVENESSNielsen’s Media Lab explores how new media technology
and trends impact consumers, advertisers and publishers.
We use a mix of Nielsen data and primary research to
demonstrate the power of new media platforms, to help
clients improve ad experiences for consumers, and to help
inform the creation and distribution of content viewers
will love. The lab’s research studies have been featured
at conferences and events around the world including the
Consumer Electronics Show, Advertising Week, Cannes Lion,
Mobile World Congress & VidCon.
Copyright © 2018 The Nielsen Company (US), LLC. All Rights Reserved. 13
Source: Nielsen Digital Media Lab, 2017 Podcast Sponsorship Study
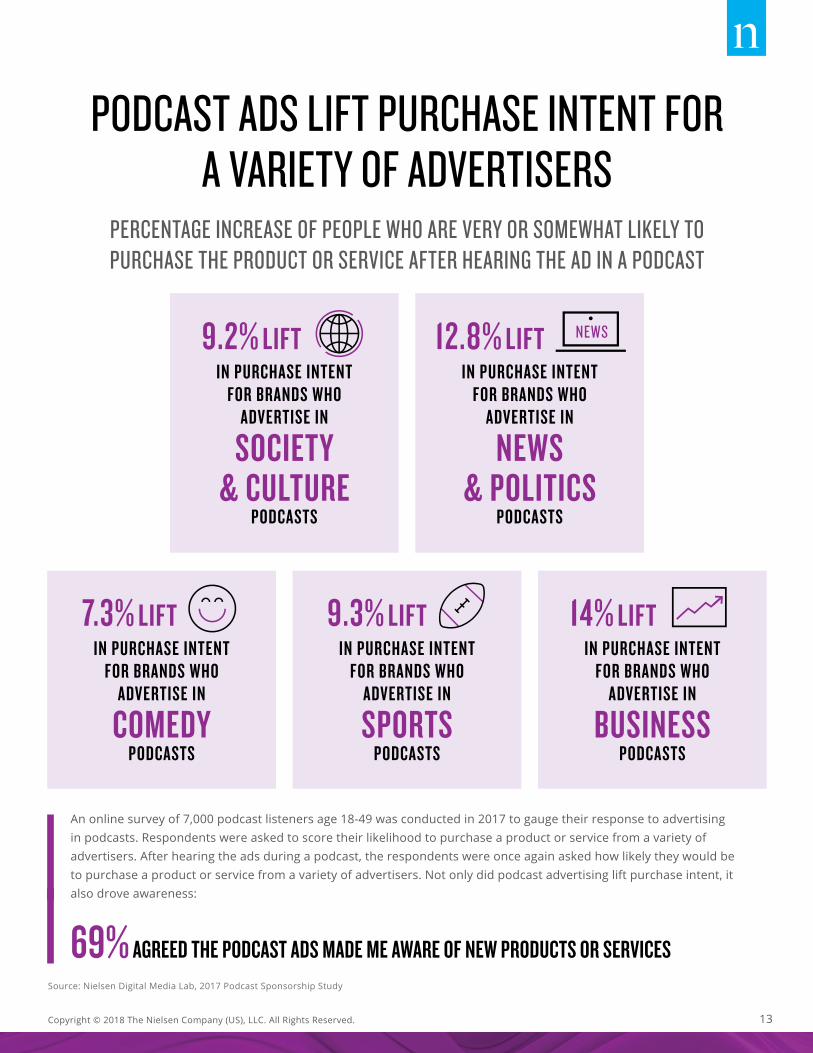
An online survey of 7,000 podcast listeners age 18-49 was conducted in 2017 to gauge their response to advertising in podcasts. Respondents were asked to score their likelihood to purchase a product or service from a variety of advertisers. After hearing the ads during a podcast, the respondents were once again asked how likely they would be to purchase a product or service from a variety of advertisers. Not only did podcast advertising lift purchase intent, it also drove awareness:
69% AGREED THE PODCAST ADS MADE ME AWARE OF NEW PRODUCTS OR SERVICES
PODCAST ADS LIFT PURCHASE INTENT FOR A VARIETY OF ADVERTISERS
PERCENTAGE INCREASE OF PEOPLE WHO ARE VERY OR SOMEWHAT LIKELY TO PURCHASE THE PRODUCT OR SERVICE AFTER HEARING THE AD IN A PODCAST
9.2% LIFT
IN PURCHASE INTENTFOR BRANDS WHO
ADVERTISE IN
SOCIETY & CULTURE
PODCASTS
12.8% LIFT
IN PURCHASE INTENTFOR BRANDS WHO
ADVERTISE IN
NEWS & POLITICS
PODCASTS
7.3% LIFT
IN PURCHASE INTENTFOR BRANDS WHO
ADVERTISE IN
COMEDY PODCASTS
9.3% LIFT
IN PURCHASE INTENTFOR BRANDS WHO
ADVERTISE IN
SPORTS PODCASTS
14% LIFT
IN PURCHASE INTENTFOR BRANDS WHO
ADVERTISE IN
BUSINESS PODCASTS

14
ABOUT NIELSENNielsen Holdings plc (NYSE: NLSN) is a global measurement and data analytics company that provides the most complete and trusted view available of consumers and markets worldwide. Our approach marries proprietary Nielsen data with other data sources to help clients around the world understand what’s happening now, what’s happening next, and how to best act on this knowledge. For more than 90 years Nielsen has provided data and analytics based on scientific rigor and innovation, continually developing new ways to answer the most important questions facing the media, advertising, retail and fast-moving consumer goods industries. An S&P 500 company, Nielsen has operations in over 100 countries, covering more than 90% of the world’s population. For more information, visit www.nielsen.com.
THE SCIENCE BEHIND WHAT’S NEXT ™

16