nielsen investor overviews1.q4cdn.com/.../2017/02/nielsen-investor-overview-1… · ·...
TRANSCRIPT

4Q 2016
NIELSENINVESTOR OVERVIEW
Co
pyr
igh
t ©20
14 T
he
Nie
lsen
Co
mp
any.
Co
nfi
den
tial
an
d p
rop
riet
ary.
2Co
pyr
igh
t ©20
17 T
he
Nie
lsen
Co
mp
any.
Co
nfi
den
tial
an
d p
rop
riet
ary.
FORWARD LOOKING STATEMENTS
The following discussion contains forward-looking statements, including those about Nielsen’soutlook and prospects, in the meaning of the Private Securities Litigation Reform Act of 1995.Forward-looking statements are those which are not historical facts. These and otherstatements that relate to future results and events are based on Nielsen’s current expectationsas of February 9, 2017.
Our actual results in future periods may differ materially from those currently expected becauseof a number of risks and uncertainties. The risks and uncertainties that we believe are materialare outlined in our disclosure filings and materials, which you can find onhttp://nielsen.com/investors. Please consult these documents for a more completeunderstanding of these risks and uncertainties. We disclaim any intention or obligation toupdate or revise any forward-looking statements, whether as a result of new information, futureevents or otherwise, except as may be required by law.
Our outlook is provided for the purpose of providing information about current expectations for2017. This information may not be appropriate for other purposes.

Co
pyr
igh
t ©20
14 T
he
Nie
lsen
Co
mp
any.
Co
nfi
den
tial
an
d p
rop
riet
ary.
3Co
pyr
igh
t ©20
17 T
he
Nie
lsen
Co
mp
any.
Co
nfi
den
tial
an
d p
rop
riet
ary.
NIELSEN AT A GLANCE
Measurement and analytics for content,
advertising and activity for television, digital,
social and audio
Market share measurement and
analytics for fast moving consumer goods
FOCUS: DRIVE SHAREHOLDER VALUE THROUGH GROWTH, PROFITABILITY, AND FREE CASH FLOW
Watch Buy
Market Cap and Dividend Yield are reported as of 2/8/17Adjusted EBITDA presented on a constant currency basis
Market Cap $15.04B
Cash Returned to Shareholders (2014-2016) $2.7B
2016 Total Company Revenue $6.3B
2016 Free Cash Flow $941M
2016 Adj. EBITDA Margin Growth 31bps
Dividend Yield 2.95%
Revenue Recurring in Nature ~70%
2016 Total Revenues
Watch47%
Buy53%
2016 Revenue: ~$3.0B
Adj. EBITDA Margin: 45%
2016 Revenue: ~$3.3B
Adj. EBITDA Margin:19%

Co
pyr
igh
t ©20
14 T
he
Nie
lsen
Co
mp
any.
Co
nfi
den
tial
an
d p
rop
riet
ary.
4Co
pyr
igh
t ©20
17 T
he
Nie
lsen
Co
mp
any.
Co
nfi
den
tial
an
d p
rop
riet
ary.
NIELSEN’S BUSINESS STRATEGY & OBJECTIVES
BUY
WATCH
Expand coverage of consumer purchase
behavior globally
Capture Total Audience across all screens and
platforms
MARKETING EFFECTIVENESS
Help clients understand how individuals’ viewing
behavior impacts purchase behavior
OUR VALUES
OPEN
CONNECTED
USEFUL
OUR BRAND
QUALITY
INTEGRITY
NEUTRALITY
EXECUTION OF OUR STRATEGY DRIVES SHAREHOLDER VALUE THROUGH THE CYCLES
v
PERSONAL
Co
pyr
igh
t ©20
14 T
he
Nie
lsen
Co
mp
any.
Co
nfi
den
tial
an
d p
rop
riet
ary.
5Co
pyr
igh
t ©20
17 T
he
Nie
lsen
Co
mp
any.
Co
nfi
den
tial
an
d p
rop
riet
ary.
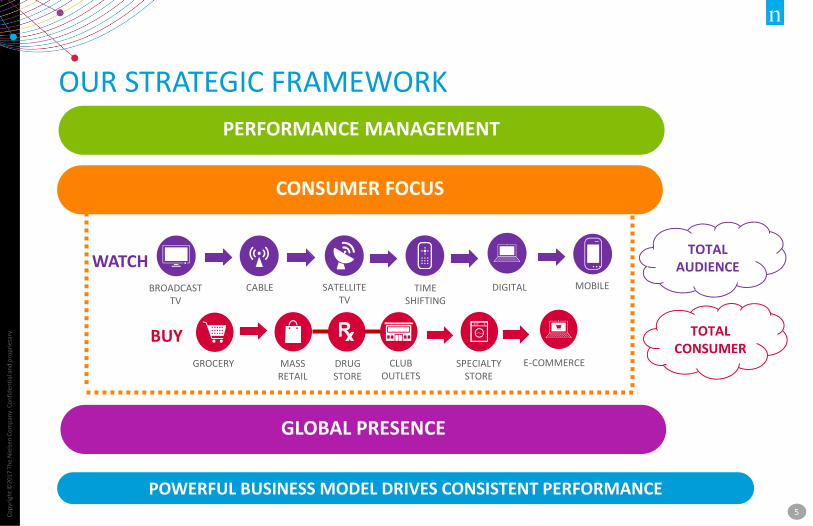
OUR STRATEGIC FRAMEWORK
CONSUMER FOCUS
PERFORMANCE MANAGEMENT
GLOBAL PRESENCE
BROADCASTTV
CABLE SATELLITE TV
TIME SHIFTING
DIGITAL
WATCHMOBILE
BUY
GROCERY MASS RETAIL
DRUG STORE
CLUB OUTLETS
SPECIALTY STORE
E-COMMERCE
TOTAL AUDIENCE
TOTAL CONSUMER
POWERFUL BUSINESS MODEL DRIVES CONSISTENT PERFORMANCE

Co
pyr
igh
t ©20
14 T
he
Nie
lsen
Co
mp
any.
Co
nfi
den
tial
an
d p
rop
riet
ary.
6Co
pyr
igh
t ©20
17 T
he
Nie
lsen
Co
mp
any.
Co
nfi
den
tial
an
d p
rop
riet
ary.
COMPELLING FINANCIAL PERFORMANCE
STRONG FREE CASH FLOW
BALANCED CAPITAL ALLOCATION
CONSISTENT REVENUE GROWTH
MARGIN EXPANSION
WELL-POSITIONED TO DELIVER STRONG SHAREHOLDER RETURNS
• 6% CAGR from ’11 to ’16• 42 quarters of consecutive growth• Investing in key growth opportunities
• Syndicated business model & cost-out initiatives• ~3.4 pts of margin expansion ’11 to ’16• Adj. EBITDA +9% CAGR from ‘11 to ‘16
• Generated $3.8B of Free Cash Flow from ‘11 to ’16• 20% CAGR from ’11 to ’16• 23 pts FCF conversion improvement ‘11 to ‘16
• Tremendous flexibility to invest in growth• $2.7B back to shareholders from 2014-2016
RESULTS
* ’11 to ’16 CAGR ~4.4% ex Harris and AudioNote: FCF conversion: calculated as a percentage of Adj. EBITDA
Co
pyr
igh
t ©20
14 T
he
Nie
lsen
Co
mp
any.
Co
nfi
den
tial
an
d p
rop
riet
ary.
7Co
pyr
igh
t ©20
17 T
he
Nie
lsen
Co
mp
any.
Co
nfi
den
tial
an
d p
rop
riet
ary.
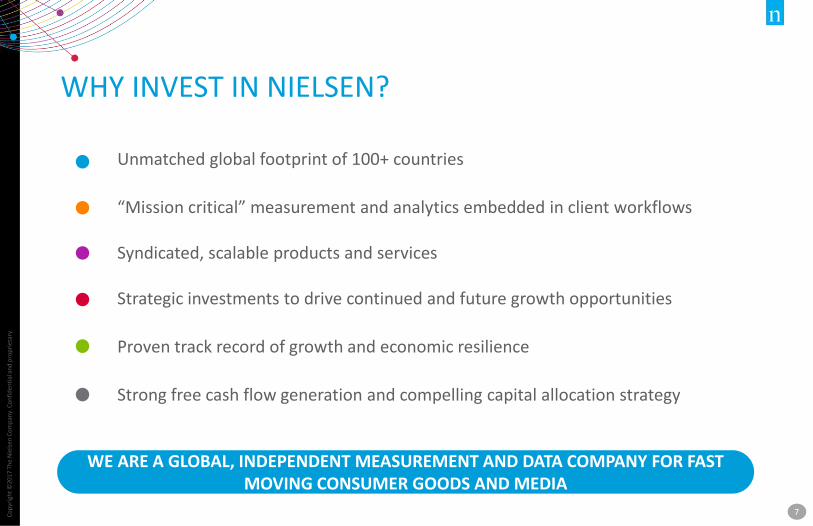
WHY INVEST IN NIELSEN?
Unmatched global footprint of 100+ countries
“Mission critical” measurement and analytics embedded in client workflows
Syndicated, scalable products and services
Strategic investments to drive continued and future growth opportunities
Proven track record of growth and economic resilience
Strong free cash flow generation and compelling capital allocation strategy
WE ARE A GLOBAL, INDEPENDENT MEASUREMENT AND DATA COMPANY FOR FAST MOVING CONSUMER GOODS AND MEDIA

Co
pyr
igh
t ©20
14 T
he
Nie
lsen
Co
mp
any.
Co
nfi
den
tial
an
d p
rop
riet
ary.
8Co
pyr
igh
t ©20
17 T
he
Nie
lsen
Co
mp
any.
Co
nfi
den
tial
an
d p
rop
riet
ary.
OUR GROWING GLOBAL FOOTPRINT
2014 REVENUE DISTRIBUTION
…Underscored By A Global Employee Base Of ~42,000 Talented Associates We Work Hard To Attract, Develop And Retain
Our focus is relentless on our pursuit to provide clients with the most complete understanding of what consumers buy and watch in 100+ countries…
Buy Coverage Only Watch & Buy Coverage
~20% of revenues in emerging markets

Co
pyr
igh
t ©20
14 T
he
Nie
lsen
Co
mp
any.
Co
nfi
den
tial
an
d p
rop
riet
ary.
9Co
pyr
igh
t ©20
17 T
he
Nie
lsen
Co
mp
any.
Co
nfi
den
tial
an
d p
rop
riet
ary.
LONG-TERM, BEST-IN-CLASS CLIENT BASEBUY WATCH
• 20,000+ clients• Relationships with top 10 clients
for over 30 years• Long-term contracts provide
stable, recurring revenues –average length of 3-10 years
• No client represents more than 4% of 2016 revenues
HIGHLIGHTS
PARTNERSHIPS
For more than 90 years, we have been at the forefront of measuring consumers around the world, helping clients drive better business decisions and profitable growth over time
Co
pyr
igh
t ©
20
16
Th
e N
iels
en C
om
pan
y.
10
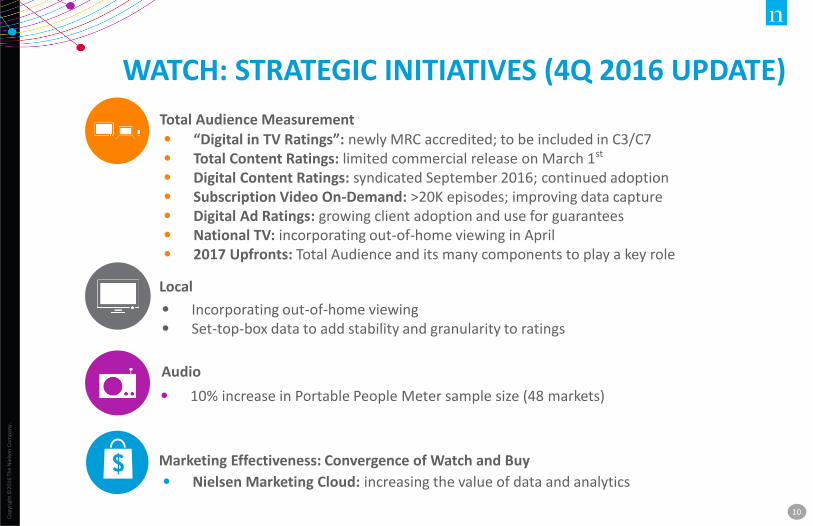
• 10% increase in Portable People Meter sample size (48 markets)
• Incorporating out-of-home viewing
• Set-top-box data to add stability and granularity to ratings
• “Digital in TV Ratings”: newly MRC accredited; to be included in C3/C7
• Total Content Ratings: limited commercial release on March 1st
• Digital Content Ratings: syndicated September 2016; continued adoption
• Subscription Video On-Demand: >20K episodes; improving data capture
• Digital Ad Ratings: growing client adoption and use for guarantees
• National TV: incorporating out-of-home viewing in April
• 2017 Upfronts: Total Audience and its many components to play a key role
WATCH: STRATEGIC INITIATIVES (4Q 2016 UPDATE)
• Nielsen Marketing Cloud: increasing the value of data and analytics
Total Audience Measurement
Marketing Effectiveness: Convergence of Watch and Buy
Audio
Local
Co
pyr
igh
t ©
20
16
Th
e N
iels
en C
om
pan
y.
11
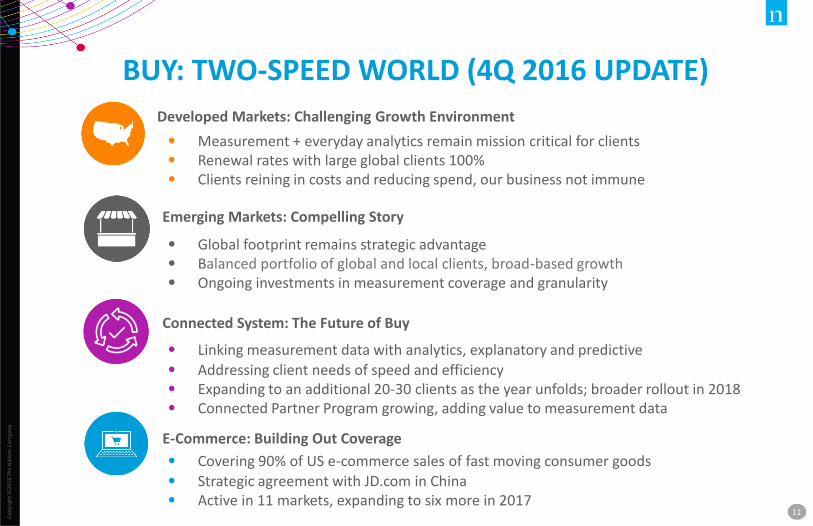
BUY: TWO-SPEED WORLD (4Q 2016 UPDATE)
• Linking measurement data with analytics, explanatory and predictive
• Addressing client needs of speed and efficiency
• Expanding to an additional 20-30 clients as the year unfolds; broader rollout in 2018
• Connected Partner Program growing, adding value to measurement data
Connected System: The Future of Buy
• Global footprint remains strategic advantage
• Balanced portfolio of global and local clients, broad-based growth
• Ongoing investments in measurement coverage and granularity
Emerging Markets: Compelling Story
Developed Markets: Challenging Growth Environment
• Measurement + everyday analytics remain mission critical for clients
• Renewal rates with large global clients 100%
• Clients reining in costs and reducing spend, our business not immune
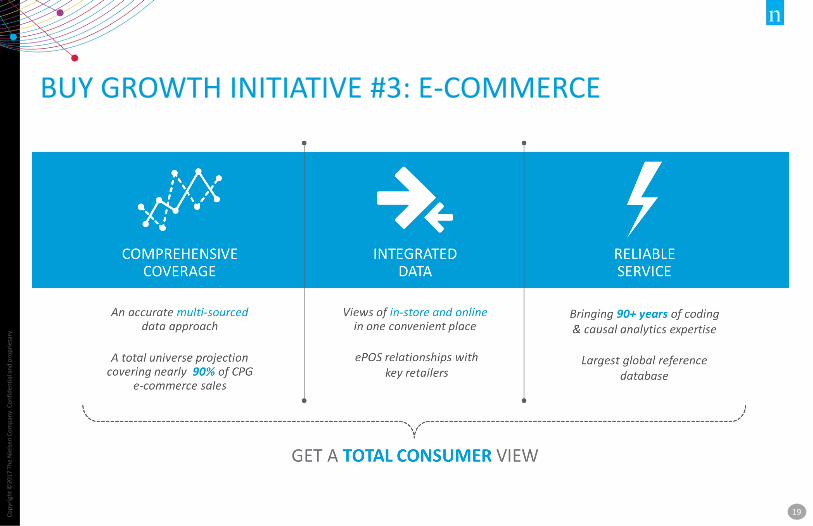
• Covering 90% of US e-commerce sales of fast moving consumer goods
• Strategic agreement with JD.com in China
• Active in 11 markets, expanding to six more in 2017
E-Commerce: Building Out Coverage
Co
pyr
igh
t ©20
14 T
he
Nie
lsen
Co
mp
any.
Co
nfi
den
tial
an
d p
rop
riet
ary.
12Co
pyr
igh
t ©20
17 T
he
Nie
lsen
Co
mp
any.
Co
nfi
den
tial
an
d p
rop
riet
ary.
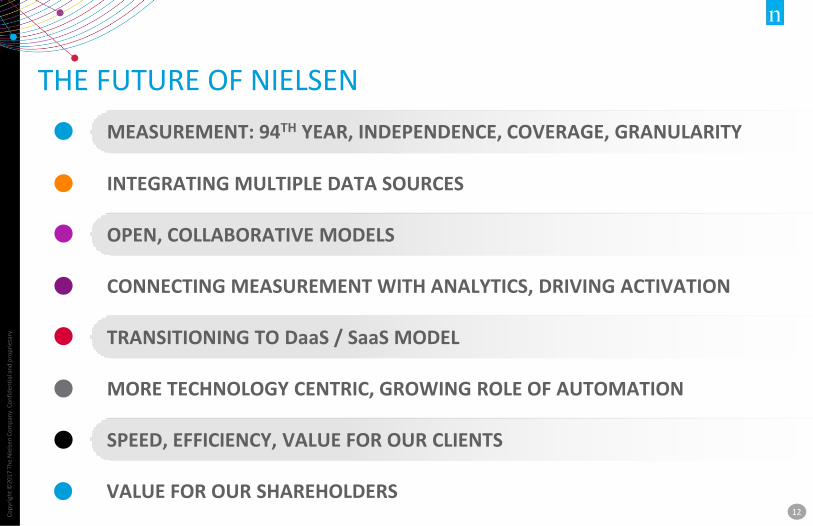
THE FUTURE OF NIELSEN
MEASUREMENT: 94TH YEAR, INDEPENDENCE, COVERAGE, GRANULARITY
INTEGRATING MULTIPLE DATA SOURCES
OPEN, COLLABORATIVE MODELS
CONNECTING MEASUREMENT WITH ANALYTICS, DRIVING ACTIVATION
TRANSITIONING TO DaaS / SaaS MODEL
MORE TECHNOLOGY CENTRIC, GROWING ROLE OF AUTOMATION
SPEED, EFFICIENCY, VALUE FOR OUR CLIENTS
VALUE FOR OUR SHAREHOLDERS
Co
pyr
igh
t ©20
14 T
he
Nie
lsen
Co
mp
any.
Co
nfi
den
tial
an
d p
rop
riet
ary.
13Co
pyr
igh
t ©20
17 T
he
Nie
lsen
Co
mp
any.
Co
nfi
den
tial
an
d p
rop
riet
ary.
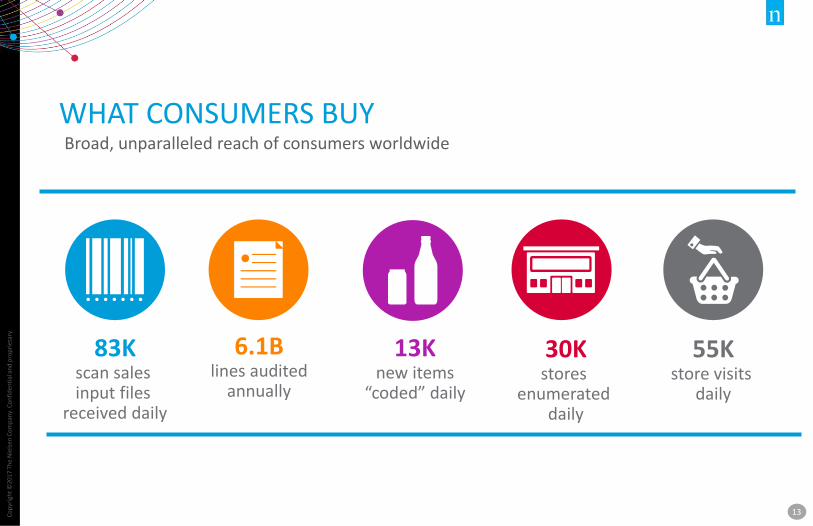
WHAT CONSUMERS BUY
83Kscan sales input files
received daily
30Kstores
enumerated daily
13Knew items
“coded” daily
6.1Blines audited
annually
55Kstore visits
daily
Broad, unparalleled reach of consumers worldwide

Co
pyr
igh
t ©20
14 T
he
Nie
lsen
Co
mp
any.
Co
nfi
den
tial
an
d p
rop
riet
ary.
14Co
pyr
igh
t ©20
17 T
he
Nie
lsen
Co
mp
any.
Co
nfi
den
tial
an
d p
rop
riet
ary.
BUY: MEASURING THE TOTAL CONSUMER
Total 2016 Revenue: ~$3.3B… Approximately 60% recurring in nature
Retail sales measurement, market share information and advanced analytical capabilities
• Presence in 100+ countries
• Measure billions of monthly point-of-sale transactions
• Store level data from nearly 2 million stores, supplemented from proprietary household level data from 240K households
• Demand for Everyday Analytics: Pricing, Promotion and Assortment
GROWTH THROUGH DIFFERENTIATION, STICKINESS & SCALE
Developed
Corporate
Emerging
63%
32%
5%
2016 Total Buy Revenue
Co
pyr
igh
t ©20
14 T
he
Nie
lsen
Co
mp
any.
Co
nfi
den
tial
an
d p
rop
riet
ary.
15Co
pyr
igh
t ©20
17 T
he
Nie
lsen
Co
mp
any.
Co
nfi
den
tial
an
d p
rop
riet
ary.
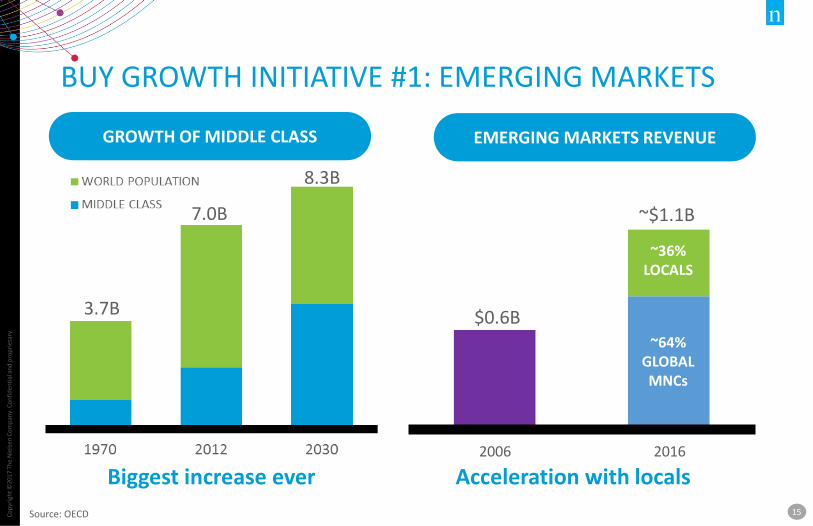
BUY GROWTH INITIATIVE #1: EMERGING MARKETS
2006 2016
$0.6B
~$1.1B
~36%LOCALS
~64%GLOBALMNCs
Biggest increase ever Acceleration with locals
Source: OECD
3.7B
7.0B
8.3B
GROWTH OF MIDDLE CLASS EMERGING MARKETS REVENUE
Co
pyr
igh
t ©20
14 T
he
Nie
lsen
Co
mp
any.
Co
nfi
den
tial
an
d p
rop
riet
ary.
16Co
pyr
igh
t ©20
17 T
he
Nie
lsen
Co
mp
any.
Co
nfi
den
tial
an
d p
rop
riet
ary.
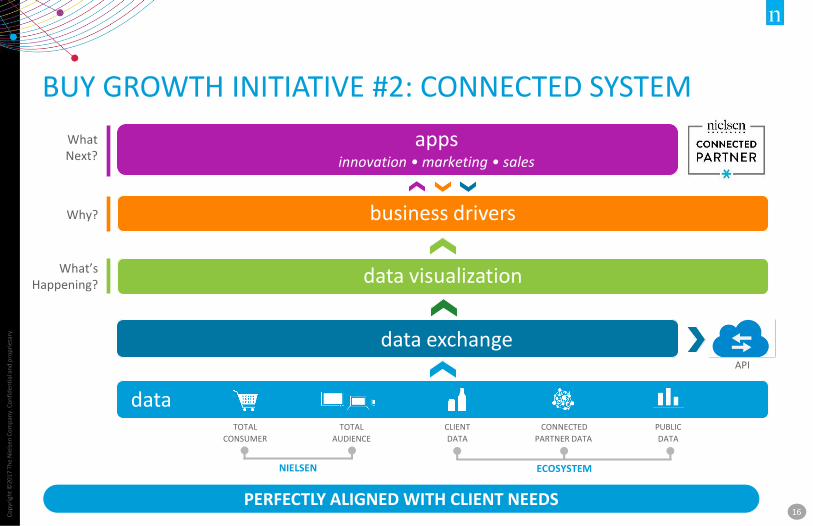
BUY GROWTH INITIATIVE #2: CONNECTED SYSTEM
PERFECTLY ALIGNED WITH CLIENT NEEDS
business driversWhy?
data visualizationWhat’s Happening?
data exchangeAPI
data
NIELSEN
CONNECTED
PARTNER DATA
TOTAL
CONSUMER
TOTAL
AUDIENCE
CLIENT
DATA
PUBLIC
DATA
ECOSYSTEM
WhatNext?
appsinnovation • marketing • sales

Co
pyr
igh
t ©20
14 T
he
Nie
lsen
Co
mp
any.
Co
nfi
den
tial
an
d p
rop
riet
ary.
17Co
pyr
igh
t ©20
17 T
he
Nie
lsen
Co
mp
any.
Co
nfi
den
tial
an
d p
rop
riet
ary.
CONNECTED SYSTEM: ONGOING, AGILE DEVELOPMENT AND ROLLOUT
Build the foundations with
charter clients
Expand to 20-30 clients
Agile rollout
2016 2017 2018

Co
pyr
igh
t ©20
14 T
he
Nie
lsen
Co
mp
any.
Co
nfi
den
tial
an
d p
rop
riet
ary.
18Co
pyr
igh
t ©20
17 T
he
Nie
lsen
Co
mp
any.
Co
nfi
den
tial
an
d p
rop
riet
ary.
CONNECTED SYSTEM: FINANCIAL OUTCOMES
Revenue
+ Data & software revenue less people intensive+ Connected Partner revenue less cost intensive+ Cost efficient technology architecture
+ Stronger value proposition for large, mid & small clients+ Analytics less lumpy…connected to core measurement+ Connected Partners…new revenue source+ Data & software revenue
Margins
EXPECTED TO LEAD TO A STRONGER, MORE PROFITABLE BUY BUSINESS
People-as-a-Service revenue
Co
pyr
igh
t ©20
14 T
he
Nie
lsen
Co
mp
any.
Co
nfi
den
tial
an
d p
rop
riet
ary.
19Co
pyr
igh
t ©20
17 T
he
Nie
lsen
Co
mp
any.
Co
nfi
den
tial
an
d p
rop
riet
ary.
BUY GROWTH INITIATIVE #3: E-COMMERCE
Co
pyr
igh
t ©20
14 T
he
Nie
lsen
Co
mp
any.
Co
nfi
den
tial
an
d p
rop
riet
ary.
20Co
pyr
igh
t ©20
17 T
he
Nie
lsen
Co
mp
any.
Co
nfi
den
tial
an
d p
rop
riet
ary.
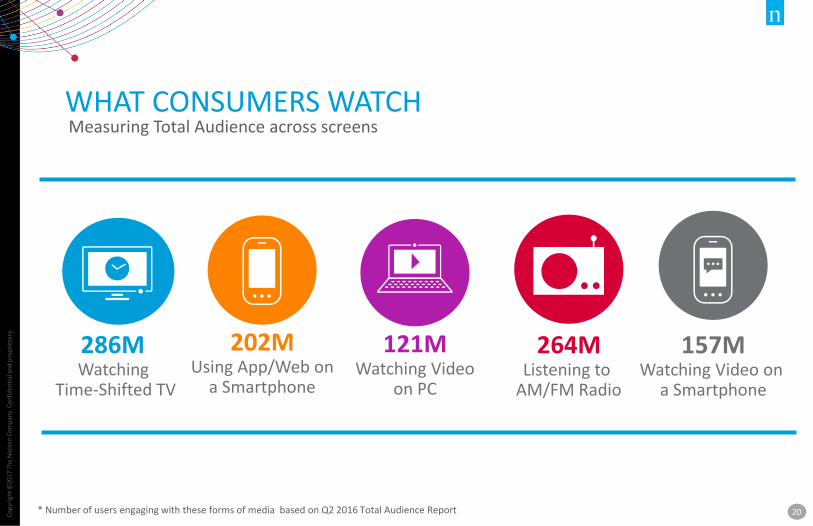
WHAT CONSUMERS WATCH
286M Watching
Time-Shifted TV
264MListening to
AM/FM Radio
121MWatching Video
on PC
202MUsing App/Web on
a Smartphone
157MWatching Video on
a Smartphone
Measuring Total Audience across screens
* Number of users engaging with these forms of media based on Q2 2016 Total Audience Report

Co
pyr
igh
t ©20
14 T
he
Nie
lsen
Co
mp
any.
Co
nfi
den
tial
an
d p
rop
riet
ary.
21Co
pyr
igh
t ©20
17 T
he
Nie
lsen
Co
mp
any.
Co
nfi
den
tial
an
d p
rop
riet
ary.
WATCH: MEASURING THE TOTAL AUDIENCE Total 2016 Revenue: ~$3.0B… Approximately 85% recurring in nature
• Watch measurement capabilities in 47 countries
• Digital measurement, audience analytics and consumer research
• Grossed and de-duplicated total reporting across all devices, access points and business models
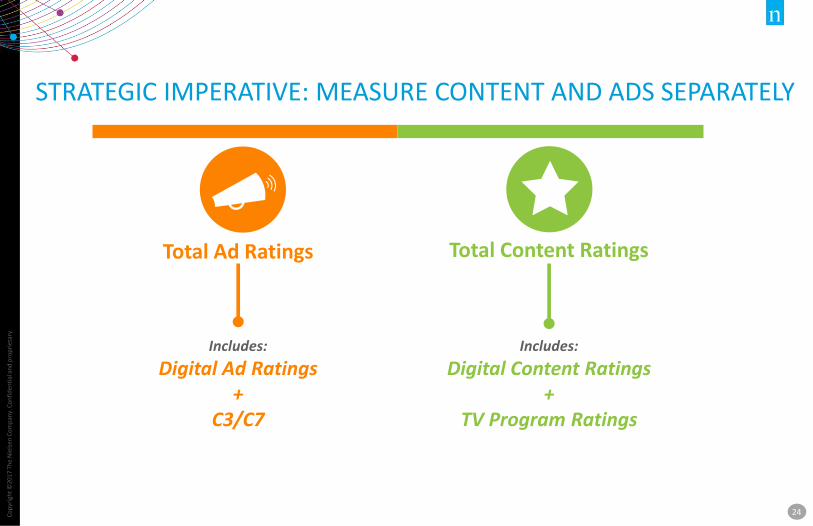
• Separate measurement for content and ads.
• Strategic relationships (Adobe, Experian, Facebook, Twitter, Roku, DISH, Charter)
• Gold standard, MRC accredited panel
Cross Platform Measurement
2016 Total Watch Revenue Breakdown
Video Ratings Audio Ratings Text Ratings
printed press
websites
Audience Measurement(Video & Text)
Audio
Marketing Effectiveness
Corporate/Other Watch
10%
17%
7%
66%

Co
pyr
igh
t ©20
14 T
he
Nie
lsen
Co
mp
any.
Co
nfi
den
tial
an
d p
rop
riet
ary.
22Co
pyr
igh
t ©20
17 T
he
Nie
lsen
Co
mp
any.
Co
nfi
den
tial
an
d p
rop
riet
ary.
2016 WATCH HIGHLIGHTS
TELEVISION: ADDING RETURN PATH DATA, OUT OF HOME VIEWING
SVOD: OVER 20,000 PROGRAM EPISODES
DIGITAL CONTENT RATINGS: SYNDICATED IN SEPTEMBER
TOTAL CONTENT RATINGS: MULTI-PHASED SYNDICATION
NIELSEN MARKETING CLOUD: DOUBLE DIGIT GROWTH IN MARKETING EFFECTIVENESS
UPFRONTS: TOTAL AUDIENCE POISED TO PLAY BIG ROLE IN 2017
DIGITAL AD RATINGS: EXPANDED TO 25 MARKETS; VIEWABILITY
Co
pyr
igh
t ©20
14 T
he
Nie
lsen
Co
mp
any.
Co
nfi
den
tial
an
d p
rop
riet
ary.
23Co
pyr
igh
t ©20
17 T
he
Nie
lsen
Co
mp
any.
Co
nfi
den
tial
an
d p
rop
riet
ary.
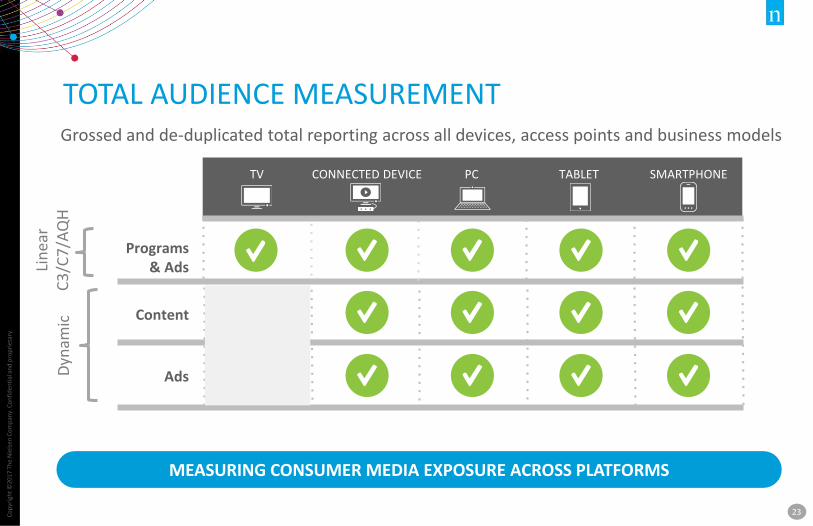
TOTAL AUDIENCE MEASUREMENTGrossed and de-duplicated total reporting across all devices, access points and business models
Programs& Ads
Content
Ads
TV CONNECTED DEVICE PC TABLET SMARTPHONE
Dyn
amic
Lin
ear
C3
/C7
/AQ
H
MEASURING CONSUMER MEDIA EXPOSURE ACROSS PLATFORMS
Co
pyr
igh
t ©20
14 T
he
Nie
lsen
Co
mp
any.
Co
nfi
den
tial
an
d p
rop
riet
ary.
24Co
pyr
igh
t ©20
17 T
he
Nie
lsen
Co
mp
any.
Co
nfi
den
tial
an
d p
rop
riet
ary.
STRATEGIC IMPERATIVE: MEASURE CONTENT AND ADS SEPARATELY
Total Ad Ratings Total Content Ratings
Includes:
Digital Content Ratings+
TV Program Ratings
Includes:
Digital Ad Ratings+
C3/C7
Co
pyr
igh
t ©20
14 T
he
Nie
lsen
Co
mp
any.
Co
nfi
den
tial
an
d p
rop
riet
ary.
25Co
pyr
igh
t ©20
17 T
he
Nie
lsen
Co
mp
any.
Co
nfi
den
tial
an
d p
rop
riet
ary.
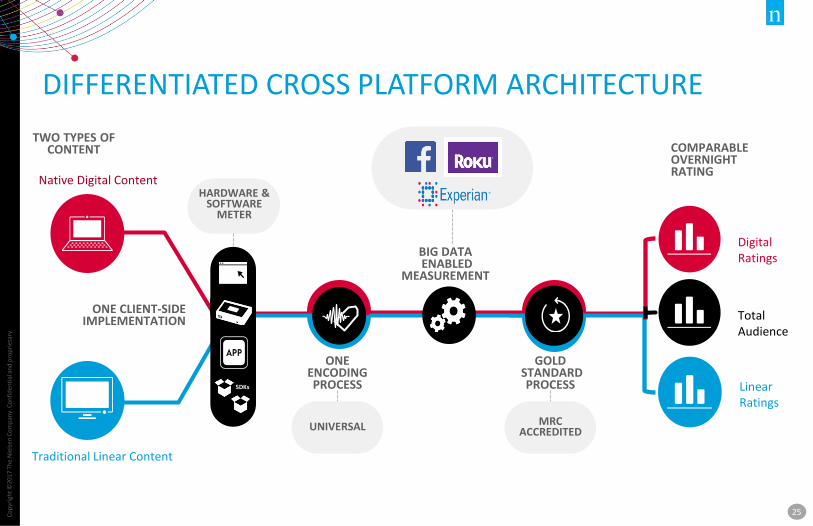
DIFFERENTIATED CROSS PLATFORM ARCHITECTURE
TWO TYPES OF CONTENT
Native Digital Content
HARDWARE METER
LinearRatings
GOLDSTANDARD PROCESS
ONE ENCODING PROCESS
COMPARABLE OVERNIGHT RATING
DigitalRatings
Total Audience
Traditional Linear Content
MRC ACCREDITEDUNIVERSAL
BIG DATAENABLED
MEASUREMENT
HARDWARE & SOFTWARE
METER
ONE CLIENT-SIDE IMPLEMENTATION
SDKs
Co
pyr
igh
t ©20
14 T
he
Nie
lsen
Co
mp
any.
Co
nfi
den
tial
an
d p
rop
riet
ary.
26Co
pyr
igh
t ©20
17 T
he
Nie
lsen
Co
mp
any.
Co
nfi
den
tial
an
d p
rop
riet
ary.
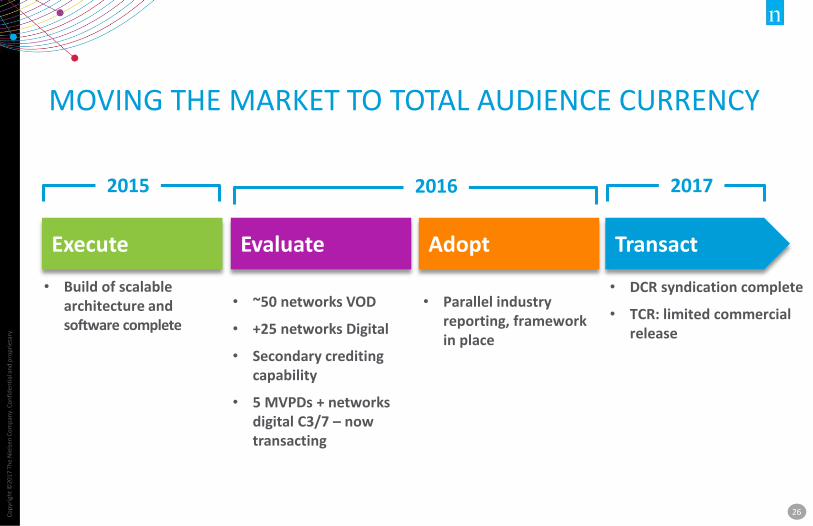
MOVING THE MARKET TO TOTAL AUDIENCE CURRENCY
Execute
• Build of scalable architecture and software complete
2015
Transact
• DCR syndication complete
• TCR: limited commercial release
2017
Evaluate
• ~50 networks VOD
• +25 networks Digital
• Secondary crediting capability
• 5 MVPDs + networks digital C3/7 – now transacting
Adopt
• Parallel industry reporting, framework in place
2016

Co
pyr
igh
t ©20
14 T
he
Nie
lsen
Co
mp
any.
Co
nfi
den
tial
an
d p
rop
riet
ary.
27Co
pyr
igh
t ©20
17 T
he
Nie
lsen
Co
mp
any.
Co
nfi
den
tial
an
d p
rop
riet
ary.
BUILDING FOR AN ADDRESSABLE FUTURE
TARGETED ADVERTISING (AUDIENCE BUYS)
REACH ADVERTISING (LINEAR BUYS)
AD AD AD AD AD
COMPARABLE CROSS-PLATFORM REACH MEASUREMENT (AGE/GENDER)
AUDIENCE SCORES (DEMO+)
ROI SCORES
Pet Lover Beer Drinker Avid Hiker Car Buyer

Co
pyr
igh
t ©20
14 T
he
Nie
lsen
Co
mp
any.
Co
nfi
den
tial
an
d p
rop
riet
ary.
28Co
pyr
igh
t ©20
17 T
he
Nie
lsen
Co
mp
any.
Co
nfi
den
tial
an
d p
rop
riet
ary.
NIELSEN MARKETING CLOUD: INFORMING CMO DECISION-MAKINGPlanning, activation and analysis via Nielsen Marketing Cloud
PERSONS LEVEL BIG DATA BACKBONE
ACTIVATEPREDICT AND PLAN ANALYZE
LIFESTYLE
TOTAL AUDIENCE
1ST PARTY PARTNERSHIP

Co
pyr
igh
t ©20
14 T
he
Nie
lsen
Co
mp
any.
Co
nfi
den
tial
an
d p
rop
riet
ary.
29Co
pyr
igh
t ©20
17 T
he
Nie
lsen
Co
mp
any.
Co
nfi
den
tial
an
d p
rop
riet
ary.
TOTAL AUDIENCE: DELIVERING ON THE NEEDS OF THE INDUSTRY – TODAY AND TOMORROW
TOTAL AUDIENCE IS FOUNDATIONAL FOR AN ADDRESSABLE WORLD
TOTAL AUDIENCE IS A CRUCIAL PART OF THE EVOLVING CURRENCY
BUILDING OUT A BUY AND SELL SIDE DEPENDENCY FOR THE FUTURE
TOTAL AUDIENCE IS HERE – DELIVERED
ONLY NIELSEN CAN

Co
pyr
igh
t ©
20
16
Th
e N
iels
en C
om
pan
y.
30
FINANCIALS
Co
pyr
igh
t ©20
14 T
he
Nie
lsen
Co
mp
any.
Co
nfi
den
tial
an
d p
rop
riet
ary.
31Co
pyr
igh
t ©20
17 T
he
Nie
lsen
Co
mp
any.
Co
nfi
den
tial
an
d p
rop
riet
ary.
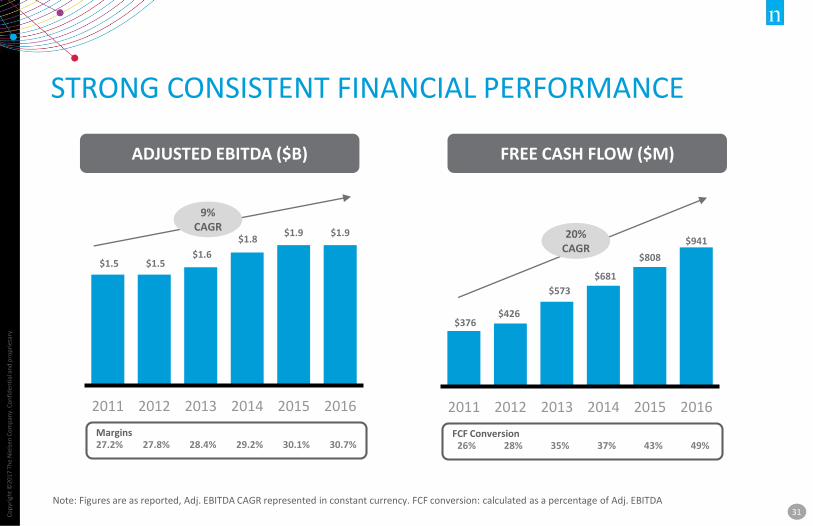
STRONG CONSISTENT FINANCIAL PERFORMANCE
$1.5 $1.5 $1.6
$1.8 $1.9 $1.9
2011 2012 2013 2014 2015 2016
27.2% 27.8% 28.4% 29.2% 30.1% 30.7%Margins
ADJUSTED EBITDA ($B)
9%CAGR
$376 $426
$573
$681
$808
$941
2011 2012 2013 2014 2015 2016
26% 28% 35% 37% 43% 49%FCF Conversion
FREE CASH FLOW ($M)
20%CAGR
Note: Figures are as reported, Adj. EBITDA CAGR represented in constant currency. FCF conversion: calculated as a percentage of Adj. EBITDA

Co
pyr
igh
t ©20
14 T
he
Nie
lsen
Co
mp
any.
Co
nfi
den
tial
an
d p
rop
riet
ary.
32Co
pyr
igh
t ©20
17 T
he
Nie
lsen
Co
mp
any.
Co
nfi
den
tial
an
d p
rop
riet
ary.
CONSISTENT REVENUE GROWTH($ billions)
Note: Figures are as reported, CAGR and revenue growth in constant currency. ’11 to ’16 CAGR ~4.4% ex Harris and Audio.
BUY
WATCH
6% CAGR
• Core measurement resilient
• New client wins
• Accelerating growth in emerging markets
• Total Audience Measurement
• Marketing Effectiveness growing double-digits
• Portfolio transformation
CONSISTENT & RESILIENT BUSINESS MODEL
2011 - 2016
Total CC % 5.6% 4.1% 6.4% 12.4% 5.0% 4.1%
Watch CC %
5.2% 4.8% 11.7% 21.3% 4.9% 6.3%
Buy CC % 5.8% 3.6% 3.1% 6.3% 5.0% 2.3%
3.3 3.3 3.4 3.5 3.3 3.3
2.0 2.1 2.3 2.8 2.8 3.0
2011 2012 2013 2014 2015 2016
$5.3 $5.4 $5.7$6.3 $6.2 $6.3

Co
pyr
igh
t ©20
14 T
he
Nie
lsen
Co
mp
any.
Co
nfi
den
tial
an
d p
rop
riet
ary.
33Co
pyr
igh
t ©20
17 T
he
Nie
lsen
Co
mp
any.
Co
nfi
den
tial
an
d p
rop
riet
ary.
Note: Revenue and Adj. EBITDA margin growth in constant currency
2017 GUIDANCE(Revenue and adj. EBITDA margin growth in constant currency)
Total Revenue 5% - 6%
Total Revenue Core 6.5% - 7.5%
Total Revenue Core (ex Gracenote) 3% - 4%
Adj. EBITDA margin growth Flat
GAAP Net Income Per Share $1.40 - $1.46
Net Debt Leverage Ratio ~3.8x
Free Cash Flow ~$900M
Net book interest $365M - $375M
GAAP Tax Rate 38.0% - 38.5%
Restructuring $60M - $70M
Cash restructuring $100M - $110M
D&A $665M - $675M
Est. wtd. avg. diluted shares outstanding for FY 2017 ~359M
OTHER FINANCIAL METRICS

Co
pyr
igh
t ©20
17 T
he
Nie
lsen
Co
mp
any.
Co
nfi
den
tial
an
d p
rop
riet
ary.
34
BALANCED CAPITAL ALLOCATION
Dividend~45%
MandatoryDebt~15%
Buyback / Tuck-in BD
~40%
LONG TERM FCF DEPLOYMENT 2014 – 2016 ACTIVITY
DELIVERING SHAREHOLDER VALUE
• Grow the business‒ Innovation…Total Audience & Connected System‒ Inorganic…Tuck-ins
• Return cash to shareholders‒ Grow dividend in line with earnings‒ Share buybacks
PRIORITIES
• Generated ~$2.4B of Free Cash Flow
• Returned $2.7B back to shareholders
• Increased dividend 94% since inception

Co
pyr
igh
t ©20
14 T
he
Nie
lsen
Co
mp
any.
Co
nfi
den
tial
an
d p
rop
riet
ary.
35Co
pyr
igh
t ©20
17 T
he
Nie
lsen
Co
mp
any.
Co
nfi
den
tial
an
d p
rop
riet
ary.
NIELSEN ACQUISITIONS & JOINT VENTURESCompany Capabilities
2013
Arbitron Radio audience measurement
Bowker E-books
MediaXIM Belgium and Netherlands advertising info services
G4 Trade promotion optimization; Leader in SaaS analytics solutions for CPG companies
2014
Nielsen Innovate Israel based incubator investing in startups that help Nielsen clients (10 countries)
Harris U.S. custom surveys
NexiumRetail shelf image identification technologies that replace manual inventory management systems
MMRD (JV) RMS in Myanmar
Czech TAM (JV) Television audience measurement
AffinovaIntuitive user interface platform and automated analytics capabilities; Nielsen’s Innovation Practice
2015 eXelate Digital Marketing Platform (DMP) that helps facilitate the buying/selling of advertising
2016Pointlogic
Global leader in marketing decision support systems that improve precision and allocation
Repucom Global leader in sports measurement, evaluation and intelligence
2017 Gracenote Industry’s largest provider of media and entertainment metadata
APPROXIMATELY $2.5B IN ACQUISITIONS AND JVS SINCE 2013, DRIVING GROWTH, VALUE & RETURNS

Co
pyr
igh
t ©20
17 T
he
Nie
lsen
Co
mp
any.
Co
nfi
den
tial
an
d p
rop
riet
ary.
36
FOREIGN CURRENCY IMPACT
(a) Projected impact assumes rates in effect at 2/8/17 remain in effect for the balance of 2017. Note: We report on a constant currency basis to reflect operating performance
61%9%
3%3%3%
21%
USD EUR CAD GBP CNY Other
2016 CURRENCY PROFILE - REVENUEPROJECTED FX IMPACT(a):
REPORTED VS CONSTANT CURRENCY
(140)
(190)
(50)
(160)
(120)
30
(70)(60)(90)
20
(40) (40)
60
(10)
4Q16 FY16 1Q17E 2Q17E 3Q17E 4Q17E FY17E
Rev (bps) EBITDA (bps)

Co
pyr
igh
t ©20
14 T
he
Nie
lsen
Co
mp
any.
Co
nfi
den
tial
an
d p
rop
riet
ary.
37Co
pyr
igh
t ©20
17 T
he
Nie
lsen
Co
mp
any.
Co
nfi
den
tial
an
d p
rop
riet
ary.
LONG TERM OUTLOOK
Note: All growth measures represented on constant currency basis.
THIS IS NIELSEN
DIVIDEND GROWTH
FREE CASH FLOW CONVERSION
MARGIN EXPANSION
REVENUE GROWTH
IN LINE WITH EARNINGS GROWTH
45-50% ADJ. EBITDA
~50 BPS
MID-SINGLE DIGIT
GAAP EPS GROWTH DOUBLE DIGIT
Co
pyr
igh
t ©
20
16
Th
e N
iels
en C
om
pan
y.
38
APPENDIX
Co
pyr
igh
t ©
20
16
Th
e N
iels
en C
om
pan
y.
39
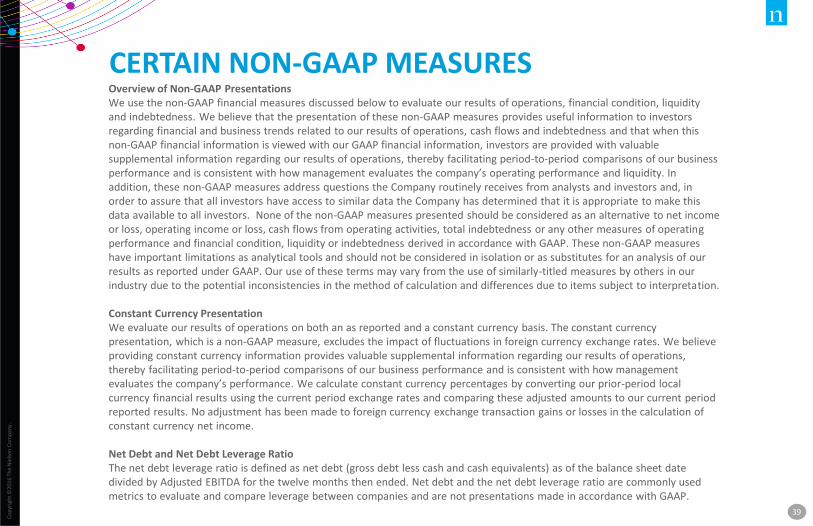
CERTAIN NON-GAAP MEASURESOverview of Non-GAAP PresentationsWe use the non-GAAP financial measures discussed below to evaluate our results of operations, financial condition, liquidity and indebtedness. We believe that the presentation of these non-GAAP measures provides useful information to investors regarding financial and business trends related to our results of operations, cash flows and indebtedness and that when this non-GAAP financial information is viewed with our GAAP financial information, investors are provided with valuable supplemental information regarding our results of operations, thereby facilitating period-to-period comparisons of our business performance and is consistent with how management evaluates the company’s operating performance and liquidity. In addition, these non-GAAP measures address questions the Company routinely receives from analysts and investors and, in order to assure that all investors have access to similar data the Company has determined that it is appropriate to make thisdata available to all investors. None of the non-GAAP measures presented should be considered as an alternative to net income or loss, operating income or loss, cash flows from operating activities, total indebtedness or any other measures of operating performance and financial condition, liquidity or indebtedness derived in accordance with GAAP. These non-GAAP measures have important limitations as analytical tools and should not be considered in isolation or as substitutes for an analysis of our results as reported under GAAP. Our use of these terms may vary from the use of similarly-titled measures by others in our industry due to the potential inconsistencies in the method of calculation and differences due to items subject to interpretation.
Constant Currency PresentationWe evaluate our results of operations on both an as reported and a constant currency basis. The constant currency presentation, which is a non-GAAP measure, excludes the impact of fluctuations in foreign currency exchange rates. We believe providing constant currency information provides valuable supplemental information regarding our results of operations, thereby facilitating period-to-period comparisons of our business performance and is consistent with how management evaluates the company’s performance. We calculate constant currency percentages by converting our prior-period local currency financial results using the current period exchange rates and comparing these adjusted amounts to our current periodreported results. No adjustment has been made to foreign currency exchange transaction gains or losses in the calculation of constant currency net income.
Net Debt and Net Debt Leverage RatioThe net debt leverage ratio is defined as net debt (gross debt less cash and cash equivalents) as of the balance sheet date divided by Adjusted EBITDA for the twelve months then ended. Net debt and the net debt leverage ratio are commonly used metrics to evaluate and compare leverage between companies and are not presentations made in accordance with GAAP.
Co
pyr
igh
t ©
20
16
Th
e N
iels
en C
om
pan
y.
40
CERTAIN NON-GAAP MEASURES(continued)
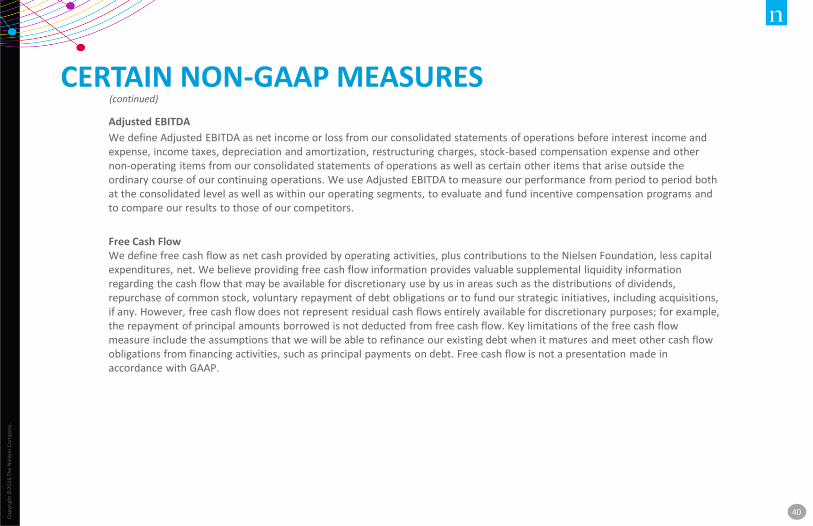
Adjusted EBITDA
We define Adjusted EBITDA as net income or loss from our consolidated statements of operations before interest income and expense, income taxes, depreciation and amortization, restructuring charges, stock-based compensation expense and other non-operating items from our consolidated statements of operations as well as certain other items that arise outside the ordinary course of our continuing operations. We use Adjusted EBITDA to measure our performance from period to period both at the consolidated level as well as within our operating segments, to evaluate and fund incentive compensation programs and to compare our results to those of our competitors.
Free Cash FlowWe define free cash flow as net cash provided by operating activities, plus contributions to the Nielsen Foundation, less capital expenditures, net. We believe providing free cash flow information provides valuable supplemental liquidity information regarding the cash flow that may be available for discretionary use by us in areas such as the distributions of dividends, repurchase of common stock, voluntary repayment of debt obligations or to fund our strategic initiatives, including acquisitions, if any. However, free cash flow does not represent residual cash flows entirely available for discretionary purposes; for example, the repayment of principal amounts borrowed is not deducted from free cash flow. Key limitations of the free cash flow measure include the assumptions that we will be able to refinance our existing debt when it matures and meet other cash flow obligations from financing activities, such as principal payments on debt. Free cash flow is not a presentation made in accordance with GAAP.

Co
pyr
igh
t ©20
17 T
he
Nie
lsen
Co
mp
any.
Co
nfi
den
tial
an
d p
rop
riet
ary.
41
2017E CORE BUY PORTFOLIO MIX
Core Measurement
Innovation
Everyday Analytics Core Measurement
Everyday Analytics‒ Price‒ Promotion‒ Assortment
Innovation‒ New product evaluation
~75%
~15%
~10%
2017E Growth Rates
Low Single Digits
Low to Mid Single Digits
Low to Mid Single Digits

Co
pyr
igh
t ©20
17 T
he
Nie
lsen
Co
mp
any.
Co
nfi
den
tial
an
d p
rop
riet
ary.
42
SELECTED FINANCIAL METRICS & BALANCE SHEET ITEMS($ in millions)
Co
pyr
igh
t ©
20
16
Th
e N
iels
en C
om
pan
y.
43
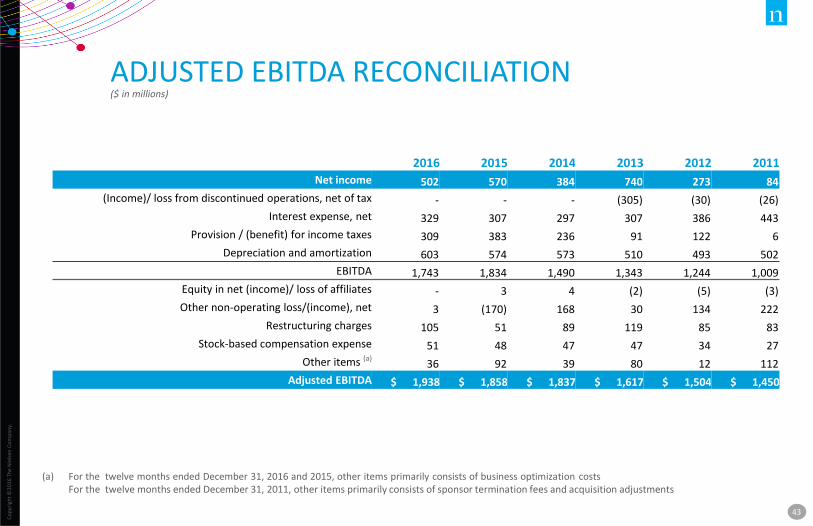
ADJUSTED EBITDA RECONCILIATION($ in millions)
(a) For the twelve months ended December 31, 2016 and 2015, other items primarily consists of business optimization costsFor the twelve months ended December 31, 2011, other items primarily consists of sponsor termination fees and acquisition adjustments
2016 2015 2014 2013 2012 2011
Net income 502 570 384 740 273 84
(Income)/ loss from discontinued operations, net of tax - - - (305) (30) (26)
Interest expense, net 329 307 297 307 386 443
Provision / (benefit) for income taxes 309 383 236 91 122 6
Depreciation and amortization 603 574 573 510 493 502
EBITDA 1,743 1,834 1,490 1,343 1,244 1,009
Equity in net (income)/ loss of affiliates - 3 4 (2) (5) (3)
Other non-operating loss/(income), net 3 (170) 168 30 134 222
Restructuring charges 105 51 89 119 85 83
Stock-based compensation expense 51 48 47 47 34 27
Other items (a)36 92 39 80 12 112
Adjusted EBITDA $ 1,938 $ 1,858 $ 1,837 $ 1,617 $ 1,504 $ 1,450

Co
pyr
igh
t ©20
17 T
he
Nie
lsen
Co
mp
any.
Co
nfi
den
tial
an
d p
rop
riet
ary.
44
($ in millions)
2017 GUIDANCE NON-GAAP RECONCILIATIONS
NET DEBT LEVERAGE RATIO
Gross Debt ~$ 8,320
Cash ~$ 580
Net Debt ~$ 7,740
Adjusted EBITDA $2,030 - $2,050
Net Debt Leverage Ratio ~3.8x
FREE CASH FLOW
Net cash provided by operating activities ~$1,360
Less: Capital expenditures, net ~(460)
Free cash flow ~$900
ADJUSTED EBITDA RECONCILIATION
2017 Guidance Range
Net income $500 - $525
Interest expense, net $365 - $375
Provision for income taxes $310 – $330
Depreciation and amortization $665 – $675
Restructuring charges $60 – $70
Stock-based compensation and other $100 - $105
Adjusted EBITDA $2,030 - $2,050
Co
pyr
igh
t ©20
17 T
he
Nie
lsen
Co
mp
any.
Co
nfi
den
tial
an
d p
rop
riet
ary.
45
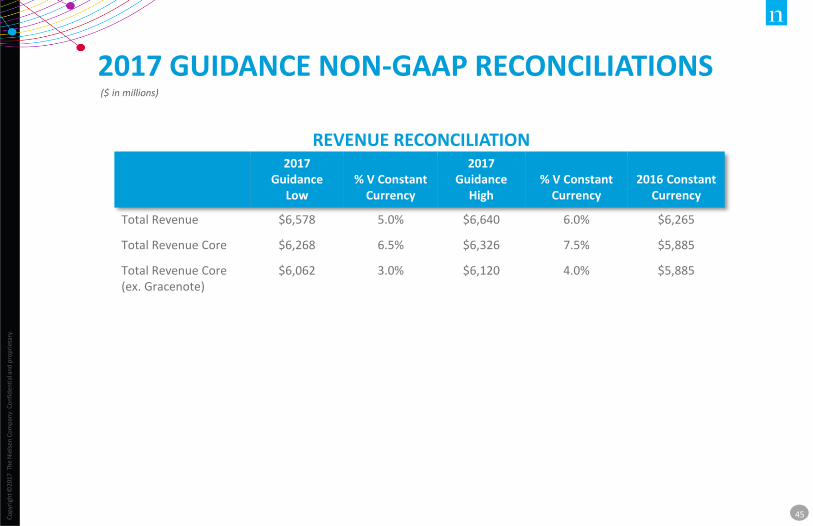
($ in millions)
2017 GUIDANCE NON-GAAP RECONCILIATIONS
2017 Guidance
Low% V Constant
Currency
2017 Guidance
High% V Constant
Currency2016 Constant
Currency
Total Revenue $6,578 5.0% $6,640 6.0% $6,265
Total Revenue Core $6,268 6.5% $6,326 7.5% $5,885
Total Revenue Core (ex. Gracenote)
$6,062 3.0% $6,120 4.0% $5,885
REVENUE RECONCILIATION

Co
pyr
igh
t ©20
14 T
he
Nie
lsen
Co
mp
any.
Co
nfi
den
tial
an
d p
rop
riet
ary.
46Co
pyr
igh
t ©20
17 T
he
Nie
lsen
Co
mp
any.
Co
nfi
den
tial
an
d p
rop
riet
ary.
WEIGHTED AVERAGE SHARES OUTSTANDING($ in millions except per share amounts. Year ended December 31 for all years)
Weighted-average shares of common stock outstanding as of December 31, basic
358,830,080 366,996,788 379,333,037 375,797,629 361,787,868 352,469,181
Dilutive shares of common stock from stock compensation plans
3,337,049 3,961,016 5,038,415 5,130,337 4,523,116 5,032,773
Shares of common stock convertible associated with the mandatory convertible
bonds
– – – 896,994 10,416,700 9,531,994
Weighted-average shares of common stock outstanding as of December 31, diluted
362,167,129 370,957,804 384,371,452 381,824,960 376,727,684 367,033,948
20112015 2013 201220142016

Co
pyr
igh
t ©20
14 T
he
Nie
lsen
Co
mp
any.
Co
nfi
den
tial
an
d p
rop
riet
ary.
47Co
pyr
igh
t ©20
17 T
he
Nie
lsen
Co
mp
any.
Co
nfi
den
tial
an
d p
rop
riet
ary.
FREE CASH FLOW RECONCILIATION($ in millions. Year ended December 31 for all years)
Net cash provided by operating activities $1,296 $1,209 $1,093 $901 $784 $641
Sponsor termination fee – – – – – 102
One-time Arbitron costs – – – 46 – –
Non-recurring contribution to the Nielsen Foundation 36 – – – – –
Capital expenditures, net (391) (401) (412) (374) (358) (367)
Free Cash Flow $941 $808 $681 $573 $426 $376
20112015 2013 201220142016

Co
pyr
igh
t ©20
14 T
he
Nie
lsen
Co
mp
any.
Co
nfi
den
tial
an
d p
rop
riet
ary.
48Co
pyr
igh
t ©20
17 T
he
Nie
lsen
Co
mp
any.
Co
nfi
den
tial
an
d p
rop
riet
ary.
NET DEBT AND NET DEBT LEVERAGE RATIO RECONCILIATION($ in millions. Year ended December 31 for all years)
Gross debt $7,926 $7,338 $6,812 $6,640 $6,296 $6,475
Less: cash and cash equivalents 754 357 273 564 288 319
Net debt $7,172 $6,981 $6,539 $6,076 $6,008 $6,156
Adjusted EBITDA $1,938 $1,858 $1,837 $1,734 $1,602 $1,546
Net debt leverage ratio 3.7x 3.8x 3.6x 3.5x 3.8x 4.0x
20112015 2013 201220142016

Co
pyr
igh
t ©20
14 T
he
Nie
lsen
Co
mp
any.
Co
nfi
den
tial
an
d p
rop
riet
ary.
49Co
pyr
igh
t ©20
17 T
he
Nie
lsen
Co
mp
any.
Co
nfi
den
tial
an
d p
rop
riet
ary.
WATCH RE-ORGANIZATION: IMPACT ON REVENUE
2016 2015 2014
Note: Figures are as reported, revenue growth in constant currency
Prior Segments Q1 Q2 Q3 YTD Q1 Q2 Q3 Q4 FY Q1 Q2 Q3 Q4 FYMarketing Effectiveness $ 67 $ 84 $ 87 $ 238 $ 52 $ 74 $ 68 $ 88 $ 282 $ 44 $ 62 $ 65 $ 68 $ 239 Audio 120 123 137 380 120 121 141 122 504 118 122 127 131 498 Audience Measurement 472 491 496 1,459 445 458 458 479 1,840 434 443 448 459 1,784 Other Watch 35 46 41 122 43 54 48 56 201 56 67 54 67 244 Total Watch $ 694 $ 744 $ 761 $ 2,199 $ 660 $ 707 $ 715 $ 745 $ 2,827 $ 652 $ 694 $ 694 $ 725 $ 2,765
Revised Segments Q1 Q2 Q3 YTD Q1 Q2 Q3 Q4 FY Q1 Q2 Q3 Q4 FYMarketing Effectiveness $ 58 $ 71 $ 75 $ 204 $ 48 $ 64 $ 61 $ 78 $ 251 $ 40 $ 56 $ 58 $ 61 $ 215 Audio 120 123 137 380 120 121 141 122 504 118 122 127 131 498 Audience Measurement 472 491 496 1,459 445 458 458 479 1,840 434 443 448 459 1,784 Core Watch 650 685 708 2,043 613 643 660 679 2,595 592 621 633 651 2,497 Corporate / Other Watch 44 59 53 156 47 64 55 66 232 60 73 61 74 268 Total Watch $ 694 $ 744 $ 761 $ 2,199 $ 660 $ 707 $ 715 $ 745 $ 2,827 $ 652 $ 694 $ 694 $ 725 $ 2,765
Revised Y/Y Growth Q1 Q2 Q3 YTD Q1 Q2 Q3 Q4 FY Q1 Q2 Q3 Q4 FYMarketing Effectiveness 20.8% 12.7% 25.0% 19.3% 26.3% 16.4% 8.9% 27.9% 19.5% 11.1% 5.7% 20.8% 19.6% 14.4%Audio 0.8% 1.7% -2.8% -0.3% 1.7% -0.8% 11.0% -6.9% 1.2% F F F -3.7% FAudience Measurement 7.5% 7.9% 8.5% 8.0% 5.5% 6.8% 5.8% 7.6% 6.4% 6.0% 6.5% 6.2% 6.5% 6.3%Core Watch 7.3% 7.2% 7.6% 7.4% 6.1% 6.1% 7.1% 6.6% 6.5% 33.0% 32.1% 34.7% 4.8% 24.5%Corporate / Other Watch -6.4% -7.8% -3.6% -6.0% -19.0% -8.6% -5.2% -7.0% -9.7% 1.7% 0.0% -7.6% -1.3% -1.8%
Total Watch 6.3% 5.8% 6.7% 6.3% 3.6% 4.7% 6.1% 5.2% 4.9% 29.4% 28.3% 29.2% 4.0% 21.3%
($ in millions)

Co
pyr
igh
t ©20
14 T
he
Nie
lsen
Co
mp
any.
Co
nfi
den
tial
an
d p
rop
riet
ary.
50Co
pyr
igh
t ©20
17 T
he
Nie
lsen
Co
mp
any.
Co
nfi
den
tial
an
d p
rop
riet
ary.
BUY RE-ORGANIZATION: IMPACT ON REVENUE
2016 2015 2014
Note: Figures are as reported, revenue growth in constant currency
Prior Segments Q1 Q2 Q3 YTD Q1 Q2 Q3 Q4 FY Q1 Q2 Q3 Q4 FYEmerging $ 243 $ 270 $ 267 $ 780 $ 249 $ 270 $ 253 $ 272 $ 1,044 $ 260 $ 286 $ 290 $ 297 $ 1,133
Developed 550 582 542 1,674 549 582 563 607 2,301 577 614 588 611 2,390 Total Buy $ 793 $ 852 $ 809 $ 2,454 $ 798 $ 852 $ 816 $ 879 $ 3,345 $ 837 $ 900 $ 878 $ 908 $ 3,523
Revised Segments Q1 Q2 Q3 YTD Q1 Q2 Q3 Q4 FY Q1 Q2 Q3 Q4 FYEmerging $ 243 $ 270 $ 267 $ 780 $ 249 $ 270 $ 253 $ 272 $ 1,044 $ 260 $ 286 $ 290 $ 297 $ 1,133
Developed 515 527 509 1,551 506 535 516 553 2,110 539 565 543 553 2,200 Core Buy 758 797 776 2,331 755 805 769 825 3,154 799 851 833 850 3,333
Corporate 35 55 33 123 43 47 47 54 191 38 49 45 58 190 Total Buy $ 793 $ 852 $ 809 $ 2,454 $ 798 $ 852 $ 816 $ 879 $ 3,345 $ 837 $ 900 $ 878 $ 908 $ 3,523
Revised Y/Y Growth Q1 Q2 Q3 YTD Q1 Q2 Q3 Q4 FY Q1 Q2 Q3 Q4 FYEmerging 10.0% 8.9% 8.5% 9.1% 10.2% 9.3% 6.3% 8.4% 8.5% 8.3% 9.2% 10.3% 10.0% 9.5%
Developed 3.8% -0.4% 0.0% 1.1% 2.2% 3.3% 2.8% 5.7% 3.5% 2.7% 3.7% -0.5% 0.9% 1.7%Core Buy 5.7% 2.6% 2.8% 3.6% 4.7% 5.2% 3.9% 6.6% 5.1% 4.4% 5.5% 3.0% 3.9% 4.2%
Corporate -18.6% 14.6% -29.8% -10.9% 13.2% -2.1% 6.8% -3.6% 2.7% 52.0% 81.5% 60.7% 65.7% 65.2%
Total Buy 4.3% 3.3% 0.9% 2.8% 5.1% 4.8% 4.1% 5.9% 5.0% 5.9% 7.9% 4.9% 6.4% 6.3%
($ in millions)

NIELSEN INVESTOR RELATIONS
+1.646.654.4602
http://nielsen.com/investors
Follow Nielsen