natural resources and economic growth: the role of investment
TRANSCRIPT

Natural Resources and Economic Growth:The Role of Investment
by
Thorvaldur Gylfason and Gylfi Zoega*
Revised June 2001
Abstract
This paper begins by a brief review of empirical evidence that seems to indicate thateconomic growth since 1965 has varied inversely with natural resource abundance orintensity across countries. The paper then proposes a new linkage between naturalresources and economic growth, through saving and investment. When the share ofoutput that accrues to the owners of natural resources rises, the demand for capitalfalls and this leads to lower real interest rates and less rapid growth. Moreover, theanalysis shows that the discrepancy between the privately and socially optimal ratesof growth increases with the natural capital share. Empirical evidence from 85countries from 1965 to 1998 suggests that natural capital may on average crowd outphysical as well as human capital, thereby inhibiting economic growth. The resultsalso suggest that, across countries, heavy dependence on natural resources may hurtsaving and investment indirectly by slowing down the development of the financialsystem.
JEL: O11.
Keywords: Economic growth, natural resources, investment, genuine saving.
* Thorvaldur Gylfason is Research Professor of Economics, University of Iceland; Research Fellow,CEPR; and Research Associate, SNS—Center for Business and Policy Studies, Stockholm. Address:Faculty of Economics and Business Administration, University of Iceland, 101 Reykjavík, Iceland. Tel:354-525-4533 or 4500. Fax: 354-552-6806. E-mail: [email protected]. Gylfi Zoega is Senior Lecturer inEconomics, Birkbeck College, and Research Affiliate, CEPR. Address: Department of Economics,Birkbeck College, University of London, 7-15 Gresse Street, London W1P 2LL, United Kingdom. Theauthors are indebted to Rögnvaldur Hannesson, Ron Smith and two referees for helpful comments and
1
1. Introduction
Natural resources are an important source of national wealth around the world. Yet,
experience shows that natural riches are neither necessary nor sufficient for economic
prosperity and progress. The world’s richest countries include Hong Kong, Japan,
Singapore and Switzerland which do not owe their national wealth to nature and many
others, such as the United States and the United Kingdom, where natural resources
nowadays play only a minor role in the generation of national income.
Among developing countries, natural resources are relatively more prevalent. This
may to some extent reflect their underdevelopment: the modest size of the modern
sector of the economy makes agriculture and other natural-resource-based economic
activity relatively more important. But there are also clear examples of countries that
are genuinely rich in terms of natural resources but still have not been able to sustain
economic growth. It thus appears that the generosity of nature may sometimes –
although by no means always – turn out to be a mixed blessing. Take Botswana and
Sierra Leone, both of which produce diamonds for export. By and large, Botswana
has managed the revenue and rent stream from its main natural resource in ways that
have contributed to impressive economic growth since independence in 1966 – in
fact, the world’s highest recorded rate of growth of gross national product (GNP) per
capita from 1965 to 1998, even if it slowed down after 1990. Meanwhile, Sierra
Leone has remained mired in poverty, ravaged by crippling internal warfare as local
warlords have continued to fight for control over the diamond trade. Sierra Leone was
the world’s poorest country in 1998 according to the World Bank (2000). Apparently,
the rich supply of diamonds has turned out to be a source of domestic strife that has
both diverted precious national resources towards rent seeking of the most destructive
kind and destroyed the infrastructure and social institutions that are so important for
economic life. This example shows that the existence of natural resources can be both
a blessing and a curse to economic growth and development.
In this paper, we consider the interaction between institutions, natural resource
dependence and economic growth. In particular, we are interested in the possible
mechanisms through which natural resources can stifle capital accumulation and
growth and the conditions under which economic growth can take place in the
presence of abundant natural resources. In this context it will be interesting to
suggestions.
2
consider the experience of those countries – if any – which at some point in the past
relied on nature’s bounty but now enjoy the benefits of developed and diversified
manufacturing and service industries.
Recent empirical research suggests that an abundance of natural resources can hurt
economic growth indirectly by unleashing forces that hamper the development of the
national economy, primarily through the Dutch disease, rent seeking and neglect of
education. We will review this literature below, in Section 3. To some, these findings
may seem counterintuitive for it should, in principle, be possible to harness natural
resources without hurting national economic welfare and growth. We concur.
This paper is intended to make two main points. First, natural resource abundance
may under certain conditions – to be specified – blunt incentives to save and invest
and thereby reduce economic growth. We demonstrate this proposition by deriving
the optimal saving rate in an endogenous growth model of an economy with natural
resources and then subject it to empirical tests in a cross-sectional sample of 85
countries from 1965 to 1998. Second, on the premise that mature institutions
contribute to an efficient use of resources, including natural resources, and that poorly
developed institutions do not, we argue that natural resource abundance may also
under certain conditions – to be specified – retard the development of financial
institutions in particular and hence hamper saving, investment and economic growth
through that channel as well.
The paper proceeds as follows. Section 2 looks briefly at the empirical evidence on
natural resource dependence and economic growth. Section 3 provides a brief
overview of recent literature on the subject. In Section 4, we compare the experience
of Norway, the world’s most successful oil exporter, with that of other oil-producing
countries. In Section 5, we derive our main proposition that natural resource
dependence tends to blunt incentives to save and invest. We also distinguish between
the quantity and quality of investment. In Section 6, we summarize the data through
simple bivariate correlations between natural resource dependence, different measures
of saving and investment and economic growth. In Section 7, we then proceed to
more elaborate tests of our hypothesis by multiple regression analysis in the spirit of
the recent empirical growth literature. Section 8 summarizes our main results and
offers a few concluding comments.

3
2. Preview
A rapidly expanding body of research has attempted to discern empirical growth
relationships across countries. While aggregative and simple, such cross-sectional and
panel data sets – often covering large numbers of countries – do provide an interesting
starting point.
Figure 1 is representative of one of the empirical findings that have emerged from
some recent studies, beginning with Sachs and Warner (1995). The figure covers 85
countries, and shows a scatterplot of economic growth per capita from 1965 to 1998
and natural resource dependence as measured by the share of natural capital in
national wealth in 1994 – i.e., the share of natural capital in total capital, which
comprises physical, human and natural capital (but not social capital; see World Bank,
1997). The natural capital variable used here is close to the source: it is intended to
come closer to a direct measurement of the intensity of natural resources across
countries than the various proxies that have been used in earlier studies, mainly the
share of primary (i.e., nonmanufacturing) exports in total exports or in gross domestic
product (GDP) and the share of the primary sector in employment or the labor force.1
The latter proxies may be prone to bias due to product and labor market distortions.
The growth rate has been adjusted for initial income: the variable on the vertical axis
is that part of economic growth that is not explained by the country’s initial stage of
development, obtained from a regression of growth during 1965-1998 on initial GNP
per capita (i.e., in 1965) as well as natural capital. When we also purge the natural
capital share of that part which is explained by the country’s initial stage of
development, we get very similar results as in Figure 1. The 85 countries in the
sample are represented by one observation each for each variable under study, an
average for the entire sample period, 1965-1998 (see Table 1 and Appendix).2
1 Alas, 1994 is the only year for which the World Bank has as yet produced data on natural capital, for92 countries. In most cases, however, natural capital in 1994 is probably a pretty good proxy for naturalresource abundance in the period under review, 1965-1998. There are exceptions, true, such asMalaysia, Mauritius and Mexico, where the share of primary exports in merchandise exports decreaseddramatically from 1965 to 1998 as a result of economic diversification away from primary production.Even so, all the empirical results reported in this paper can be reproduced without significant deviationsby using the average primary export share during 1965-1998 rather than natural capital in 1994 as aproxy for natural resource abundance, and also by measuring growth in terms of GNP per worker ratherthan GNP per capita.2 The reason why there are 85 countries in the sample and not 92 is that (a) for five countries for whichestimates of natural capital exist, there are missing data on economic growth since 1965 (Bolivia,Germany, Tanzania, Uganda and Vietnam) and (b) for two countries, the available data are problematic
4
The regression line through the scatterplot in Figure 1 suggests that an increase of
about eight or nine percentage points in the natural capital share from one country to
another is associated with a decrease in per capita growth by one percentage point per
year on average.3 The relationship is also significant in a statistical sense (Spearman’s
r = -0.64), and conforms to the partial correlations that have been reported in multiple
regression analyses where other relevant determinants of growth (investment,
education, etc., as well as initial income) are taken into account.4 A similar
relationship has been reported in a number of recent studies, including Sachs and
Warner (1995, 1999), Gylfason and Herbertsson (2001), and Gylfason, Herbertsson
and Zoega (1999).
We are aware that the study of bivariate cross-sectional relationships has many
shortcomings. For one thing, such studies bypass the diversity of individual country
experiences as well as intranational developments over time. For another, they do not
distinguish cause from effect. We intend the correlations presented in this paper
merely to describe the data in ways that are consistent with the results of multiple
regression analysis that can help account for more potential sources of growth.
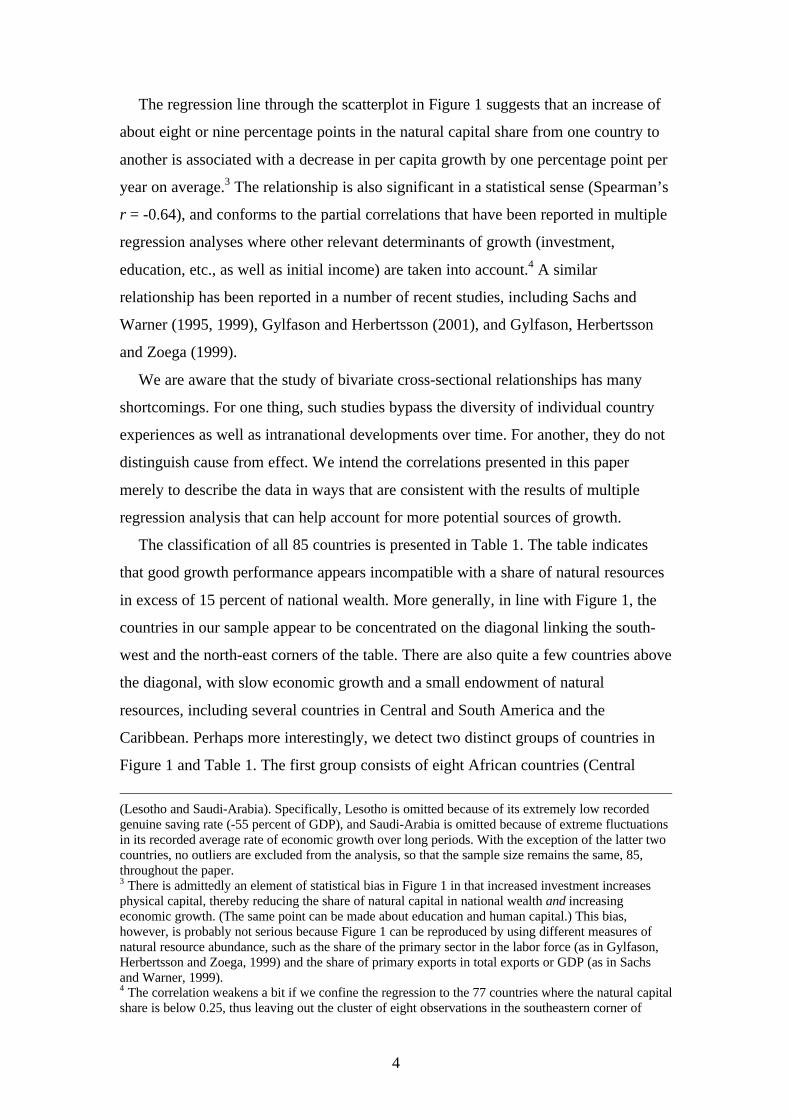
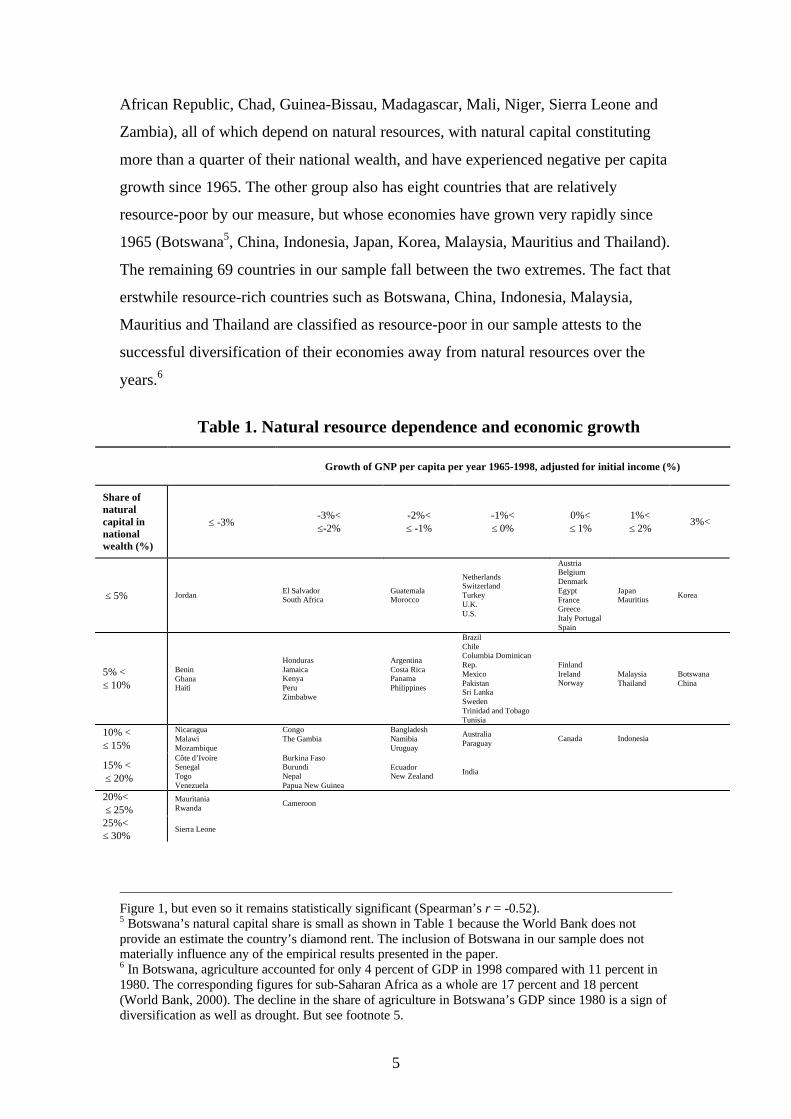
The classification of all 85 countries is presented in Table 1. The table indicates
that good growth performance appears incompatible with a share of natural resources
in excess of 15 percent of national wealth. More generally, in line with Figure 1, the
countries in our sample appear to be concentrated on the diagonal linking the south-
west and the north-east corners of the table. There are also quite a few countries above
the diagonal, with slow economic growth and a small endowment of natural
resources, including several countries in Central and South America and the
Caribbean. Perhaps more interestingly, we detect two distinct groups of countries in
Figure 1 and Table 1. The first group consists of eight African countries (Central
(Lesotho and Saudi-Arabia). Specifically, Lesotho is omitted because of its extremely low recordedgenuine saving rate (-55 percent of GDP), and Saudi-Arabia is omitted because of extreme fluctuationsin its recorded average rate of economic growth over long periods. With the exception of the latter twocountries, no outliers are excluded from the analysis, so that the sample size remains the same, 85,throughout the paper.3 There is admittedly an element of statistical bias in Figure 1 in that increased investment increasesphysical capital, thereby reducing the share of natural capital in national wealth and increasingeconomic growth. (The same point can be made about education and human capital.) This bias,however, is probably not serious because Figure 1 can be reproduced by using different measures ofnatural resource abundance, such as the share of the primary sector in the labor force (as in Gylfason,Herbertsson and Zoega, 1999) and the share of primary exports in total exports or GDP (as in Sachsand Warner, 1999).4 The correlation weakens a bit if we confine the regression to the 77 countries where the natural capitalshare is below 0.25, thus leaving out the cluster of eight observations in the southeastern corner of
5
African Republic, Chad, Guinea-Bissau, Madagascar, Mali, Niger, Sierra Leone and
Zambia), all of which depend on natural resources, with natural capital constituting
more than a quarter of their national wealth, and have experienced negative per capita
growth since 1965. The other group also has eight countries that are relatively
resource-poor by our measure, but whose economies have grown very rapidly since
1965 (Botswana5, China, Indonesia, Japan, Korea, Malaysia, Mauritius and Thailand).
The remaining 69 countries in our sample fall between the two extremes. The fact that
erstwhile resource-rich countries such as Botswana, China, Indonesia, Malaysia,
Mauritius and Thailand are classified as resource-poor in our sample attests to the
successful diversification of their economies away from natural resources over the
years.6
Table 1. Natural resource dependence and economic growth
Growth of GNP per capita per year 1965-1998, adjusted for initial income (%)
Share ofnaturalcapital innationalwealth (%)
≤ -3%-3%<≤-2%
-2%<≤ -1%
-1%<≤ 0%
0%<≤ 1%
1%<≤ 2%
3%<
≤ 5% JordanEl SalvadorSouth Africa
GuatemalaMorocco
NetherlandsSwitzerlandTurkeyU.K.U.S.
AustriaBelgiumDenmarkEgyptFranceGreeceItaly PortugalSpain
JapanMauritius
Korea
5% <≤ 10%
BeninGhanaHaiti
HondurasJamaicaKenyaPeruZimbabwe
ArgentinaCosta RicaPanamaPhilippines
BrazilChileColumbia DominicanRep.MexicoPakistanSri LankaSwedenTrinidad and TobagoTunisia
FinlandIrelandNorway
MalaysiaThailand
BotswanaChina
10% <≤ 15%
NicaraguaMalawiMozambique
CongoThe Gambia
BangladeshNamibiaUruguay
AustraliaParaguay
Canada Indonesia
15% < ≤ 20%
Côte d’IvoireSenegalTogoVenezuela
Burkina FasoBurundiNepalPapua New Guinea
EcuadorNew Zealand
India
20%< ≤ 25%
MauritaniaRwanda
Cameroon
25%<≤ 30%
Sierra Leone
Figure 1, but even so it remains statistically significant (Spearman’s r = -0.52).5 Botswana’s natural capital share is small as shown in Table 1 because the World Bank does notprovide an estimate the country’s diamond rent. The inclusion of Botswana in our sample does notmaterially influence any of the empirical results presented in the paper.6 In Botswana, agriculture accounted for only 4 percent of GDP in 1998 compared with 11 percent in1980. The corresponding figures for sub-Saharan Africa as a whole are 17 percent and 18 percent(World Bank, 2000). The decline in the share of agriculture in Botswana’s GDP since 1980 is a sign ofdiversification as well as drought. But see footnote 5.

6
30%<
Central African Rep.ChadGuinea BissauMadagascarMaliNigerZambia
The question is bound to arise what makes the eight high-performance economies in
the second group different from the eight African laggards in the first. A key factor
that distinguishes the two groups is saving and investment. Specifically, the group of
natural-resource-rich, slow-growth countries shown in the south-west corner of Table
1 has an average gross saving rate of only 5 percent, ranging from -2 percent in
Guinea-Bissau to 19 percent in Zambia, whereas the natural-resource-poor, high-
growth group shown in the north-east corner has an average gross saving rate of 32
percent, with individual observations clustered in the range between 28 and 35
percent. A similar pattern emerges when we replace gross domestic saving with gross
domestic investment. In this case, the group of natural-resource-rich, slow-growth
countries has an average gross investment rate of 14 percent, ranging from 7 percent
in Chad to 29 percent in Guinea-Bissau, whereas the natural-resource-poor, high-
growth group has an average gross investment rate of 28 percent, with individual
observations clustered in the range between 26 and 31 percent. Hence our focus on
saving and investment in this paper.
An important limitation of our data is a lack of observations on the share of natural
resources in national wealth at the beginning of the sample period. While economic
growth is measured as an average from 1965 to 1998, our measure of the importance
of natural resources – their share of total wealth – applies to the year 1994. This may
explain, in part, why some formerly resource-dependent countries such as Botswana,
China, Malaysia, Mauritius and Thailand are counted as relatively resource-poor. The
pattern in the table can thus conceivably arise through self selection as the good
performers move towards the upper right-hand corner – having high growth and a low
share of natural resources in national wealth – while the poor performers move into
the bottom left-hand corner – with low or negative growth and heavily dependent on
natural resources. However, when alternative measures of natural-resource
dependence – their share of exports, national output, or the labor force – are used at
the beginning of the period or as period averages, we also find an inverse relationship
between natural resource intensity and economic growth (see Gylfason, Herbertsson
and Zoega, 1999, and Gylfason and Herbertsson, 2001).
7
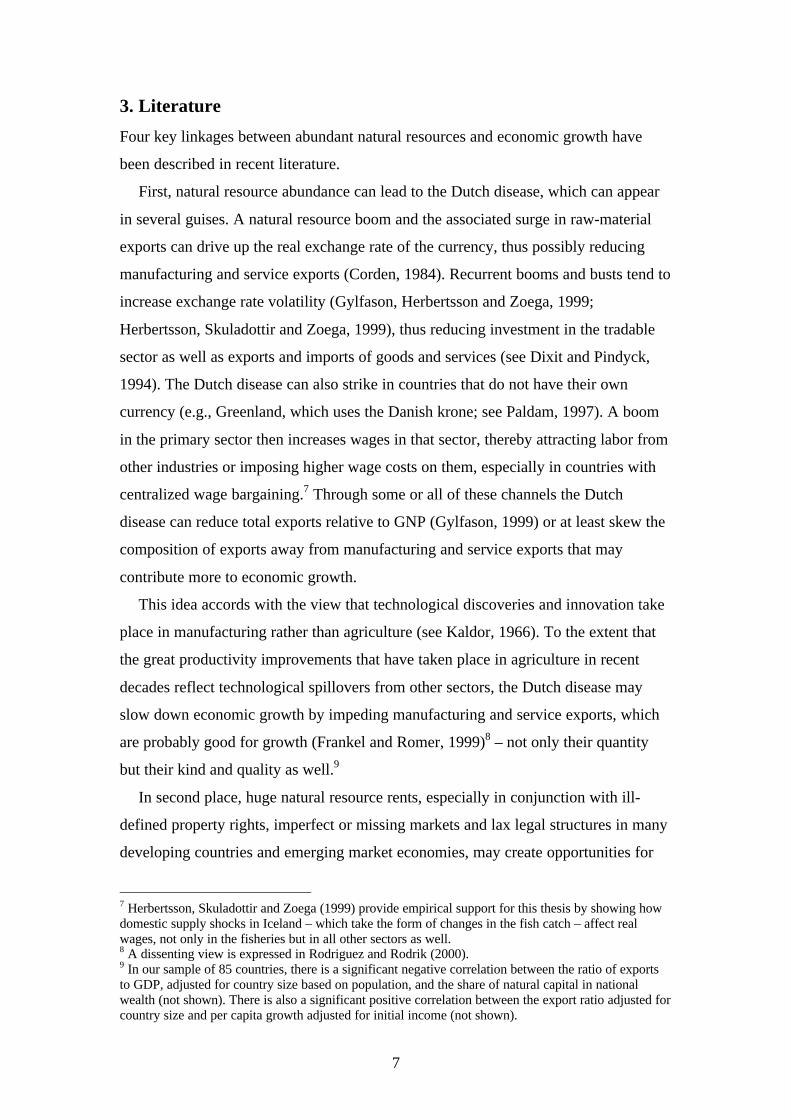
3. Literature
Four key linkages between abundant natural resources and economic growth have
been described in recent literature.
First, natural resource abundance can lead to the Dutch disease, which can appear
in several guises. A natural resource boom and the associated surge in raw-material
exports can drive up the real exchange rate of the currency, thus possibly reducing
manufacturing and service exports (Corden, 1984). Recurrent booms and busts tend to
increase exchange rate volatility (Gylfason, Herbertsson and Zoega, 1999;
Herbertsson, Skuladottir and Zoega, 1999), thus reducing investment in the tradable
sector as well as exports and imports of goods and services (see Dixit and Pindyck,
1994). The Dutch disease can also strike in countries that do not have their own
currency (e.g., Greenland, which uses the Danish krone; see Paldam, 1997). A boom
in the primary sector then increases wages in that sector, thereby attracting labor from
other industries or imposing higher wage costs on them, especially in countries with
centralized wage bargaining.7 Through some or all of these channels the Dutch
disease can reduce total exports relative to GNP (Gylfason, 1999) or at least skew the
composition of exports away from manufacturing and service exports that may
contribute more to economic growth.
This idea accords with the view that technological discoveries and innovation take
place in manufacturing rather than agriculture (see Kaldor, 1966). To the extent that
the great productivity improvements that have taken place in agriculture in recent
decades reflect technological spillovers from other sectors, the Dutch disease may
slow down economic growth by impeding manufacturing and service exports, which
are probably good for growth (Frankel and Romer, 1999)8 – not only their quantity
but their kind and quality as well.9
In second place, huge natural resource rents, especially in conjunction with ill-
defined property rights, imperfect or missing markets and lax legal structures in many
developing countries and emerging market economies, may create opportunities for
7 Herbertsson, Skuladottir and Zoega (1999) provide empirical support for this thesis by showing howdomestic supply shocks in Iceland – which take the form of changes in the fish catch – affect realwages, not only in the fisheries but in all other sectors as well.8 A dissenting view is expressed in Rodriguez and Rodrik (2000).9 In our sample of 85 countries, there is a significant negative correlation between the ratio of exportsto GDP, adjusted for country size based on population, and the share of natural capital in nationalwealth (not shown). There is also a significant positive correlation between the export ratio adjusted forcountry size and per capita growth adjusted for initial income (not shown).
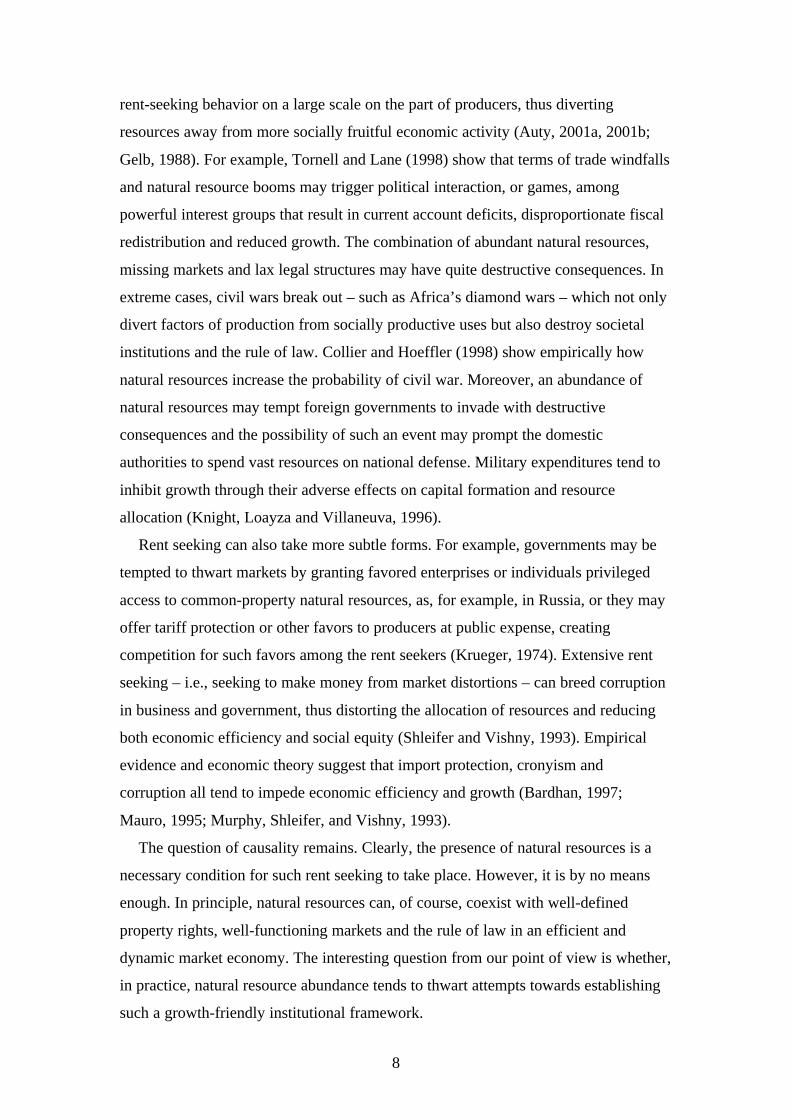
8
rent-seeking behavior on a large scale on the part of producers, thus diverting
resources away from more socially fruitful economic activity (Auty, 2001a, 2001b;
Gelb, 1988). For example, Tornell and Lane (1998) show that terms of trade windfalls
and natural resource booms may trigger political interaction, or games, among
powerful interest groups that result in current account deficits, disproportionate fiscal
redistribution and reduced growth. The combination of abundant natural resources,
missing markets and lax legal structures may have quite destructive consequences. In
extreme cases, civil wars break out – such as Africa’s diamond wars – which not only
divert factors of production from socially productive uses but also destroy societal
institutions and the rule of law. Collier and Hoeffler (1998) show empirically how
natural resources increase the probability of civil war. Moreover, an abundance of
natural resources may tempt foreign governments to invade with destructive
consequences and the possibility of such an event may prompt the domestic
authorities to spend vast resources on national defense. Military expenditures tend to
inhibit growth through their adverse effects on capital formation and resource
allocation (Knight, Loayza and Villaneuva, 1996).
Rent seeking can also take more subtle forms. For example, governments may be
tempted to thwart markets by granting favored enterprises or individuals privileged
access to common-property natural resources, as, for example, in Russia, or they may
offer tariff protection or other favors to producers at public expense, creating
competition for such favors among the rent seekers (Krueger, 1974). Extensive rent
seeking – i.e., seeking to make money from market distortions – can breed corruption
in business and government, thus distorting the allocation of resources and reducing
both economic efficiency and social equity (Shleifer and Vishny, 1993). Empirical
evidence and economic theory suggest that import protection, cronyism and
corruption all tend to impede economic efficiency and growth (Bardhan, 1997;
Mauro, 1995; Murphy, Shleifer, and Vishny, 1993).
The question of causality remains. Clearly, the presence of natural resources is a
necessary condition for such rent seeking to take place. However, it is by no means
enough. In principle, natural resources can, of course, coexist with well-defined
property rights, well-functioning markets and the rule of law in an efficient and
dynamic market economy. The interesting question from our point of view is whether,
in practice, natural resource abundance tends to thwart attempts towards establishing
such a growth-friendly institutional framework.
9
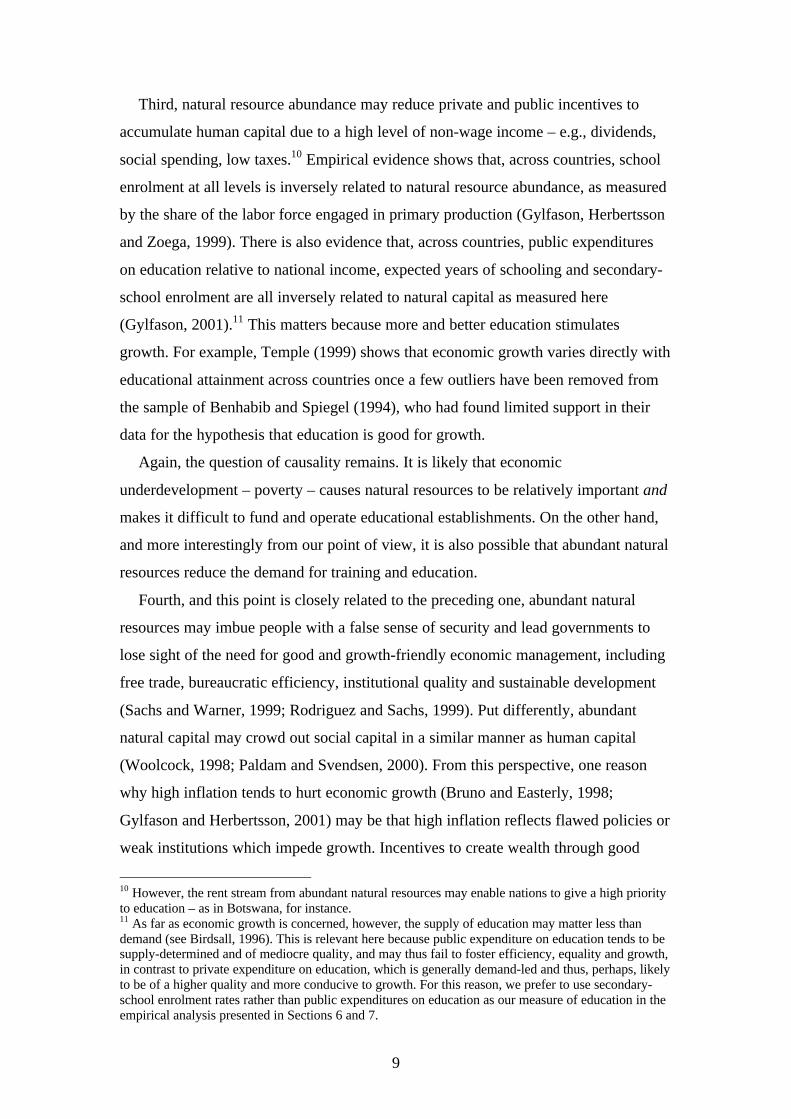
Third, natural resource abundance may reduce private and public incentives to
accumulate human capital due to a high level of non-wage income – e.g., dividends,
social spending, low taxes.10 Empirical evidence shows that, across countries, school
enrolment at all levels is inversely related to natural resource abundance, as measured
by the share of the labor force engaged in primary production (Gylfason, Herbertsson
and Zoega, 1999). There is also evidence that, across countries, public expenditures
on education relative to national income, expected years of schooling and secondary-
school enrolment are all inversely related to natural capital as measured here
(Gylfason, 2001).11 This matters because more and better education stimulates
growth. For example, Temple (1999) shows that economic growth varies directly with
educational attainment across countries once a few outliers have been removed from
the sample of Benhabib and Spiegel (1994), who had found limited support in their
data for the hypothesis that education is good for growth.
Again, the question of causality remains. It is likely that economic
underdevelopment – poverty – causes natural resources to be relatively important and
makes it difficult to fund and operate educational establishments. On the other hand,
and more interestingly from our point of view, it is also possible that abundant natural
resources reduce the demand for training and education.
Fourth, and this point is closely related to the preceding one, abundant natural
resources may imbue people with a false sense of security and lead governments to
lose sight of the need for good and growth-friendly economic management, including
free trade, bureaucratic efficiency, institutional quality and sustainable development
(Sachs and Warner, 1999; Rodriguez and Sachs, 1999). Put differently, abundant
natural capital may crowd out social capital in a similar manner as human capital
(Woolcock, 1998; Paldam and Svendsen, 2000). From this perspective, one reason
why high inflation tends to hurt economic growth (Bruno and Easterly, 1998;
Gylfason and Herbertsson, 2001) may be that high inflation reflects flawed policies or
weak institutions which impede growth. Incentives to create wealth through good
10 However, the rent stream from abundant natural resources may enable nations to give a high priorityto education – as in Botswana, for instance.11 As far as economic growth is concerned, however, the supply of education may matter less thandemand (see Birdsall, 1996). This is relevant here because public expenditure on education tends to besupply-determined and of mediocre quality, and may thus fail to foster efficiency, equality and growth,in contrast to private expenditure on education, which is generally demand-led and thus, perhaps, likelyto be of a higher quality and more conducive to growth. For this reason, we prefer to use secondary-school enrolment rates rather than public expenditures on education as our measure of education in theempirical analysis presented in Sections 6 and 7.

10
policies and institutions may wane because of the relatively effortless ability to extract
wealth from the soil or the sea. Manna from heaven can be a mixed blessing.
Unconditional foreign aid may be a case in point (see Burnside and Dollar, 2000).
4. Norway
It is by no means inevitable that existing natural resources prevent the emergence of a
dynamic economy or that the discovery of such resources acts to dampen an already
developed economy. Natural resources can be a blessing as well as a curse.
Norway is a case in point. The world’s second largest oil exporter (after Saudi-
Arabia), Norway shows as yet no clear symptoms of the Dutch disease – other,
perhaps, than a stagnant ratio of exports to GDP, albeit at a rather high level, or about
40 percent of GDP, since before the oil discoveries, indicating that Norway’s oil
exports have crowded out non-oil exports krone for krone relative to income;
moreover, Norway has attracted a relatively limited, yet gradually increasing inflow
of gross foreign direct investment, equivalent to 8 percent of GDP in 1998 (adjusted
for purchasing power parity; see World Bank, 2000), far below the figures for Sweden
and Finland next door (23 percent and 36 percent). Nor does Norway show any signs
yet of socially damaging rent-seeking behavior even if increasingly loud calls are
being voiced – and heard! – for using more of the oil revenue to address domestic
social needs rather than continue to build up the government-owned oil fund, which is
invested in foreign securities. There are as yet no clear signs either of a false sense of
security or of an inadequate commitment to education, on the contrary: for example,
college enrolment rose from 26 percent of each cohort to 62 percent between 1980
and 1997. Growth has thus far remained stubbornly high. Even so, some observers of
the Norwegian scene have recently expressed concerns that some deep-seated
structural problems in the country’s education and health care sectors (government
monopoly, insufficient competition, low efficiency, etc.) may be misdiagnosed as
financial problems because the money available from the oil fund may blunt the
willingness of politicians to undertake difficult structural reforms.
Most other oil-producing countries, including virtually the entire membership of
OPEC, carry these symptoms to varying degrees. From 1965 to 1998, GNP per capita
in the OPEC countries decreased on average by 1.3 percent per year. Negative
economic growth over this 33-year period was accompanied by an average ratio of

11
gross domestic fixed investment to GDP of 23 percent for the 11 OPEC countries on
average, a respectable ratio by world standards (compared with 27 percent in
Norway). Why did all this investment in the OPEC countries go hand in hand with
negative growth for so long? – a phenomenon familiar also from the former Soviet
block which, under socialism, saved and invested more of its national economic
output year after year than most OECD countries and yet failed to grow (Easterly and
Fischer, 1995). The answer must involve the efficiency of investment. For it is not
enough to invest; to sustain economic growth, the investments must be of high
quality. A false sense of security may lull countries with oil in abundance or other
natural resources into reducing, if not the quantity of investment, then its quality, or
both. The same argument applies to human capital and perhaps to social capital as
well.
One of the factors that separates the different experiences of Norway and the
OPEC countries, we suggest, is timing. Norway was already a developed country at
the time of the oil discoveries in the 1970s. Most importantly, Norway’s political and
social institutions were mature and the economic and financial system was relatively
developed, although by no means fully liberalized. All of this facilitated judicious and
far-sighted management of Norway’s oil wealth, at least compared with most other oil
producers (Hannesson, 2001). In contrast, full-fledged capitalist development did not
take place in most OPEC countries prior to the discovery of their oil resources, or
since for that matter (Karl, 1997). While Norway has built up substantial assets
abroad, Saudi-Arabia has accumulated debts.
It appears from our informal discussion that saving and the quantity and quality of
investment may be among the key factors that separate those resource-rich countries,
like Norway, that have grown rapidly from those that have had less success. We now
turn to the interplay between natural capital and the quantity and quality of investment
in a theoretical context.
5. Theory
Our aim in this section is to show how optimal saving, and hence also the rate of
growth of output and capital, depends on the abundance of natural resources and the
quality of the capital stock.
We take output to be produced by labor L, natural resources N and capital K and
the production function to be of the Cobb-Douglas variety:

12
(1) baba KNALY −−= 1
where A represents overall efficiency, including technology and quality (more on this
in Section 5.3). We can rewrite equation (1) in per capita terms: babkAny −−= 1 where
y = Y/L, n = N/L and k = K/L.
We distinguish between the structure of the economy and its abundance of natural
resources. By structure we mean the importance of natural resources to the national
economy while abundance refers to the supply (per capita) of the natural resources.
Within the Cobb-Douglas framework, the exponents in the aggregate production
function (1) denote factor shares – hence the structure of the economy – while the
factor inputs are absolute quantities. An increase in the parameter b thus means that
the economy now relies more heavily on natural resources in producing output –
independently of its supply – while an increase in N implies that the supply has
increased. The distinction between structure and abundance allows us to distinguish
between the effect of a change in the factor share b on growth, on one hand, and a
change in the abundance of the natural resource N, on the other. In Figure 2, we
describe changes in abundance by horizontal movements, holding the structure of the
economy unchanged, and structural changes by vertical movements, holding resource
abundance unchanged.
5.1 Optimal saving in the Solow model
To set the stage, we start with the Solow model and derive the optimal saving rate in
an economy with natural resources. Consumption per capita, c = C/Y, is proportional
to output:
(2) ( )ysc −= 1
where s = S/Y is the saving rate. In the transition towards a Solovian steady state the
capital/labor ratio evolves according to
(3) γδγδ
γ −−=−−
=−=k
ys
K
KsY
K
K
k
k &&
where γ is the growth of the labor force and δ is the depreciation rate. We abstract
from technological progress. In the steady state where 0/ =kk& , the capital-output
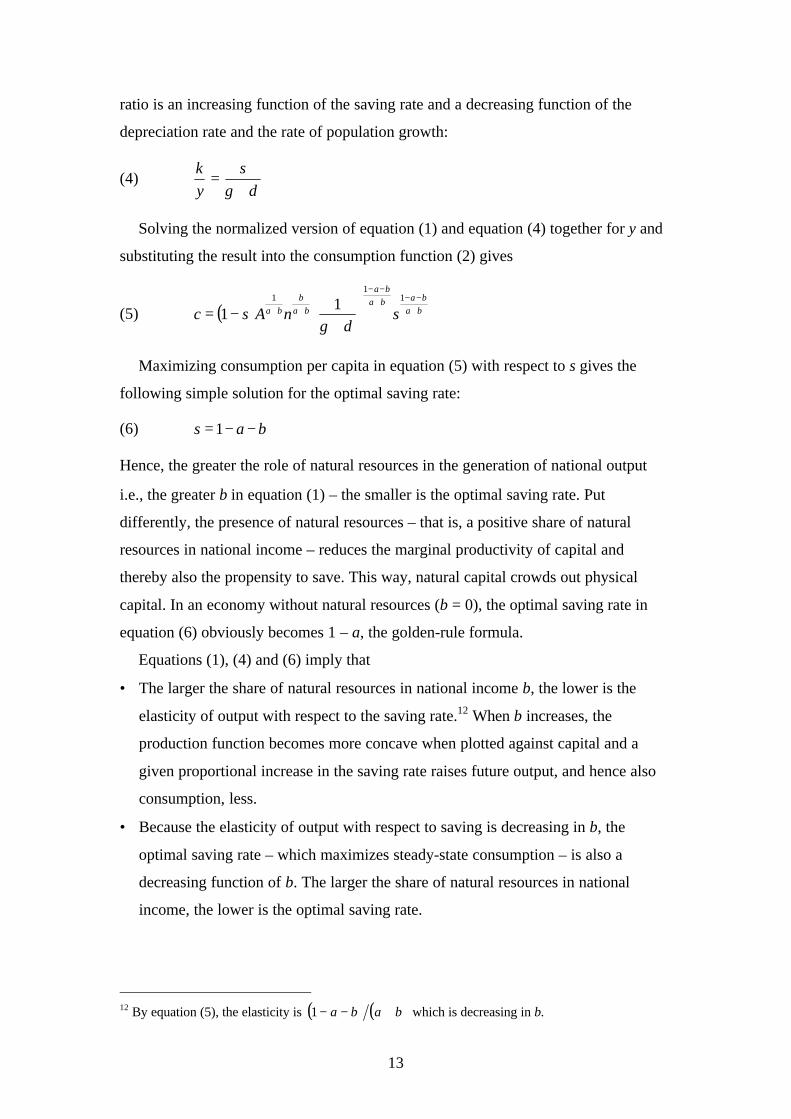
13
ratio is an increasing function of the saving rate and a decreasing function of the
depreciation rate and the rate of population growth:
(4)δγ +
=s
y
k
Solving the normalized version of equation (1) and equation (4) together for y and
substituting the result into the consumption function (2) gives
(5) ( ) ba
baba
ba
ba
b
ba snAsc +−−+
−−
++
+
−=1
11 1
1δγ
Maximizing consumption per capita in equation (5) with respect to s gives the
following simple solution for the optimal saving rate:
(6) bas −−= 1
Hence, the greater the role of natural resources in the generation of national output –
i.e., the greater b in equation (1) – the smaller is the optimal saving rate. Put
differently, the presence of natural resources – that is, a positive share of natural
resources in national income – reduces the marginal productivity of capital and
thereby also the propensity to save. This way, natural capital crowds out physical
capital. In an economy without natural resources (b = 0), the optimal saving rate in
equation (6) obviously becomes 1 – a, the golden-rule formula.
Equations (1), (4) and (6) imply that
• The larger the share of natural resources in national income b, the lower is the
elasticity of output with respect to the saving rate.12 When b increases, the
production function becomes more concave when plotted against capital and a
given proportional increase in the saving rate raises future output, and hence also
consumption, less.
• Because the elasticity of output with respect to saving is decreasing in b, the
optimal saving rate – which maximizes steady-state consumption – is also a
decreasing function of b. The larger the share of natural resources in national
income, the lower is the optimal saving rate.
12 By equation (5), the elasticity is ( ) ( )baba +−−1 which is decreasing in b.
14
• Heavy dependence on natural resources as measured by their share in national
income b causes the capital-output ratio to be lower due to a lower optimal saving
rate. In effect, natural capital crowds out physical capital to a degree.
• In the long run, the level of output per capita is inversely related to the share of
natural resources in national output, given the level of natural resources N, due to
less saving. However, notice that an increase in their level – holding their share of
national income constant – makes output as well as the stock of capital rise.
• In contrast, the speed of adjustment towards steady state is an increasing function
of the share of natural capital in national income b. The larger the natural capital
share, the smaller is the share of physical capital in national income and hence the
more rapid is the adjustment to steady state.13
In sum, an economy where the owners of natural resources receive a high fraction of
national income converges quickly to a steady state with a low saving rate and a
correspondingly low capital-output ratio and where, most importantly, output per
capita is also low.
5.2 Optimal saving in the Ramsey model
Because our derivation of the optimal saving rate in the Solow model does not
constitute microeconomic optimization from first principles, we now proceed to
derive the optimal saving rate in the Ramsey model which is more firmly grounded in
the optimization behavior of firms and consumers.
Assume the same production function as in the Solow model above. As before,
output can be either saved – that is, added to the capital stock – or consumed. Now
enters the central planner who maximizes the welfare of the representative consumer
by solving the following optimization problem:
(7) dtecu tt
c
ρ−∞
∫ )(max0
where c is consumption per capita as before and ρ is the pure rate of time preference,
subject to the constraints
13 The speed of adjustment is given by ( )( )δγ +−−− )1(1 ba which is increasing in b. This is the rateof decrease of the difference between the current and the steady-state level of capital and isindependent of the saving rate. See Romer (1996), page 22.

15
(8) 0 0k k=
(9) ( )1b a bk An k c kδ γ− −= − − +&
where 0k is a constant. The necessary conditions that have to be satisfied along an
optimal path are
(10) ( )c
cbab
u
ukAnba
&−=−−− −− ρδ1
(11) ( )1b a bk An k c kδ γ− −= − − +&
Equation (10) is the well-known Keynes-Ramsey rule. The left-hand side shows the
marginal benefit of saving – that is, postponing consumption – which is the net
marginal product of capital and the right-hand side shows the marginal cost which is
the sum of the pure rate of time preference and the (absolute) rate of growth of
marginal utility. The higher the net marginal product of capital, the greater is the
benefit from saving more and the more impatient the representative consumer, the
greater is the cost. Finally, if consumption is expected to grow in the future ( cu& < 0),
this constitutes an extra cost of increasing saving: it is costly to postpone consumption
to a later time when it will be valued less.
The Keynes-Ramsey rule tells us that changes in factor intensity that increase the
share of national income going to the owners of natural resources reduce the marginal
benefit of saving and hence also capital accumulation for all plausible parameter
values.14 It follows that an economy whose industries rely heavily on the use of
natural resources tends to have a relatively low steady-state stock of capital, other
things being equal. A structural change that makes oil more important relative to
capital will reduce the optimal saving rate. In contrast, an increase in the natural
resource base (an oil discovery, for instance) – holding the share of the resource in
national income constant – causes the marginal benefit of saving to go up and hence
also its optimal level.
14 An increase in b reduces the marginal product of capital as long as ( ) ( )log / 1 1n k a b< − − .
Assuming that a + b = 0.5 as a minimum makes the critical value of the natural capital/physical capital
ratio equal to 39.72 ≈e which ensures that the above inequality is satisfied for all countries in our dataset where Niger has the highest value of n/k, 5.66.
16
In steady state we have 0c cu u k= =&& which implies, after some manipulation of
equations (10) and (11), that
(12) ( )
++
−−=−
=ρδγδ
bay
cys 1
This result simplifies to bas −−= 1 as in equation (6) in the Solow model if γ = ρ .
In any case, the optimal rate of saving varies inversely with the share of natural
resources in national income, b.
We also find that the speed at which the economy travels along a saddle path
towards steady state is increasing in the share of the natural resource in national
income. An increase in the parameter b makes the production function be more
concave in capital. As a result, a fall in the stock of capital below its steady-state
value has a greater effect on its marginal product and hence also on the incentive to
save and invest. Therefore, saving will increase more and we will move faster back to
steady state.
To see how expectations about how permanent a natural resource boom is enter the
calculations we need to solve the model with the use of a phase diagram (not shown)
and pay close attention to whether it is the structure of the economy – represented by
the parameter b in the production function – that is changing or the supply of the
resource N, holding the factor share constant. To make a long story short, the Keynes-
Ramsey rule (10) can be rewritten as the following Euler equation:
(13) ( ) ( ) ( )[ ]γδθ
+−−−= +− babknbac
c1
1&
where θ is the coefficient of relative risk aversion – assuming that the utility function
in equation (7) is of the CRRA form, θ
θ−
−= 1
1
1)( ccu t . Equations (11) and (13) can
now be used to solve the model and derive the following results:
• A permanent increase in b – the share of natural capital in national income – makes
consumption jump immediately and then gradually decline to a lower level than
before as the capital stock is gradually depleted. While both investment and output
are lower in the new steady state, the saving rate – which is the ratio of the two – is
lower because of the diminishing marginal product of capital.

17
• A transitory increase in b makes consumption jump initially – albeit not by as
much as in the case of a permanent change – and subsequently both consumption
and capital decline until b comes down again. At exactly that moment we hit the
old saddle path. Thereafter, consumption and capital gradually increase along the
old saddle path until we hit the original steady state.
• A permanent increase in N (holding b constant) – i.e., holding technology constant
– makes consumption jump immediately so that we hit the new saddle path after
which we move upwards along the new saddle path towards a new steady state
where both the level of consumption and the stock of capital are higher than
before. Note the interesting twist to this saga: A permanent resource boom –
holding the share of natural resources in national income constant – raises
consumption by more than the increased supply of the natural resource would
imply. There is a secondary effect through capital accumulation. When N goes up,
output increases and so do permanent income and consumption, but because the
marginal product of capital goes up, the incentive to save is enhanced and the
capital stock is gradually increased. As a result, steady-state consumption rises by
more than the rise in income caused by more abundant natural resources.
• A temporary increase in N also causes consumption to jump and then to grow
gradually alongside the capital stock. However, when the natural resource boom
comes to an end we hit the old saddle path and both consumption and capital fall as
we move down the old saddle path (as in Rodriguez and Sachs, 1999). There
occurs a transitory consumption boom. Importantly, consumption is maintained at
a higher level than its original steady state for a period which is longer than the
duration of the natural resource boom.
5.3 Endogenous growth
Rather than focus on medium-term growth, we would now like to write down a model
that shows how economic growth depends on the abundance of natural resources and
the quality of the capital stock, even in the long run. In particular, we will show how
natural resources can affect the rate of growth of output and capital both directly
through the quantity of investment as well as indirectly through the quality of
investment. Our model of choice is only one of several possible ones; accordingly, its
implications need scrutiny and testing.
18
We adopt the pioneer endogenous growth model of Romer (1986) where
sustainable growth arises from constant returns to capital at the social level. At the
firm level, however, we have constant returns to all factors of production and
diminishing returns to capital. The root of constant social returns to capital lies in
learning-by-investing and instantaneous knowledge spillovers across firms.
We expand the model to include natural resources. We assume that both the
productivity of labor as well as that of the natural resource is augmented through
learning and that the level of labor- and natural-resources-augmenting technology can
be proxied by the aggregate stock of capital, which is a function of past investment;
hence the generation of knowledge. We assume that the number of workers is fixed.
This gives us the following production function for the representative firm:
(14) ( ) ( ) ( )ai
bi
baii KLKNqKY −−= 1
where Yi denotes the output of the representative firm i and q is the exogenous
productivity of capital, and takes a value between zero and one. Equation (14) gives
equation (1) when baba KqA +−−= 1 , ∑=i
iKK , ∑=i
iLL , ∑=i
iNN and all firms
are of equal size.
Like Scott (1989), we distinguish between quantity and quality (see also Lal and
Myint, 1996, Ch. 2). If some investment projects miss the mark and fail to add
commensurately to the capital stock, we have q < 1. One way to interpret q is to view
it as an indicator of distortions in the allocation of installed capital due, perhaps, to a
poorly developed financial system, but perhaps also due to trade restrictions or
government subsidies that attract capital to unproductive uses in protected industries
or in state-owned enterprises where capital may be less productive than in the private
sector (Gylfason, Herbertsson and Zoega, 2001). Another way is to view the quality
index q as the ratio of the economic cost (i.e., minimum achievable cost) of creating
new capital to the actual cost of investment (Pritchett, 2000) – that is, K is then
measured on the basis of actual costs which may overstate its productivity. Yet
another way is to view q below 1 as a consequence of aging: the larger the share of
old capital in the capital stock currently in operation, that is, the higher the average
age of capital in use, the lower is its overall quality (Gylfason and Zoega, 2001). For
our purposes, the three interpretations are analytically equivalent. However, we
assume that the quality of capital has remained constant in the past which means that

19
all units of capital are of the same quality. In other words, we are not interested here
in the implications of having different vintages of capital.
The other important new element here is the presence of natural resources.
Whereas capital is owned by a class of capitalists, the natural resources are owned by
individuals – the naturalists. The total stock of natural resources is given and hence
also the supply of their services. We take these services to be fixed and exogenous so
that no opportunities for intertemporal allocation of these resources arise.
We assume a perfectly competitive market for the services of natural resources. In
equilibrium, supply of and demand for natural resources are equalized and the
marginal product is equal to their real price. Similarly, there is perfect competition in
the market for labor and the marginal product of labor is equal to the real wage.
Finally, we have a market for capital where the owners of the capital sell their
services to firms. As in the other two factor markets, we have an equilibrium under
perfect competition where marginal product equals the sum of the real interest rate r
and the rate of depreciation δ:
(15) ( ) ( ) ( ) δ+=−−= −−−− rKLKNKqbadK
dY ai
bi
bai
ba
i
i 11
The depreciation rate δ is the rate at which installed capital loses its usefulness
over time, as a result of economic obsolescence as well as physical wear and tear
(Scott, 1989). The parameters q and δ could both be modeled as endogenous choice
parameters (as in Gylfason and Zoega, 2001), but here we treat them as exogenous
magnitudes for simplicity, even if we acknowledge that depreciation may depend on
quality, through obsolescence.
We thus view quality and durability as two different things. The pyramids of Egypt
were high-quality investments in their day – good at preserving mummies! – and they
have lasted a long time (high q, low δ); they remain among Egypt’s major sources of
foreign exchange. High-quality computers, by contrast, do not last long because they
are quickly rendered obsolete by better machines (high q, high δ). Soviet housing,
which sometimes began to crumble even before construction was completed, is an
example of low-quality, low-durability investment (low q, high δ). But some low-
quality investments last a long time, like Mr. Hoxha’s concrete bunkers, hundreds of
thousands of them, scattered all across Albania: they were built to last as long as the
pyramids, but they remain utterly useless, or worse because it would be so costly to

20
demolish them (low q, low δ).
Households with an infinite planning horizon maximize discounted future utility
with respect to consumption per capita and subject to an asset-accumulation
constraint. This gives the standard Euler equation for the growth of consumption per
worker:
(16) ( )ρσ −= rg
where σ is the elasticity of intertemporal substitution (assuming constant relative risk
aversion) and ρ is the rate of time preference. Using equation (16) and assuming
symmetric equilibrium, we get the following expression for the optimal rate of growth
of consumption and output:
(17) ( )( )ρδσ −−−−= −− abba LNqbag 11
Thus, economic growth depends on several factors:
• The rate of growth varies directly with the quality of the capital stock q. The higher
quality, the higher is the price of capital – for a given level of capital – and hence
the real rate of interest. A higher interest rate induces consumers to postpone
consumption – i.e., to save and accumulate capital.
• The rate of growth depends on the size of the labor force L. This is the scale effect
that is familiar in the growth literature. A larger aggregate labor force raises the
private marginal product of capital and hence also the price of capital – the real
rate of interest. This leads to increased saving and a more rapid rise of
consumption.
• The rate of growth is inversely related to the pure rate of time preference ρ. The
higher the rate of time preference – i.e., the more impatient are workers – the
greater is current consumption and the slower is the growth of consumption in the
future due to less saving.
• The rate of growth is inversely related to the rate of depreciation δ. A “good”
investment combines high quality and low depreciation. Equation (17) shows that
“bad” investments retard the build-up of useful capital over time in two ways: (a)
by adding capital of low quality, with q below 1, hence lowering the price of
capital and blunting the incentive to save and invest, and (b) by increasing the
depreciation rate δ, thus decelerating output from the supply side.

21
Most importantly from our perspective, the abundance of natural resources affects the
rate of growth. Given our assumptions of constant returns to scale and competitive
markets, the exponents a and b in the production function show the share of output
going to labor and the naturalists, respectively, so the remainder goes to the
capitalists. Equation (17) shows that both the share of the naturalists in output b as
well as the term Nb in the production function affect the growth rate.
A rise in the supply of natural resources N causes their price to fall while keeping
the factor share constant at b. However, an increase in the share of output going to the
owners of the natural resource, b, causes the price to rise while leaving N unchanged
due to its fixed supply. These changes affect the rate of growth of consumption and
output:
• A rise in the supply of the natural resource N – with an unchanged state of
technology and hence unchanged factor shares – leads to a fall in its price and an
increase in the quantity used in production. The increased use of the natural
resources raises the marginal product of capital, hence also the demand for capital
and its price – the real rate of interest. A higher real interest rate lowers the price of
future consumption and makes workers substitute future for current consumption.
Saving and investment increase and hence also the pace of learning and knowledge
spillovers. The rate of economic growth has increased. But notice that this is a
scale effect similar to the one involving the size of the labor force.
• A rise in the share of output going to the owners of the natural resource, b, reduces
the marginal productivity of capital. This lowers the real rate of interest and raises
the price of future consumption. Facing a higher price of future consumption,
workers increase current consumption at the expense of future consumption.
Saving is reduced and so are investment, learning and growth in this closed
economy. Given competitive markets, the share going to the naturalists can only
increase due to changes in the production function.15
The socially optimal rate of growth of consumption – which comes from the
solution to the central planner’s problem – depends on the social marginal product of
capital, not the private marginal product. The rate of growth of consumption and
output is now given by
15 Alternatively, we could have derived the same result assuming imperfect competition and monopolyrents in the market for the services of natural resources. Changes in these rents would then affectgrowth.
22
(18) ( )ρδσ −−= −− abba LNqg 1
The difference between equations (17) and (18) lies in the term 1 - a - b in the
marginal product expression in the former equation. As a result, the discrepancy
between the actual and the optimal rate of growth is increasing in the share of output
going to the naturalists b. In other words, the extent of the market failure inherent in
the Romer model varies directly with the share of output going to the owners of the
natural resources.
5.4 Natural capital, financial intermediation and growth
We have identified a direct link between natural resources and economic growth,
through saving and investment. There may also be an indirect effect through the
productivity of capital q. An abundance of natural resources may hamper the
emergence of a well-developed financial system. If so, this outcome is likely to result
in an inefficient allocation of savings across sectors and firms – that is, reduce the
value of q in the equations above – and to reduce the average productivity of capital
and so to further blunt incentives to save and invest by reducing the marginal
productivity of capital at a given level of the capital stock.
When a large part of national wealth is stored in a natural resource, renewable or
not, there is less need for financial intermediation to conduct day-to-day transactions.
Dissaving can take the form of more rapid depletion of the resource and saving can
take the form of less rapid depletion or of more rapid renewal in the case of renewable
natural resources. In some countries, such as the oil-rich OPEC states, saving also
takes the form of deposits in foreign banks. In this case, domestic financial
intermediation becomes even less important. In contrast, when saving is piled up at
home in the form of physical capital, domestic banks and stock markets assume
paramount importance. By linking up domestic savers and investors, the domestic
financial system contributes to a more efficient allocation of capital across sectors and
firms.
Further, a well-developed financial system helps drive a wedge between the effect
of foreign and domestic saving on economic growth. In other words, as the financial
system matures and becomes more efficient at allocating capital at home, foreign
savings – i.e., deficits on the current account of the balance of payments – become
relatively less useful when not channeled through the domestic banking system. In a
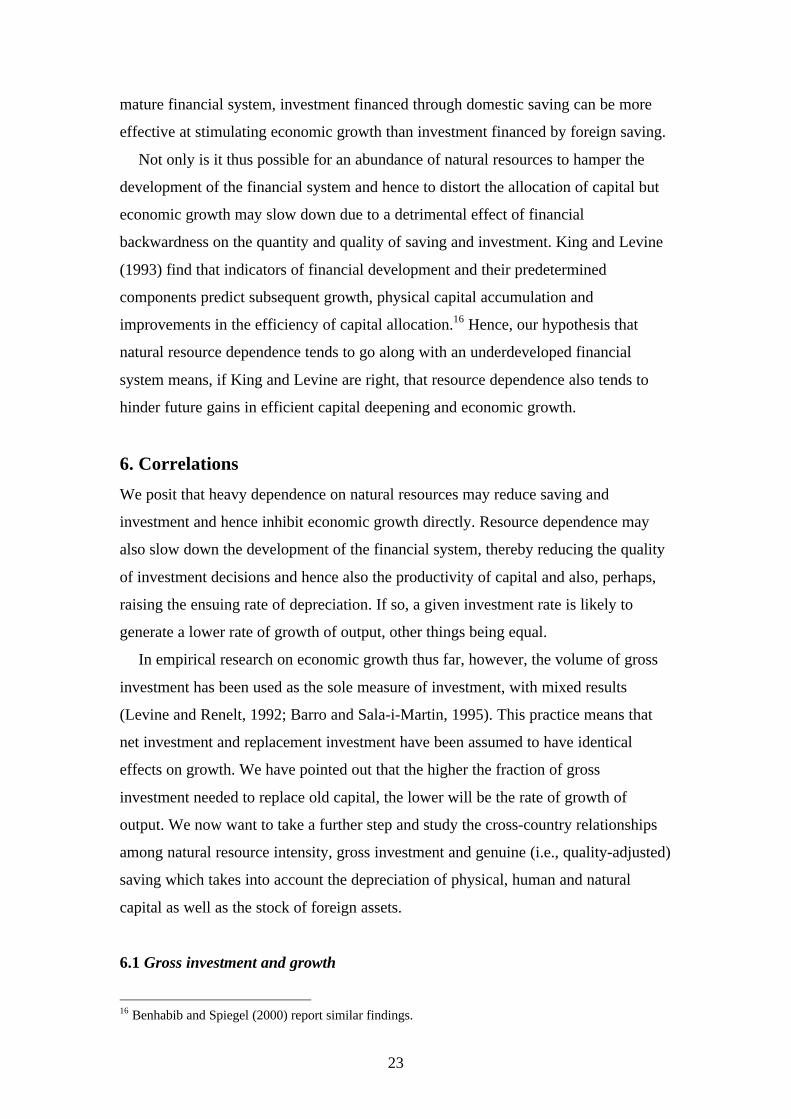
23
mature financial system, investment financed through domestic saving can be more
effective at stimulating economic growth than investment financed by foreign saving.
Not only is it thus possible for an abundance of natural resources to hamper the
development of the financial system and hence to distort the allocation of capital but
economic growth may slow down due to a detrimental effect of financial
backwardness on the quantity and quality of saving and investment. King and Levine
(1993) find that indicators of financial development and their predetermined
components predict subsequent growth, physical capital accumulation and
improvements in the efficiency of capital allocation.16 Hence, our hypothesis that
natural resource dependence tends to go along with an underdeveloped financial
system means, if King and Levine are right, that resource dependence also tends to
hinder future gains in efficient capital deepening and economic growth.
6. Correlations
We posit that heavy dependence on natural resources may reduce saving and
investment and hence inhibit economic growth directly. Resource dependence may
also slow down the development of the financial system, thereby reducing the quality
of investment decisions and hence also the productivity of capital and also, perhaps,
raising the ensuing rate of depreciation. If so, a given investment rate is likely to
generate a lower rate of growth of output, other things being equal.
In empirical research on economic growth thus far, however, the volume of gross
investment has been used as the sole measure of investment, with mixed results
(Levine and Renelt, 1992; Barro and Sala-i-Martin, 1995). This practice means that
net investment and replacement investment have been assumed to have identical
effects on growth. We have pointed out that the higher the fraction of gross
investment needed to replace old capital, the lower will be the rate of growth of
output. We now want to take a further step and study the cross-country relationships
among natural resource intensity, gross investment and genuine (i.e., quality-adjusted)
saving which takes into account the depreciation of physical, human and natural
capital as well as the stock of foreign assets.
6.1 Gross investment and growth
16 Benhabib and Spiegel (2000) report similar findings.
24
Before embarking on the regression analysis in Section 7, let us inspect the data. The
upper panel of Figure 3 shows a scatterplot of the average ratio of gross domestic
investment to GDP in 1965-1998 and natural resource intensity measured as before.
When we purge the natural capital share of that part which is explained by the
country’s initial income per head, we get very similar results as in Figure 3a.17 The
group of eight low-growth, natural-resource-rich African countries identified in
Figure 1 is visible in the lower right-hand corner of Figure 3a. The high-growth,
natural-resource-poor countries are also easy to spot in the upper left-hand corner of
the figure. Apart from these two groups, the relationship between the two variables is
not very clear, even if it remains statistically significant. A clearer relationship
emerges when we plot economic growth against the investment ratio over the same
period, 1965-1998. The figure in the lower panel of Figure 3 shows the cross-country
relationship between the rate of growth, on the one hand, and the sum of domestic and
foreign saving (the latter measured by the current account deficit) without any attempt
to adjust investment for quality, q. The regression line through the 85 observations
suggests that an increase in the investment ratio by about four percentage points is
associated with an increase in annual economic growth by 1 percentage point. The
relationship is significant (Spearman’s r = 0.65).18
6.2 Genuine saving and growth
As we saw in Section 5, however, high saving and investment rates do not necessarily
stimulate growth if they are accompanied by rapid depreciation of physical capital.19
Depreciation calls for investment to replace the depleted capital, thus rendering a
smaller share of domestic (and foreign) saving available for fresh capital formation. A
similar argument applies to natural capital. This is where the World Bank’s new
estimates of genuine saving rates enter the picture (see Appendix for a description of
the data). Countries that run down their stocks of physical and natural capital will
17 The same applies to Figures 4a, 5a and 6a.18 The slope of the regression line through the scatterplot is consistent with the coefficients oninvestment in cross-country growth regressions reported in recent literature (Levine and Renelt, 1992;Doppelhofer, Miller and Sala-i-Martin, 2000).19 Scott (1989) is of a different opinion. He claims that depreciation reflects mainly the economicobsolescence of capital, and does not necessarily reduce its usefulness. To him, therefore, grossinvestment is the correct measure of capital accumulation in growth research. In his own words,“workers … benefit from rising wages which result in appreciation which is omitted from theconventional accounts. Were it included, it would offset depreciation on capital assets. It would then beclear that net investment for society as a whole is (approximately) equal to gross investment as

25
have low, perhaps even negative, genuine saving rates which, therefore, may be taken
as a rough indication of the physical and economic durability of their capital and the
sustainability of their natural resource management, at least in a physical sense. For
example, the average genuine domestic saving rate of the 11 OPEC countries in 1970-
1998 was -7 percent, ranging from -25 percent in Kuwait to 10 percent in Indonesia,
compared with 17 percent for Norway.
Genuine domestic saving differs from net domestic saving (i.e., gross domestic
saving minus depreciation) by the rundown and depreciation of natural capital,
adjusted by current expenditure on education, which increases or improves human
capital20 even if it is classified as current expenditure in national income accounts.
Genuine saving is intended to indicate the difference between sustainable net national
product and consumption, where sustainable net national product means the
maximum amount that could be consumed without reducing the present value of
national welfare along the optimum path (Hamilton, 2001).21 Genuine saving rates are
higher than net saving rates in those countries where improvements in human capital
outweigh the deterioration of natural capital, and conversely. In view of these
adjustments, one might expect genuine saving rates to be more closely correlated with
natural capital and economic growth than gross investment rates.
The data seem to confirm this conjecture. The upper panel of Figure 4 shows a
scatterplot of genuine domestic saving in 1970-1998 (the World Bank figures do not
reach further back) and natural capital as measured before. The regression line
through the 85 observations suggests that an increase of about two and a half
percentage points in the natural capital share from one country to the next is
associated with a decrease in genuine saving by one percent of GDP. The relationship
is statistically significant (Spearman’s r = -0.53).22 The correlation between genuine
conventionally measured, and not to gross investment minus depreciation.” (p. 92).20 But recall the reservations expressed in footnote 11.21 More specifically, genuine domestic saving is defined as net domestic saving plus educationexpenditure minus energy depletion, mineral depletion, net forest depletion and carbon dioxide damage(World Bank, 2000, p. 171). Estimates that are missing include the depletion and degradation of soilsand net depletion of fish stocks. The most important pollutants affecting human health and economicassets are also excluded (particulate emissions, ground-level ozone, acid rain). In some cases, theresource depletion estimates of the World Bank are quite high because the entire mineral-resource rentis counted as depletion whereas the alternative user cost approach allocates only a fraction of the rent todepletion. The median genuine saving rate in our sample is 9 percent, and ranges from -21 percent to23 percent. The corresponding figures for the gross investment rate are 20 percent, 7 percent and 32percent.22 The correlation weakens a bit if we limit the regression to the 77 countries where the natural capitalshare is below 0.25, but it remains statistically significant (Spearman’s r = -0.43).
26
saving and natural capital in Figure 4a is closer than that between gross investment
and natural capital in Figure 3a. On the other hand, the inverse relationship between
net investment and natural capital (not shown) is weaker than the ones shown in
Figures 3a and 4a, but still significant. This seems to suggest that it is not enough to
adjust gross investment for depreciation of physical capital; we need to adjust it for
depreciation of other types of capital as well.
The lower panel of Figure 4 shows a scatterplot of economic growth and genuine
domestic saving in 1970-1998 in the same 85 countries. The regression line suggests
that an increase in the genuine saving rate by about seven percentage points is
associated with an increase in annual economic growth by 1 percentage point. The
relationship is highly significant (Spearman’s r = 0.72). Again, the correlation
between genuine saving and growth in Figure 4b is closer than that between gross
investment and growth in Figure 3b. Further, the direct relationship between
economic growth and net investment (not shown) is weaker than the ones shown in
Figures 3b and 4b, but still highly significant. This suggests once more that it is not
enough to adjust gross investment for physical depreciation. It seems that, in a broad
sense, quality counts.
6.3 Gross saving and growth
The difference between gross investment and genuine saving comprises four terms:
(a) depreciation of physical capital, (b) depreciation of natural capital, (c) depreciation
of human capital and (d) rundown of foreign capital – the current account deficit.
How much of the difference between the results reported in Figures 3 and 4 can be
traced to the current account? To find out, we subtract the current account
deficit/GDP ratio from the gross investment rate in order to obtain the gross domestic
saving rate and then redraw the scatterplots.
The upper panel of Figure 5 shows the scatterplot of gross domestic saving in
1970-1998 and natural capital. The results are essentially the same as in Figure 4a,
even if the correlation now is a bit weaker (Spearman’s r = -0.40). The lower panel of
Figure 5 shows the scatterplot of economic growth and gross domestic saving in the
same 85 countries. Again, the results are essentially the same as in Figure 4b
(Spearman’s r = 0.73). The correlations between natural capital, gross saving and
growth in Figure 5 are a bit stronger than the ones between natural capital, gross
investment and growth in Figure 3, but the differences are small.
27
To summarize, the data show that, across countries,
(a) economic growth varies directly with gross investment, genuine saving and
gross saving (Figures 3b, 4b, and 5b),
(b) gross investment, genuine saving and gross saving are all inversely related to
resource dependence (Figures 3a, 4a, and 5a), and
(c) growth varies inversely with natural resource dependence (Figure 1).
Through any one of the three possible channels under review here (gross investment,
genuine saving or gross saving), an increase in the share of natural capital in national
wealth by 10 percentage points from one country to another is associated with a
decrease in per capita economic growth by 0.5-0.6 percentage points. Natural resource
dependence thus appears to inhibit economic growth significantly by weakening
public and private incentives to save and invest as well as to build up human capital
(Barro, 1997; Temple, 1999; Gylfason, 2001), in addition to the linkages through the
Dutch disease, rent seeking, policy failures and institutional weaknesses stemming
from a false sense of security, reviewed in Section 3. If so, the adverse effects of
natural resource dependence on economic growth since the 1960s that have been
reported in the literature may, in part, reflect the effect of investment and genuine
saving on growth.
At last, we look at the data on financial development. The upper panel of Figure 6
below shows a cross-sectional scatterplot of financial development, for which we use
the average ratio of M2 and GDP in 1965-1998 as a proxy, like King and Levine
(1993), and natural resource dependence as measured before. The figure covers the
same 85 countries as before. The lower panel of the figure relates our measure of
financial development to average economic growth per capita over the same period.
Figure 6a shows a clear negative correlation between natural resource dependence and
financial depth (Spearman’s r = -0.68).23 Similarly, Figure 6b shows a positive
relationship between our measure of financial depth and average economic growth
(Spearman’s r = 0.66). However, the question of causality remains. It is possible that
heavy dependence on natural resources actually hinders the development of the
financial sector and hence also growth, as we are inclined to think, but other
possibilities also exist; in particular, some unspecified third factor may inhibit both
23 The exponential regression curve becomes steeper if we limit the regression to the 77 countrieswhere the natural capital share is below 0.25, but even so the correlation remains highly significant(Spearman’s r = -0.61).
28
financial development and economic growth.
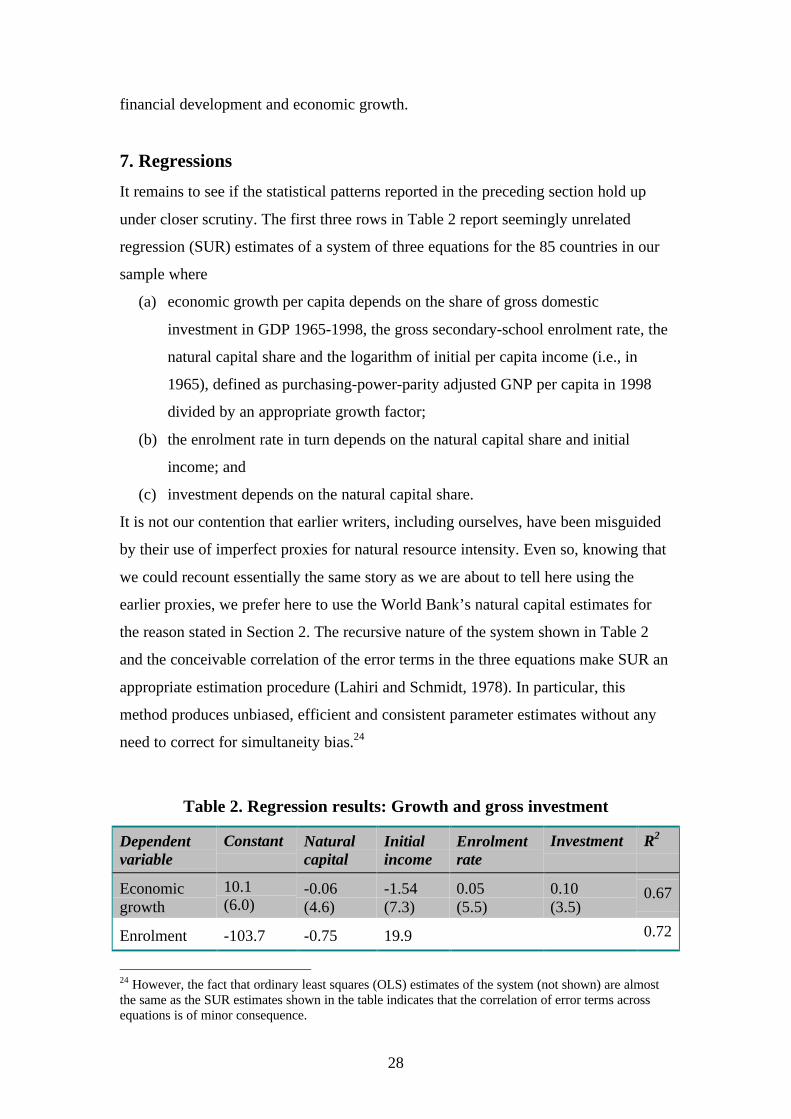
7. Regressions
It remains to see if the statistical patterns reported in the preceding section hold up
under closer scrutiny. The first three rows in Table 2 report seemingly unrelated
regression (SUR) estimates of a system of three equations for the 85 countries in our
sample where
(a) economic growth per capita depends on the share of gross domestic
investment in GDP 1965-1998, the gross secondary-school enrolment rate, the
natural capital share and the logarithm of initial per capita income (i.e., in
1965), defined as purchasing-power-parity adjusted GNP per capita in 1998
divided by an appropriate growth factor;
(b) the enrolment rate in turn depends on the natural capital share and initial
income; and
(c) investment depends on the natural capital share.
It is not our contention that earlier writers, including ourselves, have been misguided
by their use of imperfect proxies for natural resource intensity. Even so, knowing that
we could recount essentially the same story as we are about to tell here using the
earlier proxies, we prefer here to use the World Bank’s natural capital estimates for
the reason stated in Section 2. The recursive nature of the system shown in Table 2
and the conceivable correlation of the error terms in the three equations make SUR an
appropriate estimation procedure (Lahiri and Schmidt, 1978). In particular, this
method produces unbiased, efficient and consistent parameter estimates without any
need to correct for simultaneity bias.24
Table 2. Regression results: Growth and gross investment
Dependentvariable
Constant Naturalcapital
Initialincome
Enrolmentrate
Investment R2
Economicgrowth
10.1(6.0)
-0.06(4.6)
-1.54(7.3)
0.05(5.5)
0.10(3.5)
0.67
Enrolment -103.7 -0.75 19.9 0.72
24 However, the fact that ordinary least squares (OLS) estimates of the system (not shown) are almostthe same as the SUR estimates shown in the table indicates that the correlation of error terms acrossequations is of minor consequence.

29
rate (7.5) (4.2) (12.4)
Investment22.5(29.3)
-0.20(4.1)
0.16
Economicgrowth
7.29(4.8)
-0.12(6.7)
-0.58(3.2)
0.35
Note: 85 observations. t-statistics are shown within parentheses.
All the parameter estimates in Table 2 are economically and statistically significant.
The coefficient on initial income in the growth equation indicates a convergence
speed of 1.5 percent per year, which is not far below the 2-3 percent range typically
reported in statistical growth research. The direct effect of natural capital on growth is
-0.06. The indirect effect of natural capital on growth through education is -0.75× 0.05
≈ -0.04 and the additional indirect effect through investment is -0.20× 0.10 = -0.02.
The novelty here is the part of the story involving investment; as far as we know, this
linkage – from heavy dependence on natural resources to slow growth via investment
– has not been documented in econometric work before. Sachs and Warner (1997,
2001) report that they have found little evidence of a link between natural resource
abundance and investment. The total effect of natural capital on growth is thus about -
0.12 (for given initial income), which is very close to the value of the slope of the
regression line in Figure 1. This means that the implicit constraint on the coefficient
of initial income as well as the omission of education and investment in Figure 1 do
not bias the quasi-reduced-form estimate of the slope of the regression line in the
figure. The bottom row in Table 2 shows the OLS estimate of the reduced-from
equation for growth implied by the equation system above. Like Figure 1, Table 2
indicates that an increase in the natural capital share by eight or nine percentage
points is associated with a decrease in growth by about one percentage point. Of the
total effect of natural capital on growth, about a third can thus be attributed to
education according to this interpretation, and about one-sixth to investment. This still
leaves about a half of the total effect to be explained by other factors, perhaps the
Dutch disease, rent seeking and policy failures.
Notice that the positive coefficient of initial income in the enrolment equation
shows that the significance of the enrolment variable in the growth equation is not just
an indirect effect of low initial income. Higher income raises the enrolment rate which
then raises the rate of growth, contrary to the convergence hypothesis. It thus appears

30
that there is a relationship between growth and enrolment that is independent of the
effect of initial income on enrolment. The results shown in Table 2 imply absolute as
well as conditional convergence because the total effect of an increase in initial
income on growth is -1.54 + 19.9× 0.05 ≈ -0.54 which is significantly negative in a
Wald test (p = 0.00). Further, to be on guard against the possibility that the natural
capital share may in fact be a proxy for the level of development, we added to our
system an auxiliary regression of the natural capital share against a constant as well as
the logarithm of initial income. The effect of initial income on the natural capital
share is significantly negative, with a coefficient of -4.56 (with t = 4.6), but in other
respects the estimation results are virtually identical to the ones shown in Table 2. In
this case, the total effect of an increase in initial income on growth is -1.54 +
20.0× 0.05 + 0.06× 4.56 ≈ -0.27 which is barely significantly negative in a Wald test
(p = 0.045). Hence, when we take the statistical relationship between natural capital
and initial income into account, the evidence for absolute convergence weakens
considerably. When, on the other hand, we added initial income as a potential
determinant of investment, in order to allow for the possibility that investment is
lower at low levels of income than at higher levels (Chenery and Syrquin, 1975), the
effect of initial income on investment turned out to be economically and statistically
insignificant.
The use of net investment instead of gross investment yields similar results that are
significant throughout, but slightly less so than the ones shown in Table 2, especially
the investment equation. When net investment and depreciation enter separately into
the equation system, the coefficient on depreciation (0.24, with t = 3.9) in the growth
equation is significantly larger than the coefficient on net investment (0.08, with t =
2.9). Other parameter estimates remain virtually unchanged. Natural capital has a
similar effect on depreciation as on net investment.25 The depreciation of natural
resources (energy, minerals, forest, carbon dioxide damage) is not significantly
related to growth nor is the dependence on natural resources more likely to cause such
depreciation.
7.1 From gross investment to genuine saving
Table 3 shows the results we get when we replace gross investment by genuine saving
25 Very similar results obtain when the eight countries with natural capital shares above 0.25 are
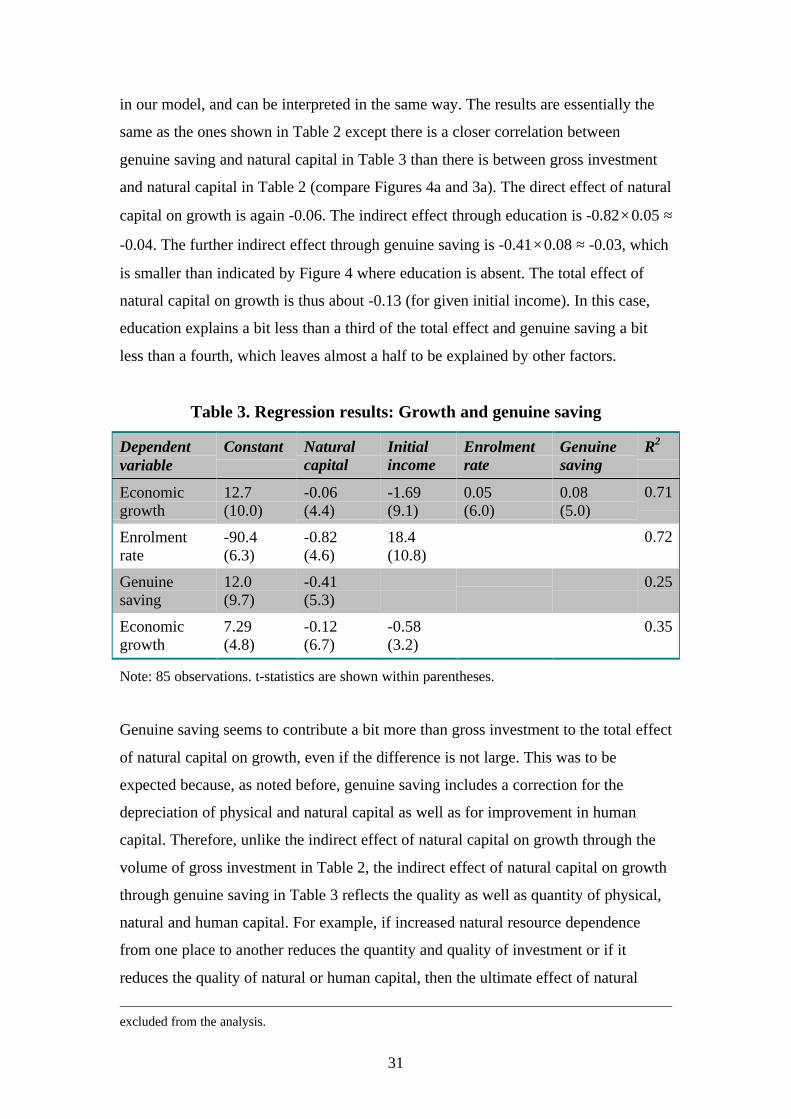
31
in our model, and can be interpreted in the same way. The results are essentially the
same as the ones shown in Table 2 except there is a closer correlation between
genuine saving and natural capital in Table 3 than there is between gross investment
and natural capital in Table 2 (compare Figures 4a and 3a). The direct effect of natural
capital on growth is again -0.06. The indirect effect through education is -0.82× 0.05 ≈
-0.04. The further indirect effect through genuine saving is -0.41× 0.08 ≈ -0.03, which
is smaller than indicated by Figure 4 where education is absent. The total effect of
natural capital on growth is thus about -0.13 (for given initial income). In this case,
education explains a bit less than a third of the total effect and genuine saving a bit
less than a fourth, which leaves almost a half to be explained by other factors.
Table 3. Regression results: Growth and genuine saving
Dependentvariable
Constant Naturalcapital
Initialincome
Enrolmentrate
Genuinesaving
R2
Economicgrowth
12.7(10.0)
-0.06(4.4)
-1.69(9.1)
0.05(6.0)
0.08(5.0)
0.71
Enrolmentrate
-90.4(6.3)
-0.82(4.6)
18.4(10.8)
0.72
Genuinesaving
12.0(9.7)
-0.41(5.3)
0.25
Economicgrowth
7.29(4.8)
-0.12(6.7)
-0.58(3.2)
0.35
Note: 85 observations. t-statistics are shown within parentheses.
Genuine saving seems to contribute a bit more than gross investment to the total effect
of natural capital on growth, even if the difference is not large. This was to be
expected because, as noted before, genuine saving includes a correction for the
depreciation of physical and natural capital as well as for improvement in human
capital. Therefore, unlike the indirect effect of natural capital on growth through the
volume of gross investment in Table 2, the indirect effect of natural capital on growth
through genuine saving in Table 3 reflects the quality as well as quantity of physical,
natural and human capital. For example, if increased natural resource dependence
from one place to another reduces the quantity and quality of investment or if it
reduces the quality of natural or human capital, then the ultimate effect of natural
excluded from the analysis.
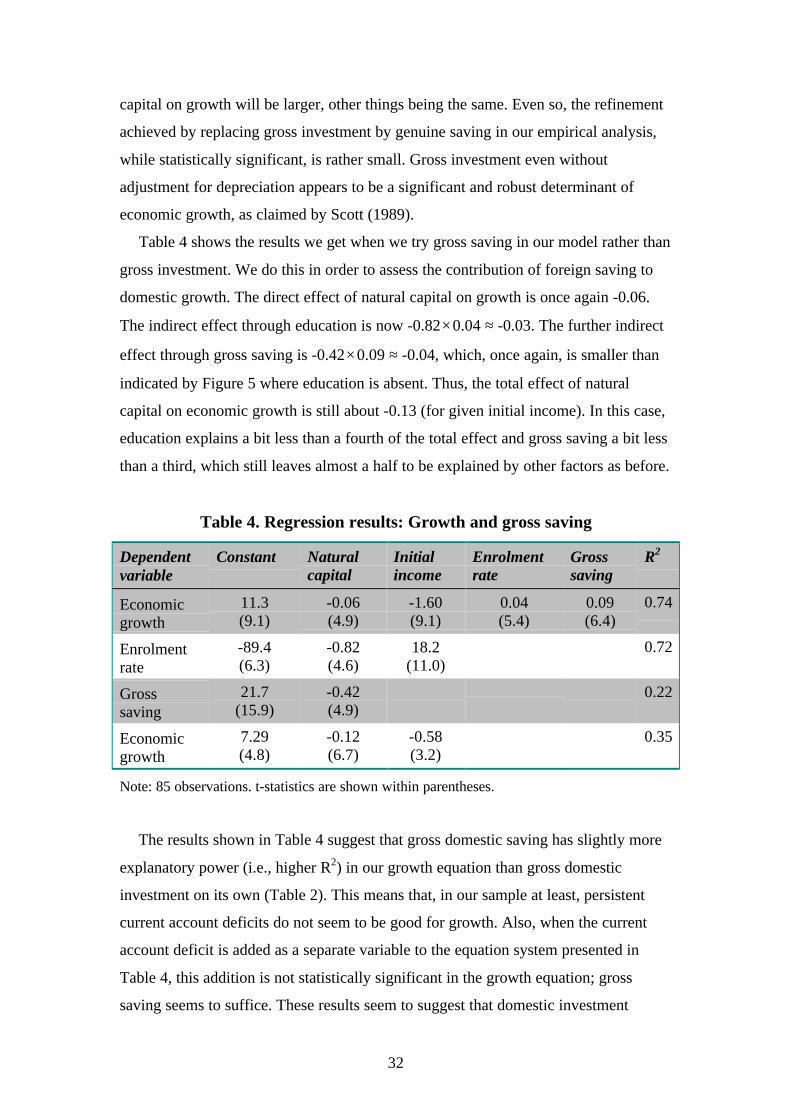
32
capital on growth will be larger, other things being the same. Even so, the refinement
achieved by replacing gross investment by genuine saving in our empirical analysis,
while statistically significant, is rather small. Gross investment even without
adjustment for depreciation appears to be a significant and robust determinant of
economic growth, as claimed by Scott (1989).
Table 4 shows the results we get when we try gross saving in our model rather than
gross investment. We do this in order to assess the contribution of foreign saving to
domestic growth. The direct effect of natural capital on growth is once again -0.06.
The indirect effect through education is now -0.82× 0.04 ≈ -0.03. The further indirect
effect through gross saving is -0.42× 0.09 ≈ -0.04, which, once again, is smaller than
indicated by Figure 5 where education is absent. Thus, the total effect of natural
capital on economic growth is still about -0.13 (for given initial income). In this case,
education explains a bit less than a fourth of the total effect and gross saving a bit less
than a third, which still leaves almost a half to be explained by other factors as before.
Table 4. Regression results: Growth and gross saving
Dependentvariable
Constant Naturalcapital
Initialincome
Enrolmentrate
Grosssaving
R2
Economicgrowth
11.3(9.1)
-0.06(4.9)
-1.60(9.1)
0.04(5.4)
0.09(6.4)
0.74
Enrolmentrate
-89.4(6.3)
-0.82(4.6)
18.2(11.0)
0.72
Grosssaving
21.7(15.9)
-0.42(4.9)
0.22
Economicgrowth
7.29(4.8)
-0.12(6.7)
-0.58(3.2)
0.35
Note: 85 observations. t-statistics are shown within parentheses.
The results shown in Table 4 suggest that gross domestic saving has slightly more
explanatory power (i.e., higher R2) in our growth equation than gross domestic
investment on its own (Table 2). This means that, in our sample at least, persistent
current account deficits do not seem to be good for growth. Also, when the current
account deficit is added as a separate variable to the equation system presented in
Table 4, this addition is not statistically significant in the growth equation; gross
saving seems to suffice. These results seem to suggest that domestic investment

33
matters for economic growth only insofar as it is financed by domestic saving. This
finding is perhaps not as surprising as it might seem, however, in view of the
prevalence of foreign borrowing by the government in many of the developing
countries in our sample. Like foreign aid, foreign lending to many developing
countries tends not to be repaid but rolled over.
7.2 Economic growth and financial maturity
This brings us to our last consideration in this paper: the role of the financial system.
We showed in our model how growth depends on the productivity of capital. We also
suggested that this might be affected by the state of the domestic financial system: A
more advanced system would be likely to raise the productivity of capital – for a
given amount of capital – and hence also the rate of interest, saving and growth. This
provides an indirect route between natural resources and economic growth if these
thwart the development of the financial system.26
Table 5. Regression results: Growth and financial depth
Dependentvariable
Constant Naturalcapital
Initialincome
Enrolmentrate
Grosssaving
Financialdepth
R2
Economicgrowth
11.7(9.4)
-0.06(5.2)
-1.64(9.2)
0.04(5.4)
0.09(6.4)
0.74
Enrolmentrate
-70.7(5.3)
-0.90(5.2)
16.0(10.1)
0.70
Grosssaving
2.97(0.4)
-0.26(2.5)
4.95(3.0)
0.28
Financialdepth
3.78(54.8)
-0.03(7.4)
0.39
Economicgrowth
7.29(4.8)
-0.12(6.7)
-0.58(3.2)
0.36
Note: 85 observations. t-statistics are shown within parentheses.
Rather than extend all the regression results from Tables 2-4 to accommodate the
financial depth variable, we focus on the case with gross saving, for the other two
cases are quite similar. Table 5 shows the results we get when gross saving depends
on natural capital as well as on the logarithm of the M2/GDP ratio, which in turn
26 Referring back to Table 1, we might add that the M2/GDP ratio is higher in the group of resource-poor, high-growth countries in the north-east corner of the table than it is in the resource-rich, low-

34
depends on natural capital.27 Apart from the addition of the financial depth variable to
the system of equations, the results are quite similar as in Table 4. What is new is this:
natural capital now influences growth through four distinct channels: directly (-0.06),
through education (-0.90× 0.04 ≈ -0.04), through gross saving (-0.26× 0.09 ≈ -0.02),
and through financial depth via gross saving (-0.03× 4.95× 0.09 ≈ -0.01). In sum, the
total effect of natural capital on growth is -0.13 as before.
When the gross saving rate and the logarithm of the M2/GDP ratio enter the growth
equation as a multiple, the estimated coefficient remains highly significant, indicating
that the effect of gross saving on economic growth varies directly with the maturity of
the financial system. However, we find no clear evidence of our earlier conjecture that
the contribution of foreign saving to economic growth varies systematically with
financial maturity as measured here.
8. Conclusion
In this paper, we have proposed a linkage between natural resources and economic
growth, through saving and investment. When the share of output that accrues to the
owners of natural resources rises, the demand for capital falls – and this leads to lower
real interest rates, less saving and less rapid growth. However, economic and
institutional reforms paving the way to a more efficient allocation of capital may
enhance the quantity as well as the quality of new investment and sustain growth.
We have extended a well-known endogenous growth model to include natural
resources as an input into the production of final goods. The model implies that the
larger the share of natural capital in national income, the lower is the rate of growth of
consumption and the greater is the need for measures to spur investment. Finally, the
more productive the capital stock, the higher is the rate of growth.
Using a data set recently released by the World Bank (2000) we calculated
correlations between growth (adjusted for initial income), the share of natural capital
in total wealth and saving and investment. The results can be summarized as follows:
• Investment in physical capital is inversely related to the share of natural capital in
national wealth and directly related to the development of the financial system.
growth group in the south-west corner, or 47 percent compared with 16 percent.27 In our sample, the M2/GDP ratio varies inversely with inflation, measured as the inflation distortionπ/(1+π) where π is the average inflation rate from 1965 to 1998. When we purge the M2/GDP ratio ofits inflation-related component and re-estimate the system, we obtain similar results as in Table 5.

35
• The development of the financial system – measured by the ratio of M2 to GDP – is
also inversely related to the share of natural capital in national wealth.
• The secondary-school enrolment rate – which is our measure of education – is
inversely related to the natural capital share.
• Economic growth is inversely related to natural resource abundance as well as to
initial income and directly related to the level of education and investment.
In addition, we found that foreign saving – in the form of current account deficits –
was inversely correlated with growth. Even if investment financed by domestic saving
is good for growth this does not seem to apply to investment financed by foreign
saving.
We conclude that economic and structural reforms leading to more efficient capital
markets, increased investment and a better allocation of capital across sectors may
help start growth in countries that are well endowed in terms of natural resources. An
excessive dependence on natural resources may, ceteris paribus, stifle the
development of efficient capital markets. Even so, active measures to construct an
institutional environment that contributes to saving and high-quality investment may
ensure growth and enhance welfare in the presence of abundant natural resources.

36
References
Auty, Richard M. (ed.) (2001a), Resource Abundance and Economic Development,
Oxford University Press, Oxford and New York.
Auty, Richard M. (2001b), “The Political Economy of Resource-Driven Growth,”
European Economic Review 45, May, 839-846.
Bardhan, Pranab (1997), “Corruption and Development: A Review of the Issues,”
Journal of Economic Literature 35, September, 1320-1346.
Barro, Robert J. (1997), The Determinants of Economic Growth, MIT Press,
Cambridge, Massachusetts.
Barro, Robert J., and Xavier Sala-i-Martin (1995), Economic Growth, McGraw-Hill,
New York.
Benhabib, Jess, and Mark M. Spiegel (1994), “The Role of Human Capital in
Economic Development: Evidence from Aggregate Cross-Country Data,” Journal
of Monetary Economics 34, 143-174.
Benhabib, Jess, and Mark M. Spiegel (2000), “The Role of Financial Development in
Growth and Investment,” Journal of Economic Growth 5, December, 341-360.
Birdsall, Nancy (1996), “Public Spending on Higher Education in Developing
Countries: Too Much or Too Little?”, Economics of Education Review 15, No. 4,
407-419.
Bruno, Michael (1984), “…”, Quarterly Journal of Economics 99, …
Bruno, Michael, and William R. Easterly (1998), “Inflation Crises and Long-run
Growth,” Journal of Monetary Economics 41, 3-26.
Burnside, Craig, and David Dollar (2000), “Aid, Policies, and Growth,” American
Economic Review 90, September, 847-868.
Chenery, Hollis B., and Moshe Syrquin (1975), Patterns of Development, 1950-1970,
Oxford University Press, London.
Collier, Paul, and Anke E. Hoeffler (1998), “On the Economic Causes of Civil War,”
Oxford Economic Papers 50, 563-73.
Corden, W. Max (1984), “Booming Sector and Dutch Disease Economics: Survey and
Consolidation,” Oxford Economic Papers 36, 359-380.
Dixit, Avinash K., and Robert S. Pindyck (1994), Investment under Uncertainty,
Princeton University Press, Princeton, N.J.
Doppelhofer, Gernot, Ronald Miller and Xavier Sala-i-Martin (2000), “Determinants
37
of Long-term Growth. A Bayesian Averaging of Classical Estimates (BACE)
Approach,” NBER Working Paper No. 7750, June.
Easterly, William R., and Stanley Fischer (1995), “The Soviet Economic Decline,”
World Bank Economic Review 9, September, 341-371.
Frankel, Jeffrey A., and David Romer (1999), “Does Trade Cause Growth?,”
American Economic Review 89, June, 379-399.
Gelb, A. (1988), Windfall Gains: Blessing or Curse?, Oxford University Press,
Oxford and New York.
Gylfason, Thorvaldur (1999), “Exports, Inflation, and Growth,” World Development
27, June, 1031-1057.
Gylfason, Thorvaldur (2001), “Natural Resources, Education, and Economic
Development,” European Economic Review 45, May, 847-859.
Gylfason, Thorvaldur, and Tryggvi Thor Herbertsson (2001), “Does Inflation Matter
for Growth?,” Japan and the World Economy, forthcoming.
Gylfason, Thorvaldur, Tryggvi Thor Herbertsson and Gylfi Zoega (1999), “A Mixed
Blessing: Natural Resources and Economic Growth,” Macroeconomic Dynamics 3,
June, 204-225.
Gylfason, Thorvaldur, Tryggvi Thor Herbertsson and Gylfi Zoega (2001),
“Ownership and Growth,” World Bank Economic Review 15, September.
Gylfason, Thorvaldur, and Gylfi Zoega (2001), “Obsolescence,” CEPR Discussion
Paper, forthcoming.
Hamilton, Kirk (2001), “The Sustainability of Extractive Economies,” Ch. 3 in Auty.
Hannesson, Rögnvaldur (2001), Investing for Sustainability: The Management of
Mineral Wealth, Kluwer Academic Publishers, Dordrecht, the Netherlands.
Herbertsson, Tryggvi Thor, Marta G. Skuladottir and Gylfi Zoega (1999), “Three
Symptoms and a Cure: A Contribution to the Economics of the Dutch Disease,”
Working Paper No. W99:10, Institute of Economic Studies, University of Iceland.
Kaldor, Nicolas (1966), Causes of the Slow Rate of Growth in the United Kingdom,
Cambridge University Press, Cambridge, England.
Karl, Terry Lynn (1997), “The Perils of the Petro-State: Reflections on the Paradox of
Plenty,” Journal of International Affairs 53, Fall, 31-48.
King, Robert G., and Ross Levine (1993a), “Finance and Growth: Schumpeter Might
be Right,” Quarterly Journal of Economics 108, August, 717-737.

38
King, Robert G,. and Ross Levine (1993b), “Finance, Entrepreneurship and Growth:
Theory and Evidence,” Journal of Monetary Economics 32, 513-542.
Knight, Malcolm, Norman Loayza and Delano Villaneuva (1996), “The Peace
Dividend: Military Spending and Economic Growth, IMF Staff Papers 43, March,
1-37.
Krueger, Anne (1974), “The Political Economy of the Rent-Seeking Society,“
American Economic Review, 64, June, 291-303.
Lahiri, Kajal, and Peter Schmidt (1978), “On the Estimation of Triangular Structural
Systems,” Econometrica 46, 1217-1221.
Lal, Deepak, and H. Myint (1996), The Political Economy of Poverty, Equity, and
Growth, Clarendon Press, Oxford, England.
Levine, Ross, and David Renelt (1992), “A Sensitivity Analysis of Cross-Country
Growth Regressions,” American Economic Review 82, September, 942-963.
Mayer, Jörg, Brian Chambers and Ayisha Farooq (eds.) (1999), Development Policies
in Natural Resource Economies, Edward Elgar, Cheltenham, UK, and
Northampton, Massachusetts.
Mauro, Paolo (1995), “Corruption and Growth,” Quarterly Journal of Economics 90,
August, 681-712.
Murphy, Kevin M., Andrei Shleifer and Robert W. Vishny (1993), “Why Is Rent-
Seeking so Costly to Growth?,” American Economic Review 83, May, 409-414.
Paldam, Martin (1997), “Dutch Disease and Rent Seeking: The Greenland Model,”
European Journal of Political Economy 13, August, 591-614.
Paldam, Martin, and Gert Tinggaard Svendsen (2000), “An Essay on Social Capital:
Looking at the Fire behind the Smoke,” European Journal of Political Economy 16,
June, 339-366.
Pritchett, Lant (2000), “The Tyranny of Concepts: CUDIE (Cumulated, Depreciated,
Investment Effort) is Not Capital,” Journal of Economic Growth 5, December,
361-384.
Rodriguez, Francisco, and Jeffrey D. Sachs (1999), "Why Do Resource-Abundant
Economies Grow More Slowly? A New Explanation and an Application to
Venezuela," Journal of Economic Growth 4, September, 277-303.
Rodriguez, Francisco, and Dani Rodrik (2000), “Trade Policy and Economic Growth:
A Skeptic’s Guide to the Cross-National Evidence,” NBER Macroeconomics
Manual.
39
Romer, David (1996), Advanced Macroeconomics, McGraw Hill, New York.
Romer, Paul M. (1986), “Increasing Returns and Long-Run Growth,” Journal of
Political Economy 94, October, 1002-1037.
Sachs, Jeffrey D., and Andrew M. Warner (1995, revised 1997, 1999), “Natural
Resource Abundance and Economic Growth,” NBER Working Paper 5398,
Cambridge, Massachusetts.
Sachs, Jeffrey D. and Andrew M. Warner (1997), “Sources of Slow Growth in
African Economies,” Journal of African Economies 6, October, 335-376.
Sachs, Jeffrey D., and Andrew M. Warner (1999), “Natural Resource Intensity and
Economic Growth,” Ch. 2 in Mayer et al.
Sachs, Jeffrey D., and Andrew M. Warner (2001), “The Curse of Natural Resources,”
European Economic Review 45, May, 827-838.
Scott, Maurice Fitzgerald (1989), A New View of Economic Growth, Clarendon Press,
Oxford.
Shleifer, Andrei, and Robert W. Vishny (1993), “Corruption,” Quarterly Journal of
Economics 88, August, 599-617.
Temple, Jonathan (1999), “A Positive Effect of Human Capital on Growth,”
Economics Letters 65, October, 131-134.
Tornell, Aaron, and Philip R. Lane (1998a), “The Voracity Effect,” American
Economic Review 89, March, 22-46.
Tornell, Aaron, and Philip R. Lane (1998b), “Are Windfalls a Curse? A Non-
representative Agent Model of the Current Account,” Journal of International
Economics 44, 83-112.
Wood, Adrian J. B. (1999), “Natural Resources, Human Resources and Export
Composition: a Cross-country Perspective,” Ch. 3 in Mayer et al.
Woolcock, Michael (1998), “Social Capital and Economic Development: Toward a
Theoretical Synthesis and Policy Framework,” Theory and Society 27, April, 151-
208.
World Bank (1997), “Expanding the Measure of Wealth: Indicators of
Environmentally Sustainable Development,” Environmentally Sustainable
Development Studies and Monographs Series No. 17, World Bank, Washington,
D.C.
World Bank (2000), World Development Indicators 2000, World Bank, Washington,
D.C.
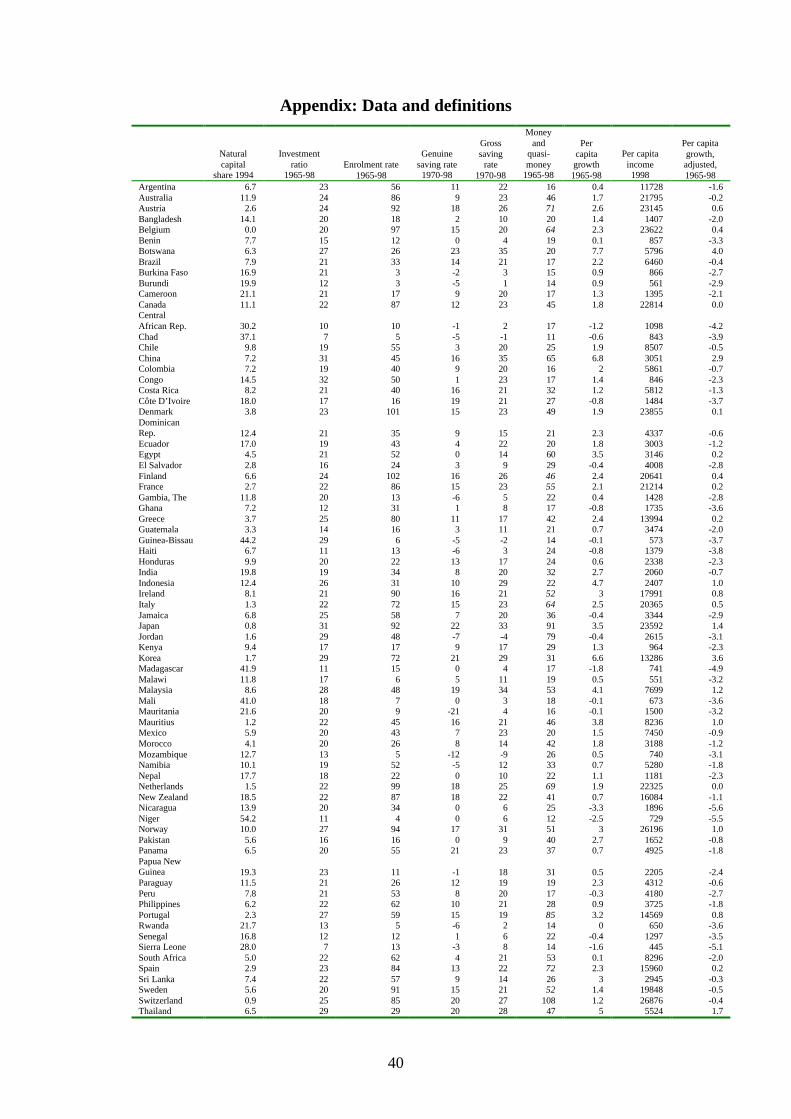
40
Appendix: Data and definitions
Naturalcapital
share 1994
Investmentratio
1965-98Enrolment rate
1965-98
Genuinesaving rate
1970-98
Grosssaving
rate1970-98
Moneyand
quasi-money
1965-98
Percapitagrowth1965-98
Per capitaincome1998
Per capitagrowth,adjusted,1965-98
Argentina 6.7 23 56 11 22 16 0.4 11728 -1.6Australia 11.9 24 86 9 23 46 1.7 21795 -0.2Austria 2.6 24 92 18 26 71 2.6 23145 0.6Bangladesh 14.1 20 18 2 10 20 1.4 1407 -2.0Belgium 0.0 20 97 15 20 64 2.3 23622 0.4Benin 7.7 15 12 0 4 19 0.1 857 -3.3Botswana 6.3 27 26 23 35 20 7.7 5796 4.0Brazil 7.9 21 33 14 21 17 2.2 6460 -0.4Burkina Faso 16.9 21 3 -2 3 15 0.9 866 -2.7Burundi 19.9 12 3 -5 1 14 0.9 561 -2.9Cameroon 21.1 21 17 9 20 17 1.3 1395 -2.1Canada 11.1 22 87 12 23 45 1.8 22814 0.0CentralAfrican Rep. 30.2 10 10 -1 2 17 -1.2 1098 -4.2Chad 37.1 7 5 -5 -1 11 -0.6 843 -3.9Chile 9.8 19 55 3 20 25 1.9 8507 -0.5China 7.2 31 45 16 35 65 6.8 3051 2.9Colombia 7.2 19 40 9 20 16 2 5861 -0.7Congo 14.5 32 50 1 23 17 1.4 846 -2.3Costa Rica 8.2 21 40 16 21 32 1.2 5812 -1.3Côte D’Ivoire 18.0 17 16 19 21 27 -0.8 1484 -3.7Denmark 3.8 23 101 15 23 49 1.9 23855 0.1DominicanRep. 12.4 21 35 9 15 21 2.3 4337 -0.6Ecuador 17.0 19 43 4 22 20 1.8 3003 -1.2Egypt 4.5 21 52 0 14 60 3.5 3146 0.2El Salvador 2.8 16 24 3 9 29 -0.4 4008 -2.8Finland 6.6 24 102 16 26 46 2.4 20641 0.4France 2.7 22 86 15 23 55 2.1 21214 0.2Gambia, The 11.8 20 13 -6 5 22 0.4 1428 -2.8Ghana 7.2 12 31 1 8 17 -0.8 1735 -3.6Greece 3.7 25 80 11 17 42 2.4 13994 0.2Guatemala 3.3 14 16 3 11 21 0.7 3474 -2.0Guinea-Bissau 44.2 29 6 -5 -2 14 -0.1 573 -3.7Haiti 6.7 11 13 -6 3 24 -0.8 1379 -3.8Honduras 9.9 20 22 13 17 24 0.6 2338 -2.3India 19.8 19 34 8 20 32 2.7 2060 -0.7Indonesia 12.4 26 31 10 29 22 4.7 2407 1.0Ireland 8.1 21 90 16 21 52 3 17991 0.8Italy 1.3 22 72 15 23 64 2.5 20365 0.5Jamaica 6.8 25 58 7 20 36 -0.4 3344 -2.9Japan 0.8 31 92 22 33 91 3.5 23592 1.4Jordan 1.6 29 48 -7 -4 79 -0.4 2615 -3.1Kenya 9.4 17 17 9 17 29 1.3 964 -2.3Korea 1.7 29 72 21 29 31 6.6 13286 3.6Madagascar 41.9 11 15 0 4 17 -1.8 741 -4.9Malawi 11.8 17 6 5 11 19 0.5 551 -3.2Malaysia 8.6 28 48 19 34 53 4.1 7699 1.2Mali 41.0 18 7 0 3 18 -0.1 673 -3.6Mauritania 21.6 20 9 -21 4 16 -0.1 1500 -3.2Mauritius 1.2 22 45 16 21 46 3.8 8236 1.0Mexico 5.9 20 43 7 23 20 1.5 7450 -0.9Morocco 4.1 20 26 8 14 42 1.8 3188 -1.2Mozambique 12.7 13 5 -12 -9 26 0.5 740 -3.1Namibia 10.1 19 52 -5 12 33 0.7 5280 -1.8Nepal 17.7 18 22 0 10 22 1.1 1181 -2.3Netherlands 1.5 22 99 18 25 69 1.9 22325 0.0New Zealand 18.5 22 87 18 22 41 0.7 16084 -1.1Nicaragua 13.9 20 34 0 6 25 -3.3 1896 -5.6Niger 54.2 11 4 0 6 12 -2.5 729 -5.5Norway 10.0 27 94 17 31 51 3 26196 1.0Pakistan 5.6 16 16 0 9 40 2.7 1652 -0.8Panama 6.5 20 55 21 23 37 0.7 4925 -1.8Papua NewGuinea 19.3 23 11 -1 18 31 0.5 2205 -2.4Paraguay 11.5 21 26 12 19 19 2.3 4312 -0.6Peru 7.8 21 53 8 20 17 -0.3 4180 -2.7Philippines 6.2 22 62 10 21 28 0.9 3725 -1.8Portugal 2.3 27 59 15 19 85 3.2 14569 0.8Rwanda 21.7 13 5 -6 2 14 0 650 -3.6Senegal 16.8 12 12 1 6 22 -0.4 1297 -3.5Sierra Leone 28.0 7 13 -3 8 14 -1.6 445 -5.1South Africa 5.0 22 62 4 21 53 0.1 8296 -2.0Spain 2.9 23 84 13 22 72 2.3 15960 0.2Sri Lanka 7.4 22 57 9 14 26 3 2945 -0.3Sweden 5.6 20 91 15 21 52 1.4 19848 -0.5Switzerland 0.9 25 85 20 27 108 1.2 26876 -0.4Thailand 6.5 29 29 20 28 47 5 5524 1.7
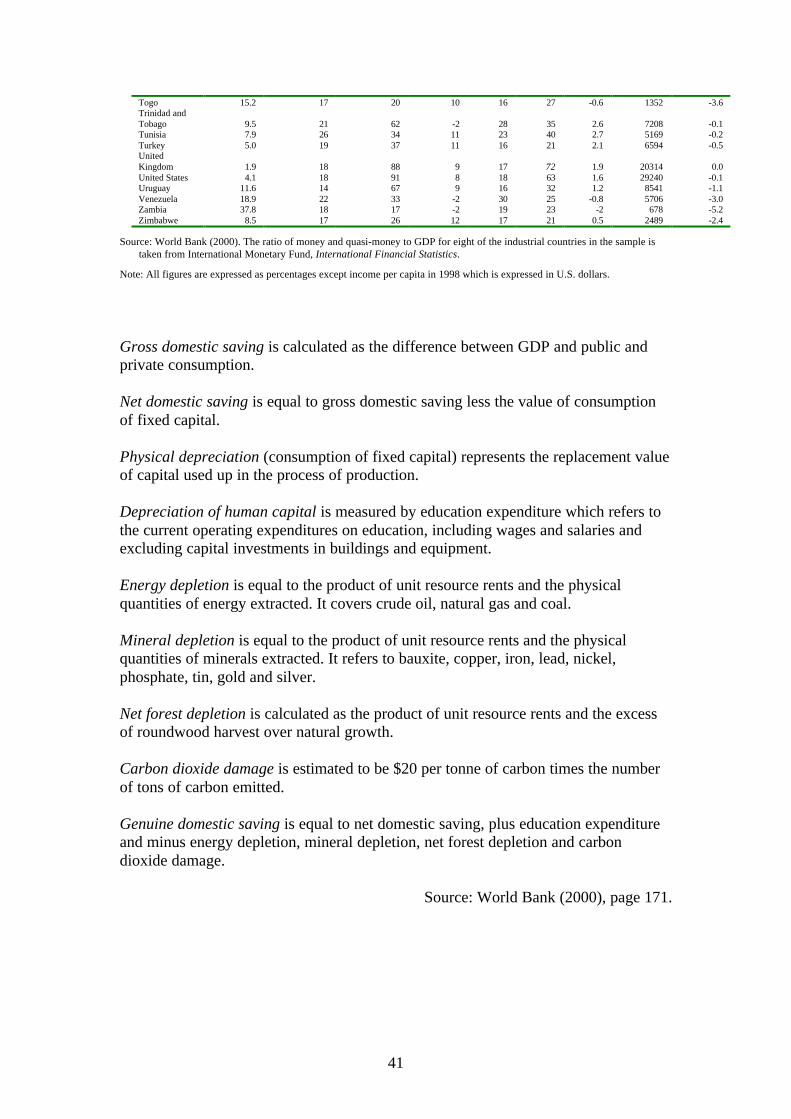
41
Togo 15.2 17 20 10 16 27 -0.6 1352 -3.6Trinidad andTobago 9.5 21 62 -2 28 35 2.6 7208 -0.1Tunisia 7.9 26 34 11 23 40 2.7 5169 -0.2Turkey 5.0 19 37 11 16 21 2.1 6594 -0.5UnitedKingdom 1.9 18 88 9 17 72 1.9 20314 0.0United States 4.1 18 91 8 18 63 1.6 29240 -0.1Uruguay 11.6 14 67 9 16 32 1.2 8541 -1.1Venezuela 18.9 22 33 -2 30 25 -0.8 5706 -3.0Zambia 37.8 18 17 -2 19 23 -2 678 -5.2Zimbabwe 8.5 17 26 12 17 21 0.5 2489 -2.4
Source: World Bank (2000). The ratio of money and quasi-money to GDP for eight of the industrial countries in the sample istaken from International Monetary Fund, International Financial Statistics.
Note: All figures are expressed as percentages except income per capita in 1998 which is expressed in U.S. dollars.
Gross domestic saving is calculated as the difference between GDP and public andprivate consumption.
Net domestic saving is equal to gross domestic saving less the value of consumptionof fixed capital.
Physical depreciation (consumption of fixed capital) represents the replacement valueof capital used up in the process of production.
Depreciation of human capital is measured by education expenditure which refers tothe current operating expenditures on education, including wages and salaries andexcluding capital investments in buildings and equipment.
Energy depletion is equal to the product of unit resource rents and the physicalquantities of energy extracted. It covers crude oil, natural gas and coal.
Mineral depletion is equal to the product of unit resource rents and the physicalquantities of minerals extracted. It refers to bauxite, copper, iron, lead, nickel,phosphate, tin, gold and silver.
Net forest depletion is calculated as the product of unit resource rents and the excessof roundwood harvest over natural growth.
Carbon dioxide damage is estimated to be $20 per tonne of carbon times the numberof tons of carbon emitted.
Genuine domestic saving is equal to net domestic saving, plus education expenditureand minus energy depletion, mineral depletion, net forest depletion and carbondioxide damage.
Source: World Bank (2000), page 171.

42
Figure 1. Economic growth and natural capital
y = -0,1192x - 1E-05
R2 = 0,4094
-8
-6
-4
-2
0
2
4
6
0 10 20 30 40 50 60
Share of natural capital in national wealth 1994 (%)
Gro
wth
of
GN
P p
er c
apit
a 19
65-1
998,
ad
just
ed
for
init
ial i
nco
me
(%)
Figure 2. Natural resource abundanceand economic structure
Resource poor,resource dependent
(e.g., Chad, Mali)
Resource rich,resource dependent
(e.g., OPEC)
Resource rich,resource free
(e.g., Canada, U.S.)
Resource poor,resource free
(e.g., Jordan, Panama)
Resource abundance, N

43
Figure 3a. Investment and natural capital
y = -0,2021x + 22,627
R2 = 0,1702
0
5
10
15
20
25
30
35
0 10 20 30 40 50 60
Share of natural capital in national wealth 1994 (%)
Gro
ss d
om
esti
c in
vest
men
t 19
65-1
998
(% o
f G
DP
)
Figure 3b. Economic growth and investment
y = 0,2466x - 6,4008R2 = 0,4207
-8
-6
-4
-2
0
2
4
6
0 5 10 15 20 25 30 35
Gross domestic investment 1965-1998 (% of GDP)
Gro
wth
of
GN
P p
er c
apit
a 19
65-1
998,
ad
just
ed
for
init
ial i
nco
me
(%)

44
Figure 4a. Genuine saving and natural capital
y = -0,4138x + 12,087R2 = 0,2487
-25
-20
-15
-10
-5
0
5
10
15
20
25
30
0 10 20 30 40 50 60
Share of natural capital in national wealth 1994 (%)
Gen
uin
e d
om
esti
c sa
vin
g 1
970-
1998
(%
of
GD
P)
Figure 4b. Economic growth and genuine saving
y = 0,157x - 2,5391R2 = 0,4894
-8
-6
-4
-2
0
2
4
6
-30 -20 -10 0 10 20 30
Genuine domestic saving 1970-1998 (% of GDP)
Gro
wth
of
GN
P p
er c
apit
a 19
65-1
998,
ad
just
ed
for
init
ial i
nco
me
(%)
45
Figure 5a. Gross saving and natural capital
y = -0,4174x + 21,7
R2 = 0,2187
-15
-10
-5
0
5
10
15
20
25
30
35
40
0 10 20 30 40 50 60
Share of natural capital in national wealth 1994 (%)
Gro
ss d
om
esti
c sa
vin
g 1
970-
1998
(%
of
GD
P)
Figure 5b. Economic growth and gross saving
y = 0,1546x - 4,0018R2 = 0,5493
-8
-6
-4
-2
0
2
4
6
-20 -10 0 10 20 30 40
Gross domestic saving 1970-1998 (% of GDP)
Gro
wth
of
GN
P p
er c
apit
a 19
65-1
998,
ad
just
ed
for
init
ial i
nco
me
(%)
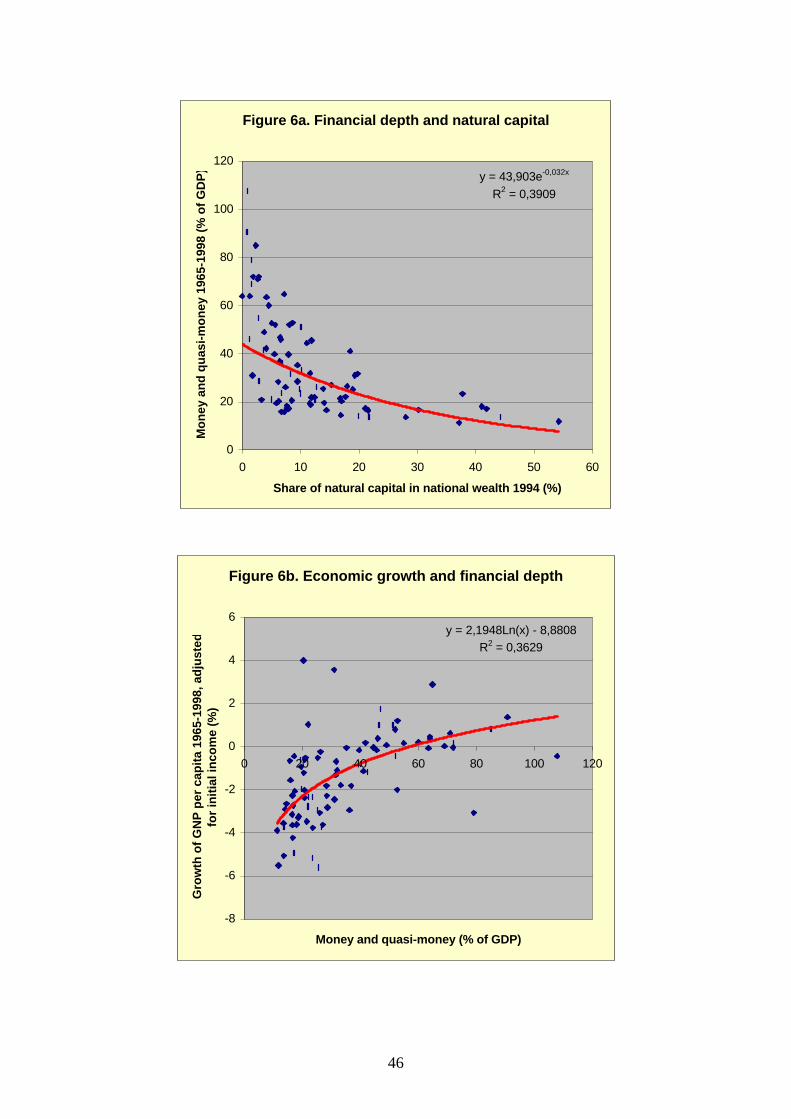
46
Figure 6a. Financial depth and natural capital
y = 43,903e-0,032x
R2 = 0,3909
0
20
40
60
80
100
120
0 10 20 30 40 50 60
Share of natural capital in national wealth 1994 (%)
Mo
ney
an
d q
uas
i-m
on
ey 1
965-
1998
(%
of
GD
P)
Figure 6b. Economic growth and financial depth
y = 2,1948Ln(x) - 8,8808R2 = 0,3629
-8
-6
-4
-2
0
2
4
6
0 20 40 60 80 100 120
Money and quasi-money (% of GDP)
Gro
wth
of
GN
P p
er c
apit
a 19
65-1
998,
ad
just
ed
for
init
ial i
nco
me
(%)