naaqs implementation and modeling issues for the iron …/media/files/aisi/public...
TRANSCRIPT

May 20, 2014
Source-Related Modeling Issues for the
Iron and Steel Industry
AISI Presentation at EPA’s 2014 Modeling Workshop
1 1
Outline of Presentation
Specific source-related modeling issues of concern to the
iron and steel sector:
• AERMOD can significantly over-predict for industrial
complexes with large heat releases
• We propose a modeling approach for these conditions
that uses urban dispersion with a large “effective
population” and the low wind options in AERMOD
• AERMOD also still needs a way to handle buoyant
volume and area sources – perhaps using hourly volume
source heights
• There are remaining AERMOD building downwash
issues: lack of meandering in light winds and need to
account for lift-off effects due to industrial heat releases
1
2 2
Unique Modeling Aspects of Iron and Steel
Industrial Processes: consider urban dispersion
• A major source-related issue is large heat releases in an industrial setting
• Normal assignments of urban vs. rural and population settings result in AERMOD over-prediction
• Industrial processes in geographic areas with large heat releases (i.e., Gary, IN and East Chicago, IN) would be modeled more accurately if considered as urban areas with large “effective populations”
• This would provide an appropriate urbanized treatment of mixing height and temperature lapse rate for dispersion calculations to handle releases within a large heated industrial complex
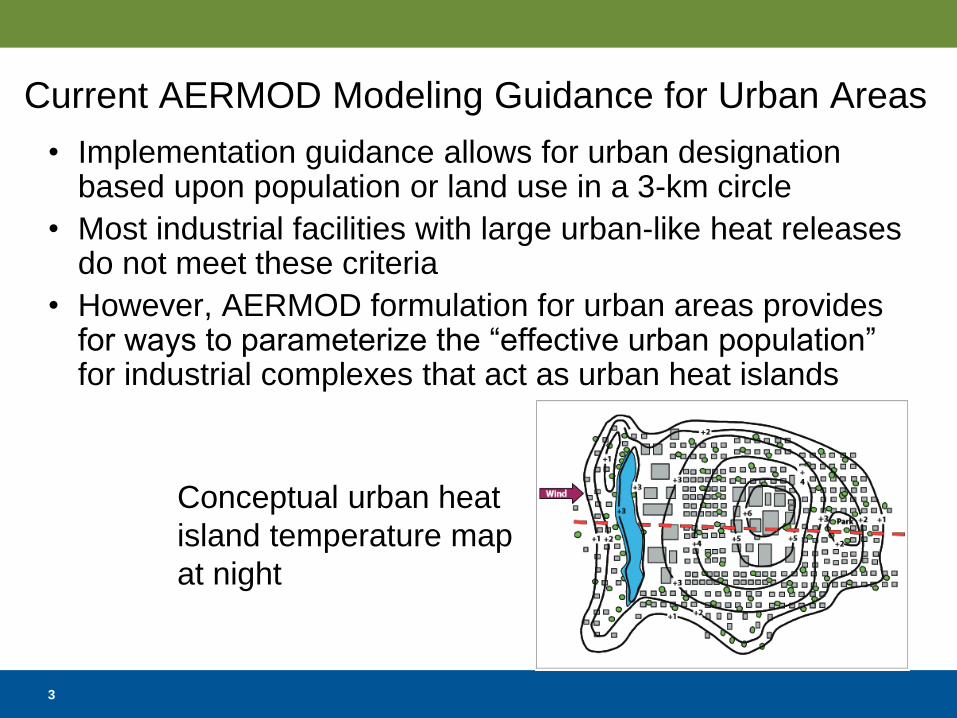
Current AERMOD Modeling Guidance for Urban Areas
• Implementation guidance allows for urban designation based upon population or land use in a 3-km circle
• Most industrial facilities with large urban-like heat releases do not meet these criteria
• However, AERMOD formulation for urban areas provides for ways to parameterize the “effective urban population” for industrial complexes that act as urban heat islands
3
Conceptual urban heat
island temperature map
at night

Determining the “Effective Urban Population”
• The AERMOD urban formulation has a relationship between the urban-rural temperature difference (ΔTu-r) and the effective urban population (P):
ΔTu-r = ΔTmax [0.1 ln(P/Po) + 1.0],
where ΔTmax = 12 deg C and Po = 2,000,000
• The urban-rural temperature difference can be measured for industrial complex areas
• Alternatively, if the excess heat release (flux, Hu) is known, then this can be related to the urban-rural temperature difference, as noted in the AERMOD formulation:
Hu = α ρ cp ΔTu-r u*,
where α, ρ, cp, and u* are known, so ΔTu-r ~ Hu/4
4
Measurements of Urban-Rural Temperature Difference
• The excess temperature in industrial complex areas is now routinely available via satellite databases
• Available satellites are ASTER and LandSat 8
• We have provided EPA with a technical discussion of how to access these databases
• An example of an ASTER satellite temperature map is provided later in this presentation
• Brightness temperature” from satellite can be reviewed for industrial area and compared to urban areas to quantify the “industrial complex heat island” temperature excess
5

AISI field database tested to illustrate how urban
dispersion with large effective population
improves AERMOD performance:
NW Indiana SO2 evaluation database for
AERMOD using actual emissions for 2008
6

7 7
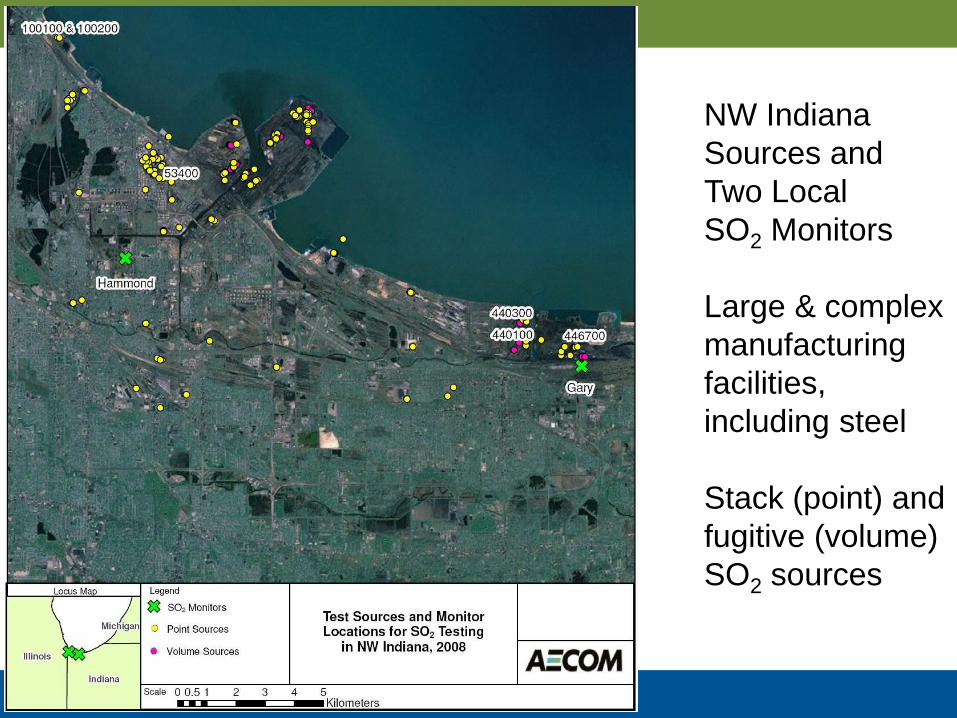
NW Indiana
Sources and
Two Local
SO2 Monitors
Large & complex
manufacturing
facilities,
including steel
Stack (point) and
fugitive (volume)
SO2 sources

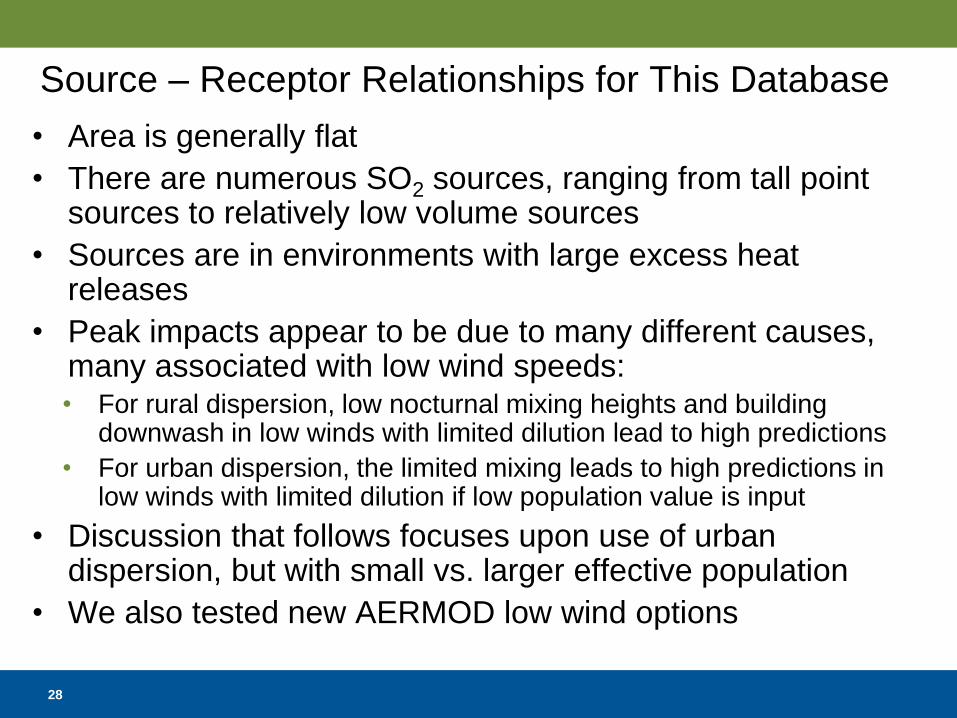
Source – Receptor Relationships for This Database
• Area is generally flat
• There are numerous SO2 sources, ranging from tall point sources to relatively low volume sources
• Sources are in environments with large excess heat releases
• Peak impacts appear to be due to many different causes, many associated with low wind speeds: • For rural dispersion, low nocturnal mixing heights and building
downwash in low winds with limited dilution lead to high predictions
• For urban dispersion, the limited mixing leads to high predictions in low winds with limited dilution if low population value is input
• Discussion that follows focuses upon use of urban dispersion, but with small vs. larger effective population
• We also tested new AERMOD low wind options
8

9 9
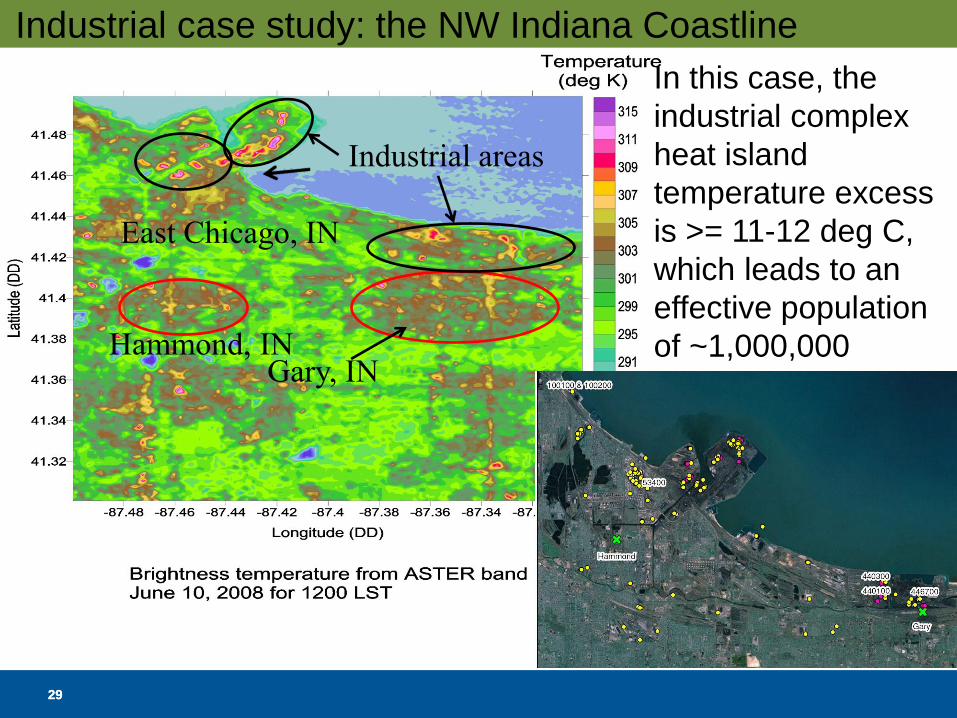
Industrial case study: the NW Indiana Coastline
Industrial areas
Gary, IN
East Chicago, IN
Hammond, IN
In this case, the
industrial complex
heat island
temperature excess
is >= 11-12 deg C,
which leads to an
effective population
of ~1,000,000

10 10
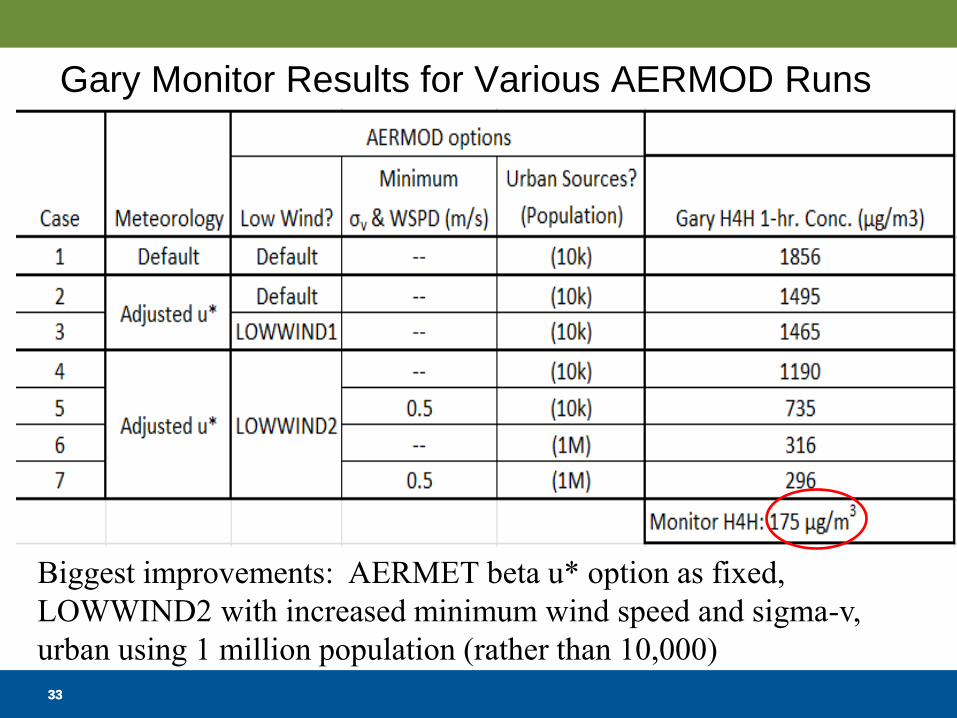
Gary Monitor Results for Various AERMOD Runs
Biggest improvements: AERMET beta u* option as fixed,
LOWWIND2 with increased minimum wind speed and sigma-v,
urban using 1 million population (rather than 10,000)

11 11
Summary for NW Indiana Study
• AERMOD run with small urban population over-predicts by about a factor of 10 at two monitors in NW Indiana
• Urban dispersion option improves AERMOD performance for industrial complex heat islands
• Use of larger effective population with urban treatment provides significant improvement (more than a factor of 2)
• Use of AERMOD beta options for met processing and LOWWIND2 treatment with 0.5 m/s minimum values for wind speed and sigma-v gives factor of 2-3 improvement
• Some over-prediction tendency remains with the best case option, but results are much improved with consideration of urban dispersion with effective urban population and low wind options

Building Downwash Issues: Low Winds and
Source-related Lift-off Effects
12

13 13
Building Downwash Complications for Light Winds
and Source-Related Effects
• AERMOD predicted building downwash effects –
sometimes very high concentrations - can occur with nearly calm winds in stable conditions (especially with rural dispersion)
• The peak predictions under these conditions are not expected and have not been adequately evaluated
• These conditions are discussed in Alan Robins chapter on “Flow and dispersion around buildings in light wind conditions” in Stably Stratified Flows, edited by Castro and Rockliff, 1994
• Plume lift-off considerations are discussed in “Lift-off of ground-based buoyant plumes” in Journal of Hazardous Materials, 1998, by Hanna, Briggs, and Chang

14 14
Comments on Light Wind Downwash Issues
• Light winds are associated with extreme stability conditions
• Characteristics of flow and dispersion near buildings in these conditions may be quite unlike those in neutral cases
• Source-related effects become important due to weak ambient turbulence effects in light winds
• In light winds with significant wind meander, building wake effects are very unsteady, but AERMOD does not accommodate this effect in the current formulation
• In fact, AERMOD’s meander treatment for low winds only applies to non-downwash dispersion, and was never implemented in the PRIME model implementation within AERMOD

15 15
How to Adjust for this Light Wind Effect?
• Suggested approach would be to reduce downwash impact for very low winds due to wind direction unsteadiness / meander
• The Danish OML model accounts for the intermittent nature of the downwash (see Genikhovich-Snyder approach in http://www2.dmu.dk/1_viden/2_Publikationer/3_arbrapporter/rapporter/AR123.pdf, Section 5.2)
• Basically, the downwash vs. non-downwash treatment is weighted by a factor depending upon the wind intermittency
• An AERMOD workgroup should take this on as a key issue to be resolved

16 16
Downwash for Sources with Excess Heat Releases
• In cases with significant heat releases, plumes will resist
downwash effects, especially in light wind cases, and lift off from the building – PRIME does not consider this effect
• Heat can be estimated with a buoyancy flux term, Fb
• Hanna, Briggs, and Chang suggest a combined dimensionless buoyancy flux, F** = Fb/(Ueff3W), where Fb is the buoyancy flux, Ueff is the effective wind speed and W is the initial plume width
• Possible approach similar to low wind intermittency: Use a weighting factor between lift-off conditions (no downwash) and non-lift-off conditions (normal downwash) ranging from 0 to 1 from Hanna, Briggs, Chang paper:
exp (-6F**^0.4)
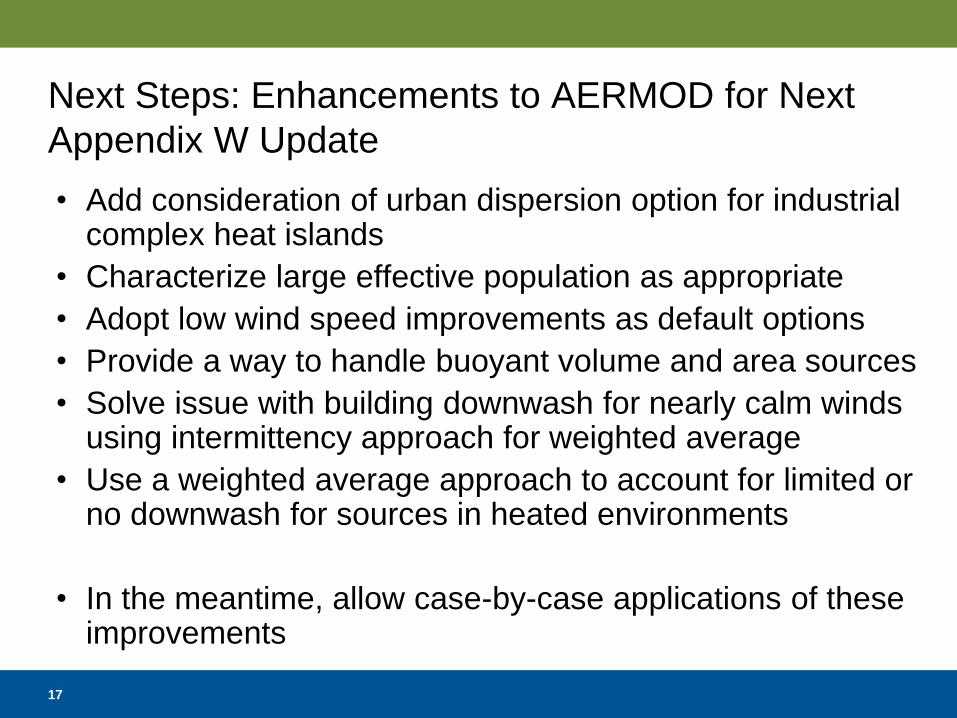
Next Steps: Enhancements to AERMOD for Next
Appendix W Update
• Add consideration of urban dispersion option for industrial complex heat islands
• Characterize large effective population as appropriate
• Adopt low wind speed improvements as default options
• Provide a way to handle buoyant volume and area sources
• Solve issue with building downwash for nearly calm winds using intermittency approach for weighted average
• Use a weighted average approach to account for limited or no downwash for sources in heated environments
• In the meantime, allow case-by-case applications of these improvements
17
May 20, 2014
Source-Related Modeling Issues for the
Iron and Steel Industry
AISI Presentation at EPA’s 2014 Modeling Workshop
Appendix: Full Set of Presentation Slides
19 19
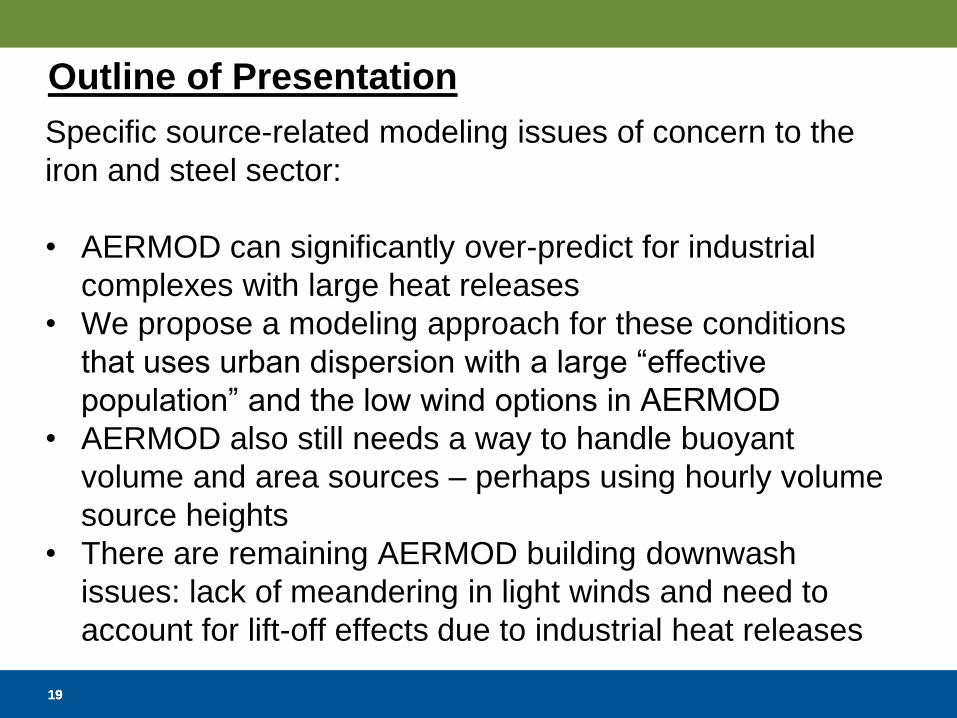
Outline of Presentation
Specific source-related modeling issues of concern to the
iron and steel sector:
• AERMOD can significantly over-predict for industrial
complexes with large heat releases
• We propose a modeling approach for these conditions
that uses urban dispersion with a large “effective
population” and the low wind options in AERMOD
• AERMOD also still needs a way to handle buoyant
volume and area sources – perhaps using hourly volume
source heights
• There are remaining AERMOD building downwash
issues: lack of meandering in light winds and need to
account for lift-off effects due to industrial heat releases
19
20 20
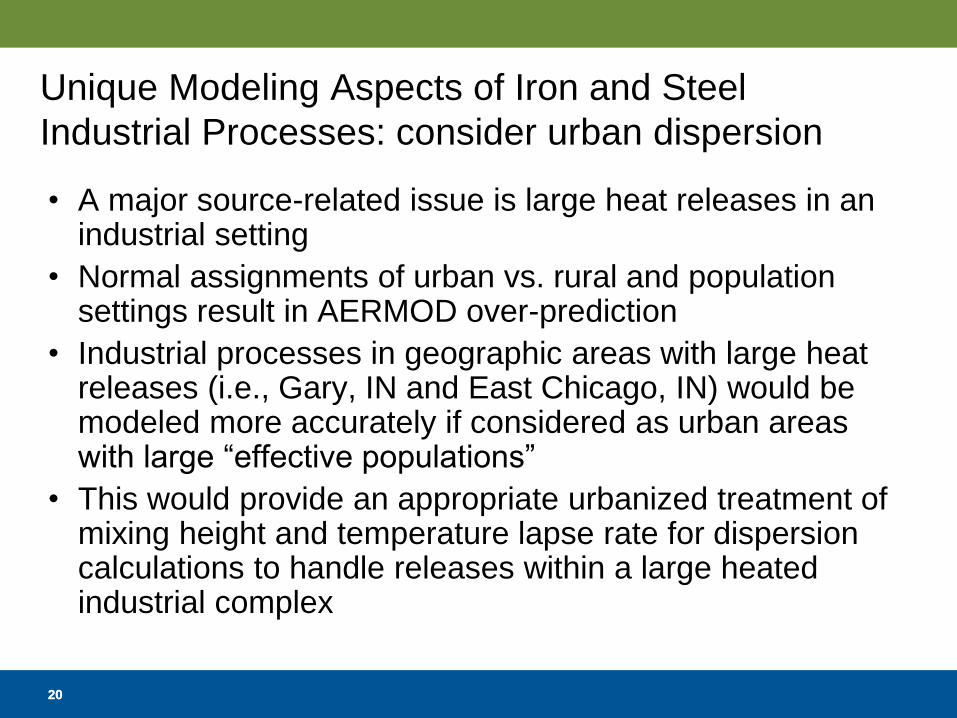
Unique Modeling Aspects of Iron and Steel
Industrial Processes: consider urban dispersion
• A major source-related issue is large heat releases in an industrial setting
• Normal assignments of urban vs. rural and population settings result in AERMOD over-prediction
• Industrial processes in geographic areas with large heat releases (i.e., Gary, IN and East Chicago, IN) would be modeled more accurately if considered as urban areas with large “effective populations”
• This would provide an appropriate urbanized treatment of mixing height and temperature lapse rate for dispersion calculations to handle releases within a large heated industrial complex

Current AERMOD Modeling Guidance for Urban Areas
• Implementation guidance allows for urban designation based upon population or land use in a 3-km circle
• Most industrial facilities with large urban-like heat releases do not meet these criteria
• However, AERMOD formulation for urban areas provides for ways to parameterize the “effective urban population” for industrial complexes that act as urban heat islands
21
Conceptual urban heat
island temperature map
at night

Determining the “Effective Urban Population”
• The AERMOD urban formulation has a relationship between the urban-rural temperature difference (ΔTu-r) and the effective urban population (P):
ΔTu-r = ΔTmax [0.1 ln(P/Po) + 1.0],
where ΔTmax = 12 deg C and Po = 2,000,000
• The urban-rural temperature difference can be measured for industrial complex areas
• Alternatively, if the excess heat release (flux, Hu) is known, then this can be related to the urban-rural temperature difference, as noted in the AERMOD formulation:
Hu = α ρ cp ΔTu-r u*,
where α, ρ, cp, and u* are known, so ΔTu-r ~ Hu/4
22

Examples of Effective Population Calculation (P)
Case 1: urban-rural temperature difference is provided: ΔTu-r = 10 deg C P = Po exp [10(ΔTu-r /ΔTmax-1.0)], where ΔTmax = 12 deg C, and Po = 2,000,000 P ~ 400,000 Case 2: anthropogenic heat flux, Hu, is estimated for the entire source and divided by the source area to provide average heat flux in watts/m2 for the industrial area: suppose Hu = 40 watts/m2
ΔTu-r ~ Hu/4 = 10 deg C
Then, from the example above, P ~ 400,000
23
Measurements of Urban-Rural Temperature Difference
• The excess temperature in industrial complex areas is now routinely available via satellite databases
• Available satellites are ASTER and LandSat 8
• We have provided EPA with a technical discussion of how to access these databases
• An example of an ASTER satellite temperature map is provided later in this presentation
• Brightness temperature” from satellite can be reviewed for industrial area and compared to urban areas to quantify the “industrial complex heat island” temperature excess
24
AISI field database tested to illustrate how urban
dispersion with large effective population
improves AERMOD performance:
NW Indiana SO2 evaluation database for
AERMOD using actual emissions
25
26 26
Northwest Indiana SO2 Evaluation for AERMOD
Using Actual Emissions for 2008
• Indiana Department of Environmental Management (IDEM) provided an inventory of annual average SO2 emissions for 2008
• AERMOD predicted results using annual average emission rates were compared to measurements at two local SO2 monitors
• AERMOD evaluation study was submitted to EPA in June 2012, but was later updated with AERMOD version 12345
27 27
NW Indiana
Sources and
Two Local
SO2 Monitors
Large & complex
manufacturing
facilities,
including steel
Stack (point) and
fugitive (volume)
SO2 sources
Source – Receptor Relationships for This Database
• Area is generally flat
• There are numerous SO2 sources, ranging from tall point sources to relatively low volume sources
• Sources are in environments with large excess heat releases
• Peak impacts appear to be due to many different causes, many associated with low wind speeds: • For rural dispersion, low nocturnal mixing heights and building
downwash in low winds with limited dilution lead to high predictions
• For urban dispersion, the limited mixing leads to high predictions in low winds with limited dilution if low population value is input
• Discussion that follows focuses upon use of urban dispersion, but with small vs. larger effective population
• We also tested new AERMOD low wind options
28
29 29
Industrial case study: the NW Indiana Coastline
Industrial areas
Gary, IN
East Chicago, IN
Hammond, IN
In this case, the
industrial complex
heat island
temperature excess
is >= 11-12 deg C,
which leads to an
effective population
of ~1,000,000

30 30
AERMOD Version 12345* Model Tests Conducted
for NW Indiana for Modeled Year 2008
*with Theta-star fix as installed in AERMET 13350

31 31
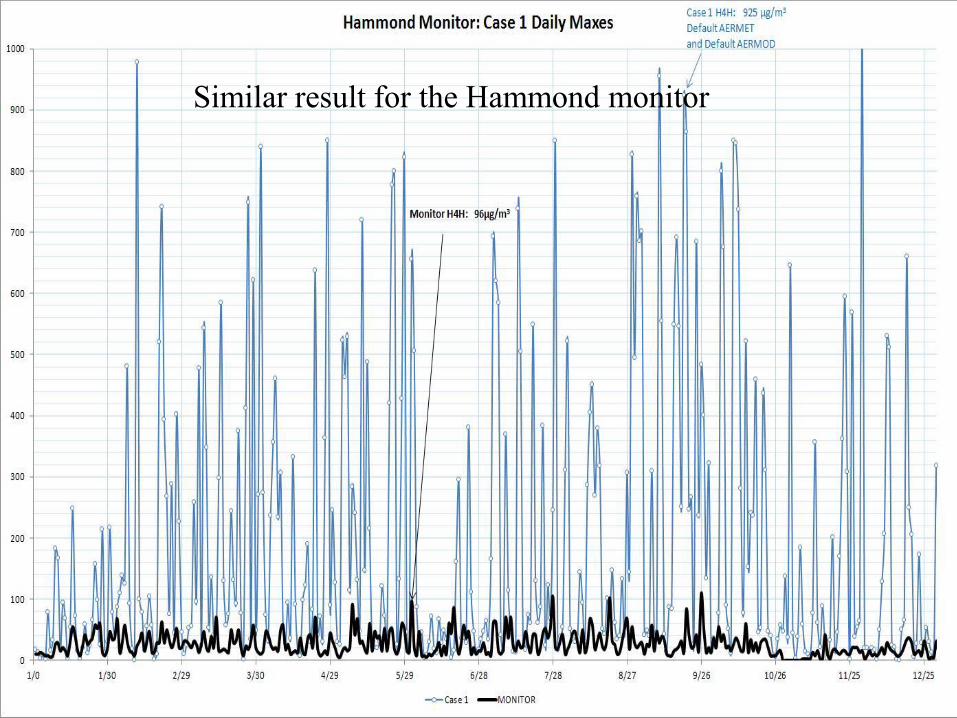
AERMOD urban with very small population over-predicts by
more than a factor of 10 (urban boundary layer only ~100 m);
limited boundary layer height is a primary cause
Monitor
AERMOD
32 32
Similar result for the Hammond monitor
33 33
Gary Monitor Results for Various AERMOD Runs
Biggest improvements: AERMET beta u* option as fixed,
LOWWIND2 with increased minimum wind speed and sigma-v,
urban using 1 million population (rather than 10,000)

34 34
Best case AERMOD much better,
still over-predicts by a factor of 1.7
35 35
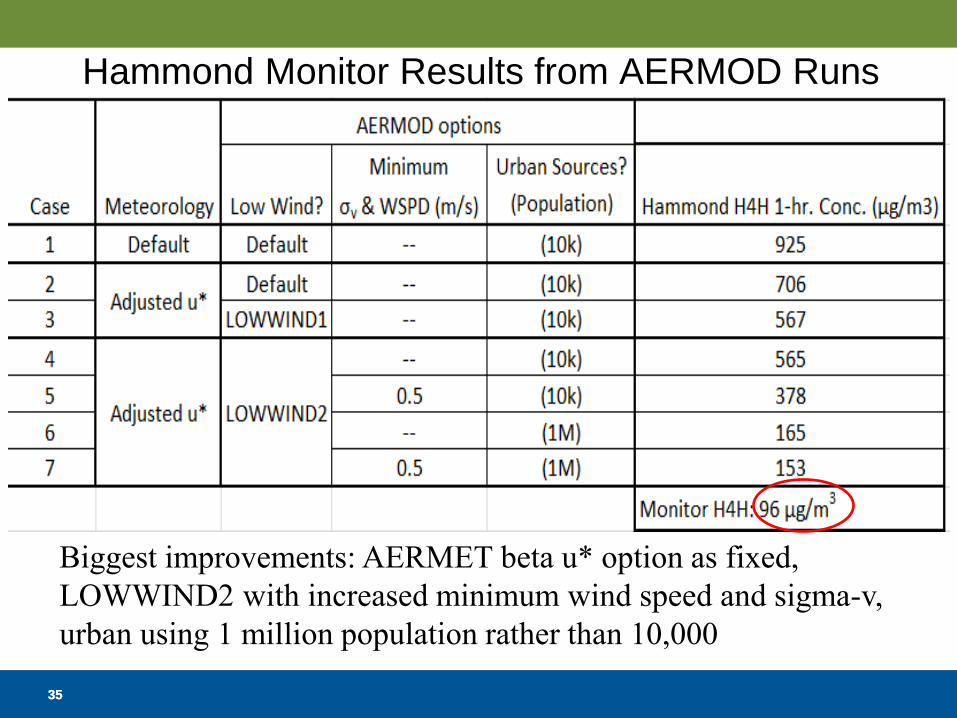
Hammond Monitor Results from AERMOD Runs
Biggest improvements: AERMET beta u* option as fixed,
LOWWIND2 with increased minimum wind speed and sigma-v,
urban using 1 million population rather than 10,000
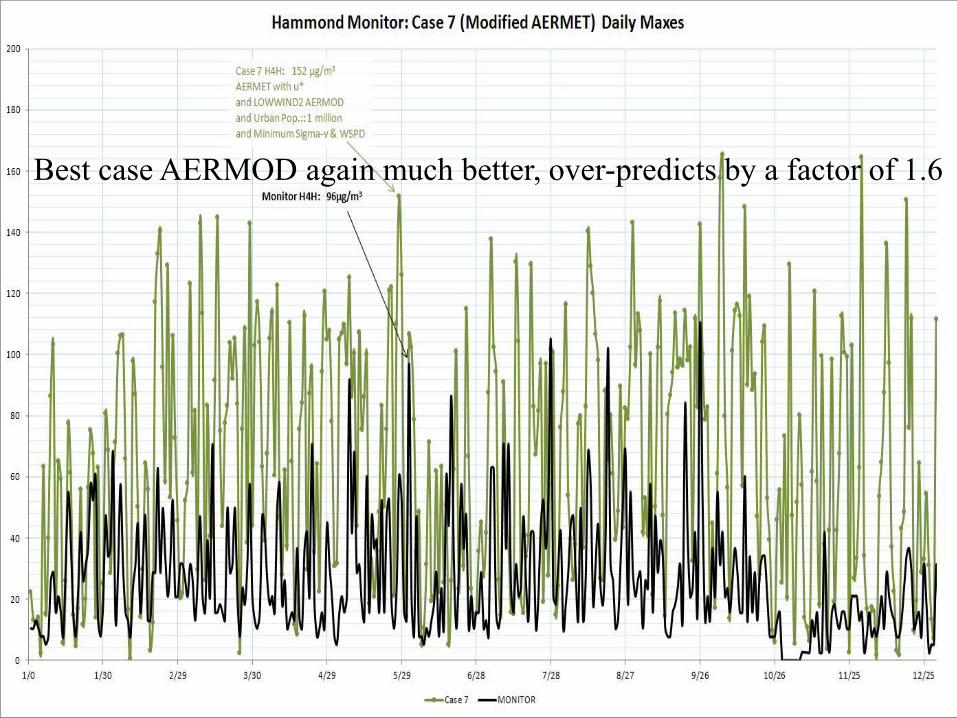
36 36
Best case AERMOD again much better, over-predicts by a factor of 1.6
37 37
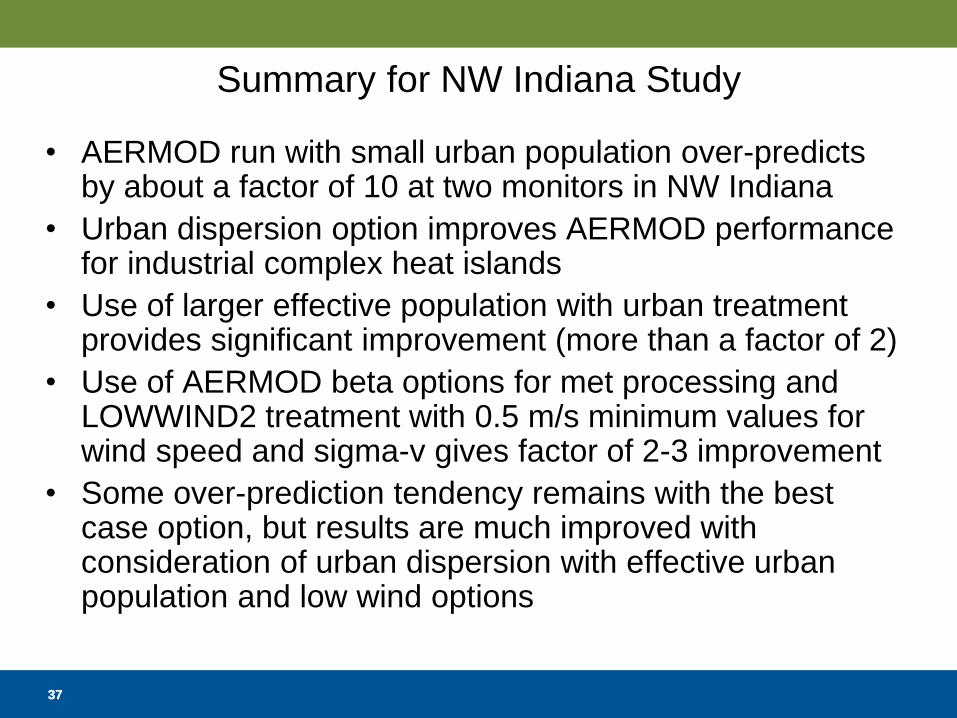
Summary for NW Indiana Study
• AERMOD run with small urban population over-predicts by about a factor of 10 at two monitors in NW Indiana
• Urban dispersion option improves AERMOD performance for industrial complex heat islands
• Use of larger effective population with urban treatment provides significant improvement (more than a factor of 2)
• Use of AERMOD beta options for met processing and LOWWIND2 treatment with 0.5 m/s minimum values for wind speed and sigma-v gives factor of 2-3 improvement
• Some over-prediction tendency remains with the best case option, but results are much improved with consideration of urban dispersion with effective urban population and low wind options

Building Downwash Issues: Low Winds and
Source-related Lift-off Effects
38

39 39
Building Downwash Complications for Light Winds
and Source-Related Effects
• AERMOD predicted building downwash effects –
sometimes very high concentrations - can occur with nearly calm winds in stable conditions (especially with rural dispersion)
• The peak predictions under these conditions are not expected and have not been adequately evaluated
• These conditions are discussed in Alan Robins chapter on “Flow and dispersion around buildings in light wind conditions” in Stably Stratified Flows, edited by Castro and Rockliff, 1994
• Plume lift-off considerations are discussed in “Lift-off of ground-based buoyant plumes” in Journal of Hazardous Materials, 1998, by Hanna, Briggs, and Chang

40 40
Comments on Light Wind Downwash Issues
• Light winds are associated with extreme stability conditions
• Characteristics of flow and dispersion near buildings in these conditions may be quite unlike those in neutral cases
• Source-related effects become important due to weak ambient turbulence effects in light winds
• In light winds with significant wind meander, building wake effects are very unsteady, but AERMOD does not accommodate this effect in the current formulation
• In fact, AERMOD’s meander treatment for low winds only applies to non-downwash dispersion, and was never implemented in the PRIME model implementation within AERMOD
41 41
How to Adjust for this Light Wind Effect?
• Suggested approach would be to reduce downwash impact for very low winds due to wind direction unsteadiness / meander
• The Danish OML model accounts for the intermittent nature of the downwash (see Genikhovich-Snyder approach in http://www2.dmu.dk/1_viden/2_Publikationer/3_arbrapporter/rapporter/AR123.pdf, Section 5.2)
• Basically, the downwash vs. non-downwash treatment is weighted by a factor depending upon the wind intermittency
• An AERMOD workgroup should take this on as a key issue to be resolved

42 42
Downwash for Sources with Excess Heat Releases
• In cases with significant heat releases, plumes will resist
downwash effects, especially in light wind cases, and lift off from the building – PRIME does not consider this effect
• Heat can be estimated with a buoyancy flux term, Fb
• Hanna, Briggs, and Chang suggest a combined dimensionless buoyancy flux, F** = Fb/(Ueff3W), where Fb is the buoyancy flux, Ueff is the effective wind speed and W is the initial plume width
• Possible approach similar to low wind intermittency: Use a weighting factor between lift-off conditions (no downwash) and non-lift-off conditions (normal downwash) ranging from 0 to 1 from Hanna, Briggs, Chang paper:
exp (-6F**^0.4)

Next Steps: Longer-Term vs. Short-Term Modeling
Approaches for Iron and Steel Emission Sources
• Longer term (promulgation of Appendix W update – 2016?):
• Add consideration of urban dispersion option for industrial complex heat islands
• Characterize large effective population as appropriate
• Adopt low wind speed improvements as default options
• Provide a way to handle buoyant volume and area sources
• Solve issue with building downwash for nearly calm winds using intermittency approach for weighted average
• Use a weighted average approach to account for limited or no downwash for sources in heated environments
43
Next Steps: Longer-Term vs. Short-Term for Iron
and Steel Emission Sources
• Shorter term (until Appendix W update):
• Status quo modeling approaches do not result in credible AERMOD results – there are substantial over-predictions
• Without recommended changes, modeling cannot be used to conclude that there are NAAQS violations in the vicinity of iron and steel industry sources with significant excess heat releases
• In the interim, allow on a case-by-case basis (without impossible hurdles) the use of urban dispersion with large effective population, low wind speed options, and downwash adjustments for low winds and/or heated buildings
44