chapter 6 modeling and water resource issues
TRANSCRIPT

Chapter 6Modeling and Water Resource Issues
Contents
Page
Surface Water Flow and Supply. . . . . . . . . . . . . . . . . . . . . . . . . . . . . . . . . . . . . . 119Introduction . . . . . . . . . . . . . . . . . . . . . . . . . . . . . . . . . . . . . . . . . . . . . . . . . . . . . . . . . . . 119Types of Models Used in Surface Water Flow and Supply Analysis . . . . . . . . . . . . 121Water Availability Issues . . . . . . . . . . . . . . . . . . . . . . . . . . . . . . . . . . . . . . . . . . . . . . . . 124Water Use Issues . . . . . . . . . . . . . . . . . . . . . . . . . . . . . . . . . . . . . . . . . . . . . . . . . . . . . . . 128Evaluation of Currently Available Surface Water Flow and Supply Models . . . . . 130
Surface Water Quality . . . . . . . . . . . . . . . . . . . . . . . . . . . . . . . . . . . . . . . . . . . . . . 131Introduction . . . . . . . . . . . . . . . . . . . . . . . . . . . . . . . . . . . . . . . . . . . . . . . . . . . . . . . . . . . 131Types of Models Used in Surface Water Quality Analysis . . . . . . . . . . . . . . . . . . . . 132Nonpoint Source Issues . . . . . . . . . . . . . . . . . . . . . . . . . . . . . . . . . . . . . . . . . . . . . . . . . 134Point Source and General Issues . . . . . . . . . . . . . . . . . . . . . . . . . . . . . . . . . . . . . . . . . . 138Evaluation of Currently Available Surface Water Quality Models . . . . . . . . . . . . . 141
Ground Water Quantity and Quality . . . . . . . . . . . . . . . . . . . . . . . . . . . . . . . . . . 143Introduction . . . . . . . . . . . . . . . . . . . . . . . . . . . . . . . . . . . . . . . . . . . . . . . . . . . . . . . . . . . 143Types of Models Used in Ground Water Resources Analysis . . . . . . . . . . . . . . . . . 144Ground Water Quantity Issues . . . . . . . . . . . . . . . . . . . . . . . . . . . . . . . . . . . . . . . . . . . 146Ground Water Quality Issues . . . . . . . . . . . . . . . . . . . . . . . . . . . . . . . . . . . . . . . . . . . . 147Evaluation of Currently Available Ground Water Models . . . . . . . . . . . . . . . . . . . . 151
Economic and Social Models . . . . . . . . . . . . . . . . . . . . . . . . . . . . . . . . . . . . . . . . 152Introduction . . . . . . . . . . . . . . . . . . . . . . . . . . . . . . . . . . . . . . . . . . . . . . . . . . . . . . . . . . . 152Basic Analytical Characteristics . . . . . . . . . . . . . . . . . . . . . . . . . . . . . . . . . . . . . . . . . . . 153Types of Models Used for Economic Analysis . . . . . . . . . . . . . . . . . . . . . . . . . . . . . . 155Other Social and Economic Analytical Techniques . . . . . . . . . . . . . . . . . . . . . . . . . . 155Economic and Social Issues in Water Resource Analysis . . . . . . . . . . . . . . . . . . . . . 156
TABLES
Table No. Page
7. Surface Water Flow and Supply Model Evaluation . . . . . . . . . . . . . . . . . . . . . . . . 1308. Surface Water Quality Model Evaluation . . . . . . . . . . . . . . . . . . . . . . . . . . . . . . . . 1429. Ground Water Model Evaluation . . . . . . . . . . . . . . . . . . . . . . . . . . . . . . . . . . . . . . . 151

Chapter 6
Modeling and Water Resource Issues—— —— —
Government agencies normally use water re-source models to address specific resource problemsunder their jurisdiction. While most problems andmodel applications have unique aspects, it is possi-ble to generalize about the kinds of problems mostfrequently encountered in water resource manage-merit — and the analytic techniques used to under-stand them. This chapter describes 33 of the Na-tion’s most prevalent water resource issues, brief-ly assesses the modeling capabilities associated witheach of them, and evaluates the model types usedto analyze them. Previous chapters have focusedon generic issues and problems involving water re-source models; this chapter deals with specific waterresource concerns and the capacity of models to ad-dress them. It is provided as a layman’s introduc-tion to the relationship between models and real-world water resource issues.
Water resource concerns can readily be groupedaccording to four major subject areas: 1 ) surfacewater flow and supply; 2) surface water quality;3) ground water quantity and quality; and 4) economic and social models. The areas differ signifi-
cantly with regard to levels of current knowledge,kinds of issues addressed, and types of models andlevels of modeling expertise currently available.Each is discussed in a separate section of thechapter.
The first three subject areas deal primarily withphysical processes, and are described according toa common format: 1) introduction; 2) types of mod-els; 3) issues addressed; and 4) evaluation of cur-rently available models. Each subject-area modelevaluation follows a format that reflects the prob-lems addressed, processes modeled, and mathe-matical techniques most commonly used withineach scientific discipline. The last area, economicand social models, deals with the social science in-formation needed to support water resource deci-sionmaking. Models of social sciences processes dif-fer fundamentally from those of physical processes,and are extremely diverse; consequently, a largersubjective component is involved in evaluatingthem. No formal evaluation of economic and socialmodels was undertaken for this study.
SURFACE WATER FLOW AND SUPPLY
Introduction
Managing surface water today virtually requiresthe use of a wide range of computer-based analyticaltechniques, ranging from sophisticated models thatforecast the probable frequencies and extents ofserious floods, to relatively simple computer modelsfor simulating the operational characteristics of farmirrigation systems. All of these models provide in-formation to help assure that water will be availablewhen and where needed, or will not intrude whenor where it is not wanted. Models permit the analystto: 1 ) make reasonable predictiom of natural events,and 2) estimate the favorable and adverse cose-quences of man’s attempts to improve the reliabili-ty of’ freshwater production, distribution, and useSyst ems.
Water resource models are widely applicable toproblems in policy, planning, operational manage-ment, and regulation of the Nation surface waterresources. Existing models are widely used to planand operational~ manage most water availability y andwater use problems. Model use is not as commonfor policy and regulatory activities, partially becauseexisting models are not well adapted to decision-making in these governmental areas, and partial-ly because such decisions have traditionally beenbased more on qualitative than quantitative criteria.
Models used to analyze surface water flow andSupply problems can be subdivided into two broadcategories, for which both current model capabilitiesand future promising roles are somewhat different.For each of the two broad categories-water avail-
119
120 ● Use of Models for Water Resources Management, Planning, and Policy
ability and water use—four specific problem areasare discussed later in this section. Although theseproblem areas are not all-inclusive, they encom-pass the major surface water quantity problems fac-ing the Nation. Each problem area is specificenough to permit discussion of successes and fail-ures in the use of models, and development of rec-ommendations for appropriate model uses. An eval-uation table for the models used in each problemarea is presented later in this chapter (see table 7).
To introduce the modeling techniques that ap-ply to surface water flow and supply issues, appli-cable model types are discussed below. Generally,the model types are not limited to one specific prob-lem area—each model type may be applicable toseveral issues. References, keyed to over 30 modelclasses, are provided in appendix D to this report.
Availability of Water
Water availability analysis-which encompassesbut is not limited to the sciences of hydrology andmeteorology —uses models extensively. While mod-els are less frequently used in policymaking thanfor planning and management, numerous examplesof model use for determining water availability canbe cited throughout private industry and at all levelsof government. In fact, a major problem in usingmodels to analyze a given water availability prob-lem is the difficulty of selecting—from among theplethora of available models—the most appropriatemodel for the problem at hand.
Determining the availability of surface water re-quires analyses of the hydrologic cycle, typically in-cluding calculations of streamflow magnitude, dura-tion, and frequency; and the temporal and spatialvariations of these streamflow characteristics. Aspecific problem may require analyzing one or moreof these characteristics at a single point along astream—for instance, to determine the extent of aflood plain—or it may require coordinated analysisat a large number of locations in a watershed (e. g.,to operate a series of multiple-purpose reservoirs).
Solving problems of water availability, however,requires more than understanding and modelingthe hydrologic cycle. Many problems arise becauseof the need to alter natural hydrologic processes for avariety of reasons: to reduce flood hazards; toreduce the risks of drought and low streamflow; to
change the timing and distribution of streamflow;and to improve management of this increasinglyscarce renewable resource for a variety of beneficialpurposes. Certain types of human intervention innatural hydrologic processes can be modeled rea-sonably well, but many types of modifications andcontrols introduce conditions that may be too com-plex to simulate or forecast accurately. In dealingwith water availability problems, one must distin-guish between the capability to model natural proc-

Ch. 6—Modeling and Water Resource Issues ● 121— —
esses, and current capabilities to model the effects ofhuman management efforts on these processes.
Water Use
Models have been used less frequently to analyzewater use than to analyze water availability. Ex-cept for agricultural irrigation needs in arid areasof the Western United States, water availability hashistorically been so much greater than water usethat there was little or no requirement for sophisti-cated analysis. Consequently, almost no effort wasexpended on developing models to analyze wateruse. In recent years, however, increasing demandfor relatively large quantities of water—e. g., forenergy development—and the droughts of the1960’s in the Northeast and the 1970’s in theMidwest and West, have stimulated the develop-ment of models for planning and operations/man-agement. Nonetheless, these recent developmentsare not yet reflected in widespread adoption of wateruse models.
Water availability and water use also differ inthe kinds of information they require for model con-struction. Most problems of water availability areconcerned with physical principles and relationshipsthat are reasonably well understood, and are conse-quently easier to model successfully, while mostwater use problems involve not only physical fac-tors but also social and economic factors—many ofwhich are less well understood. The lack of knowl-edge about interrelationships among economic, so-cial, and physical factors is compounded by a lackof data on social and economic factors related towater use. Social and economic models are dis-cussed in more detail later in this chapter.
Types of Models Used in SurfaceWater Flow and Supply Analysis
Of the wide array of models used to analyze vari-ous aspects of surface water flow and supply, themost important ones fall into two broad modelclasses—process models and statistical models. Proc-ess models simulate or describe the flow of waterthrough a watershed or water body using known,physical relationships. Statistical models use empir-ically derived relationships—often with no inherentphysical meaning—to estimate the probability of
a flood or drought, the magnitude of a flood peak,or even regional water use demands.
Watershed Process Models
Watershed process models follow the movementof water from the time it reaches the Earth as pre-cipitation until it flows into a lake or stream, reachesa ground water aquifer, or evaporates back to theatmosphere. Models used to describe the dynamicsof water over three distinctly different types of landareas are described in this section: 1) watershedsimulation models, which describe the movementof water over large, nonurban areas; 2) agriculturalsoil/water interaction models, which are designedto specifically address agricultural water problems;and 3) urban runoff models, which describe themovement of water through urban areas.
Watershed Simulation Models.—Simulationmodels describing the movement of water overlarge, nonurban areas are used to estimate floodpeaks, low flows, and volumes of water availableto users. They are most useful where historicalstreamflow data are sparse or nonexistent. Thesesimulation models are powerful planning tools thatcome far closer to replicating measured flows thanwas previously possible. Four types of processesmust be included in watershed simulation models:1) the movement of rainfall into and through thesoil; 2) ground water flow to streams (called base-flow); s) the l0SS of water to the atmosphere fromevaporation and evapotranspiration from plants;and 4) in colder climates, snow accumulation andsnowmelt.
Watershed soil/water process models are used to repli-cate water movement into and through the soil for:1) estimating flood peaks during storm events;2) estimating water supply on an annual basis; and3) estimating low flows during dry periods. Cur-rent models are most reliable for estimating lowflows and total annual runoff volumes, and less so(but still acceptable) for calculating short-term flowsand flood peaks.
During low-flow periods, except in very humidclimates, water enters streams primarily by seepagethrough the soil profile or from aquifers. Mostbaseflow models do not use advanced ground watermodeling techniques to estimate flow rates, but
8 + - [ 83 n - 82 - 3

122 ● Use of Models for Water Resources Management, Planning, and Policy
rather use observed flow patterns during long dryperiods as an estimate of ground water flow tostreams. They are quite adequate for estimatingbaseflow during floods, and reasonably good forestimating low flows.
Evaporation from water surfaces and evapotransPira-
tion from plants are modeled to simulate the soil-drying process. The drier the soil, the more precipi-tation will infiltrate and be stored during the nextstorm. The results are more reliable for watershed-wide average soil moisture than for specific loca-tions within the watershed, but are difficult to val-idate because of the scarcity of field data.
For areas where snow remains on the ground formore than about a month, the processes of snowaccumulation on the ground and snowmelt in thespring must also be considered. Total runoff vol-umes from snowmelt can be simulated quite wellfor forecasting water availability during the follow-ing summer, but models are not very reliable forsimulating snowmelt flood peaks (magnitudes arebad and timing is worse), because of the difficultyof predicting spring weather conditions. However,in areas where the snowmelt occurs relatively slow-ly, the models are adequate for most purposes.
Agricultural Soil/Water Interaction Models.—Simulation models similar to the watershed processmodels described above have been developed toassist in agricultural water conservation. Four typesof models are currently available:
Soil/water process models are sometimes spe-cialized to estimate moisture conditions in a smallplot, rather than average conditions over an entirewatershed. These P!ot--size soil/water process models areused for agricultural water management and land-use decisionmaking. This approach has potentialfor improving crop management decisions, butthese models are not yet very accurate.
Models that analyze the effects of local climaticvariation on @ant water use are valuable for allocatingavailable water supplies. Acceptable results are ob-tained on an annual or seasonal basis, but estimatesof shorter term demands (less than 1 month) areunreliable.
The extent and duration of the soil’s capacity tohold irrigation water for plant use has been modeledto assist in farm water management and irrigation
system design. Results from irrigation water demandmodels are generally reliable for estimating averageannual water use, but poor for estimating how useis distributed over the irrigation season.
In areas where excess water is a problem, soilmoisture can be reduced by subsurface tile or ditchdrains to make the land more productive. Landdrainage models estimate flow rates for system designand residual field moisture conditions for croppingdecisions. These models achieve adequate to goodresults.
Ch. 6—Modeling and Water Resource Issues ● 123
Urban Runoff Models .—Urban runoff modelsgenerate simultaneous flows from many small ur-ban watersheds, and aggregate them into floodflows for specified downstream points. These mod-els are sophisticated tools for urban flood plainmanagement and for designing and operatingurban storm-water control systems. They have re-ceived widespread use over the last few years andpromise a great deal for the future.
Stream Process Models
Stream process models begin describing themovement of water at the point where watershedprocess models end— once the water enters astream, lake, or reservoir. In this section, two topicsare discussed: 1) models that describe the flow ofwater through streams, lakes, and reservoirs, usedprimarily for flood control; and 2) models that de-scribe the movement and erosion of sediments(called alluvial processes) within water bodies.
Channel Process Models.— Channel processmodels describe the flow of water through streams,lakes, and reservoirs. They are often used for reser-voir operations during flood conditions and for floodplain management. In general, they provide veryreliable results when accurate information on chan-nel and flood plain geometry is available. The fol-lowing models are included in this category:
F[ood channel routing models are used for operatingflood control facilities or issuing warnings duringflood emergencies. These models provide quite reli-able estimates of changes in flow depth and veloc-ity as water moves downstream in well-definedchannels. However, the estimates are less accuratefor larger floods where streams overflow theirbanks, and are particularly unreliable where flowsspread out over large flat areas.
When flows enter a lake or reservoir they increaseboth water depth and outflow through spillways orother outlet controls. Lake and reservoir routing mod-els are accurate enough to size spillways to ensuredam safety and for controlling spillway gates to min-imize downstream flood damage.
Flood plain management relies heavily on ac-curate mapping of flood hazard areas. Models canestimate flood heights and—when combinecl with
accurate topographic maps—the geographic extent
of flooding. The most accurate results from floodinundation models are achieved when the stream flowsbetween stable channel banks, and the least reliableestimates are obtained on broad flat flood plainswhere flows are deflected by small obstructions andare spread in random patterns from one event tothe next.
Special channel routing models are used to deter-mine the downstream areas that would be inun-dated if a dam failed. The reliability of dam failuremodels is uncertain, because few historical recordsare available on the hydrologic conditions existingat the time of failure.
Alluvial Process Models. —The dynamics ofchannel erosion and sediment deposition have beendescribed through modeling techniques. The re-sults, however, are approximate, and a great dealmore research is needed to make these models reli-able. Two important problem areas include reser-voir sedimentation and channel erosion:
Re.sewoir sedimentation models have been developedfor determining the amount of sediment washedinto a reservoir that is deposited on the bottom, thusreducing its water storage capacity. These modelsdo not have the accuracy desired for estimating
useful reservoir life, unless supported by empiricalrelationships from reservoir surveys.
Flowing water can erode the channels throughwhich it flows and deposit sediment loads down-stream. Problem locations can be identified byusing channel erosion and deposition models, but theresults are not reliable enough for channel designor maintenance management.
Statistical Models
When causative mechanisms are not well enoughunderstood to construct process models, or the ex-pense of developing or using process models is notjustifiable, statistical models are often used in theirplace. Statistical models can be used wheneverenough data are available to estimate the relation-ships between factors of interest—without havingto understand the underlying physical processes.
Three types of models are presented in this sec-tion: 1) statistical flood models, which yield resultssimilar to combined watershed and stream process

124 Use of Models for Water Resources Management, P/arming, and Policy-— — . — . .
models; 2) flood and drought frequency analysis,used for sizing flood control or water supply proj-ects; and 3) water use statistical relationships, whichare used to estimate demands for water.
Statistical Flood Models .—Statistical models—simpler in approach than the process models dis-cussed earlier—have been developed to estimateflood flows and areas of inundation. These tools areuseful for structural design or reservoir operationin situations where more sophisticated continuoussimulation models are not justified. Three commonapproaches—flood formulae, regional flood for-mulae, and unit hydrography models—have beenextensively used.
Flood formulae are simple equations for estimatingflood peaks from watershed characteristics. Theyhave been used for years to help design small struc-tures, but can only be recommended for relativelysmall projects. Much more reliable for structuralplanning are regional flood formulcw. These equationsare derived statistically using historical data andcan be used for estimating flood peaks on streamsthroughout hydrologically uniform regions.
Another approach, called unit hydrography mode/-ing, is based on the assumption that a given amountof runoff from a given watershed will always resultin similar flood patterns. These models have longbeen used to establish flow patterns for designingflood control reservoirs. The results are reasonablefor reservoir design to prevent flooding by a stormevent of specified size, but less than desirable forreservoir operation.
Flood and Drought Frequency Analysis.—Several approaches are available for estimating thefrequency of occurrence of floods and droughts. Thepurpose of these models is to determine the econom-ically optimal size of flood control or water supplyprojects. The available statistical models providereasonable to good results for most applications.
Flow frequency models analyze historical series offlood peaks, flood volumes, or low flows to providean estimate of the maximum or minimum flowmagnitudes to be expected, on the average, no morethan once every 10 years, 100 years, or some otherperiod. The reliability of these models improveswith longer record lengths. Once the statistical char-acteristics of streamflow have been determined, an-
nual data generation models can generate annual runoffsequences that match the size, probability distribu-tion, and other patterns of historical flows for usein determining reservoir capacity. The results aregenerally good for monthly, seasonal, or annualtime periods.
Another important use of statistical models is forassisting reservoir design. By accounting for all in-flows (stream and precipitation) and outflows (evap-oration, uncontrolled releases, and project waterdelivered) over long time periods, capacity require-ments for designing reservoirs and rules for operat-ing them during dry periods can be determined.Reseruoir water accounting models provide excellent re-sults if reliable data are available to describe inflowand storage volumes.
Water Use Statistical Relationships.—Wateruse demands (use as it would be if unconstrainedby supply shortages) are estimated either from his-torical data or simulation models. Two types ofmodels have been applied on broad regional scales:
Regional water use relationships statistically estimatepeak, annual, and seasonal variations in water userates. Their results are generally adequate for esti-mating the volume of water needed over long peri-ods, but not for estimating peak demands.
Annual use generation models, similar to models thatsimulate streamflow, have potential for generatingestimates of monthly to annual water use. Theseresults may then be combined with supply estimatesfor the same period to improve water supply reser-voir design or operating procedures. However, reli-able models of this type are not widely used.
Water Availability Issues
Flood Forecasting and Control
Floods rank among the most prevalent of naturalhazards. About half of the Nation’s communities,and nearly 90 percent of its largest metropolitanareas, are located in flood-prone areas. Despite ex-penditures of more than $13 billion for flood con-trol over the last 50 years, flood damage continuesto rise each year. Residential, commercial, and in-dustrial development in flood-prone areas outstripsour ability to provide protection, while the econom-ic value of existing damage-susceptible property in-creases as well.

Ch. 6—Modeling and Water Resource Issues ● 125
Available models and the hydrologic data re-quired to operate them are generally adequate forflood control planning and management. Even insituations where hydrologic records are not as ex-tensive as designers require, statistical methods anddigital simulation models provide sufficient infor-mation for designing flood control and protectionstructures.
Although there are isolated cases of design defi-ciencies in flood control projects, most of the hun-dreds of existing projects function as planned.When flood damage occurs in ‘‘protected’ areas,it is generally not due to faulty flood forecastingor to failure to operate flood control projects prop-erly. Rather, damages occur because the flood mag-nitude exceeds the degree of protection providedby the project. However, when flood magnitudesexceed the project’s protective capabilities, accurateforecasting becomes essential for minimizing losseven if it cannot prevent loss. A poor forecast of aflood exceeding the control structure’s capacity cancause serious mismanagement, and greatly increasethe resulting damage. Improvement is needed inthe accuracy with which flood characteristics arepredicted once the event is under way.
While models and predictive methods for floodcontrol planning and management are generallysatisfactory for design, engineering, and routineoperation of traditional areawide flood control struc-tures, flood control planners are increasingly con-cerned with nonstructural measures for reducingflood damage. Consequently, new needs for modelsand data aimed at nonstructural approaches havearisen. Many of these measures are regulatory innature, and frequently address areas considerablysmaller than those associated with larger scale struc-tural projects. As a result, many traditional floodcontrol models are not suited for planning and man-aging nonstructural approaches. These traditionalmodels are based on a ‘‘ macrohydrologic’ scale,in which model assumptions and data requirementsare scaled to hydrologic analyses for relatively largewatersheds. However, when these models are ap-plied to the ‘‘ microhydrologic’ scale, they are oftenfuuncl to be inappropriate, either because detaileddata are not available at the microscale level, orbecause the macroscale assumptions are not consist-ent with conditions on the smaller scale.
Good hydrologic analysis on a microscale basisrequires considerably more data than macroscaleanalysis; consequently, geographic consistency indata on soil types, vegetation, land use, precipita-tion, and surface runoff is considerably more impor-tant in microscale analysis. As a result, the modelsbeing developed for microscale analysis frequent-ly depend on the availability of spatial data bases—i.e. , sets of computerized ‘‘maps’ with a geo-graphically consistent set of data on an area’s physi-cal characteristics. Although the needed data arefrequently available on printed maps, the effort re-quired for digitizing and maintaining the data sig-nificantly limits widespread use of these models atpresent.
Model use for the regulatory aspects of flood con-trol has been extensive in both flood plain manage-ment and flood insurance programs. Two basictypes of models—flood inundation models and floodfrequency models—have been widely employed.Flood inundation models are used to delineate floodhazard areas. When properly used, the availablemodels are relatively noncontroversial. However,problems have occurred when the analysis is per-formed for part of a stream at one time and for ad-jacent parts at another time, with the result thatthe flood hazard areas fail to coincide at the bound-aries of adjacent areas. Since the primary purposeof this analysis is regulatory in nature—identifyingareas subject to flooding so that appropriate restric-tions in use can be implemented—it is not surpris-ing that even minor inconsistencies in flood hazardarea delineations are major sources of controversy.
A larger source of controversy has been the useof statistical flood models to determine the magni-tude of flood associated with a specified recurrenceinterval (usually 100 years). Each of the half dozenor so major flood frequency theories (and the mod-els based on them) produces somewhat different re-sults in a given setting, even when the same dataset is used for all cases. In some instances the dif-ferent theories give considerably different results,so that estimates of the size of a 100-year flood, forinstance, may vary by a factor of two or more. Withthat large a variation in flood magnitude, there isan attendant, but usually somewhat smaller, varia-tion in flood hazard area—since the amount of landsubject to development restrictions varies with the
126 Use of Models for Water Resources Management, P/arming, and Policy
estimate of the 100-year flood magnitude. Floodfrequency estimates at different points on the samestream using different models (or even at the samepoint using different models) often produce differentresults, causing a tremendous amount of confusionand controversy. Since the differences are not dueto error in calculation, but to fundamental differ-ences in the assumptions of the models, the differ-ences are essentially irreconcilable. The need forconsistency was a major factor in the Water Re-sources Council’s decision to recommend a uniformtechnique (or model) for use by Federal agenciesin performing flood frequency analyses. That deci-sion has eliminated some, but not all, of the contro-versy.
LOW-FlOW and Drought Forecasting
Low streamflow is caused primarily by physicalphenomena, while droughts result from the jointoccurrence of low streamflow and high demand—acondition due to social and economic causes as wellas physical ones. Modeling capability for forecastingand managing low streamflow per se is as highlydeveloped as for flood forecasting. However, fromthe point of view of drought management, whichrequires an ability to modify both water availabilityand water use, the available models are less satis-factory.
The major difficulty in forecasting low flowsstems from problems in choosing appropriate sta-tistical procedures for determining how often to ex-pect low flows of a specified volume and duration.Most of the theories used in hydrologic probabilityanalysis are based on the concept of independ-ence—the idea that two or more “events’ are total-ly unrelated to one another. In the case of lowstreamflow, analysts are normally concerned withthe quantity of streamflow during a specific periodof time. Frequently, however, the specified periodis part of a more extended period of low flow pro-duced by general climatological and meteorologicaltrends. For this reason, it is difficult to ascribe prob-ability estimates to low-flow ‘‘events.
Perhaps because of the difficulty of determininglow-flow probabilities, a common practice in plan-ning and designing facilities for low-flow manage-ment has been to design for the ‘ ‘drought of rec-ord, i.e., the most severe low-flow period experi-
enced in recorded history in a given watershed.Because of natural variation and differences in thelength of available hydrologic records in differentwatersheds, the ‘‘drought of record’ in some water-sheds is very severe—perhaps with an estimated re-currence interval of 300 years or more—while inother watersheds the drought of record may havea recurrence interval of 20 years or less.
When the drought of record is used as a designstandard, some facilities are inevitably underde-signed and others are overdesigned. Thus, whilefailures of flood control structures are rare, seriousinaccuracies in low-flow management facilities arerelatively common. Although alternative methodshave been developed for calculating streamflow se-quences of long duration based on statistical anal-ysis of relatively short historical hydrologic records,planners have been reluctant to accept designsbased on statistical methods that differ substantiallyfrom designs based on the “drought of record. ”Considerably more work is needed on the use ofstatistical methods for planning, designing, oper-ating, and managing low-flow control facilities.
Public policy for dealing with low-flow problemshas focused more on water availability y policy thanon water use in low-flow periods—except with re-gard to competition among uses (irrigation, hydro-electric power, municipal water supply), which willbe discussed in the following subsection on stream-flow regulation. Little use has been made of modelsfor regulatory aspects of low-flow management, ex-cept where interstate compacts or judicial decisionshave forced governmental entities to apportion lowflow among competing users. In general, availablemodels seem to be adequate for these needs.
Streamflow Regulation
The Nation has invested billions of dollars infacilities to regulate streamflow for a variety of pur-poses: to reduce flood damage; to generate hydro-electric power; to provide stable navigation chan-nels; to provide dependable surface water suppliesfor municipal, industrial, and agricultural uses; toimprove fish and wildlife habitat; and to providerecreational opportunities. Federal agencies alonehave constructed hundreds of structures that regu-late streamflow for one or more of these purposes.Thousands more have been constructed by other
Ch. 6—Modeling and Water Resource Issues ● 127— —
governmental entities, private enterprises, and indi-viduals. Most of these facilities are passive; i.e.,they require little, if any, operational management(other than routine maintenance) to accomplishtheir intended purpose. Levees, ungated diversionstructures, and small dams with ungated spillwaysare typical facilities that require minimal opera-tional management.
Hundreds of these existing facilities, however,are not passive. They are large, complex structuresserving many purposes and requiring intricatedaily, hourly, or sometimes even minute-to-minuteoperational management to achieve their intendedpurposes. Myriad conditions, criteria, and datamust be identified and evaluated each time an op-erational decision is made. Some operationalcriteria are based on fixed conditions (e. g., thosethat ensure the safety of the structure) while othersare based on changing phenomena (e. g., currentand future weather conditions). Operational man-agement is further complicated in multipurposeprojects because some purposes are competitive (adecision favoring one purpose has an adverse ef-fect on some other purpose), while others are com-plementary (a decision favoring one purpose hasbeneficial effects on other purposes). Operationalmanagement problems are even more complex inwatersheds where two or more multipurpose proj-ects exist. In this case, decisions for each projectmust be coordinated so that the projects themselvesfunction in a complementary fashion.
Over the past decade, computer models that givethe project manager much greater flexibility thanpreviously used fixed operating rules have beendeveloped. Thus, it is now feasible to model theoperation of single projects or large systems of inter-connected projects.
Many fixed operational rules have been replacedby models that permit day-to-day decisionmakingthat can more effectively consider several objectivesof a project (or projects) simultaneously. Most ofthe current models include only hydrologic inputsand outputs, and the physical operation of a proj-ect or system. Economic, social, institutional, andenvironmental factors affecting operational man-agement are only considered indirectly, or evalu-ated outside the model. Despite their limitations,these models have the capacity to improve both
short- and long-term operational management deci-sions and plans.
More recently, modeling capabilities for opera-tional management of streamflow regulation struc-tures have expanded to include mathematical op-timization models and—in a few instances—online,real-time models used for controlling major por-tions of a system’s operation. Some simulationmodels have also been expanded to analyze eco-nomic, institutional, and environmental factors.However, data acquisition (particularly for real-time operation) and model calibration are substan-tial obstacles to widespread use of the models cur-rently available for large systems; many operatingentities do not have sufficient computer capabilitiesand personnel to use the most sophisticated modelsavailable for onsite operational decisions.
Instream Needs
Determining instream flow needs differs fromother water availability problems in that instreamflow needs are frequently linked to water qualityrather than water quantity requirements. The twomost common purposes for establishing instreamflow requirements are to preserve and protectaquatic and riparian ecosystems, and to complywith statutory, contractual, or institutional obliga-tions to maintain the necessary streamflows.
The common practice of specifying instreamneeds in terms of water volume dates back to theearliest days of water resource development in thiscountry, when allocating water to meet these needswas labeled ‘‘low-flow augmentation. While it wasrecognized that many of the objectives of low-flowaugmentation were related to water quality char-acteristics rather than to water quantity per se, vir-tually all of the analytic techniques available forplanning and managing strearnflow regulation werequantity oriented,
In the mid-1960’s, knowledge of water quantity/water quality relationships and computer model-ing capabilities simultaneously reached the pointwhere it became possible to model many importantwater quality characteristics in reservoirs andstreams. The first such models dealt with the twobest understood quality characteristics—tempera-ture and dissolved oxygen. These two characteris-
128 ● Use of Models for Water Resources Management, Planning, and Policy— — — —
tics were considered to be particularly importantbecause they are involved in virtually all physical,chemical and biological processes occurring instreams.
By the early 1970’s existing models were capableof assisting planning efforts to meet instream needsbased on water quantity requirements, and provid-ing information for some policy and regulatory as-pects of instream-needs analysis. However, theavailable models could not, in most cases, produceresults commensurate with requirements for opera-tional management. New models that show prom-ise for meeting the requirements for managementdecisions have recently begun to appear.
The role of models in policy and regulation ofinstream flow is limited by a lack of knowledgeabout the qualities of instream flow required to en-sure the survival of fish, wildlife, and other aquaticand riparian biota. Many existing instream require-ments are based on extremely limited informationconcerning biological survival and tolerances. Mostexisting standards establish a single value for in-stream needs, so that in essence a pass-fail condi-tion exists. In policy and regulatory work, tradeoffsare critical components of analysis, and tradeoffanalysis is severely hampered when degrees of suc-cess and failure cannot be analyzed. Improved un-derstanding of relationships between instream flowand biotic life would greatly enhance the utility ofexisting models in policy and regulatory areas.
Water Use Issues
Domestic Water Supply
Domestic water suppliers in this country usual-ly assume a utility responsibility —i.e., that of aregulated monopoly— in their service area. In ef-fect, they agree to provide services to all users withinthe service area according to an established ratestructure, and to assure, insofar as possible, thatthe service is equally available and dependable forall users. This does not preclude the possibility ofestablishing service classes or priorities for variouscategories of users (e. g., differentiating betweenpurely domestic use and industrial use), but suchpractices are much less common in the water supplyindustry than in the electric power industry. Be-cause of this ‘ ‘utility’ philosophy, water agencies
have traditionally worked much harder to secureadditional supplies than to control or managedemands.
In many instances, domestic water use projec-tions have consisted solely of projecting changes inpopulation and applying established per capita de-mand factors to the projected future population.In some cases projections have been somewhatmore sophisticated. Some analysts recognize thatper capita consumption is affected by changes indemography, technology, and lifestyles, and at-tempt to adjust current per capita consumptionestimates to reflect anticipated changes in these fac-tors. However, only a modest amount of data isavailable on which to base such adjustments.
As growth in domestic demands and competinguses diminish the relative availability of water,water utilities will have to develop and evaluate al-ternatives for obtaining additional supplies, or strat-egies for allocating available supplies among com-peting users. Models can be used to establish pric-ing policies, user priorities, and other economic andtechnological aspects of system expansion. Modelscan also play a useful role in examining the likelyresponses of various sectors (domestic, commercial,municipal, and industrial) to strategies that mightbe used to achieve targetted reductions in use.
If priority use and pricing systems come intowidespread use, models will be needed to assist indetermining the conditions under which use priori-ties should be implemented, and the amounts ofwater that should be made available to each userclass.
When additional supply capacity is deemed nec-essary, models can be used for planning efforts todevelop and expand water distribution systems.These models focus primarily on the hydraulics andeconomics of the distribution system itself ratherthan on water use characteristics.
Irrigated Agriculture
Model use in the area of irrigated agriculture hasa relatively long history, and has grown more rapid-ly and is more widespread than for other water uses.Since irrigation occurs primarily where rainfall isdeficient, farmers have had to be more consciousof the importance of water and of the need to man-
Ch. 6—Modeling and Water Resource Issues 129
age a limited supply. Uses of models have rangedfrom determining the need for irrigation water andtiming applications for specific crops, to develop-ing policies for allocating water among users intimes of water shortage. Models are also used toplan, design, and operate water distribution systemsfor large irrigation projects.
Some of the models available for planning andoperational management of irrigation water are ex-tremely sophisticated. They enable users to con-sider water requirements of individual crops overan entire growing season or for specific intervalswithin the growing season. The models can alsogage the effect of precipitation on the amount andtiming of needed irrigation water. Some of the mostsophisticated models permit users to consider op-tions to defer applying water or to reduce theamounts of water applied during periods of watershortage. These models provide information on therisks of crop failure or the likelihood of reduced cropyields, thereby helping farmers to apportion limitedsupplies among various crops. Such models alsoprovide information on the economic consequencesof buying and selling water entitlements.
The availability of these models to farmers in-volved in irrigated agriculture will be even moreimportant in the future, as competition between ir-rigation and other nonagricultural water uses in-creases in the Western States.
Other Offstream Uses
Water is also used for such purposes as coolingin thermal electric power-generating plants; proc-ess water and cooling in coal gasification, shale oilproduction and other energy extraction and conver-sion processes; hydraulic mining; and for use as atransport medium in slurry pipelines. Many ofthese uses require withdrawals of large quantitiesof water from rivers and streams. In some cases(e. g., evaporative cooling, slurry pipelines, and in-terbasin transfer) not only are the withdrawalslarge, but the use is “consumptive’ ‘—i.e., the waterwithdrawn is lost from the stream system fromwhich it was withdrawn. In other cases (e. g., once-through cooling, mineral extraction, and energyconversion), while withdrawals are relatively large,the use is not consumptive because the water even-tually returns to the stream after use. In some of
these cases, however, the quality of the returnedwater is substantially altered and the water may notbe fit for many other uses.
Models are currently available to assess the ef-fects of offstream uses on water quantity and toassess such common water quality characteristicsas temperature and dissolved oxygen changes.However, improvements in models are needed forassessing the economic and environmental implica-tions of water withdrawals and potential water qual-ity changes due to offstream uses.
Policy and regulatory functions are greatly af-fected by the lack of adequate modeling capabilityin this problem area. The volume of some proposedoffstream uses—e. g., coal gasification or liquefac-tion and oil shale processing—is so large that deci-sions regarding them are likely to affect the econ-omies and ecologies of large regions and involvea considerable number of governmental jurisdic-tions. Information from models would be of greatvalue in resolving the controversies and inter-jurisdictional disputes that will inevitably arise.
Efficiency and Conservation
Models for dealing with water use efficiency andconservation are considerably different from modelsused in other aspects of water management. Withthe exception of irrigated agriculture, water usersin this country have not emphasized efficiency andconservation except during periods of critical watershortages. Consequently, there is no substantialbody of knowledge regarding efficiency and con-servation strategies and their economic, social, andenvironmental consequences. Some data exist onspecific conservation practices and their effects inisolated pilot programs under ‘ ‘normal’ conditions,and some data exist on a wide range of conserva-tion practices and effects under emergency condi-tions. However, it is doubtful that the existing database and knowledge (other than for irrigated agri-culture) provides a sufficient basis for developingthe models needed for policy and planning func-tions.
Pertinent economic models—e, g., models to de-termine the effects of water pricing on use—arediscussed in “Social and Economic Models” of thischapter.

130 . Use of Models for Water Resources Management, Planning, and Policy
Evaluation of Currently AvailableSurface Water Flow and
Supply Models
model applications; for example, under the issueof ‘flood forecasting and control, the capabilitiesof models vary for the seven applications addressed.Models are rated from A to F, with A indicatingthat modeling for this purpose does a good job in
Table 7 presents evaluations of currently avail- supplying the needed information, and F indicatingable surface water flow and supply models. Each that the state of the modeling art for this purposewater resource issue is subdivided into specific is generally unsatisfactory.
Table 7.—Surface Water Flow and Supply Model Evaluation
OverallIssue Information required for applications rating
Water avaiiabiiity:1. Flood forecasting and control
2. Drought and low-flow riverforecasting
3. Streamflow regulation(including reservoirs)
4. Instream flow needs:Fish and Wildlife
Recreation
Navigation
Hydroelectricity
Water use:5. Domestic water supply
6. Irrigated agriculture
7. Other off stream uses
8. Water use efficiency
a. Flood peaks for channel and bridge designb. Flood hydrography for reservoir design and operationc. Simultaneous flood hydrography for flood control system design and operationd. Flood depth mapping for flood plain land-use planninge. Effects of land use on downstream flows for upstream land-use planningf. Flood peaks after dam failures for emergency preparedness planningg. Soil moisture conditions for land drainage design
a. Low river flows for off stream usesb. Timing of drought sequences for estimating cumulative economic impactc. Soil moisture conditions for precipitation-supplied uses
a. Runoff volume for maximum obtainable yieldb. Runoff time patterns (within and among years) for reservoir sizingc. Simultaneous runoff volumes in regional streams for regional
water supply planning
a. Low river flows for estimating fish support potentialb. Within-year timing of low flows for fish Iifecycle matchingc. Timing of drought sequences for estimating minimum reservoir or lake levelsd. Flow velocities within streams for estimating effects on fish speciesa. Low river flows for sustaining recreation capacity and esthetic appealb. Timing of flow sequences for matching with recreation periodsc. Runoff time patterns (within and among years) for estimating the impact of
fluctuations in lake levelsa. Low river flows for determining waterway capacityb. High river flows for determining navigation interferencec. Formation of surface ice for determining navigation interferencea. Timing of flow sequences for estimating run-of-the-river
generating capacityb. Runoff time patterns (within and among years) for designing
streamfiow regulationsc. Simultaneous runoff volumes in regional streams for regional generating
system planning
a. Timing of water use for delive~ system designb. Water pressures throughout delivery system for delivery system designc. Volume of use for sizing supply facilitiesd. Return flow volumes for designing wastewater collection systems
a. Timing of water use for delivery system designb. Volume of use for sizing supply facilitiesc. Return flow volumes for drainage system design
a. Volume of industrial use for sizing supply facilities
a. Effect of increased use-efficiency on return flows for evaluatingconservation measures
BccccDc
cBc
AB
c
cBBccB
BccD
B
B
c
DcBc
cBB
B
cRating Key:
A Modeling of the physical process at the current state-of-the-art does a good job in supplying the needed information.B Information between adequate and good.C Modeling does an adequate job for most purposes.D Information between unsatisfactory and adequate.F The supplied information is generally unsatisfactory.
SOURCE: Office of Technology Assessment.

Ch. 6—Modeling and Water Resource Issues ● 131
SURFACE WATER QUALITY
Introduction
Billions of dollars are spent annually in theUnited States to protect the quality of surfacewaters. Unless carefully managed, residual wastesfrom municipalities, industry, and agriculture canseriously interfere with many beneficial water re-source uses. Water quality models are used exten-sively in Federal, State, and local efforts to main-tain and improve the quality of the Nation’s sur-face waters.
Water quality models serve two general func-tions. The first is to provide basic scientific insightand understanding about the relationships betweenmaterial inputs and water quality changes. Theserelationships are expressed in the form of mathe-matical equations that interrelate and synthesize ob-servations. The second function is of an engineer-ing nature. Once confidence in these relationshipsis obtained, the equations can be used to helpmanage, plan, and make policy. Given the presentstate of scientific knowledge and engineeringdevelopment, existing models can generally pro-vide a limited basis for water quality decision-making.
Mathematical models of water quality are mostfrequently used for planning, to some extent forpolicymaking, and to a lesser degree for day-to-dayoperations and management. Their most commonuse is to determine the degree of treatment requiredfor a specific wastewater discharge in order toachieve or maintain a desired receiving water quali -ty. Other uses include determining the magnitudeand effects of urban runoff, and assessing the ef-fectiveness of alternative measures for preventingsoil erosion and the resulting sedimentation withinwater bodies.
Because models simply quantify existing scientif-ic knowledge about water quality, a basic under-standing of the processes that underlie model equa-tions and assumptions is helpful in assessing modelcapabilities. The next section, ‘ ‘Types of ModelsUsed in Surface Water Quality Analysis, describesthe current state of scientific knowledge about deter-minants of water quality, and examines how wellthis knowledge is incorporated into present water
quality models. Later, the state of the art of waterquality modeling is discussed on an issue-by-issuebasis, analyzing 10 major problems under the gen-eral categories of point and nonpoint pollutionsources. The section entitled ‘‘Evaluation of Cur-rently Available Surface Water Quality Models’assesses currently available model types. Evalua-tions are made both according to the characteristicsof the models themselves, and for the 10 majorproblems to which they may be applied.
When considering water quality concerns, fourbasic questions face the analyst:
1. What is the quantiy and quality of the water andresiduals coming from each point and non-point source?
2. How are these materials transported to thereceiving waters?
3. How are these wastes transported within thereceiving water?
4. What processes transform waste residuals with-in a water body?
Given the response of the system, the analystmust further consider the following quest ions:
●
●
●
●
What deleterious effects do these wastes haveon beneficial uses?Do existing standards reflect the magnitudeof the effects?What control alternatives are available, howwell do they perform, and how much do theycost?Are these control alternatives politically, eco-nomically, and esthetically feasible?
All of the above information is needed for man-agement, planning, and policy decisions. Modelsare available, in varying degrees of detail and ac-curacy, to help the analyst address each of thesequestions.
The common basis for the majority of water qual-ity models is the principle of ‘‘mass balance.Water and any material inputs from natural or hu-man sources are followed: 1 ) from their point oforigin; 2) as they travel to the water body; and3) as they travel within the water body. The modelsaccount for biological, physical, and biochemical

132 . Use of Models for Water Resources Management, Planning, and Policy
reactions that occur, and additions of water or ma-terials.
To run these models, users must provide quanti-tative estimates of the characteristics of the water-shed and the receiving water body. Source quanti-ties, constituents, and other pertinent characteristicsmust be enumerated, and the numerical coefficientsthat describe the above reactions must be known.
Water quality models have one aspect that is botha vice and a virtue—most provide an absolute nu-merical value for any given variable such as the con-centration of a pollutant. While it is desirable tohave such a number, often no indication of thepossible error is given. In practice, most waterquality projections are subject to large errors andmust be validated with field observations.
However, water quality models are still very use-ful in planning contexts, for example, because rel-ative effects of control alternatives can be analyzedwith sufficient confidence for many purposes. Mod-el projections, when combined with the professionaljudgment of water resource analysts, are often thebest information available to aid the decisionmakerin evaluating alternatives.
Types of Models Used in SurfaceWater Quality Analysis
All water bodies are affected by inputs from nat-ural sources and human activities. The accuracywith which models can estimate relationships be-tween these inputs and the water quality responsedetermines their utility for management, planning,and policy purposes. Thus, current levels of scien-tific and engineering knowledge about these rela-tionships form the basis for assessing surface waterquality models.
Water quality models can be divided into threecomponents that describe:
● source of materials;● transport to and within the receiving water;
and● processes occurring within the receiving water;
The first component estimates the inputs of sub-stances through human activities and natural phe-nomena; the second, the hydrologic and hydro-
dynamic regime of the water body and its water-shed; and the last, the biological, chemical, andphysical processes that affect water quality.
Source of Materials
Water bodies may receive point source dischargesfrom municipal, industrial, and agricultural activ-ities; dispersed or nonpoint source runoff from thesesame areas; natural inputs from undisturbed water-sheds; and additional chemicals from rainfall.
The chemical characteristics of effluents frommunicipal sources are well known with respect toboth average values and their variations. This isalso true for many industries that generally pro-duce one or a few products, such as the pulp andpaper, canning, and steel industries. However, in-dustries that produce a variety of products, suchas organics, synthetic chemicals, and pharmaceuti-cals, produce discharges that are more difficult tocharacterize.
Information on agricultural and feedlot sourcesof waste is meager, but has been improving in re-cent years. Irrigation return waters pose difficultproblems, particularly in the mid- and far-westernregions of the country where high background con-centrations of salts of natural origin prevail. Thetime-variable nature of return flows, which are bothpoint and distributed, introduces additional com-plexities. Our social and scientific awareness ofthese problems is relatively recent; consequently,the historical data on these sources are minimal,and many gaps remain in current knowledge of thegoverning phenomena.
The ability to quantify pollutant loadings froma variety of sources is critical, particularly withrespect to differentiating between point sources,which are readily controllable, and nonpointsources, which are relatively difficult to identify andcontrol. Assigning realistic values to distributednonpoint sources is very difficult, given the pres-ent state of knowledge and data, Current modelsprovide at least some assessment of the problem.
The most significant information gap lies inquantifying toxic substances from nonpoint sourcesor from residues of toxic materials created by pastactivities, e.g., from riverbeds and from landfillsthat leach into water systems.
Ch. 6—Modeling and Water Resource Issues ● 133
Transport to and Within Receiving Waters
Point discharges are transported by pipes, openchannels, or other conveyance devices from thepoint of origin to the receiving water on a regularbasis. Nonpoint discharges move through stormdrainage systems, via overland flow, and throughsubsurface flow to the receiving water as a resultof rain events. Consequently, the quantities ofmaterials entering water bodies from nonpointsources are much more difficult to predict.
Most surface water quality models include a sur-face water flow submodel as part of the program,since in most cases it is necessary to predict runoffand flow quantities before making quality estimates.Many of the models discussed in the previous sec-tion on surface water flow are used as componentsof surface water quality models.
Pollutant transport by rivers and streams is, ingeneral, better understood than transport withinlakes. Transport in streams depends primarily onflowing water; within lakes, and some complex riversystems, movement of pollutants occurs by diffu-sion and dispersion as well—difficult processes tomodel. In addition, a longer and more extensivedata base is available for streams than for lakes.
Transport in streams can be approximated bysimple one-dimensional models—the one dimen-sion being the direction of flow. Under certain con-ditions, simple models can adequately simulatetransport in lakes, but often more complex two- andthree-dimensional models are necessary. The stateof knowledge and computational techniques aresuch that only the most proficient analysts can usethese models.
The above remarks apply to situations that arenot highly time dependent. When water qualityanalysis must incorporate such factors as stormsurges from combined sewers or rapidly changingriver flows, the models must be considerably morecomplex. These models are still in the developmen-tal stage and their results are only marginally usefulat present.
Processes Occurring Withinthe Receiving Water
In general, the chemical, physical, and biologicalprocesses of rivers and streams are better modeled
than those of lakes. In addition, more extensive wa-ter quality data exist for rivers and streams, par-ticularly for such constituents as dissolved oxygenand coliforms (bacteria used to indicate the pres-ence of sewage).
Eutrophication (excess algae or aquatic weedgrowth) is another widespread problem. The nutri-ents that cause eutrophication originate from a vari-ety of municipal, industrial, agricultural, and natu-ral sources. While the state of the art permits somemodel-based assessment, data requirements are soextensive that these techniques are often imprac-tical. Simplified approaches, involving the nutrientsphosphorus and nitrogen, presently yield resultsthat may be indicative and, in certain cases, ade-quate for the intended purpose.
For inorganic and organic chemical water qual-ity, the present state of knowledge is mixed. Thebiochemical reactions of certain industrial chemicalsare sufficiently understood to permit the develop-ment of reliable models. This is true for a widerange of chemical compounds of relatively simplestructure, which are commonly present in industrialeffluents and which are susceptible to the present-ly available treatment processes. While the reac-tions involving metals are not as well understoodas those of the simple industrial chemicals, theyhave been developed to a degree that will permitat least a marginal analysis and projection.
On the other hand, for more complex com-pounds, many of synthetic composition, far less isknown about reactions, byproducts, and removalby present treatment techniques. These substances,which inciude many toxic materials, may be mod-eled with simplifying assumptions, yielding reason-able projections in limited cases. However, on thewhole, current methods of analysis are regarded as
only marginally reliable, A similar assessment ap-plies to complex metals when concentrations ap-proach or exceed toxic limits. Water quality modelsthat analyze these substances are presently beingdeveloped.
A second area of notable uncertainty is the accu-mulation of toxicants in the food chain leading tofish. Much research has been undertaken over thepast decade to advance basic understanding of theproblem, collect data, and develop models, someof which appear to be very promising. Preliminary
134 ● Use of Models for Water Resources Management, Planning, and Policy—— .—
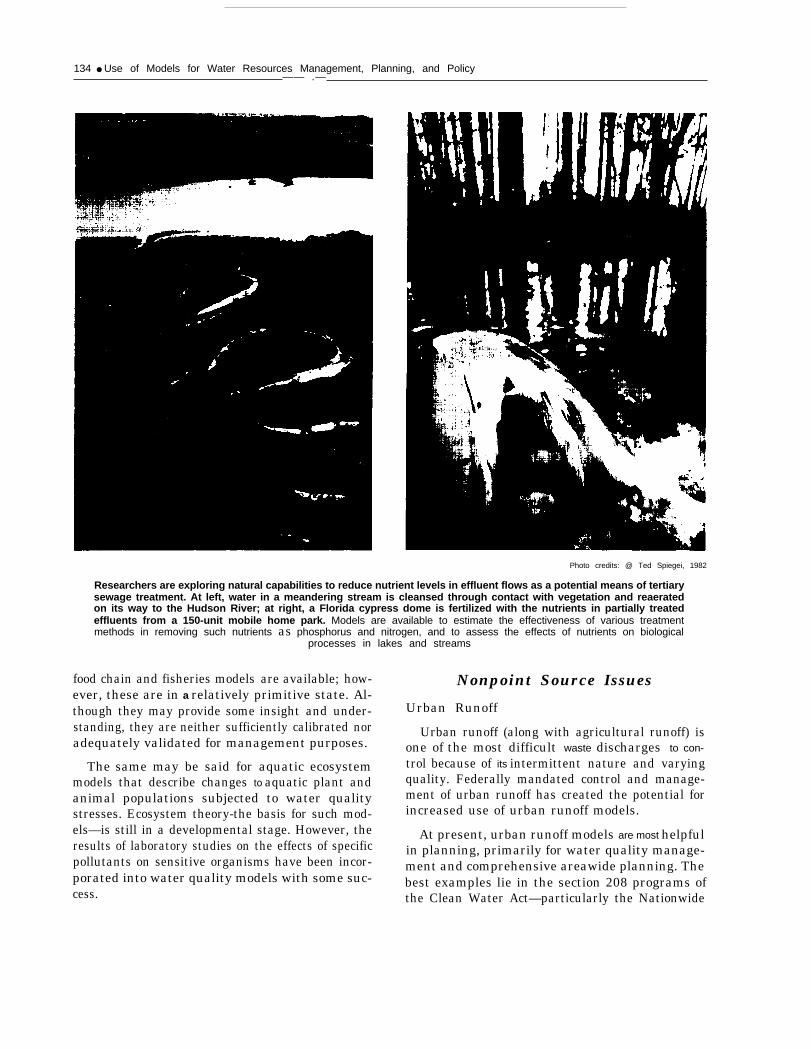
Photo credits: @ Ted Spiegei, 1982
Researchers are exploring natural capabilities to reduce nutrient levels in effluent flows as a potential means of tertiarysewage treatment. At left, water in a meandering stream is cleansed through contact with vegetation and reaeratedon its way to the Hudson River; at right, a Florida cypress dome is fertilized with the nutrients in partially treatedeffluents from a 150-unit mobile home park. Models are available to estimate the effectiveness of various treatmentmethods in removing such nutrients as phosphorus and nitrogen, and to assess the effects of nutrients on biological
processes in lakes and streams
food chain and fisheries models are available; how-ever, these are in a relatively primitive state. Al-though they may provide some insight and under-standing, they are neither sufficiently calibrated noradequately validated for management purposes.
The same may be said for aquatic ecosystemmodels that describe changes to aquatic plant andanimal populations subjected to water qualitystresses. Ecosystem theory-the basis for such mod-els—is still in a developmental stage. However, theresults of laboratory studies on the effects of specificpollutants on sensitive organisms have been incor-porated into water quality models with some suc-cess.
Nonpoint Source Issues
Urban Runoff
Urban runoff (along with agricultural runoff) isone of the most difficult waste discharges to con-
trol because of its intermittent nature and varyingquality. Federally mandated control and manage-ment of urban runoff has created the potential forincreased use of urban runoff models.
At present, urban runoff models are most helpfulin planning, primarily for water quality manage-ment and comprehensive areawide planning. Thebest examples lie in the section 208 programs ofthe Clean Water Act—particularly the Nationwide

—
Ch. 6—Mode/ing and Water Resource Issues 135
Urban Runoff Program. Such planning is designedto provide each State and the Environmental Pro-tection Agency (EPA) with information on pointsource and nonpoint (including urban runoff) treat-ment needs and the effectiveness of treatment meth-ods. Urban runoff models such as EPA’s Storm-water Management Model and the Corps of En-gineers’ STORM can simulate the quantity andquality of runoff from a specified runoff area andcan be used to compare the effectiveness of alter-native control strategies. These models may alsobe linked to receiving water models to gage the ef-fects of urban runoff on receiving water quality.
Urban runoff models can also play an importantrole in Federal and State agency policy decisions.Federal agency construction grants allocations, andrequests for such funds by State agencies, could bebased in part on estimates of the volume and quality
of point source and nonpoint source wastes in aspecific area, the effects of these wastes on thereceiving water, and the effectiveness of nonpointsource control in alleviating the problem.
Urban runoff models do not appear to have at-tained the credibility necessary to be used as regu-latory tools at this time. These models require anextensive local data base, and such information isusually unavailable, except for cities in which spe-cific studies have been performed to develop, cali-brate, and test such models.
Erosion and Sedimentation
Models of erosion and sedimentation are devel-oped primarily by such Federal agencies as theCorps of Engineers, the Soil Conservation Service,the U.S. Geological Survey, and, to a lesser extent,
Photo credit: U.S. Department of Agriculture
Two years of low rainfall on the Big Canyon Ranch near Sanderson, Tex., greatly reduced plant cover levels, settingthe stage for extremely high runoff rates on the draw pictured above after rainstorms hit an area 30 miles away. Plantcover is a major determinant of soils’ abilities to absorb moisture and resist erosion; runoff and erosion models consider
cover levels as one of many factors in estimating flows and sediment transport

136 ● Use of Models for Water Resources Management, P/arming, and Policy
EPA. Extensive use is made of erosion and sedi-mentation models by Federal, State, and local agen-cies concerned with river management. Construc-tion agencies use these models to assist in opera-tional management, e.g., in dredging navigationchannels and operating reservoirs. Sedimentationis a critical factor in reservoir management, as itcan reduce a reservoir’s useful volume. Riverauthorities must have information on rates ofsedimentation and ways of alleviating or mini-mizing sedimentation to operate their reservoirsmost efficiently.
Local, State, and Federal agencies concernedwith forestlands, rangelands, and farmland man-agement continually seek better ways to minimizesoil erosion. They employ models to guide the selec-tion of effective management techniques.
A primary concern is the large amounts of nu-trients (especially nitrogen and phosphorus) con-tained in eroded soils. Soils reaching waterwaysmay impart those nutrients to the water, potentiallycausing nuisance algal growths or other symptomsof eutrophication.
Probably the greatest utility of erosion and sedi-mentation models lies in the area of planning. Forexample, the Corps of Engineers employs suchmodels to plan and design erosion control struc-tures along rivers and coastal areas and to estimatethe extent of sediment accumulation over the lifeof a reservoir. The Soil Conservation Service useserosion models to plan erosion control programson farmlands and forestlands.
Because toxic chemicals often adhere to riversediments, sediment transport models are used topredict the movement and fate of toxicants accident-ally released into waterways. EPA relies on waterquality models incorporating sediment transportsubmodels to follow the transport of Kepone downthe James River to the Chesapeake Bay. The agen-cy is using this information to plan monitoring pro-grams and subsequent mitigation programs, ifneeded.
Salinity
Several factors may cause the buildup of excesssalinity in surface waters. One major source is irri-gation return flows. To maintain a favorable salt
balance in agricultural soils, farmers may apply
more water to their crops than is required for plantproduction. The additional water leaches out ex-cess soil salts that may either flow overland to sur-face waters or percolate to the ground water. Theerosion of soils with high salt contents, such as themarine shales found extensively in the West, andthe input of salts from natural sources, such asbrines, also contribute to excess salinity. Finally,the concentration of salt in surface waters can in-crease due to evaporation, reductions or diversionsin flow, and plant transpiration.
Salinity, as a physical process, is one of the bestunderstood pollution problems, and relatively easyto model, Many models exist to predict salt concen-trations in agricultural drainage as a function ofcrop, soil type, and irrigation practice; downstreamsalinity concentrations; and the effects of excesssalinity on crops, metal deterioration, soap con-sumption, and health. A well-developed data basecomplements these models.
Models are widely used to develop managementstrategies for salinity control. They can providemanagers with information on the effectiveness ofcontrol options for reducing downstream salt con-centrations. In addition, these models are usefulfor evaluating the likely effects of proposed regula-tions. From a planning standpoint, these samemodels are used to develop areawide salinity con-trol plans and can aid in setting funding prioritiesto implement these plans.
In the ares of policy, salinity is an importantaspect of international water rights issues and treatyobligations between the United States and Mex-ico. In particular, the salinity of the Colorado Riverhas been a major international issue for some years.The increase in salinity of the Colorado from salinereturn flows before it leaves the United States isa major problem for water users in Mexico. Modelshave been used to determine whether planned con-sumptive uses from the Colorado Basin will allowthe United States to meet its treaty obligations fordelivering water at or below a specified salinity.
Agricultural Pollutants
Agricultural pollutants are found in runoff fromirrigated and nonirrigated agricultural lands andpastures. The pollutants include soil particles
Ch. 6—Modeling and Water Resource Issues ● 137
eroded from the land; organic substances fromdecaying vegetation, animals, and feedlot waste;nitrogen and phosphorus from commercially pro-duced fertilizers as well as from animal waste; andpesticides that have been applied but are not yetdegraded. These pollutants find their way into near-by receiving streams, where their effects must beassessed.
Agricultural pollutants are generally consideredto originate from nonpoint sources; animal feedlots, however, are considered point sources. Likeother point sources, the latter must be treated tomeet effluent and receiving water standards accord-ing to sections 301 and 303 of the Clean Water Act.Nonpoint sources are eventually to be controlledas well, but standards and guidelines for imple-menting controls have not yet been promulgated.
Mathematical models aid in assessing the in-stream effects of these point and nonpoint sources—such analyses play an important role in regulatingpollution sources. The models for tracking organicmaterials and their effects on oxygen resources instreams are well developed, well documented, andeasily usable by personnel with appropriate analyti-cal skills and knowledge of water quality manage-ment principles. Such models should also withstandthe scrutiny of litigation. Models for nutrients andpesticides, however, are not used as broadly asmodels that predict levels of dissolved oxygen.
Mathematical modeling of agricultural pollutantsfinds extensive use in planning. Models have beenused primarily for section 208 studies of areawidepollutant problems and water treatment needs.Such studies enable States and EPA to establishpriorities for treatment, based on estimates of theeffects of point and nonpoint sources on receivingwaters.
Not only do Federal and State agencies use math-ematical models for the kind of planning mentionedabove, but they also use these models to determinethe effectiveness of treating agricultural pollutants,recommend funding levels to Congress, and pro-pose legislation for controlling agriculturalpollutants. In these cases, mathematical modelsmay be the only means of linking the pollutionsource to effects on the receiving waters—a con-nection that is important in estimating the benefitsof regulatory programs.
i
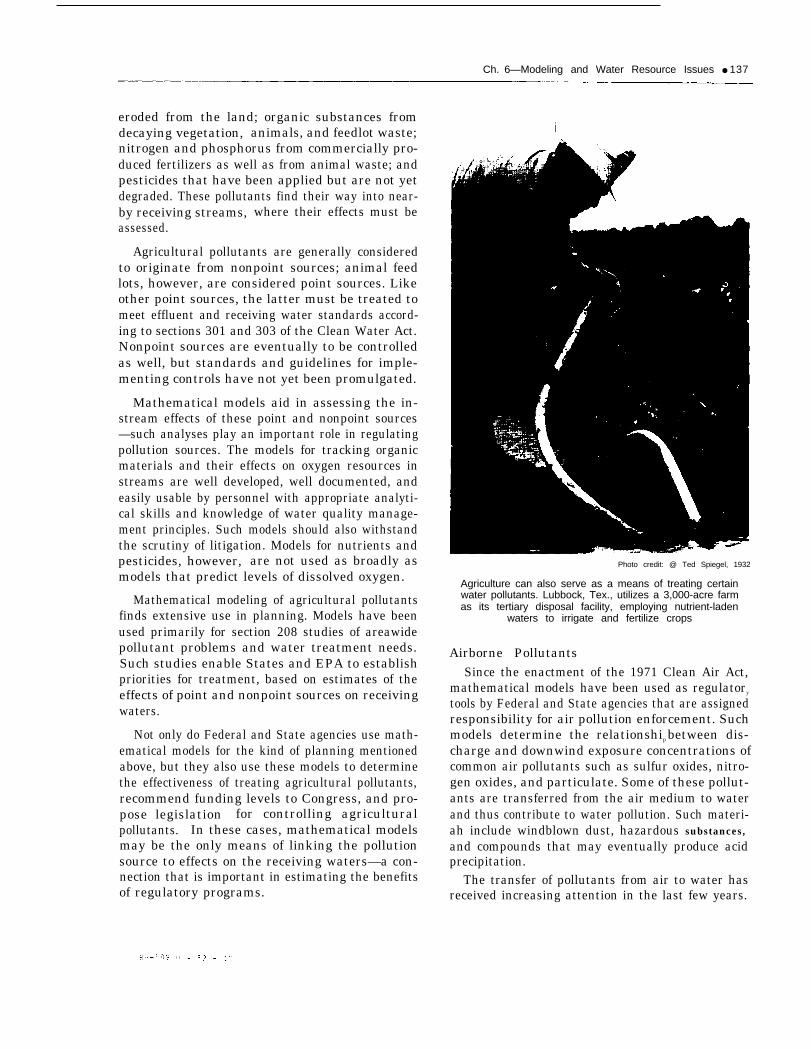
Photo credit: @ Ted Spiegel, 1932
Agriculture can also serve as a means of treating certainwater pollutants. Lubbock, Tex., utilizes a 3,000-acre farmas its tertiary disposal facility, employing nutrient-laden
waters to irrigate and fertilize crops
Airborne PollutantsSince the enactment of the 1971 Clean Air Act,
mathematical models have been used as regulatory
tools by Federal and State agencies that are assignedresponsibility for air pollution enforcement. Suchmodels determine the relationship between dis-charge and downwind exposure concentrations ofcommon air pollutants such as sulfur oxides, nitro-gen oxides, and particulate. Some of these pollut-ants are transferred from the air medium to waterand thus contribute to water pollution. Such materi-ah include windblown dust, hazardous substances,and compounds that may eventually produce acidprecipitation.
The transfer of pollutants from air to water hasreceived increasing attention in the last few years.

138 . Use of Models for Water Resources Management, Planning, and Policy
Hazardous substances in incinerator effluents andwindblown erosion from landfill sites are problemsfor which mathematical models may be used to an-ticipate and formulate control strategies. Modelsof short-range pollution transport (less than 200km) are currently available. The potential conse-quences of acid precipitation, and of the deposi-tion of heavy metals, radioactivity and other haz-ardous materials from powerplant air emissions,may require Federal and State agencies to assessfuture water quality problems resulting from in-creased energy production. Models of long-distancepollution transport, and of atmospheric processesthat may produce acid rain, are in early stages ofdevelopment.
Point Source and General Issues
Wasteload Allocation (Point Source)
Wasteload allocation refers to the process ofdetermining the amount of some waste material thata particular discharger is allowed to release by ana-lyzing the relationship between discharged amountsand resulting concentrations in the receiving water.This cause-effect relationship may be determinedafter the fact through sampling programs, or beforedischarges occur with the help of mathematicalmodels.
Water quality models find their most appropriateregulatory roles in estimating waste treatment needsfor compliance with the Clean Water Act. The actsets forth two criteria for water quality standards:1) effluent requirements for regulating ‘ ‘end-of-pipe” discharges, as specified in section 301 of theact; and 2) receiving water standards, as specifiedin section 303 of the act. Discharges who meet ef-fluent standards may be required to provide fur-ther treatment if resulting waste discharges causehigher-than-acceptable receiving water concentra-tions. Wasteload allocation models determine themaximum allowable level of discharge for individ-ual producers in order for pollutant concentrationlevels in receiving waters to be at or below existingstandards. Removal techniques to meet these limitscan then be selected.
Mathematical models for this procedure are welldeveloped and documented, can be adapted to re-ceiving waters of different types, can be easily usedby regulatory staff, and are reliable enough to with-
stand judicial scrutiny. Waste allocation is par-ticularly complex, however, when a number ofdischarges reach a common receiving water nearthe same point. In such cases, the allowablewasteload can again be determined by a mathemat-ical model, but assigning wasteloads equitablyamong the contributors must be a legal and admin-istrative decision.
Water quality models have been used extensivelyin planning for treatment needs throughout the Na-tion. As part of section 208 of the Clean Water Act,point and nonpoint wasteloads were to be deter-mined for segments of the Nation’s waterways.Mathematical models were used in these cases, firstto estimate current loadings from the point andnonpoint sources, and then to estimate the impactof these loadings on the receiving stream. Basedon the magnitude of these effects, the need forwasteload reduction was determined. Then, basedon the ratio of point source to nonpoint source dis-charges, Federal and State agencies could estimatewhere the greatest water quality improvement couldbe achieved at the least cost.
Probably the most dramatic and exemplary pol-icy-level application of these water resource modelswas undertaken by the National Commission onWater Quality. The commission, mandated byCongress as part of the 1972 Federal Water Pollu-tion Control Act Amendments (Public Law 92-500), undertook a number of assessments of thesocial, economic, technical, and environmental im-pacts of implementing the other sections of the act.Among the commission’s responsibilities were a setof water quality studies to evaluate the act’s im-pact on some 40 specific areas around the UnitedStates. Water quality models were used extensive-ly in these studies and were, in fact, necessary tocarry them out. Study results indicated that the ef-fluent regulations of the 1972 act should be alteredto reflect more realistically attainable levels of treat-ment in the allotted time periods. The work of thecommission contributed to policy changes withinEPA, and influenced congressional formulation andpassage of the 1977 Clean Water Act (Public Law95-21 7), which incorporated many of the commis-sion’s recommendations.
Wasteload allocation models were critical to thecommission’s ability to demonstrate the conse-quences for the Nation’s receiving water quality of

Ch. 6—Modeling and Water Resource Issues ● 139
Photo credit: EPA-DOCUMERICA, Doug Wilson
Untreated water from a pulpmill in Puget Sound, Wash.
implementing the 1972 act. The study also revealedsome shortcomings in then-current modeling capa-bilities, however. Contractors performing work forthe commission relied primarily on dissolved solidsand dissolved oxygen models; models for nutrientsand toxic materials were applied in only a few situa-tions, largely because existing data bases were in-adequate for calibrating and validating them.
Thermal Pollution
Thermal effluents are among those regulated bythe Clean Water Act. Effluent limits have been setfor thermal wastes as well as for allowable temper-ature increases in receiving waters. Zones of influ-ence and resulting temperature increases from ther-mal effluents can either be monitored directly orpredicted with mathematical models.
Mathematical models for thermal wastes rangefrom fairly simple one-dimensional models to morecomplex two- and three-dimensional models. Mostof these models have been developed through thesupport of EPA and the electric utility industry andhave been applied in many locations. Most regula-tory staffs can operate the simpler thermal wastemodels, but the more complex multidimensionalmodels require well-trained staff.
The electric utility industry uses mathematicalmodels extensively in applying for construction andoperation permits for nuclear powerplants throughthe Nuclear Regulatory Commission, and in pre-paring environmental impact statements as re-quired by the National Environmental Poiicy Actof 1969. Under the latter act, the permittee mustshow the extent of the environmental impact of its

140 ● Use of Models for Water Resources Management, Planning, and Policy
facility, in particular the impact of the thermalwaste. Such effects are routinely forecasted by usingmathematical models.
Toxic Materials
Compounds that cause some injury to humansor other organisms of concern are classified as toxicmaterials. Such materials are not necessarily lethal,but may be compounds that produce such sublethaleffects as cancer, birth defects, or reproductivefailure.
Toxic materials are regulated under several stat-utes, including the Clean Water Act, the ToxicSubstances Control Act of 1976 (Public Law94-469), the Resource Conservation and RecoveryAct of 1976 (Public Law 94-580), and the SafeDrinking Water Act of 1974 (Public Law 93-523).Regulation under this last act is discussed in thesection entitled “Ground Water Quantity andQuality. ” Although control is focused on technol-ogy-based standards, mathematical models havepotential roles in enforcing portions of these acts.As with other pollutants, effluent requirements havebeen established for point sources based primarilyon removal techniques. However, receiving watercriteria must be met as well. Modeling for toxicmaterial concentrations may be required at somefuture time to determine further treatment needsif receiving water standards are not being met.
While legislation exists for control of nonpointsource toxicants, implementation has been givenlow priority. As controls are applied, however,ground and surface water quality models could playan important role in determining the cost effec-tiveness of alternative control measures, Mathemat-ical models can also be used to design monitoringnetworks so that stations can be best located andsampled to gain maximum information from moni-tormg.
As with other issues, mathematical models fortoxic materials have greatest utility in the planningprocess. Models can be used to anticipate problems,and to test different management approaches forremoval effectiveness and managerial efficiency.Since regulations for controlling liquid and gaseoussources of toxic substances are currently being im-plemented, and those for hazardous solid wasteshave recently been issued, models for planning
long-term toxic material control should find wide-spread application.
Drinking Water Supply
The Safe Drinking Water Act is the principalFederal legislation regulating the quality of drink-ing water. It, along with State statutes and localordinances, regulates the quality of public drink-ing water. Regulations apply to water quality atthe end of the treatment process; consequently,streamwater quality models have no roles per sein regulating drinking water under this act. How-ever, toxicology models, which relate concentrationsof various hazardous substances to human healthrisks, are used to aid in setting standards. Thesemodels use differing methods for extrapolating datafrom animals to humans, so that resulting estimatesof human risk may diverge widely. The OTA re-port, Technologies for Determining Cancer Risks Fromthe Environment, provides an assessment of toxicologymodels.
The quality of the raw water is an important fac-tor in supplying high-quality water for human con-sumption. Where raw waters are degraded by up-stream users, water quality models can be used topredict water quality at the point of intake to deter-mine the level of treatment needed. In particular,water quality models are used in determining whenintakes should be closed due to contaminants origi-nating upstream. For example, a spill of carbon tet-rachloride in the Ohio River several years agoforced water users downstream to close intake struc-tures at appropriate times to avoid contaminatingthe water supply. Models were used to predict whenand how long the carbon tetrachloride would be inthe vicinity of the intake structures.
Water Quality Impacts on Aquatic Life
Models for predicting water quality impacts onaquatic life involve two steps: 1 ) estimating concen-trations of those materials that may affect aquaticlife (positively or negatively), and 2) comparingcalculated concentrations with accepted criteria tojudge the consequences of those concentrations tothe ecosystem. This latter step is seldom incor-porated into the model structure, and requires pro-fessional judgment by aquatic ecologists.
Ch. 6—Modeling and Water Resource Issues ● 141
The models used to assess impacts can vary fromvery simple models for calculating the effects of con-centrations of selected materials, to very complexmodels incorporating several different types ofpollutants and their effects on numerous organisms.The complex models are the least reliable, due tothe lack of data to support many of the necessaryassumptions and the great difficulty in calibratingand validating them. Both types of models requireconsiderable professional judgment in applying theresults to field situations.
Models to determine water quality impacts onaquatic life are primarily of value in the planningprocess. This is due to the kinds of applications thatcan be made of these models, the current state oftheir development, and the number of areas forwhich data are adequate to apply them.
Aquatic life impact models can be usefully ap-plied if a theoretical analysis of the aquatic systemis coupled with coefficients derived from controlledlaboratory experiments. Examples include modelsof the movement and effects of Kepone in the JamesRiver, of polychlorinated biphenyl (PCBS) in theHudson River, and of PCBS in the Great Lakes.Both the Kepone and PCB models facilitate impactassessment by allowing researchers to compare ex-posure concentrations to tolerable levels, while theP(2B models can predict alterations in populationsif toxic interactions are included. These modelshave been used to forecast the effectiveness of alter-native remedial actions, and thus help provide abasis for future regulatory activities.
Evaluation of Currently AvailableSurface Water Quality Models
A model’s level of complexity and its degree ofavailability provide the basis for a simple schemeof classification. Accordingly, four generic types ofmodels are outlined below, and their basic capabil-ities are summarized. In the evaluation table (table8), these four generic model types are rated accord-ing to their utility in analyzing five major aspectsof each of the 10 issue areas discussed above. Theevaluation table also assigns an overall rating formodeling sophistication in each issue area. Usinga potential scale of zero to 10, actual assignedratings range between 1 and 9, indicating the
uneven level of current modeling capability for sur-face water quality analysis.
Type Z is a standardized procedure or techniquethat may be routinely performed without a com-puter. It involves simple mathematical equations,statistical techniques, and graphical procedures. Ex-amples include use of the Streeter-Phelps streammodel for evaluating dissolved oxygen down-stream of point sources (although this is often pro-gramed into complex models), and evaluating lakeeutrophication potential with diagrams or regres-sion equations. While the procedure does not in-volve a computer, it is not necessarily unsophisti-cated. On the contrary, some ‘‘desktop’ proce-dures are mathematically quite sophisticated,whereas some complex digital computer models arenothing more than a programed version of intui-tion. Finally, a Type I model may still require con-siderable time and effort and the use of computa-tional aids (e. g., hand calculators) to be fully oper-ational.
Type II is a computerized version of a Type Imodel. This may avoid the tedium of routine calcu-lations and greatly expand the amount of data thatcan be processed. The level of complexity of theanalytical technique, however, is still low.
Type III is a procedure that is sufficiently com-plex that a computer is required for its use. Suchmodels generate numerical solutions for sets ofmathematical equations that could not be solvedprior to the advent of modern computers. Manyindividuals, consultants, universities, industries,and public agencies have constructed such models.
Type IV is the same as a Type III model exceptthat it is termed operational, meaning: 1) documen-tation (e. g., user’s manual, description, and theory)is available; 2) the program has been well testedand its credibility established by groups other thanthe model developer; 3) the program is availableand accessible to interested users (this does not pre-clude proprietary models); and 4) user support isavailable either from the model developer or fromother groups. Although several hundred large waterquality models are described in the literature, less
than 100 can be termed operational. A Type IVmodel can thus be used by others with relative ease.

142 ● Use of Models for Water Resources Management, Planning, and Policy
Table 8.—Surface Water Quality Modei Evacuation
Generic type
IvI II Ill Computer, Overall level
No computer, Computer, Computer, complex,Issue
of modelingnot complex not complex comDlex operational sophistication
Nonpolnt source pollution and land useUrban runoff:
Source/generation. . . . . . . . . . . . . . . . . . . . . . . . . . . . . .Transport to receiving water. . . . . . . . . . . . . . . . . . . . .Transport in receiving water. . . . . . . . . . . . . . . . . . . . .Impacts on beneficial use. . . . . . . . . . . . . . . . . . . . . . .Control options/costs. . . . . . . . . . . . . . . . . . . . . . . . . . .
Erosion and sedimentation:Sourcelgeneratlon. . . . . . . . . . . . . . . . . . . . . . . . . . . . . .Transport to receiving water. . . . . . . . . . . . . . . . . . . . .Transport in receiving water. . . . . . . . . . . . . . . . . . . . .Impacts on beneficial use. . . . . . . . . . . . . . . . . . . . . . .Control options/costs. . . . . . . . . . . . . . . . . . . . . . . . . . .
Salinity:Source/generation. . . . . . . . . . . . . . . . . . . . . . . . . . . . . .Transport to receiving water. . . . . . . . . . . . . . . . . . . . .Transport in receiving water. . . . . . . . . . . . . . . . . . . . .Impacts on beneficial use. . . . . . . . . . . . . . . . . . . . . . .Control options/costs. . . . . . . . . . . . . . . . . . . . . . . . . . .
Other agricultural runoff:Source/generation. . . . . . . . . . . . . . . . . . . . . . . . . . . . . .Transport to receiving water. . . . . . . . . . . . . . . . . . . . .Transport in receiving water. . . . . . . . . . . . . . . . . . . . .Impacts on beneficial use. . . . . . . . . . . . . . . . . . . . . . .Control options/costs. . . . . . . . . . . . . . . . . . . . . . . . . . .
Airborne pollutants:Source/generation. . . . . . . . . . . . . . . . . . . . . . . . . . . . . .Transport to receiving water. . . . . . . . . . . . . . . . . . . . .Transport in receiving water. . . . . . . . . . . . . . . . . . . . .Impacts on beneficial use. . . . . . . . . . . . . . . . . . . . . . .Controi options/costs. . . . . . . . . . . . . . . . . . . . . . . . . . .
Water quality (other than nonpoint sources and land use)Wasteioad allocation:
Source/generation. . . . . . . . . . . . . . . . . . . . . . . . . . . . . .Transport to receiving water. . . . . . . . . . . . . . . . . . . . .Transport in receiving water. . . . . . . . . . . . . . . . . . . . .Impacts on beneficial use. . . . . . . . . . . . . . . . . . . . . . .Controi options/costs. . . . . . . . . . . . . . . . . . . . . . . . . . .
Thermai poiiution:Source/generation. . . . . . . . . . . . . . . . . . . . . . . . . . . . . .Transport to receiving water. . . . . . . . . . . . . . . . . . . . .Transport in receiving water. . . . . . . . . . . . . . . . . . . . .impacts on beneficial use. . . . . . . . . . . . . . . . . . . . . . .Controi options/costs. . . . . . . . . . . . . . . . . . . . . . . . . . .
Toxic materiais:Source/generation. . . . . . . . . . . . . . . . . . . . . . . . . . . . . .Transport to receiving water. . . . . . . . . . . . . . . . . . . . .Transport in receiving water. . . . . . . . . . . . . . . . . . . . .Impacts on beneficial use. . . . . . . . . . . . . . . . . . . . . . .Controi options/costs. . . . . . . . . . . . . . . . . . . . . . . . . . .
Drinking water quaiity:Source. . . . . . . . . . . . . . . . . . . . . . . . . . . . . . . . . . . . . . . .Treatment. . . . . . . . . . . . . . . . . . . . . . . . . . . . . . . . . . . . .Impacts on beneficial use. . . . . . . . . . . . . . . . . . . . . . .
Water quality impacts on aquatic iife. . . . . . . . . . . . . . .Key: A Reliable, credibie modeling may bereadily used for most problems ofthis subissue. Some models maybe suitable forreguiation and design,
B Same as C, but some models may beuseful for planning andrelated purposes, and suitabie for determining relative effects.C Modeling lspossible. Credibility andreliability of results is Iowdueto weaknesses in the database.— Modeling of this type is not usually performed.
Overall level of modellng sophistication:O No models available.
10 Routine use of models of all types,
c—
;B
:BBA
AAABA
c——cB
AAccA
AAAcB
AA
:A
c—
zc
A
;B
cAccB
c————
AAAc—
cBccB
AAccA
AAAcB
c————
————
BABcB
ccc——
AAAc—
BABcB
ABccA
AAAcB
AAAcA
ccccc
cc—B
4c————
——A—
9
—3
BA
:B
6AB——A
7
9AAAcA
1ccc——
2———B 3

Ch. 6—Modeling and Water Resource Issues ● 143
It is not possible to state categorically that onetype of model is to be preferred over another—inparticular that a Type IV model is to be preferredover a Type 1. The appropriateness of an analyticaltool depends on the particular problem and objec-tives of the analysis. In the most general terms,Type III and IV models have greater potential foraccuracy and credibility than do Type I and II mod-els. But there are many instances in which data andtheoretical formulations are so lacking that the useof a complex computerized model is simply not war-ranted, even if one already exists. For example, thefate of toxics in the environment is of immediateconcern to the public, but the various parametersand coefficients that describe the sources, sinks, andtransformations of these chemicals are so ill-definedthat the sophistication of toxic model formulationsfar outstrips the present data base. Simpler proce-dures are often much more credible.
The evaluation table presents a summary of in-formed opinion regarding the utility of models inanalyzing specific issue areas. Overall, models are
currently judged most successful for the issues ofsalinity, wasteload allocation and thermal pollution.The weakest issue is toxics, due mainly to the lackof data necessary to determine the changes thesesubstances undergo in receiving waters.
Successful modeling for a given issue requiresa good deal more than the application of sufficientmodeling expertise. To model the governing prin-ciples of physical processes, the principles them-selves must be well understood. Scientific under-standing of biochemical phenomena related to waterquality is not sufficiently advanced to permit highlyaccurate modeling; the governing principles of tem-perature, on the other hand, are relatively well doc-umented. Data constraints place a further limita-tion on the utility of models—processes that arethoroughly understood can be accurately modeledonly if data are available to predict conditions forthe location under study. This evaluation accountsfor these factors in assessing model utility, ratherthan simply assessing the state of the modeling artin itself.
GROUND WATER QUANTITY AND QUALITYIntroduction
Ground water systems, unlike surface water sys-tems, are completely concealed from view; conse-quently, conceptual, physical, or mathematicalmodels are the only way to achieve an understand-ing of their potential yields and responses to naturalor man-related stresses. Simple ground water prob-lems may be analyzed using physical hydraulic con-cepts and assumptions, perhaps expressed in sim-ple paper calculations. However, more complex ap-plications require the use of large amounts of data,gathered from multiple test wells at many differenttimes. The only way to integrate this informationinvolves using computers that are capable of solv-ing hundreds or even thousands of complex mathe-matical expressions simultaneously.
Public agencies that issue water use permits orotherwise manage regional ground water resourcesmust rely on models to forecast effects of groundwater use. Applications range from day-to-daymanagement of a community’s ground water use
to long-range Planning for maximizing the utilityu .
of an entire aquifer. Models can be designed, forexample, to calculate how pumping from a new wellmight affect local ground water levels, or to predicthow far contaminants might move in a given periodof time. However, models can also be designed toanswer more complex questions about potentialquantities of recoverable water in regional groundwater systems as more and more wells are drilledand pumped. These evaluations can provide infor-mation for regulatory decisions regarding allowablelimits on total ground water use, optima] pump-ing rates and placement of new wells, or control-ling subsurface waste injection that may contami-nate ground water.
The principal types of situations for which mod-els are used include:
. changes in ground water availability;● changes in ground water levels due to pump-
ing from wells, land drainage, or injectingwater into an aquifer;

144 ● Use of Models for Water Resources Management, Planning, and Policy
●
●
●
changes in ground water flow caused by altera-tions in surface water flow patterns;movement of contaminants through groundwater systems from waste disposal or encroach-ment of saltwater; andsettlement or subsidence of the land surfacedue to withdrawals of ground water.
The greatest limitations on the effective use ofground water models are not computer size or accu-racy, but: 1) the basic understanding of physicaland chemical processes in ground water systems;2) the cost of collecting sufficient field data todescribe the characteristics of the ground water sys-tem; and 3) the availability of well-trained person-nel. In general, ground water quality models aremuch less reliable than ground water flow models.While models are widely used to address groundwater availability questions, many ground waterquality models have not yet been proven reliableenough for routine regulatory application.
Types of Models Used in GroundWater Resource Analysis
Ground water models are usually classified ac-cording to the physical and chemical processes theydescribe. The two major types are: 1) ground waterflow models; and 2) contaminant transport models.Generally, ground water quantity and yield prob-lems are analyzed with flow models, while groundwater quality issues require the use of contaminanttransport models. The two major model types areexamined below, and ground water quantity andquality issues are analyzed in “Ground WaterQuality Issues. ” Lastly, the section evaluates theutility of currently available ground water models.
Ground Water Flow Models
Flow models determine rates and patterns of fluidmovement through soil or rock. Both the type offluid and the nature of the soil or rock are used tofurther characterize the flow model. Types of fluidsmodeled include water only, water and air, or waterand an immiscible fluid (a fluid that does not mixwith water, such as gasoline). The soil or rock typesmay be either porous or fractured material. Flowin porous media is primarily through interconnectedvoids (open spaces) between individual grains. Anexample of this type of material is sandstone. In
fractured media, water cannot move through the rockas in porous flow, but moves through cracks or cav-ities in the rock. In general, better estimates of flowcan be made with models for porous media thanfor fractured media.
Saturated flow models consider the flow of wateronly. These models assume that water completelyfills the open spaces between soil grains or rock.Data used in these models include: 1) inherentcharacteristics of the system, such as the transmis-sivity (ability to transmit fluids) and storage (abilityto store fluids) characteristics of the rock or soil;and 2) changes imposed on the ground water sys-tem, such as water entering or leaving the system.Results from the model consist of calculated fluidpressures or water levels at time intervals for specificlocations in the ground water system. Saturatedflow models are used for almost all types of groundwater quantity applications.
Above the water table, the open spaces betweensoil grains or in rock voids contain air as well aswater. A model that considers a mixture of air andwater simultaneously is called an unsaturated~owmodel. Data requirements for unsaturated flow mod-els include all of those needed for saturated flowmodels plus data describing the reduction in trans-missivity (resistance to water flow) due to the pres-ence of air. Besides fluid pressures, the models alsocalculates variations in the amount of air containedin the pore spaces. Unsaturated flow models areuseful for small-scale problems such as crop irri-gation or water flow adjacent to landfills.
Multifluid models deal with the simultaneous flowof immiscible fluids in the soil or rock—e. g., a gas-oline-water or oil-water model. These models aresimilar to unsaturated flow models, except that gas-oline rather than air is the second component ofthe fluid mixture. Multifluid models can help toassess the consequences of fuel tank leaks or oil spillson land.
Contaminant Transport Models
Contaminant transport models analyze themovement, mixing, and chemical reactions of con-taminated water in the native water and the soilor rock through which it flows. Like flow models,transport models are also classified by fluid and

wmedia types, as well as by the chemical reactionsconsidered.
Three major processes control the movement andchanges in concentrations of pollution in groundwater: 1) movement due to ground water flow(called advection or convection); 2) the mixing ofground waters having different levels of contamina-tion (called hydrodynamic dispersion); and3) chemical reactions. Contaminant transportmodels are normally classified according to whetherthey consider chemical reaction. Two major typesof models are generally recognized: 1 ) conservativetransport models, which do not consider chemicalreactions; and 2) nonconservative transport models,which do.
Nonconservative transport models can simulatea variety of possible chemical reactions. For exam-ple, models may consider the fate of water-bornepollutants that become fixed or adhere to the soilor rock surface, thereby coming out of solution andnot moving with the water. However, while theseand more complex reactions can be addressed intheory, in practice, chemical reactions are normallyeither ignored or are approximated by simple equa-tions. Simple equations are used because the precisemechanisms for the chemical reaction are general-ly unknown or are too complicated to be used infield applications.
Data required for both conservative and noncon-servative transport models include the hydrologic

146 ● Use of Models for Water Resources Management, Planning, and Policy. . — —
data discussed previously for flow models, as wellas data describing mixing and chemical reactions.Models generally calculate projected concentrationsof the various pollutants as they vary over time andspace.
Because ground water flow is a major factor af-fecting the movement of contamination, pollutanttransport models are necessarily extensions ofground water flow models. As a result, a contami-nant transport model is, at best, as reliable as theground water flow model to which it is coupled.For small-scale contamination problems in materialthat is highly variable or is fractured, estimates ofground water flow may be inaccurate, thereby re-ducing the reliability of transport estimates.
In addition to ground water flow, the movementof pollutants is affected by mixing and by chemicalprocesses, both of which are poorly understood.Since quality problems are more complex thanquantity problems, models dealing with groundwater quality are generally less reliable than thosefor ground water quantity. Quality models are alsoconsidered less credible than quantity models be-cause of their recent origin and the relative unavail-ability of validated models.
Ground Water Quantity Issues
Available Supplies and Optimal Yields
Models are well suited for determining the hydro-logic limitations on ground water availability, oron the yield of an aquifer. Hydrologists have devel-oped several definitions of what constitutes an aqui-fer’s yield. One definition, “sustained yield, ” rep-resents the maximum amount of water that can beremoved from the system if inputs and outputs areto be balanced, with no net loss from the aquifer.The concept is based on the commonsense obser-vation that water cannot be continually withdrawnfrom wells if the rate of withdrawal exceeds thenatural rate of replenishment to the ground watersystem. A second definition, ‘ ‘optimal yield, in-corporates political and social considerations, andrefers to an optimal plan for using a ground watersystem, whether on a sustained basis or not. Thisapproach attempts to maximize economic objectivesand to minimize environmental impacts throughlegal and social constraints on the use of the groundwater supply.
Computer models can be very useful tools for es-timating an aquifer’s response to alternative devel-opment plans. Assuming that the geometry andwater-bearing characteristics of the ground watersystem have been adequately described, the model-er uses equations to show, for example, how waternaturally enters the system from infiltration of rain-fall or streamflow, how water naturally escapes fromthe system through discharge into surface waterbodies or through consumption by vegetation, andhow the extraction of water from wells affects theoverall water balance.
The response of a ground water system dependsnot only on hydrological conditions, but also on themanner in which the ground water is withdrawnfor use. For example, locating wells too close to eachother may cause large water-level declines near thewell field, resulting in reduced yields, dry wells, oreven subsidence of the land surface. Ground waterflow models can be used to address problems suchas the optimal design of a well field and the extentof available supplies, and to predict water-level de-clines due to alternative development schemes.
Although the most frequent use of ground waterflow models is for water-supply management, thesemodels can be helpful throughout the planningstages preceding management decisions. Modelsalso provide a framework and guide for collectingand organizing data. By matching computed modelresults with observed system behavior, one can gaina better understanding of hydrologic and geologicconditions. Even with limited data, the hydrologistmay use a model to test alternative hypotheses ofhow the system behaves.
For managing, regulating, and planning the useof ground water, models that determine availablesupplies and optimal yields are highly reliable.However, since ground water data are derived pri-marily from wells, aquifers that are relatively unde-veloped often have an inadequate data base for esti-mating potentially available yields. As the systemis developed, more data become available, and ear-lier modeling efforts can be modified to reflect thisadditional information. Thus, data collection andmodeling activities must be coordinated with aqui-fer development if reliable information about theground water system is to be available when it ismost needed—when water withdrawals are largeenough to significantly affect the aquifer.

Ch. 6—Modeling and Water Resource issues ● 147
Conjunctive Use of Ground and Surface Waters
Aquifers are commonly hydrologically connectedto surface lakes and streams. Ground water fre-quently provides the base flow to streams—thestreamflow that occurs even during dry weather.During periods of low rainfall, the base flow pro-vided by ground water is a major determinant ofboth the quantity and quality of surface water. Adecline in ground water levels may decrease thebase flow and degrade surface water quality. Inother situations, surface water may recharge theground water system. In this case, a change in thequantity or quality of the surface water would af-fect the ground water.
Conjunctive use models analyze the interactionbetween ground and surface water systems. Thesemodels may provide information about both quan-tity and quality aspects of surface water and groundwater interrelationships, and can be used to aid inthe combined management of both water sources.Ground water flow models have been employed formany different conjunctive-use situations. A typicalproblem of this kind involves determining the ef-fects on surface water flows of irrigating withpumped ground water distributed through irriga-tion systems. The ground water flow models usedfor these applications are essentially the same asthose used to determine optimal yields. For con-junctive use, however, the components of the modeldescribing the interaction between ground and sur-face waters become critical and are consequentlymore complex.
During the past decade, ground water flow mod-els have frequently been used to solve conjunctiveuse problems. Model reliability is nearly as highas for ground water supply and optimal yield ap-plications; confidence is somewhat reduced, how-ever, because quantitative estimates of the interac-tions between ground and surface waters are diffi-cult to obtain. Furthermore, the scale of the sur-face water problem (i.e., area of influence and speedof water movement) may differ from that of the as-sociated ground water system. This may result inan accurate description of the ground water re-sponse but a less satisfactory description of localsurface water responses.
Subsidence of the Land Surface
Under certain geologic conditions, particularlywhere thick beds of clay underlie the land surface,heavy withdrawals of ground water may lowerground water levels to such an extent that the clayspartially dry out. In some situations these claysshrink or compact, resulting in settling or subsi-dence of the land surface, which may cause rup-tures in pipelines, cracking of building foundations,or even surface water floods. The Houston ShipChannel in Houston, Tex., is a notable example—several adjacent residential communities have es-sentially been abandoned because flooding by tidalwaters has resulted from land surface settlement.
To model these conditions, data are needed notonly for the ground water system itself but also forsoil mechanics and physical properties of clay soilsunder dry conditions. In addition, information isneeded about the surface water systems in areaswhere subsidence may alter drainage areas and flowpatterns.
Ground Water Quality Issues
A basic understanding of ground water flow isnecessary for understanding ground water qualityproblems. Since pollutants entering a ground watersystem are carried along with the water flow, manyof the factors that determine quantity relationshipsalso apply to quality models. Problems of groundwater quality are likely to dominate water resourceissues in the 1980’s. They fall into four broad cat-egories: 1) accidental and negligent contaminationfrom urban and industrial areas; 2) agriculturalpollutants to ground water; 3) movement of pol-lutants into and through ground water from wastedisposal; and 4) seawater intrusion.
The disposal of wastes, in particular, involvesmajor political issues for which the analytical capa-bilities of models will be useful. Wastes can be dis-posed of in the atmosphere, in streams and othersurface water bodies, or into or on the solid earth.Each of these options has associated tradeoffs. In-land and onland disposal of either solids or liquidsmay contaminate ground water and cause wastesto be transported long distances from the original

148 ● Use of Models for Water Resources Management, Planning, and Policy
disposal site. Consequently, ground water hydrolo-gists are being asked to predict the movement ofcontaminants to aid in designing waste-disposalsystems to minimize contamination. The problemis perhaps best exemplified by the present searchfor a geologic disposal site for high-level radioac-tive wastes.
Accidental and Negligent ContaminationFrom Urban and Industrial Areas
Unintentional ground water pollution is reportedwith increasing frequency. Regulatory agencieshave particular difficulty in planning for emergencyincidents of ground water pollution, due to the widevariety of possible contaminants and hydrogeologi-
11 - M /
cal conditions. Contaminant transport models, inconjunction with careful hydrologic studies, canprovide important information on alternative cor-rective measures.
This section deals with unintentional, nonagricul-tural contaminants to ground water. Three fre-quently occurring pollutant types will be discussed:1) petroleum products; 2) industrial chemicals; and3) road salts. For each of these, contaminant trans-port models can be used with varying degrees ofsuccess and confidence. Model capabilities are lim-ited primarily by insufficient data on and under-standing of the movement of contaminants throughsoil and rock. It is often necessary to drill numeroussampling wells to determine the extent of the con-tamination. Other information that is needed in-cludes the amounts of contaminants released andthe chemical reactions occurring in the soil.
Petroleum spills and leaks are serious sources ofground water contamination. Hundreds of thou-sands of gasoline storage tanks, thousands of milesof underground pipelines, and numerous tanktrucks and railroad cars carry oil or gasolinethroughout the country. Contamination from thesesources is quite difficult to analyze with models.Models of the movement of oil or gasoline havebeen routinely employed for petroleum reservoirengineering, but have had limited application toground water problems. Insufficient experiencewith these models limits their use for analyzing con-taminant transport.
P
Photo credits: @ Ted Spiegei, 1982
Extensive ground water withdrawal can cause land to subside on small or large scales. At left, signs on telephonepoles in the San Joaquin Valley, Cal if., show the sinking of the Earth’s crust as a result of ground water use for irrigationsince 1925. Florida sinkhole at right demonstrates a more dramatic local effect. At any scale, land subsidence in inhabitedareas has enormous destructive potential; developing models to estimate the conditions under which subsidence will
occur requires extensive knowledge of geology, ground water hydrology, and soil sciences

Ch. 6—Modeling and Water Resource Issues ● 149
Although oil and gasoline do not generally mixwith water, small concentrations of petroleum prod-ucts may dissolve. These low concentrations mayexceed acceptable water pollution standards. Themovement of dissolved oil or gasoline can be ana-lyzed by contaminant transport models once thenature of the dissolution process is known. Thesemodels can be used to gage the effectiveness of var-ious cleanup procedures.
Toxic industrial chemicals can accidently contami-nate ground water supplies in a number of ways—leaky storage tanks, tanker spills, or leaky holdingponds. The range of possible contaminants makesit difficult to use models to predict resulting pollut-ant concentrations. In general, for chemicals thatdissolve in water but do not react with soil or rock,credible models can be developed if sufficient hydro-logic data exist. However, for chemicals that areeither immiscible with water or reactive with soilor rock, model reliability will be low, regardless ofthe amount of hydrologic data available. Still, forsuch reactive constituents, conservative or ‘ ‘worst-case’ predictions can be useful for assessing themaximum pollution potential, and can be generatedby assuming that no reactions occur. In these cases,model results can aid in evaluating alternativeremedial measures.
Large quantities of salts are applied to roads dur-ing icy conditions, primarily in Northern States.Road salt is highly soluble in water; thus, shallowground water supplies near major roads may be-come contaminated. In recent years, recognitionof this problem has led to decreased usage of roadsalt. While contaminant transport models can assessthe potential for ground water pollution from roadsalt use, the problem is not generally consideredserious enough to warrant the collection of the ex-pensive field data needed to produce credible re-sults.
Agricultural Pollutants to Ground Water
Agriculture, because it is so widespread an activ-ity, is an important influence on the quality ofground water. Agricultural activities can affectground water quality through: 1) salt buildup, and2) contamination by herbicides and pesticides.
Salt buildup is caused in two ways. In semiaridregions, fields close to streams are commonly irri -
gated with both surface water and pumped groundwater. As the water flows through the ground andreturns to the stream, it accumulates salts from thesoil that are further concentrated by evaporationfrom soil and plants. The water returning to thestream often has high salt concentrations and issometimes unusable for irrigation by farmers down-stream.
Salt buildup can also occur as a result of fertiliz-ers, and, to a lesser extent, from storage or disposalof livestock wastes. Fertilizer is a serious source ofpollution. Nitrates— a major component of fertilizerand a type of salt—are the most common cause ofground water contamination beneath agriculturallands.
The use of pesticides and herbicides has expandedsignificantly in recent years, When pesticides andherbicides are applied to the land, they migratedownward toward ground water supplies throughthe unsaturated zone. They generally move slow-ly, and undergo chemical changes in the unsatu-rated zone that alter their properties. Pesticides andherbicides that are “broken down’ in this man-ner are often not harmful when they reach theground water. However, the greater the use of pes-ticides and herbicides, the higher the likelihood ofproducing concentrations exceeding the biodegra-dation capabilities of the unsaturated zone. Seriousground water pollution can result in such cases,
Models of ground water flow and transportthrough saturated soil and rock are generallyreliable when applied to these problems. Waterquality variations in an irrigated stream-aquifersystem can be reliably predicted with mathematicalmodels, if sufficient data are available.
Flow and transport in unsaturated zones are lesswell understood; consequently, unsaturated flowmodels are less reliable than saturated ground watermodels. As yet, no model has been developed thatincorporates all the physical, chemical, and biologi-cal processes occurring in the unsaturated zone.However, many problems involving pesticide-her-bicide ground water contamination can be analyzedwithout a comprehensive model, Simplified modelsare useful for assessing the effectiveness of the un-saturated zone as a barrier to potential pollutants.Results based on conservative or worst-case as-

150 ● Use of Models for Water Resources Management, Planning, and Policy—
sumptions may be helpful for determining the ef-fects of agricultural practices on ground water.
Movement of Pollutants Into and ThroughGround Water From Waste Disposal
Several methods are commonly used for onlandwaste disposal:
● landfills;. surface spreading;. surface impoundments; and● injection wells.
Approximately 5 pounds of solid wastes per per-son are produced daily in the United States. Solidwaste is normally reduced in volume by compac-tion and placed in landfills, which currently numberover 150,000 in the United States. When rain entersa landfill and infdtrates through the refuse, byprod-ucts of waste decomposition dissolve in the water,producing a liquid known as leachate. Leachate canbe a serious problem in nonarid regions, where ris-ing water tables infiltrate refuse, causing contami-nants to migrate into the ground water system.Such leaching of pollutants may continue for dec-ades or even hundreds of years. Models can be usedto predict the effects of alternative engineeringdesigns on the landfill hydrology, and to predictthe transport of leachate into ground waters. Thesemodels are still in initial stages of development.
Much domestic waste in the United States isprocessed in secondary sewage treatment plants.A common practice for disposing of these waste by-products is to spray liquid sewage on and spreadsludge over the land surface. Surface spreading ofsewage and sewage sludge may degrade groundwater quality, both through salt buildup and fromheavy metals that are not removed during second-ary treatment. Since this practice is similar to fer-tilization, modeling capabilities and difficulties aresimilar to those described for agricultural practices.
Surface impoundments are pits, ponds, and lagoonsin which liquid wastes are stored, treated, and dis-posed of. These wastes contain a wide variety oforganic and inorganic substances. Over 170,000impoundments are located in the United States—many of them contain potentially hazardous wastes.Few of these impoundments have a bottom liner,
and few have means for monitoring ground waterquality.
Contaminants that seep from impoundmentsmay be modified in the soil by various chemicalreactions, thus reducing their harmfulness; othersmay move into shallow ground water and cause pol-lution. Studies generally show that ground watercontamination creates a contaminant plume thatmay be well contained locally, but might extendup to a mile or more from the impoundment, de-pending on ground water conditions.
Actions that can be taken to alleviate contamina-tion
●
●
●
of ground water include:
lining the impoundment with plastic, impervi-ous clay, asphalt, or concrete;constructing collection systems such as wellsfor recycling; andreducing the movement of contaminatedground water by means of hydraulic or phys-ical barriers.
The effectiveness of these actions can be evaluatedwith mathematical models. The approach to analyz-ing contamination from impoundments is similarto that used for landfills.
Wastewater injection wells offer an alternative todisposal of waste at or near the land surface. Asof mid- 1973, at least 278 industrial wastewater in-jection wells had been installed in 24 States, and170 of these wells were operating. Most were be-tween 1,000 and 6,000 ft deep and had average in-jection rates of less than 400 gallons per minute.As with other pollution problems, chemical and bio-logical reactions occurring within injection wells arethe most difficult to model accurately. Nonetheless,models may still be used to estimate the impact ofthe injection system on the natural hydrology; this,in turn, may be used to design well fields and injec-tion schemes.
Seawater Intrusion
Cities in coastal areas often withdraw large quan-tities of ground water for their freshwater supplies.This decreases the seaward flow of freshwater,which may cause saltwater to move into groundwater reservoirs.

Ch, 6—Modeling and Water Resource Issues 151— —
The movement of seawater into drinking watersupplies in coastal areas is a serious and widespreadproblem. Models can aid in designing well fieldsand pumping schemes to minimize seawater intru-sion. However, for cases in which the hydrologyis complex, such as a layered ground water systemin which flow characteristics among the layers varygreatly, modeling results are less reliable.
Evaluation of Currently AvailableGround Water Models
In table 9, models that can be applied to eachof the problems previously described are evaluatedaccording to model types employed and the models’areal scale of analysis. The evaluations are for the
general level of model development in each cat-egory, rather than for any specific model. A com-prehensive list of models available for ground wateranalysis is provided by Bachmat, et al. 1
Two major criteria are used to evaluate eachmodel category: 1) model reliability; and 2) credi-bility of model results. Models are considered reli-able if they can accurately describe the importantchemical and physical processes. Credible resultsrequire both a reliable model and sufficient datato run that model. For some applications, modelsmay be reliable, but the cost and difficulty of col-
IY. B. Bachmat, et al. , ‘ ‘Utilization of Numerical Ground \\’atcrModels for Water Resource Management, ” U.S. Environmental Pro-tection Agency, report No. EPA-600 /8-78-Ol 2, 1978.
Table 9.—Ground Water Model Evaluation
spatial ConsiderationsModel types
Site Local Regional
Transport Transport TransportTransport WIO Transport WI Wlo
Pollutant movement, if anyWI Wlo
Flow only reactions reactions Flow only reactions reactions Flow only reactions
un
Fiow conditionssat sat sat multi sat sat : ; t sat sat M sat sat sat sat sat sat sat sat sat sat
P F p fluid P F F’ P F P P F P F p F p F p F
IssuesQuantity—available supplies. . . . . B c A B B B
Q u a n t i t y — c o n j u n c t i v e u s e . B R A B B B
Quality —accdental petroleumproducts. . . . . . . . . . R B c R c R
Quality—accidental road salt, . . . . B c cQuality—accidental industrial
chemical . . . . . . . . . . . . . . . . . . . . B c c c R – B c c –Ouality—agricultural pesticides
and herbicides. . . . . . . . . . . . . . . B c c c R – B c c –Quality–agriculture salt buildup. . B c c B cQuality—waste disposal landfills. B c c c R – B c c –Quality—waste disposal injection. B c c c R – B c c –
Quality—seawater intrusion. . . . . . B B c c 0 c c cKey
Rows — issue and subissue areas discussed in textColumns — model types and scale of applications; e g, the sixth column applies to a site-scale problem in which Pollutant movement IS described by a transport
model without chemical reactions under saturated flow condltlon in fractured mediaApplication scale
Site—models delaing with areas less than a few square milesLocal—models dealing with areas greater than a few square miles but less than a few thousand square milesRegional—models dealing with areas greater than a few thousand square m!les
Abbreviationsw/—withw/o—without.sat—saturated ground waterfiow conditionsunsat —unsaturated flow conditionsP—porous mediaF—fractured or solution cavity media
Entr!esA a usable predictive tool having a high degree of rellablllty and credlb!l!ty given sufficient dataB a reliable conceptual tool capable of short.term (a few years) prediction with a moderate level of crediblltty gwen suff!ctent dataC a useful conceptual tool for helping the hydrologist synthewze complicated hydrologic and quality dataR a model that IS still In the research stage— no model existsBlank—model type not applicable to issue area
152 . Use of Models for Water Resources Management, Planning, and Policy
lecting data may prevent calculated results frombeing very credible. The ratings assigned for eachmodel category are a composite of these two con-siderations.
The key at the bottom of table 9 describes theterms employed, and briefly summarizes the modelrating scheme, the breakdown of model types, andthe measurements used to define different levels ofscale. Explanations of the rating scheme, and ofscale and time considerations in model evaluation,are provided below:
Model Rating
A rating of‘‘A ‘‘ indicates that models are reli-able and can be applied with credibility to a par-ticular problem. It also implies that data necessaryto use the model can be obtained at reasonablecosts. Models with ‘ ‘A’ ratings can be used effec-tively for making decisions on applicable problems.
Models rated “B” can be used for short-termpredictions with confidence. The lower level of cred-ibility implies that either some part of the processesdescribed is not fully understood, or that data nec-essary to use the model may be too expensive ortoo difficult to obtain. These models can be appliedto field problems if their limitations and capabilitiesare recognized. Further, if field data were collectedon a continuing basis and incorporated into themodel, model credibility would improve. Modelswith “B” ratings can also be used to investigategeneral problems (but not specific field applica-tions). Conceptual investigations can be used indesigning regulations and policy, e.g., for deter-mining landfill siting criteria.
Models rated ‘‘C” have not been sufficiently val-idated for analyzing specific problems. Both expen-sive data collection and inadequate understandingof important processes are likely for these models.Models with “C’ ratings have utility as concep-tual tools for investigating general problems.
Models having a rating of “R” are still in devel-opmental research stages. In the future, these mod-els should earn a higher rating as they are validatedthrough field use.
Models described by “-” are not presentlyavailable.
Area/ Scale. The credibility of ground watermodels is highly dependent on the geographic scaleof the study area. Most models are designed to op-erate at the local scale (area greater than a fewsquare miles but less than a few thousand squaremiles). Therefore, more confidence may be placedin models used for this scale.
Time Scales. Ground water models project futureconditions for widely varying intervals of time.Generally, the longer the range of the prediction,the less reliable it is. Ground water models normallyinvolve planning horizons of 20 to 30 years, andeach model varies in its ability to forecast futureconditions. For many hazardous waste problems,the time frames needed are much longer, sometimesranging to hundreds of years. Results from suchprojections are much less credible than results frommodels used for problems with shorter time frames.While time frames are not specifically consideredin the evaluations, the effects of different time pro-jections on the credibility of model results must beconsidered in evaluating specific models.
ECONOMIC AND SOCIAL MODELS
Introduction
Many different types of models and analytic tech-niques are used to determine the economic andsocial consequences of water resource activities, toforecast consumer and industrial water needs, andto analyze water resources for comprehensive riverbasin planning and management. Social and eco-nomic models address patterns of human behavior
using theories drawn from economics, sociology,social psychology, geography, and political science.
Economic models are used to estimate the overalleffects of water resource activities and regulationsat both the regional and national levels, as well asto forecast economic consequences to individualsand firms. For example, an economic model canforecast changes in an industry’s water use as the

Ch. 6—Modeling and Water Resource Issues ● 153
cost of obtaining water changes, and determine theeffect of such changes on industrial output.
Social models can project population trends, esti-mate water demands, and analyze the social struc-ture of a given area. They can be used to identifythe groups likely to be affected by resource deci-sions, and their perceptions of these effects. Socialmodels can be coupled with economic models toevaluate the societal implications of water resourceregulations or projects.
The use of social and economic models is relative-ly new in the water resources field, as in other fields.Social and economic model use in water resourceanalysis has been prompted by two major regula-tions: 1) the Principles and Standards (P&S) of theWater Resources Council; and 2) the National En-vironmental Policy Act of 1969. The P&S are agroup of publications that presently require con-sideration of the likely effects on environmentalquality and national economic development of proj-ects proposed to receive full or partial Federal fund-ing. The P&S also require studies of the effects ofproposed projects on regional development and onthe social well-being of the affected area. The Na-tional Environmental Policy Act requires estimatesof the social and economic effects of proposed proj-ects. To make such estimates, social models can beused to identify the population that would be af-fected by the resource decision, and the extent ofthe likely effects. Economic models are also em-ployed to determine the economic impacts of a proj-ect on individuals, firms and the region overall.
Several factors account for the increasing use ofsocial and economic models. Models may providethe only available means of organizing complex in-formation for examining the effects of an action orpolicy. Information derived from the conditions andscenarios assumed in a model can provide insightsabout the effects that may occur, and serve as abasis for common discussion of assumptions andprobable outcomes. Finally, social and economicmodels can be used to compare the merits of pro-posals in terms of a particular objective, and helpdecisionmakers determine the costs and benefits ofa proposed decision.
Both social and economic models are limited by
the necessity of dealing with human behavior,which is not always predictable. Behavior is difficult
to incorporate in a model except in an abstractway—identifying behavioral tendencies with in aprobability of outcomes. Another problem, moreprevalent among social models, is that they aredata-limited. Available data often prohibit quantify-ing and analyzing all factors involved in determin-ing the ‘ ‘public interest ‘‘ in any given situation.Thus, ‘ ‘decision’ models of social and economicfactors can only be used as guides—they cannot besubstituted for the human decisionmaking process.
Because of the difficulty in evaluating social sci-ence models, and their less advanced state of devel-opment, these models were not formally evaluated.Few social science models are widely adaptable;moreover, such models are difficult to validate bycomparing predictions to results, as is routinely
done for models of physical processes. Assessing therelative utility of these models requires comparisonsof previous model applications under a variety ofconditions by different analysts, and necessarily in-volves a considerable component of subjective anal-ysis.
Basic Analytical Characteristics
Social science models are classified by the kindsof information they generate. Three major distinc-tions are used to identify significant characteristics:1) descriptive v. normative; ‘2) macroscale v. micro-scale; and 3) efficiency v. distribution of costs andbenefits.
1. Perhaps the most important dimension involvesthe distinction between descriptive and norma-tive models. A descriptive model is an empiricaland historical representation of ‘what is. De-scriptive models determine factual relationshipsas they exist or may be expected to occur. Theyare intended to include a minimum of subjec-tive assumptions and biases.
A normative model may be equally reliable andcredible, but it focuses deliberately on ‘‘whatshould be. Normative models include substan-tial judgments and assumptions about goals andobjectives. For example, a descriptive model ofthe Nation’s economic output would simply re-port actual or expected levels of gross nationalproduct (GNP), while a normative model mightinclude the assumption of a 5-percent annual in-crease in GNP as an economic goal. Most of the

2.
Photo credit: U.S. Department of Agr/cu/ture
Water resources development can have tremendous effects on an area’s ability to attract residents, industry, and relatedactivity. Models are available to estimate how construction expenditures may directly affect local or regional economies,as well as how water facilities could affect subsequent development. In addition, models can describe how water-related development could affect demands for a wide range of public services, for example, schools, hospital facilities,
roads, and other infrastructures
current social and economic models used inwater resource analysis are normative, i.e., sub-stantial a priori value judgments have been madeabout the goals, objectives, measures, and meth-ods used in the model.
Scale is the second feature by which social sci-ence models can be categorized. Two distincttypes are recognized—macroscale models andmicroscale models. Macroscale models address ag-gregate changes or activities. Macrolevel modelsinclude those that measure and forecast trendssuch as levels of national economic activity (e. g.,GNP), money supply, international trade, mi-gration patterns, etc. They are useful for pro-viding national and regional analyses of waterresource projects and programs.
3.
Microscale models focus on individual and/orenterprise-level behavior. They are often usedin water resources for feasibility studies, environ-mental impact statements and other project-plan-ning activities. Microscale models are used toaddress, for example, pricing, benefit/cost, socialimpact, and risk/benefit questions.
A third feature of social science models addressesthe dual questions of efficiency and distribution ofcosts and benefits. Water resource policies or activ-ities affect both economic efficiency and the dis-tribution of costs and benefits. Efficiency is de-scribable by economic models, while addressingthe distribution of benefits requires a broadersocial analysis, Models of economic efficiencyfocus on means of increasing the gross supply

Ch. 6—Modeling and Water Resource Issues ● 155
of goods and services. Distributive models tracechanges in assets and/or income distributionamong either resource owners (e. g., labor, cap-ital, management) or major sectoral groups(e. g., farmers , industrial workers, the unem-ployed).
Types of Models Usedfor Economic Analysis
Four types of economic models are widely usedfor dealing with water resource issues: 1) input-output; 2) optimization; 3) econometric; and4)
1.
2.
3.
simulation.
Input-output models are based on a detailed ac-counting of sales and purchases among each ofthe industries or sectors being studied. Informa-tion on purchases and sales is used to determineeither the requirements for particular inputs(e.g., water) or the production of outputs (e. g.,manufactured products).
Optimization models are used to determine the allo-cation of resources that best meets a previouslyspecified objective (e. g., least cost), subject tosome specified constraints. The technique is par-ticularly well suited, therefore, to solving prob-lems where both the objectives and the con-straints are clearly defined. When more than oneobjective is considered, these models can describethe tradeoffs between the best solutions for eachrespective objective.
Econometric models are a less homogeneous groupthan the two previously discussed classes of mod-els. The term is generally used to describe fore-casting models, the structures of which have beencarefully estimated from historical data. Thelarge, national forecasting models (e. g., Chase,Wharton, Data Resource, Inc. (DRI), etc. ) areof this type, as are many models tailored toregional and State needs. Econometric modelsare typically based on the following macroeco-nomic principles: 1 ) production determines in-come; 2) income determines demand; and3) production, in turn, adjusts to demand. Theinteractions among production, income, and de-mand determine economic multiplier effects,which play an important role in economic im-pact analysis.
4. The fourth class of models is referred to here assimulation models. Economic simulation modelsare often input-output or econometric modelsthat are adapted to examine the implications ofdifferent sets of assumptions. Simulation modelsdescribe the highly involved pattern of cause-and-effect relationships that operates within mostsocial or economic systems. Once relationshipsare identified and the key factors have beenquantified, the model is used to simulate theperformance of a system over a period of time,under different sets of assumptions about thesystem’s internal relationships and the values ofexternal variables. Such models can calculate theincremental effects of price changes or im-provements in production methods, for example.
Other Social and EconomicAnalytical Techniques
In addition to traditional economic analysis andthe four model types identified above, an increas-ingly large set of social and economic analyticalmethods is being used in natural resource planningand policy evaluation. The methods are diverse,so they will be discussed here according to the kindsof relationships they are designed to explore.
A major consideration in planning and policyanalysis is the size and demographic structure of thepopulation. Demographic models, therefore, relateinformation about the present size and structureof the population to projected changes due to birthsand deaths or to population shifts. Most of thesemodels deal with specific age, sex, and racial groupsor cohorts, and are consequently referred to as co-hort survival models,
Another set of analytical techniques has been de-veloped to deal with the demands for, and supply ofinfrastructure—factors such as housing and publicfacilities and services. These techniques are usedby planners to determine the fiscal impacts on gov-ernments —including both expenditures and collec-tion of revenues—of providing various levels of in-frastructure services, Standard models are availableto carry out these infrastructure and fiscal impactcalculations, although variations among jurisdic-tional units require adjustment for the particularunit of government being considered.

156 . Use of Models for Water Resources Management, Planning, and Policy
Once economic, demographic, and public sec-tor behavior has been accounted for, a major re-maining concern is the social structure of an area. Fewcomputer models have been developed to analyzethis problem, but progress is being made in defin-ing social structure, and in understanding how itis affected by natural resource decisions.
The final major area of activity for socioeconomicanalysis is the integration of the various economicand social concerns discussed above. The modelsdiscussed above provide measures of change in theeconomic, demographic, fiscal, and social environ-ment. However, the significance of these changesultimately depends on the perceptions and valuesof the people who will be affected by them. Cur-rent research is underway in identifying groups thatmay be affected by resource decisions, and deter-mining their evaluation of the social and economicchanges that may affect them. Methods for quanti-fying these analyses, however, are in relatively earlystages of development.
Economic and Social Issuesin Water Resource Analysis
Effects of Water Pricing on Use
Severe water shortages in many locations haveprompted investigation into strategies for reducingthe demand for water. Water use restrictions havecommonly been used for managing water use, butother methods that rely on economic incentives(water pricing and conservation subsidies) havepotential for reducing the consumption of waterthrough nonregulatory approaches.
Water demand models, which predict the re-sponse of water demand to changes in water costs,have been developed for residential, industrial, andagricultural uses. The cost of using water, as con-sidered by these models, includes both prices paidfor water delivery and other acquisition and usecosts, such as costs of disposing of used water.
Residential/ water demand models are based on ac-tual household water use behavior. Consumer de-mand theory suggests that the quantities demandedare related to water price, consumer characteristics(income, family size), and factors such as theseason, and extent of outdoor use. Data are col-lected on household water use and on factors which
affect that use. Using statistical analyses, the ef-fect of price can be isolated from the effects of allother variables influencing residential water use.
The models analyze actual consumer responsesto water prices. However, because responses toprices vary among regions and among incomegroups over time, model estimates will be region-,time-, and income group-specific. These models areuseful planning tools, provided that adequate dataare available and that analysts recognize the theo-retical and statistical assumptions underlying themodel.
Industrial and agricultural! water demand can also beanalyzed with mathematical models. Because largewater users are often self-supplied, market pricesfor water in the conventional sense do not apply.However, analyses for these demand sectors arebased on the costs borne for using water. Thesemodels consider the objectives and constraints thatgovern agricultural and industrial decisions aboutlevels of production and amounts of raw materialsto be used, including water. The influence of waterprice on use is inferred by examining the models’predictions of water use changes as water costschange.
These models are not based on observed re-sponses to price change. Rather, they are simula-tions of responses that could be expected from ‘ ‘ra-tional’ water users with objectives and constraintssimilar to those described in the model. To the ex-tent that water users deviate from the objectives andconstraints assumed in the model, model predic-tions will be inaccurate. A number of these modelshave been developed; however, their use requireshighly skilled analysts and good data bases.
Both types of water demand models are usefultools for water resource decisionmaking. If properlydeveloped, they can organize complex informationabout the factors that determine water use, and as-sess the importance of price relative to other fac-tors in determining use. Information provided bysuch models is helpful for developing demand man-agement strategies, including changes in prices ofpublicly supplied water (e. g., at municipal systemsor Federal irrigation projects) or marketing of waterrights, where market prices are determined by will-ing buyers and sellers. These models are useful forcomparing alternatives, but are less reliable for pro-

Ch. 6—Modeling and Water Resource Issues 157
vialing quantitative estimates of actual volume de-mands.
Cost to Industry of Pollution Control
Pollution control costs, like the availability andcost of water, are one of many factors affecting theprofitability and location of industrial activity.Models are used to determine the effects of regula-tions on specific industries, as well as the impactof pollution control policies on the economy as awhole. Costs of pollution control can be assessedat both macroeconomic and macroeconomic levels.Macroeconomic costs are those associated with aparticular firm or industrial group, and include di-rect expenditures for pollution control equipment,costs of changing production processes, and fore-gone production. Macroeconomic costs are gagedby calculating the effects of industry expendituresto meet environmental regulations on employmentlevels, the Consumer Price Index (CPI) and GNP.
Macroeconomic models are the most complex ofall economic models. Their development and userequires highly skilled personnel. For example, themodels of DRI, and Chase Econometrics, Inc.,which are among the best known of this type, havebeen used to evaluate changes in macroeconomicvariables in response to industry expenditures forcompliance with environmental regulations. How-ever, some analysts consider it inappropriate to usethese models to measure ‘ ‘costs of pollution con-tro l . While the models can predict movements inthe CPI or GNP, they do not estimate the economicvalue of a cleaner environment (e. g., reduced healthcare costs, workdays lost due to illness, etc. ) as anoffset to the cost of pollution control equipment.The reliability of these models is difficult to test;their use depends largely on the plausibility of as-sumptions made about inputs and the lack of credi-ble analytical alternatives.
A4zc~oecomrnic moa!ds of costs to industry for pollu-tion control are most often optimization models,similar to those described in the above section onwater demand. Models of this type can be devel-oped for ‘‘typical firms ‘‘ in specific industries. Abaseline condition is first determined by applyingthe model without environmental regulations. Envi-ronmental regulations are then introduced as a con-straint on the firm’s resources and outputs. Prop-
er interpretation of the results can provide estimatesof the costs that firms incur as a result of regula-tions. Limitations and potentials of this type ofmodel are similar to those of water demand models.Models of this type are used for determining theleast-cost approach to environmental regulations.These models have been used to a limited extentby EPA in the water quality regulatory process. Itis likely that greater use of these models will bemade in the future, for reviewing existing or pro-mulgating new environmental regulations.
Benefit/Cost Analysis
Benefit/cost analysis measures the value of a pol-icy, program, project, or regulation in terms of eco-nomic efficiency. Procedures for calculating thebenefits and costs of Federal water resource activ-ities are outlined in the P&S of the Water ResourcesCouncil.
A relatively small portion of Federal activities inwater resource protection and development is nowcovered by the P&S. Affected agencies (principal-ly the Corps of Engineers, Soil Conservation Serv-ice, Bureau of Reclamation, and Tennessee ValleyAuthority) prepare estimates of some costs and ben-efits of their proposed investment projects. How-ever, some of the most common Federal activities—e. g., waterway and discharge permits, and sew-age treatment construction grants—are not re-quired to prepare benefit/cost analyses.
Although economists have developed rigoroustheoretical standards for determining the propermeasure of both costs and benefits, even the mostcompetent analysts face difficulties in conductingsound benefit/cost analyses. Many costs and bene-fits may be known, and yet be difficult to defineor quantify accurately— in water resource activities,more incommensurable benefits tend to be encoun-tered than incommensurable costs. Constructioncosts for building a dam or a sewage treatmentplant, for example, are easier to estimate than thevalue of decreased likelihoods of flooding, or thevalue of cleaner water to downstream users.
When no professional consensus exists as to themonetary value of a benefit, or the probable costof an activity, standards of accuracy for benefit/costanalysis are difiicult to establish. Estimating the val-

—
158 Use of Models for Water Resources Management, Planning, and Policy
ue of less tangible benefits necessarily involves anelement of subjectivity; consequently, such esti-mates are affected by the assumptions of the analyst.The choice of a particular time frame or discountrate, for example, while not imparting intentionalbias, may heavily influence results.
As a general rule, benefits and costs of publicprojects are easiest to evaluate when the resources,goods, or services produced are traded in themarket economy (e. g., power production). Benefitsand costs are less easy to measure if the resource,good, or service either contributes directly to a goodwhich is traded (e. g., irrigation water as a factorin agricultural production), or if the private marketoffers a comparable substitute for the public proj-ect’s output (e. g., railroad transportation as asubstitute for river transportation). Benefits andcosts are very difficult to estimate for resources,goods, or services for which few market transac-tions exist (e. g., recreation, wildlife habitat). Inthese cases, the economic value of the public proj-ect cannot be inferred from observed market prices.
Institutional limitations on the alternatives thatcan be considered for achieving an objective consti-tute another constraint to effective use of ben-efit/cost analysis for Federal water activities.Benefit/cost analysis is most useful when it is usedas a screening device for comparing alternatives.If an agency, for example, is restricted to fundingflood control structures and cannot propose pur-chasing flood plain development rights as a non-structural alternative, the full power of theanalytical technique cannot be effectively used.
Benefit/cost analysis is often used to support nor-mative arguments that no actions should be takenunless benefits exceed costs. However, such argu-ments are often rejected for two reasons: First, com-plete measurements of economic efficiency, bene-fits, and costs of public actions are limited by dataand time for conducting the analysis. Therefore,a benefit/cost analysis will often not reflect alleconomic benefits and costs. Second, economic effi-ciency in resource allocation is only one of severalpossible aspects of the “public interest” which mustguide decisions. For example, the distribution ofthese benefits and costs among the public can beconsidered as important as the relative amounts ofthese benefits and costs. Nonetheless, benefit/cost
analysis is useful for comparing and screening alter-natives according to their relative contribution tothe Nation’s economy.
Implications of Water Resources Policyfor Regional Economic Development
The regional economic impact of water resourcedevelopment is an important concern that is notconsidered in ‘‘standard’ benefit/cost analysis. Tothe locality or region in which a water project isproposed, the regional economic effects may be asimportant as the costs or benefits to the nation asa whole.
Models have been developed that estimatechanges in the level of local or regional economicactivities (employment or income) and/or economicbase (development potential) due to projects or ac-tivities. Standard models include various forms ofsimple economic base studies, as well as the morecomplex input-output models.
In the past decade, advances have been madein regional development models for analyzing eco-nomic, demographic, and community effects associ-ated with water resources development. The Bu-reau of Reclamation, for example, has developedthe Bureau of Reclamation Economic AssessmentModel, an economic/demographic simulation mod-el used in both planning and impact assessment pro-cedures. Similar tools are used by the Corps of En-gineers and by regional and State water resourceagencies.
These models are used to evaluate the economiceffects of direct expenditures made in a region toimplement a program or build a project, and thecontinued effects of the spending generated by theseactivities. Such models simulate a complex and dy-namic process, accounting for multiplier effectsfrom expenditures made in direct support of theactivity (wages paid to labor, goods and servicespurchases locally, etc.), and assist in comparing theimpacts of alternative programs and projects on theregional economy. Such comparisons can be of valu-e for both planning and policy.
The use of these models is feasible for most skilledanalysts. The Water Resources Council has pub-lished multipliers developed by the U.S. Depart-ment of Commerce for simulation purposes. How-

Ch. 6—Modeling and Water Resource Issues ● 159
ever, developing the models and multipliers them-selves requires special skills and extensive data.
The results of these models must be carefully in-terpreted. Such models are based on data that rep-resent the existing regional economy. If the waterresource activity being evaluated significantly altersthe region’s economic structure, the model may beinvalid. The smaller the public action relative tothe regional economy, the more reliable model re-sults will be. Moreover, these models should notbe used with the implicit assumption that economicactivity (e. g., a new industry) will be attracted tothe area solely on the basis of increased water re-sources development. Many economists considerwater projects to be uncertain means for redistribut-ing income, stimulating regional development, orachieving employment stability.
Clarification of the regional economic stake inwater development has been and can be furtheraided by careful model use. This type of analysisis best suited to planning activities, such as com-paring scenarios for different alternatives. If suchmodels are used to estimate impacts with more pre-cision, they should only assess the impact of cer-tain, direct expenditures resulting from the publicaction, and only for short (1- to 5-year) timeperiods.
Forecasting Water Use
Models for forecasting long-range water userange from simple extrapolations of past trends tocomplex models that project water use in responseto changing social, economic, and technologicalconditions.
Simple models, often termed the ‘ ‘requirementsapproach” to projection, have been favored by Fed-eral agencies in the past. These models extrapolatehistorical growth rates in water use, by use categoryor for total consumption. The models can be modi-fied to provide separate per capita use rates andpopulation projections, which are then combinedto produce a total water use projection. Under thelatter approach, per capita use is projected to growat historical rates and population projections aretaken from separate demographic studies. The re-quirements approach has been called into questionbecause it has failed to project actual water use ac-curately. The requirements approach also provides
little assistance to the decisionmaker, since it doesnot indicate why water use changes over time.
To remedy these shortcomings, more complexeconomic forecasting models have been developed.Complex models are simply applications of thewater demand models described above. First, thedemand models are used to determine the relativeimportance of the various independent factors(price, income, technology, etc. ) that determineconsumption levels for each major category of wateruser. Second, future changes in these factors areprojected and incorporated into a demand modelto predict future demands for water. A disadvan-tage of the complex model approach is that it re-quires projections into the future for many factors,a difficult task requiring a large, credible data base.
Water use projections are only guides—’ ’bestguesses’ about an uncertain future. The demandmodel approach does, however, serve a useful rolein planning and policy. Models can be used to testthe sensitivity of forecasts to different assumptions—e. g., they can identifyquences of overinvestmentwater supply capacity.
Risk/Benefit “Analysis
and assess the conse-or underinvestment in
The consideration of uncertainty in planning orpolicymaking processes is a significant recent devel-opment in water resources analysis. ‘‘Risk assess-ment, o r ‘ ‘risk/benefit analysis, is required bythe revised P&S for situations in which uncertain-ty is an essential element of the planning process.Risk/benefit analysis deals with uncertain eventsso as to reflect both the expected outcome (in aprobabilistic sense) and public attitudes towarduncertainty and risk. Public attitudes are particular-ly difficult to gage for those situations in which thereare low probabilities of highly serious accidents.
Since the year-to-year and day-to-day variabili-ty of the hydrologic cycle encourages the presen-tation of information in probabilistic terms, riskanalysis is a particularly suitable approach to waterresources decisionmaking. A flood or a drought ora pollutant spill of a particular magnitude will causequantifiable losses. Estimates of the probability ofthat size flood or drought or spill occurring trans-form the projected loss to a statement of risk. Safetyis generally paid for with time and money. Projects

160 . Use of Models for Water Resources Management, Planning, and Policy
and policies, with their associated costs, work toeither reduce damages or the probability of an un-desirable event. Judgments about acceptable levelsof risk and what should be spent to reduce themare a part of the politics of water resources. Modelscan help in clarifying those choices.
Risk/benefit analysis organizes information so thedecisionmaker can compare the reduced risk of al-ternative policies with the increased costs. The“benefit” side of risk/benefit analysis is generallya statement of net costs incurred by choosing a morecostly alternative over a less costly one. These costsare calculated using estimation models similar tothose used for benefit/cost analyses. The ‘‘risk’ sideof risk/benefit analysis is a statement of the proba-bility and consequences of a particular action oroccurrence. Consequently, risk/benefit analysis isnot the sole domain of social scientists, but mustrather be conducted by engineers, lawyers, and sci-entists from many disciplines.
Methods for estimating adverse health and safetyrisks are relatively new, but the cases in which thesemethods have been applied are relatively similar.One of the major shortcomings of this approach isthe inadequacy of historical data to construct prob-ability functions. Although subjective probabilitiescan be assigned by experts, such assignments canpotentially impart biases to the analysis. The highdegree of uncertainty about dose-response relation-ships, in particular, tends to reduce the credibilityof quantitative estimates of risk.
Social Impact Analysis
The potential social impacts of water resourcesprograms or projects have received increasing pub-lic attention in recent years. As a result, Federalagencies have begun to develop accounting methodsfor social-effects that consider two important factors:
1.
2.
The effects of a program or project fall un-evenly on different groups. For example, somegroups may benefit from increased employ-ment, some may experience shifts in recrea-tional opportunities, others may undergo taxincreases.The desirability of these effects will dependon the value structures of the groups affected.The impact of activities can be perceived dif-ferently by different groups.
These two factors mean that political decisionsare likely to affect certain groups differently thanothers. Decisionmakers need to understand not onlythe effects of a project, but also what the effects willmean to the affected individuals.
Regional economic development models (de-scribed above) provide a basis for considering com-munity-level effects—particularly effects on hous-ing, on the demand for public facilities and services,and on the overall fiscal condition of local govern-ments. Once these consequences of a project havebeen determined, consideration must be given towhat the Water Resources Council has referred toas ‘‘social well-being. The remaining questionsare of two kinds: First, what is the effect of the proj-ect on the social structure of an area? Second, howare the economic, demographic, community, andsocial effects of the projects perceived by the affectedpeople? Models and operational methods to answerthese questions are still in the research stage.
Current research indicates that social structureis definable in terms of: 1 ) the functional groupsin an area; 2) the characteristics of the groups (e. g.,size, attitudes towards growth); and 3) patterns ofeconomic, political, and social interaction amongthe groups (e. g., employee/employer relations andpolitical alliances). Questions can then be asked:Will a project introduce any new groups into anarea? Will it in any important way affect the char-acteristics of existing groups? Will it affect the wayin which economic, political, or social interactionoccurs among the groups? Answers to these ques-tions constitute the social effects of a project in thesame sense that economic/demographic and com-munity effects can be defined using the models andprocedures outlined above.
The next step in social well-being analysis is todetermine the significance of the changes to the peo-ple affected. This requires that the distribution ofeffects among the various groups be known and thattheir individual evaluations of these effects be deter-mined. Specifying the distribution of the effects(economic, demographic, community, social) isusually possible once both effects and groups havebeen clearly defined. Effects can then be evaluated,largely through direct questioning of group mem-bers or knowledgeable individuals. This part of thesocial assessment process constitutes ‘‘public in-volvement.

Ch. 6—Modeling and Water Resource Issues ● 161
In projecting the social impacts of variouschanges, models can be used to: 1 ) organize infor-mation on the social factors that are affected, and2) qualitatively determine the direction of the im-pacts (positive, negative, or no change). Even thisqualitative information can be useful to a decision-maker. If a systematic approach is not used, theinventory of social impacts may be incomplete.
Unified River Basin Planning and Management
River basin models consider the simultaneous useof water resources and the competing values associ-ated with those uses. Such models are one meansof assessing the ‘‘value’ of water for alternativeuses—both for offstream purposes and recreational,wildlife, and water quality instream uses. Thesemodels form an analytical basis for examining alter-native planning and management strategies for anentire river basin. River basin models require in-put from a large number of disciplines as well asinformation from economic and social models.
Two principles are central to unified river basinplanning and management:
1.
2.
River basin planning stresses comprehensiveanalysis of the interrelationships among waterresources and social and economic activity,rather than the project-specific focus of mostplanning activities.River basin planning emphasizes monitoringand analyses on a continuing basis, insteadof only at times when specific projects arebeing considered.
Since the methods applied in this area are similarto, or the same as, the methods discussed in the
The first models developed for unified river basinplanning were river basin simulation models com-pleted during the 1960’s. These models linked waterresources to economic activity and demographictrends. The Susquehanna River basin model devel-oped in the early 1960’s was the first of these ef-forts, and demonstrated the applicability of a sys-tems approach to river basin analysis. The generalexample provided by that work has been repeatedmany times since.
Another related application of river basin analysishas occurred principally in the Western UnitedStates. Models have been developed to analyze theeconomic development implications of competitivedemands for water among agriculture, energy-re-lated mining or industrial development, and in rec-reational stream uses. Analysis of the implicationsof alternative allocation schemes has generally beenconducted at the river basin or State level, usingsimulation models with hydrologic, econometric,and demographic components. Models of this kindwere first developed for the purpose of analyzing
different resource management strategies in Utahin the early 1970’s with the Utah Process EconomicDemographic Model. Similar models now exist inmany States and, among other applications, areused to analyze water resource management al-ternatives.
Only in a few basins have there been modelingand data collection on the scale necessary to relatein detail both water quality and water demand tosubregions and sectors. To do this comprehensively
requires linking physical and social models that in-clude many subjective inputs from citizens and/ordecisionmakers.
previous sections, all of the justifications and limita-tions discussed in those instances apply here.