monthly weather review - semantic scholar · monthly weather review volume 99, number 3 march 1971...
TRANSCRIPT
Monthly Weather Review VOLUME 99, NUMBER 3
MARCH 1971
UDC 661.515.427:561.566.1:661.511.2
THUNDERSTORM-ENVIRONMENT INTERACTIONS DETERMINED FROM AIRCRAFT AND RADAR OBSERVATIONS
JAMES C. FANKHAUSER Notional Center for Atmospheric Research,’ Boulder, Colo.
ABSTRACT
Aircraft measurements at low- and mid-cloud levels near two isolated and persistent Great Plains thunder- storms concurrently scanned by radar are analyzed to determine the kinematic properties of the near-cloud air flow, the moisture budget, and the dynamical interactions between the cloud and its surroundings. Time variation in velocity divergence, relative vorticity, and moisture flux convergence in the subcloud layer relate well to changes in storm development and translation. Aircraft winds and radar chaff trajectories substantiate the premise in some mo.dels that mature thunderstorms, moving more slowly than ambient winds, divert and distort mid-tropospheric air motion in a manner similar to solid obstacles in relative streaming flow. Observed ingestion of mid-tropospheric air motion tracers demonstrates that, at the same time, internal circulations aloft are not entirely insulated from the environment.
A graphical synthesis of three-dimensional air flow within and around a typical Great Plains cumulonimbus is presented, accommodating concepts in earlier models with the resolved circulation features. The involvement of cool, dry middle-level air in the internal circulation and its role in maintaining downdrafts are discussed. In con- sidering factors influencing storm movement, i t is concluded that, in addition to propagative mechanisms, hydro- dynamical drag and deflection forces acting a t cloud boundaries may play a significant role in determining a thunder- storm’s preferred path with respect to the mean winds.
1. INTRODUCTION
For nearly a decade, the U.S. Weather Bureau National Severe Storms Project (NSSP) and later the ESSA Na- tional Severe Storms Laboratory (NSSL) have been documenting the Great Plains thunderstorm and its sur- roundings.2 Field investigations, patterned broadly after the Thunderstorm Project of the late 1940s, have been conducted seasonally in south-central Oklahoma since spring 1961. Diversified operations with instrumented aircraft are supported by well-calibrated multiple-purpose radar installations and carried out near and within a network of mesoscale surface and upper air stations.
This paper presents the results of two experiments using the ESSA Research Flight Facility (RFF) DC-6 aircraft to investigate dynamical and kinematical properties of the low- and middle-level air surrounding isolated cumu- lonimbus clouds. Based on air flow derived from aircraft and chaff tracer winds, as well as radar profiles, nearby
‘The National Center for Atmospheric Research is sponsored by the National Science Foundation.
f Project structure, program objectives, and the scope of the data collected are contained in the NSSP-NSSL technical report series, nos. 1, 2, 6. 14, 20, and 23 (available through NOAA, US. Department of Commerce, Washington, D.C.).
rawinsondes, and surface recordings, a generalized inter- pretation of the three-dimensional circulation within and around an isolated Great Plains cumulonimbus is con- strued. Factors influencing storm ‘development, structure, and persistence are discussed, with emphasis on propa- gative mechanisms and hydrodynamical forces acting at cloud boundaries.
9. CASE I, JUNE 1, 1965 SYNOPTIC SITUATION AND STORM HISTORY
A feature recognized as favorable to thunderstorm de- velopment is the confluence of surface winds along the boundary between dry continental air over the southwest United States and the northward flow of maritime tropical air from the Gulf of Mexico. Figure 1 shows that such a zone existed in the Texas Panhandle on the afternoon of June 1, 1965. McGuire (1962) notes that these so-called “dry lines” may remain quasi-stationary for days in this region without becoming active; but under certain con- ditions, they appear to act as mechanisms aiding the formation of large thunderstorms and organized squall
171

172 MONTHLY WEATHER REVIEW Vol. 99, No. 3
lines. According to the statistics of Rhea (1966), this is most likely when a supporting feature, such as the weak trough in figure 2, exists at 500 mb.
Figure 3 shows the trajectory and evolution of the radar echo from a giant cumulonimbus that formed in the moist air near the dry front about 40 n.mi. east- southeast of Amarillo, Tex. The initial echo appeared on the NSSE WSR-57 (weather surveillance radar) at 1340 CST and in 30 min grew to the proportions shown in figure 4. Contours in figure 3 show that, in the area of storm formation, the terrain rises 300 m in about 60 km toward the northwest. With southeasterly flow of 10 m s-’ (fig. l ) , the lifting by this incline is 5 cm s-I. Thus, complementary destabilizing effects of ascent and convergence, as dis- cussed by Byers (1942), were locally favored by moist upslope flow and converging winds at the dry front. The importance of mechanical lift along the “Cap Rock” escarpment is emphasized by noting that, although sta- bility indexes were nearly uniform in the moist air mass to the east, the large cumulonimbus that formed on the dry front was the only significant development of the day.
The environment near this thunderstorm was sounded continuously by a R F F DC-6 during the period 1430-1910 CST. The flight level was 800 mb (-6,400 f t MSL) between 1430 and 1650 CST and 500 mb (-18,250 f t ) from 1705 to 1910 CST; the climb from 800 to 500 mb was on the upwind (west) side of the storm.
FIGURE 2.-The 500-mb streamlines and isotachs (kt) at 1800 CST on June 1, 1965.
FIGURE 1.-Sea-level pressure analysis and location of surface fronts at 1800 CST on June 1, 1965.
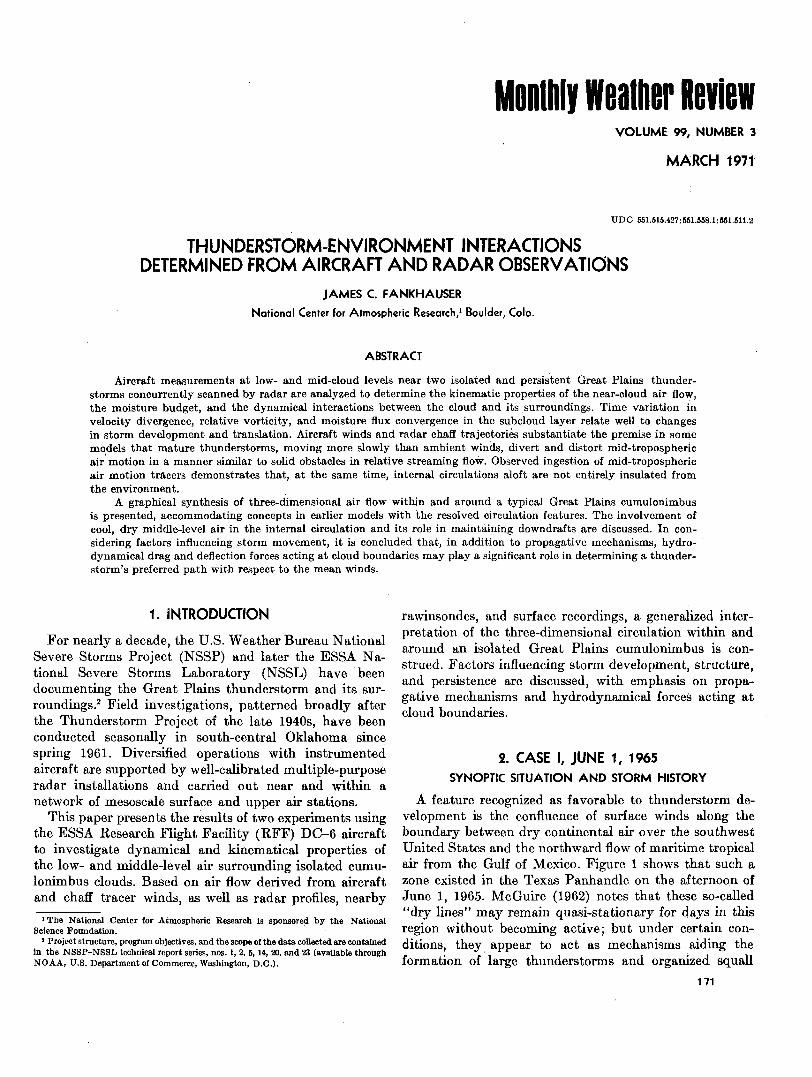
FIGURE 3.-PPI (plan position indicator) radar echo trajectory and 1800 CST observed and relative wind hodographs for June 1, 1965 (inset). The hourly echo position and configuration at the reduced gain (Z-lol mmo m-3) are shown by hatching and by 30-min displacement marked on the track. The thin irregular lines are topographic contours. The arrows on the aircraft track represent looking angles for the photographs in figure 4.
The radar echo history in figure 3 demonstrates the persistent character of the storm. As shown by the hodo- graphs in the inset, the ambient wind had pronounced vertical shear, and the echo track indicates that the storm movement was to the right of the winds a t all levels during much of its lifetime. Heavy rain and hail damage were observed along the west-east portion of the track, but no tornadoes were reported. The characteristics of storms with this behavior have been summarized by Browning (1964), who labeled them “SR storms” (S for severe, for right-moving).
March 1971 James C. Fankhauser 173
FIQURE 4.-Photographs of large developing cumulonimbus taken between 1415-1430 CST from research aircraft flying at 18,000 f t along the track shown in figure 3. The top picture corresponds to the earliest position and looking angle.
RHI (range-height indicator) profiles obtained from R F F RDR-ID (airborne radar3) film are presented in figure 5. Stationarity in the echo codgurations found along the same general cloud section over a period of about 3% hr is evidence that internal circulations were at leasi, statistically steady with time, a paramount feature in Browning’s interpretation of SR storms. Further evidence
3 The specifications for this radar and a detailed description of the other meteorological instrumentation aboard the RFF DC+ me given in Reber and Friedman (1969).
of the “Severe-Right” character is the extensive echo over- hang in advance of the precipitation column and the region of lower radar reflectivity that penetrates into the core of the storm beneath its highest point and tilts upshear from the region of cloud entry. These echo-free or weakly re- flective zones, recognized by Stout and Hiser (1955) as being associated features of severe hailstorms, have been termed the “vault” by Browning (1964) and are viewed as locations of organized updrafts.

1 74 MONTHLY WEATHER REVIEW Vol. 99, No. 3
1529 C S T FT
\ DENOTES AIRCRAFT POSIT ION. RADAR RANGE , A N D ANGLE
I I
,000
,000
FIGURE 5.-RHI profiles (right) from airborne radar and corre- sponding NSSL, WSR-57, PPI full-gain configurations (left). The densely hatched areas on the RHI denote a signal attenuation of 16 dB. The dashed boundaries of the PPI represent anvil outline. The aircraft position is shown as a small circle; the orientation of respective RHI scanning planes is designated by arrows on the PPI sequence; and the NRO are call letters for a station at Norman, Okla.
KINEMATIC PROPERTIES OF THE NEAR-CLOUD ENVIRONMENT
Winds obtained from a Doppler navigational system are a basis for evaluating the mesoscale circulation in the storm’s surroundings. For achieving a consistent measure of the air flow with respect to the storm, each aircraft ob- servation is positioned in a coordinate system that has the radar echo centroid as its origin. Wind data were available at 10-s intervals; however, analyzed winds were obtained from a 50-s nonweighted five-point running mean.6 With an average air speed of 200 kt, this is equivalent to 2.8 n.mi. or a 5.2-km distance.
Figure 6 shows t*he 800- and 500-mb winds and flight tracks, relative to the PPI radar echo intensity contours as recorded on the NSSL WSR-57 at 1630 CST, early in the storm’s mature state. At 800 mb, a level slightly below cloud base, the circulation closely resembles that found by Fujita and Arnold (1963) near another isolated Great Plains cumulonimbus. Cyclonic curvature, streamline con- fluence, and high wet-bulb potential temperature (dashed lines), all concentrated on the right forward flank, point to an organized area of inflow. Other investigations near the base of thunderstorms observed over the High Plains (Auer and Sand 1966, Auer and Marwitz 1968) also suggest that the right forward flank is the favored location for updraft entry. An analysis of the Thunderstorm Project data by Fujita (1959) showed that sharp wind discontinui- ties found at and near the surface gradually disappear upward toward the cloud base. The absence of discontinui-
ties in the resolved flow at 800 mb is consistent with his analysis.
With respect to the radar echo center, a region of very low Ow (I 17OC) is shown to the left and slightly forward of the maximum reflectivity. Browning (1964) concludes that the most intense downdraft should also be found in this region of the storm. On the 1800 CST RAOB (radio- sonde observation) at Amarillo in the upwind direction, Ow of 17OC is found between 600 and 500 mb, giving support to the judgment that air participating in the downdraft enters the cloud circulation at levels aloft.
Although data are lacking in some crucial areas, the analysis of 500-mb winds in figure 6B shows some of the features observed in hydrodynamical experiments in- volving solid cylinders in quasi-potential Most notable are the maximum wind bands on both flanks of the radar echo (also evident in fig. 7) and the tendency for streamline confluence and light winds beneath the anvil in the lee of the storm that suggest a wakelike regime as analyzed by Fujita and Arnold (1963).
Flight tracks in figure 6A show three nearly complete circuits around the cloud at the 800-mb level. By over- lapping data from successive circuits, it is possible tcs obtain three sequential and essentially independent evaluations of the net circulation, divergence, and relative vorticity near the base of the storm. A single estimate of the same quantities is provided by the closed flight loop at 500 mb. For the computations, the following analytical expressions are used :
relative circula,tion I’= I;V,AL, (1)
divergence ~ = - ~ v , , A L , 1 - A
and rela tire vorticity [ = r/A. (3)
Summation around a closed circuit of length L and area A is denoted by 8, and V, and represent the normal (positive outward) and tangential (positive cyclonic) components of the average wind along a segment AL=cAt where c is the aircraft ground speed less the cloud motion.
Table 1 lists results of the computations. The time variations at 800 mb are of particular interest. Circula- tion and tangential velocity, and thus the relative vorticity, are cyclonic and largest for the period centered on 1545 CST, just before the storm veers to the right, but diminish significantly thereafter. By contrast, convergence increases markedly as the storm assumes a more eastward course. The winds measured around the 500-mb cloud circuit were convergent but less so than at cloud base. Net anticyclonic vorticity at the 500-mb level is consistent with the location of maximum velocity on the storm’s left flank as shown in figure 6B, but it should be recognized that the results are dependent to some degree on flight track location.
4 Raw wind data were processed according to procedures outlined in Friedman et al. (1969).
6 A recent study (Duchon 1970) of the error variance in Doppler winds indicates that extension of the averaging interval improves the accnracy of winds obtained from the ESSA DC-6 navigational system.
6 It should be noted that interpretation of the circulations at the m m b level k corn- plicated somewhat by the development of new convective elements in the upwind direction and by the fact that, during the latter- portion of the sounding interval, the stwm ww losing some of its wetlagmized structure (see the RHI profile at 1803 C9T in fig. 6).

March 1971 James C. Fankhauser 175
STREAMLINE
ew O C
1430 C S l ‘ *START
B I I FIGURE 6.-Aircraft flight data positioned relative to radar echo centroid (bold cross). (A) 800-mb track, winds (m s-l), streamlines, and
wet-bulb potential temperature, ew (“C). The loss of the positive Doppler navigation results in missing wind data between 1453 and 1510 CST. The aircraft track during this period is established by relative positions between the aircraft and the storm echo determined from airborne weather radar. (B) 500-mb track, winds (m s-l), streamlines, and isotachs (dashed). The radar echo configuration and intensity gradient (6-dB intervals) are from the NSSL WSR-57 PPI a t 1630 CST.

176 MONTHLY WEATHER REVIEW VOl. 99, No. 3
km
FIGURE 7.-Winds (m s-1) and temperatures (“C) near a cumulonim- bus cloud in the USSR Odessa region on June 29,1965. The fiight altitude is 9.1 km (-300 mb) ; and the cloud height is 1Ck10.5 km (after Shmeter 1966, streamlines and isotachs added). The 20 DO. .s-I isotach (heavy dashed) shows maximum winds located on the cloud flanks.
Mean horizontal divergence in the upper reaches of the cloud was estimated from expansion of the radar echo produced by the anvil “blowoff,” represented by the dashed PPI echo contours in figure 5. I n the practical evaluation,
- B A A D=- - A At (4)
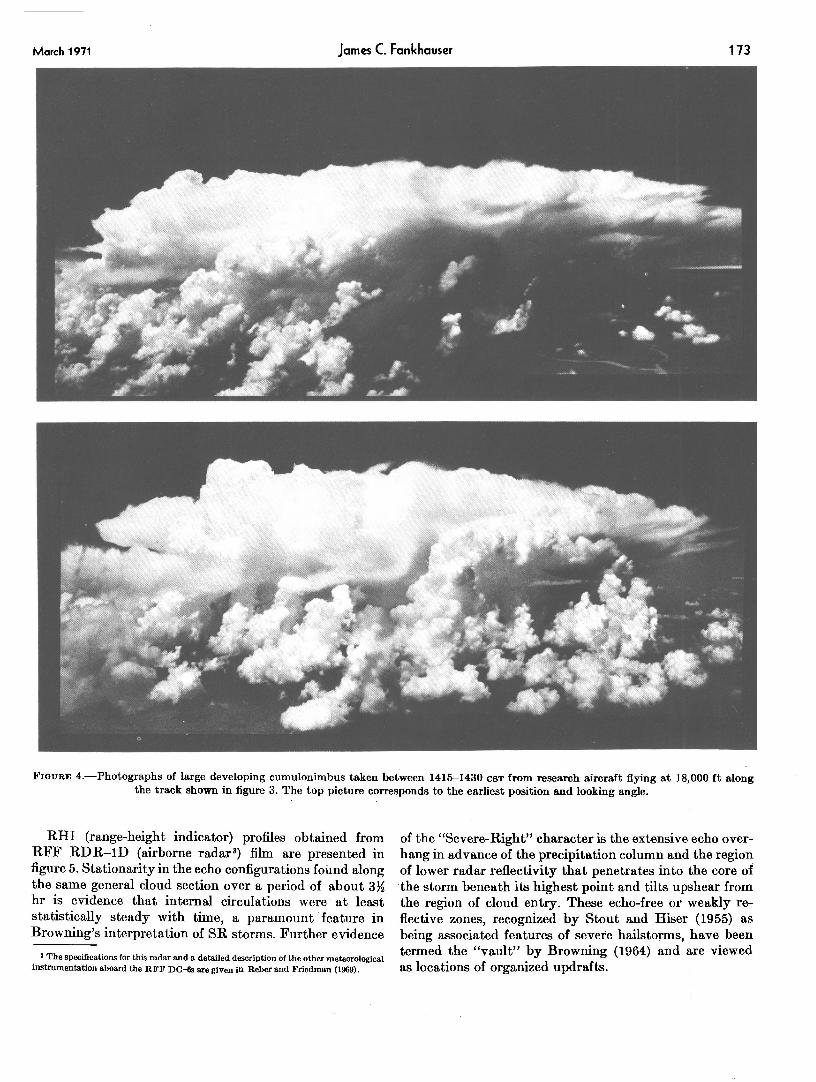
is considered, where A is taken as the anvil area near the middle of the cloud’s life history and AA is measured during the time interval At (-7 min) between successive PPI radar configurations. The vertical echo profile in figure 8, synthesized from the RHI presentation a t 1620 CST in figure 5 , places the leading edge of the anvil at 32,000 f t MSL or near 280 mb. Average divergence7 com- puted for this level, during the period when interpreta- tions based on radar information suggest steady cloud circulations, is 1.3 X s-l. This magnitude compares closely to that of the convergence near cloud base and corresponds to numerical results of Pastushkov and Shmeter (1968) who found that the horizontal flows toward and away from cumulonimbus clouds a t low and high levels are purely compensatory.
Vertical profiles of net divergence and associated kine- matic vertical velocity are shown on the right side of figure 8. Their shapes are derived from the simplest inter- pretation of the values in table 1 (points 1 and 2) and
7 This is likely to be an underestimate because of subsidence and evaporation of radar- reflecting ‘h ydrometers.
TABLE 1.-Summary of kinaat ic properties
- L P V” i l
D I
f
Mean flight-level pressure Time
Length of closed flight track area enclosed mean circuit radius mean radial wind component mean tangential component relative circulation horizontal divergence relative vorticity
800 1546
306 5.8 43
-2.2 . 6
18.0 -1.2 3. 1
8I#) 1600
330 6.3 45
-3.1 . 3
10.6 -1.6
1.7
sa0 1615
280 4.9 40
-3.0 . 2
4.5 -1.7
.9
WD 1745 - 446 12.2 62
-2.2 - . 1 4.8 - .8 - .3
are deduced from the anvil expansion (point 3). The zero crossing on the vertical velocity curve, designated as point 4, was arbitrarily set near the top of the RHI profile, assuming that upward motions must be minimal near the cloud’s highest point.
Since visible cloud was observed to occupy only a fraction of the area enclosed by the flight track L, ascent at the rate indicated in figure a obviously did not occur uniformly everywhere within L. A more realistic view may be that the air at low levels converges from the mean radius enclosed by L toward the cloud under conditions that approximate a conserved mass flow rate, that is, vnr=constant. With this condition, the radial inflow in- creases to 12 m at a radius of 10 km (essentially that Qf the radar echo extending above the anvil level), and the associated convergence becomes 2.4X s-l. This is an order of magnitude greater than values calculated across L, 40 to 45 km from the storm’s center and would be re- flected in a corresponding increase in the net vertical velocity within the storm.
If net vertical draft velocities of tens of meters per second are actually attained over large regions within the cloud, then significant daerences undoubtedly exist between in-cloud and ambient horizontal air motions. As hypothesized by Newton and Newton (1959), Pastushkov and Shmeter (1968), and Alberty (1969), a large diPfer- entia1 velocity at mid-cloud levels can account for the presence of an effective obstacle and the inertial resist- ance it poses to the environment. The implications of these possibilities are expanded in a later section.
MOISTURE BUDGET CONSIDERATIONS
Detailed aircraft measurements of wind and moisture a t 800 mb afford a means for evaluating the storm’s balance of moisture in its mature stages. Convergence of water vapor M , into the region confined within the closed loops L, was calculated from
(5)
where Ap is pressure depth of a layer and is the average specific humidity over the interval AL. Distributions of specific humidity in the subcloud layer are derived from
March 1971 James C. Fankhauser 177
60
50
.+ + 40
O Y -30 I - I - X I 2 20-9 w w I I
10.
0 -
- n
r
-
- _ E --
FIQURE S.-Mesoscale divergence (D) and vertical velocity (O and w ) profiles (right) derived from aircraft and radar measurements. The RHI profile from airborne radar at 1620 CST is shown at a common height scale.
infrared hygrometer measurements of absolute humidity obtained at flight level.
Since aircraft observations apply only to a single point in time and space, extension of the results to three dimen- sions requires vertical extrapolation of the flight-level results. Examination of the distribution of wind and moisture profiles obtained in the aircraft’s climb from 800 to 500 mb and 1800 CST rawinsonde ascents made at Ft. Sill, Okla., and Amarillo, Tex., indicated that the condi- tions at 800 mb were fairly representative of the mean conditions in the subcloud layer near the storm. If the water vapor convergence computed for the 800-mb level (about 100 mb above ground) is assumed to apply uniformly to a layer of 200-mb depth extending from the surface to cloud base, the net moisture flux convergence into the region beneath the storm during its early persistent stage becomes, from eq (5), 2 8 X I O 6 kg s-l.
The precipitation efficiency of the cloud system may be calculated by comparing the rainfall rate at the ground with the moisture convergence into the cloud circulation. Rainfall data were sparse in the region affected by the storm, but the relationship between radar reflectivity and rainfall rate (Z-R) affords a means for assessing the precipitation rate.
The cloud was 150 n.mi. from the NSSL radar when aircraft measurements involved in the moisture con- vergence calculations were obtained. At this range, the precipitation echo extending below about, 10,000 ft is not detected; but as the profiles in figure 5 indicate, this is only a small fraction of the overall echo volume. The exponent on r in the simplified radar equation8 was adjusted upward to compensate for the dependence of echo intensity on range, as recommended in an empirical study by Baxter (1966). Based on the revised exponent, reflec- tivity factors for discrete echo intensity steps were used to determine the corresponding rates according to the
* Radar reflectivity is defined as Z = ( P , / P I ) (r*/C) where P , is the power received; Pt, the power transmitted; and C, the radar constant determined from its physical characteristics.
rela tionship 2 = 2 O O Rl.6. (6)
PPI intensity contours were traced for all available step-gain sequences spanning the lifetime of the storm. Areas of the various steps were determined with the aid of automatic chart readers, multiplied by the adjusted Z-equivalent rainfall rates and summed for each sequence to evaluate the average storm-wide precipitation rate as a function of time.
Variations in total echo area A, total mass precipitation rate P , and precipitation rate per unit area R during the life cycle of the convective system are shown in figure 9. While echo area is fairly constant between 1600 and 1800 CST, during the storm’s motion to the right of the upper winds, its water output displays an increasing trend until just prior to the turnback to the left and dissipation.8 These features compare favorably with earlier interpre- tations of the cloud system’s persistent character and its motion relative to the moist air in the subcloud layer. Ex- cessively high output rates between 1700 and 1810 CST, peaking near 1745 CST, may not be representative, since hail observed at the surface during much of this period invalidates the relationship in eq (6).
Confidence in the use of the Z-R approach for estimating the rainfall at the ground at the time of aircraft moisture flux measurements, early in the persistent stage, is gained, however, by a comparison with observed rain-gage data shown in figure 10. Maximum rainfall rates, as well as changes in rate recorded directly beneath the storm, are well correlated with the highest radar reflectivity and strong reflectivity gradient. Total rainfall deposited at this gage between 1542 and 1654 CST amounts to 1.52 in. (38.6 mm) for an hourly rate of 32.2 mm hr-l. The average hourly rate calculated from quantitative radar data during the same period is 34.6 mm hr-l.
9 The echo area in figure 9 corresponds to the full-gain radar return, while configurations in figure 3 relate to a reflectivity contour of Z-tD1 mma m-3; thus, echo expansion indi- cated in figure 3 is consistent with the increasing water-output trend in figure 9.

178 16
15
14
13
12.
I1
10 - I L
= L
y" ? E 2 a 6 - - u
5 -
4 -
3 -
2 -
I -
- O'
MONTHLY WEATHER REVIEW Vol. 99, No. 3 - . . -
- -
9.T E - =
7 . -
50
4 0 .
30
32 8 0 , I 1 , 1 , , . , , . , , , , , . , , , , . , , , , . . , , , , ,
-
-
...... ............ P , L l O U l D WATER O U T P U T
R . RAINFALL RATE PER UNIT ECHO AREA
- - _ - A . E C H O A R E A
60 701 ~
- - - .
10
0 " ' " ' ' " ' " ' ' " " ' ' " ' ~ ' ~ * " " O
18 N-
16
14
12
10
1 8
6
4
2
FIGURE 9.-Time history of full-gain radar echo area A, liquid water output P, and precipitation rate per unit echo area R, computed from 2-R relationships. The changes in the echo's trajectory are marked on the abscissa.
S C A L E I " " ' ' I Km 0 10 2 0 3 0 40 5 0
10
~~
10 1700 1650 1640 1630 1620 1610 1600 1550 1540 1530 C S T
TIME
FICKJRE iO.-Rainfall rate (inverted histogram) computed from a recording rain gage a t McLean, Tex. (for position relative to storm path, see fig. 3), superimposed upon 6-dB echo intensity contours a t 1630 CST. The base of the rate profile represents the echo's path across the rain gage.
Table 2 lists comparisons of the storm's water output with water vapor convergence estimates abtained from eq (5). Although the curves in figure 9 and the results in table 2 both display considerable scatter, there seems to be reasonable evidence that. earh in it.9 nersirtent state. the
TABLE 2.-Summary of water vapor jluz-precipitation relalionshzp
Explanation Time (CaT)
1546 1600 1615 Mean
a. Water vapor convergence across vertical boundary surrounding moist suboloud layer at flight-track radius, ? (see also table 1)
b. Precipitation rate assuming that allcon- verged vapor is condensed and reaches the surface beneath the radar echo (mm hr-1) 51 68 53 54
c. Liquid water output derived from quan- titative radar measurements (from P curveinfig. 9) (1Wkgs-1) 14 17 18 16
d. Average equivalent rainfall rate per unit radar echo area (mm hr-1) 31 30 35 32
e. Precipitation efflciency (line d data divided by line b data) (%) 61 52 68 60
(1Oakgs-1) 24 32 29 28
convective system was converting approximately 60 percent o j the converged water wpor into r a i n j d at the ground.
Based on the assessed water vapor convergence near cloud base, an estimate of the horizontal area required to supply the storm's moisture needs during its persistent phase may be derived. If the moist layer on which it feeds is 200 mb deep and has a mean specific humidity l o of 10 g kg-l, an available water vapor mass of 20 kg exists over each square meter of surface area. At a steady ac- cumulation rate of lo1' kg hr-I (28X106 kg s-l, from table 2), 2 3 X 10'O kg of water vapor would be fed into the storm circulation during the 2.3-hr west-to-east traverse shown in figure 3. When considering that 20 kg m+ is available, an effective area, A,, of 11,500 km2 must be intercepted to supply the moisture consumed. With an average storm diameter of 50 km and an average speed of 31.5 km hr-I, a surface area, A,, of 3600 km2 is swept over by the traveling radar echo during the same peri0d.l'
The ratio A,/A, leads to the conclusion that, during the persistent stage, the areal extent of the moist air mass
10 Estimated from soundings on the moist (east) side of the dry front 11 A schematic representation of the relationship between a storm's path and it8 effective
swath through the moist low-level air mass is given by Newton and Fankhauser (1% I y - - - . . . . . . . . . -. . . . . , fig. 7).
March 1971 James C. Fankhauser 179
200
km c
180 -
I I I I I I 1 Y WAT
1 5- -
2 0 0
km
180
160
140
120
100
80 +LT S
6 0
40
20
0
2 0
+ I I I I
WAT
- " \ 1600CST - \ 2 \' 28 MAY 1967 , SPS I B I I I I I I
\
2 A
FSI z '+ P V Y
T --+
0 m 1-1
1500 CST 28 MAY 1967
0 20 40 T 6 0 80 100 '120 140 160 180 2 0 0 k m
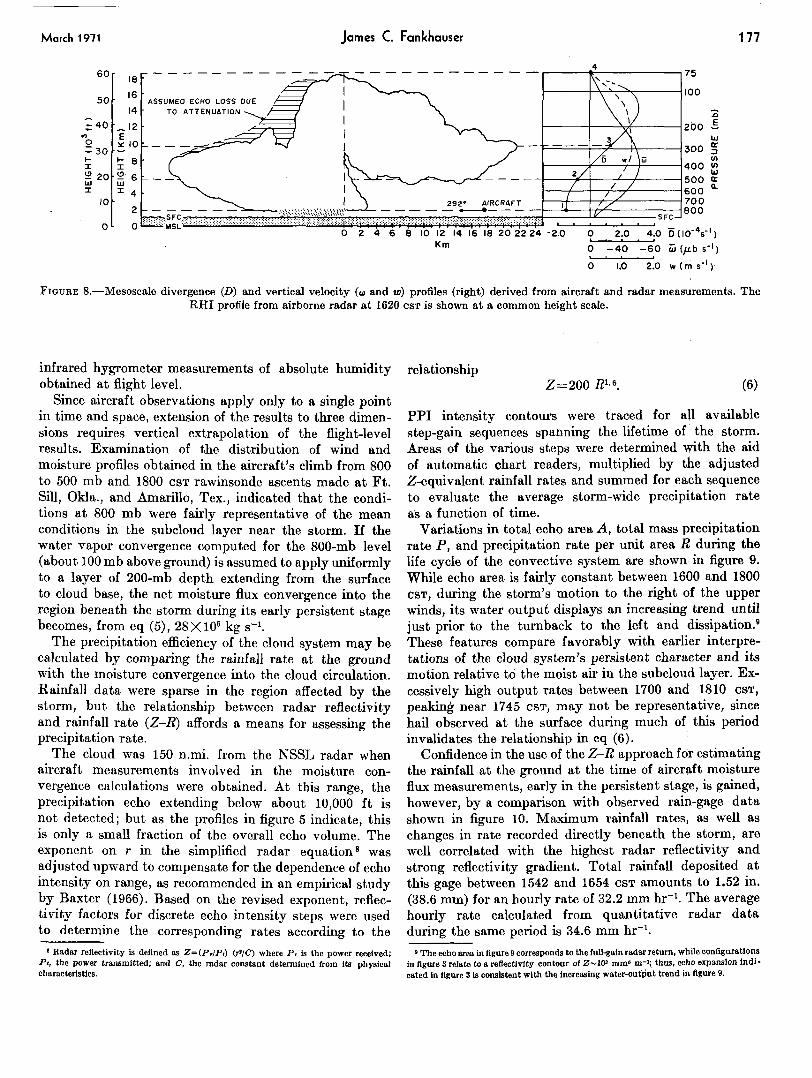
FIGURE 11.-NSSL mesonetwork, showing frontal (heavy solid) and mesosystem (heavy dashed) boundaries, radar echo position and intensity (contour interval, 10 dB), and surface winds at 1500 (A) and 1600 CST (B) on May 28,1967. The vectors originate at surface recording sites, and the bold dots designate special rawinsonde stations. The lower range limit in radar surveillance is shown as a lightly dashed circle (after Fankhauser 1969).
required to feed the storm circulation is roughly three times larger than the area swept over by the storm itself. Because large isolated thunderstorms of the type analyzed here draw moisture from a considerable distance, it follows that an air mass characterized by horizontally and vertically uniform moist air distribution is inherently limited in the number of convective storms it can sustain over a given geographic area. This is to say that, if thunderstorms are large and persistent, from the standpoint of their moisture
requirements, the spacing be tween them must necessarily be greater than in the case of convective clouds of small to moderate size and intensity.
3. CASE II, MAY 98, 1967
An experiment to establish more firmly the dserential flow between in-cloud and surrounding air was conducted on May 28, 1967, within the NSSL network. Figure 11 shows the location of surface and rawinsonde sites, surface winds, and the appearance of radar echoes near the beginning and end of the period of aircraft investigation. A detailed three-dimensional analysis of the storm environment structure has been presented by Fankhauser (1969), and only a brief summary will be presented here.
A stationary front, lying a few miles north of the NSSL network in the morning, sagged southward during midday, providing sufficient low-level convergence to set off weak thunderstorms over the northwest portion of the network. Events at low levels were simultaneously enhanced by insolation and the passage of the strongly diffiuent upper shortwave trough during early afternoon. As a conse- quence, echoes of moderate intensity developed as shown in figure 11A; and storm A is the subject of this study.
Although it displays many similar characteristics, this convective system is considerably less intense and per- sistent than that in case 1. The first echo appeared on the NSSL WSR-57 PPI shortly after 1400 CST and had reached the mature stage by 1500 CST. A history of the RHI echo, thereafter, is presented in figure 12. The echo height remained approximately steady between 1500 and 1540 CST, with a maximum radar reflectivity occasionally exceeding lo5 mm6 m-3. In the light of average raindrop terminal fall velocities, the decline rate of the echo top of nearly 3 to 4 m s-l during the dissipation stage suggests an absence of organized updrafts after 1600 CST.
The horizontal echo velocity was remarkably constant during the period of aircraft investigation, direction of travel and speed (245'/8 m s-') being about 20' to the right of, and 1 m s-' less than, the mean wind in the troposphere (225'/9 m s-l). The storm track was S-shaped as in figure 3; in the formative stages before 1500 CST and late in the dissipating stage after 1615 CST, the echo movement corresponded closely to the mean wind speed and direction.
EXPERIMENTAL AND ANALYSIS PROCEDURES
An RFF DC-6 sounded the cloud environment in a manner similar to that described in case I. Two clockwise circuits were flown at the 500-mb level between 1500 and 1550 CST during the system's mature stage. After descent to the 800-mb level, three circumnavigations were com- pleted between 1600 and 1630 CST while dissipation was occurring (fig. 12). Aircraft tracks and winds, positioned relative to the radar echo center, are presented in figure 13 for the two flight levels.
For tracing air motion relative to the cloud, seven packets of radar reflective chaff were ejected from the air- craft at 500 mb on the first northbound upwind leg; and a few minutes later, six more were dispensed in the down- wind region. Positions of the 13 chaff targets, soon after
415-428 0 - 71 - 2

180 MONTHLY WEATHER REV1 EW Vol. 99, No. 3
!! A
70 - 1
I I 1 I I I
the last was released, are pictured in figure 14 relative to the storm's precipitation echo. A deposition interval of 45 s and average air speed of 110 m s-l resulted in a chaff echo separation of approximately 5 km.
Chaff displacement was calculated from the time lapse photography of the PPI display recorded by an ARSR-ID (air route surveillance radar) , a navigational control radar located at Oklahoma City-Will Rogers Airport, an FAA (Federal Aviation Administration) facility. The radar, operated on MTI (moving target indicator) mode through- out the experiment, accepted only those targets having a radial velocity larger than about 1 or 2 m s-l. Radar re- turns from targets moving with a large cross-beam com- ponent were therefore partially canceled, or at least strongly attenuated.
Manufacturer specifications list a terminal fall velocity for individual chaff elements of 0.5 ft s-l (-15 cm s-l).
60
50
40
30
20
12 Individual chaff dipoles consisted of metallic coated Fiber&@ needles, with a diameter of 0.0076 in. (-190 pm), cut at the wavelength of the L-band tracking radar and having a radar cross section of 80 cmz. (Mention of a commercial product d m not constitute an endorsement .)
-
- - - -
tf Lm 1500 1510 1520 1530 1540 1550 1600 1610 1620 1630 CST
16 262. 266. AZIMUTH 270. 274. 50,000
14
12
10
8
6
4
2
0
FIGURE 12.-RHI radar echo time history of mature and dissipating stages for (A) in figure 11. The slope of the dashed line corresponds to the descent rate of 3.6 m s-*.
lot Iom_s-' 1503-1551 CST 500 mb 1 01 1 1 1 1 I I I
0 IO 20 30 40 50 60 70 BOKM
Magnitudes of the mesoscale vertical velocity fields sur- rounding the cloud (Fankhauser 1969) indicate that the chaff's net vertical motion could range from 0 to -0.5 km hr-l. With average environment winds of about 50 km h r l , the horizontal displacement is 100 times greater than the largest vertical displacement that might be ex- pected. Lateral motion, as resolved from PPI tracking, can therefore be taken as a reasonably accurate basis for defining horizontal wind at the level of release.
As seen in figure 14, the appearance of the chaff echoes, soan after release from the aircraft, is characteristic of point targets in that beam-width effects result in stretch- ing normal to the radar-beam axis. Further lateral expan- sion in this sense can result from eddy diffusion, while heterogeneous terminal fall velocities combined with vertical wind shear can lead to eventual skewness of the echo with respect to the beam axis. When considering the normal condition of wind veering and increasing with height, it is most likely that those chaff elements forming the right, forward part of the overall echo have undergone the least downward displacement and best approximate the air motion at the level of emission into the flow. Con- versely, the left rear section is apt to consist of needles (possibly clustered) that have experienced the greatest downward motion. When foyowing this reasoning, the extreme right forward edge of 'individual echoes was used to evaluate chaff displacement. Positions were determined from the PPI film records at 5-min intervals, and trajec- tomes and associated winds ,were derived by smoothing displacement increments over 10 min. Trajectories of the seven targets released on the upwind side of the storm echo are shown in figure 15A with the echo's motion vector over the equivalent time interval represented by the bold axrow. Streamlines relative to the moving storm are shown in figure 15B.
35 '
30 '
25
20
15
800 mb 1559 - 1634 CST
0 0 5 10 15 20 25 30 35 40KM
FIGURE 13.-(A) aircraft track (dashed) and winds (vectors originate at track) at 500 mb, averaged over 1 min and positioned with respect to the stationary radar echo centered at the cross; (B) same as (A), except data applies at 800 mb and is averaged over 30-3 intervals.
March 1971 James C. Fankhauser 181
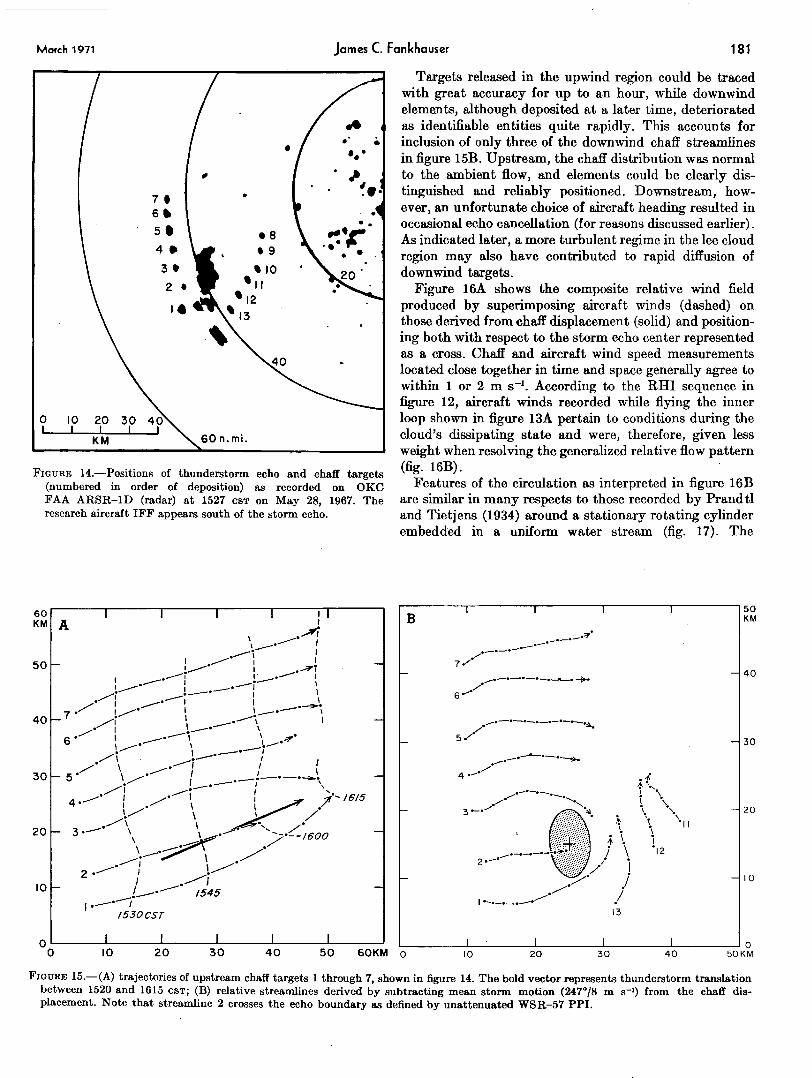
FIGURE 14.-Positions of thunderstorm echo and chaff targets (numbered in order of deposition) as recorded on OKC FAA ARSR-ID (radar) at 1527 CST on May 28, 1967. The research aircraft IFF appears south of the storm echo.
I I 01 I 1 I I I I 0 IO 20 30 4 0 50 60KM
Targets released in the upwind region could be traced with great accuracy for up to an hour, while downwind elements, although deposited at a later time, deteriorated as identifiable entities quite rapidly. This accounts for inclusion of only three of the downwind chaff streamlines in figure 15B. Upstream, the chaff distribution was normal to the ambient flow, m d elements could be clearly dis- tinguished and reliably positioned. Downstream, how- ever, an unfortunate choice of aircraft heading resulted in occasional echo cancellation (for reasons discussed earlier). As indicated later, a more turbulent regime in the lee cloud region may also have contributed to rapid difEusion of downwind targets.
Figure 16A shows the composite relative wind field produced by superimposing aircraft winds (dashed) on those derived from chafT displacement (solid) and position- ing both with respect to the storm echo center represented as a cross. ChafT and aircraft wind speed measurements located close together in time and space generally agree to within 1 or 2 m s-l. According to the RHI sequence in k u r e 12, aircraft winds recorded while flying the inner loop shown in figure 13A pertain to conditions during the cloud’s dissipating state and were, therefore, given less weight when resolving the generalized relative flow pattern (fig. 16B).
Features of the circulation as interpreted in figure 16B are similar in many respects to those recorded by Rand tl and Tietjens (1934) around a stationary rotating cylinder embedded in a uniform water stream (fig. 17). The
B I I
._._.-. -*7- ,.-.-.--- 7 ./e
I I
13
I ’ I I I IO 20 30 40
5 0 KM
40
30
2 0
I O
0 ;M
FIGURE 15.-(A) trajectories of upstream chaff targets 1 through 7, shown in figure 14. The bold vector represents thunderstorm translation between 1520 and 1615 CST; (B) relative streamlines derived by subtracting mean storm motion (247O/8 m s-l) from the chaff dis- placement. Note that streamline 2 crosses the echo boundary as defined by unattenuated WSR-57 PPI.

182 MONTHLY WEATHER REVIEW VOl . 99, No. 3
A
I 4
9 I 4
4 I 7
S c o l e
FIGURE 16.-(A) composite 50@-mb relative wind field around the thunderstorm centered on the cross, derived from aircraft measurements (dashed) and chaff displacement (solid). The vector magnitude (m s-l) appears at the tail. (B) synthesized streamline andisotach pattern based on winds in (A). The dash-dot line denotes the wake axis.
FIQUHE 17.-Flow about a stationary, cyclonically rotating cyclinder embedded in a uniform water stream moving from left to right.The ratio of the tangential velocity a t the cylinder periphery to speed of the uniform flow is 3 (after Prandtl and Tietjens 1934, fig. 1, plate 8).

March 1971 James C. Fankhauser 183
FIGURE 18.-Relative winds, streamlines, and isotachs (kt) around an isolated cumulonimbus near Topeka, Kans., on Apr. 21, 1961. The relative wind is obtained by subtracting the storm's velocity, 268'/22 kt, from winds measured by airborne Doppler radar (after Fujita and Grandoso 1968).
analysis also corroborates the results of Fujita and Grandoso (1968), shown for comparison in figure 18. Chaff winds are clearly diffluent immediately upstream, while winds from both data sources demonstrate a tendency for confluence to the lee of the cloud. Relative velocity, which averages about 5 m s-l in the undisturbed airstream, increases to maxima of 10 m s-l on the storm's right flank and 7 to 8 m sv1 on the left side. A speed deficit of 1 to 2 m s-' exists over a broad area in the downstream region and reflects the resistance imposed by the storm on the uniform ambient flow.
Although the streamlines, as resolved in figure 16B, suggest essentially laminar flow, the early dissipation of chaff elements, identified as 8, 9, and 10 in figure 14, suggests a wakelike regime that may be quite turbulent in character. Analytical difficulties encountered in this region, attributed in part to the MT1 radar characteris- tics, may have been compounded by irregular displace- ment and rapid target diffusion caused by eddies of a scale smaller than those resolved by the observational and analysis techniques employed.
Relative streamlines in figure 15B demonstrate that one of the chaff elements released on the upwind side crossed the radar echo boundary as defined by the WSR-57.
While targets 1 and 3 diverge and accelerate relative to the storm, element 2 decelerates and enters the right rear flank. The location of cloud entry is, however, undoubtedly influenced by the target's position with respect to the storm at the time of its release into the air flow.
Aircraft temperature and moisture measurements near the upwind cloud boundary a t 500 mb indicated wet-bulb temperatures (e,) of 18.5OC, and nearby rawinsonde observations revealed values as low as 17OC near 600 mb. In moist surface air surrounding the storm, Ow was as high as 23OC. A minimum value of 20°C observed by a surface station located beneath the radar echo during the period of heaviest rainfall can be explained by allowing for some mixing between descending dry air and the warmer rising currents in the updraft. This, combined with the observed ingestion of chaff through cloud boundaries aloft, is taken a,s evidence that middle-level air participated in the storm's downdraft circulation.
4. THREE-DIMENSIONAL THUNDERSTORM CIRCULATION PATTERN
A schematic drawing showing the interacting external and internal air flow associated with an individual persistent Great Plains thunderstorm is presented in

184 MONTHLY WEATHER REVIEW
FIG IURE 19.-Three-dimensionaI interpretation of the interacting external and internal air flow associated with an individual persistent Great Plains cumulonimbus, accommodating the impressions from earlier works and features observed in two Oklahoma field experi- ments. The thin, solid inflowing and ascending streamlines represent the history of moist air originating in the subcloud layer (surface to - 750 mb). The heavy dashed streamlines trace the entry and descent of potentially cold and dry middle-level (700- to 400-mb) air feeding downrushing and diverging downdraft. The surface boundary between the inflow and downdraft is shown as a barbed band. The internal circular bands signify net updraft rotation. The shape and orientation of the dividing external bands represent typical vertical shear and character of ambient relative horizontal air flow at middle (- 500-mb) and upper (- 225-mb) levels. The approxi- mate pressure-height relationship is shown on the left forward corner of the perspective box. The broad flat arrow on the right represents direction of travel.
figure 19. In formulating the shape of the three-dimensional circulation pattern, an attempt has been made to accom- modate various features of earlier convective storm models for the same general region (cf. Bates 1961, Browning 1964, Newton 1966, and Goldman 1968) with the conditions observed in the two field experiments described above. Figure 19 is intended to represent the persistent and quasi-steady development phase, but discussion will a t times consider aspects of the transitory stages of growth and dissipation.
In line with the views of Newton (1950) and Browning (1964), the internal circulation is seen to consist of essentially independent rising and descending branches. Of the total air flux, Newton (1966) estimates that 60 percent ascends from the potentially warm and moist
subcloud layer, while the remaining 40 percent is drawn from potentially cold and dry levels aloft and is the main source for the downdraft.
Based on the relative motions between the organized convective system and the winds in the subcloud layer, the preferred region of entry for the moist idowing air is placed on the right forward flank (cf. figs. 6A and 13B). Streamlines in figure 6A and curvature k low cloud streets, shown in the well-known cumulonimbus cloud photograph by Fujita (1963, fig. 37), demonstrate the tendency for cyclonic curvature and convergence in this region. Converging air, possessing some initial cyclonic vorticity, should have its rotational component enhanced while ascending to the level of maximum upward motion in an updraft that increases With height. Following

March 1971 James C. Fankhauser 185
growth, attended by increasing diameter, the net result is perceived as an insulated rotating core, depicted in figure 19 by the revolving ribbon encircling the rising warm air branch.
Newton (1966) adopted Bates’ (1961) model for calcu- lating the shape of updraft profiles, incorporating the dependence on draft diameter and vertical velocity, and concluded that it is physically possible for air entering the lowest forward side of a large cumulonimbus to emerge at cloud top to the rear. In agreement with this interpre- tation, a general upshear slope is indicated for the updraft as it traverses the storm from cloud base to the penetrating stratospheric dome. This configuration is evidenced by the location of cloud-top turrets in figure 4, on the upshear side of the main convective column, and by the upshear canting of the echo-free indentation demonstrated on RHI profiles in figure 5, regarded by Browning (1964) as the location of strongest updraft.
It is reasonably well established that the rate at which environmental air is entrained through vertical cloud walls is inversely proportional to updraft diameter (Malkus and Williams 1963) , and indirect evidence suggests that the strongest mixing is likely to be confined to a sheath surrounding the updraft core. Thus, only the perimeter of large convective columns is directly exposed to the eroding and diluting effects of surrounding flow; and a portion of the air in the innermost updraft core is allowed to reach the stratospheric towers under conditions that approach pseudoadiabatic parcel theory (Newton 1966, Roach 1967).
Possessing high kinetic energy, this air penetrates into the relatively warm stratosphere with temperatures con- siderably lower than the surroundings and becomes negatively buoyant. Mixing, which is more efficient in the small penetrative turrets, occurs in the diverging outer sheath during descent ; parcels descending into the tropo- sphere, therefore, once again become buoyant, being warmer than those ascending in the undiluted inner core. Newton (1966) suggests that the net result may be viewed as a damped oscillation that ultimately comes to equilib- rium somewhat below the tropopause, where air that has circulated through stratospheric towers is gradually subjected to horizontal accelerations by strong winds a t this level and erodes into the expanding anvil. Fujita and Byers (1962) present data which indicate that nearly 50 percent of the total volume of a large mature hail cloud is concentrated in the visual anvil. Since only part of the low-level inflow experiences stratospheric excursion (New- ton 1966), a large body of air diluted a t boundaries during ascent through the cloud’s waist must also eventually be eroded into the blowoff in the manner described by Hitsch- feld (1960). This is substantiated by the photographs in figure 4 which show that a major portion of the region downwind (right side of picture) from the storm’s highest point is cloud-filled.
Fawbush and Miller (1954) found a significant correla- tion between the maximum surface gusts produced by
Great Plains thunderstorms and the difference between characteristic surface temperature a t the base of down- drafts and the warmer surface temperature surrounding the storm. Their empirical results show that the intensity of thunderstorm outflow increases with increasing tem- perature contrast and imply that the severity of thunder-. storms formed in air masses with given moisture and tem- perature properties at low levels increases with the potential dryness and coolness of the ambient air aloft. More recently, Darkow (1968) proposed an “energy index” for diagnosing potentially severe weather occurrence that involves the participation of cold, dry mid-tropospheric air in the total energy release in convective systems. This is done by com- paring a quantity related to Ow in the lower moist layers to that near the 500-mb level. He found that the synoptic distribution of this index correlated well with severe storm outbreaks in a number of selected cases. In his detailed analysis of the mesostructure of the cold domes of high pressure generated beneath mature convective systems, Fujita (1959) found the excess mass of air, Am, contained within the thunderstorm mesohigh to be directly proportional to R , the water mass precipitated a t the surface. The largest ratios of Am/R tended to be concentrated in the southwestern high plains where the greatest differences between ~9~ a t low and middle tropo- spheric levels are apt to be found. All of these studies support Normand’s (1946) contention that the efficiency and vigor of a cumulonimbus cloud is greatest when “it is organized to take in potentially cool air from higher levels as well as warm air” from below.
From evidence presented earlier, the relative horizontal air motion around an erect convective column in strong vertical wind shear is represented in figure 19 by the broad external bands a t middle and upper cloud levels. Moving more slowly than the winds aloft, the thunderstorm system acts as an obstacle to the ambient winds through a great vertical depth, forcing the airstream to divide and acceler- ate on cloud flanks in the manner described by Newton and Newton (1959). I n the available cases, streaks or bands tif maximum velocity are consistently observed on cloud flanks with a distinct speed deficit indicated dow~wind , where, as suggested by the behavior of air motion tracers in case 11, the flow is also likely to be quite turbulent in character. Although the velocity distribution and stream- lines in figure 16B may be partly influenced by pre-existing ambient vorticity, the implied cyclonic circulation near the cloud may also derive, in part, from viscous coupling between environment flow and in-cloud air ,having net cyclonic rotation. The later condition corresponds to the interpretation of internal draft rotation in figure 19; but the external flow, as drawn, does not reflect the viscous interaction.
A decrease from upwind to downwind in the average wind speed taken across the relative streaming flow im- plies a momentum loss as air passes the cloud. This can be attributed to strong mixing by eddies at cloud boundaries. The mixing process is perceived as one in which potentially

186 MONTHLY WEATHER REVIEW Vol. 99, No. 3
cool and extremely dry air is drawn inward while cloudy air is simultaneously detrained and eroded to form the cloud mass downwind of the main convective column, as discussed earlier.
According to the analyses of Browning (1964) and as shown in figure 3 (inset), middle-level air, possessing the most favorable thermodynamic properties for downdraft production, approaches the storm in the relative sense on the storm’s right flank and should be most readily mixed by eddy processes on the storm’s right forward and left rear sides where the greatest lateral shear between the ex- ternal and internal velocity are apt to exist. When con- sidering mass continuity, a net in-cloud convergence must prevail below the level of maximum vertical motion, which for large and persistent cumulonimbus grown in an air mass with typical potential instability, should be found well above 500 mb (see profiles in fig. 8). Diluted but un- saturated cool cloudy air that has undergone milving on the right forward jlank may then be gradually drawn cy- clonically inward, according to the updraft rotation, while passing over the ascending core, which, as discussed earlier, is characteristically tilted in the upshear sense.
RHI profiles in figure 5 show that a large mass of pre- cipitation is suspended in the region downshear from the echo-free updraft. Browning and Donaldson (1963) called this the “overhang” and concluded that its relatively high radar reflectivity is due to a concentration of precipitation elements that are too small to fall through the under- lying updraft where they are produced and are circulated outward and downwind with time according to the pre- cipitation sorting mechanism proposed by Browning and Ludlam (1962). Hookings (1965) has demonstrated that the evaporative cooling, contributing to the negative buoyancy necessary for downdraft descent, is most ef- ficient when water droplets are small. Hence, as recognized by Browning (1964), middle-level air probably acquires its greatest downward impetus while traversing the densely clouded and precipitation-JiEed downshear region. A favor- able aspect of this concept is that cloudy air depleted by evaporation is continuously replenished by the debris eroded from the active convective column.
As the evaporatively chilled and negatively buoyant air begins descent on the storm’s left forward flank, it also comes more and more under the influence of the convergent and rotating updraft core. Interaction between the de- scending and rising branches acts, through further eddy processes, to circulate the cooled air to a position (A in fig. 19) beneath the sloping ~ p d r a f t , ’ ~ where larger precipita- tion particles are falling from the ascending branch, with- out being appreciably retarded by opposing upward cur- rents (Browning and Ludlam 1962). Although the presence of more massive precipitation elements in this region (both rain and hail) contributes less to downward motion from the standpoint of evaporative cooling, their larger size and
la This mechanism leading to cyclonic circulation in the descending branch differs from that proposed by Browning (19641, where cyclonic precipitation trajectories are seen to result from environment winds backing with decreasing height.
mass allow precipitation drag to come into play. W t a t ~ ~ loading (weight of accumulated condensed water aloft) was recognized in The Thunderstorm; Report of the Thunder- storm Project (Byers and Braham 1949, p. 38) as being a plausible downdraft initiating mechanism for ordinary single-celled thunderstorms ; and in his numerical simu- lation of convective clouds, Takeda (1965, 1966) demon- strated that precipitation drag may be a primary force for downdraft acceleration in vigorous thunderstorm circula- tions in sheared wind regimes. Attaching a secondary role to evaporation in the zone of heaviest rain and most rapid descent helps to account for observed cloud maintenance around the core of downdrafts that reach the surface in an unsaturated state.
E&dy mixing, both at cloud boundaries and internally as proposed above, not only provides a means for explaining kinematic and thermodynamic properties of downdraft circulation but also accounts -fGr a bufler zone that is necessary to accommodate the large dijerences that un- doubtedly exist between erternal and internal horizontal momentum when a storm moves more slowly than the winds. Although horizontal momentum of the ingested mid-tropospheric air is only partially conserved while adjusting to internal circulations, what is retained is op- posed to the momentum of inflowing and ascending cur- rents; and when transported downward to the surface, it acts to produce the characteristic “gust front” (Byers and Braham 1949), shown as the barbed band in figure 19. Lucid descriptions of this, probably the best known feature of vigorous thunderstorms, are given in early chronicles by Sandstrom (1911) and Humphreys (1914), both of whom recognized the importance of downrushing outflowing air in sustaining convection by providing mechanical lift to moist inflowing air along the zone marking the leading edge of cold outflow.
5. STORM PROPAGATION AND STEERING MECHANISMS
I n his early treatise on thunderstorm phenomena, Humphreys (1914) also speculated that the movement of convectuive clouds should be close to that of the air in the layer through which they penetrate; but at the same time, he recognized that the horizontal momentum of air participating in the convective drafts should tend to be conserved. This concept of vertical momentum exchange was expanded by Newton and Newton (1959) to explain the self-propagating nature of large thunderstorms that persist in strong vertical wind shear. When the relative airstream toward and around a cumulonimbus tower is as drawn in figure 19 and vertical wind shear resembles that shown in figure 3 (inset), they theorize that a vertical gradient in nonhydrostatic pressure is generated a t cloud boundaries which enhances new cloud growth in a favored region with respect to the existing convective circulation.
Ascending subcloud air conserving some of its low horizontal momentum is seen to interact with descending

March 1971 James C. Fankhauser 187
mid-tropospheric air, whose high momentum is also partially conserved, to produce a net incloud horizontal speed that differs at all levels from the ambient winds. Relative flow thereby established around the cloud core is, as discussed earlier, characterized by maximum velocity on the cloud’s flanks. Such a velocity distribution near cloud boundaries contributes, in a strongly veering and sheared wind regime, to a pressure deficiency aloft that overlies a nonhydrostatic pressure excess on the right flank at low levels. The location of this vertical hydro- dynamical pressure gradient coincides with the gust front convergence zone in the subcloud region and provides vertical acceleration for the moist inflowing air.
Thus, although generation and maintenance of ascending currents is possible anywhere along the zone of con- vergence at the boundary between inflowing and down- rushing air, it is most favored on the relative low-level upwind side of existing convection (on the right forward flank in a typical vertically sheared environment with southerly flow in the subcloud layer and strong southwest or west minds aloft). Degeneration is most likelj- in the low-level downwind direction vhere neither the necessary sustaining moisture supply nor the benefits of upward acceleration exist. A cycle of generation and decay on right and left flanks, respectively, results in a net right- ward propogation for the system as a whole (Newton and Katz 1958). Browning (1964) has noted that, when thunderstorms are organized and persistent (as in the cases described earlier) , propagation may proceed in a continuous manner, rather than through the evolving process of discrete cell formation and decay. In either event, favorable vertical hSdrodynamica1 pressure gradients on the right forward flank appear to be a plausible mechanism for producing rightward movement.
It has been demonstrated that the effect of these influences on storm propagation increases with storm diameter (Newton and Newton 1959) and that the observed deviation of largest storms farthest to the right of the mean steering flow is consistent with supply-and- demand requirements in the storm water budgets (Newton and Fankhauser 1964). For a given precipitation rate, the amount of water deposited by a storm is proportional to its area or to its diameter squared. The rate at which water vapor is intercepted is, however, a function of the product of the storm’s diameter and its velocity relative to the winds in the moist subcloud layer. Hence, a large storm must ingest more vapor in proportion to its diameter than a small one and requires a greater migration com- ponent relative to the flow in the moist layer. For wind veering with height, this requirement is satisfied if larger storms move farther to the right of the mean tropospheric wind. The areal growth of the case I echo while turning to the right (cf. figs. 3 and 9) is consistent with the fore- going arguments.
Analyses’of air and moisture flux in large cumulonimbus clouds that form in pronounced vertical wind shear (e.g., Newton 1966) shows that the greatest quantity of air
participating in the internal circulation originates in the subcloud layer, By virtue of its conserved horizontal momentum, steady ingestion of this slowly moving air into the updrafts leads to an in-cloud horizontal velocity that departs more and more from the stronger ambient winds aloft as the storm size increases. Although com- pensated to some degree by entrainment of air with high momentum from middle and upper levels, the net result is an inertial resistance to shearing tendenciesI4 and an overall storm, speed that is less than the mean winds through the cloud’s surroundings. Since the entrainment rate decreases as the diameter of convective towers increases (e.g., Malkus 1960), it follows that the speed of larger storms, which travel to the right of the upper flow, should differ most from the environment wind. This was the general tendency found for a sample of Oklahoma storms (Newton and Fankhauser 1964, fig. 14).
In relation to the winds aloft, the movement of the thunderstorms described earlier way in general agreement with the concepts of Browning (1964) and the results obtained for Oklahoma storms by Newton and Fank- hauser (1964) in that, when the radar echoes were largest and most persistent, their direction of travel \vas strongly to the right of, and their speed less than, the mean tropo- spheric flow. There is, however, an increasing body of observational evidence which shows that not all large and persistent thunderstorms move to the right of the winds in the cloud-bearing layer (Staats and Turrentine 1956, Hitschfeld 1960, Newton and Fankhauser 1964, Harrold 1966, Hammond 1967, Achtemeier 1967, and Charba and Sasaki 1968). Severe storms that may produce both hail (Hammond 1967) and tornadoes (Staats and Turrentine 1956) and usuallyform with a right-moving counterpart have been observed to depart as much as 40’- to the left of the mean tropospheric flow. Figure 20 summarizes the ob- served radar echo movement and upper winds in five documented cases where large thunderstorms existed simultaneously and traveled along widely divergent paths to the right and left of the mean winds in the troposphere.
Comparison of storm velocity with upper winds in figure 20 indicates that all of the fast-moving leftward- deviating storms in the sample traveled to the left of the middle and upper tropospheric winds. Hammond (1967) notes that, as a consequence, the relative wind hodographs for the diverging radar echo couplets are essentially re- flections of one another. The situation is generalized in figure 21, where it can be seen that at low and middle levels the flow, relative to the left-moving element, approaches from the front and left quadrants, respectively; in the case of the severe-right storm, the relative flow at the same levels arrives from the right forward A a&.
With the demonstrated shift in relative wind orienta- tion, vertical hydrodynamical pressure gradi,ents contrib- uting to new convective development, as discussed above for right-moving storms, should be located in the
14 Note that the small cumuli surrounding the large cb in figure 4 have a large down- shear tllt and in some instances are being fragmented from their b,aseS.
415-428 0 - 71 - 3

188 MONTHLY WEATHER REVIEW Vol. 99, No. 3
1525 C S T \ 27 MAY 1965 I
I \ \ 1530 C S T 700 24 MAY 1962
1633 C S T ‘23 APRIL 1964
8 5 0 m b
500
FIGURE 20.-Radar echo configuration and movement (Polid vectors) of diverging thunderstorm couplets (left) and upper winds (right) showing departures from mean tropospheric winds (dashed vector). Note that the left-moving echo consistently moves faster than its right-moving counterpart.
forward sector of the leftward-traveling thunderstorm. Charba and Sasaki (1968) point out that a propagative component, which is in the same sense as the direction of travel, could contribute to the more rapid movement and persistence of the left-moving storm.
The distinct tendency for left-moving thunderstornis to move faster than their right-moving counterp,arts may also be explained in terms of the role of low-level momen- tum. If the boundary layer flow is uniform over a broad
area and has a typical southerly component, conserved low-level momentum, after entering the respective storm circulations, would act to strongly oppose the motion of a right-moving clement and to abet that of the left-moving member (fig. 21).
With increasing migration velocity, the relative flow of subcloud air toward the left-moving thunderstorm is consequently increased; and the important means for supplying sustaining moisture is thereby afforded. In the

March 1971 James C.
N. t i- ,--, P’
/’ ‘, I
FIGURE 21.-Hod0 graph showing the relationship between low-level VL, middle-level VM, and upper level Vu winds (bold vectors) and thunderstorm velocity Vs (dotted vectors) for right- and left- moving (primed vectors) storms. The thin solid and dashed vectors represent the relative flow (subscript R) a t the respective levels. The storm sector where propagation is most favored is denoted by P . Circles of increasing diameter illustrate the relationship between V R L , storm size, and angular deviation from mean wind, V.
-
few available cases, there is the further indication that the systematic relationship between storm size, direction of movement, and water-budget requirements, demon- strated for right-moving storms by Newton and Fank- hauser (1964), can be expected to hold for leftward- deviating thunderstorms, provided they move more rapidly with increasing size. This condition would appear to be supported by momentum considerations.
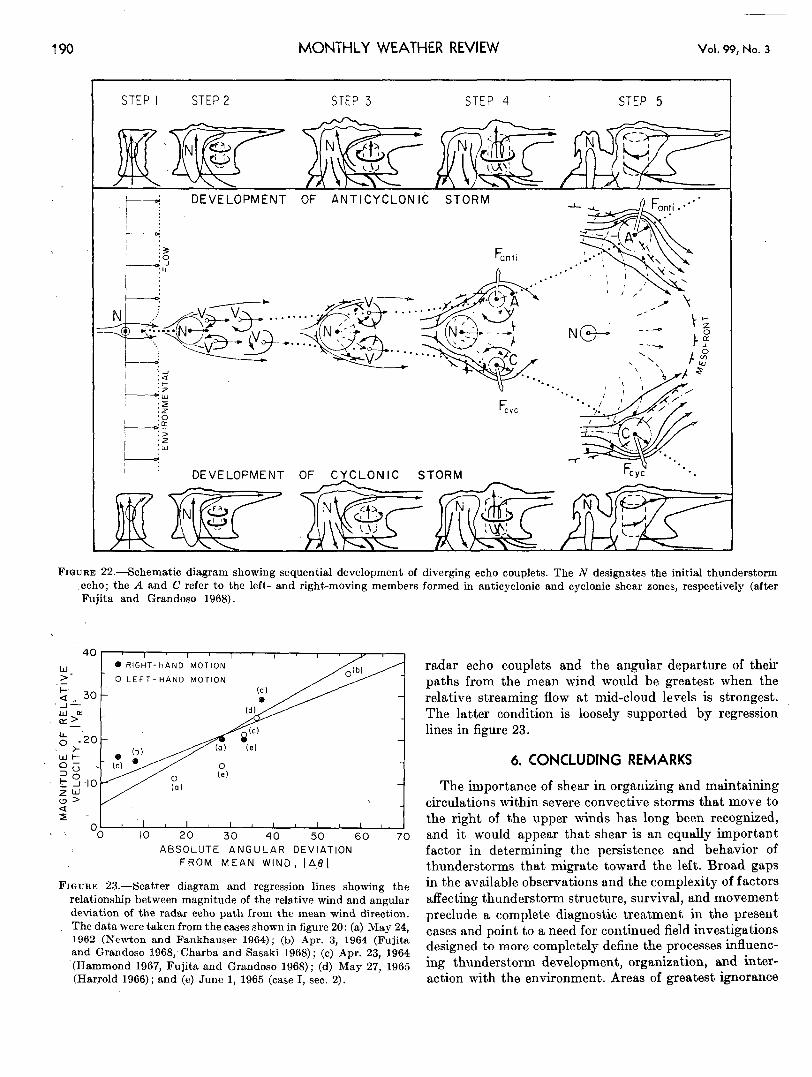
Although the organization, persistence, and movement of both leftward- and rightward-traveling thunderstorms may be explained in terms of momentum and moisture budgets, the selection of a preferred path in their early stages of development appears to be more a function of hydrodynamic steering forces generated at cloud bound- aries. Fujita and Grandoso (1968) have examined the phenomenon of diverging radar echo couplets in detail and formulated physical and numerical models to explain the dynamical processes involved. According to their interpretation of the sequence of events (fig. 22), a single thunderstorm exists (steps 1 and 2) with relative etream- lines having features resembling those demonstrated in figures 16, 17, and 18. After maturity and downdraft formation (step 3), radar echo extensions develop on the right and left forward quadrants of the main PPI echo mass, then intensify (step 4), and eventually separate into diverging left- and right-moving thunderstorms while the parent convective element, robbed of its sus- taining moisture supply, gradually dissipates (step 5).
Dynamical forces considered by Fujita and Grandoso (1968) are: a form drag, which tends to accelerate the cloud column to the velocity of the surrounding air; a
Fan khauser 1 a9
defEection force (Magnus effect) derived from circulation around updraft cores (assumed to be rotating cyclonically and anticyclonically, respectively) , which acts a t right angles to the form drag according to the sign of the circula- tion; and an inertialforce, related to the horizontal momen- tum of in-cloud air. Air rising in a converging updraft while conserving the angular and horizon tal momen tum drawn from the subcloud layer is regarded in their model to be the source of circulation a t the boundaries of the cloud core aloft.
Darkow (1969) has recently called attention to the fact that a normally directed force will exist whether circulation is induced by viscous coupling with a rotating cloud or pre-exists as a consequence of uniform lateral wind shear in the cloud’s surroundings. Kuo (1969) includes both circulation sources in his general analytical treatment of vortices moving in sheared flow and concludes that, when the absolute vorticity of the basic current is nonuniform, an additional force component acting along the vorticity gradient must be considered. Its influence acts to drive cyclonic and anticyclonic vortices toward regions of higher and lower absolute vorticity, respectively.
As indicated in figures 16B and 18, strong cyclonic shear is favored on the right forward flank of an isolated convective tower while anticyclonic shear is concentrated on the left forward flank. New convective elements triggered a t the convergent gust front beneath these strong shear zones should, according to KUO’S (1969) analysis, be subjected to leftward and rightward ac- celerations in response to the associated anticyclonic and cyclonic vorticity gradients.
After growth and separation from the parent convective column, the velocity distribution a t the boundaries of the individual towers is such that the opposite deflective accelerations may be maintained. Flow at this stage may be compared to relative streamlines in the vicinity of vortex pairs (Milne-Thomson 1960, p. 358). Whether or not cloud cores possess a significant degree of rotation, as implied in figure 22, a relative speed minimum is likely to exist in the once wakelike region between them, particu- larly while the parent storm persists. Relative streaming flow, aividing around the system as a whole, then favors excessive anticyclonic shear on the left flank of the left- moving storm and a dominant cyclonic shear zone on the right flank of the right-moving component as indicated by the streamlines in the fourth and fifth steps in figure 22. This in turn maintains the vorticity gradients supporting leftward and rightward acceleration, and the situation can persist as long as the circulations around the individual storms forming the couplet interact. When the separation between the pair becomes great, the relative streamlines revert to the original and most frequently observed condi- tions (figs. 16 and 18) ; and the cycle may then be repeated as was observed in the case of Apr. 3, 1964 (Fujita and Grandoso 1968, Charba and Sasaki 1968).
Since the magnitude of dynamical steering forces is proportional to the relative wind speed, it is tempting to speculate that the likelihood of the formation of diverging
MONTHLY WEATHER REVIEW Vol. 99, No. 3
S T E P I STEP 2 STEP 3 S T E P 4 STEP 5
FIGURE 22.Schematic diagram showing sequential development of diverging echo couplets. The N designates the initial thunderstorm echo; the A and C refer to the left- and right-moving members formed in anticyclonic and cyclonic shear zones, respectively (after Fujita and Grandoso 1968).
o ! " " " 8 1 ' 1 ' 1 ' ' I O 2 0 30 40 50 60 70 ABSOLUTE A N G U L A R D E V I A T I O N
F R O M MEAN W l N O , ( A 8 1
FIGURE 23.-Scatter diagram and regression lines showing the relationship between magnitude of the relative wind and angular deviation of the radar echo path from the mean wind direction. The data were taken from the cases shown in figure 20: (a) May 24, 1962 (Newton and Fankhauser 1964); (b) Apr. 3, 1964 (Fujita and Grandoso 1968, Charba and Sasaki 1968); (c) Apr. 23, 1964 (Hammond 1967, Fujita and Grandoso 1968); (d) May 27, 1965 (Harrold 1966); and (e) June 1, 1965 (case I, sec. 2).
radar echo couplets and the angular departure of their paths from the mean wind would be greatest when the relative streaming flow at mid-cloud levels is strongest. The latter condition is loosely supported by regression lines in figure 23.
6. CONCLUDING REMARKS
The importance of shear in organizing and maintaining circulations within severe convective storms that move to the right of the upper winds has long been recognized, and it would appear that shear is an equally important factor in determining the persistence and behavior of thunderstorms that migrate toward the left. Broad gaps in the available observations and the complexity of factors affecting thunderstorm structure, survival, and movement preclude a complete diagnostic treatment in the present cases and point to a need for continued field investigations designed to more completely define the processes influenc- ing thunderstorm development, organization, and inter- action with the environment. Areas of greatest ignorance

March 1971 James C. Fankhauser 191
at the present time probably center on the role of turbu- lent mixing and the shape of internal circulation patterns. The demonstrated utility of chaff as a tracer in case I1 and recent applications of Doppler radar techniques (Lhermitte 1969) provide some hope that knowledge of air motion within and around thunderstorms may soon be improved.
Thunderstorm data obtained from new techniques is likely to be most completely interpreted when viewed within the framework of supplementary observations provided by radar, aircraft platforms, balloon soundings, and surface networks and collected at time and space intervals that vary from synoptic to cloud scales.
A C K N O W L E D G M E N T S
Data supporting this work were collected and some of the analyses were carried out while the author was on the staff of the National Severe Storms Laboratory. Contributions by NSSL staff members who participated in various phases of data collection and reduction are gratefully acknowledged. Special recognition is due the ESSA Research Flight Facility aircraft crews for their cooperation and Mr. Lester Merritt who operated the tracking radar during the chaff experiment.
REFERENCES
Achtemeier, Gary L., “Trajectories of Thunderstorms and Accom- panying Severe Weather Over the Midwest on August 25, 1965,” Papers of the Fifth Conference on Severe Local Storms, S t . Louis, Missouri, October 19-20, 1967, American Meteorological Society, St. Louis, 1967, pp. 229-236.
Alberty, Ronnie L., “A Proposed Mechanism for Cumulonimbus Persistence in the Presence of Strong Vertical Shear,” Monthly Weather Review, Vol. 97, No. 8, Aug. 1969, pp. 590-596.
Auer, August H., Jr., and Maraitz, John D., “Estimates of Air and Moisture Flux Into Hailstorms on the High Plains,” Journal of Applied Meteorology, Vol. 7, No. 2, Apr. 1968, pp. 196-198.
Auer, August H., Jr., and Sand, Wayne, “Updraft Measurements Beneath the Base of Cumulus and Cumulonimbus Clouds,” Journal of Applied Meteorology, Vol. 5, No. 4, Aug. 1966, pp. 461-466.
Bates, F. C., “The Great-Plains Squall-Line Thunderstorm-A Model,” Ph. D. thesis, St. Louis University, Mo., 1961, 164 pp.
Baxter, Thomas L., “An Empirical Determination of the WSR-57 Radar Range Attenuation Function for Oklahoma Thunder- storms,” Proceedings of the 18th Conference on Radar Meteorology, Norman, Oklahoma, October 17-20, 1966, American Meteoro- logical Society, Boston, Mass., 1966, pp. 67-70.
Browning, Keith A., “Airflow and Precipitation Trajectories Within Severe Local Storms Which Travel to the Right of the Winds,” Journal of the Atmospheric Sciences, Vol. 21, No. 6, Nov. 1964,
Browning, Keith A., and Donaldson, R. J., Jr., “Airflow and Structure of a Tornadic Storm,” Journai! of the Atmospheric Sciences, Vol. 20, No. 6, Nov. 1963, pp. 533-545.
Browning, Keith A., and Ludlam, F. H., “Airflow in Convective Storms,” Quarterly Journal o,f the Royal Meteorological Society, Vol. 88, No. 376, London, England, Apr. 1962, pp. 117-135.
Byers, Horace R., “Combined Effects of Ascent and Divergence on the Lapse Rate,” Bulletin of the American Meteorological Society,
Byers, Horace R., and Braham, Roscoe R., Jr., The Thunderstorm: Report of the Thunderstorm Projcct, U.S. Air Force, U.S. Navy, U 3. National Advisory Committee for Aeronautics, and U.S. Weather Bureau, Washington, D.C., June 1949, 287 pp.
pp. 634-639.
Vol. 23, NO. 8, Oct. 1942, pp. 319-320.
Charba, Jess, and Sasaki, Yoshikazu, “Structure and Movement of the Severe Thunderstorms of April 3, 1964 as Revealed From Radar and Surface hlesonetwork Data Analysis,” ESSA Tech- nical Mcmorandurn ERLTM-NSSL 41, U.S. Department of Commerce, National Severe Storms Laboratory, Norman, Okla., Oct. 1968, 47 pp.
Darkow, Grant L., “The Total Energy Environment of Severe Storms,” Journal of Applied 111 eteorology, Vol. 7, No. 2, Apr. 1968,
Darkow, Grant L., “Deflecting Forces on Non-Rotating Convective Systems Due to Environmental Shear,” Preprint of paper pre- sented at the 6th conference on Severe Local Storms, Chicago, Illinois, April 8-10, 1969, American Meteorological Society, Boston, Mass., 1969, pp. 20-23 (unpublished manuscript).
Duchon, C. E., Error Variance Analysis of Meteorological Data From the ESSA-IZFF DC-G’s, Department of Meterology, Uni- versity of Oklahoma, Norman, 1970, 48 pp.
Fankhauser, James C., “Convective Processes Resolved by a Mesoscale Rawinsonde Network,” Journal of Applied Meteorology,
Fawbush, Ernest J., and Miller, Robert C., “A Basis for Fore- casting Peak Wind Crusts in Non-Frontal Thunderstorms,” Bulletin of the American Mtteorological Society, Vol. 35, No. 1, Jan. 1954, pp. 14-19.
Friedman, Howard A., Ahrens, Merlin R., and Davis, Harlan W., “The ESSA Research Flight Facility: Data Processing Pro- cedures,” ESSA Technical Report E R L 132-RFF 2, U.S. Depart- ment of Commerce, Research Laboratories, Miami, Fla., Nov. 1969, 64 pp.
Fujita, Tetsuya, “Precipitation and Cold Air Production in Meso- scale Thunderstorm Systems,” Journal of Meteorology, Vol. 16,
Fujita, Tetsuya, “Analytical Mesometeorology: A Review,” Meteorological Monographs, Vol. 5, No. 27, American Meteoro- logical Society, Boston, Mass., Sept. 1963, pp. 77-128.
Fujita, Tetsuya, and Arnold, James, “Preliminary Result of Analysis of the Cumulonimbus Cloud of April 21, 1961,” Meso- meteorology Project Research Paper No. 16, Department of the Geophysical Sciences, The University of Chicago, Ill., 1963, 16 PP.
Fujita, Tetsuya, and Byers, Horace R , “Model of a Hail Cloud as Revealed by Photogrammetric Analysis,” Nubila, Vol. 5, No. 1, Verona, Italy, 1962, pp. 85-105.
Fujita, Tetsuya, and Grandoso, Hector, “Split of a Thunderstorm Into Anticyclonic and Cyclonic Storms and Their Motion as Determined From Numerical Model Experiments,” Journal of the Atmospheric Sciences, Vol. 25, No. 3, May 1968, pp. 416-439.
Goldman, Joseph L., “The High Speed Updraft-The Key to the Severe Thunderstorm,” Journal of the Atmospheric Sciences, Vol. 25, No. 2, Mar. 1968, pp. 222-248.
Hammond, George R., “Study of a Left Moving Thunderstorm of 23 April 1964,” ESSA Technical Memorandum IERTM-NSSL 31, U.S. Department of Commerce, National Severe Storms Laboratory, Norman, Okla., Apr. 1967, 75 pp.
Harrold, T. W., “A Note on the Development and Movement of Storms Over Oklahoma on May 27, 1965, ESSA Technical Memorandum IERTM-NSSI, 29, U .S. Department of Commerce, National Severe Storms Laboratory, Norman, Okla., NOV. 1966, pp. 1-8.
Hitschfeld, Walter, “The Motion and Erosion of Convective Storms in Severe Vertical Wind Shear,” Journal of Meteorology, Vol. 17, No. 3, June 1960, pp. 270-282.
Hookings, G. A,, “Precipitation-Maintained Downdrafts,” Journal of Applied Meteorology, Vol. 4, No. 2, Apr. 1965, pp. 190-195.
Humphreys, William J., “The Thunderstorm and Its Phenomena,” Monthly Weather Reaiew, Vol. 42, No. 6, June 1914, pp. 348-380.
Xuo, H. L., “Motions of Vortices and Circulating Cylinder in Shear Flow With Friction,” Journal of the Atmospheric Sciences, Vol. 26, No. 3, May 1969, pp. 390-398.
pp. 199-205.
Vol. 8, NO. 5, Oct. 1969, pp. 778-798.
NO. 4, Aug. 1959, pp. 454-466.

192 MONTHLY WEATHER REVIEW Vol. 99, No. 3
Lhermitte, Roger M., “Doppler Radar Observation of a Con- vective Storm,” Preprint of paper presented at the 6th Conference on Severe Local Storms, Chicago, lllinois, April 8-10, 1969, American Meteorological Society, Boston, Mass., 1969, pp. 139- 145 (unpublished manuscript).
Malkus, Joanne S., “Recent Ilevelopments in Studies of Penetra- tive Convection and an Application to Hurrricane Cumulonimbus Towers,” Proceedings of the First Conference on Cumulus Convec- tion, Portsmouth, A’ew Hampshire, Mal! 19-61, 1969, Cumidus Dynamics, Pergamon Press, New York, N.Y., 1960, pp. 65-84.
Malkus, Joanne S., and Williams, R. T., “On the Interaction Between Severe Storms and Large Cuniulus Clouds,” Meteoro- logical Monographs, Vol. 5, No. 27, American Meteorological Society, Boston, Mass., Sept. 1963, pp. 59-64.
McGuire, E. L., “The Vertical Structure of Three Dry Lines as Revealed by Aircraft Traverses,” National Severe Ptorms Project Report No. 7, U.S. Department of Commerce, National Severe Storms Laboratory, Norman, Okla., Apr. 1962, 10 pp.
Milne-Thomson, Louis M., Theorelical Hydrodynamics, 4th Edition, The Macmillan Co., London, England, 1960, 660 pp.
Newton, Chester W., “Structure and Mechanism of the Prefrontal Squall Line,” Journal of Meteorology, Vol. 7, No. 3, June 1950,
Newton, Chester W., “Circulations in Large Sheared Cumulo- nimbus,” Tellus, Vol. 18, No. 4, Stockholm, Sweden, 1966,
Newton, Chester W., and Fankhauser, James C., “On the Move- ments of Convective Storms, With Emphasis on Size Discrimin- ation in Relation to Water-Budget Requirements,” Journal of Applied Meteorology, Vol. 3, No. 6, Dec. 1964, pp. 651-668.
Newton, Chester W., and Kats, Sey, “Movement of Large Convec- tive Rainstorms in Relation to Winds Aloft,” Bulletin of the American Meteorological Society, Vol. 39, No. 3, Mar. 1958, pp.
Newton, Chester W . , and Newton, Harriet R., “Dynamical lnter- actions Between Large Convective Clouds and Environment with Vertical Shear,” Journal of Meteorology, Vol. 16, No. 5, Oct. 1959,
Normand, Charles W. R., “Energy in the Atmosphere,” Quarterly Journal of the Royal Meteorological Society, Vol. 72, Nos. 312-313, London, England, Apr.-July 1946, pp. 145-147.
pp. 210-222.
pp. 699-713.
129-1 36.
pp. 483-496.
Pastushkov, R. S., and Shmeter, S. M., “Influence of Vertical Motion on Severe Convective Clouds and Wind Field,” IzvestiQa, Atmospheric and Oceanic Physics, Vol. 4, No. 3, The American Geophysical Union, Washington, D.C., Mar. 1968, pp. 154-164 (translation of “Vliianie vertikal’nykh dvizhenit v nioshchnykh konvektivnykh oblakakh na pole vetra,” Akademiia Nauk S S S R , Izvestiia, Fizika Atmosferp i okeana, Vol. 4, No. 3, Lenin- grad, Mar. 1968, pp. 283-293).
Prandtl, Ludwig, and Tietjens, 0. G., Applied Hydro- and Aero- Mechanics, Dover Publications, Inc., New York, N.Y., 1934, 311 pp.
Reber, Carl M., and Friedman, Howard A., Manual of Meleorological Instrumentation and Data Processing, U.S. Department of Com- merce, ESSA Research Laboratory, Miami, Fla., Nov. 1969,
Rhea, J. Owen, “A Study cf Thunderstorm Formation Along Dry Lines,” Journal of Applied Meteorology, Vol. 5, No. 1, Feb. 1966,
Roach, W. T., “On the Nature of the Summit Areas of Severe Storms in Oklahoma,” Quarterly Journal of the Royal Mdeorologi- cal Soczety, Vol. 93, No. 397, London, England, July 1967,
Sandstrom, Johan W., “On the Relation Between Atmospheric Pressure and Wind,” Bulletin of the Mount Weather Obseroatory, Vol. 3, Pt. 5, Washington, D.C., June 1911, pp. 275-303.
Shmeter, S. M., “Interaction Between Cumulonimbus Clouds and a Wind Field,” Izvestiya, Atmospheric and Oceanic Physics, Vol. 2, No. 10, Oct. 1966, pp. 618-621 (translation of “Vzaimodelstvie kuchevodozhdevykh oblakov s polem vetra,” A k a d a i i a Nauk SSSR, Izvestiia, Fizika Atmosfery i Okeana, Vol. 2, No. LO, Oct.
Staats, Wayne F., and Turrentine, Charles M., “Some Observations and Radar Pictures of the Blackwell and Udal1 Tornadoes of May 25, 1955, “Bzilletin of the American Meteorological Society, Vol. 37, No. 10, Dec. 1956, pp. 495-505.
Stout, G. E., and Hiser, H. W., “Radar Scope Interpretations of Wind, Hail, and Heavy Rain Storms Between May 27 and June 8, 1954,” Bulletin of the American Meteorological Society, Vol. 36, No. 10, Dec. 1955, pp. 519-527.
Takeda, Takao, “The Downdraft in Convective Shower-Cloud Under the Vertical Wind Shear and Its Significance for Main- tainance of the Convective System,” Journal of the Meteorological Society of Japan, Ser. 2, Vol. 43, No. 6, Tokyo, Dec. 1965, pp.
Takeda, Takao, “Effects of the Prevailing Wind With Vertical Shear on the Convective Cloud Accompanied With Heavy Rainfall,” Journal of the Meteorological Society of Japan, Ser. 2, Vol. 44, No. 2, Tokyo, Apr. 1966, pp. 129-144.
64 PP.
pp. 58-63.
pp. 318-336.
1966, pp. 1026-1032).
302-309.
[Received April 23, 1970; rewised July 1, 19701