minority student participation in international … student participation in international programs...
TRANSCRIPT
Minority Student Participation in International Programs and Activities: Attitudes, Obstacles, and Future Directions
UNCF SPECIAL PROGRAMS CORPORATION
INSTITUTE FOR INTERNATIONAL PUBLIC POLICY
2007
This report was produced under U.S. Department of Education, award number P017A050048-06
to the United Negro College Fund Special Programs Corporation, 2750 Prosperity Avenue, Suite
600, Fairfax, Virginia 22031.
The mission of the U.S. Department of Education (ED) is to ensure equal access to education and
to promote educational excellence throughout the nation. ED supports solutions to emerging
problems in postsecondary education and promotes the highest quality education for all learners.
With a portfolio of more than $90 million in federal programs, the United Negro College Fund
Special Programs Corporation (UNCFSP) mission is to ―organize and deliver educational
support services‖ such as capacity building, technical assistance and workforce development
programs to minority serving institutions of higher education. UNCFSP, a spin-off of the United
Negro College Fund (UNCF), is an independently established 501(c) 3 nonprofit organization
with the broad mandate of serving not only Historically Black Colleges and Universities
(HBCUs) but all domestic minority institutions, including Hispanic Serving Institutions (HSIs),
Tribal Colleges and Universities (TCUs), and Other Minority Institutions (OMIs), as well as
institutions of higher education (IHEs) abroad.
Abstract
The United Negro College Fund Special Programs Corporation completed a study that examined
undergraduate minority student participation in international education activities and programs at
Historically Black Colleges and Universities (HBCU‘s). The study addressed two research
questions: (1) What are the existing international education activities and programs attitudes of
minority undergraduates attending HBCUs? (2) What factors impact (i.e. promote or hinder) the
participation of minority undergraduates attending HBCUs in international education activities
and programs? 1,346 students from 62 HBCUs completed a survey; seven focus groups were
conducted on five college campuses to supplement the survey data. The study found that HBCU
student attitudes towards international education activities and programs are highly positive
identifying academic, personal, and future career benefits. Obstacles to greater participation in
international education activities and programs included financial issues, fear and safety
concerns, not fulfilling graduation requirements, and lack of knowledge of opportunities. Final
recommendations to increase student participation in international education included (1)
Sustaining Student Interest, (2) Increasing Student Motivation, Awareness and Participation, (3)
Strengthening Study Abroad Programs, (4) Increasing Focus on Critical Languages, (5)
Increasing Focus on Male Students, (6) Learning Lessons from Successful Campuses, and (7)
Continuing Further Research.
iv
TABLE OF CONTENTS
Background ................................................................................................................................... 6
Internationalization of Higher Education ................................................................................... 7
Benefits of Internationalization and International Education .................................................... 8
Research Gap ............................................................................................................................ 10
Study Purpose.............................................................................................................................. 13
Research Questions ................................................................................................................... 16
Methodology ................................................................................................................................ 16
Population and Sample ............................................................................................................. 16
Survey and Focus Group Protocol Design ............................................................................... 21
Study Procedures ...................................................................................................................... 21
Data Analysis Techniques ......................................................................................................... 23
Survey Results ............................................................................................................................. 24
General Attitudes and Abilities ................................................................................................. 24
Formal International Education Experiences .......................................................................... 30
Informal International Education Experiences ........................................................................ 36
Focus Group Results ................................................................................................................... 43
Perceived Benefits ..................................................................................................................... 43
Attitudes .................................................................................................................................... 44
Facilitators and Obstacles ........................................................................................................ 45
Future Directions ...................................................................................................................... 46
Discussion..................................................................................................................................... 48
Research Question One Review ................................................................................................ 48
Research Question Two Review ................................................................................................ 50
Recommendations ....................................................................................................................... 52
References .................................................................................................................................... 56
APPENDIX A: Sample Characteristics .................................................................................... 60
APPENDIX B: Survey Instrument............................................................................................ 63
APPENDIX C: Focus Group Protocol ...................................................................................... 76
APPENDIX D: Focus Group Summary Sheets........................................................................ 79
APPENDIX E: Data Tables ....................................................................................................... 96
Section A: General Attitudes and Abilities ............................................................................... 97
Section B: Formal International Education Experiences ....................................................... 158
Section C: Informal International Education Experiences ..................................................... 211
Minority Student Participation in International Programs and Activities:
Attitudes, Obstacles, and Future Directions
The U.S. University Presidents Summit on International Education was held in early
2006. Condoleezza Rice, Secretary of State, and Margaret Spellings, Secretary of Education,
hosted the summit to ―engage leaders of U.S. higher education in a renewed partnership to
strengthen international education and emphasize its importance to the national interest‖ (US
Department of State, n.d.). The National Security Language Initiative (NSLI) was launched at
this meeting. NSLI is designed to provide support for language and culture study of targeted
critical languages: Arabic, Chinese, Japanese, Korean, Russian, Hindi, Farsi and Turkish (ED,
2006). President George W. Bush‘s proposed 2008 budget reflects this commitment to
international areas. The Fiscal Year 2008 budget proposes $16.8 billion for international
development and $4.2 billion for international education (OMB, n.d.).
The focus on international issues in the U.S. fits within the context of an increasingly
globalized world. Although there are numerous definitions of globalization, Scholte (2005)
defines this concept as the ―spread of trans-planetary connections between people‖ (Scholte,
2005, p. 59) which has economic and social impacts. The World Bank (n.d.) cites economic
impacts related to economic globalization in international trade, foreign direct investment, and
capital market flows. As an example, the share of international trade in total output in
developing countries grew from 33.8% to 48.9% between 1990 and 2001 (The World Bank,
n.d.). Globalization of the world continues to move at an accelerated rate with increasingly
greater impacts (Scholte, 2005; Carnegie Endowment for International Peace, n.d.).
Public opinion is aligned with the focus of NSLI and the globalization trend. NAFSA:
Association of International Educators conducted a study to assess public attitudes towards
6
international education. The study found wide-scale agreement that (1) it is important to prepare
future generations of Americans for a global society; (2) knowledge of other languages will give
future generations a competitive advantage in career opportunities; (3) it is important for future
generations to participate in study abroad programs in college; and (4) it is important for future
generations to have knowledge of other countries and cultures (NAFSA, 2006).
Given the funding priorities of the nation, increasing globalization impacts, and public
attitudes towards international education, it is important to assess the role postsecondary
education has in preparing students to fully participate in society. This study specifically
engages the perspectives of minority students that attend Historically Black Colleges and
Universities (HBCU). The United Negro College Fund Special Programs Corporation
(UNCFSP) was funded by the U. S. Department of Education to conduct this study on Minority
Student Participation in International Programs and Activities: Attitudes, Obstacles, and Future
Directions.
Background
―If we are to maintain our place at the forefront of the world‘s institutions of learning, we
must truly be universities and colleges of the world. To make this claim we must
internationalize our mission—our learning, discovery and engagement‖ (NASULGC Task Force
on International Education, 2004, p. v). This quote is an example of the growing emphasis being
placed on international education and its potential contribution to the U.S. and world. To create
a context for the study, this section will discuss the internationalization of higher education and
the benefits associated with internationalization and international education. The specific
research gap this study addresses will also be discussed.
7
Internationalization of Higher Education
Knight (1993) proposed a frequently cited definition of the internationalization of higher
education as ―the process of integrating an international/intercultural dimension into the
teaching, research, and service functions of the institution‖ (p. 21). With the growing emphasis
on internationalization and globalization, Knight (2003) recently proposed an expanded
definition: ―Internationalization at the national, sector, and institutional levels is defined as the
process of integrating an international, intercultural, or global dimension into the purpose,
functions or delivery of postsecondary education‖ (p. 2). The international education definition
is generally more concise and consists of the programs and activities that facilitate international
learning (NASULGC Task Force on International Education, 2004). As noted, this study
addresses HBCU student attitudes towards international education programs and activities.
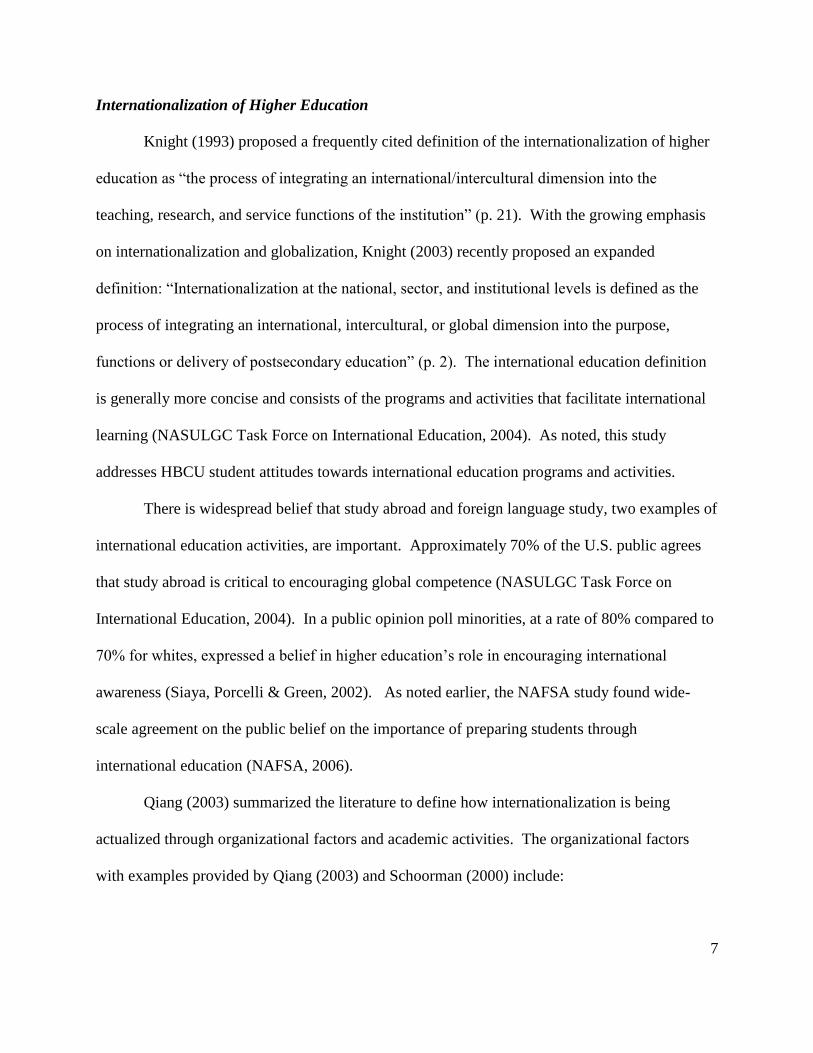
There is widespread belief that study abroad and foreign language study, two examples of
international education activities, are important. Approximately 70% of the U.S. public agrees
that study abroad is critical to encouraging global competence (NASULGC Task Force on
International Education, 2004). In a public opinion poll minorities, at a rate of 80% compared to
70% for whites, expressed a belief in higher education‘s role in encouraging international
awareness (Siaya, Porcelli & Green, 2002). As noted earlier, the NAFSA study found wide-
scale agreement on the public belief on the importance of preparing students through
international education (NAFSA, 2006).
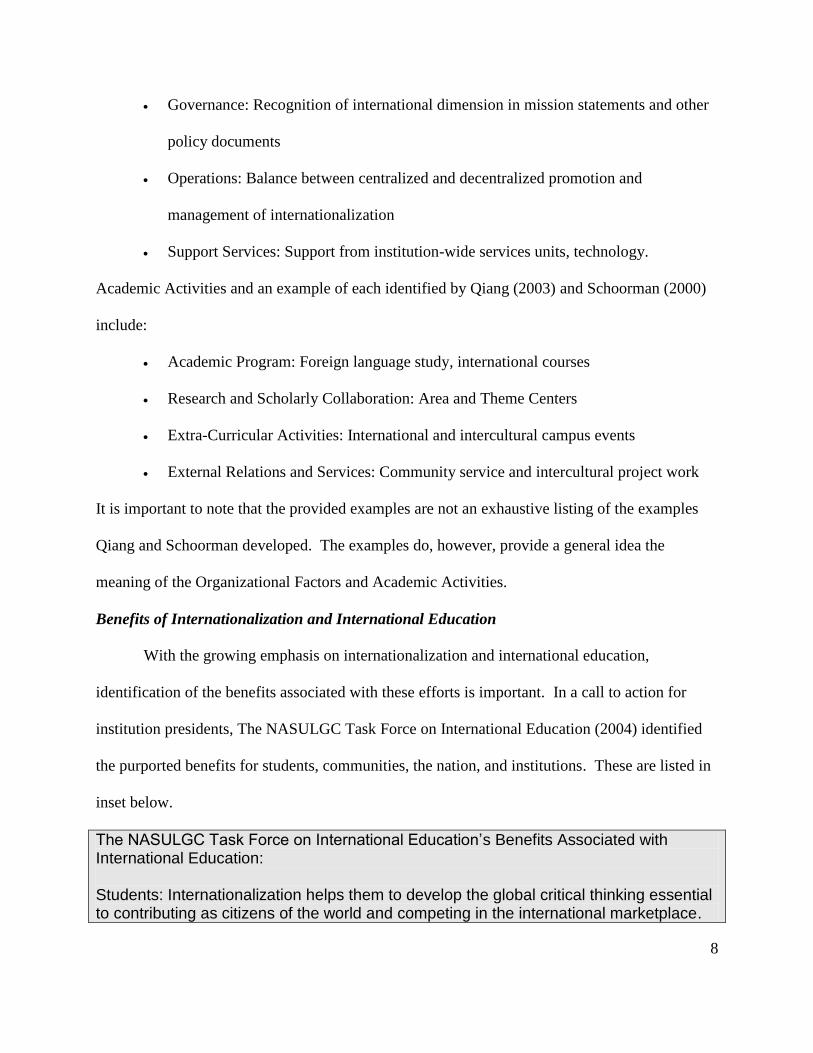
Qiang (2003) summarized the literature to define how internationalization is being
actualized through organizational factors and academic activities. The organizational factors
with examples provided by Qiang (2003) and Schoorman (2000) include:
8
Governance: Recognition of international dimension in mission statements and other
policy documents
Operations: Balance between centralized and decentralized promotion and
management of internationalization
Support Services: Support from institution-wide services units, technology.
Academic Activities and an example of each identified by Qiang (2003) and Schoorman (2000)
include:
Academic Program: Foreign language study, international courses
Research and Scholarly Collaboration: Area and Theme Centers
Extra-Curricular Activities: International and intercultural campus events
External Relations and Services: Community service and intercultural project work
It is important to note that the provided examples are not an exhaustive listing of the examples
Qiang and Schoorman developed. The examples do, however, provide a general idea the
meaning of the Organizational Factors and Academic Activities.
Benefits of Internationalization and International Education
With the growing emphasis on internationalization and international education,
identification of the benefits associated with these efforts is important. In a call to action for
institution presidents, The NASULGC Task Force on International Education (2004) identified
the purported benefits for students, communities, the nation, and institutions. These are listed in
inset below.
The NASULGC Task Force on International Education’s Benefits Associated with International Education: Students: Internationalization helps them to develop the global critical thinking essential to contributing as citizens of the world and competing in the international marketplace.
9
Communities: Internationalization links them to the world, expanding opportunities for university service and engagement while also enhancing their global competitiveness. Nation: Internationalization contributes to national security and a vital economy, and prepares future world leaders who know and value American democracy Institutions: Internationalization enlivens faculty scholarship and teaching, expands research opportunities, and provides a pathway to national and international distinction.
--A Call to Leadership: The Presidential Role in Internationalizing the University (p. viii)
The question is what actual international education benefits have been documented in the
literature. Related to study abroad the major benefits identified: (1) Personal Development, (2)
Academic Commitment, (3) Intercultural Development, and (4) Career Development (Black &
Duhon, 2006; Adler, Loughrin-Sacco & Moffatt, 2005; Dwyer & Peters, 2004; Wanasek, 2005).
Personal development refers to benefits such as increased self-confidence and expanded world-
view understanding. Academic commitment refers to enhanced interest in academic study and
commitment to foreign language study. Intercultural development refers to an increased
understanding of own cultural values and biases. Career Development captures the acquisition
of skills that influenced career and clarification of career direction. The research has also noted
that the benefits increase as the length of time spent in study abroad increases (Ingraham &
Peterson, 2004; Dwyer & Peters, 2004).
The study abroad benefits cited represent an example of student benefits related to
international education activities and programs. NAFSA: Association of International Educators,
(n.d.) completed a study related to the economic impact of internationalization for the 2004-2005
academic year. The NAFSA study focused specifically on the impact of foreign students. The
study found that the net contribution to the U.S. economy by foreign students and their families
10
is $13.3 billion. This figure represented a contribution of $9.0 billion from tuition and fees and
$9.6 billion from living expenses with $5.3 billion subtracted from the sum of these two areas
because of U.S. support.
This is not an exhaustive list of benefits. The information presented on
internationalization, international education, and benefits instead creates a context for the
importance of study in these areas. The specific research gaps this study will address will be
addressed next.
Research Gap
While there is recognition of the importance of international education as demonstrated
by the U.S. Department of Education funding for this study and the research cited earlier, the
statistics related to participation in international education activities are not high. Approximately
3% of U.S. students participate in study abroad experiences (Siaya & Hayward, 2001). Welles
(2004) found that in the 1960s, approximately 16% of U.S. students study a foreign language;
this percentage fell to 9% in the 2000s. Language study requirements to earn a degree have also
decreased from 90% in 1965 to 67% in 1995 (NASULGC, 2004).
The situation at HBCUs is the specific interest of this study. The research gap is the lack
of studies on HBCU student attitudes towards international education. The earliest known
research on language study at HBCUs was conducted by Rivers (1933). Related to interests on
HBCU campuses, Rivers documented that French, German, Spanish and Italian were the most
commonly taught and therefore studied languages, and that students were not provided with
opportunities to study abroad.
Nyabongo (1946) conducted a survey on the number of faculty teaching foreign
languages, the number of students enrolled in foreign language classes, and the language
11
teaching method used during the period 1942-1944. Results showed that since the Rivers study
there had been an increased interest and enrollment in foreign language courses at black colleges
and universities. The main study conclusion was that little attention was being paid to measuring
and evaluating foreign language teaching and learning at HBCUs.
There is a dearth of studies related to HBCUs and student attitudes and obstacles
associated with international education related activities after Nyabongo‘s study. A 1953 study
by Miller on HBCU campuses found that teaching methods were an obstacle to greater
competence in language acquisition among students at HBCUs but not an obstacle to
participation in language study. LeBlanc (1972) studied foreign language programs at HBCUs
and did address student attitudes. This study found that HBCU students felt that language study
would be more relevant if it was specifically related to their academic majors. Students also
expressed a desire to develop fluency in the languages they studied.
Davis (1990) conducted a study with 57 HBCUs focused on attitudes towards foreign
language programs. The study found that students generally held positive attitudes towards
foreign language study and were aware of the practical and intrinsic value of second languages
and cultural studies (Davis, 1990). As defined by Qiang (2003), the organizational factor
obstacles students identified to language study in the Davis study related to a lack of or
insufficient 1) opportunity for developing conversational skills, 2) cross-cultural study and
information provided in classes, 3) funding for study abroad opportunities, and 4) other
extracurricular activities that promote the use of the language studied.
Moore (2005) conducted a study on the low enrollment of Blacks and African-Americans
at a majority institution with conclusions similar to the Davis study on HBCUs. This study noted
organizational factors as an obstacle to student participation in foreign language learning; in this
12
case, little effort to encourage student participation. Students recommended greater
dissemination of information on the advantages of foreign language study and a requirement for
foreign language study.
Comp (2006) completed a comprehensive literature review on diversity and study abroad.
The review condensed findings from 131 different sources. Of these sources, Comp considered
approximately 65 to be research-based. The obstacles identified in the literature review for more
minorities participating in study abroad experiences included: (1) Financial Issues, (2) Lack of
Family Support and/or Needing to Remain Close to Family, (3) Concerns about Language, (4)
Concerns about Discrimination, and (5) Program Sites not of Interest. As a sample of the
research included in Comp‘s literature review, Fels (1993) found that Black students assumed
they would be treated as objects of fear abroad and that institutional efforts keep them ignorant
of opportunities for study abroad. Overall, the research included in the Comp literature review
focused on minority participation in study abroad overall rather than specifically on HBCU
campuses.
Areas similar to those identified by Comp were also identified by Norfles (2003) as
obstacles to student participation in all international education activities. This study was
conducted with TRIO program faculty and students. Areas identified by Norfles included (1)
Cost, (2) Lack of Information, (3) Family Constraints, (4) Individual Limitations, and (5)
Language. This research was not specific to HBCUs but did address underrepresented and
underserved populations.
This study fills research gaps in multiple areas. First, it is specific to minority students
attending HBCUs. Second, it addresses the attitudes and obstacles related to participation in
international education activities specific to HBCUs. Unlike the previous studies cited, this
13
study addresses multiple areas associated with international education including language study,
study abroad, educational exchanges, and perceptions of institutional policies. Information from
this study can be used to help identify strategies to increase HBCU student participation in
international education. This was one of the recommendations of the Committee to Review the
Title VI and Fulbright-Hays International Education Programs (National Academy of Sciences,
2007). The Study Purpose section provides a detailed description of the study.
Study Purpose
The purpose of this study is to develop baseline data on the attitudes and obstacles related
to minority HBCU students‘ participation in international education activities in order to
determine future directions. The importance of this study is anchored in filling the research gap
related to the involvement in international education activities and programs by HBCU
undergraduates. This is salient because of the important role of HBCUs related to Blacks or
African Americans that earn bachelor degrees. According to the National Center for Education
Statistics (2006), approximately 23% of all bachelor degrees earned by Blacks or African
Americans have been awarded by HBCUs despite the fact that only 13% of all Blacks or African
Americans that attend college are enrolled in HBCUs (Provasnik, Shafer, & Snyder, 2004). The
effectiveness of HBCUs in promoting minority education facilitates an opportunity to increase
diversity in the international related careers workforce.
The number of college-attending Blacks or African-Americans is steadily increasing.
Between 1991 and 2001, Black or African-American college enrollment increased by 36.9% to
approximately 1.8 million students (Harvey & Anderson, 2004). Other minority groups have
also experienced rapid growth in college enrollment. Between 1991 and 2001, Hispanic or
Latino enrollment grew by 75.1% and Asian-American enrollment grew by 53.7% (Harvey &
14
Anderson, 2004). This growth is an indicator of the presence of a considerable number of
minority students who can benefit from international education activities and supports the need
to complete a benchmark study on their attitudes and obstacles related to international education.
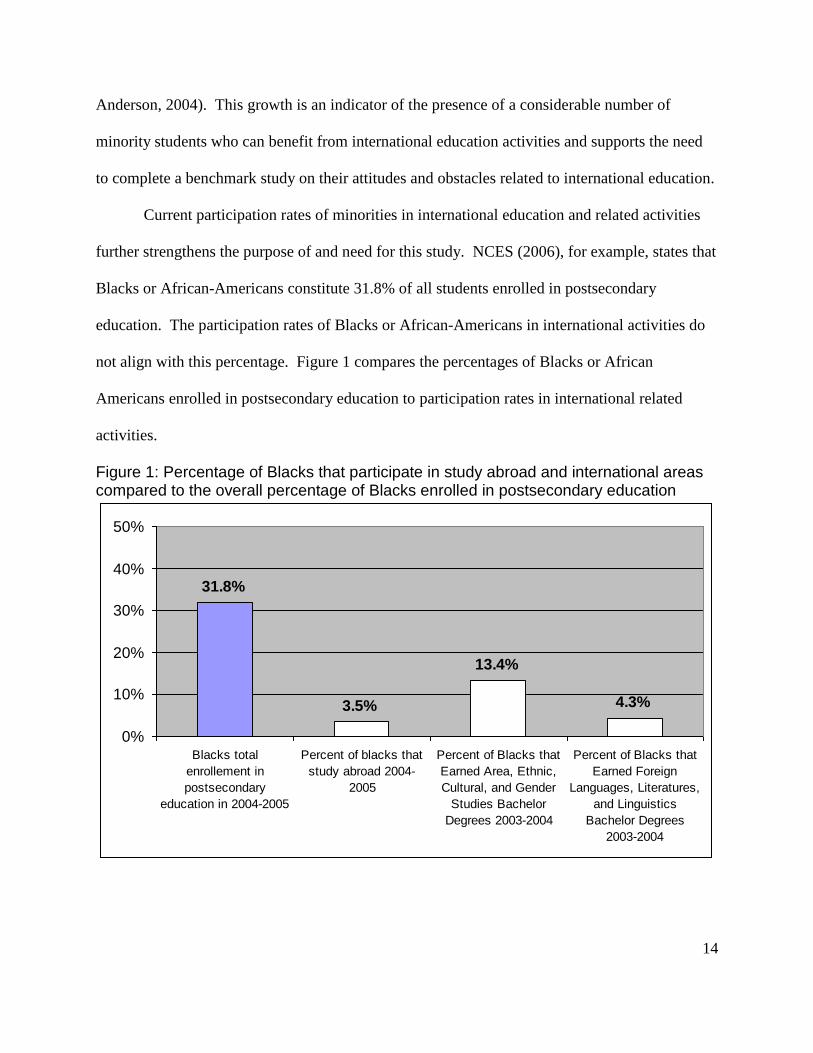
Current participation rates of minorities in international education and related activities
further strengthens the purpose of and need for this study. NCES (2006), for example, states that
Blacks or African-Americans constitute 31.8% of all students enrolled in postsecondary
education. The participation rates of Blacks or African-Americans in international activities do
not align with this percentage. Figure 1 compares the percentages of Blacks or African
Americans enrolled in postsecondary education to participation rates in international related
activities.
Figure 1: Percentage of Blacks that participate in study abroad and international areas compared to the overall percentage of Blacks enrolled in postsecondary education
31.8%
3.5%
13.4%
4.3%
0%
10%
20%
30%
40%
50%
Blacks total
enrollement in
postsecondary
education in 2004-2005
Percent of blacks that
study abroad 2004-
2005
Percent of Blacks that
Earned Area, Ethnic,
Cultural, and Gender
Studies Bachelor
Degrees 2003-2004
Percent of Blacks that
Earned Foreign
Languages, Literatures,
and Linguistics
Bachelor Degrees
2003-2004
15
Figure 1 clearly demonstrates that there is a wide gap between the percentage of Blacks
or African Americans enrolled in postsecondary education and the percentage that study abroad
(28.3% difference), as well as those who earn degrees in international study areas—Area, Ethnic,
Cultural, and Gender Studies (18.4% difference), and in foreign languages, literatures, and
linguistics (27.5% difference). As HBCUs have an enrollment that is 96.1% Black or African
American, this information is especially pertinent to this study (Provasnik, Shafer & Snyder,
2004). Similar differences, however, are also observed in other minority groups. Hispanics or
Latinos represent 24.7% of the total enrollment in postsecondary education in 2004-2005 (ED,
2005) but only 5.6% of the students that have a study abroad experience (IIE, 2006). Since
1993, the percentage of White students that participate in study abroad experiences has been
greater than 80% (IIE, 2006) while the proportion of White students enrolled in postsecondary
education has been approximately 40% (NCES, 2006). In addition, the students who do
participate in study abroad tend to be students from higher socio-economic groups from more
elite universities (Bellamy & Weinberg, 2006).
Identifying attitudes and obstacles that prevent more minorities from participating in
international education activities is important when considering the changing demographics of
the U.S. In 1990, approximately 13% of the U.S. population was non-white. This increased to
25% by the year 2000 (Hobbs & Stoopes, 2002). The growth in the minority population is
continuing. The U. S. Census Bureau (2007) announced in May 2007 that it is estimated that the
minority population in the U.S. has surpassed the 100 million mark comprising approximately
one-third of the total U.S. population. These changing demographics also subscribe to the need
to study the attitudes and obstacles related to international education among minority students so
that higher education, specifically HBCUs, can effectively respond.
16
The workforce needs of the U.S. also affirm the importance of this study. The Census
Bureau estimates that 20% of U.S. jobs are tied to international trade and expects it to increase
even further in the coming years (U.S. Census Bureau, 2004). Furthermore, the majority of
growth in U.S. companies is expected to shift to overseas markets (Stewart, 2007).
Research Questions
This study addresses two major research questions that have direct relevance to student
attitudes and obstacles related to international education activities on HBCU campuses.
Research Question One: What are the existing international education activities and
programs attitudes of minority undergraduates attending HBCUs?
Research Question Two: What factors impact (i.e. promote or hinder) the participation
of minority undergraduates attending HBCUs in international education activities and programs?
Methodology
This section addresses the following areas: (1) Population and Sample, (2) Protocol
Design, (3) Study Procedures, (4) Data Analysis Techniques. The purpose of this information is
to verify the replicability and external validity of the study data.
Population and Sample
The population for this study was all minority undergraduates attending HBCUs.
According to the White House Initiative on Historically Black Colleges and Universities (n.d.),
there are 103 HBCUs dispersed through 20 U.S. states, the District of Columbia, and the U.S.
Virgin Islands. Of these, 100 have undergraduate study programs; therefore, the minority
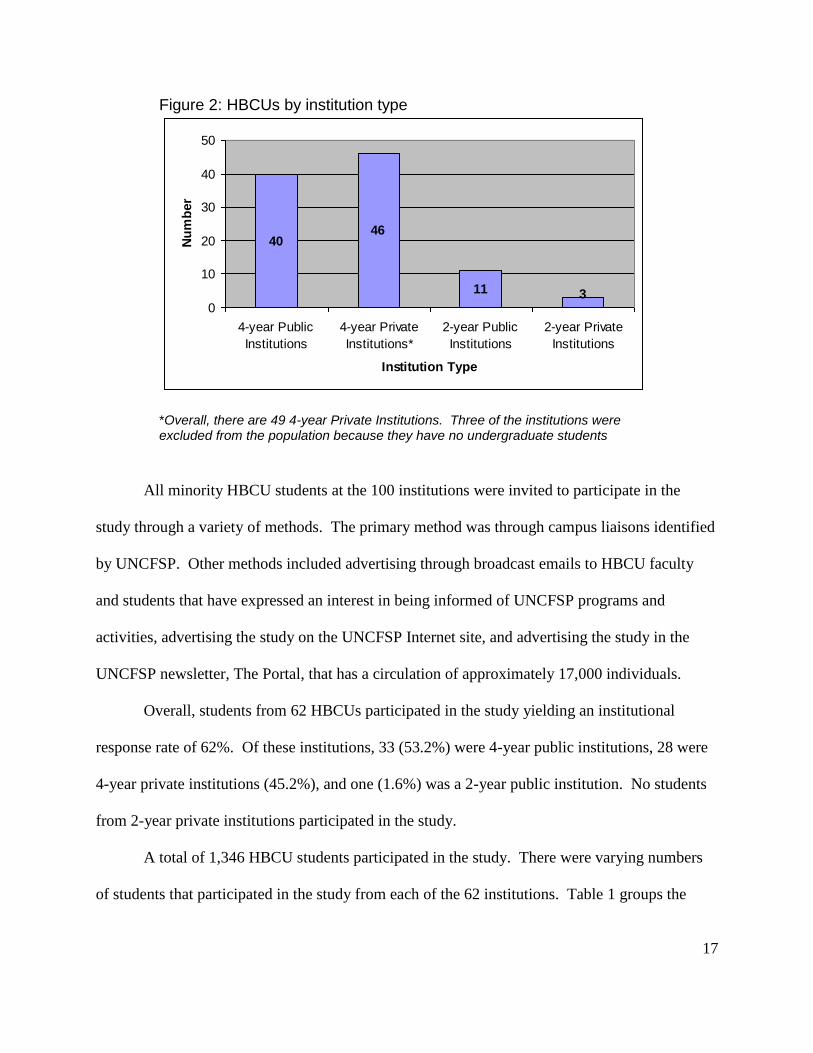
undergraduates at these 100 institutions represent the study population. Figure 2 displays
HBCUs by institution type that collectively provide the sample frame.
17
Figure 2: HBCUs by institution type
4046
11 30
10
20
30
40
50
4-year Public
Institutions
4-year Private
Institutions*
2-year Public
Institutions
2-year Private
Institutions
Institution Type
Nu
mb
er
*Overall, there are 49 4-year Private Institutions. Three of the institutions were excluded from the population because they have no undergraduate students
All minority HBCU students at the 100 institutions were invited to participate in the
study through a variety of methods. The primary method was through campus liaisons identified
by UNCFSP. Other methods included advertising through broadcast emails to HBCU faculty
and students that have expressed an interest in being informed of UNCFSP programs and
activities, advertising the study on the UNCFSP Internet site, and advertising the study in the
UNCFSP newsletter, The Portal, that has a circulation of approximately 17,000 individuals.
Overall, students from 62 HBCUs participated in the study yielding an institutional
response rate of 62%. Of these institutions, 33 (53.2%) were 4-year public institutions, 28 were
4-year private institutions (45.2%), and one (1.6%) was a 2-year public institution. No students
from 2-year private institutions participated in the study.
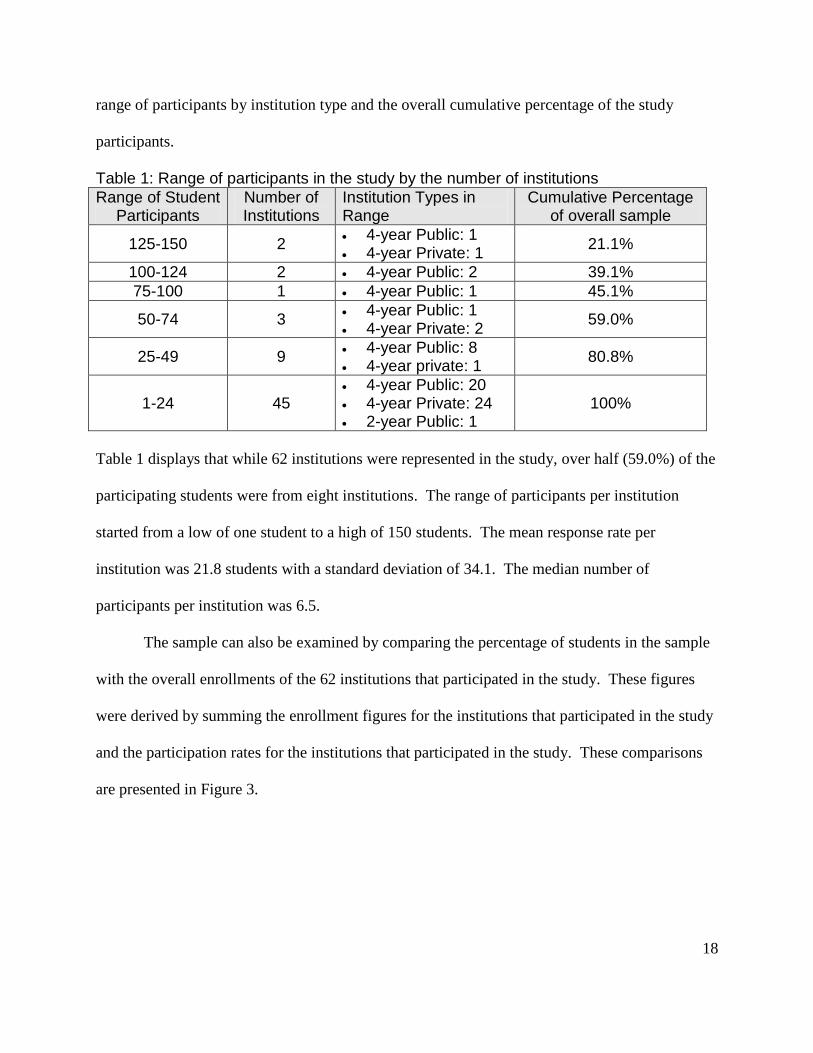
A total of 1,346 HBCU students participated in the study. There were varying numbers
of students that participated in the study from each of the 62 institutions. Table 1 groups the
18
range of participants by institution type and the overall cumulative percentage of the study
participants.
Table 1: Range of participants in the study by the number of institutions
Range of Student Participants
Number of Institutions
Institution Types in Range
Cumulative Percentage of overall sample
125-150 2 4-year Public: 1 4-year Private: 1
21.1%
100-124 2 4-year Public: 2 39.1%
75-100 1 4-year Public: 1 45.1%
50-74 3 4-year Public: 1 4-year Private: 2
59.0%
25-49 9 4-year Public: 8 4-year private: 1
80.8%
1-24 45 4-year Public: 20 4-year Private: 24 2-year Public: 1
100%
Table 1 displays that while 62 institutions were represented in the study, over half (59.0%) of the
participating students were from eight institutions. The range of participants per institution
started from a low of one student to a high of 150 students. The mean response rate per
institution was 21.8 students with a standard deviation of 34.1. The median number of
participants per institution was 6.5.
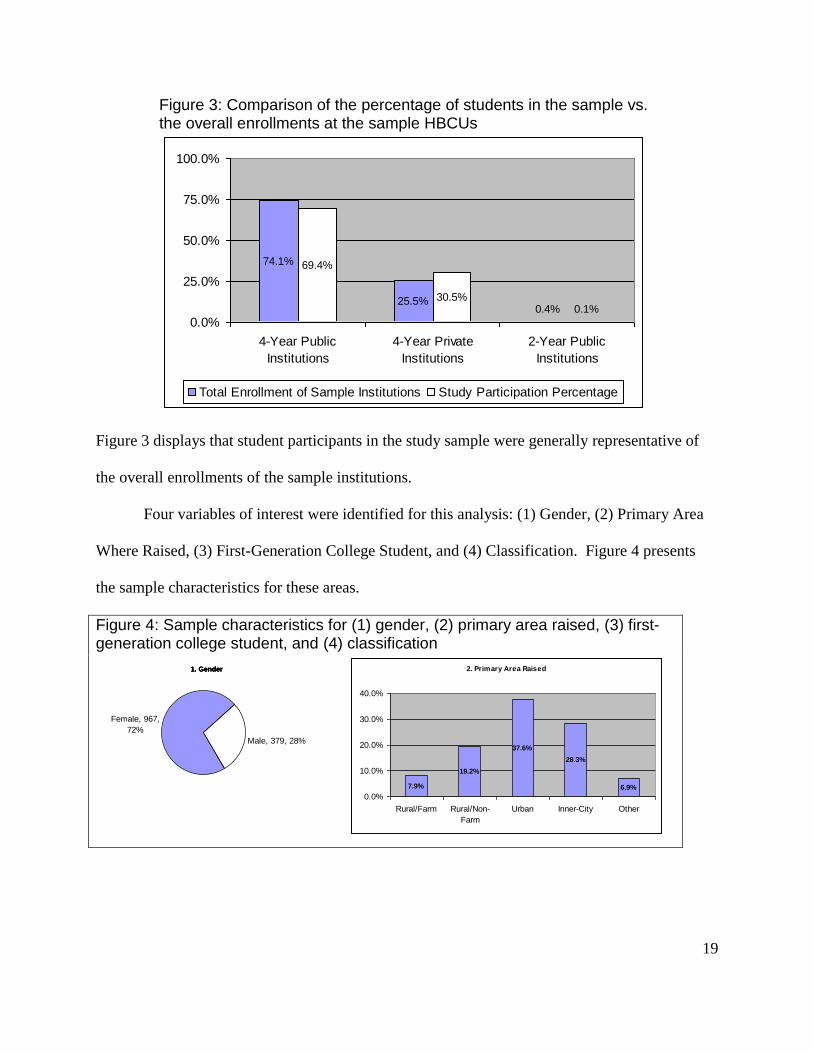
The sample can also be examined by comparing the percentage of students in the sample
with the overall enrollments of the 62 institutions that participated in the study. These figures
were derived by summing the enrollment figures for the institutions that participated in the study
and the participation rates for the institutions that participated in the study. These comparisons
are presented in Figure 3.
19
Figure 3: Comparison of the percentage of students in the sample vs. the overall enrollments at the sample HBCUs
74.1%
25.5%0.4%
69.4%
30.5%0.1%
0.0%
25.0%
50.0%
75.0%
100.0%
4-Year Public
Institutions
4-Year Private
Institutions
2-Year Public
Institutions
Total Enrollment of Sample Institutions Study Participation Percentage
Figure 3 displays that student participants in the study sample were generally representative of
the overall enrollments of the sample institutions.
Four variables of interest were identified for this analysis: (1) Gender, (2) Primary Area
Where Raised, (3) First-Generation College Student, and (4) Classification. Figure 4 presents
the sample characteristics for these areas.
Figure 4: Sample characteristics for (1) gender, (2) primary area raised, (3) first-generation college student, and (4) classification
Female, 967,
72%
Male, 379, 28%
1. Gender 2. Primary Area Raised
7.9%
19.2%
37.6%
28.3%
6.9%
0.0%
10.0%
20.0%
30.0%
40.0%
Rural/Farm Rural/Non-
Farm
Urban Inner-City Other
4. Classification
20.2% 20.3% 21.0%
35.1%
3.4%
0.0%
10.0%
20.0%
30.0%
40.0%
Freshman Sophomore Junior Senior Unclassified
3. First-Generation College Student
Yes, 643, 48%
No, 703, 52%
Female, 967,
72%
Male, 379, 28%
1. Gender
Female, 967,
72%
Male, 379, 28%
1. Gender 2. Primary Area Raised
7.9%
19.2%
37.6%
28.3%
6.9%
0.0%
10.0%
20.0%
30.0%
40.0%
Rural/Farm Rural/Non-
Farm
Urban Inner-City Other
4. Classification
20.2% 20.3% 21.0%
35.1%
3.4%
0.0%
10.0%
20.0%
30.0%
40.0%
Freshman Sophomore Junior Senior Unclassified
3. First-Generation College Student
Yes, 643, 48%
No, 703, 52%
20
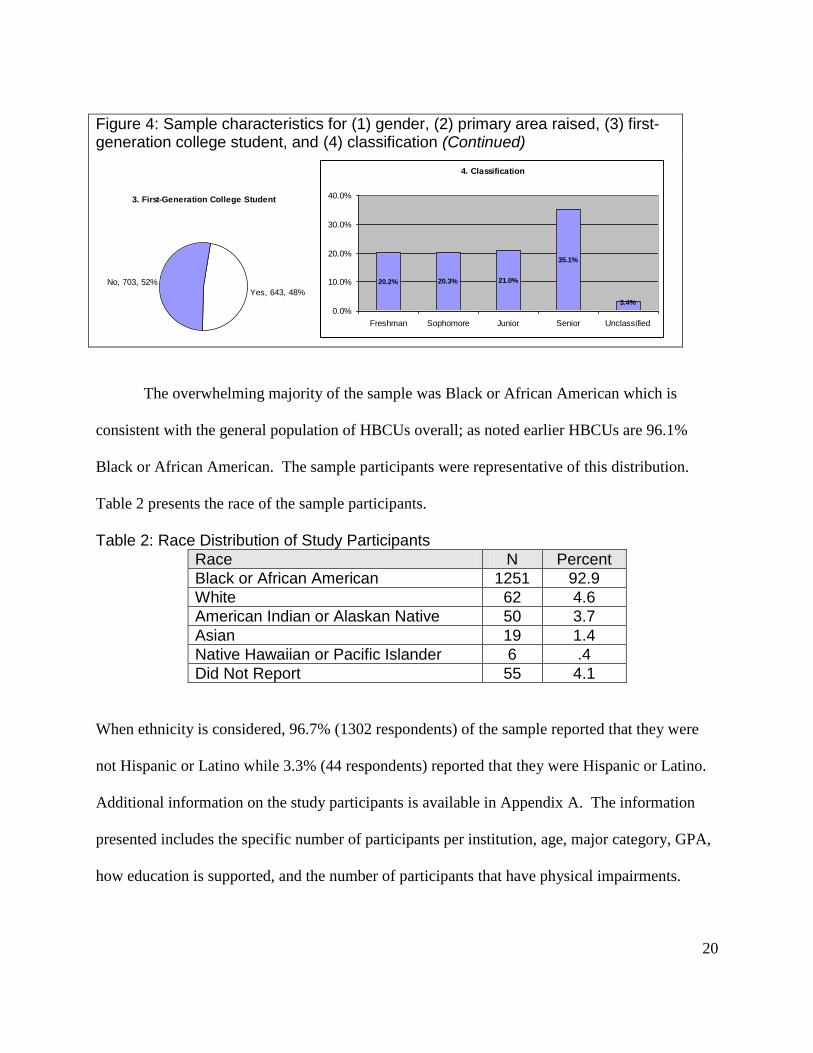
Figure 4: Sample characteristics for (1) gender, (2) primary area raised, (3) first-generation college student, and (4) classification (Continued)
Female, 967,
72%
Male, 379, 28%
1. Gender 2. Primary Area Raised
7.9%
19.2%
37.6%
28.3%
6.9%
0.0%
10.0%
20.0%
30.0%
40.0%
Rural/Farm Rural/Non-
Farm
Urban Inner-City Other
4. Classification
20.2% 20.3% 21.0%
35.1%
3.4%
0.0%
10.0%
20.0%
30.0%
40.0%
Freshman Sophomore Junior Senior Unclassified
3. First-Generation College Student
Yes, 643, 48%
No, 703, 52%
Female, 967,
72%
Male, 379, 28%
1. Gender
Female, 967,
72%
Male, 379, 28%
1. Gender 2. Primary Area Raised
7.9%
19.2%
37.6%
28.3%
6.9%
0.0%
10.0%
20.0%
30.0%
40.0%
Rural/Farm Rural/Non-
Farm
Urban Inner-City Other
4. Classification
20.2% 20.3% 21.0%
35.1%
3.4%
0.0%
10.0%
20.0%
30.0%
40.0%
Freshman Sophomore Junior Senior Unclassified
3. First-Generation College Student
Yes, 643, 48%
No, 703, 52%
The overwhelming majority of the sample was Black or African American which is
consistent with the general population of HBCUs overall; as noted earlier HBCUs are 96.1%
Black or African American. The sample participants were representative of this distribution.
Table 2 presents the race of the sample participants.
Table 2: Race Distribution of Study Participants
Race N Percent
Black or African American 1251 92.9
White 62 4.6
American Indian or Alaskan Native 50 3.7
Asian 19 1.4
Native Hawaiian or Pacific Islander 6 .4
Did Not Report 55 4.1
When ethnicity is considered, 96.7% (1302 respondents) of the sample reported that they were
not Hispanic or Latino while 3.3% (44 respondents) reported that they were Hispanic or Latino.
Additional information on the study participants is available in Appendix A. The information
presented includes the specific number of participants per institution, age, major category, GPA,
how education is supported, and the number of participants that have physical impairments.
21
Seven focus groups were also conducted at five HBCUs. A total of 56 students
participated in the focus groups. There were 28 female and 28 male focus group participants.
The focus groups were conducted between April 23, 2007 and May 16, 2007.
Survey and Focus Group Protocol Design
The study design proposed utilizing the student survey from an American Council of
Education (ACE) study conducted by Siaya and Hayward (2003). A content review of the
survey by the Department of Education and UNCFSP determined that the survey questions
would not adequately respond to the proposed research questions. Relevant study questions from
the ACE study were selected and additional questions appropriate to the study objectives were
developed. The final survey contained four sections: (1) Background, (2) General Attitudes and
Abilities, (3) Formal International Education Experiences, and (4) Informal International
Education Experiences. The study survey instrument is available in Appendix B.
The focus group protocol was developed to gather more in-depth information related to
the study research questions. The protocol contained six main questions with a supplementary
question to be discussed at the discretion of the moderator. Of the six questions, two focused on
attitudes, two on obstacles/facilitators, one on future directions, and one on all three areas. The
supplemental question focused on attitudes. The full study focus group protocol is available in
Appendix C.
Study Procedures
The following procedures were followed for the survey:
Survey Review: The ACE survey from the study conducted by Siaya and Hayward (2003)
was reviewed for appropriateness to the study research questions. The full adoption of the
ACE survey was rejected by Department of Education and UNCFSP representatives.
22
Questions from the ACE survey appropriate for this study were utilized with permission from
ACE.
Survey Revision: Questions necessary to collect pertinent information on the study objectives
were developed and reviewed by international education content experts for appropriateness.
Liaisons: HBCU presidents were contacted to identify study liaisons on their campuses to
facilitate participation in the study.
Online Posting: The survey was published online on April 12, 2007. mrInterview
4.0 was
used to field the survey online. Hard copies of the surveys were also distributed to the
liaisons in order to maintain student participation on technologically challenged campuses.
After students at their institutions completed the surveys, the liaisons submitted the surveys to
UNCFSP to be entered into the online survey.
Advertisement: Study was publicized utilizing methods described in the Population and
Sample section.
Data Collection Closing Date: Survey data was collected until May 21, 2007. As noted in the
Population and Sample section, 1346 students from 62 HBCUs completed the surveys.
Data Analysis: UNCFSP personnel and consultants summarized the data for analysis.
The following procedures were followed for the focus groups:
Question Development: Included brainstorming by international education content experts
and finalization of questions through an iterative review process by the experts.
Focus Group Script Development: Included description of focus group procedures, opening,
questions, closing, and analysis procedures
23
Moderator Training: Campus liaisons participated in a telephone training session on how to
conduct a focus group and the procedures related specifically to the project. The training
sessions were video taped and posted online for moderators to refer to if necessary.
Focus Group Moderation: Seven focus groups were conducted
Data Recording: Each moderator received training on how to record the focus group data on
a Focus Group Summary Sheet and submitted these to UNCFSP.
Data Analysis: UNCFSP compiled the focus group results to identify major themes in the
data.
Data Analysis Techniques
Survey results were compiled utilizing SPSS 13.0. Functions utilized within SPSS
included the Frequency procedure and the Cross-Tabulation procedure. Chi-square tests were
completed using the Non-Parametric Tests—Chi-Square procedure in SPSS. Graphs and charts
were developed utilizing Microsoft Excel.
Focus group moderators submitted summary sheets of their focus group results in
Microsoft Word. The results for each question were entered into Microsoft Excel for
organization and coding purposes. The focus groups were designed to assess attitudes,
obstacles/facilitators, and future directions. A concept map was developed for each area. A
concept map is a graphical representation of themes identified in the analysis.
24
Survey Results
As noted in the methodology section, the survey was divided into four sections: (1)
Background, (2) General Attitudes and Abilities, (3) Formal International Education
Experiences, and (4) Informal International Education Experiences. Apropos background data
was presented in the Population and Sample section. This section, Survey Results, will report on
the results from the remaining survey sections.
General Attitudes and Abilities
The General Attitudes and Abilities section asked a series of questions related
international education attitudes and abilities. The questions related to the importance of
international skills to the job market, perceptions on learning of other cultures and the relevance
of international education experiences, and language abilities.
Ability to Compete in the Job Market
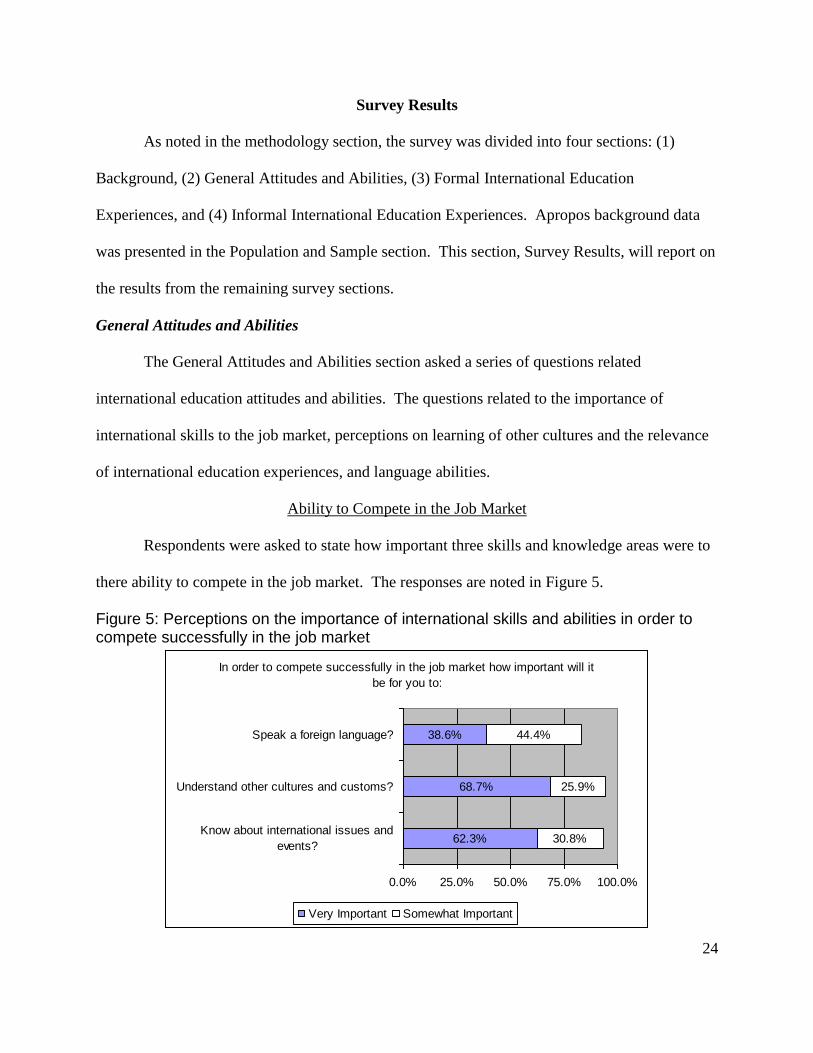
Respondents were asked to state how important three skills and knowledge areas were to
there ability to compete in the job market. The responses are noted in Figure 5.
Figure 5: Perceptions on the importance of international skills and abilities in order to compete successfully in the job market
In order to compete successfully in the job market how important will it
be for you to:
62.3%
68.7%
38.6%
30.8%
25.9%
44.4%
0.0% 25.0% 50.0% 75.0% 100.0%
Know about international issues and
events?
Understand other cultures and customs?
Speak a foreign language?
Very Important Somewhat Important
25
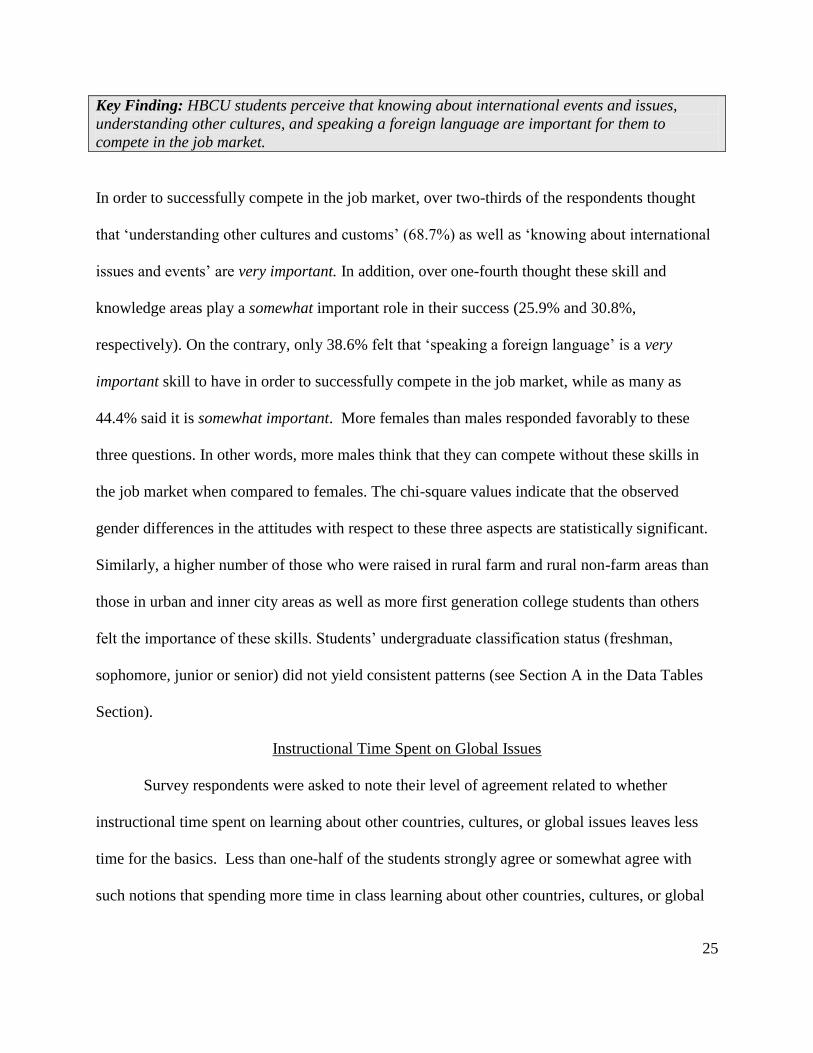
Key Finding: HBCU students perceive that knowing about international events and issues,
understanding other cultures, and speaking a foreign language are important for them to
compete in the job market.
In order to successfully compete in the job market, over two-thirds of the respondents thought
that ‗understanding other cultures and customs‘ (68.7%) as well as ‗knowing about international
issues and events‘ are very important. In addition, over one-fourth thought these skill and
knowledge areas play a somewhat important role in their success (25.9% and 30.8%,
respectively). On the contrary, only 38.6% felt that ‗speaking a foreign language‘ is a very
important skill to have in order to successfully compete in the job market, while as many as
44.4% said it is somewhat important. More females than males responded favorably to these
three questions. In other words, more males think that they can compete without these skills in
the job market when compared to females. The chi-square values indicate that the observed
gender differences in the attitudes with respect to these three aspects are statistically significant.
Similarly, a higher number of those who were raised in rural farm and rural non-farm areas than
those in urban and inner city areas as well as more first generation college students than others
felt the importance of these skills. Students‘ undergraduate classification status (freshman,
sophomore, junior or senior) did not yield consistent patterns (see Section A in the Data Tables
Section).
Instructional Time Spent on Global Issues
Survey respondents were asked to note their level of agreement related to whether
instructional time spent on learning about other countries, cultures, or global issues leaves less
time for the basics. Less than one-half of the students strongly agree or somewhat agree with
such notions that spending more time in class learning about other countries, cultures, or global
26
issues result in the availability of less time for the basics (44.1%) or learning about other
countries, cultures and global issues may be useful, but not necessary (38.6%). Consistent with
the above gender differences, males more frequently strongly agreed/somewhat agreed with both
the notions than females. The corresponding chi-square values also suggest that these differences
are statistically significant. Based on where they were primarily raised, those from rural farm
areas tend to agree more frequently with these notions than others—perhaps due to the additional
time they need to catch up with others in their classes. These differences are significant as well.
However, no significant differences were found either on the basis of whether they were first
generation college students or their undergraduate classification.
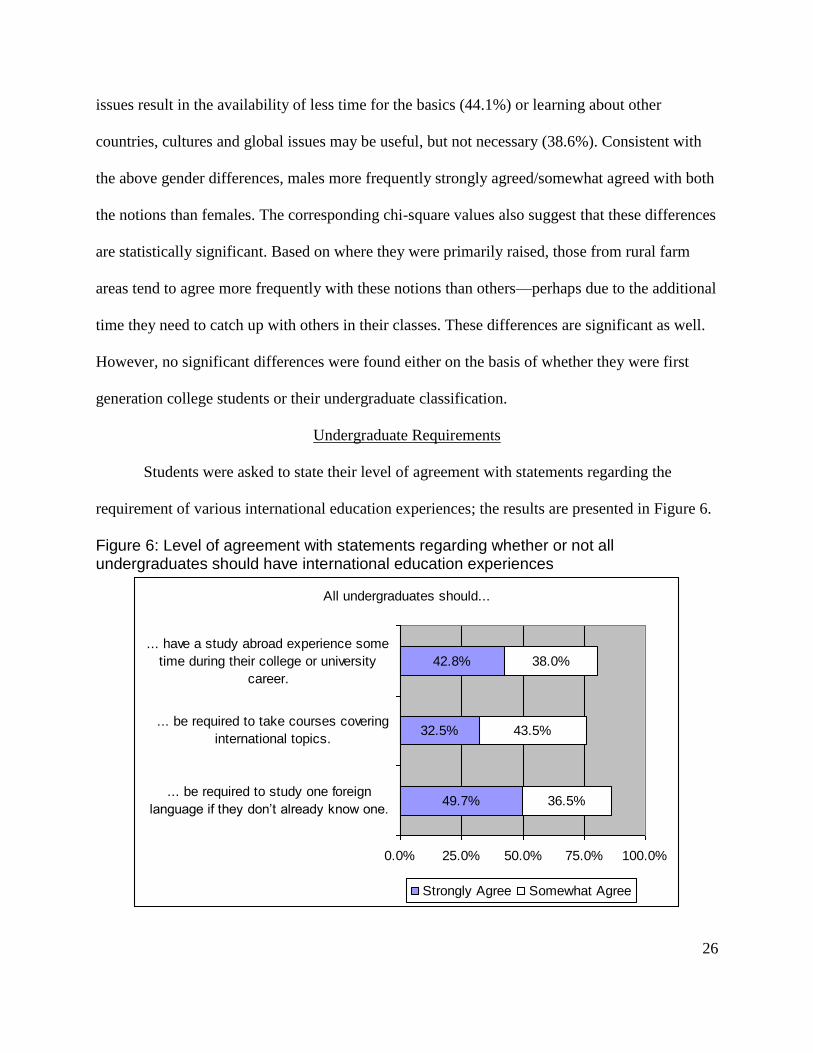
Undergraduate Requirements
Students were asked to state their level of agreement with statements regarding the
requirement of various international education experiences; the results are presented in Figure 6.
Figure 6: Level of agreement with statements regarding whether or not all undergraduates should have international education experiences
All undergraduates should...
49.7%
32.5%
42.8%
36.5%
43.5%
38.0%
0.0% 25.0% 50.0% 75.0% 100.0%
... be required to study one foreign
language if they don’t already know one.
... be required to take courses covering
international topics.
... have a study abroad experience some
time during their college or university
career.
Strongly Agree Somewhat Agree
27
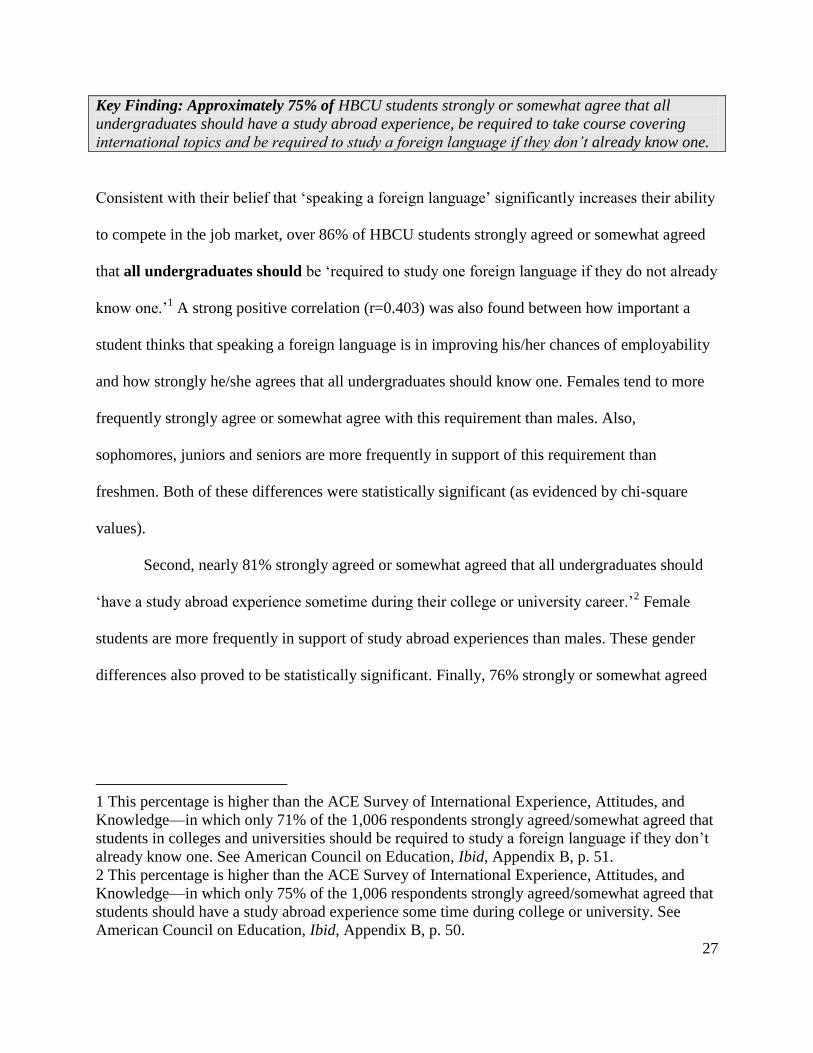
Key Finding: Approximately 75% of HBCU students strongly or somewhat agree that all
undergraduates should have a study abroad experience, be required to take course covering
international topics and be required to study a foreign language if they don’t already know one.
Consistent with their belief that ‗speaking a foreign language‘ significantly increases their ability
to compete in the job market, over 86% of HBCU students strongly agreed or somewhat agreed
that all undergraduates should be ‗required to study one foreign language if they do not already
know one.‘1 A strong positive correlation (r=0.403) was also found between how important a
student thinks that speaking a foreign language is in improving his/her chances of employability
and how strongly he/she agrees that all undergraduates should know one. Females tend to more
frequently strongly agree or somewhat agree with this requirement than males. Also,
sophomores, juniors and seniors are more frequently in support of this requirement than
freshmen. Both of these differences were statistically significant (as evidenced by chi-square
values).
Second, nearly 81% strongly agreed or somewhat agreed that all undergraduates should
‗have a study abroad experience sometime during their college or university career.‘2 Female
students are more frequently in support of study abroad experiences than males. These gender
differences also proved to be statistically significant. Finally, 76% strongly or somewhat agreed
1 This percentage is higher than the ACE Survey of International Experience, Attitudes, and
Knowledge—in which only 71% of the 1,006 respondents strongly agreed/somewhat agreed that
students in colleges and universities should be required to study a foreign language if they don‘t
already know one. See American Council on Education, Ibid, Appendix B, p. 51.
2 This percentage is higher than the ACE Survey of International Experience, Attitudes, and
Knowledge—in which only 75% of the 1,006 respondents strongly agreed/somewhat agreed that
students should have a study abroad experience some time during college or university. See
American Council on Education, Ibid, Appendix B, p. 50.
28
that all undergraduates should be required to take courses covering international topics.3 This
pattern is consistent across the categories of gender, classification, where they were primarily
raised, or whether they were first generation college students.
Study of International Related Areas
Students were asked to rate their level of agreement with a variety of statements on the
benefits of international education noted in the literature. Most agree or strongly agree that
studying international topics, foreign languages, and visiting other countries will increase their
understanding of their own culture and values (90.8%), more so among those raised in rural farm
and rural non-farm areas (the chi-square value is significant). Over 96% agree or strongly agree
that such experiences will not only increase their understanding of other people and cultures, but
also provide them with skills to work with people from diverse backgrounds. Females
significantly agree more often than males. Nearly 86% strongly and somewhat agree that these
experiences will help them get a better job, with female agreement higher than male agreement.
Key Finding: Females attitudes towards international education experiences tend to be more
positive than males. Females were more positive on the benefits they would derive on the job
market from participation in international experiences. Females were also more positive than
males on the belief the all undergraduates should international education experiences.
Language Ability
Nearly 95% of the students in this study reported being U.S. Citizens (n=1,278). When
asked whether they studied a foreign language before college, 87.7% (n=1,180) replied ‗yes,‘
although only 11.1% (n=150) were a native speakers of a language other than English. Only
9.2% (n=124) come from a bilingual home; and yet, 60.5% (n=814) are able to speak or read at
3 This percentage is very close to the ACE Survey of International Experience, Attitudes, and
Knowledge—in which 77% of the 1,006 respondents strongly agreed/somewhat agreed that
colleges and universities should require students to take courses covering international topics.
See American Council on Education, Ibid, Appendix B, p. 51.
29
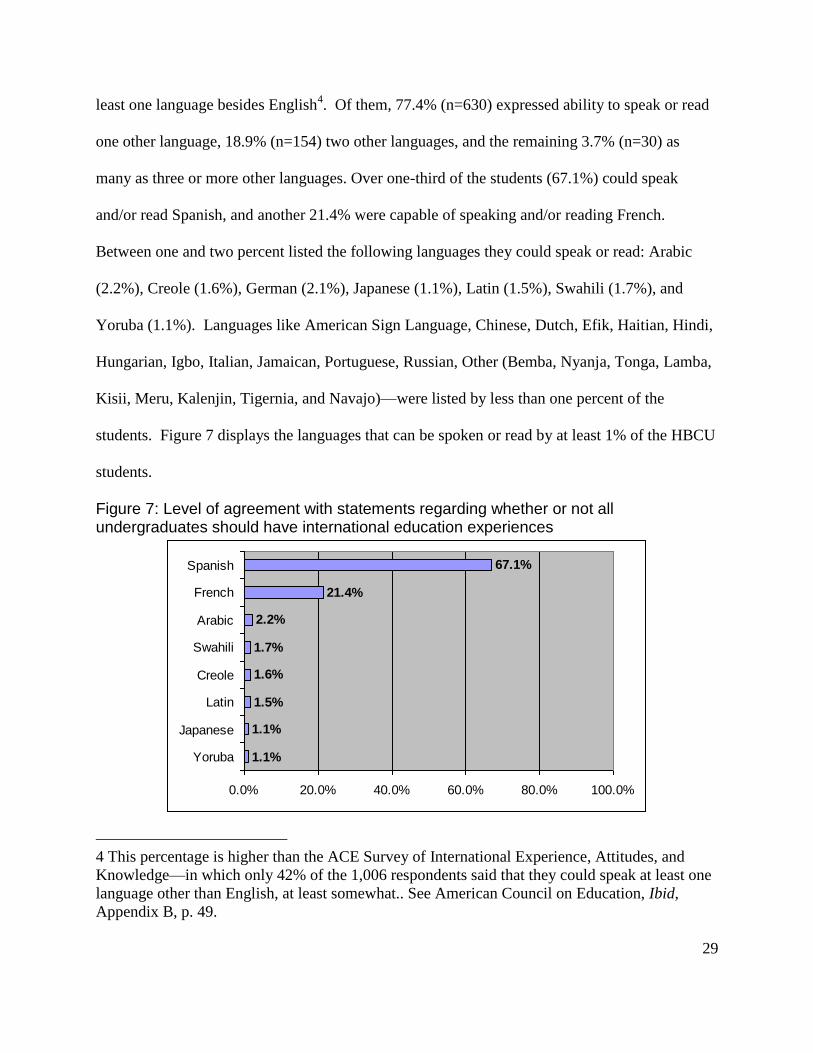
least one language besides English4. Of them, 77.4% (n=630) expressed ability to speak or read
one other language, 18.9% (n=154) two other languages, and the remaining 3.7% (n=30) as
many as three or more other languages. Over one-third of the students (67.1%) could speak
and/or read Spanish, and another 21.4% were capable of speaking and/or reading French.
Between one and two percent listed the following languages they could speak or read: Arabic
(2.2%), Creole (1.6%), German (2.1%), Japanese (1.1%), Latin (1.5%), Swahili (1.7%), and
Yoruba (1.1%). Languages like American Sign Language, Chinese, Dutch, Efik, Haitian, Hindi,
Hungarian, Igbo, Italian, Jamaican, Portuguese, Russian, Other (Bemba, Nyanja, Tonga, Lamba,
Kisii, Meru, Kalenjin, Tigernia, and Navajo)—were listed by less than one percent of the
students. Figure 7 displays the languages that can be spoken or read by at least 1% of the HBCU
students.
Figure 7: Level of agreement with statements regarding whether or not all undergraduates should have international education experiences
1.1%
1.1%
1.5%
1.6%
1.7%
2.2%
21.4%
67.1%
0.0% 20.0% 40.0% 60.0% 80.0% 100.0%
Yoruba
Japanese
Latin
Creole
Swahili
Arabic
French
Spanish
4 This percentage is higher than the ACE Survey of International Experience, Attitudes, and
Knowledge—in which only 42% of the 1,006 respondents said that they could speak at least one
language other than English, at least somewhat.. See American Council on Education, Ibid,
Appendix B, p. 49.
30
Formal International Education Experiences
The Formal International Education Experiences survey section asked a series of
questions related to the academic activities of the students. Areas covered included travel for
academic reasons, perceptions on the importance of a variety of international experiences, and
participation in international academic activities.
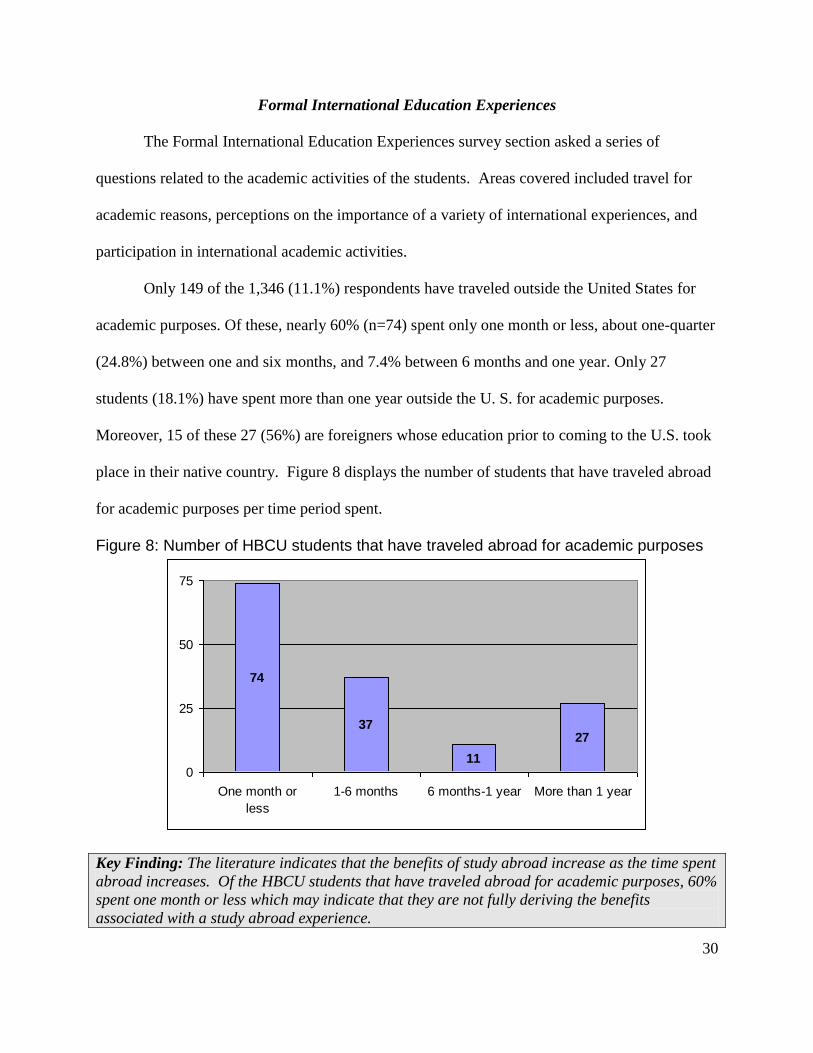
Only 149 of the 1,346 (11.1%) respondents have traveled outside the United States for
academic purposes. Of these, nearly 60% (n=74) spent only one month or less, about one-quarter
(24.8%) between one and six months, and 7.4% between 6 months and one year. Only 27
students (18.1%) have spent more than one year outside the U. S. for academic purposes.
Moreover, 15 of these 27 (56%) are foreigners whose education prior to coming to the U.S. took
place in their native country. Figure 8 displays the number of students that have traveled abroad
for academic purposes per time period spent.
Figure 8: Number of HBCU students that have traveled abroad for academic purposes
74
37
11
27
0
25
50
75
One month or
less
1-6 months 6 months-1 year More than 1 year
Key Finding: The literature indicates that the benefits of study abroad increase as the time spent
abroad increases. Of the HBCU students that have traveled abroad for academic purposes, 60%
spent one month or less which may indicate that they are not fully deriving the benefits
associated with a study abroad experience.
31
The most commonly visited countries visited for academic purposes included Canada
(10.7%), France (9.4%), Mexico (7.4%), Nigeria (6.0%), South Africa (6.0%), Spain (7.4%), and
United Kingdom (4.3%). Other nations, though specified less commonly, included: Bahamas
(2.0%), Bermuda (0.7%), Brazil (2.0%), Chile (1.3%), China (2.0%), Costa Rica (4.7%),
Ecuador (2.0%), Gambia (0.7%), Germany (4.7%), Ghana (2.0%), Guyana (0.7%), Haiti (1.3%),
Hungary (0.7%), India (1.3%), Italy (1.3%), Jamaica (1.3%), Japan (2.7%), Kenya (2.7%),
Morocco (1.3%), Nicaragua (1.3%), Poland (1.3%), St. Kitts (0.7%), Switzerland (1.3%),
Tanzania (1.3%), Trinidad and Tobago (2.7%), West Africa (1.3%), Zambia (1.3%), and
Zimbabwe (2.0%).
The students who traveled outside the U.S. for academic purposes were predominantly
female (67.1%), raised primarily in urban areas (37.6%) or inner cities (27.5%), were not first
generation college students (57.0%) and were senior undergraduates (38.1%). These patterns
remained the same regardless of how long they stayed outside the U.S. for academic purposes,
with a single exception that sophomores were the majority among those who stayed outside the
country for more than one year (44.4%). It is understandable that while more seniors prefer to
have this experience before they graduate from college, they are less likely to stay for a longer
duration as they need to be at their host institution long before their graduation in order to
complete all the necessary requirements for on-time graduation.
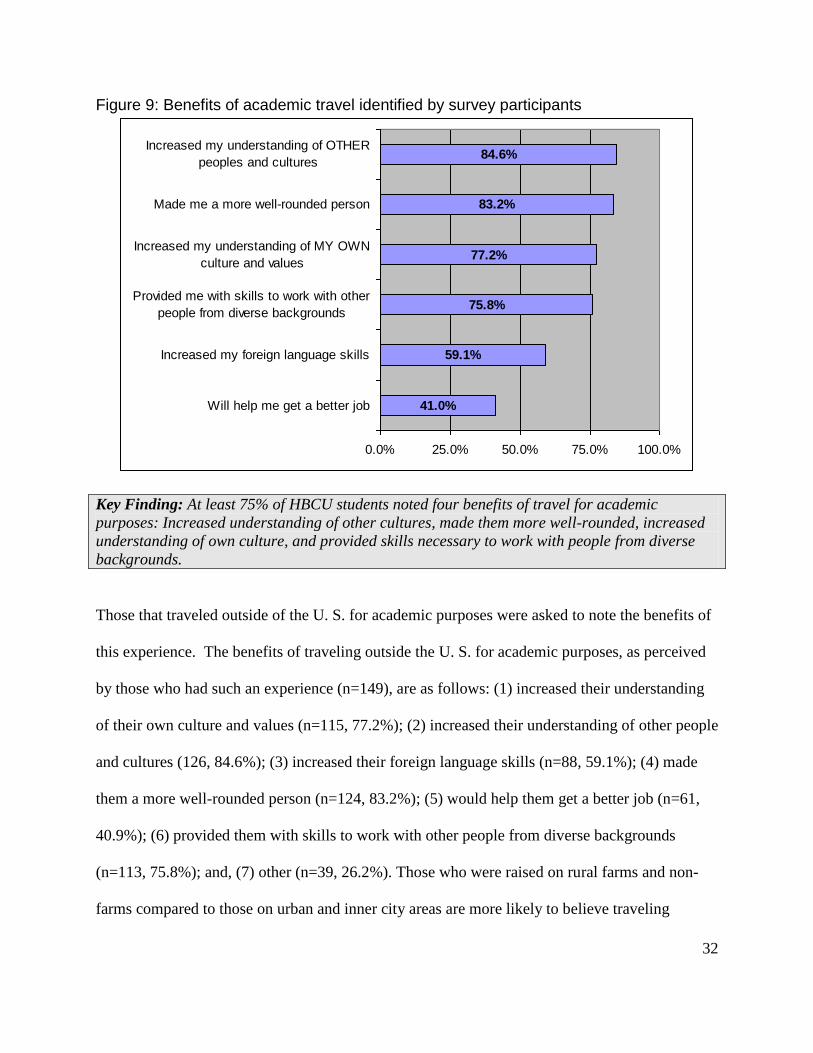
Students were asked to note the benefits related to their academic travel abroad in six
areas identified in the literature. These results are presented in Figure 9.
32
Figure 9: Benefits of academic travel identified by survey participants
41.0%
59.1%
75.8%
77.2%
83.2%
84.6%
0.0% 25.0% 50.0% 75.0% 100.0%
Will help me get a better job
Increased my foreign language skills
Provided me with skills to work with other
people from diverse backgrounds
Increased my understanding of MY OWN
culture and values
Made me a more well-rounded person
Increased my understanding of OTHER
peoples and cultures
Key Finding: At least 75% of HBCU students noted four benefits of travel for academic
purposes: Increased understanding of other cultures, made them more well-rounded, increased
understanding of own culture, and provided skills necessary to work with people from diverse
backgrounds.
Those that traveled outside of the U. S. for academic purposes were asked to note the benefits of
this experience. The benefits of traveling outside the U. S. for academic purposes, as perceived
by those who had such an experience (n=149), are as follows: (1) increased their understanding
of their own culture and values (n=115, 77.2%); (2) increased their understanding of other people
and cultures (126, 84.6%); (3) increased their foreign language skills (n=88, 59.1%); (4) made
them a more well-rounded person (n=124, 83.2%); (5) would help them get a better job (n=61,
40.9%); (6) provided them with skills to work with other people from diverse backgrounds
(n=113, 75.8%); and, (7) other (n=39, 26.2%). Those who were raised on rural farms and non-
farms compared to those on urban and inner city areas are more likely to believe traveling
33
outside the nation would: (a) increase their understanding of their own culture and values, and
(b) provide them with skills to work with other people from diverse backgrounds. While females,
more often than males, tend to subscribe to the latter, they also join the first generation college
students to espouse that such international travel would increase their understanding of other
people and cultures.
Importance of Academic Study Topics
Students were asked to rate the importance of participation in four different international
education experiences. These results are presented in Figure 10.
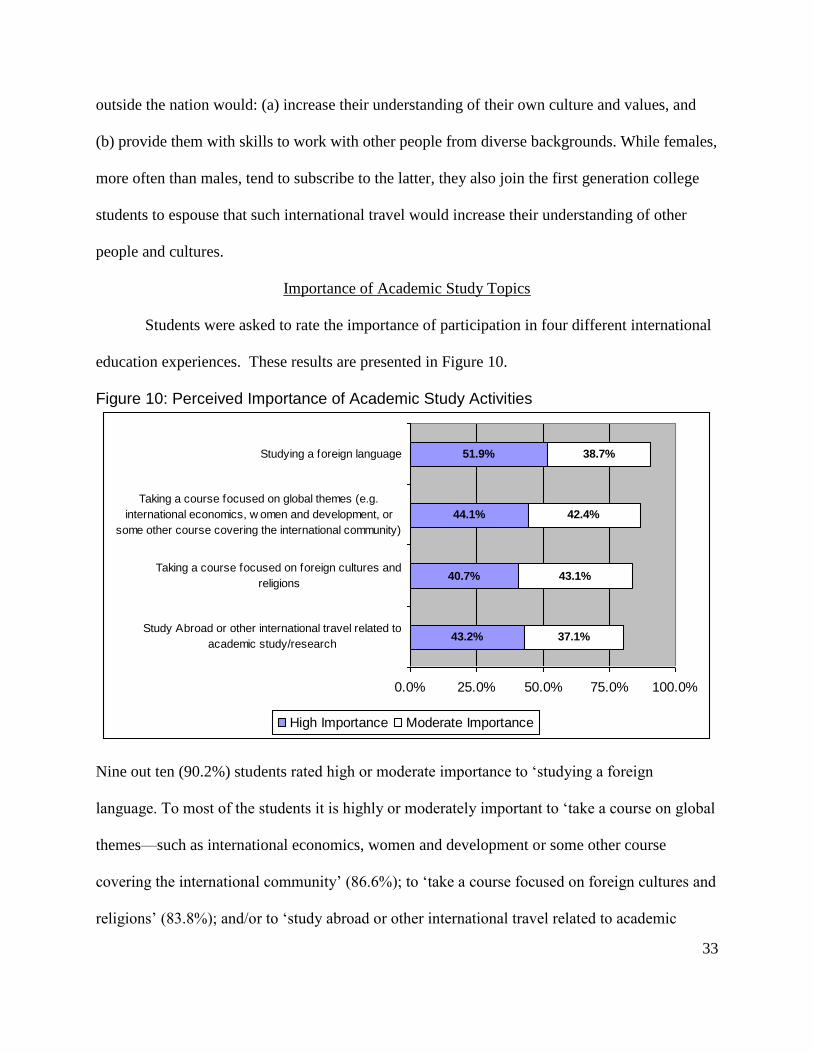
Figure 10: Perceived Importance of Academic Study Activities
43.2%
40.7%
44.1%
51.9%
37.1%
43.1%
42.4%
38.7%
0.0% 25.0% 50.0% 75.0% 100.0%
Study Abroad or other international travel related to
academic study/research
Taking a course focused on foreign cultures and
religions
Taking a course focused on global themes (e.g.
international economics, w omen and development, or
some other course covering the international community)
Studying a foreign language
High Importance Moderate Importance
Nine out ten (90.2%) students rated high or moderate importance to ‗studying a foreign
language. To most of the students it is highly or moderately important to ‗take a course on global
themes—such as international economics, women and development or some other course
covering the international community‘ (86.6%); to ‗take a course focused on foreign cultures and
religions‘ (83.8%); and/or to ‗study abroad or other international travel related to academic
34
study/research‘ (80.3%). All these activity participations received higher ratings of importance
from females than males. No significant differences were apparent by other factors (i.e., where
they were primarily raised, whether or not they were first generation college students or their
classification).
Participation in International Academic Activities
When students were asked about their actual participation in international activities,
males, freshmen, and those primarily raised on rural farms were less likely to participate in
‗studying a foreign language,‘ than females. The participation levels constantly increase in
taking courses focused on ‗global themes‘ and ‗foreign cultures and religions‘ as they moved up
from ‗freshman‘ to ‗senior‘ level. In other words, the participation levels in these courses are at
minimum among juniors and at the highest among seniors. The low participation of freshman
may be due to the fact that normally they are required to take a long list of general education
classes in freshman years; and, unless these global theme/foreign culture are included in the list
of their general education curriculum they are less likely to enroll in those classes in their first
year in an undergraduate program.
When the overall levels of perceptions and participations in these activities are compared,
the perception-participation gap was found to be narrow for ‗studying a foreign language‘
(90.2% vs. 81.1%); moderate for ‗taking a course focused on global themes—such as
international economics, women and development or some other course covering the
international community‘ (86.6% vs. 56.2%) and ‗taking a course focused on foreign cultures
and religions‘ (83.8% vs. 56.2%); and wider for ‗studying abroad or other international travel
related to academic study/research‘ (80.3% vs. 19.9%). The next question, therefore, asked to
know why they did or did not participate in these activities.
35
Of the 16 response-categories provided, 72% of the students chose three main reasons for
‗studying a foreign language‘: graduation requirements (45.6%), interest (18.6%), and planned to
do this before graduating from college (7.7%). Sixty-four percent selected four major reasons
‗taking a course focused on global themes‘: graduation requirements (26.8%), elective option
(10.5%), interest (16.1%), and planned to do this before graduating from college (10.5%). Sixty-
seven percent elected the same four major reasons ‗taking a course focused on foreign cultures
and religions‘: graduation requirements (27.0%), elective option (9.7%), interest (19.8%), and
planned to do this before graduating from college (10.5%). About 58% asserted five main
reasons for ‗studying abroad or other international travel related to academic study/research‘:
graduation requirements (6.5%), costs (16.6%), interest (11.4%), financial support (7.6%), and
planned to do this before graduating from college (15.4%). When compared between those
participated and not participated, these response patterns remained the same.
The survey data tables for Formal International Education Experiences are available in
Appendix E, Section B.
36
Informal International Education Experiences
The Informal International Education Experiences survey section asked a series of
questions related to activities that were not academic activities. Areas covered included travel,
participation in informal education experiences, perceptions on the importance of a variety of
informal international experiences, importance of and participation in international related extra-
curricular activities, and importance of and participation in other informal international related
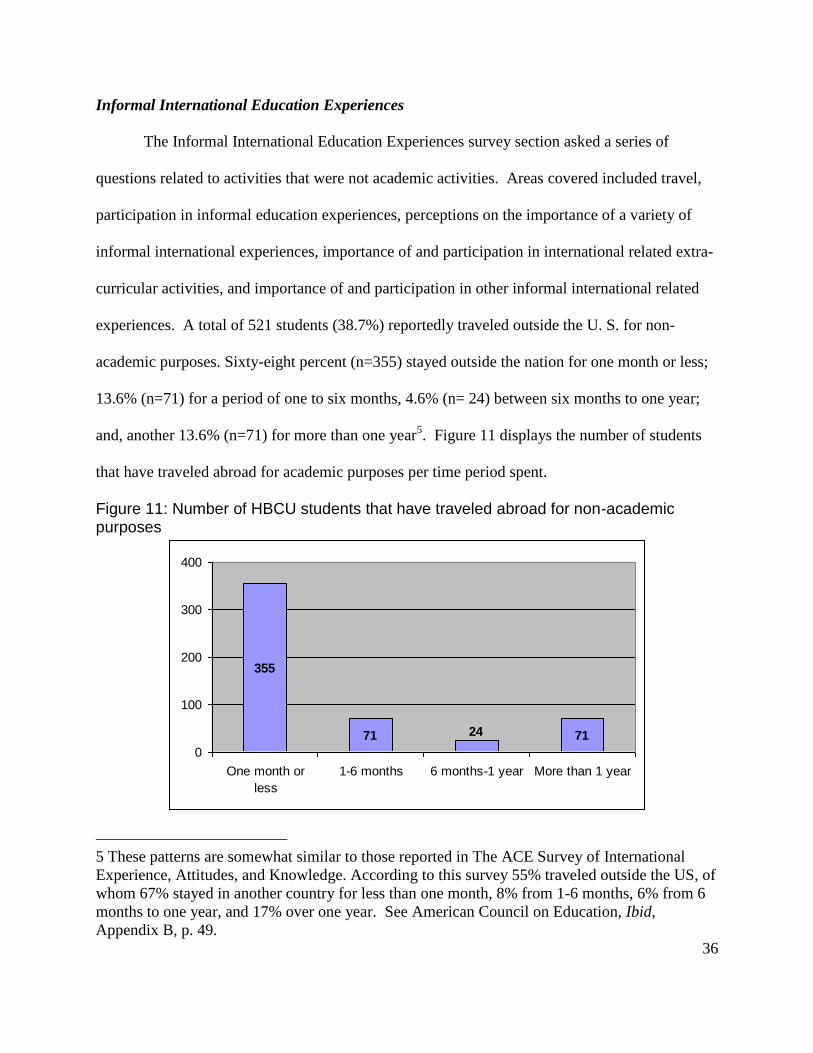
experiences. A total of 521 students (38.7%) reportedly traveled outside the U. S. for non-
academic purposes. Sixty-eight percent (n=355) stayed outside the nation for one month or less;
13.6% (n=71) for a period of one to six months, 4.6% (n= 24) between six months to one year;
and, another 13.6% (n=71) for more than one year5. Figure 11 displays the number of students
that have traveled abroad for academic purposes per time period spent.
Figure 11: Number of HBCU students that have traveled abroad for non-academic purposes
355
71 7124
0
100
200
300
400
One month or
less
1-6 months 6 months-1 year More than 1 year
5 These patterns are somewhat similar to those reported in The ACE Survey of International
Experience, Attitudes, and Knowledge. According to this survey 55% traveled outside the US, of
whom 67% stayed in another country for less than one month, 8% from 1-6 months, 6% from 6
months to one year, and 17% over one year. See American Council on Education, Ibid,
Appendix B, p. 49.
37
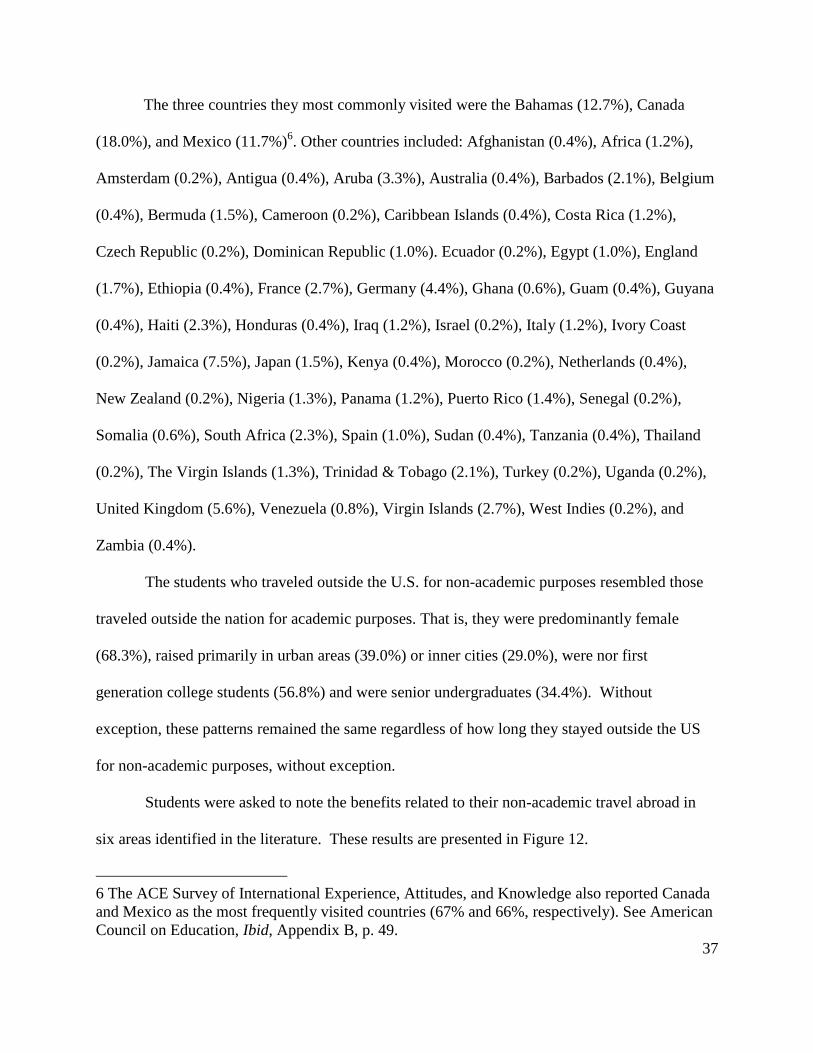
The three countries they most commonly visited were the Bahamas (12.7%), Canada
(18.0%), and Mexico (11.7%)6. Other countries included: Afghanistan (0.4%), Africa (1.2%),
Amsterdam (0.2%), Antigua (0.4%), Aruba (3.3%), Australia (0.4%), Barbados (2.1%), Belgium
(0.4%), Bermuda (1.5%), Cameroon (0.2%), Caribbean Islands (0.4%), Costa Rica (1.2%),
Czech Republic (0.2%), Dominican Republic (1.0%). Ecuador (0.2%), Egypt (1.0%), England
(1.7%), Ethiopia (0.4%), France (2.7%), Germany (4.4%), Ghana (0.6%), Guam (0.4%), Guyana
(0.4%), Haiti (2.3%), Honduras (0.4%), Iraq (1.2%), Israel (0.2%), Italy (1.2%), Ivory Coast
(0.2%), Jamaica (7.5%), Japan (1.5%), Kenya (0.4%), Morocco (0.2%), Netherlands (0.4%),
New Zealand (0.2%), Nigeria (1.3%), Panama (1.2%), Puerto Rico (1.4%), Senegal (0.2%),
Somalia (0.6%), South Africa (2.3%), Spain (1.0%), Sudan (0.4%), Tanzania (0.4%), Thailand
(0.2%), The Virgin Islands (1.3%), Trinidad & Tobago (2.1%), Turkey (0.2%), Uganda (0.2%),
United Kingdom (5.6%), Venezuela (0.8%), Virgin Islands (2.7%), West Indies (0.2%), and
Zambia (0.4%).
The students who traveled outside the U.S. for non-academic purposes resembled those
traveled outside the nation for academic purposes. That is, they were predominantly female
(68.3%), raised primarily in urban areas (39.0%) or inner cities (29.0%), were nor first
generation college students (56.8%) and were senior undergraduates (34.4%). Without
exception, these patterns remained the same regardless of how long they stayed outside the US
for non-academic purposes, without exception.
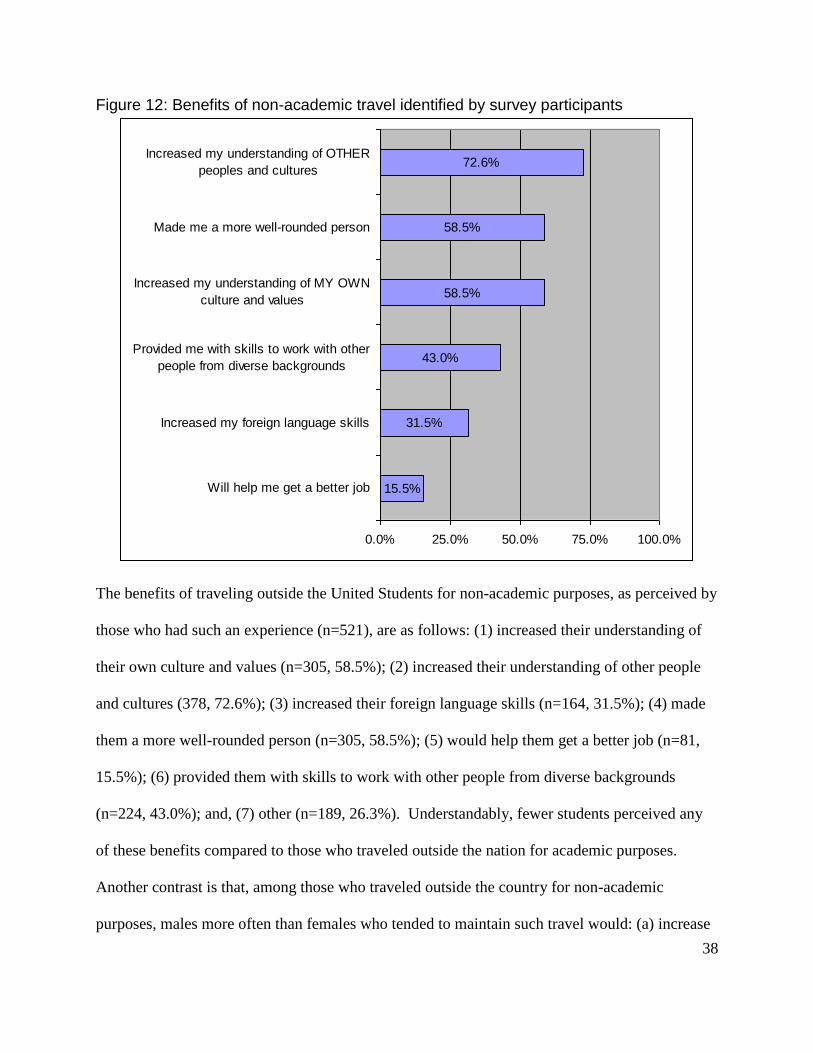
Students were asked to note the benefits related to their non-academic travel abroad in
six areas identified in the literature. These results are presented in Figure 12.
6 The ACE Survey of International Experience, Attitudes, and Knowledge also reported Canada
and Mexico as the most frequently visited countries (67% and 66%, respectively). See American
Council on Education, Ibid, Appendix B, p. 49.
38
Figure 12: Benefits of non-academic travel identified by survey participants
15.5%
31.5%
43.0%
58.5%
58.5%
72.6%
0.0% 25.0% 50.0% 75.0% 100.0%
Will help me get a better job
Increased my foreign language skills
Provided me with skills to work with other
people from diverse backgrounds
Increased my understanding of MY OWN
culture and values
Made me a more well-rounded person
Increased my understanding of OTHER
peoples and cultures
The benefits of traveling outside the United Students for non-academic purposes, as perceived by
those who had such an experience (n=521), are as follows: (1) increased their understanding of
their own culture and values (n=305, 58.5%); (2) increased their understanding of other people
and cultures (378, 72.6%); (3) increased their foreign language skills (n=164, 31.5%); (4) made
them a more well-rounded person (n=305, 58.5%); (5) would help them get a better job (n=81,
15.5%); (6) provided them with skills to work with other people from diverse backgrounds
(n=224, 43.0%); and, (7) other (n=189, 26.3%). Understandably, fewer students perceived any
of these benefits compared to those who traveled outside the nation for academic purposes.
Another contrast is that, among those who traveled outside the country for non-academic
purposes, males more often than females who tended to maintain such travel would: (a) increase
39
their understanding of their own culture and values; (b) increase their foreign language skills;
and (c) help them get a better job. Secondly, those who were not the first generation college
students were prone to join males in maintaining that such travel would increase their foreign
language skills, also thinking that it would increase their understanding of other peoples and
cultures; and, make them a more well-rounded—that is, when compared to first generation
college students. Lastly, those who were raised in rural farm areas believe more often than those
raised in rural non-farm, urban and inner city areas that traveling outside the United States for
non-academic purposes has other benefits (unrelated to academics and careers).
Participation in Informal Education Experiences
When students were asked about their participation or plans for participation in campus
activities related to informal international education, two activities gained more popularity than
others. Several students are found to have participated in international festivals on campus
(29.1%) and study groups with international students (22.6%); and, several more are planning to
participate (55.6% and 56.2%, respectively). As expected, senior undergraduates constituted a
significantly larger portion of those who have already participated, while freshman were the
majority among those who are planning to participate in both activities. Also, males are involved
in study groups with international students more frequently than females.
Although the current participation levels are rather low in buddy programs (6.8%) and
language partner programs (6.3%) that pair US students with international students, several
students expressed the likelihood of their participation (68.1% and 72.6%, respectively). Here, an
interesting gender preference is noticed—that is, while females show more interest in buddy
programs, males are more enthusiastic about participating in language partner programs.
40
International residence halls received not only a low percentage of ‗participated‘ students (6.8%)
but also the highest among ‗not interested‘ (37.6%).
Undergraduate minority students are well aware of the importance of participating in
extracurricular activities with international foci. At least three-fourths perceived high or
moderate importance of: (a) internship in the US with an organization focused on international
issues (78.5%); (b) international internship (79.0%); (c) community service/volunteer in the US
with an organization focused on international issues (81.7%); (d) local community service/
volunteer (e.g. tutoring) with international populations (84.5%); (e) community service/volunteer
in a foreign country (75.0%); and, (f) foreign language or international clubs/groups (79.0%).
Females tend to rate higher than males for activities (a), (d) and (f). Students raised primarily in
rural farm areas are likely to perceive a higher importance of activities (b), (c), (d) and (f).
Freshmen seem to be rather slow in realizing the importance of activity (c).
When asked, however, about their actual participation in the above activities—males
reported participating more often than females in activities (a), (b), (e) and (f). When the overall
levels of perceptions and participations in these activities are compared, similar to the formal
international education experiences, the perception-participation gap was evident with
participation rates ranging from 8.8% in activity (b) to 30.5% in activity (d). Activities (a) and
(e) are in the lower end with participation of only 11.3% and 13.0% of students, activity (c) is in
the middle with 22.7% participation, and activity (f) is on the higher end with 31.1%
participation. In general, these perception-participation gaps are wider than those for formal
international education experiences. Therefore, the next question was asked to determine why
they did or did not participate in these activities.
41
Of the 16 response-categories provided, 82 percent of the students chose six main
reasons for ‗internship in the US with an organization focused on international issues‘: costs
(7.8%), time requirements (7.4%), interest (15.1%), program availability at home institution
(6.7%), planned to do this before graduating from college (8.9%), and other (36.2%). Sixty-eight
percent selected four major reasons for ‗international internship‘: costs (13.8%), interest
(10.9%), planned to do this before graduating from college (10.6%), and other (33.2%). Seventy-
six percent indicated four major reasons for ‗community service/volunteer in the US with an
organization focused on international issues‘ and ‗local community service/volunteer (e.g.
tutoring) with international populations‘: time requirements (10.0% and 9.1%), interest (20.4%
and 23.0%), planned to do this before graduating from college (9.2% and 8.9%), and other
(36.0% and 34.5%). Eighty percent elected the same four major reasons for ‗foreign language or
international clubs/groups‘: time requirements (7.9%), interest (26.2%), planned to do this before
graduating from college (9.8%), and other (36.2%). About 70% asserted four main reasons for
‗community service/volunteer in a foreign country‘: costs (10.9%), interest (14.2%), planned to
do this before graduating from college (8.7%), and other (35.7%). Thus, interest and planning to
do before graduation are two major reasons for participating/not participating in any of these
activities and cost is an added reason when traveling outside the country is involved. These
reasons remain the same for formal international education experiences as well.
Perception of Importance of Other International Activities
At least 80% of the HBCU students felt high or moderate importance for international
study trips or tours (84.6%); panel discussions, workshops, conferences related to international
issues (83.7%); or international travel for holiday or other pleasure related reasons (80.1%).
Males tend to give a higher importance than females to international travel for holiday or other
42
pleasure related reasons. However, as found earlier, when asked about their actual participation
in these activities—the participation levels are far below their perception levels. Specifically,
only 13.7% participated in international study trips or tours; 28.0% in panel discussions,
workshops, and conferences related to international issues, and 21.7% in international travel for
holiday or other pleasure related reasons. Non-first generation college students outnumbered
their counter parts in all the three activities, seniors surpassed others in international study trips
or tours as well as international travel for holiday or other pleasure related reasons, and those
raised primarily in rural non-farm and urban areas exceeded those raised in rural farm and inner
city areas in international travel for holiday or other pleasure related reasons. Perhaps money,
exposure and reason to celebrate are the driving forces behind these patterns. We may also recall
from our earlier discussion in this section that the countries they commonly visited are not far
from the United States—e.g. Mexico, Canada, and Bahamas.
About three-fourths of the students stated four reasons for their participation or lack of
participation in international study trips or tours (73.8%) and international travel for holiday or
other pleasure related reasons (77.6%): costs (24.1% and 21.0%), interest (11.7% and 16.9%),
plan to do this before graduation from college (9.3% and 8.0%), and other (28.7% and 31.7%).
Top five reasons for participating or not participating in panel discussions, workshops,
conferences related to international issues, as chosen by 82% of HBCU students include: time
requirement (8.0%), interest (24.1), program availability at home institution (7.7%), plan to do
this before graduation (7.4%), and other (34.8%). Thus, once again, interest and planning to do
before graduation are two major reasons for participating/not participating in any of these
activities and cost is an added reason when traveling outside the country is involved.
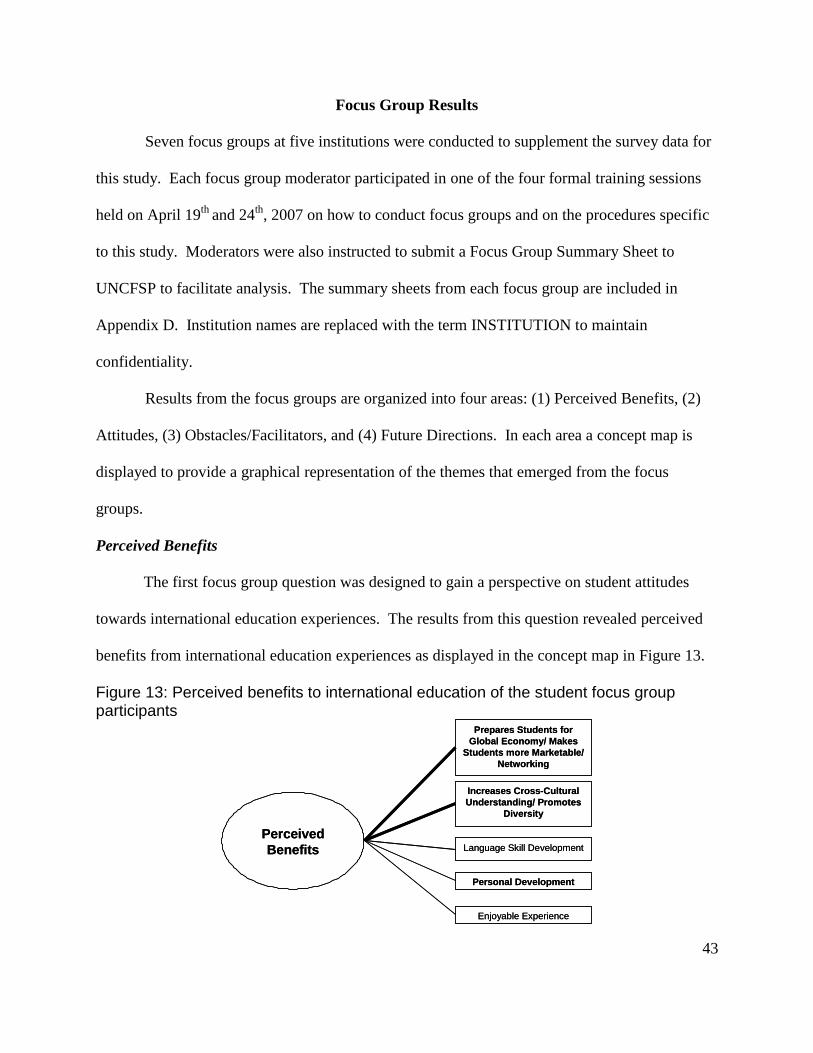
43
Focus Group Results
Seven focus groups at five institutions were conducted to supplement the survey data for
this study. Each focus group moderator participated in one of the four formal training sessions
held on April 19th
and 24th
, 2007 on how to conduct focus groups and on the procedures specific
to this study. Moderators were also instructed to submit a Focus Group Summary Sheet to
UNCFSP to facilitate analysis. The summary sheets from each focus group are included in
Appendix D. Institution names are replaced with the term INSTITUTION to maintain
confidentiality.
Results from the focus groups are organized into four areas: (1) Perceived Benefits, (2)
Attitudes, (3) Obstacles/Facilitators, and (4) Future Directions. In each area a concept map is
displayed to provide a graphical representation of the themes that emerged from the focus
groups.
Perceived Benefits
The first focus group question was designed to gain a perspective on student attitudes
towards international education experiences. The results from this question revealed perceived
benefits from international education experiences as displayed in the concept map in Figure 13.
Figure 13: Perceived benefits to international education of the student focus group participants
Perceived
Benefits
Increases Cross-Cultural
Understanding/ Promotes
Diversity
Prepares Students for
Global Economy/ Makes
Students more Marketable/
Networking
Language Skill Development
Personal Development
Enjoyable Experience
Perceived
Benefits
Increases Cross-Cultural
Understanding/ Promotes
Diversity
Prepares Students for
Global Economy/ Makes
Students more Marketable/
Networking
Language Skill Development
Personal Development
Enjoyable Experience
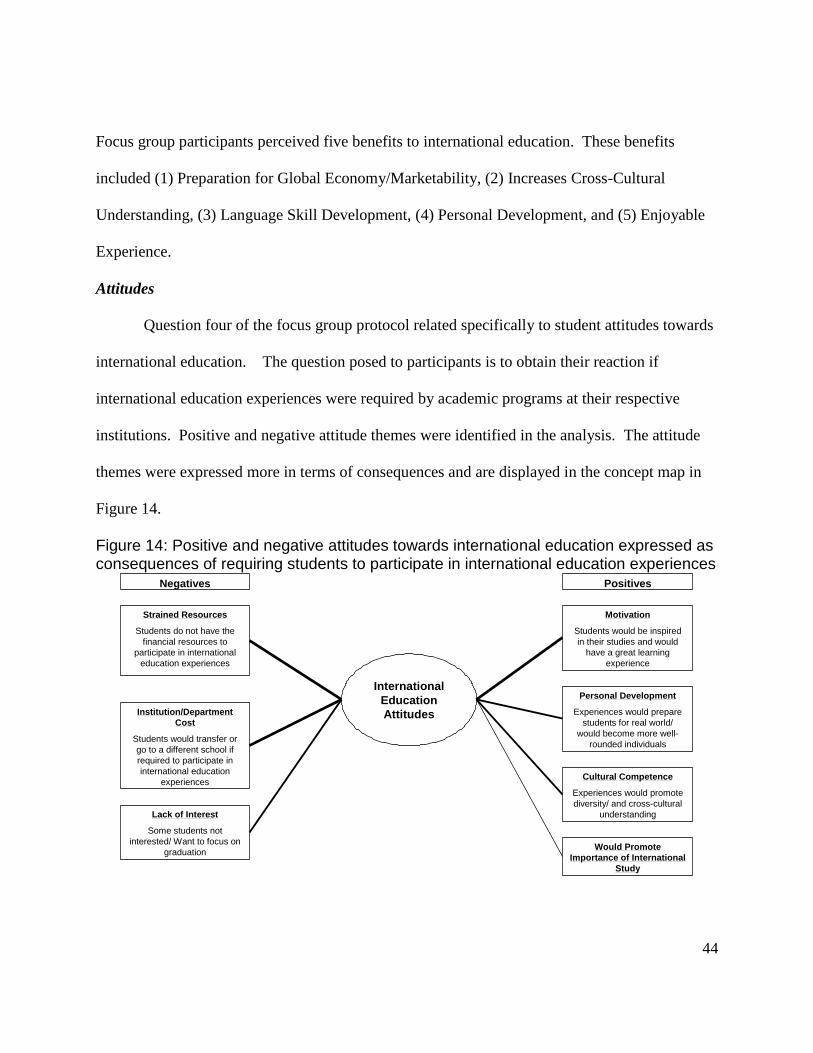
44
Focus group participants perceived five benefits to international education. These benefits
included (1) Preparation for Global Economy/Marketability, (2) Increases Cross-Cultural
Understanding, (3) Language Skill Development, (4) Personal Development, and (5) Enjoyable
Experience.
Attitudes
Question four of the focus group protocol related specifically to student attitudes towards
international education. The question posed to participants is to obtain their reaction if
international education experiences were required by academic programs at their respective
institutions. Positive and negative attitude themes were identified in the analysis. The attitude
themes were expressed more in terms of consequences and are displayed in the concept map in
Figure 14.
Figure 14: Positive and negative attitudes towards international education expressed as consequences of requiring students to participate in international education experiences
Institution/Department
Cost
Students would transfer or
go to a different school if
required to participate in
international education
experiences
International
Education
Attitudes
Strained Resources
Students do not have the
financial resources to
participate in international
education experiences
Lack of Interest
Some students not
interested/ Want to focus on
graduation
Motivation
Students would be inspired
in their studies and would
have a great learning
experience
Personal Development
Experiences would prepare
students for real world/
would become more well-
rounded individuals
Would Promote
Importance of International
Study
Negatives Positives
Cultural Competence
Experiences would promote
diversity/ and cross-cultural
understanding
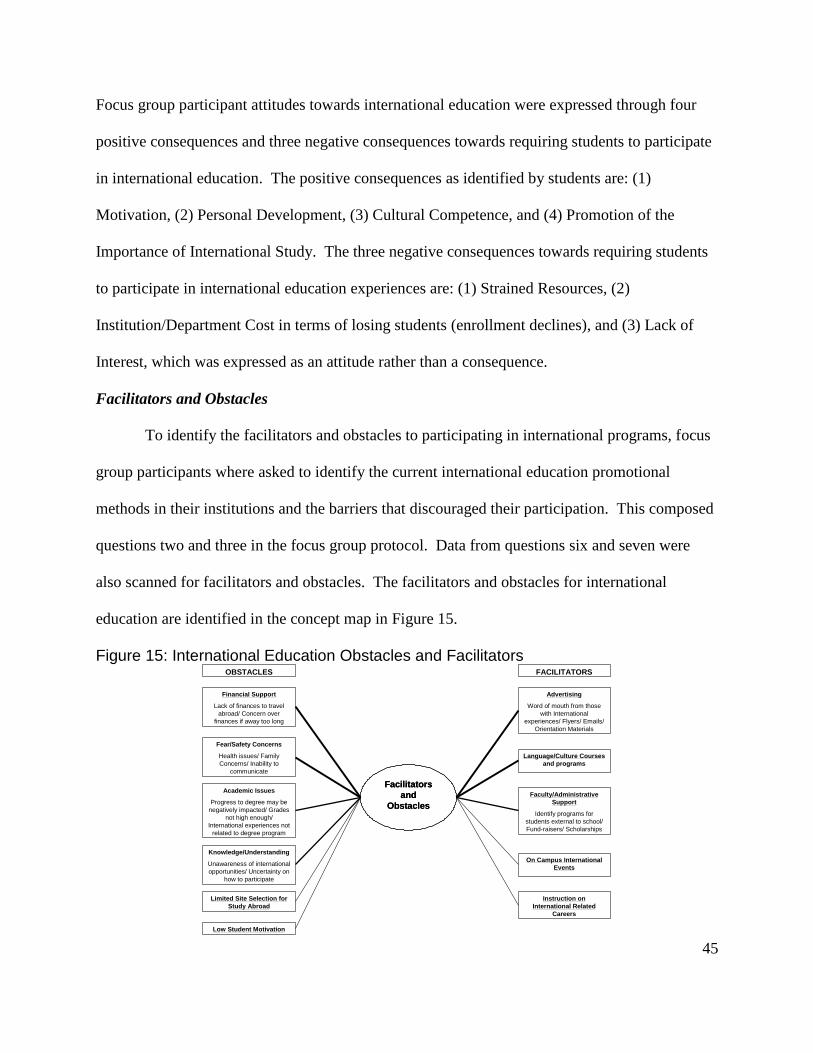
45
Focus group participant attitudes towards international education were expressed through four
positive consequences and three negative consequences towards requiring students to participate
in international education. The positive consequences as identified by students are: (1)
Motivation, (2) Personal Development, (3) Cultural Competence, and (4) Promotion of the
Importance of International Study. The three negative consequences towards requiring students
to participate in international education experiences are: (1) Strained Resources, (2)
Institution/Department Cost in terms of losing students (enrollment declines), and (3) Lack of
Interest, which was expressed as an attitude rather than a consequence.
Facilitators and Obstacles
To identify the facilitators and obstacles to participating in international programs, focus
group participants where asked to identify the current international education promotional
methods in their institutions and the barriers that discouraged their participation. This composed
questions two and three in the focus group protocol. Data from questions six and seven were
also scanned for facilitators and obstacles. The facilitators and obstacles for international
education are identified in the concept map in Figure 15.
Figure 15: International Education Obstacles and Facilitators
Fear/Safety Concerns
Health issues/ Family
Concerns/ Inability to
communicate
Facilitators
and
Obstacles
Facilitators
and
Obstacles
Financial Support
Lack of finances to travel
abroad/ Concern over
finances if away too long
Academic Issues
Progress to degree may be
negatively impacted/ Grades
not high enough/
International experiences not
related to degree program
Knowledge/Understanding
Unawareness of international
opportunities/ Uncertainty on
how to participate
Limited Site Selection for
Study Abroad
Low Student Motivation
Advertising
Word of mouth from those
with International
experiences/ Flyers/ Emails/
Orientation Materials
Language/Culture Courses
and programs
Faculty/Administrative
Support
Identify programs for
students external to school/
Fund-raisers/ Scholarships
On Campus International
Events
Instruction on
International Related
Careers
OBSTACLES FACILITATORS
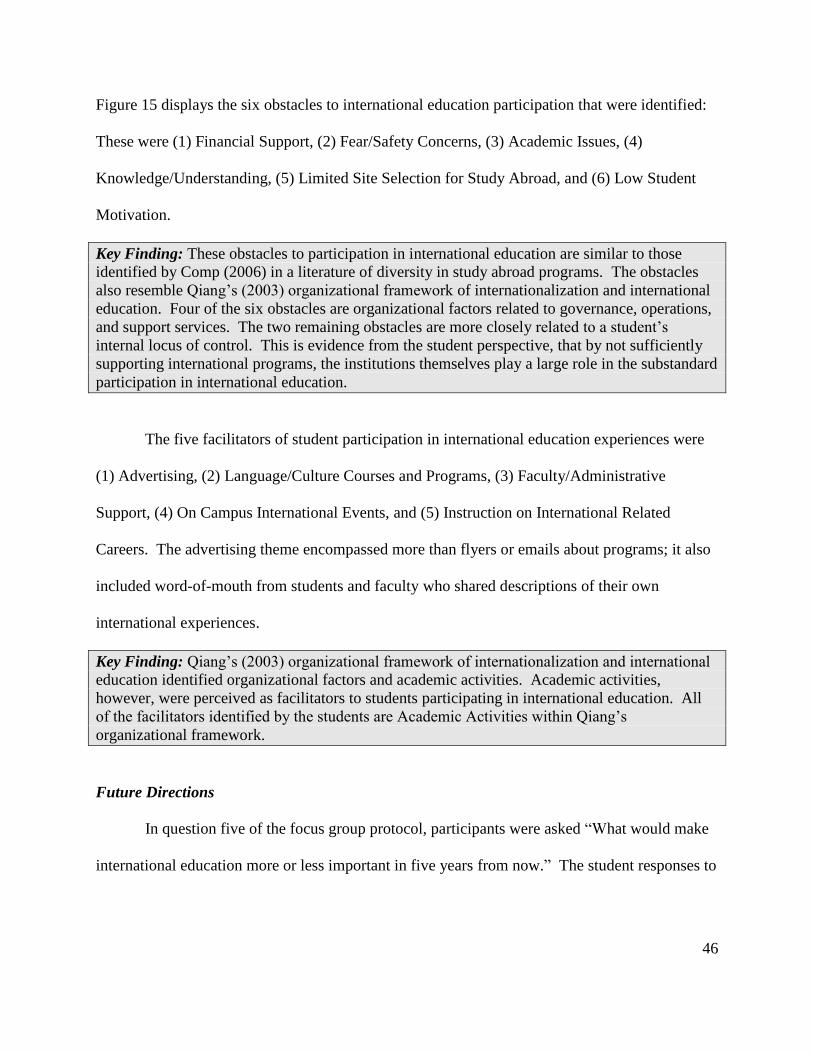
46
Figure 15 displays the six obstacles to international education participation that were identified:
These were (1) Financial Support, (2) Fear/Safety Concerns, (3) Academic Issues, (4)
Knowledge/Understanding, (5) Limited Site Selection for Study Abroad, and (6) Low Student
Motivation.
Key Finding: These obstacles to participation in international education are similar to those
identified by Comp (2006) in a literature of diversity in study abroad programs. The obstacles
also resemble Qiang‘s (2003) organizational framework of internationalization and international
education. Four of the six obstacles are organizational factors related to governance, operations,
and support services. The two remaining obstacles are more closely related to a student‘s
internal locus of control. This is evidence from the student perspective, that by not sufficiently
supporting international programs, the institutions themselves play a large role in the substandard
participation in international education.
The five facilitators of student participation in international education experiences were
(1) Advertising, (2) Language/Culture Courses and Programs, (3) Faculty/Administrative
Support, (4) On Campus International Events, and (5) Instruction on International Related
Careers. The advertising theme encompassed more than flyers or emails about programs; it also
included word-of-mouth from students and faculty who shared descriptions of their own
international experiences.
Key Finding: Qiang‘s (2003) organizational framework of internationalization and international
education identified organizational factors and academic activities. Academic activities,
however, were perceived as facilitators to students participating in international education. All
of the facilitators identified by the students are Academic Activities within Qiang‘s
organizational framework.
Future Directions
In question five of the focus group protocol, participants were asked ―What would make
international education more or less important in five years from now.‖ The student responses to
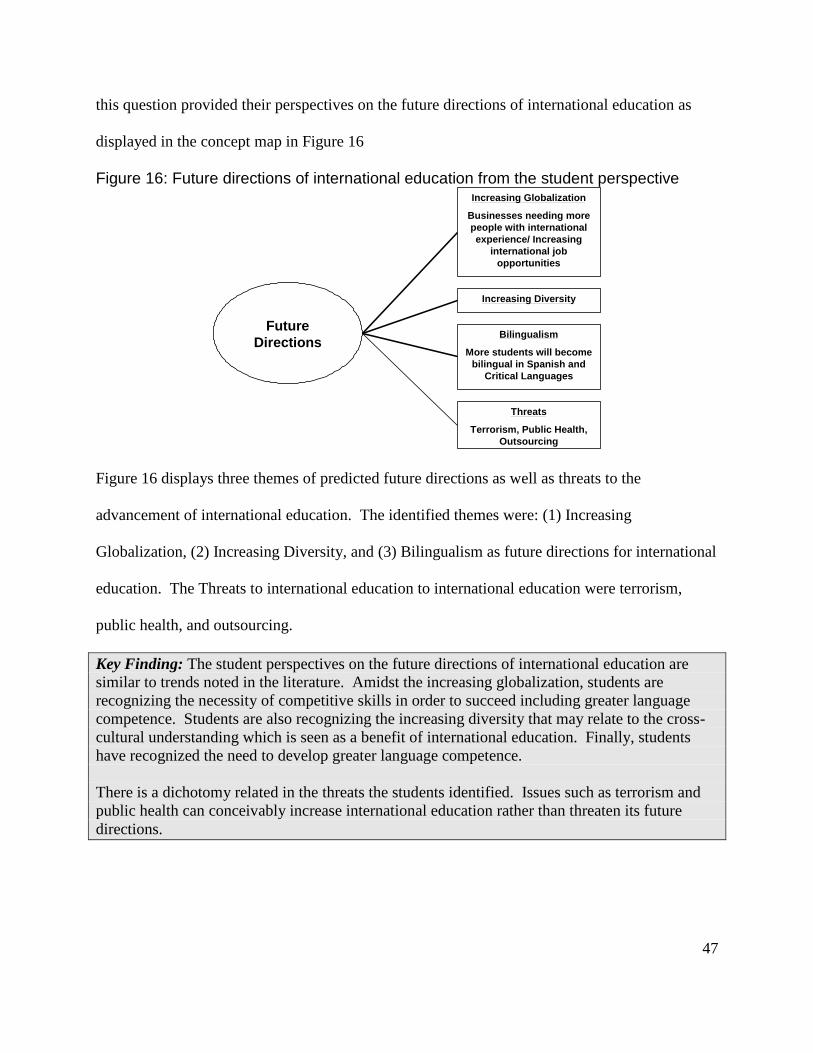
47
this question provided their perspectives on the future directions of international education as
displayed in the concept map in Figure 16
Figure 16: Future directions of international education from the student perspective
Future
Directions
Increasing Diversity
Increasing Globalization
Businesses needing more
people with international
experience/ Increasing
international job
opportunities
Bilingualism
More students will become
bilingual in Spanish and
Critical Languages
Threats
Terrorism, Public Health,
Outsourcing
Figure 16 displays three themes of predicted future directions as well as threats to the
advancement of international education. The identified themes were: (1) Increasing
Globalization, (2) Increasing Diversity, and (3) Bilingualism as future directions for international
education. The Threats to international education to international education were terrorism,
public health, and outsourcing.
Key Finding: The student perspectives on the future directions of international education are
similar to trends noted in the literature. Amidst the increasing globalization, students are
recognizing the necessity of competitive skills in order to succeed including greater language
competence. Students are also recognizing the increasing diversity that may relate to the cross-
cultural understanding which is seen as a benefit of international education. Finally, students
have recognized the need to develop greater language competence.
There is a dichotomy related in the threats the students identified. Issues such as terrorism and
public health can conceivably increase international education rather than threaten its future
directions.
48
Discussion
This study was based on two main research questions associated with international
education at HBCUs. The research questions related to attitudes towards international education
and factors that impact participation. The discussion of the results will review the results in the
context of the research questions.
Research Question One Review
Research question one was ―What are the international education activities and programs
attitudes of minority undergraduates attending HBCUs?‖ In every area, HBCU student attitudes
towards international education are positive. The positive attitudes expressed will be reviewed
by survey section and focus group results.
General Attitudes and Abilities
In the General Attitudes and Abilities survey section, over 80% of the respondents
perceived that international skills (i.e. speaking a foreign language, understanding other cultures,
and knowing about international events) will help them to be successful in the job market in the
future. A majority of HBCU students do not perceive that addressing international issues in the
classroom detracts from instruction on the basics. At least 75% of the HBCU students also
believe that all undergraduates should participate in a study abroad experience, be required to
take courses covering international topics, and should be required to study a foreign language.
There is also vast agreement among HBCU students that studying international topics will help
them to better understand their own culture and values, increase their understanding of other
cultures, and provide them with skills to work with people from diverse backgrounds.
49
The only area where attitudes were not positive related to the benefits of academic travel.
Less than half of the HBCU student respondents that have traveled abroad perceived that the
experience would help them to secure a better job in the future.
Formal International Education Experiences
Positive attitudes were identified in the Formal International Education Experiences
survey section. A vast majority of students that traveled for academic purposes noted that the
experience provided benefits in understanding other cultures, made them more well-rounded,
increased their understanding of their own culture and values, provided skills to work with
people from diverse backgrounds, and increased their foreign language skills. At least 80% of
all HBCU students perceive that it is important to study a foreign language, take a course
focused on global themes, take a course on foreign cultures and religions, and study abroad.
Positive attitudes were also noted in the reasons why students elected to participate in
international education academic study activities. Related to attitudes, the main reasons for
participation were interest and planning to do so before graduating.
Informal International Education Experiences
Positive attitudes were identified in the Informal International Education Experiences
survey section as well. A vast majority of students that traveled for academic purposes noted
that the experience provided benefits in understanding other cultures, and made them more well-
rounded. At least 75% of the HBCU students believe it would be important to have
international-related internships, participate in local and foreign community service, and
participate in international or foreign language clubs. At least 80% of the HBCU student survey
respondents perceived that it is important to participate in international study trips or tours,
international forums and discussions, and international travel for holiday or pleasure reasons.
50
Positive attitudes were also noted in the reasons why students elected to participate in informal
international education academic study activities. Related to attitudes, the main reasons for
participation were interest and planning to do so before graduating.
Less positive attitudes were expressed related to the benefits of non-academic travel.
Less than half of the HBCU student respondents that have traveled abroad perceived that the
experience provided them with skills to work with other people from diverse backgrounds,
increased their foreign language skills, or would help them to secure a better job in the future.
Focus Groups
The focus groups allowed for a more in depth discussion on attitudes towards
international education experiences. A theme expressed in the focus groups was that
international education is motivating for students and provides them with a valuable learning
experience. There is also a belief that international education supports the personal development
of the students in making them more well-rounded individuals and increasing their cultural
competence. Personal development and cultural competence were identified as benefits of
international education which also indicates positive attitudes towards these types of experiences.
The last theme that represented the positive attitudes students have towards international
education is saying that it would be an enjoyable experience.
Research Question Two Review
Research question two was ―What factors impact the participation of minority
undergraduates attending HBCUs in international education activities and programs?‖ Despite
the mostly positive attitudes related to international education, the participation patterns are not
high. It is, therefore, critical to identify the obstacles students face regarding participation in
international education activities and programs. It is noteworthy that the obstacles that Comp
51
(2006) identified in his literature review as reasons for the lack of diversity in study abroad apply
to the greater realm of international education. As a reminder, Comp identified the following
factors: (1) Financial Issues, (2) Lack of Family Support and/or Needing to Remain Close to
Family, (3) Concerns about Language, (4) Concerns about Discrimination, and (5) Program Sites
not of Interest. The present survey and focus group analyses identified financial issues;
fear/safety concerns (i.e. family concerns, concerns about language, and discrimination); and
limited selection of study abroad sites. Other obstacles identified in this study include
international education experiences not applying to graduation requirements and lack of
knowledge of opportunities.
A critical finding is that the obstacles students identified are primarily organizational
factors articulated by Qiang‘s (2003) organizational framework for internationalization and
international education. The components of the organizational framework are governance,
operations, and support services. This indicates a need for the HBCUs to develop interventions
for the actual and perceived obstacles for their students in order to increase participation.
Understanding the facilitators towards participation in international education activities
also can assist in increasing participation. Outside of a pre-existing interest in these types of
activities, the primary facilitators are advertising, available courses and programs, faculty and
administrative support through identification of programs and funding, and structured on campus
international events. These are they types of activities that institutions can utilize to facilitate
participation in international activities.
52
Recommendations
Several recommendations are emergent from the study results. These recommendations
guide the future directions appropriate for minority students, especially for those enrolled in
HBCUs, to actively participate in international education.
Sustainability of Students’ Interest: The vastly positive attitudes towards international education
represent an opportunity for HBCUs. Students have expressed great interest in participating in
international education activities and programs. HBCUs must, therefore, do all they can to
sustain the level of student interest by developing appropriate programs within the means of
existing resources and acquiring additional resources, if necessary, in order to allow students to
fulfill their interest in international education.
Increasing Students’ Motivation, Awareness, and Participation: Focus group results indicate
that students have limited their definition of international education to study abroad experiences.
HBCUs must increase the motivation and awareness of various international education
opportunities among students on their campuses by organizing periodic events routinely.
Examples include international education day, international fair, student international clubs, etc,
where students can be exposed to literature, flyers, pamphlets, etc, on international education
opportunities, build partnerships with international students and have opportunities to empathize
with, admire, and understand various international cultures. Internship/community service
opportunities with local organizations that work with people from foreign countries should also
be explored and incorporated into academic programs. The motivation and participation levels
can also be boosted by developing additional recognitions, incentives, and preferences in
registration and graduation procedures to those who participate in international education and
activities for a minimum of specified hours (e.g. 150 clock hours or 9 semester hours).
53
Strengthening Study Abroad Programs: Study Abroad programs teach important intercultural
and language skills; but the true success of a program occurs within a student, when he or she
realizes that he or she can see the world from a different cultural viewpoint. This experience also
has a lasting impact in that years after students return, they continue to learn languages, continue
to foster interest in other cultures, and start to promote the importance of this experience.
However, before this stage can be reached, HBCUs must strengthen their study abroad programs
by undertaking the following three initiatives. First, more financial assistance must be obtained
from the federal government and study abroad providers. The survey data clearly shows that cost
is a major obstacle for the students who wish to participate in study abroad programs, as
evidenced by the wide gap between perception and practice. Many students attending HBCUs
depend on federal financial aid and student loans just to cover the basic college expenses (tuition,
textbooks, and dormitory fees). Consequently, participating in programs like study abroad will
remain a dream and beyond reach for many students. HBCUs themselves are not wealthy and
constantly face financial constraints just to meet the infrastructural requirements. Therefore it is
inevitable for HBCUs to engage in strong, fundraising efforts to obtain finances to fund the
international and study abroad programs. Second, HBCUs must build partnerships with all
stakeholders. Because any single HBCU cannot do it all by itself, they should from into
coalitions based on similar interests, develop partnerships with private corporations,
governmental agencies, and international organizations, not only to pool their resources, but also
to expand the program strengths (fiscal and programmatic) and make the programs more
economic and affordable. Third, HBCUs must pay more attention to the quality of study abroad
programs. Administrators and program coordinators should develop standards and continually
assess programmatic impact to ascertain that the outcomes of the study abroad programs are
54
rewarding and credit-worthy. Key performance indicators and proper monitoring techniques
must be developed and implemented for evaluation purposes. These performance evaluations, in
turn, help the HBCUs to maintain and obtain additional funding in successive years.
Increase Focus on Critical Languages: NSLI indicates that the U.S. has a need for more
citizens to be fluent in critical languages. This study found, however, that the languages most
spoken by HBCU students are Spanish and French. None of the critical languages are spoken by
more than 2% of the HBCU students. HBCUs must, therefore, expand their foreign language
departments by accommodating opportunities for students to learn critical languages. In light of
globalization, mastering critical languages will help pave the way to obtaining higher-paying
jobs in the future and better citizenship.
Increase Focus on Male Students: Multiple areas of this study found that females have
statistically significantly more positive attitudes and participation rates in international
education. This is consistent with studies that have identified males as being underrepresented in
international education (Bush & Madden, 2006). Efforts should be made at HBCUs to ensure
that they include a focus on male students to increase their participation in international
education activities.
Lessons to Learn From More Successful Campuses: HBCUs may opt to examine the
international programs that are more successful on other college/university campuses, including
those that are predominantly white to gain knowledge of the logistics, scope, and measures that
have contributed to the success of their programs. Once this knowledge is acquired, HBCUs can
customize them to meet their own needs and availability of resources. They can also use this
knowledge for partnership purposes by developing similar programs.
55
Conduct Further Research: Research can continue in multiple areas. Tribal Colleges and
Universities‘ students, for example, can be invited to complete the survey to identify attitudes
and obstacles and compare them to students at HBCUs. Given available resources, the study can
be expanded to include all minority institutions. This type of research would continue to inform
institutional leaders on what efforts can be taken to increase international education participation
among all underrepresented and underserved populations.
56
References
Adler R. K., Loughrin-Sacco, F. J., and Moffatt, R. (2005). The role of experiential learning
preparing global-ready graduates. In Impact of education abroad on career development,
volume I, M. Tillman (ed.). Stamford, CT: American Institute for Foreign Study.
Bellamy, C., and Weinberg, A. (2006). Creating global citizens through study abroad.
Connection: The Journal of the New England Board of Higher Education, 21(2), 20-21.
Black, H. T., and Duhon, D. L. (2006). Assessing the impact of business study abroad programs
on cultural awareness and personal development. Journal of Education for Business,
81(3), 140-143.
Bush, S. S., and Madden, C. (2006). Women and the global generation: Study abroad is a
vehicle for women’s empowerment and leadership. Retrieved on May 30, 2007 from
http://www.transitionsabroad.com/publications/studyabroadmagazine/2006Fall/women_a
nd_study_abroad.shtml.
Carnegie Endowment for International Peace (n.d.). Globalizaton 101: What is globalization?
Retrieved on May 22, 2007 from http://www.globalization101.org/
What_is_Globalization.html.
Comp, D. (2006, May). What we know about diversity in study abroad. Presentation to the
Academy for Educational Development Colloquium on Diversity in Education Abroad.
Retrieved on May 21, 2007 from http://www.cap-aed.org/files/D.%20Comp%20AED%
20Colloquium%20Power%20Point%205-2-06.ppt -
Davis, J. (1990a). A study of student attitudes toward language study at Historically and
Predominantly Black Institutions. Unpublished Ph.D. dissertation, University of
Maryland, College Park.
Dwyer, M. M., and Peters, C. K. (2004). The benefits of study abroad. Transitions Abroad
Magazine, 37(5).
Fels, M. D. (1993). Assumptions of African-American students about international education
exchange. ERIC Document number ED368315.
Harvey, W. B., and Anderson, E. L. (2004). Minorities in higher education: Twenty-first annual
status report 2003-2004. Washington, DC: American Council on Education.
Hobbs, F. and Stoops N. (2002). Demographic trends in the 20th
century: Census 2000 special
reports. Washington, DC: US Census Bureau.
57
Ingraham, E. C., and Peterson, D. L. (2004). Assessing the impact of study abroad on student
learning at Michigan State University. Frontiers: The interdisciplinary journal of study
abroad, 10, 83-100.
Institute of International Education [IIE] (2007). Open doors 2006. New York: Institute for
International Education.
Knight, J. (1993). Internationalization: Management strategies and issues. International
Education Magazine, 9(1), 6, 21-22.
Knight, J. (2003). Updating the definition of internationalization. International Higher
Education, 33, 2. Retrieved on May 21, 2007 from http://www.bc.edu/bc_org/avp/soe/
cihe/newsletter/ihe_pdf/ihe33.pdf.
LeBlanc, H. G. (1972). An exploratory study on the responses to students’ needs in foreign
language instruction in colleges and universities predominantly attended by Afro-
American students. (Doctoral dissertation, University of Minnesota). Dissertation
Abstracts International, 33: 5409-A.
Miller, K. C. (1953). The teaching and learning of modern foreign languages in colleges for
Negroes. Unpublished doctoral dissertation, Ohio State University.
Moore, Z. (2005). African-American students‘ opinion about foreign language study: An
exploratory study of low enrollments at the college level. Foreign Language Annals,
38(2), 191-200.
NAFSA: Association for International Education (2006). Americans call for leadership on
international education. Washington, DC: NAFSA.
NAFSA: Association for International Education (n.d.). The economic benefits of international
education to the United States for the 2004-2005 academic year: A statistical analysis.
Retrieved on May 24, 2007 from http://www.nafsa.org/_/File/_/eis2005/usa.pdf.
National Academy of Science (2007). International education and foreign languages: Keys to
securing America’s future. Washington, DC: National Academy of Science
National Association of State Universities and Land Grant Colleges [NASULGC] Task Force on
International Education (2004). A call to leadership: The presidential role in
internationalizing the university. Washington, DC: National Association of State
Universities and Land Grant Colleges.
National Center for Education Statistics (2006). Digest of education statistics: 2005. Retrieved
on April 17, 2007 from http://nces.ed.gov/programs/digest/d05/.
58
Norfles, N. (2003). Toward equal and equitable access: Obstacles and opportunities in
international education. Retrieved on May 23, 2007 from http://www.jhfc.duke.edu/
ducis/globalchallenges/pdf/norfles_abstract.pdf.
Nyabongo, V. S. (1946). Modern foreign language study in Negro colleges. French Review,
20:153-58.
Office of Management and Budget [OMB] (n.d.). Budget of the United States government:
Fiscal year 2008. Retrieved on May 25, 2007 from http://www.whitehouse.gov/omb/
budget/fy2008/.
Provasnik, S., Shafer, L. L., and Snyder, T. D. (2004). Historically black colleges and
universities, 1976-2001. Washington, DC: National Center for Education Statistics.
Qiang, Z. (2003). Internationalization of higher education: Towards a conceptual framework.
Policy Futures in Education, 1(2), 248-270.
Rivers, W. N. (1933). A study of modern foreign languages in thirty Negro colleges. Journal of
Negro Education 2: 437-493.
Scholte, J. A. (2005) Globalization: A critical introduction, 2nd
ed. New York: Palgrave
Macmillan.
Schoorman, D. (2000). How is internationalization implemented? A framework for
organizational practice. ED 444 426.
Siaya, L., Porcelli, M., and Green, M. (2002). One year later: Attitudes about international
education since September 11. Washington, DC: American Council on Education.
Siaya, L., and Hayward, F. M. (2003). Mapping internationalization on U. S. campuses.
Washington, DC: American Council on Education.
Siaya, L. M. and Hayward, F. M. (2001). A report on two national surveys about international
education. Washington, DC: American Council on Education.
Stewart, V. (2007). Becoming citizens of the world. Educational Leadership, 64(7), 8-14.
The World Bank (n.d.) Assessing globalization. Retrieved on May 20, 2007 from
http://www1.worldbank.org/economicpolicy/globalization/documents/
AssessingGlobalizationP1.pdf.
U.S. Census Bureau. (2004). Exports from manufacturing establishments: 2001 (p. 8).
Washington, DC: U.S. Department of Commerce.
59
U.S. Department of State (n.d.). U. S. university presidents summit on international education.
Retrieved on May 20, 2007 from http://exchanges.state.gov/universitysummit/.
Wanasek, B. (2005). International service learning: Impact on career choices. In Impact of
education abroad on career development, volume I M. Tillman (ed.). Stamford, CT:
American Institute for Foreign Study.
Welles, E. (2004). Foreign language enrollments in United States institutions of higher
education, fall 2002. ADFL Bulletin, 35(2-3), 7-24.
White House Initiative on Historically Black Colleges and Universities (n.d.) List of HBCUs.
Retrieved on January 27, 2007 from http://www.ed.gov/about/inits/list/whhbcu/edlite-
list.html.
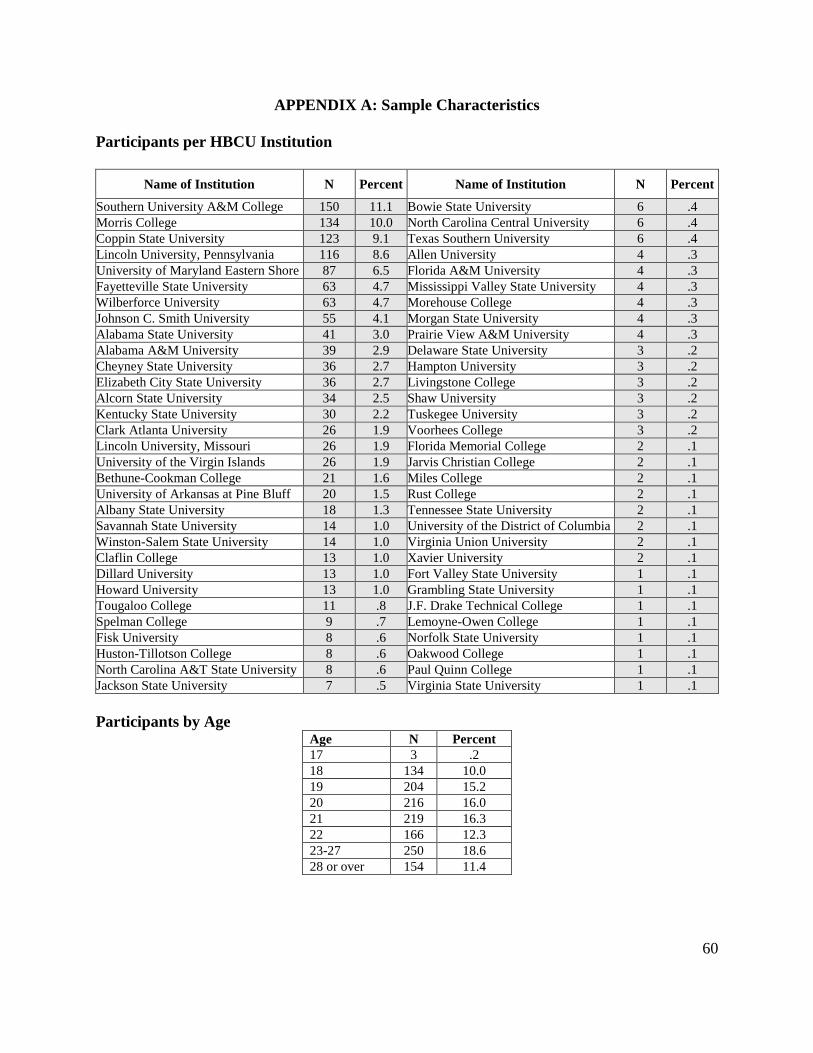
60
APPENDIX A: Sample Characteristics
Participants per HBCU Institution
Name of Institution N Percent Name of Institution N Percent
Southern University A&M College 150 11.1 Bowie State University 6 .4
Morris College 134 10.0 North Carolina Central University 6 .4
Coppin State University 123 9.1 Texas Southern University 6 .4
Lincoln University, Pennsylvania 116 8.6 Allen University 4 .3
University of Maryland Eastern Shore 87 6.5 Florida A&M University 4 .3
Fayetteville State University 63 4.7 Mississippi Valley State University 4 .3
Wilberforce University 63 4.7 Morehouse College 4 .3
Johnson C. Smith University 55 4.1 Morgan State University 4 .3
Alabama State University 41 3.0 Prairie View A&M University 4 .3
Alabama A&M University 39 2.9 Delaware State University 3 .2
Cheyney State University 36 2.7 Hampton University 3 .2
Elizabeth City State University 36 2.7 Livingstone College 3 .2
Alcorn State University 34 2.5 Shaw University 3 .2
Kentucky State University 30 2.2 Tuskegee University 3 .2
Clark Atlanta University 26 1.9 Voorhees College 3 .2
Lincoln University, Missouri 26 1.9 Florida Memorial College 2 .1
University of the Virgin Islands 26 1.9 Jarvis Christian College 2 .1
Bethune-Cookman College 21 1.6 Miles College 2 .1
University of Arkansas at Pine Bluff 20 1.5 Rust College 2 .1
Albany State University 18 1.3 Tennessee State University 2 .1
Savannah State University 14 1.0 University of the District of Columbia 2 .1
Winston-Salem State University 14 1.0 Virginia Union University 2 .1
Claflin College 13 1.0 Xavier University 2 .1
Dillard University 13 1.0 Fort Valley State University 1 .1
Howard University 13 1.0 Grambling State University 1 .1
Tougaloo College 11 .8 J.F. Drake Technical College 1 .1
Spelman College 9 .7 Lemoyne-Owen College 1 .1
Fisk University 8 .6 Norfolk State University 1 .1
Huston-Tillotson College 8 .6 Oakwood College 1 .1
North Carolina A&T State University 8 .6 Paul Quinn College 1 .1
Jackson State University 7 .5 Virginia State University 1 .1
Participants by Age Age N Percent
17 3 .2
18 134 10.0
19 204 15.2
20 216 16.0
21 219 16.3
22 166 12.3
23-27 250 18.6
28 or over 154 11.4
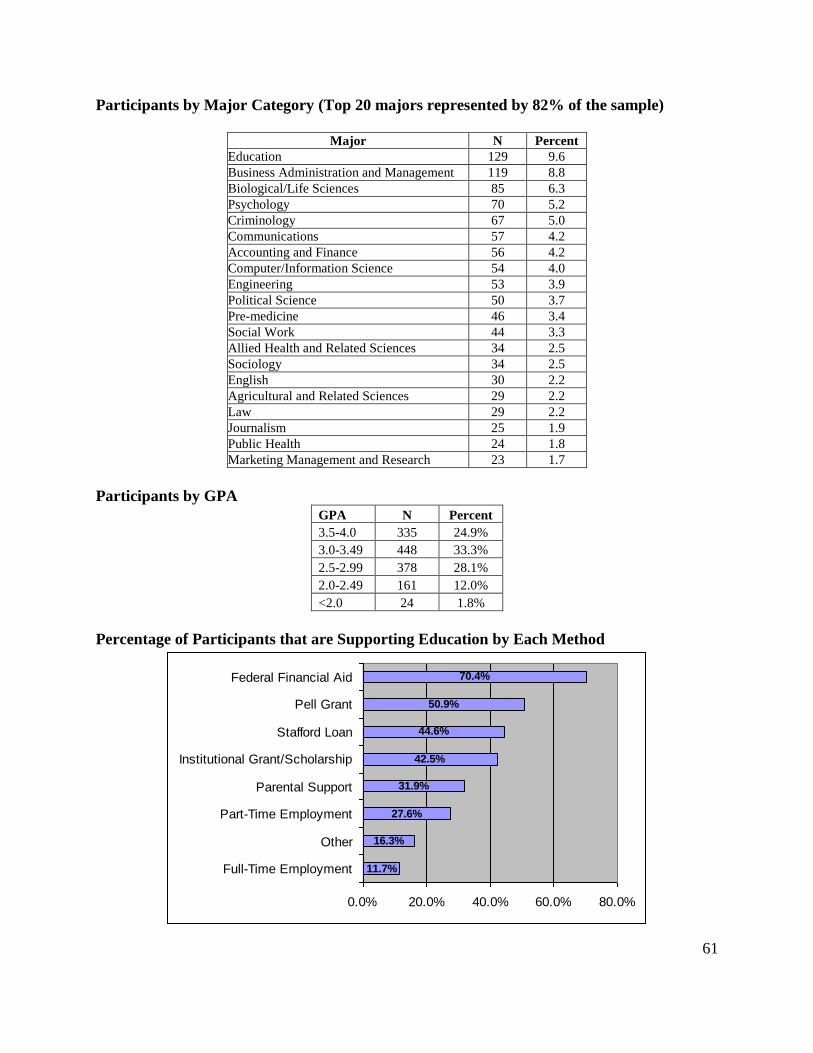
61
Participants by Major Category (Top 20 majors represented by 82% of the sample)
Major N Percent
Education 129 9.6
Business Administration and Management 119 8.8
Biological/Life Sciences 85 6.3
Psychology 70 5.2
Criminology 67 5.0
Communications 57 4.2
Accounting and Finance 56 4.2
Computer/Information Science 54 4.0
Engineering 53 3.9
Political Science 50 3.7
Pre-medicine 46 3.4
Social Work 44 3.3
Allied Health and Related Sciences 34 2.5
Sociology 34 2.5
English 30 2.2
Agricultural and Related Sciences 29 2.2
Law 29 2.2
Journalism 25 1.9
Public Health 24 1.8
Marketing Management and Research 23 1.7
Participants by GPA
GPA N Percent
3.5-4.0 335 24.9%
3.0-3.49 448 33.3%
2.5-2.99 378 28.1%
2.0-2.49 161 12.0%
<2.0 24 1.8%
Percentage of Participants that are Supporting Education by Each Method
11.7%
16.3%
27.6%
31.9%
42.5%
44.6%
50.9%
70.4%
0.0% 20.0% 40.0% 60.0% 80.0%
Full-Time Employment
Other
Part-Time Employment
Parental Support
Institutional Grant/Scholarship
Stafford Loan
Pell Grant
Federal Financial Aid

62
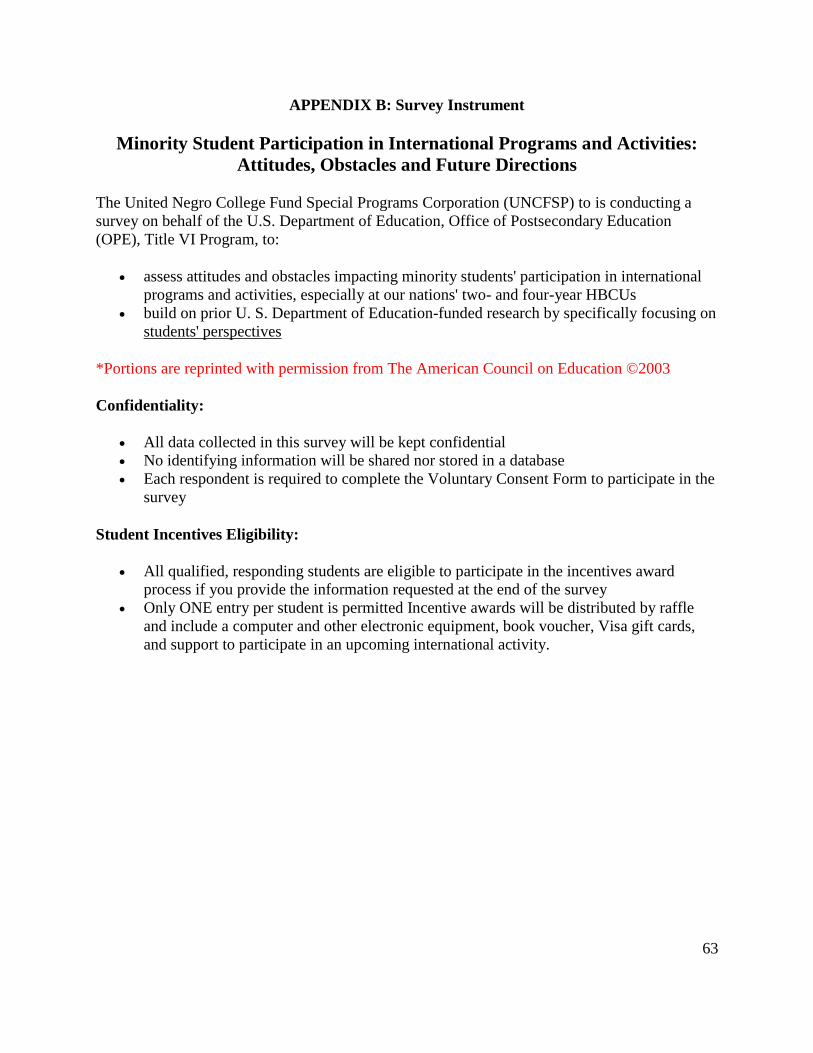
63
APPENDIX B: Survey Instrument
Minority Student Participation in International Programs and Activities:
Attitudes, Obstacles and Future Directions
The United Negro College Fund Special Programs Corporation (UNCFSP) to is conducting a
survey on behalf of the U.S. Department of Education, Office of Postsecondary Education
(OPE), Title VI Program, to:
assess attitudes and obstacles impacting minority students' participation in international
programs and activities, especially at our nations' two- and four-year HBCUs
build on prior U. S. Department of Education-funded research by specifically focusing on
students' perspectives
*Portions are reprinted with permission from The American Council on Education ©2003
Confidentiality:
All data collected in this survey will be kept confidential
No identifying information will be shared nor stored in a database
Each respondent is required to complete the Voluntary Consent Form to participate in the
survey
Student Incentives Eligibility:
All qualified, responding students are eligible to participate in the incentives award
process if you provide the information requested at the end of the survey
Only ONE entry per student is permitted Incentive awards will be distributed by raffle
and include a computer and other electronic equipment, book voucher, Visa gift cards,
and support to participate in an upcoming international activity.
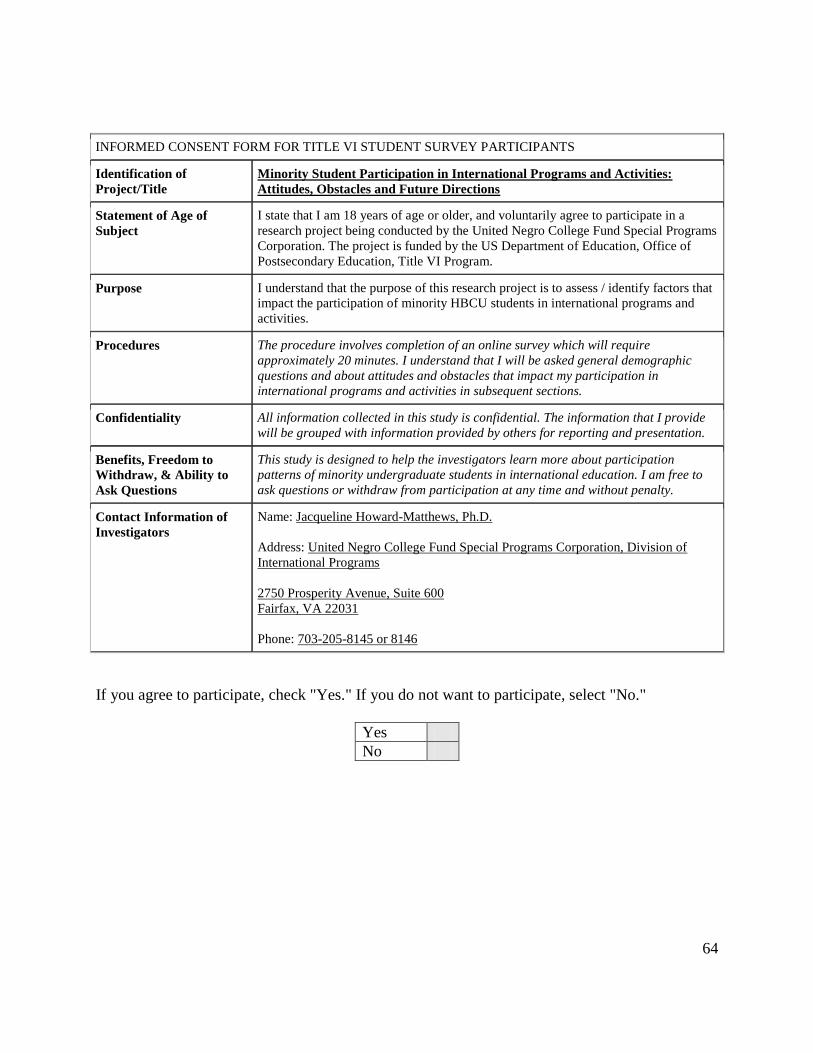
64
INFORMED CONSENT FORM FOR TITLE VI STUDENT SURVEY PARTICIPANTS
Identification of
Project/Title
Minority Student Participation in International Programs and Activities:
Attitudes, Obstacles and Future Directions
Statement of Age of
Subject
I state that I am 18 years of age or older, and voluntarily agree to participate in a
research project being conducted by the United Negro College Fund Special Programs
Corporation. The project is funded by the US Department of Education, Office of
Postsecondary Education, Title VI Program.
Purpose
I understand that the purpose of this research project is to assess / identify factors that
impact the participation of minority HBCU students in international programs and
activities.
Procedures
The procedure involves completion of an online survey which will require
approximately 20 minutes. I understand that I will be asked general demographic
questions and about attitudes and obstacles that impact my participation in
international programs and activities in subsequent sections.
Confidentiality
All information collected in this study is confidential. The information that I provide
will be grouped with information provided by others for reporting and presentation.
Benefits, Freedom to
Withdraw, & Ability to
Ask Questions
This study is designed to help the investigators learn more about participation
patterns of minority undergraduate students in international education. I am free to
ask questions or withdraw from participation at any time and without penalty.
Contact Information of
Investigators
Name: Jacqueline Howard-Matthews, Ph.D.
Address: United Negro College Fund Special Programs Corporation, Division of
International Programs
2750 Prosperity Avenue, Suite 600
Fairfax, VA 22031
Phone: 703-205-8145 or 8146
If you agree to participate, check "Yes." If you do not want to participate, select "No."
Yes
No
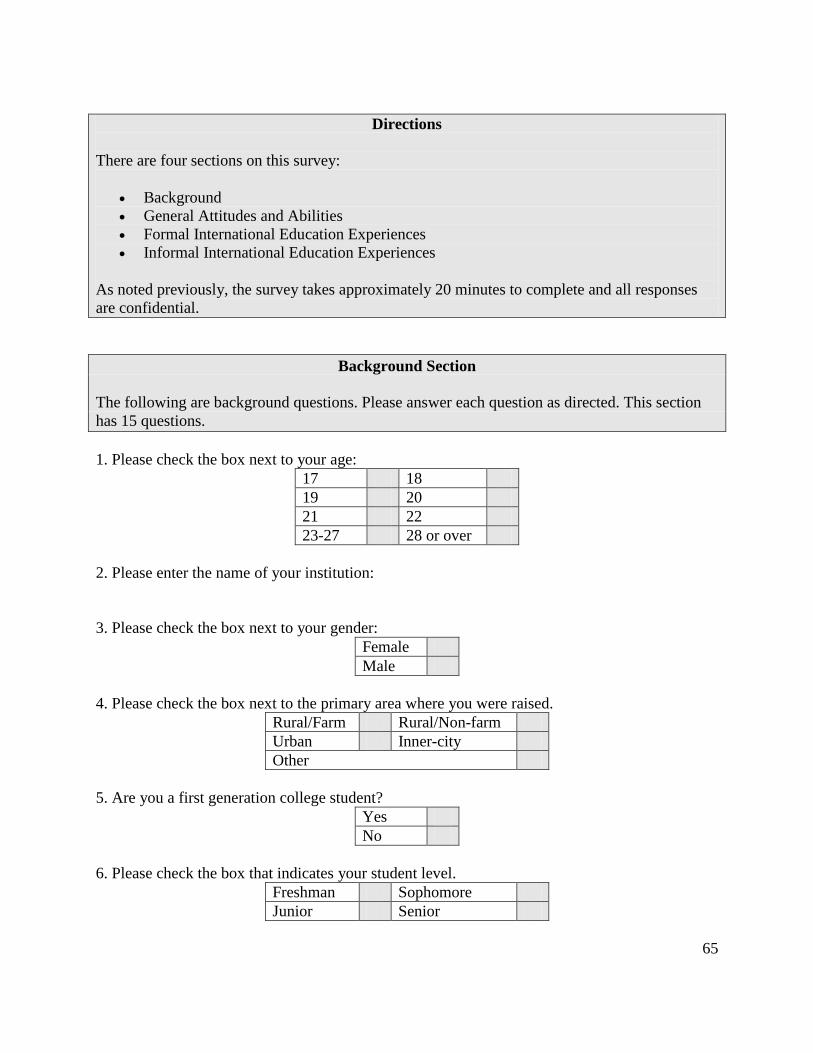
65
Directions
There are four sections on this survey:
Background
General Attitudes and Abilities
Formal International Education Experiences
Informal International Education Experiences
As noted previously, the survey takes approximately 20 minutes to complete and all responses
are confidential.
Background Section
The following are background questions. Please answer each question as directed. This section
has 15 questions.
1. Please check the box next to your age:
17 18
19 20
21 22
23-27 28 or over
2. Please enter the name of your institution:
3. Please check the box next to your gender:
Female
Male
4. Please check the box next to the primary area where you were raised.
Rural/Farm Rural/Non-farm
Urban Inner-city
Other
5. Are you a first generation college student?
Yes
No
6. Please check the box that indicates your student level.
Freshman Sophomore
Junior Senior
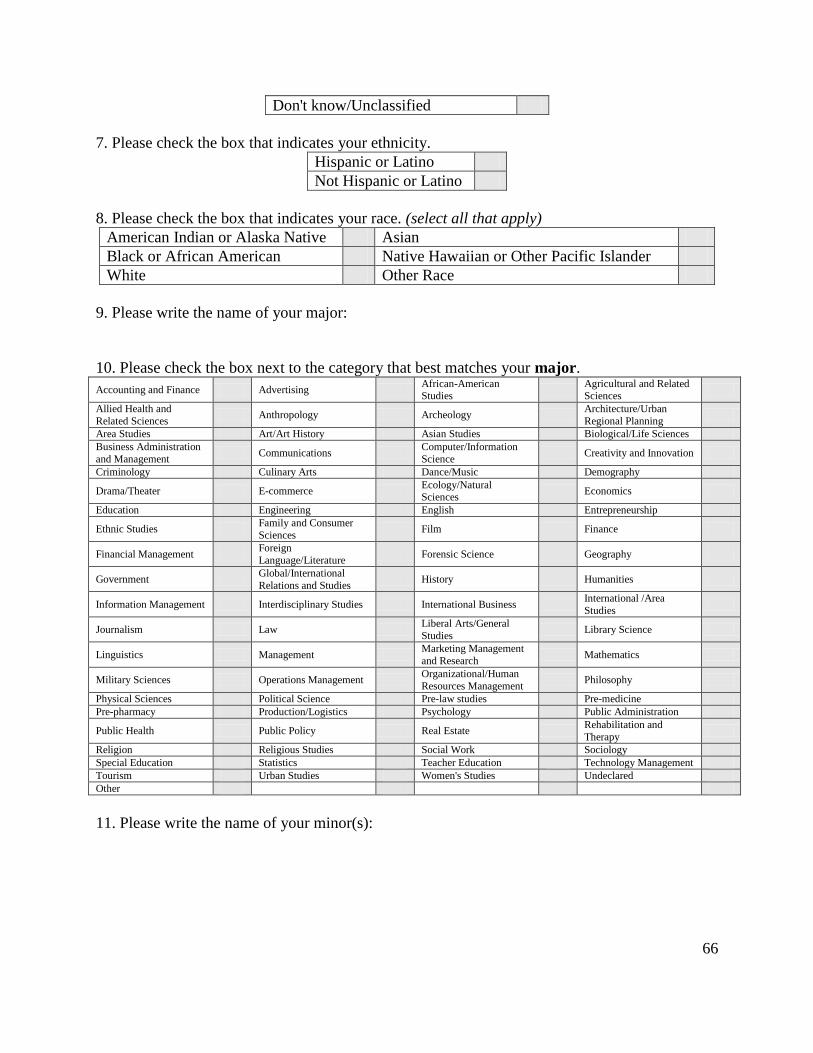
66
Don't know/Unclassified
7. Please check the box that indicates your ethnicity.
Hispanic or Latino
Not Hispanic or Latino
8. Please check the box that indicates your race. (select all that apply)
American Indian or Alaska Native Asian
Black or African American Native Hawaiian or Other Pacific Islander
White Other Race
9. Please write the name of your major:
10. Please check the box next to the category that best matches your major.
Accounting and Finance Advertising African-American Studies
Agricultural and Related Sciences
Allied Health and
Related Sciences Anthropology Archeology
Architecture/Urban
Regional Planning
Area Studies Art/Art History Asian Studies Biological/Life Sciences
Business Administration
and Management Communications
Computer/Information
Science Creativity and Innovation
Criminology Culinary Arts Dance/Music Demography
Drama/Theater E-commerce Ecology/Natural Sciences
Economics
Education Engineering English Entrepreneurship
Ethnic Studies Family and Consumer
Sciences Film Finance
Financial Management Foreign
Language/Literature Forensic Science Geography
Government Global/International
Relations and Studies History Humanities
Information Management Interdisciplinary Studies International Business International /Area
Studies
Journalism Law Liberal Arts/General
Studies Library Science
Linguistics Management Marketing Management
and Research Mathematics
Military Sciences Operations Management Organizational/Human
Resources Management Philosophy
Physical Sciences Political Science Pre-law studies Pre-medicine
Pre-pharmacy Production/Logistics Psychology Public Administration
Public Health Public Policy Real Estate Rehabilitation and
Therapy
Religion Religious Studies Social Work Sociology
Special Education Statistics Teacher Education Technology Management
Tourism Urban Studies Women's Studies Undeclared
Other
11. Please write the name of your minor(s):
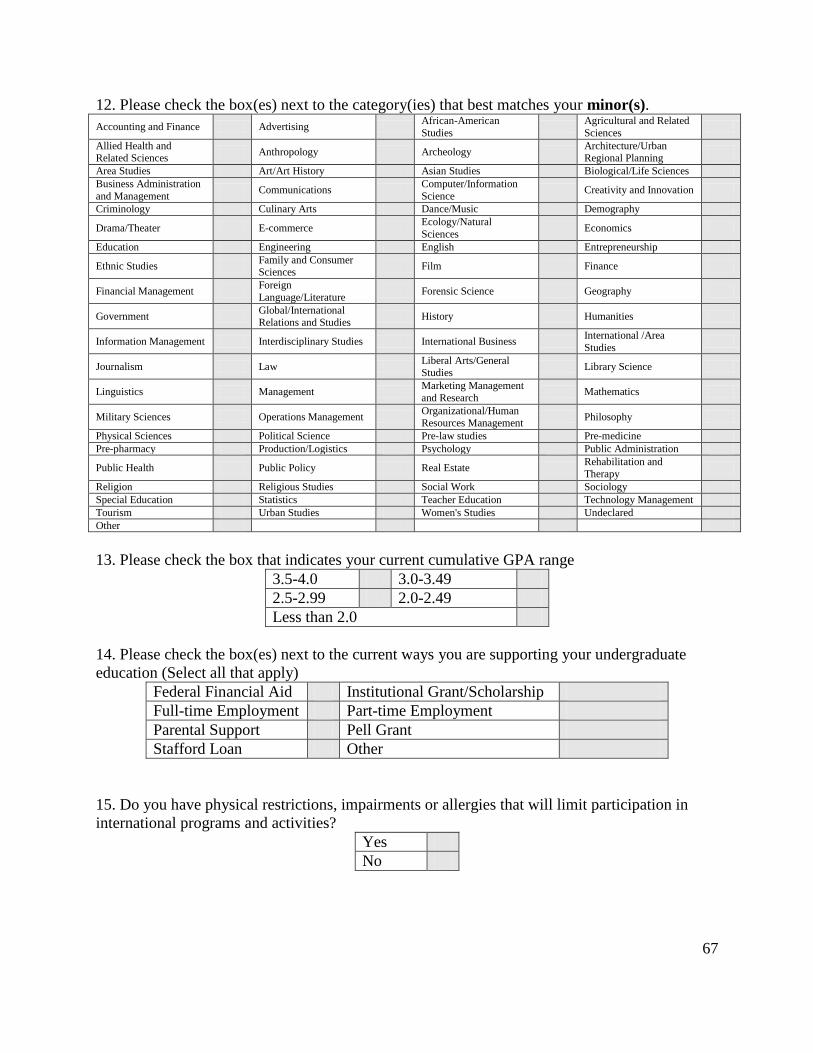
67
12. Please check the box(es) next to the category(ies) that best matches your minor(s).
Accounting and Finance Advertising African-American
Studies
Agricultural and Related
Sciences
Allied Health and Related Sciences
Anthropology Archeology Architecture/Urban Regional Planning
Area Studies Art/Art History Asian Studies Biological/Life Sciences
Business Administration
and Management Communications
Computer/Information
Science Creativity and Innovation
Criminology Culinary Arts Dance/Music Demography
Drama/Theater E-commerce Ecology/Natural
Sciences Economics
Education Engineering English Entrepreneurship
Ethnic Studies Family and Consumer Sciences
Film Finance
Financial Management Foreign
Language/Literature Forensic Science Geography
Government Global/International Relations and Studies
History Humanities
Information Management Interdisciplinary Studies International Business International /Area
Studies
Journalism Law Liberal Arts/General Studies
Library Science
Linguistics Management Marketing Management
and Research Mathematics
Military Sciences Operations Management Organizational/Human Resources Management
Philosophy
Physical Sciences Political Science Pre-law studies Pre-medicine
Pre-pharmacy Production/Logistics Psychology Public Administration
Public Health Public Policy Real Estate Rehabilitation and
Therapy
Religion Religious Studies Social Work Sociology
Special Education Statistics Teacher Education Technology Management
Tourism Urban Studies Women's Studies Undeclared
Other
13. Please check the box that indicates your current cumulative GPA range
3.5-4.0 3.0-3.49
2.5-2.99 2.0-2.49
Less than 2.0
14. Please check the box(es) next to the current ways you are supporting your undergraduate
education (Select all that apply)
Federal Financial Aid Institutional Grant/Scholarship
Full-time Employment Part-time Employment
Parental Support Pell Grant
Stafford Loan Other
15. Do you have physical restrictions, impairments or allergies that will limit participation in
international programs and activities?
Yes
No
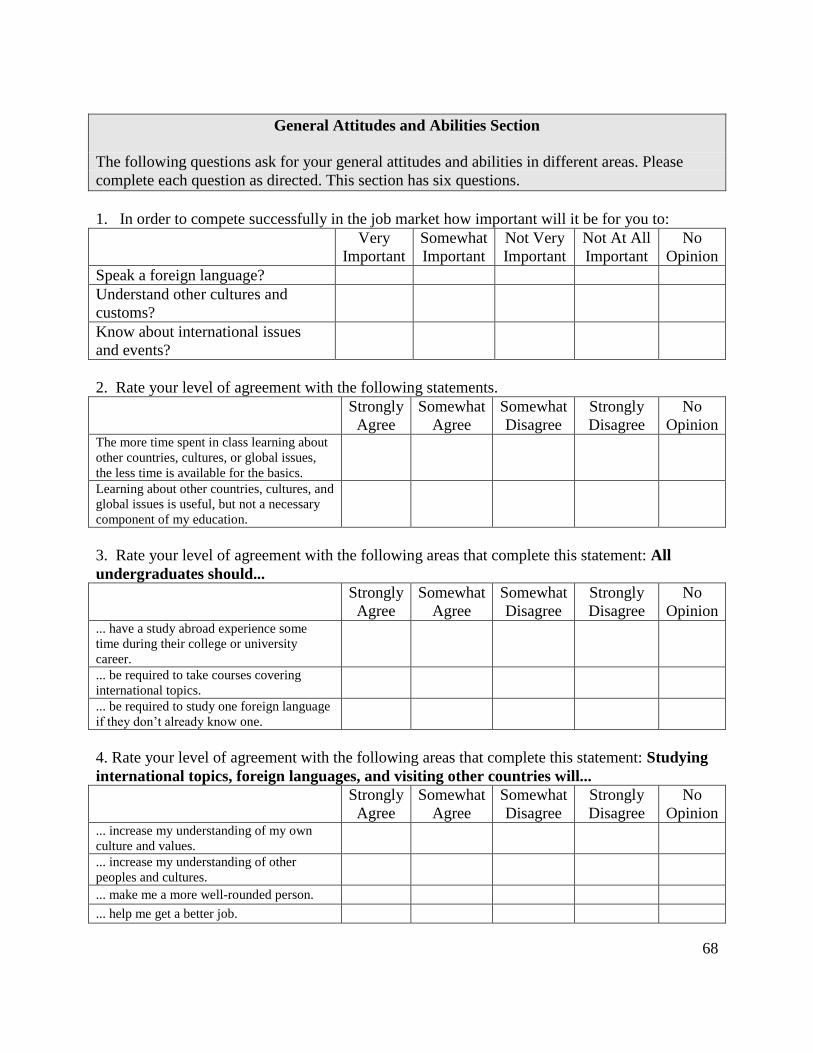
68
General Attitudes and Abilities Section
The following questions ask for your general attitudes and abilities in different areas. Please
complete each question as directed. This section has six questions.
1. In order to compete successfully in the job market how important will it be for you to:
Very
Important
Somewhat
Important
Not Very
Important
Not At All
Important
No
Opinion
Speak a foreign language?
Understand other cultures and
customs?
Know about international issues
and events?
2. Rate your level of agreement with the following statements.
Strongly
Agree
Somewhat
Agree
Somewhat
Disagree
Strongly
Disagree
No
Opinion The more time spent in class learning about
other countries, cultures, or global issues,
the less time is available for the basics.
Learning about other countries, cultures, and
global issues is useful, but not a necessary
component of my education.
3. Rate your level of agreement with the following areas that complete this statement: All
undergraduates should...
Strongly
Agree
Somewhat
Agree
Somewhat
Disagree
Strongly
Disagree
No
Opinion ... have a study abroad experience some
time during their college or university
career.
... be required to take courses covering
international topics.
... be required to study one foreign language
if they don‘t already know one.
4. Rate your level of agreement with the following areas that complete this statement: Studying
international topics, foreign languages, and visiting other countries will...
Strongly
Agree
Somewhat
Agree
Somewhat
Disagree
Strongly
Disagree
No
Opinion ... increase my understanding of my own
culture and values.
... increase my understanding of other
peoples and cultures.
... make me a more well-rounded person.
... help me get a better job.
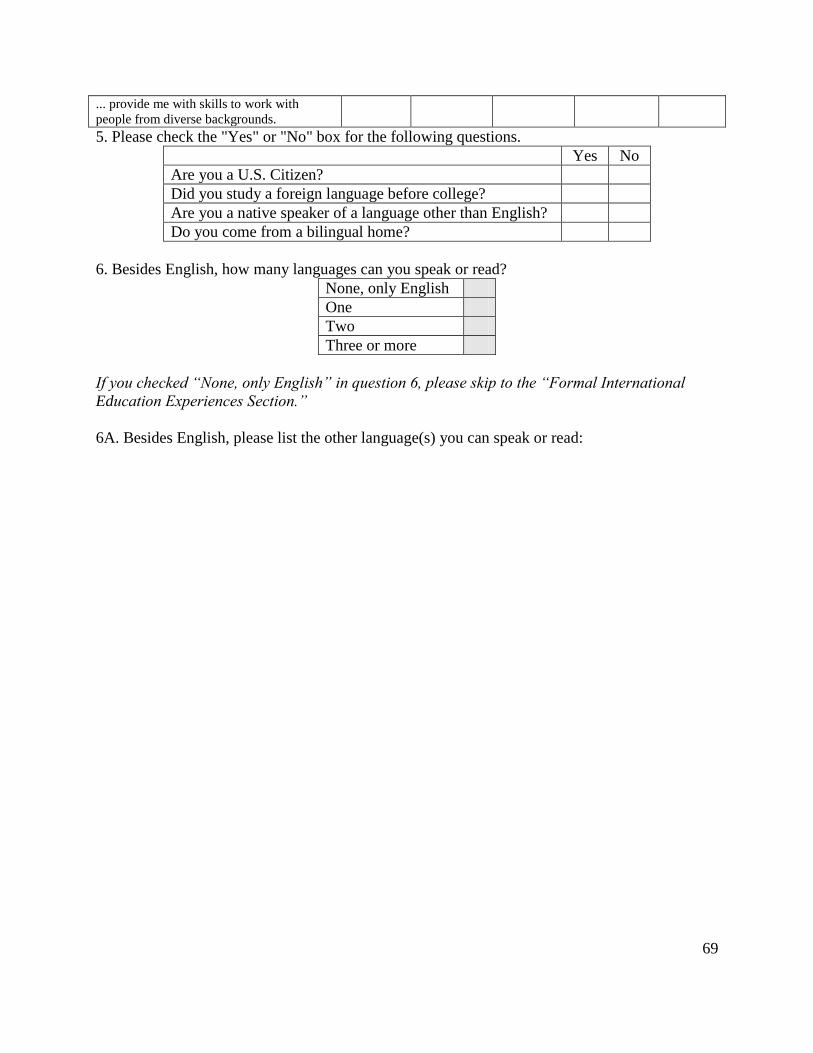
69
... provide me with skills to work with
people from diverse backgrounds.
5. Please check the "Yes" or "No" box for the following questions.
Yes No
Are you a U.S. Citizen?
Did you study a foreign language before college?
Are you a native speaker of a language other than English?
Do you come from a bilingual home?
6. Besides English, how many languages can you speak or read?
None, only English
One
Two
Three or more
If you checked “None, only English” in question 6, please skip to the “Formal International
Education Experiences Section.”
6A. Besides English, please list the other language(s) you can speak or read:
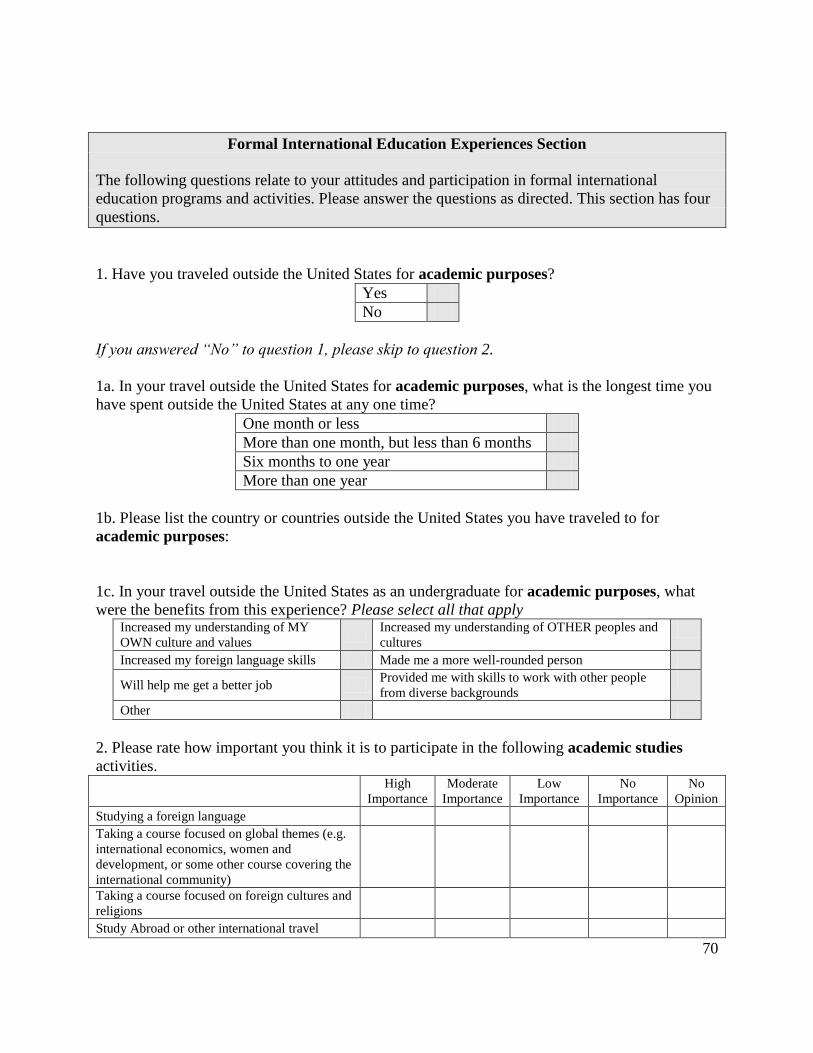
70
Formal International Education Experiences Section
The following questions relate to your attitudes and participation in formal international
education programs and activities. Please answer the questions as directed. This section has four
questions.
1. Have you traveled outside the United States for academic purposes?
Yes
No
If you answered “No” to question 1, please skip to question 2.
1a. In your travel outside the United States for academic purposes, what is the longest time you
have spent outside the United States at any one time?
One month or less
More than one month, but less than 6 months
Six months to one year
More than one year
1b. Please list the country or countries outside the United States you have traveled to for
academic purposes:
1c. In your travel outside the United States as an undergraduate for academic purposes, what
were the benefits from this experience? Please select all that apply Increased my understanding of MY
OWN culture and values
Increased my understanding of OTHER peoples and
cultures
Increased my foreign language skills Made me a more well-rounded person
Will help me get a better job Provided me with skills to work with other people
from diverse backgrounds
Other
2. Please rate how important you think it is to participate in the following academic studies
activities.
High
Importance
Moderate
Importance
Low
Importance
No
Importance
No
Opinion
Studying a foreign language Taking a course focused on global themes (e.g.
international economics, women and
development, or some other course covering the
international community)
Taking a course focused on foreign cultures and
religions
Study Abroad or other international travel
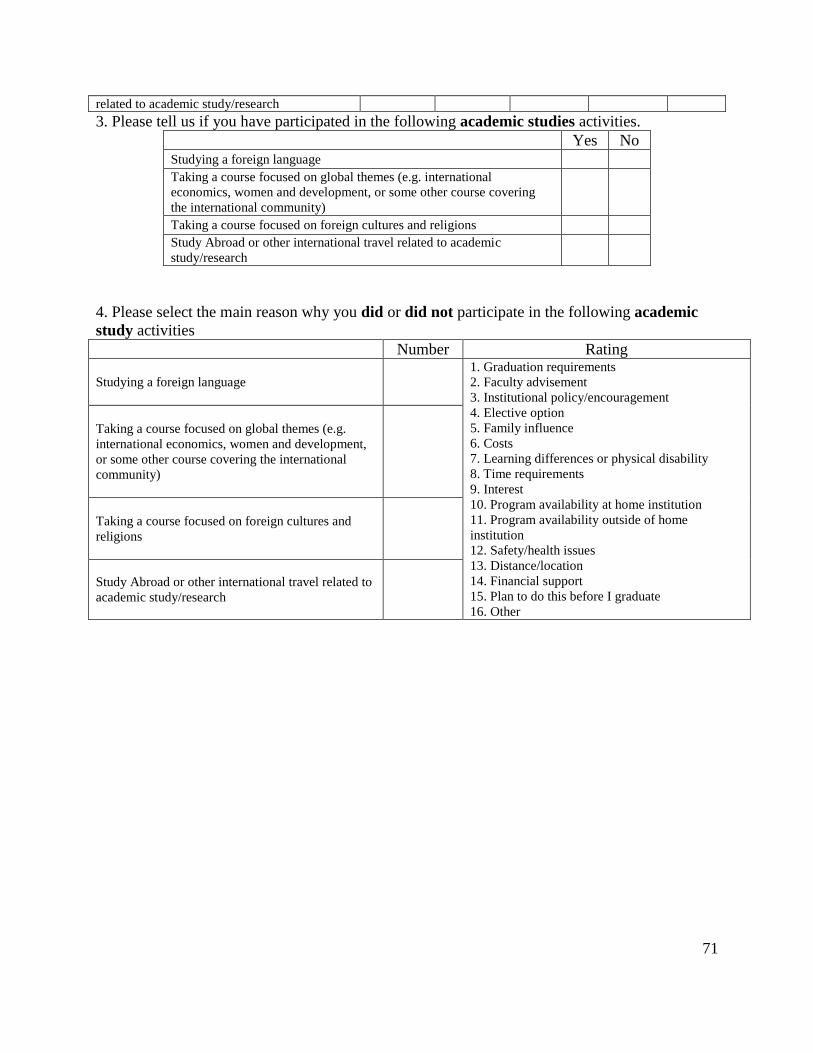
71
related to academic study/research
3. Please tell us if you have participated in the following academic studies activities.
Yes No
Studying a foreign language Taking a course focused on global themes (e.g. international
economics, women and development, or some other course covering
the international community)
Taking a course focused on foreign cultures and religions Study Abroad or other international travel related to academic
study/research
4. Please select the main reason why you did or did not participate in the following academic
study activities
Number Rating
Studying a foreign language
1. Graduation requirements
2. Faculty advisement
3. Institutional policy/encouragement
4. Elective option
5. Family influence
6. Costs
7. Learning differences or physical disability
8. Time requirements
9. Interest
10. Program availability at home institution
11. Program availability outside of home
institution
12. Safety/health issues
13. Distance/location
14. Financial support
15. Plan to do this before I graduate
16. Other
Taking a course focused on global themes (e.g.
international economics, women and development,
or some other course covering the international
community)
Taking a course focused on foreign cultures and
religions
Study Abroad or other international travel related to
academic study/research
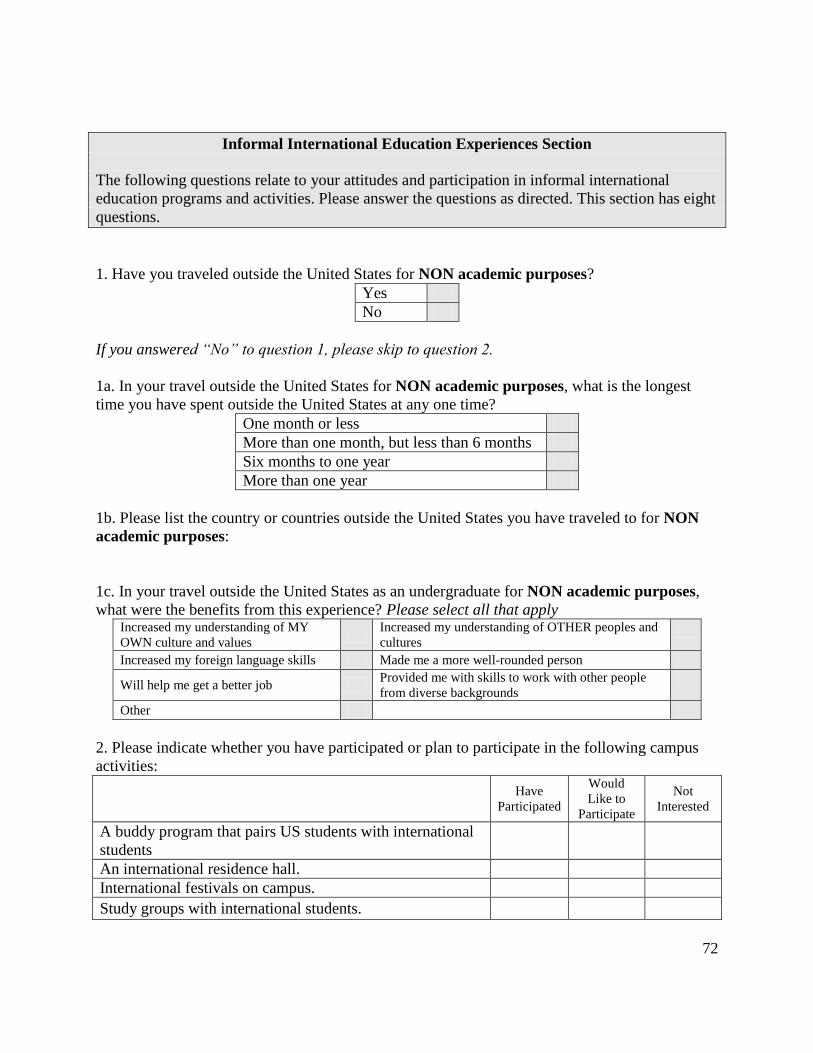
72
Informal International Education Experiences Section
The following questions relate to your attitudes and participation in informal international
education programs and activities. Please answer the questions as directed. This section has eight
questions.
1. Have you traveled outside the United States for NON academic purposes?
Yes
No
If you answered “No” to question 1, please skip to question 2.
1a. In your travel outside the United States for NON academic purposes, what is the longest
time you have spent outside the United States at any one time?
One month or less
More than one month, but less than 6 months
Six months to one year
More than one year
1b. Please list the country or countries outside the United States you have traveled to for NON
academic purposes:
1c. In your travel outside the United States as an undergraduate for NON academic purposes,
what were the benefits from this experience? Please select all that apply Increased my understanding of MY
OWN culture and values
Increased my understanding of OTHER peoples and
cultures
Increased my foreign language skills Made me a more well-rounded person
Will help me get a better job Provided me with skills to work with other people
from diverse backgrounds
Other
2. Please indicate whether you have participated or plan to participate in the following campus
activities:
Have
Participated
Would
Like to
Participate
Not
Interested
A buddy program that pairs US students with international
students
An international residence hall.
International festivals on campus.
Study groups with international students.
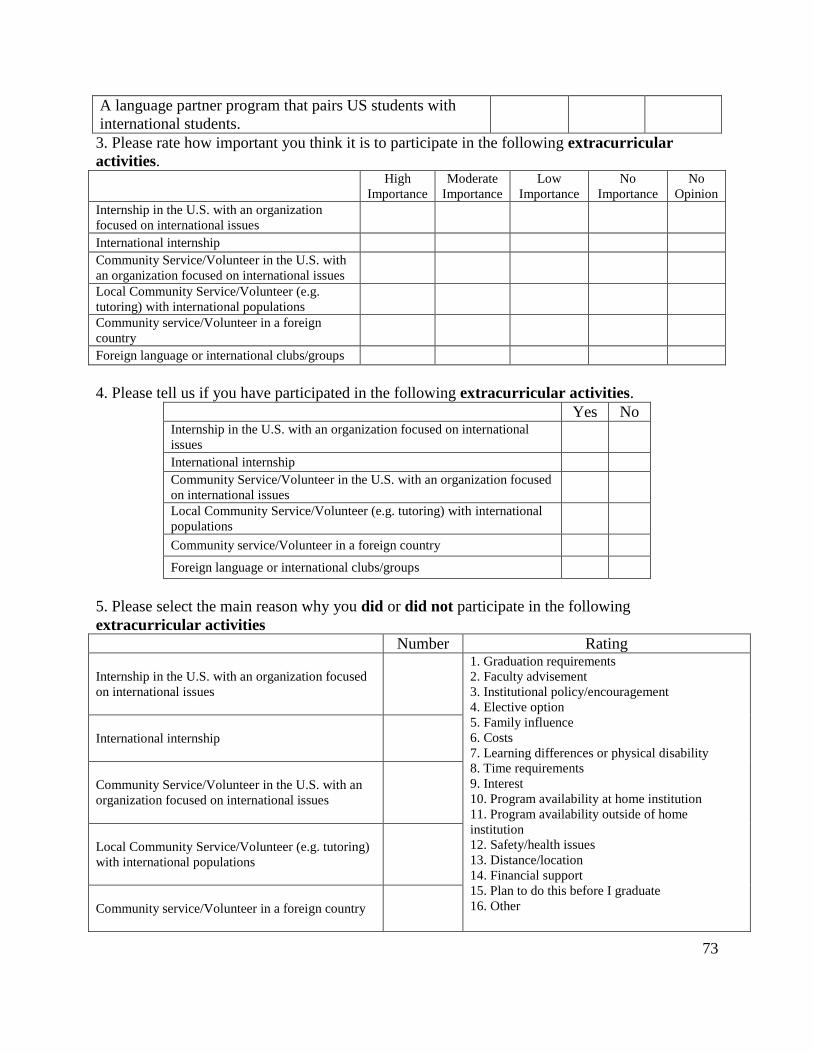
73
A language partner program that pairs US students with
international students.
3. Please rate how important you think it is to participate in the following extracurricular
activities.
High
Importance
Moderate
Importance
Low
Importance
No
Importance
No
Opinion
Internship in the U.S. with an organization
focused on international issues
International internship Community Service/Volunteer in the U.S. with
an organization focused on international issues
Local Community Service/Volunteer (e.g.
tutoring) with international populations
Community service/Volunteer in a foreign
country
Foreign language or international clubs/groups
4. Please tell us if you have participated in the following extracurricular activities.
Yes No Internship in the U.S. with an organization focused on international
issues
International internship Community Service/Volunteer in the U.S. with an organization focused
on international issues
Local Community Service/Volunteer (e.g. tutoring) with international
populations
Community service/Volunteer in a foreign country
Foreign language or international clubs/groups
5. Please select the main reason why you did or did not participate in the following
extracurricular activities
Number Rating
Internship in the U.S. with an organization focused
on international issues
1. Graduation requirements
2. Faculty advisement
3. Institutional policy/encouragement
4. Elective option
5. Family influence
6. Costs
7. Learning differences or physical disability
8. Time requirements
9. Interest
10. Program availability at home institution
11. Program availability outside of home
institution
12. Safety/health issues
13. Distance/location
14. Financial support
15. Plan to do this before I graduate
16. Other
International internship
Community Service/Volunteer in the U.S. with an
organization focused on international issues
Local Community Service/Volunteer (e.g. tutoring)
with international populations
Community service/Volunteer in a foreign country

74
Foreign language or international clubs/groups
6. Please rate how important you think it is to participate in these other international activities.
High
Importance
Moderate
Importance
Low
Importance
No
Importance
No
Opinion
International study trips or tours
Panel discussions, workshops,
conferences related to international
issues
International travel for holiday or other
pleasure related reasons
7. Please tell us if you have participated in these other international activities.
Yes No
International study trips or tours
Panel discussions, workshops, conferences related to
international issues
International travel for holiday or other pleasure related
reasons
8. Please select the main reason why you did or did not participate in the following other
activities
Number Rating
International study trips or tours
1. Graduation requirements
2. Faculty advisement
3. Institutional policy/encouragement
4. Elective option
5. Family influence
6. Costs
7. Learning differences or physical disability
8. Time requirements
9. Interest
10. Program availability at home institution
11. Program availability outside of home
institution
12. Safety/health issues
13. Distance/location
14. Financial support
15. Plan to do this before I graduate
16. Other
Panel discussions, workshops, conferences
related to international issues
International travel for holiday or other
pleasure related reasons
75
To be eligible for the student incentives award process, please enter the following information:
First Name:
Last Name:
Permanent Address:
Phone Number:
Email Address:
On behalf of the United Negro College Fund Special Programs Corporation, Title VI-funded
project and the U.S. Department of Education, we thank you for completing this survey of
student attitudes and obstacles to participation in international education programs and activities.
Incentives for Eligible Student Respondents All eligible student respondents are qualified to
win through a raffle drawing:
Computer or other electronic equipment
Book Voucher
Visa gift cards
Support awards to participate in an approved international program or activity
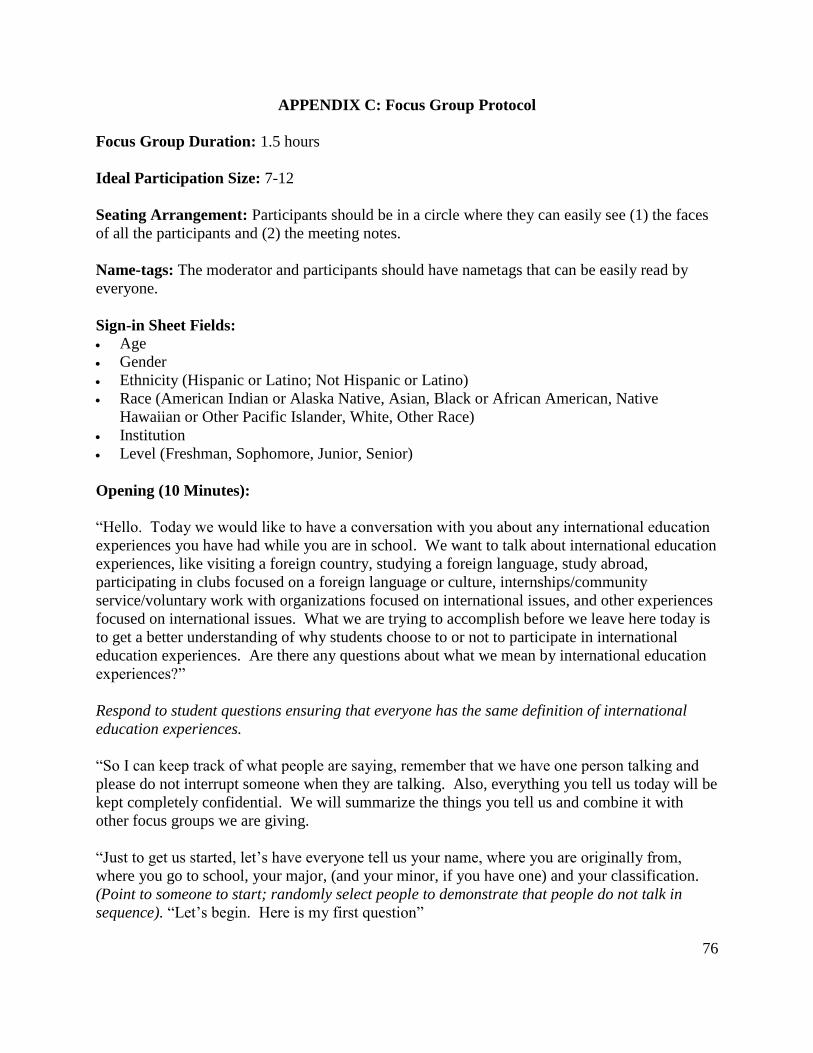
76
APPENDIX C: Focus Group Protocol
Focus Group Duration: 1.5 hours
Ideal Participation Size: 7-12
Seating Arrangement: Participants should be in a circle where they can easily see (1) the faces
of all the participants and (2) the meeting notes.
Name-tags: The moderator and participants should have nametags that can be easily read by
everyone.
Sign-in Sheet Fields:
Age
Gender
Ethnicity (Hispanic or Latino; Not Hispanic or Latino)
Race (American Indian or Alaska Native, Asian, Black or African American, Native
Hawaiian or Other Pacific Islander, White, Other Race)
Institution
Level (Freshman, Sophomore, Junior, Senior)
Opening (10 Minutes):
―Hello. Today we would like to have a conversation with you about any international education
experiences you have had while you are in school. We want to talk about international education
experiences, like visiting a foreign country, studying a foreign language, study abroad,
participating in clubs focused on a foreign language or culture, internships/community
service/voluntary work with organizations focused on international issues, and other experiences
focused on international issues. What we are trying to accomplish before we leave here today is
to get a better understanding of why students choose to or not to participate in international
education experiences. Are there any questions about what we mean by international education
experiences?‖
Respond to student questions ensuring that everyone has the same definition of international
education experiences.
―So I can keep track of what people are saying, remember that we have one person talking and
please do not interrupt someone when they are talking. Also, everything you tell us today will be
kept completely confidential. We will summarize the things you tell us and combine it with
other focus groups we are giving.
―Just to get us started, let‘s have everyone tell us your name, where you are originally from,
where you go to school, your major, (and your minor, if you have one) and your classification.
(Point to someone to start; randomly select people to demonstrate that people do not talk in
sequence). ―Let‘s begin. Here is my first question‖
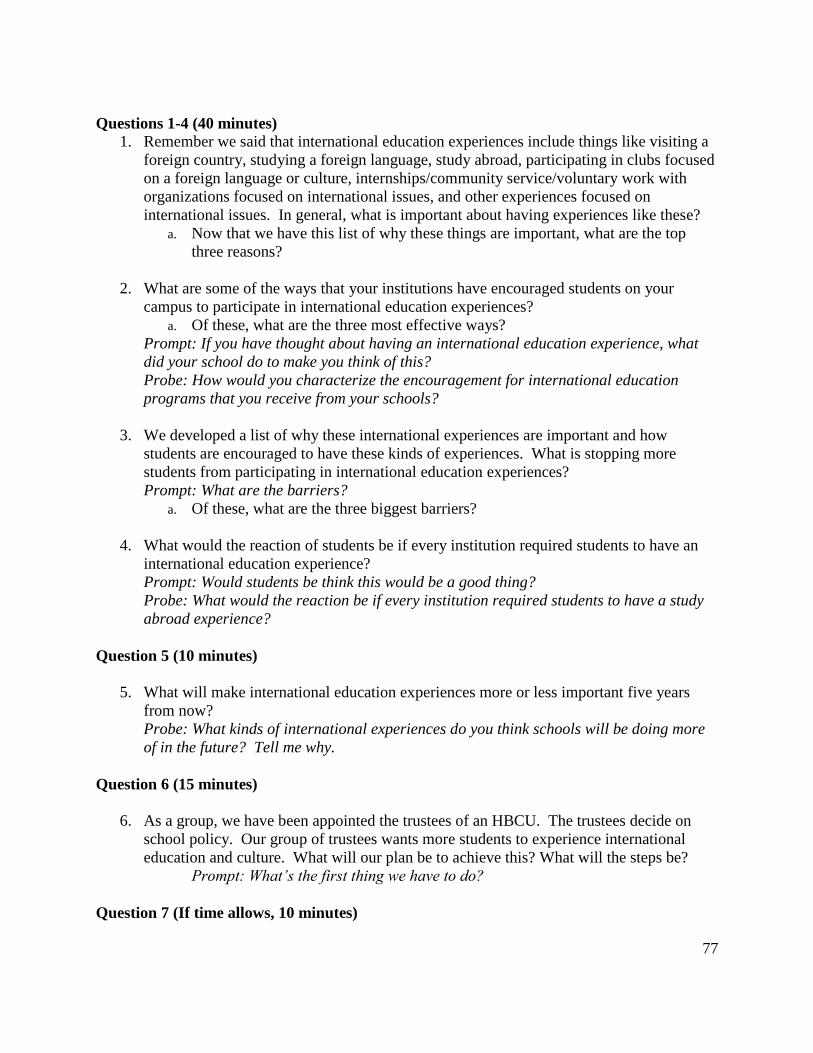
77
Questions 1-4 (40 minutes)
1. Remember we said that international education experiences include things like visiting a
foreign country, studying a foreign language, study abroad, participating in clubs focused
on a foreign language or culture, internships/community service/voluntary work with
organizations focused on international issues, and other experiences focused on
international issues. In general, what is important about having experiences like these?
a. Now that we have this list of why these things are important, what are the top
three reasons?
2. What are some of the ways that your institutions have encouraged students on your
campus to participate in international education experiences?
a. Of these, what are the three most effective ways?
Prompt: If you have thought about having an international education experience, what
did your school do to make you think of this?
Probe: How would you characterize the encouragement for international education
programs that you receive from your schools?
3. We developed a list of why these international experiences are important and how
students are encouraged to have these kinds of experiences. What is stopping more
students from participating in international education experiences?
Prompt: What are the barriers?
a. Of these, what are the three biggest barriers?
4. What would the reaction of students be if every institution required students to have an
international education experience?
Prompt: Would students be think this would be a good thing?
Probe: What would the reaction be if every institution required students to have a study
abroad experience?
Question 5 (10 minutes)
5. What will make international education experiences more or less important five years
from now?
Probe: What kinds of international experiences do you think schools will be doing more
of in the future? Tell me why.
Question 6 (15 minutes)
6. As a group, we have been appointed the trustees of an HBCU. The trustees decide on
school policy. Our group of trustees wants more students to experience international
education and culture. What will our plan be to achieve this? What will the steps be?
Prompt: What’s the first thing we have to do?
Question 7 (If time allows, 10 minutes)
78
7. We talked about a lot of different things today. What does everyone think of international
education?
Probe: Did you learn things from our discussion? Did any of your opinions change?
Closure (5 minutes)
―Are there are final questions? (Respond to questions) Thank you for participating in focus
group today. We are excited to learn about what you think. Please stay tuned for more
information on UNCFSP‘s efforts to increase students‘ participation in international education.
We may be asking you to help us out to spread the word around your campus and among your
peers. If you are currently enrolled as a student at an HBCU, we ask that you respond to our
survey at www.uncfsp.org/survey. I have a flyer from UNCFSP for you to see (Pass out the
flyer). If you complete the survey you may win an award. Thank you.‖
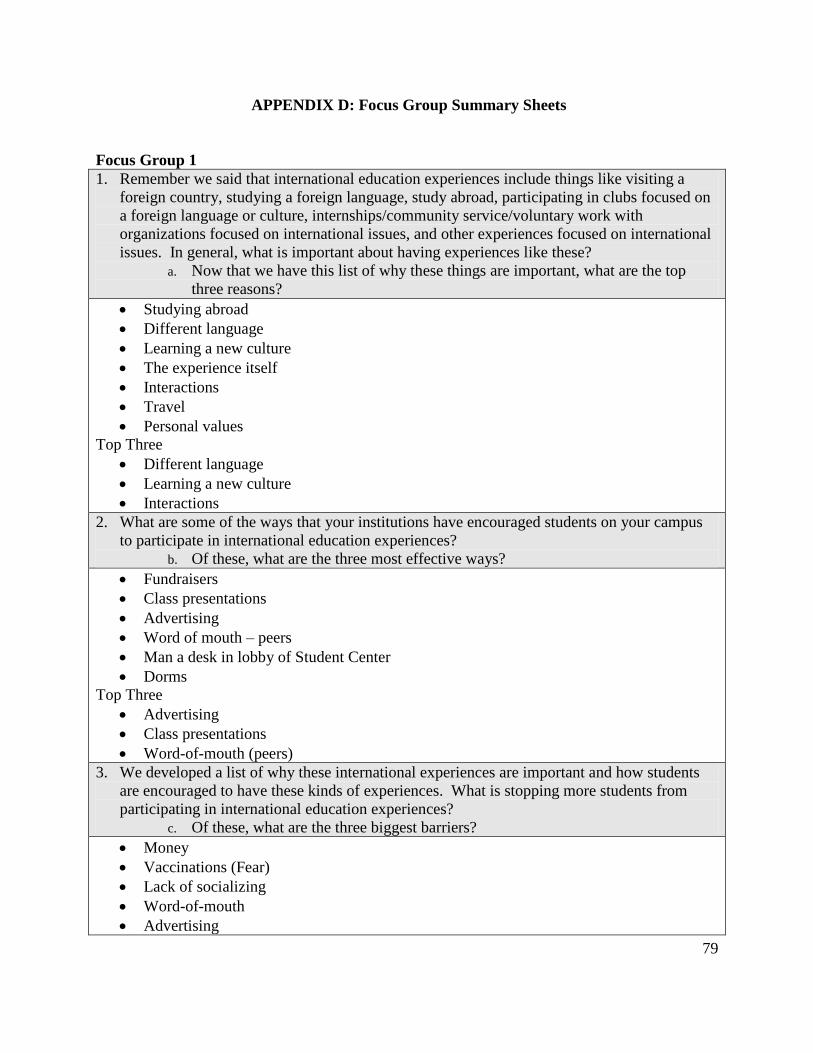
79
APPENDIX D: Focus Group Summary Sheets
Focus Group 1
1. Remember we said that international education experiences include things like visiting a
foreign country, studying a foreign language, study abroad, participating in clubs focused on
a foreign language or culture, internships/community service/voluntary work with
organizations focused on international issues, and other experiences focused on international
issues. In general, what is important about having experiences like these?
a. Now that we have this list of why these things are important, what are the top
three reasons?
Studying abroad
Different language
Learning a new culture
The experience itself
Interactions
Travel
Personal values
Top Three
Different language
Learning a new culture
Interactions
2. What are some of the ways that your institutions have encouraged students on your campus
to participate in international education experiences?
b. Of these, what are the three most effective ways?
Fundraisers
Class presentations
Advertising
Word of mouth – peers
Man a desk in lobby of Student Center
Dorms
Top Three
Advertising
Class presentations
Word-of-mouth (peers)
3. We developed a list of why these international experiences are important and how students
are encouraged to have these kinds of experiences. What is stopping more students from
participating in international education experiences?
c. Of these, what are the three biggest barriers?
Money
Vaccinations (Fear)
Lack of socializing
Word-of-mouth
Advertising
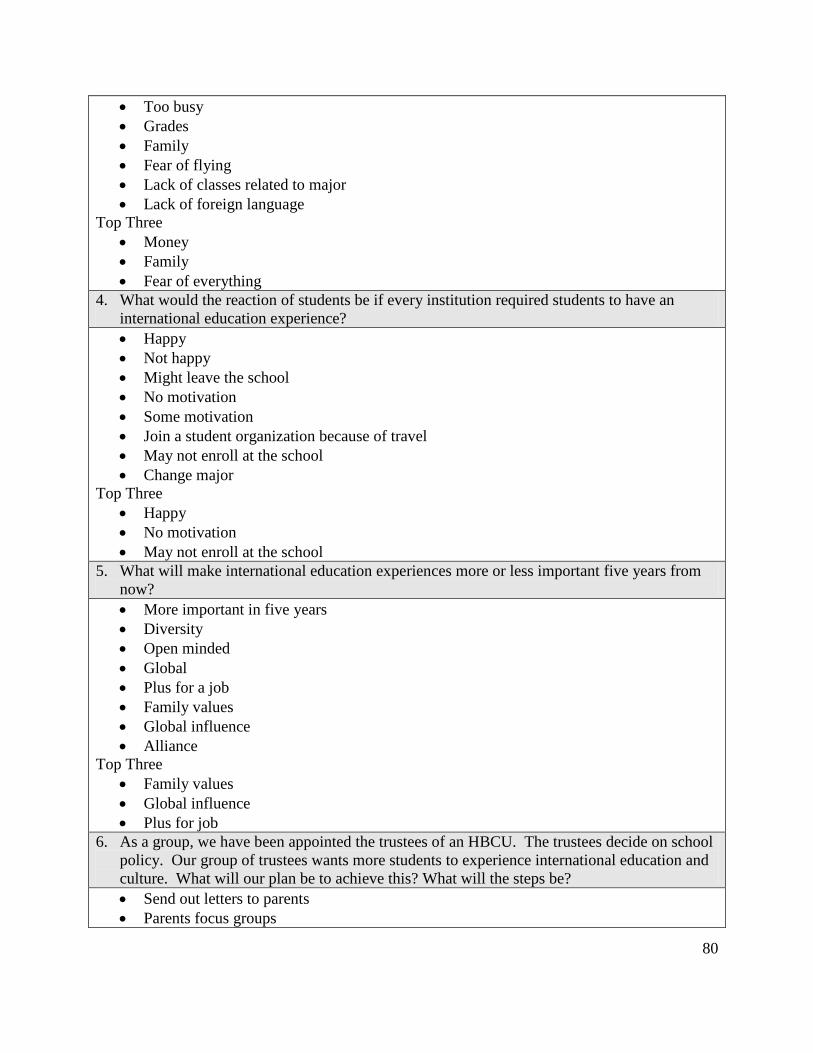
80
Too busy
Grades
Family
Fear of flying
Lack of classes related to major
Lack of foreign language
Top Three
Money
Family
Fear of everything
4. What would the reaction of students be if every institution required students to have an
international education experience?
Happy
Not happy
Might leave the school
No motivation
Some motivation
Join a student organization because of travel
May not enroll at the school
Change major
Top Three
Happy
No motivation
May not enroll at the school
5. What will make international education experiences more or less important five years from
now?
More important in five years
Diversity
Open minded
Global
Plus for a job
Family values
Global influence
Alliance
Top Three
Family values
Global influence
Plus for job
6. As a group, we have been appointed the trustees of an HBCU. The trustees decide on school
policy. Our group of trustees wants more students to experience international education and
culture. What will our plan be to achieve this? What will the steps be?
Send out letters to parents
Parents focus groups
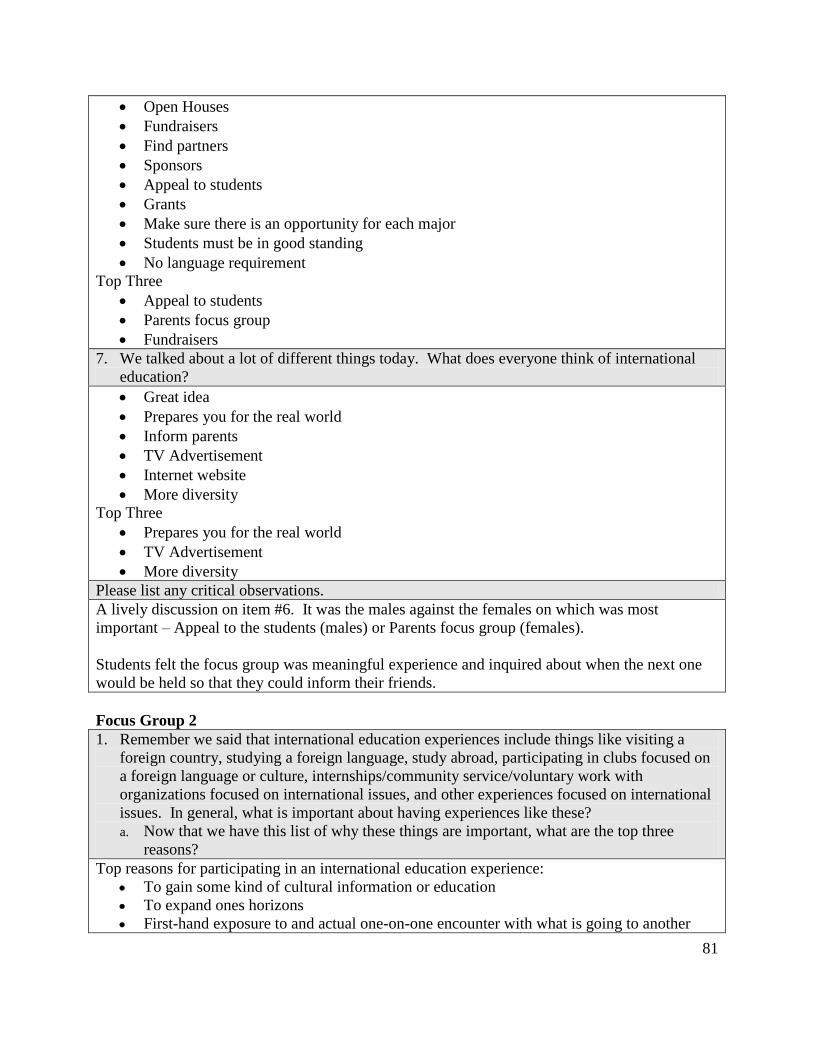
81
Open Houses
Fundraisers
Find partners
Sponsors
Appeal to students
Grants
Make sure there is an opportunity for each major
Students must be in good standing
No language requirement
Top Three
Appeal to students
Parents focus group
Fundraisers
7. We talked about a lot of different things today. What does everyone think of international
education?
Great idea
Prepares you for the real world
Inform parents
TV Advertisement
Internet website
More diversity
Top Three
Prepares you for the real world
TV Advertisement
More diversity
Please list any critical observations.
A lively discussion on item #6. It was the males against the females on which was most
important – Appeal to the students (males) or Parents focus group (females).
Students felt the focus group was meaningful experience and inquired about when the next one
would be held so that they could inform their friends.
Focus Group 2
1. Remember we said that international education experiences include things like visiting a
foreign country, studying a foreign language, study abroad, participating in clubs focused on
a foreign language or culture, internships/community service/voluntary work with
organizations focused on international issues, and other experiences focused on international
issues. In general, what is important about having experiences like these?
a. Now that we have this list of why these things are important, what are the top three
reasons?
Top reasons for participating in an international education experience:
To gain some kind of cultural information or education
To expand ones horizons
First-hand exposure to and actual one-on-one encounter with what is going to another
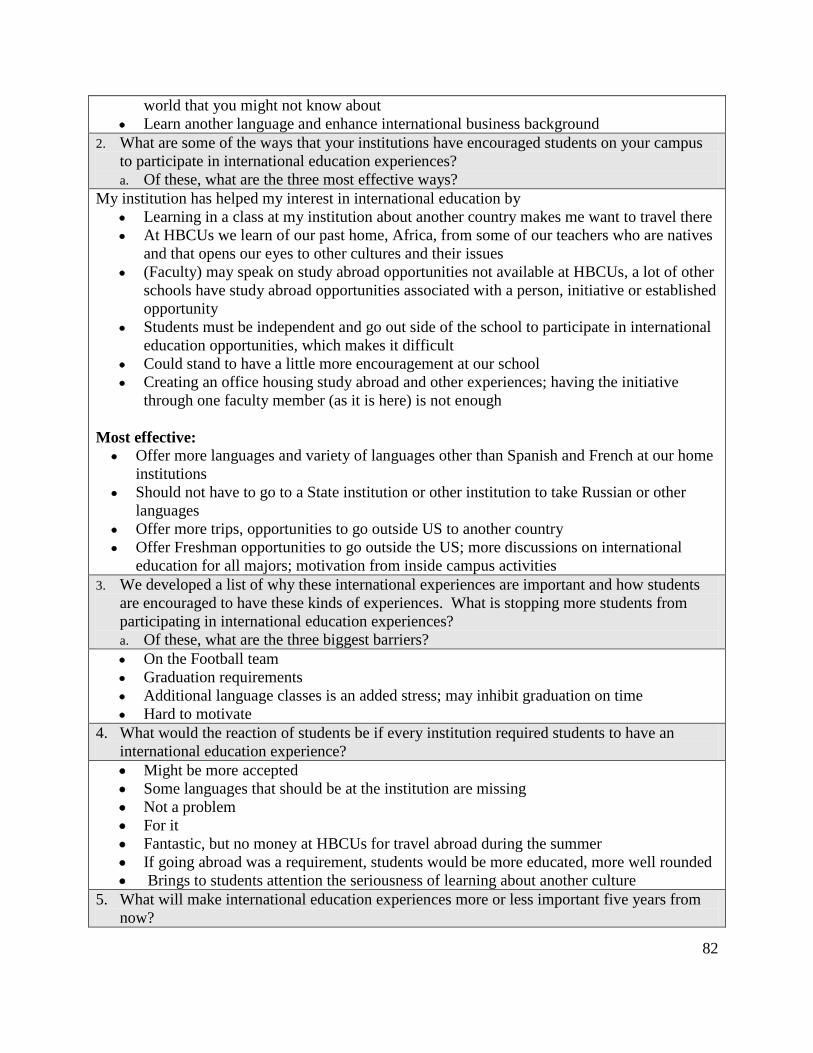
82
world that you might not know about
Learn another language and enhance international business background
2. What are some of the ways that your institutions have encouraged students on your campus
to participate in international education experiences?
a. Of these, what are the three most effective ways?
My institution has helped my interest in international education by
Learning in a class at my institution about another country makes me want to travel there
At HBCUs we learn of our past home, Africa, from some of our teachers who are natives
and that opens our eyes to other cultures and their issues
(Faculty) may speak on study abroad opportunities not available at HBCUs, a lot of other
schools have study abroad opportunities associated with a person, initiative or established
opportunity
Students must be independent and go out side of the school to participate in international
education opportunities, which makes it difficult
Could stand to have a little more encouragement at our school
Creating an office housing study abroad and other experiences; having the initiative
through one faculty member (as it is here) is not enough
Most effective:
Offer more languages and variety of languages other than Spanish and French at our home
institutions
Should not have to go to a State institution or other institution to take Russian or other
languages
Offer more trips, opportunities to go outside US to another country
Offer Freshman opportunities to go outside the US; more discussions on international
education for all majors; motivation from inside campus activities
3. We developed a list of why these international experiences are important and how students
are encouraged to have these kinds of experiences. What is stopping more students from
participating in international education experiences?
a. Of these, what are the three biggest barriers?
On the Football team
Graduation requirements
Additional language classes is an added stress; may inhibit graduation on time
Hard to motivate
4. What would the reaction of students be if every institution required students to have an
international education experience?
Might be more accepted
Some languages that should be at the institution are missing
Not a problem
For it
Fantastic, but no money at HBCUs for travel abroad during the summer
If going abroad was a requirement, students would be more educated, more well rounded
Brings to students attention the seriousness of learning about another culture
5. What will make international education experiences more or less important five years from
now?
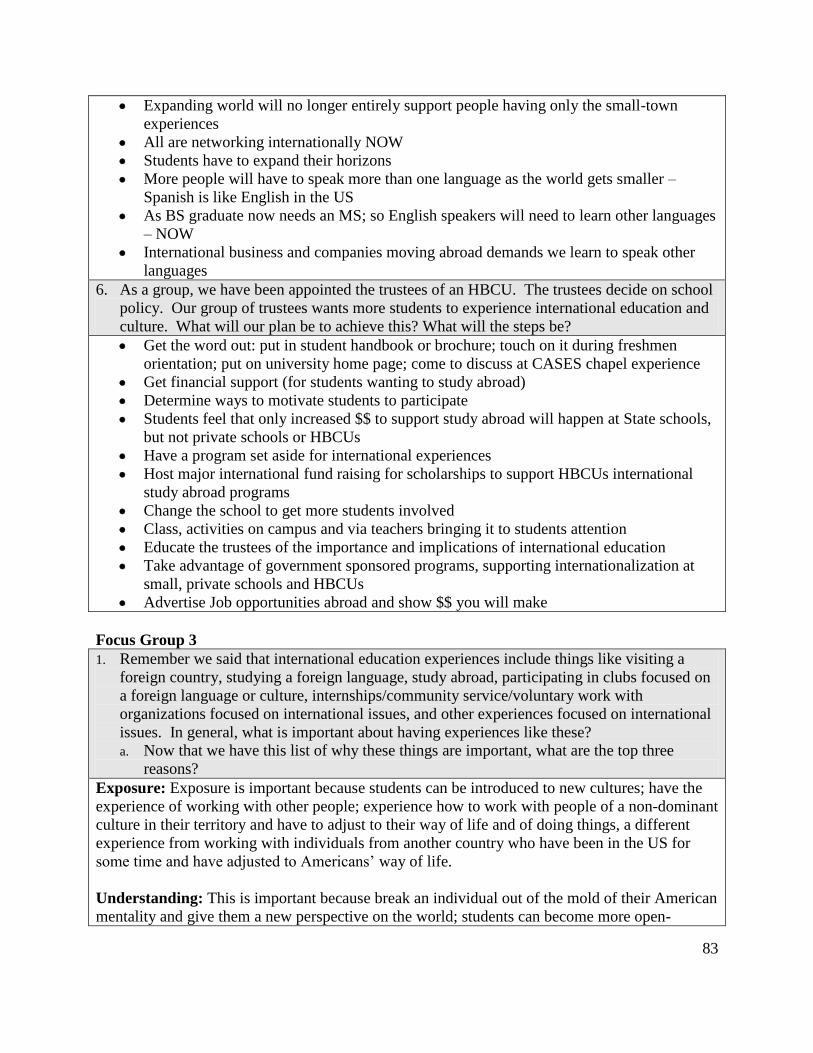
83
Expanding world will no longer entirely support people having only the small-town
experiences
All are networking internationally NOW
Students have to expand their horizons
More people will have to speak more than one language as the world gets smaller –
Spanish is like English in the US
As BS graduate now needs an MS; so English speakers will need to learn other languages
– NOW
International business and companies moving abroad demands we learn to speak other
languages
6. As a group, we have been appointed the trustees of an HBCU. The trustees decide on school
policy. Our group of trustees wants more students to experience international education and
culture. What will our plan be to achieve this? What will the steps be?
Get the word out: put in student handbook or brochure; touch on it during freshmen
orientation; put on university home page; come to discuss at CASES chapel experience
Get financial support (for students wanting to study abroad)
Determine ways to motivate students to participate
Students feel that only increased $$ to support study abroad will happen at State schools,
but not private schools or HBCUs
Have a program set aside for international experiences
Host major international fund raising for scholarships to support HBCUs international
study abroad programs
Change the school to get more students involved
Class, activities on campus and via teachers bringing it to students attention
Educate the trustees of the importance and implications of international education
Take advantage of government sponsored programs, supporting internationalization at
small, private schools and HBCUs
Advertise Job opportunities abroad and show $$ you will make
Focus Group 3
1. Remember we said that international education experiences include things like visiting a
foreign country, studying a foreign language, study abroad, participating in clubs focused on
a foreign language or culture, internships/community service/voluntary work with
organizations focused on international issues, and other experiences focused on international
issues. In general, what is important about having experiences like these?
a. Now that we have this list of why these things are important, what are the top three
reasons?
Exposure: Exposure is important because students can be introduced to new cultures; have the
experience of working with other people; experience how to work with people of a non-dominant
culture in their territory and have to adjust to their way of life and of doing things, a different
experience from working with individuals from another country who have been in the US for
some time and have adjusted to Americans‘ way of life.
Understanding: This is important because break an individual out of the mold of their American
mentality and give them a new perspective on the world; students can become more open-
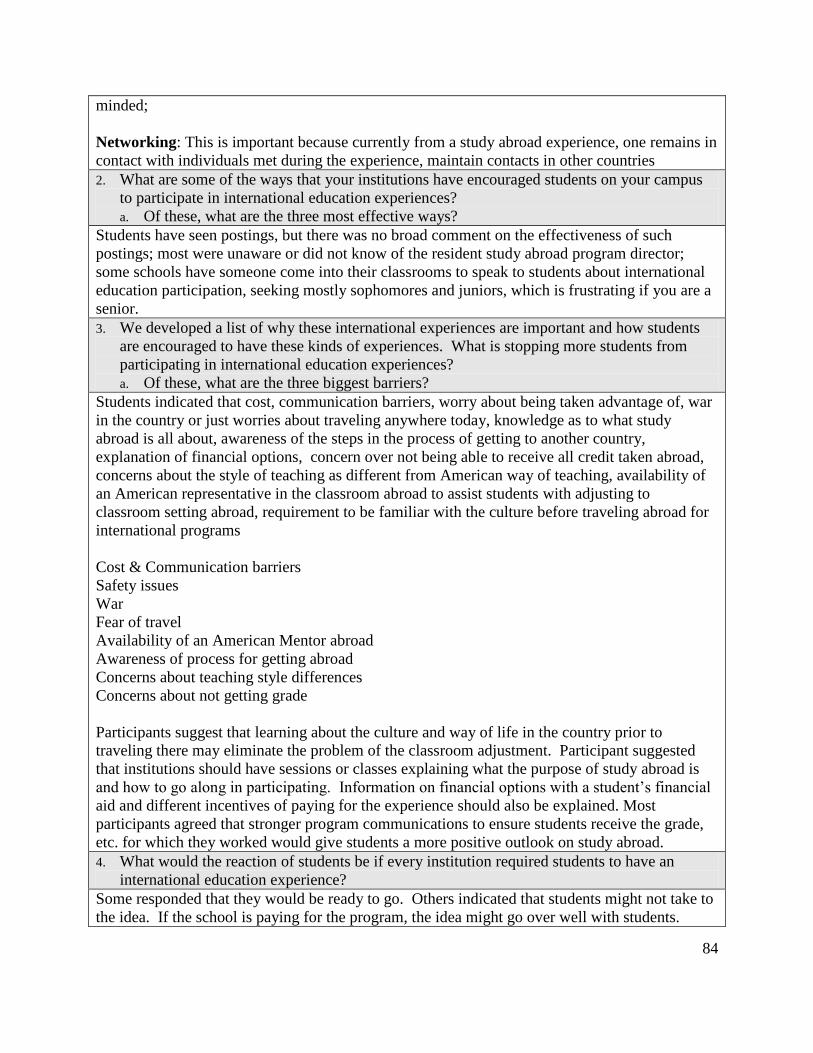
84
minded;
Networking: This is important because currently from a study abroad experience, one remains in
contact with individuals met during the experience, maintain contacts in other countries
2. What are some of the ways that your institutions have encouraged students on your campus
to participate in international education experiences?
a. Of these, what are the three most effective ways?
Students have seen postings, but there was no broad comment on the effectiveness of such
postings; most were unaware or did not know of the resident study abroad program director;
some schools have someone come into their classrooms to speak to students about international
education participation, seeking mostly sophomores and juniors, which is frustrating if you are a
senior.
3. We developed a list of why these international experiences are important and how students
are encouraged to have these kinds of experiences. What is stopping more students from
participating in international education experiences?
a. Of these, what are the three biggest barriers?
Students indicated that cost, communication barriers, worry about being taken advantage of, war
in the country or just worries about traveling anywhere today, knowledge as to what study
abroad is all about, awareness of the steps in the process of getting to another country,
explanation of financial options, concern over not being able to receive all credit taken abroad,
concerns about the style of teaching as different from American way of teaching, availability of
an American representative in the classroom abroad to assist students with adjusting to
classroom setting abroad, requirement to be familiar with the culture before traveling abroad for
international programs
Cost & Communication barriers
Safety issues
War
Fear of travel
Availability of an American Mentor abroad
Awareness of process for getting abroad
Concerns about teaching style differences
Concerns about not getting grade
Participants suggest that learning about the culture and way of life in the country prior to
traveling there may eliminate the problem of the classroom adjustment. Participant suggested
that institutions should have sessions or classes explaining what the purpose of study abroad is
and how to go along in participating. Information on financial options with a student‘s financial
aid and different incentives of paying for the experience should also be explained. Most
participants agreed that stronger program communications to ensure students receive the grade,
etc. for which they worked would give students a more positive outlook on study abroad.
4. What would the reaction of students be if every institution required students to have an
international education experience?
Some responded that they would be ready to go. Others indicated that students might not take to
the idea. If the school is paying for the program, the idea might go over well with students.
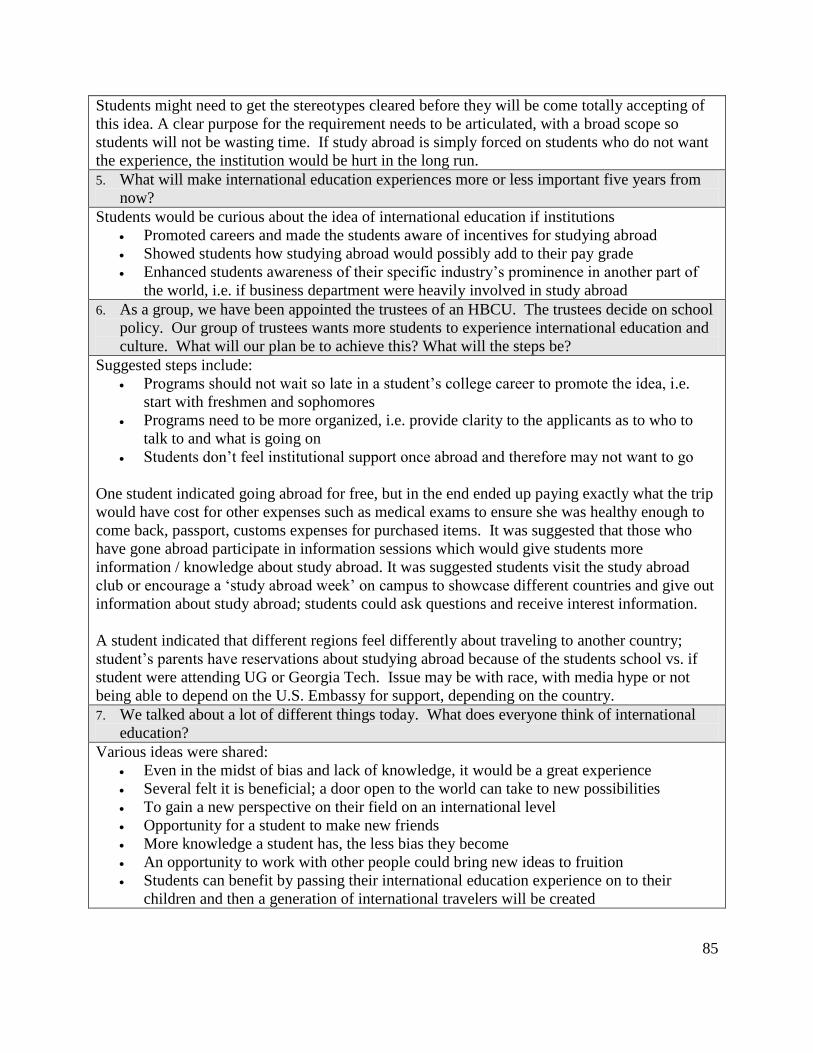
85
Students might need to get the stereotypes cleared before they will be come totally accepting of
this idea. A clear purpose for the requirement needs to be articulated, with a broad scope so
students will not be wasting time. If study abroad is simply forced on students who do not want
the experience, the institution would be hurt in the long run.
5. What will make international education experiences more or less important five years from
now?
Students would be curious about the idea of international education if institutions
Promoted careers and made the students aware of incentives for studying abroad
Showed students how studying abroad would possibly add to their pay grade
Enhanced students awareness of their specific industry‘s prominence in another part of
the world, i.e. if business department were heavily involved in study abroad
6. As a group, we have been appointed the trustees of an HBCU. The trustees decide on school
policy. Our group of trustees wants more students to experience international education and
culture. What will our plan be to achieve this? What will the steps be?
Suggested steps include:
Programs should not wait so late in a student‘s college career to promote the idea, i.e.
start with freshmen and sophomores
Programs need to be more organized, i.e. provide clarity to the applicants as to who to
talk to and what is going on
Students don‘t feel institutional support once abroad and therefore may not want to go
One student indicated going abroad for free, but in the end ended up paying exactly what the trip
would have cost for other expenses such as medical exams to ensure she was healthy enough to
come back, passport, customs expenses for purchased items. It was suggested that those who
have gone abroad participate in information sessions which would give students more
information / knowledge about study abroad. It was suggested students visit the study abroad
club or encourage a ‗study abroad week‘ on campus to showcase different countries and give out
information about study abroad; students could ask questions and receive interest information.
A student indicated that different regions feel differently about traveling to another country;
student‘s parents have reservations about studying abroad because of the students school vs. if
student were attending UG or Georgia Tech. Issue may be with race, with media hype or not
being able to depend on the U.S. Embassy for support, depending on the country.
7. We talked about a lot of different things today. What does everyone think of international
education?
Various ideas were shared:
Even in the midst of bias and lack of knowledge, it would be a great experience
Several felt it is beneficial; a door open to the world can take to new possibilities
To gain a new perspective on their field on an international level
Opportunity for a student to make new friends
More knowledge a student has, the less bias they become
An opportunity to work with other people could bring new ideas to fruition
Students can benefit by passing their international education experience on to their
children and then a generation of international travelers will be created
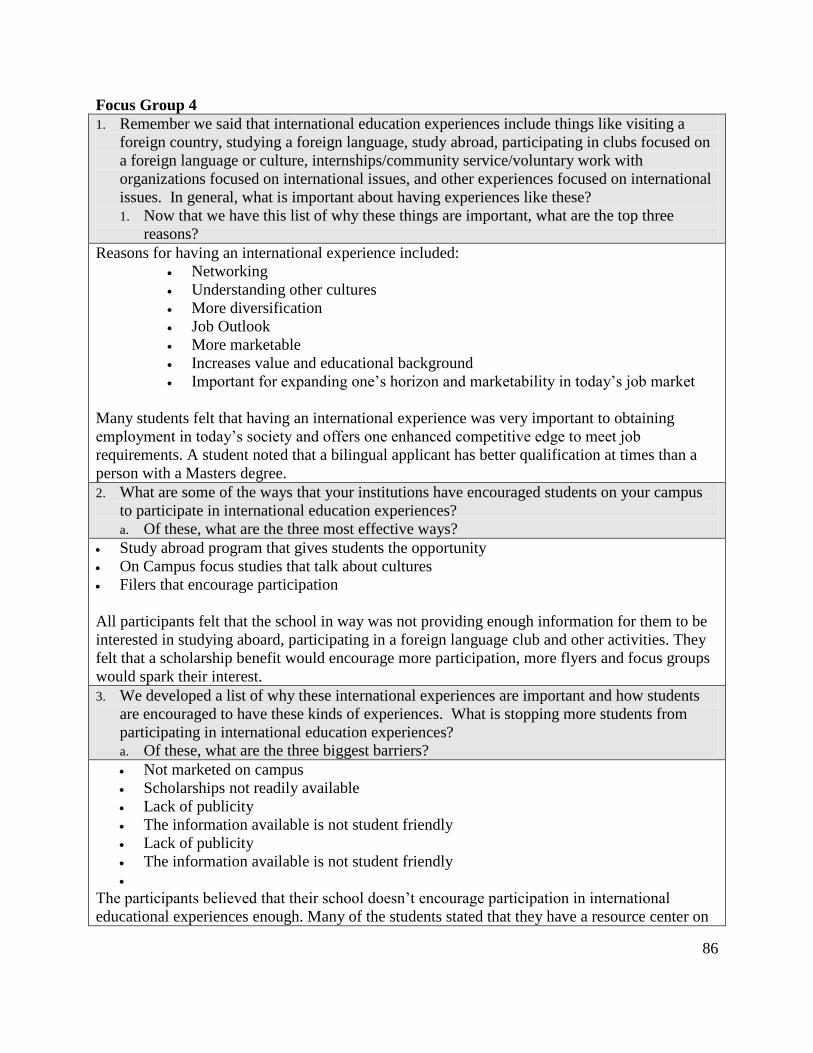
86
Focus Group 4
1. Remember we said that international education experiences include things like visiting a
foreign country, studying a foreign language, study abroad, participating in clubs focused on
a foreign language or culture, internships/community service/voluntary work with
organizations focused on international issues, and other experiences focused on international
issues. In general, what is important about having experiences like these?
1. Now that we have this list of why these things are important, what are the top three
reasons?
Reasons for having an international experience included:
Networking
Understanding other cultures
More diversification
Job Outlook
More marketable
Increases value and educational background
Important for expanding one‘s horizon and marketability in today‘s job market
Many students felt that having an international experience was very important to obtaining
employment in today‘s society and offers one enhanced competitive edge to meet job
requirements. A student noted that a bilingual applicant has better qualification at times than a
person with a Masters degree.
2. What are some of the ways that your institutions have encouraged students on your campus
to participate in international education experiences?
a. Of these, what are the three most effective ways?
Study abroad program that gives students the opportunity
On Campus focus studies that talk about cultures
Filers that encourage participation
All participants felt that the school in way was not providing enough information for them to be
interested in studying aboard, participating in a foreign language club and other activities. They
felt that a scholarship benefit would encourage more participation, more flyers and focus groups
would spark their interest.
3. We developed a list of why these international experiences are important and how students
are encouraged to have these kinds of experiences. What is stopping more students from
participating in international education experiences?
a. Of these, what are the three biggest barriers?
Not marketed on campus
Scholarships not readily available
Lack of publicity
The information available is not student friendly
Lack of publicity
The information available is not student friendly
The participants believed that their school doesn‘t encourage participation in international
educational experiences enough. Many of the students stated that they have a resource center on
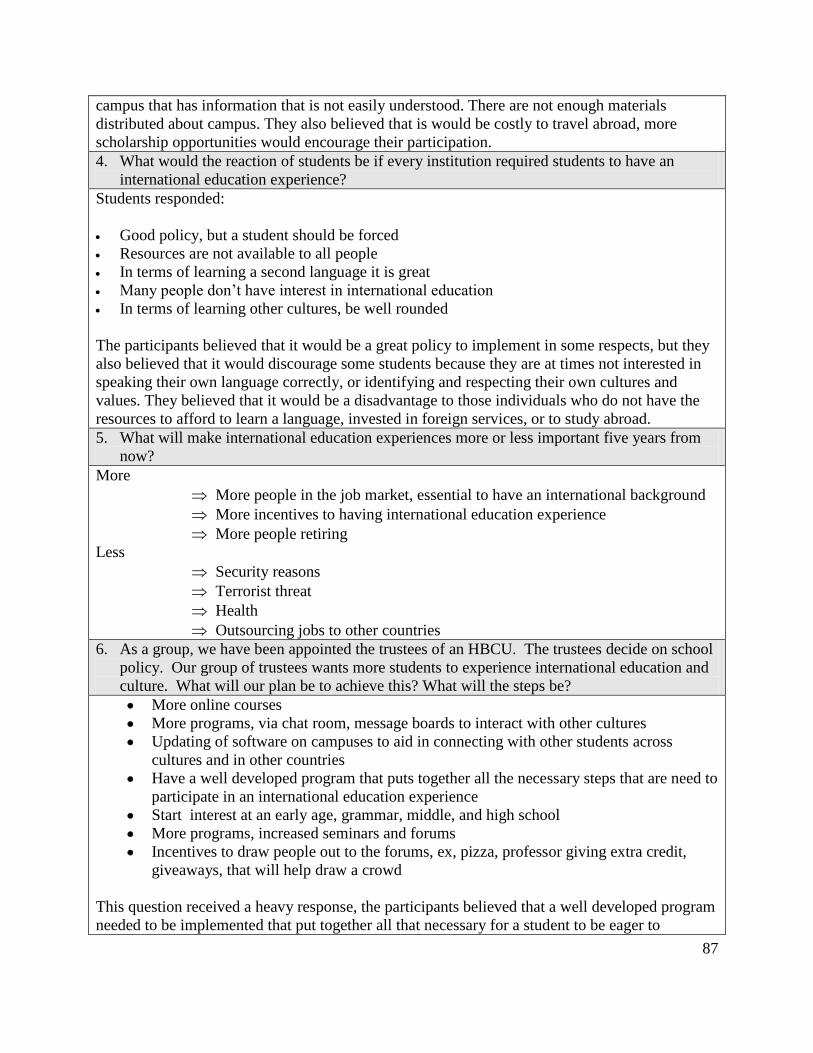
87
campus that has information that is not easily understood. There are not enough materials
distributed about campus. They also believed that is would be costly to travel abroad, more
scholarship opportunities would encourage their participation.
4. What would the reaction of students be if every institution required students to have an
international education experience?
Students responded:
Good policy, but a student should be forced
Resources are not available to all people
In terms of learning a second language it is great
Many people don‘t have interest in international education
In terms of learning other cultures, be well rounded
The participants believed that it would be a great policy to implement in some respects, but they
also believed that it would discourage some students because they are at times not interested in
speaking their own language correctly, or identifying and respecting their own cultures and
values. They believed that it would be a disadvantage to those individuals who do not have the
resources to afford to learn a language, invested in foreign services, or to study abroad.
5. What will make international education experiences more or less important five years from
now?
More
More people in the job market, essential to have an international background
More incentives to having international education experience
More people retiring
Less
Security reasons
Terrorist threat
Health
Outsourcing jobs to other countries
6. As a group, we have been appointed the trustees of an HBCU. The trustees decide on school
policy. Our group of trustees wants more students to experience international education and
culture. What will our plan be to achieve this? What will the steps be?
More online courses
More programs, via chat room, message boards to interact with other cultures
Updating of software on campuses to aid in connecting with other students across
cultures and in other countries
Have a well developed program that puts together all the necessary steps that are need to
participate in an international education experience
Start interest at an early age, grammar, middle, and high school
More programs, increased seminars and forums
Incentives to draw people out to the forums, ex, pizza, professor giving extra credit,
giveaways, that will help draw a crowd
This question received a heavy response, the participants believed that a well developed program
needed to be implemented that put together all that necessary for a student to be eager to
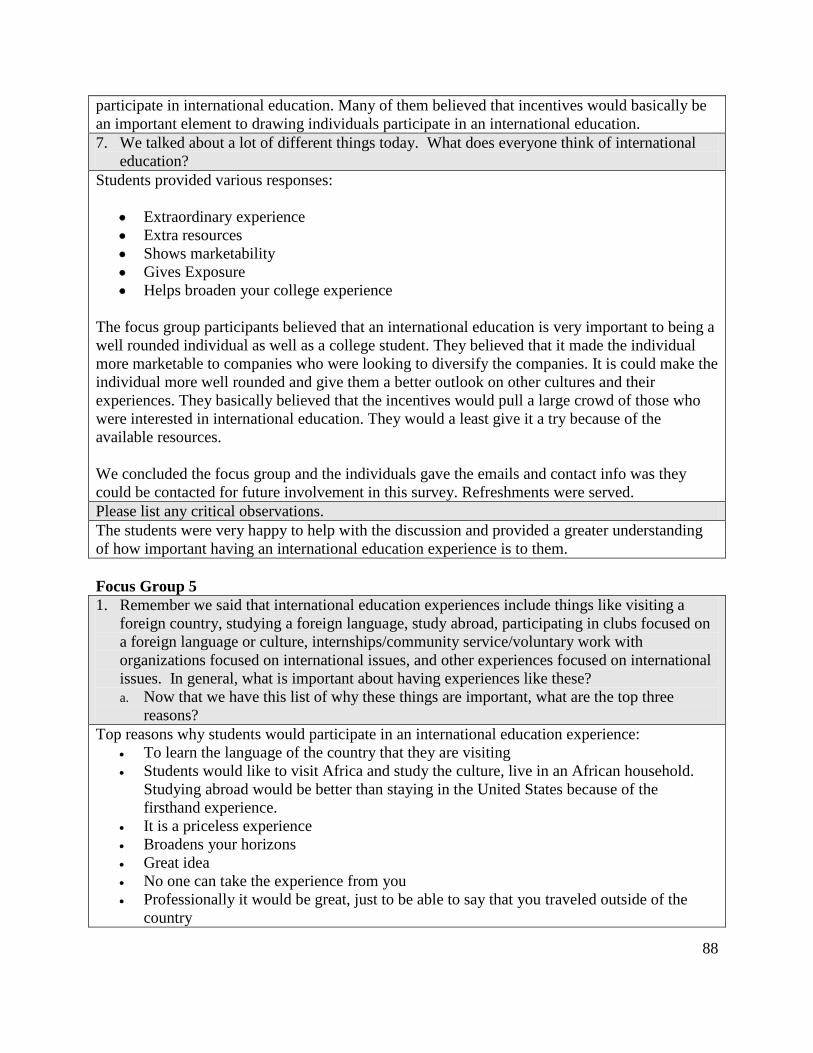
88
participate in international education. Many of them believed that incentives would basically be
an important element to drawing individuals participate in an international education.
7. We talked about a lot of different things today. What does everyone think of international
education?
Students provided various responses:
Extraordinary experience
Extra resources
Shows marketability
Gives Exposure
Helps broaden your college experience
The focus group participants believed that an international education is very important to being a
well rounded individual as well as a college student. They believed that it made the individual
more marketable to companies who were looking to diversify the companies. It is could make the
individual more well rounded and give them a better outlook on other cultures and their
experiences. They basically believed that the incentives would pull a large crowd of those who
were interested in international education. They would a least give it a try because of the
available resources.
We concluded the focus group and the individuals gave the emails and contact info was they
could be contacted for future involvement in this survey. Refreshments were served.
Please list any critical observations.
The students were very happy to help with the discussion and provided a greater understanding
of how important having an international education experience is to them.
Focus Group 5
1. Remember we said that international education experiences include things like visiting a
foreign country, studying a foreign language, study abroad, participating in clubs focused on
a foreign language or culture, internships/community service/voluntary work with
organizations focused on international issues, and other experiences focused on international
issues. In general, what is important about having experiences like these?
a. Now that we have this list of why these things are important, what are the top three
reasons?
Top reasons why students would participate in an international education experience:
To learn the language of the country that they are visiting
Students would like to visit Africa and study the culture, live in an African household.
Studying abroad would be better than staying in the United States because of the
firsthand experience.
It is a priceless experience
Broadens your horizons
Great idea
No one can take the experience from you
Professionally it would be great, just to be able to say that you traveled outside of the
country
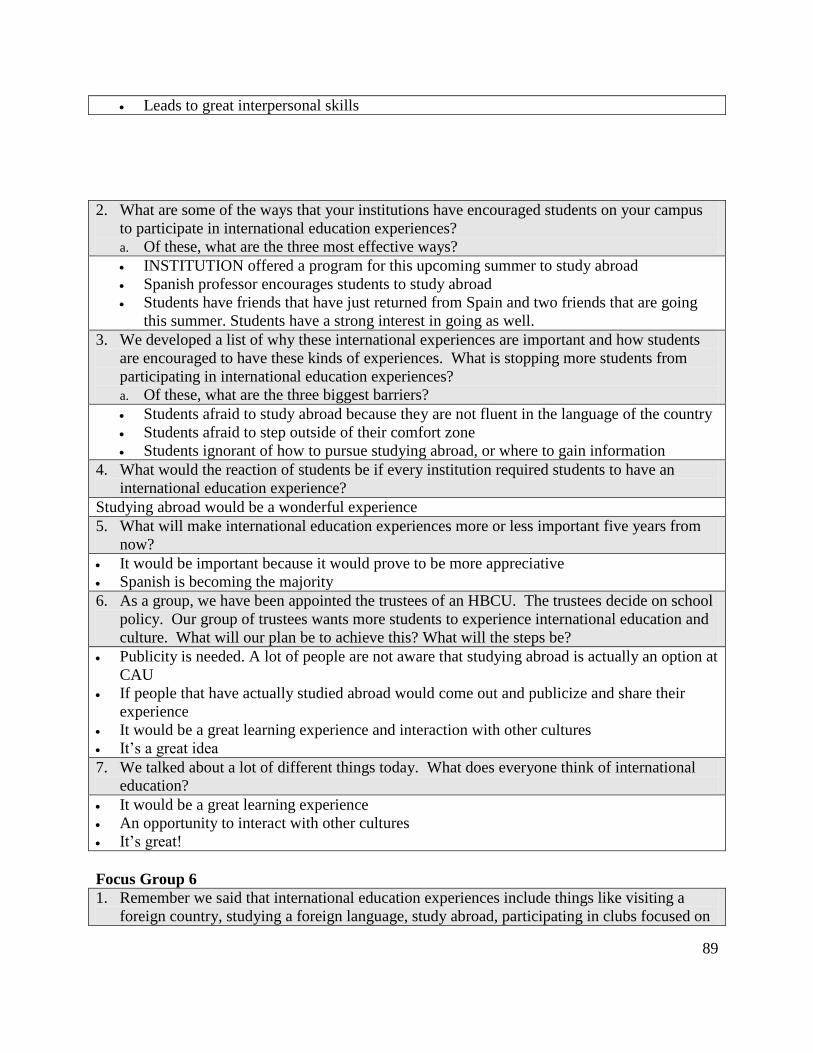
89
Leads to great interpersonal skills
2. What are some of the ways that your institutions have encouraged students on your campus
to participate in international education experiences?
a. Of these, what are the three most effective ways?
INSTITUTION offered a program for this upcoming summer to study abroad
Spanish professor encourages students to study abroad
Students have friends that have just returned from Spain and two friends that are going
this summer. Students have a strong interest in going as well.
3. We developed a list of why these international experiences are important and how students
are encouraged to have these kinds of experiences. What is stopping more students from
participating in international education experiences?
a. Of these, what are the three biggest barriers?
Students afraid to study abroad because they are not fluent in the language of the country
Students afraid to step outside of their comfort zone
Students ignorant of how to pursue studying abroad, or where to gain information
4. What would the reaction of students be if every institution required students to have an
international education experience?
Studying abroad would be a wonderful experience
5. What will make international education experiences more or less important five years from
now?
It would be important because it would prove to be more appreciative
Spanish is becoming the majority
6. As a group, we have been appointed the trustees of an HBCU. The trustees decide on school
policy. Our group of trustees wants more students to experience international education and
culture. What will our plan be to achieve this? What will the steps be?
Publicity is needed. A lot of people are not aware that studying abroad is actually an option at
CAU
If people that have actually studied abroad would come out and publicize and share their
experience
It would be a great learning experience and interaction with other cultures
It‘s a great idea
7. We talked about a lot of different things today. What does everyone think of international
education?
It would be a great learning experience
An opportunity to interact with other cultures
It‘s great!
Focus Group 6
1. Remember we said that international education experiences include things like visiting a
foreign country, studying a foreign language, study abroad, participating in clubs focused on
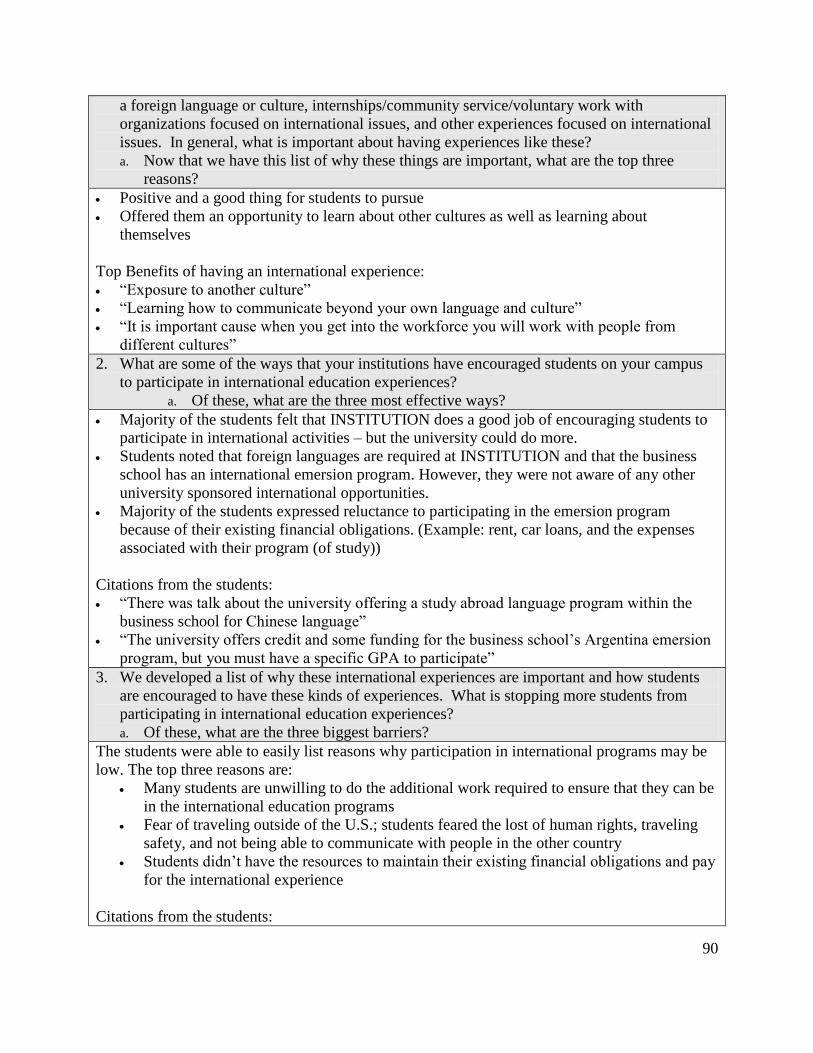
90
a foreign language or culture, internships/community service/voluntary work with
organizations focused on international issues, and other experiences focused on international
issues. In general, what is important about having experiences like these?
a. Now that we have this list of why these things are important, what are the top three
reasons?
Positive and a good thing for students to pursue
Offered them an opportunity to learn about other cultures as well as learning about
themselves
Top Benefits of having an international experience:
―Exposure to another culture‖
―Learning how to communicate beyond your own language and culture‖
―It is important cause when you get into the workforce you will work with people from
different cultures‖
2. What are some of the ways that your institutions have encouraged students on your campus
to participate in international education experiences?
a. Of these, what are the three most effective ways?
Majority of the students felt that INSTITUTION does a good job of encouraging students to
participate in international activities – but the university could do more.
Students noted that foreign languages are required at INSTITUTION and that the business
school has an international emersion program. However, they were not aware of any other
university sponsored international opportunities.
Majority of the students expressed reluctance to participating in the emersion program
because of their existing financial obligations. (Example: rent, car loans, and the expenses
associated with their program (of study))
Citations from the students:
―There was talk about the university offering a study abroad language program within the
business school for Chinese language‖
―The university offers credit and some funding for the business school‘s Argentina emersion
program, but you must have a specific GPA to participate‖
3. We developed a list of why these international experiences are important and how students
are encouraged to have these kinds of experiences. What is stopping more students from
participating in international education experiences?
a. Of these, what are the three biggest barriers?
The students were able to easily list reasons why participation in international programs may be
low. The top three reasons are:
Many students are unwilling to do the additional work required to ensure that they can be
in the international education programs
Fear of traveling outside of the U.S.; students feared the lost of human rights, traveling
safety, and not being able to communicate with people in the other country
Students didn‘t have the resources to maintain their existing financial obligations and pay
for the international experience
Citations from the students:
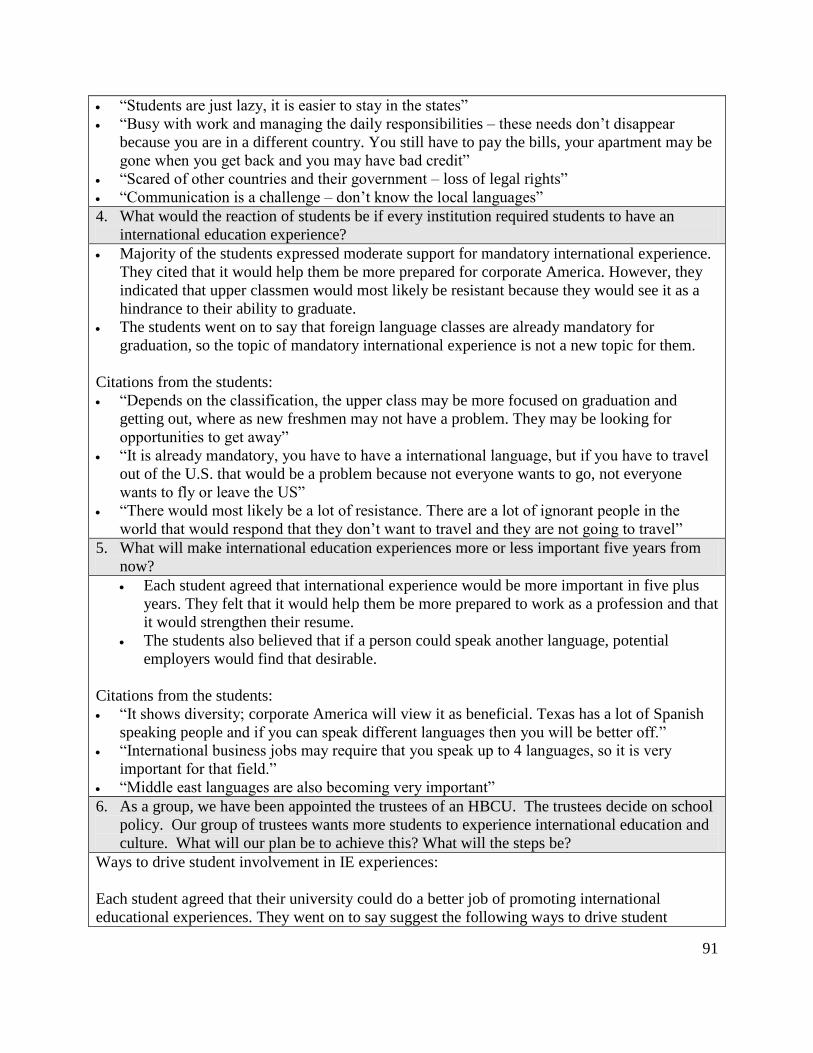
91
―Students are just lazy, it is easier to stay in the states‖
―Busy with work and managing the daily responsibilities – these needs don‘t disappear
because you are in a different country. You still have to pay the bills, your apartment may be
gone when you get back and you may have bad credit‖
―Scared of other countries and their government – loss of legal rights‖
―Communication is a challenge – don‘t know the local languages‖
4. What would the reaction of students be if every institution required students to have an
international education experience?
Majority of the students expressed moderate support for mandatory international experience.
They cited that it would help them be more prepared for corporate America. However, they
indicated that upper classmen would most likely be resistant because they would see it as a
hindrance to their ability to graduate.
The students went on to say that foreign language classes are already mandatory for
graduation, so the topic of mandatory international experience is not a new topic for them.
Citations from the students:
―Depends on the classification, the upper class may be more focused on graduation and
getting out, where as new freshmen may not have a problem. They may be looking for
opportunities to get away‖
―It is already mandatory, you have to have a international language, but if you have to travel
out of the U.S. that would be a problem because not everyone wants to go, not everyone
wants to fly or leave the US‖
―There would most likely be a lot of resistance. There are a lot of ignorant people in the
world that would respond that they don‘t want to travel and they are not going to travel‖
5. What will make international education experiences more or less important five years from
now?
Each student agreed that international experience would be more important in five plus
years. They felt that it would help them be more prepared to work as a profession and that
it would strengthen their resume.
The students also believed that if a person could speak another language, potential
employers would find that desirable.
Citations from the students:
―It shows diversity; corporate America will view it as beneficial. Texas has a lot of Spanish
speaking people and if you can speak different languages then you will be better off.‖
―International business jobs may require that you speak up to 4 languages, so it is very
important for that field.‖
―Middle east languages are also becoming very important‖
6. As a group, we have been appointed the trustees of an HBCU. The trustees decide on school
policy. Our group of trustees wants more students to experience international education and
culture. What will our plan be to achieve this? What will the steps be?
Ways to drive student involvement in IE experiences:
Each student agreed that their university could do a better job of promoting international
educational experiences. They went on to say suggest the following ways to drive student
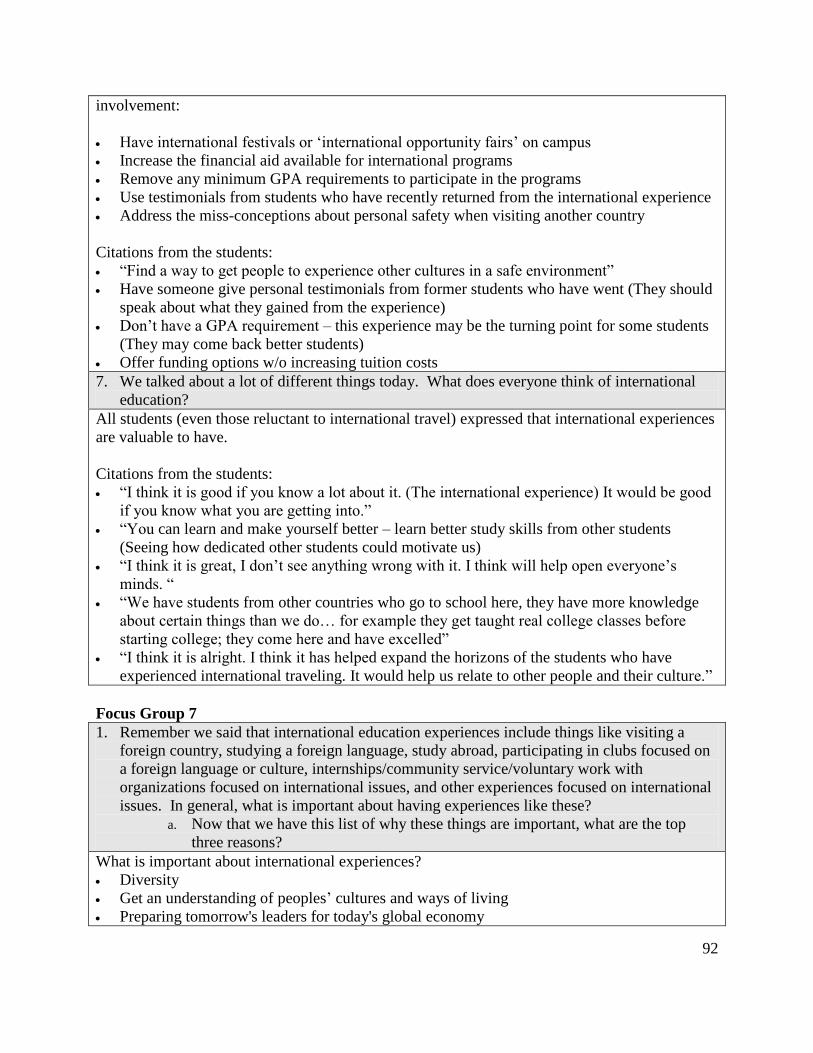
92
involvement:
Have international festivals or ‗international opportunity fairs‘ on campus
Increase the financial aid available for international programs
Remove any minimum GPA requirements to participate in the programs
Use testimonials from students who have recently returned from the international experience
Address the miss-conceptions about personal safety when visiting another country
Citations from the students:
―Find a way to get people to experience other cultures in a safe environment‖
Have someone give personal testimonials from former students who have went (They should
speak about what they gained from the experience)
Don‘t have a GPA requirement – this experience may be the turning point for some students
(They may come back better students)
Offer funding options w/o increasing tuition costs
7. We talked about a lot of different things today. What does everyone think of international
education?
All students (even those reluctant to international travel) expressed that international experiences
are valuable to have.
Citations from the students:
―I think it is good if you know a lot about it. (The international experience) It would be good
if you know what you are getting into.‖
―You can learn and make yourself better – learn better study skills from other students
(Seeing how dedicated other students could motivate us)
―I think it is great, I don‘t see anything wrong with it. I think will help open everyone‘s
minds. ―
―We have students from other countries who go to school here, they have more knowledge
about certain things than we do… for example they get taught real college classes before
starting college; they come here and have excelled‖
―I think it is alright. I think it has helped expand the horizons of the students who have
experienced international traveling. It would help us relate to other people and their culture.‖
Focus Group 7
1. Remember we said that international education experiences include things like visiting a
foreign country, studying a foreign language, study abroad, participating in clubs focused on
a foreign language or culture, internships/community service/voluntary work with
organizations focused on international issues, and other experiences focused on international
issues. In general, what is important about having experiences like these?
a. Now that we have this list of why these things are important, what are the top
three reasons?
What is important about international experiences?
Diversity
Get an understanding of peoples‘ cultures and ways of living
Preparing tomorrow's leaders for today's global economy
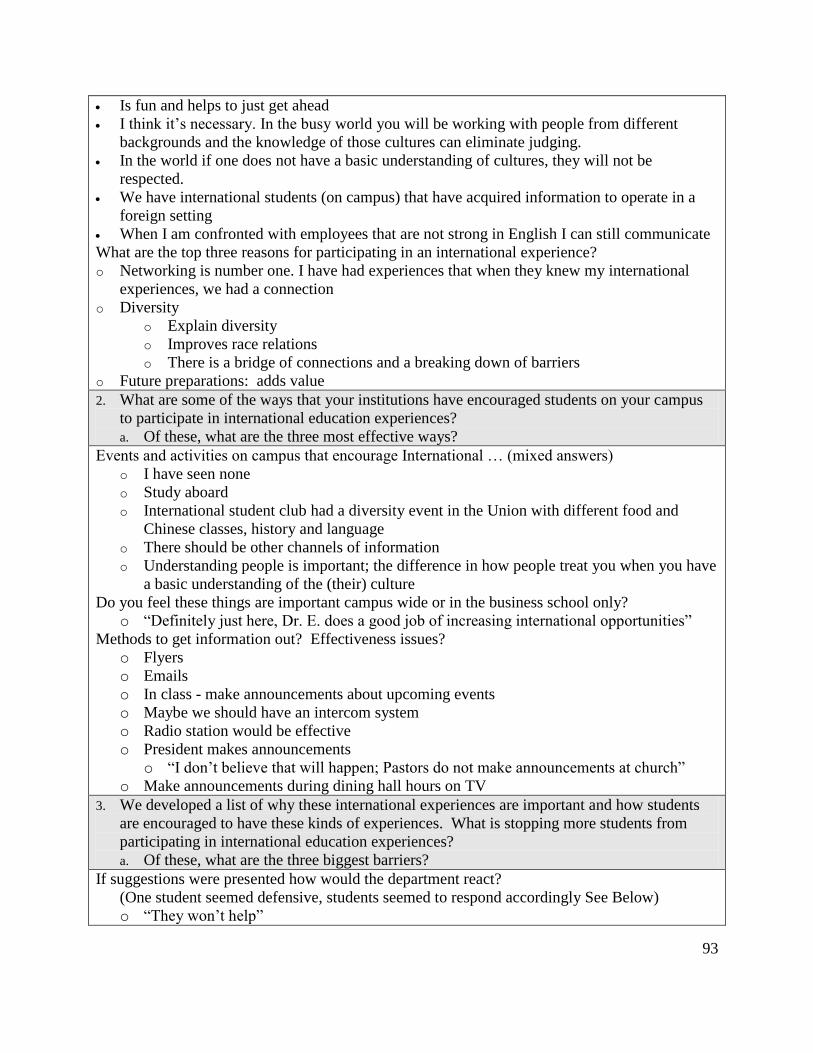
93
Is fun and helps to just get ahead
I think it‘s necessary. In the busy world you will be working with people from different
backgrounds and the knowledge of those cultures can eliminate judging.
In the world if one does not have a basic understanding of cultures, they will not be
respected.
We have international students (on campus) that have acquired information to operate in a
foreign setting
When I am confronted with employees that are not strong in English I can still communicate
What are the top three reasons for participating in an international experience?
o Networking is number one. I have had experiences that when they knew my international
experiences, we had a connection
o Diversity
o Explain diversity
o Improves race relations
o There is a bridge of connections and a breaking down of barriers
o Future preparations: adds value
2. What are some of the ways that your institutions have encouraged students on your campus
to participate in international education experiences?
a. Of these, what are the three most effective ways?
Events and activities on campus that encourage International … (mixed answers)
o I have seen none
o Study aboard
o International student club had a diversity event in the Union with different food and
Chinese classes, history and language
o There should be other channels of information
o Understanding people is important; the difference in how people treat you when you have
a basic understanding of the (their) culture
Do you feel these things are important campus wide or in the business school only?
o ―Definitely just here, Dr. E. does a good job of increasing international opportunities‖
Methods to get information out? Effectiveness issues?
o Flyers
o Emails
o In class - make announcements about upcoming events
o Maybe we should have an intercom system
o Radio station would be effective
o President makes announcements
o ―I don‘t believe that will happen; Pastors do not make announcements at church‖
o Make announcements during dining hall hours on TV
3. We developed a list of why these international experiences are important and how students
are encouraged to have these kinds of experiences. What is stopping more students from
participating in international education experiences?
a. Of these, what are the three biggest barriers?
If suggestions were presented how would the department react?
(One student seemed defensive, students seemed to respond accordingly See Below)
o ―They won‘t help‖
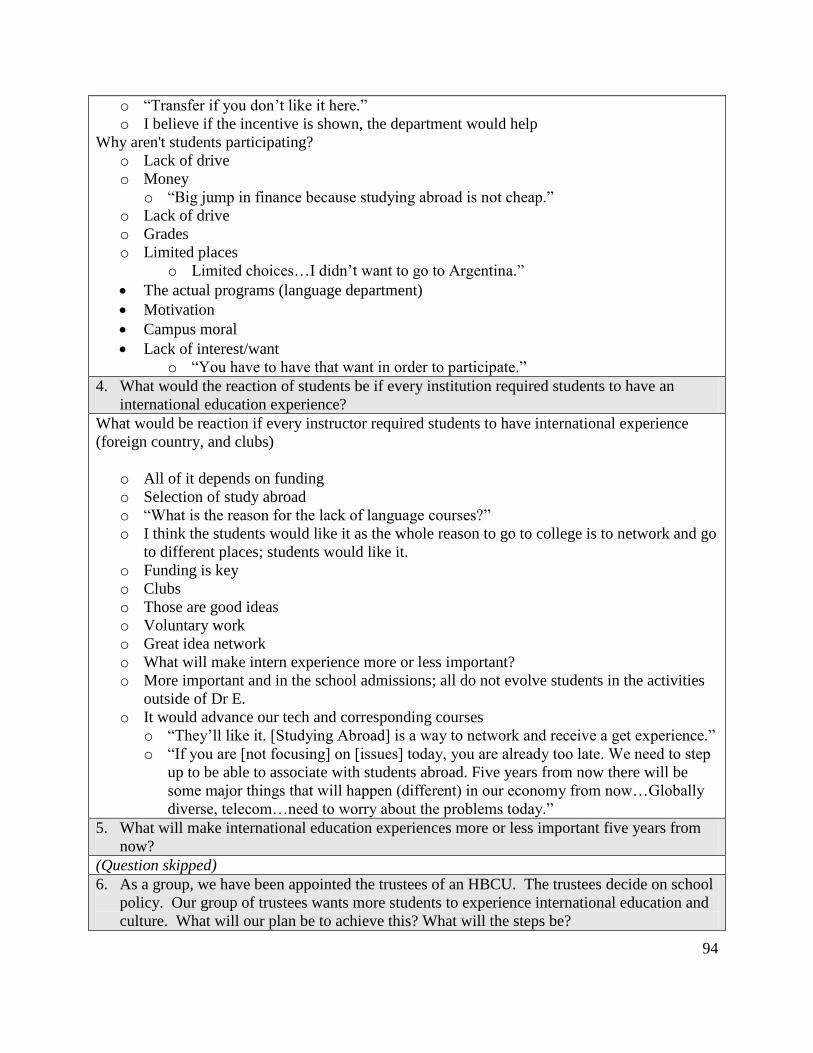
94
o ―Transfer if you don‘t like it here.‖
o I believe if the incentive is shown, the department would help
Why aren't students participating?
o Lack of drive
o Money
o ―Big jump in finance because studying abroad is not cheap.‖
o Lack of drive
o Grades
o Limited places
o Limited choices…I didn‘t want to go to Argentina.‖
The actual programs (language department)
Motivation
Campus moral
Lack of interest/want
o ―You have to have that want in order to participate.‖
4. What would the reaction of students be if every institution required students to have an
international education experience?
What would be reaction if every instructor required students to have international experience
(foreign country, and clubs)
o All of it depends on funding
o Selection of study abroad
o ―What is the reason for the lack of language courses?‖
o I think the students would like it as the whole reason to go to college is to network and go
to different places; students would like it.
o Funding is key
o Clubs
o Those are good ideas
o Voluntary work
o Great idea network
o What will make intern experience more or less important?
o More important and in the school admissions; all do not evolve students in the activities
outside of Dr E.
o It would advance our tech and corresponding courses
o ―They‘ll like it. [Studying Abroad] is a way to network and receive a get experience.‖
o ―If you are [not focusing] on [issues] today, you are already too late. We need to step
up to be able to associate with students abroad. Five years from now there will be
some major things that will happen (different) in our economy from now…Globally
diverse, telecom…need to worry about the problems today.‖
5. What will make international education experiences more or less important five years from
now?
(Question skipped)
6. As a group, we have been appointed the trustees of an HBCU. The trustees decide on school
policy. Our group of trustees wants more students to experience international education and
culture. What will our plan be to achieve this? What will the steps be?
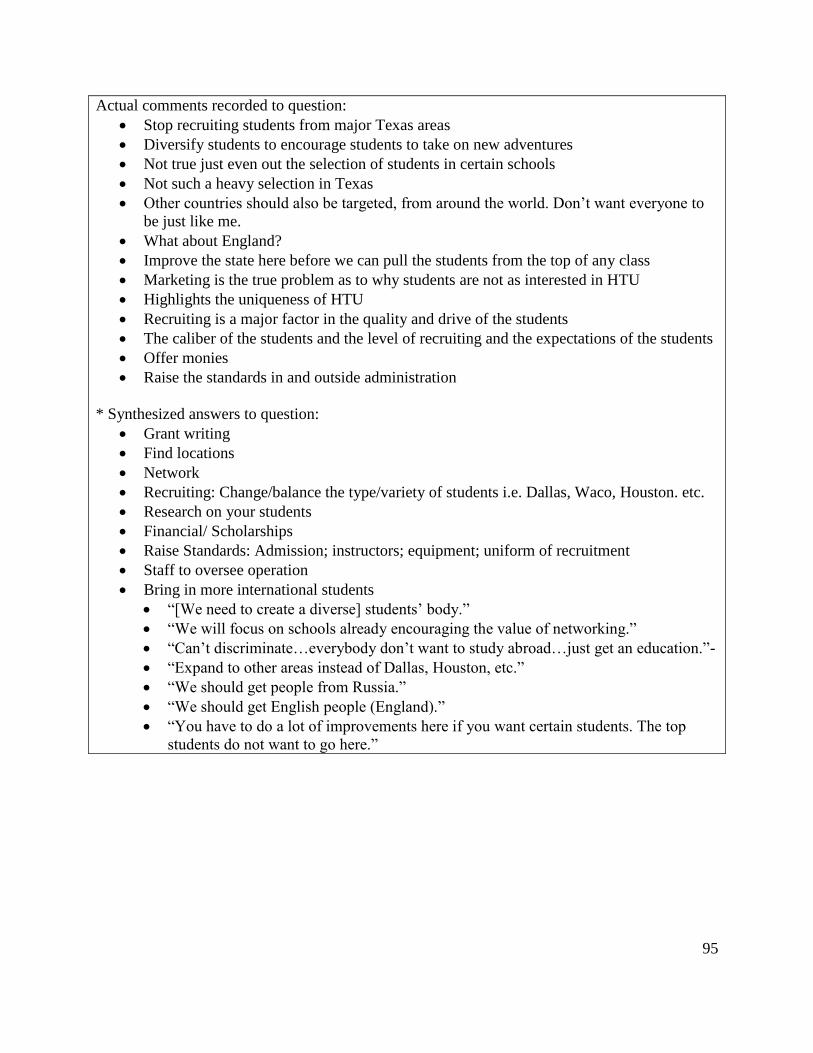
95
Actual comments recorded to question:
Stop recruiting students from major Texas areas
Diversify students to encourage students to take on new adventures
Not true just even out the selection of students in certain schools
Not such a heavy selection in Texas
Other countries should also be targeted, from around the world. Don‘t want everyone to
be just like me.
What about England?
Improve the state here before we can pull the students from the top of any class
Marketing is the true problem as to why students are not as interested in HTU
Highlights the uniqueness of HTU
Recruiting is a major factor in the quality and drive of the students
The caliber of the students and the level of recruiting and the expectations of the students
Offer monies
Raise the standards in and outside administration
* Synthesized answers to question:
Grant writing
Find locations
Network
Recruiting: Change/balance the type/variety of students i.e. Dallas, Waco, Houston. etc.
Research on your students
Financial/ Scholarships
Raise Standards: Admission; instructors; equipment; uniform of recruitment
Staff to oversee operation
Bring in more international students
―[We need to create a diverse] students‘ body.‖
―We will focus on schools already encouraging the value of networking.‖
―Can‘t discriminate…everybody don‘t want to study abroad…just get an education.‖-
―Expand to other areas instead of Dallas, Houston, etc.‖
―We should get people from Russia.‖
―We should get English people (England).‖
―You have to do a lot of improvements here if you want certain students. The top
students do not want to go here.‖

96
APPENDIX E: Data Tables
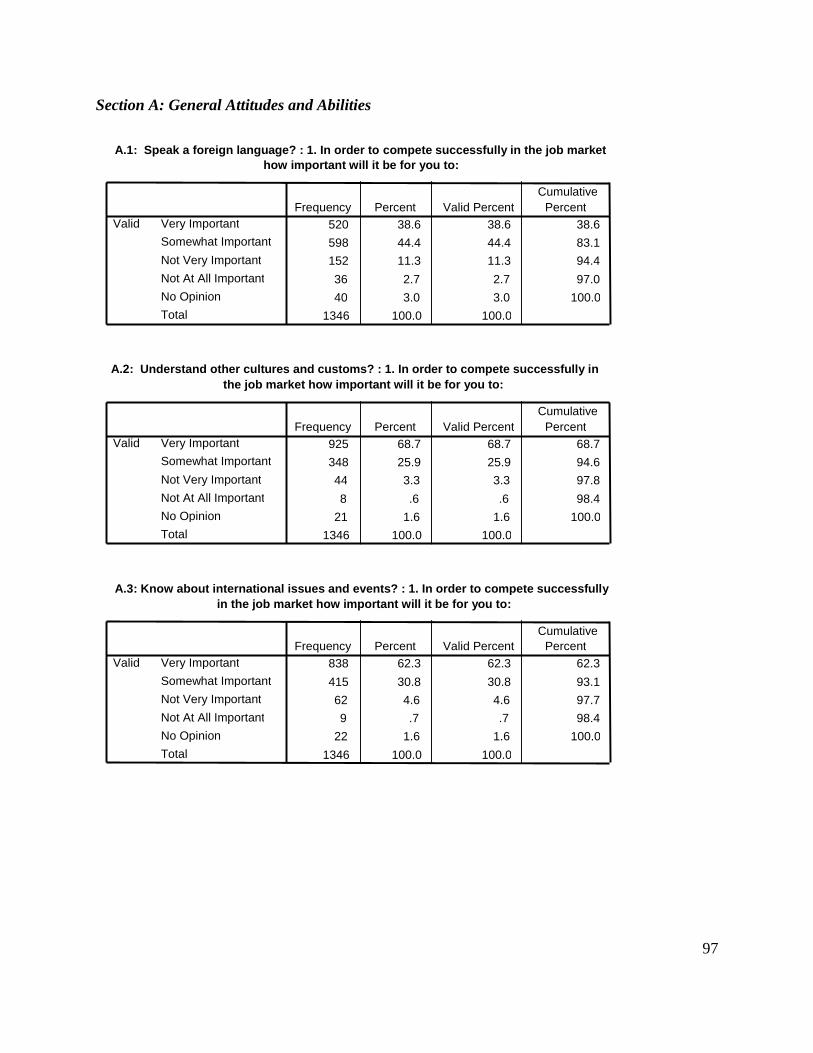
97
Section A: General Attitudes and Abilities
A.1: Speak a foreign language? : 1. In order to compete successfully in the job market how important will it be for you to:
520 38.6 38.6 38.6
598 44.4 44.4 83.1 152 11.3 11.3 94.4
36 2.7 2.7 97.0
40 3.0 3.0 100.0
1346 100.0 100.0
Very Important Somewhat Important
Not Very Important
Not At All Important
No Opinion
Total
Valid Frequency Percent Valid Percent
Cumulative Percent
A.2: Understand other cultures and customs? : 1. In order to compete successfully in the job market how important will it be for you to:
925 68.7 68.7 68.7
348 25.9 25.9 94.6 44 3.3 3.3 97.8
8 .6 .6 98.4
21 1.6 1.6 100.0
1346 100.0 100.0
Very Important Somewhat Important
Not Very Important
Not At All Important
No Opinion
Total
Valid Frequency Percent Valid Percent
Cumulative Percent
A.3: Know about international issues and events? : 1. In order to compete successfully in the job market how important will it be for you to:
838 62.3 62.3 62.3
415 30.8 30.8 93.1
62 4.6 4.6 97.7 9 .7 .7 98.4
22 1.6 1.6 100.0
1346 100.0 100.0
Very Important
Somewhat Important
Not Very Important
Not At All Important
No Opinion
Total
Valid Frequency Percent Valid Percent
Cumulative Percent
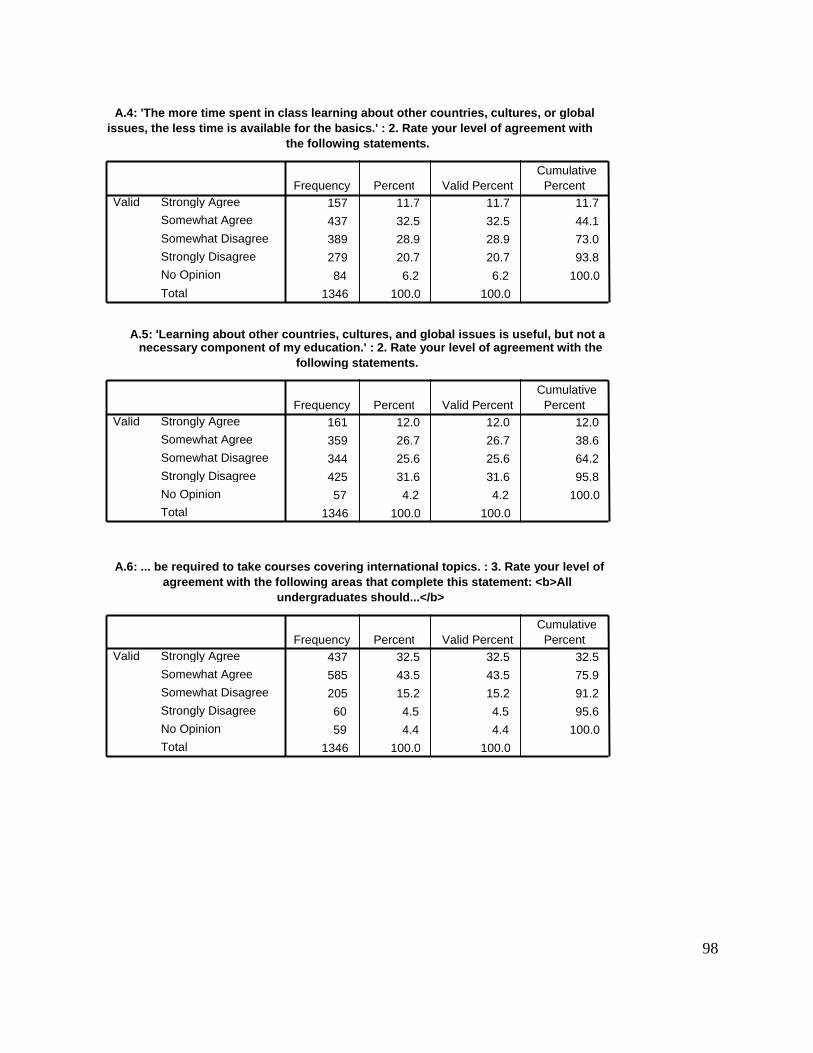
98
A.4: 'The more time spent in class learning about other countries, cultures, or global issues, the less time is available for the basics.' : 2. Rate your level of agreement with
the following statements.
157 11.7 11.7 11.7
437 32.5 32.5 44.1 389 28.9 28.9 73.0
279 20.7 20.7 93.8
84 6.2 6.2 100.0 1346 100.0 100.0
Strongly Agree Somewhat Agree
Somewhat Disagree Strongly Disagree No Opinion
Total
Valid Frequency Percent Valid Percent
Cumulative Percent
A.5: 'Learning about other countries, cultures, and global issues is useful, but not a necessary component of my education.' : 2. Rate your level of agreement with the
following statements.
161 12.0 12.0 12.0
359 26.7 26.7 38.6
344 25.6 25.6 64.2
425 31.6 31.6 95.8
57 4.2 4.2 100.0
1346 100.0 100.0
Strongly Agree
Somewhat Agree
Somewhat Disagree
Strongly Disagree
No Opinion Total
Valid Frequency Percent Valid Percent
Cumulative Percent
A.6: ... be required to take courses covering international topics. : 3. Rate your level of agreement with the following areas that complete this statement: <b>All
undergraduates should...</b>
437 32.5 32.5 32.5
585 43.5 43.5 75.9
205 15.2 15.2 91.2
60 4.5 4.5 95.6
59 4.4 4.4 100.0
1346 100.0 100.0
Strongly Agree
Somewhat Agree
Somewhat Disagree
Strongly Disagree
No Opinion
Total
Valid Frequency Percent Valid Percent
Cumulative Percent
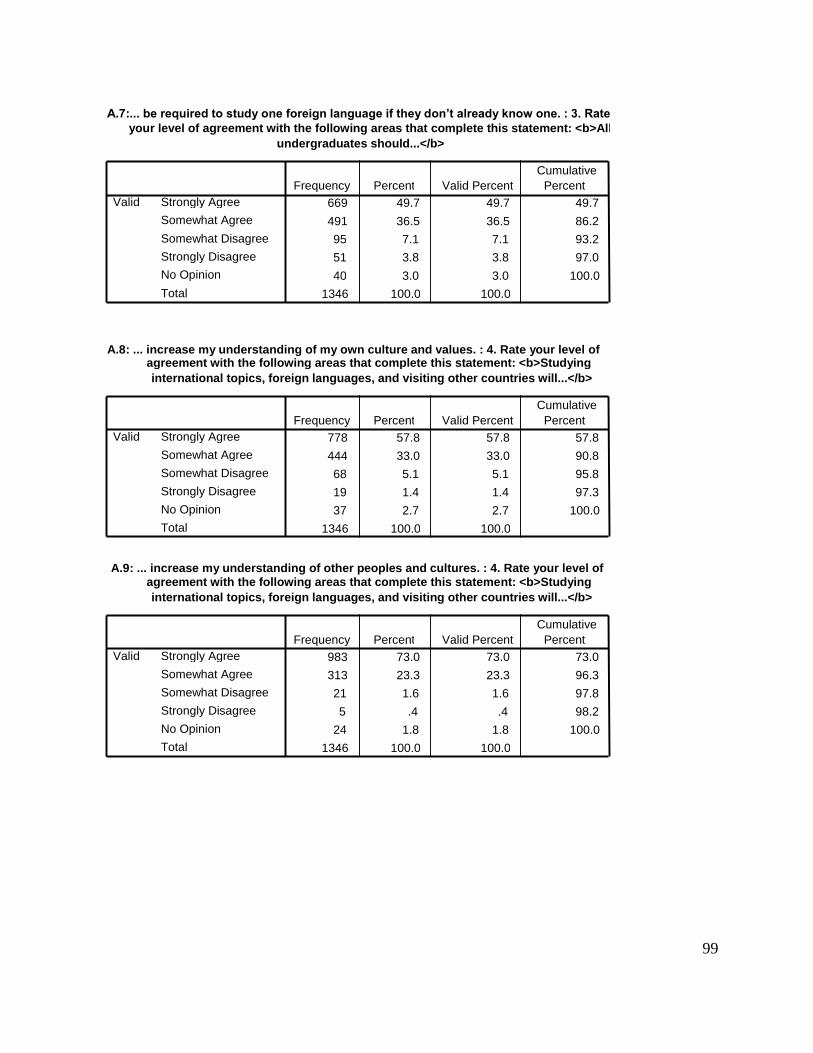
99
A.7:... be required to study one foreign language if they don’t already know one. : 3. Rate your level of agreement with the following areas that complete this statement: <b>All
undergraduates should...</b>
669 49.7 49.7 49.7
491 36.5 36.5 86.2 95 7.1 7.1 93.2
51 3.8 3.8 97.0
40 3.0 3.0 100.0 1346 100.0 100.0
Strongly Agree Somewhat Agree
Somewhat Disagree Strongly Disagree No Opinion
Total
Valid Frequency Percent Valid Percent
Cumulative Percent
A.8: ... increase my understanding of my own culture and values. : 4. Rate your level of agreement with the following areas that complete this statement: <b>Studying international topics, foreign languages, and visiting other countries will...</b>
778 57.8 57.8 57.8
444 33.0 33.0 90.8
68 5.1 5.1 95.8
19 1.4 1.4 97.3
37 2.7 2.7 100.0
1346 100.0 100.0
Strongly Agree
Somewhat Agree
Somewhat Disagree
Strongly Disagree
No Opinion
Total
Valid Frequency Percent Valid Percent
Cumulative Percent
A.9: ... increase my understanding of other peoples and cultures. : 4. Rate your level of agreement with the following areas that complete this statement: <b>Studying international topics, foreign languages, and visiting other countries will...</b>
983 73.0 73.0 73.0
313 23.3 23.3 96.3
21 1.6 1.6 97.8
5 .4 .4 98.2
24 1.8 1.8 100.0
1346 100.0 100.0
Strongly Agree
Somewhat Agree
Somewhat Disagree
Strongly Disagree
No Opinion
Total
Valid Frequency Percent Valid Percent
Cumulative Percent
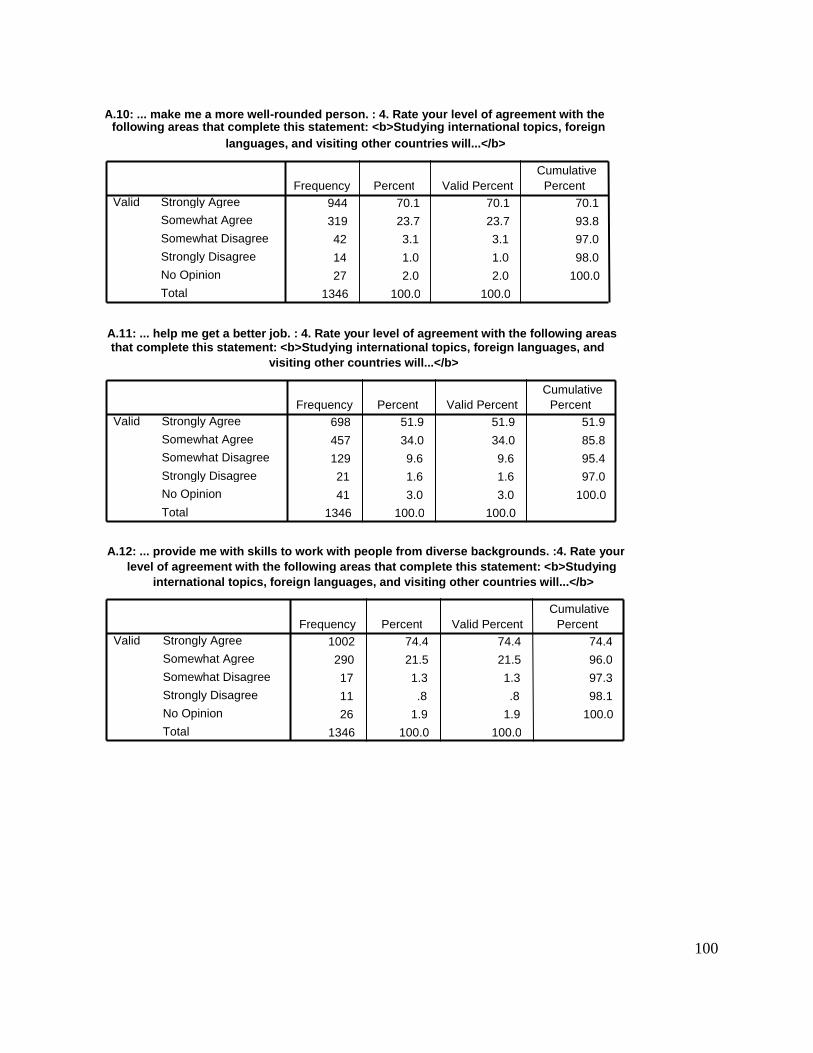
100
A.10: ... make me a more well-rounded person. : 4. Rate your level of agreement with the following areas that complete this statement: <b>Studying international topics, foreign
languages, and visiting other countries will...</b>
944 70.1 70.1 70.1
319 23.7 23.7 93.8 42 3.1 3.1 97.0
14 1.0 1.0 98.0
27 2.0 2.0 100.0 1346 100.0 100.0
Strongly Agree Somewhat Agree
Somewhat Disagree
Strongly Disagree
No Opinion
Total
Valid Frequency Percent Valid Percent
Cumulative Percent
A.11: ... help me get a better job. : 4. Rate your level of agreement with the following areas that complete this statement: <b>Studying international topics, foreign languages, and
visiting other countries will...</b>
698 51.9 51.9 51.9
457 34.0 34.0 85.8
129 9.6 9.6 95.4 21 1.6 1.6 97.0
41 3.0 3.0 100.0 1346 100.0 100.0
Strongly Agree
Somewhat Agree Somewhat Disagree
Strongly Disagree No Opinion
Total
Valid Frequency Percent Valid Percent
Cumulative Percent
A.12: ... provide me with skills to work with people from diverse backgrounds. :4. Rate your level of agreement with the following areas that complete this statement: <b>Studying
international topics, foreign languages, and visiting other countries will...</b>
1002 74.4 74.4 74.4
290 21.5 21.5 96.0
17 1.3 1.3 97.3
11 .8 .8 98.1
26 1.9 1.9 100.0
1346 100.0 100.0
Strongly Agree
Somewhat Agree
Somewhat Disagree
Strongly Disagree
No Opinion
Total
Valid Frequency Percent Valid Percent
Cumulative Percent
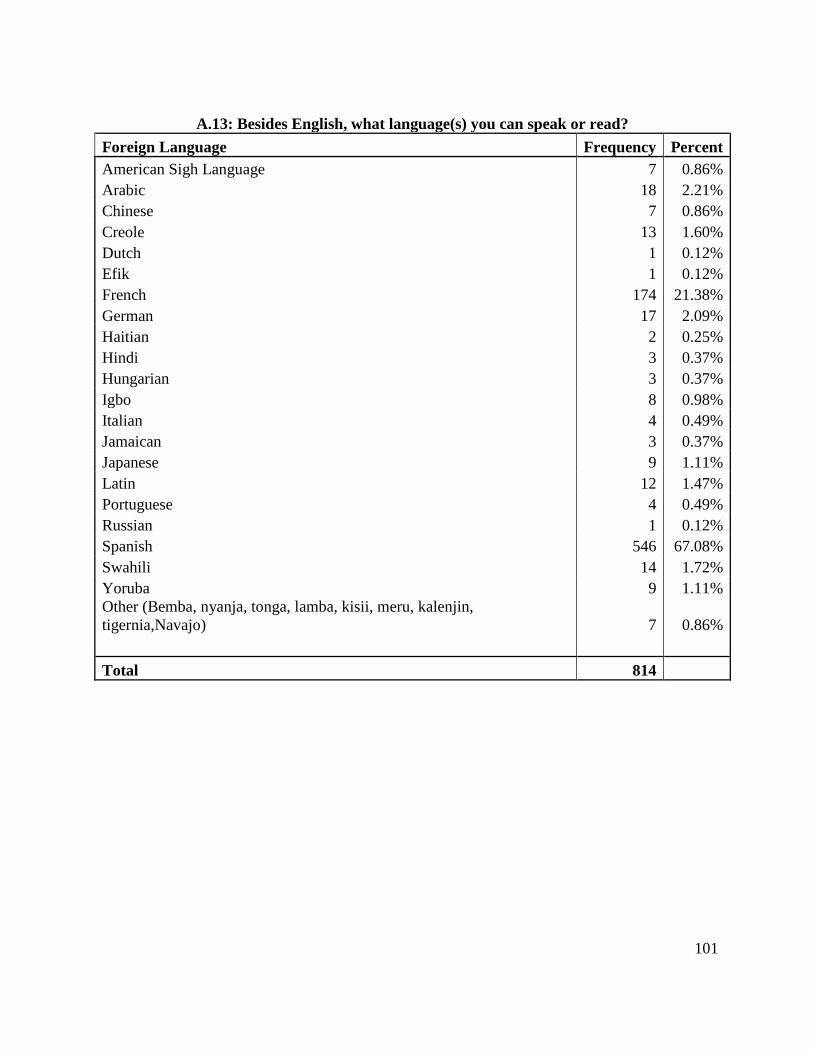
101
A.13: Besides English, what language(s) you can speak or read?
Foreign Language Frequency Percent
American Sigh Language 7 0.86%
Arabic 18 2.21%
Chinese 7 0.86%
Creole 13 1.60%
Dutch 1 0.12%
Efik 1 0.12%
French 174 21.38%
German 17 2.09%
Haitian 2 0.25%
Hindi 3 0.37%
Hungarian 3 0.37%
Igbo 8 0.98%
Italian 4 0.49%
Jamaican 3 0.37%
Japanese 9 1.11%
Latin 12 1.47%
Portuguese 4 0.49%
Russian 1 0.12%
Spanish 546 67.08%
Swahili 14 1.72%
Yoruba 9 1.11%
Other (Bemba, nyanja, tonga, lamba, kisii, meru, kalenjin,
tigernia,Navajo) 7 0.86%
Total 814
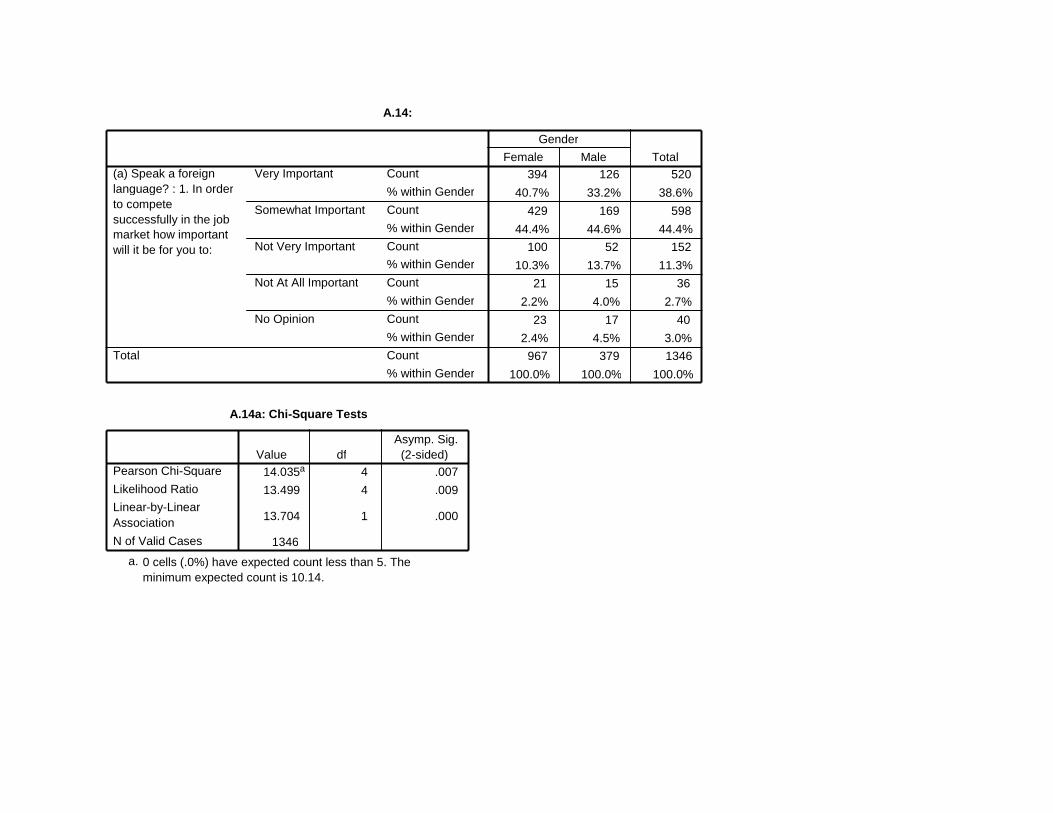
A.14:
394 126 520
40.7% 33.2% 38.6%
429 169 598
44.4% 44.6% 44.4% 100 52 152
10.3% 13.7% 11.3% 21 15 36
2.2% 4.0% 2.7%
23 17 40
2.4% 4.5% 3.0% 967 379 1346
100.0% 100.0% 100.0%
Count
% within Gender
Count
% within Gender
Count % within Gender
Count
% within Gender
Count
% within Gender
Count % within Gender
Very Important
Somewhat Important
Not Very Important
Not At All Important
No Opinion
(a) Speak a foreign language? : 1. In order to compete successfully in the job market how important will it be for you to:
Total
Female Male Gender
Total
A.14a: Chi-Square Tests
14.035 a 4 .007
13.499 4 .009
13.704 1 .000
1346
Pearson Chi-Square
Likelihood Ratio Linear-by-Linear Association
N of Valid Cases
Value df Asymp. Sig.
(2-sided)
0 cells (.0%) have expected count less than 5. The minimum expected count is 10.14.
a.
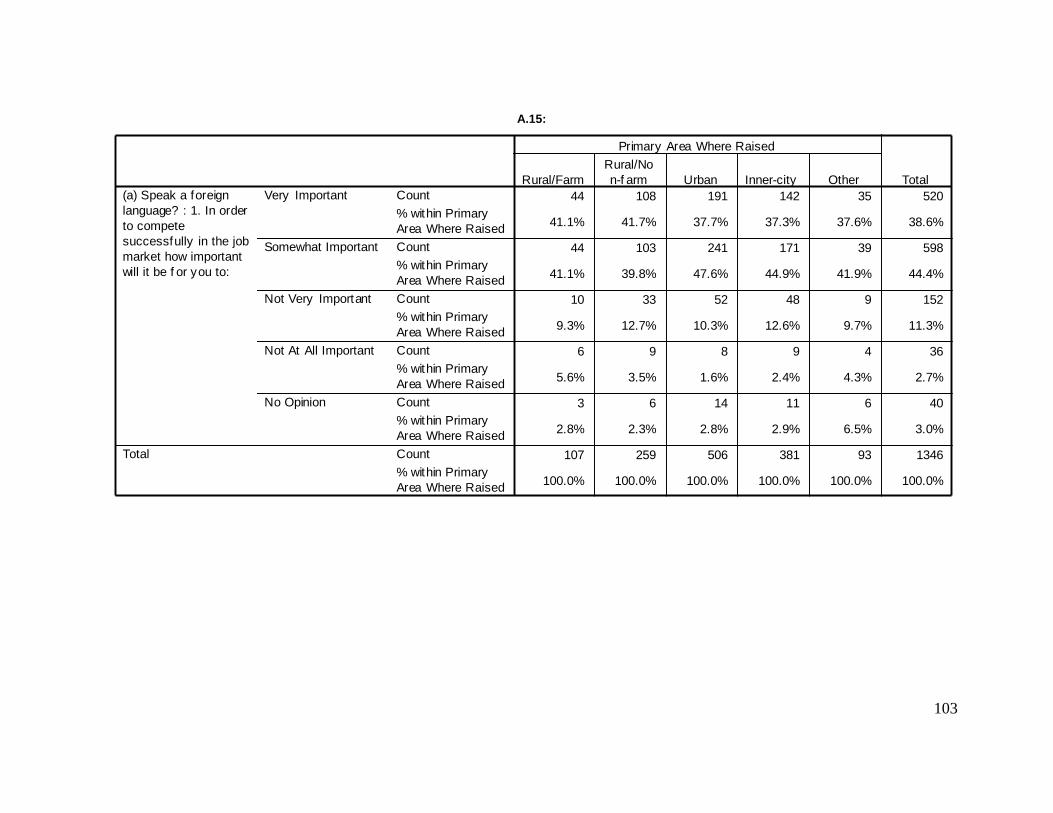
103
Crosstab
44 108 191 142 35 520
41.1% 41.7% 37.7% 37.3% 37.6% 38.6%
44 103 241 171 39 598
41.1% 39.8% 47.6% 44.9% 41.9% 44.4%
10 33 52 48 9 152
9.3% 12.7% 10.3% 12.6% 9.7% 11.3%
6 9 8 9 4 36
5.6% 3.5% 1.6% 2.4% 4.3% 2.7%
3 6 14 11 6 40
2.8% 2.3% 2.8% 2.9% 6.5% 3.0%
107 259 506 381 93 1346
100.0% 100.0% 100.0% 100.0% 100.0% 100.0%
Count
% within Primary
Area Where Raised
Count
% within Primary
Area Where Raised
Count
% within Primary
Area Where Raised
Count
% within Primary
Area Where Raised
Count
% within Primary
Area Where Raised
Count
% within Primary
Area Where Raised
Very Important
Somewhat Important
Not Very Important
Not At All Important
No Opinion
(a) Speak a foreign
language? : 1. In order
to compete
successfully in the job
market how important
will it be f or you to:
Total
Rural/Farm
Rural/No
n-f arm Urban Inner-city Other
Primary Area Where Raised
Total
A.15:

104
A.16:
270 250 520
42.0% 35.6% 38.6%
267 331 598
41.5% 47.1% 44.4%
67 85 152
10.4% 12.1% 11.3%
16 20 36
2.5% 2.8% 2.7%
23 17 40
3.6% 2.4% 3.0%
643 703 1346
100.0% 100.0% 100.0%
Count
% within First Generation College Student
Count
% within First Generation College Student
Count
% within First Generation College Student
Count
% within First Generation College Student
Count
% within First Generation College Student
Count
% within First Generation College Student
Very Important
Somewhat Important
Not Very Important
Not At All Important
No Opinion
(a) Speak a foreign language? : 1. In order to compete successfully in the job market how important will it be for you to:
Total
Yes No
First Generation College Student
Total

105
A.16a: Chi-Square Tests
8.437 a 4 .077 8.442 4 .077
1.116 1 .291
1346
Pearson Chi-Square
Likelihood Ratio
Linear-by-Linear Association
N of Valid Cases
Value df Asymp. Sig.
(2-sided)
0 cells (.0%) have expected count less than 5. The minimum expected count is 17.20.
a.
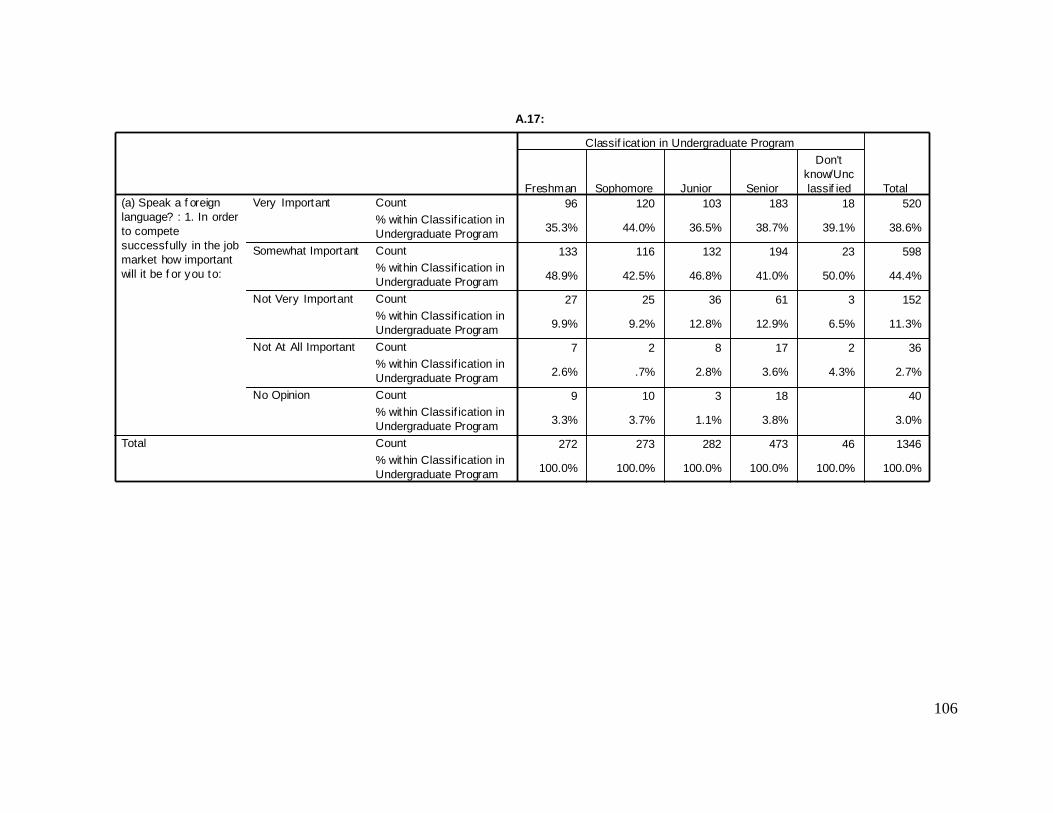
106
Crosstab
96 120 103 183 18 520
35.3% 44.0% 36.5% 38.7% 39.1% 38.6%
133 116 132 194 23 598
48.9% 42.5% 46.8% 41.0% 50.0% 44.4%
27 25 36 61 3 152
9.9% 9.2% 12.8% 12.9% 6.5% 11.3%
7 2 8 17 2 36
2.6% .7% 2.8% 3.6% 4.3% 2.7%
9 10 3 18 40
3.3% 3.7% 1.1% 3.8% 3.0%
272 273 282 473 46 1346
100.0% 100.0% 100.0% 100.0% 100.0% 100.0%
Count
% within Classif ication in
Undergraduate Program
Count
% within Classif ication in
Undergraduate Program
Count
% within Classif ication in
Undergraduate Program
Count
% within Classif ication in
Undergraduate Program
Count
% within Classif ication in
Undergraduate Program
Count
% within Classif ication in
Undergraduate Program
Very Important
Somewhat Important
Not Very Important
Not At All Important
No Opinion
(a) Speak a f oreign
language? : 1. In order
to compete
successfully in the job
market how important
will it be f or you to:
Total
Freshman Sophomore Junior Senior
Don't
know/Unc
lassif ied
Classif icat ion in Undergraduate Program
Total
A.17:
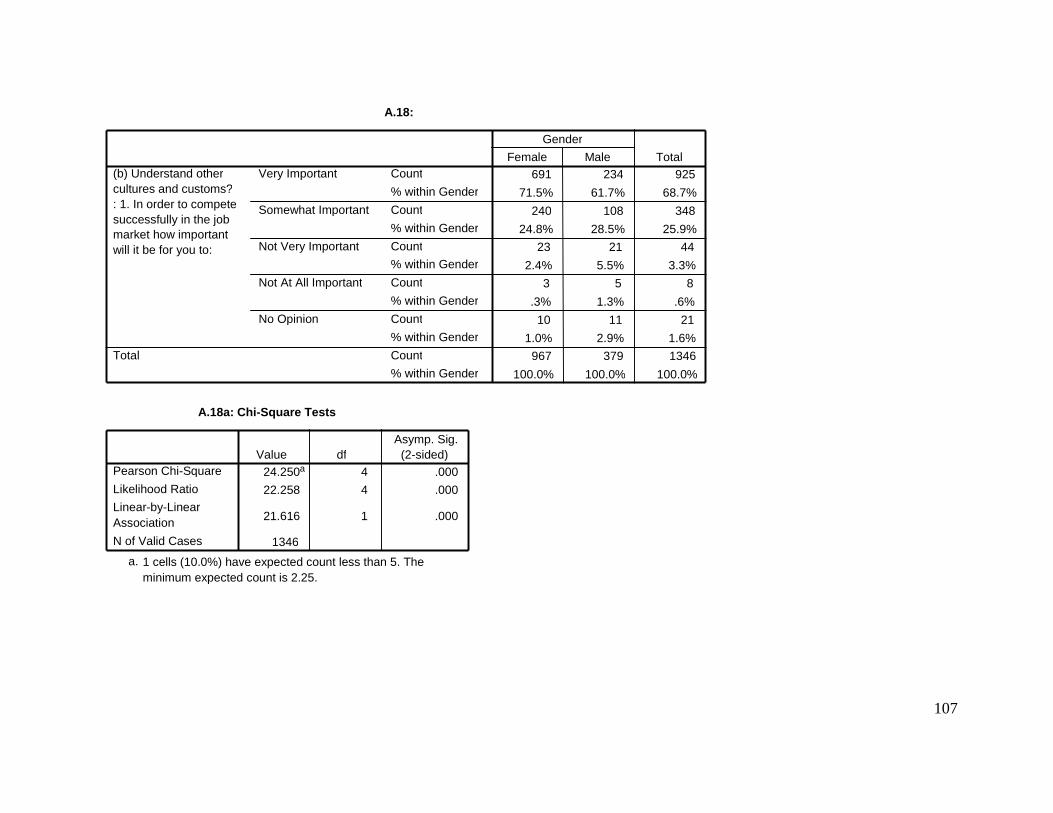
107
A.18:
691 234 925
71.5% 61.7% 68.7%
240 108 348
24.8% 28.5% 25.9% 23 21 44
2.4% 5.5% 3.3% 3 5 8
.3% 1.3% .6%
10 11 21
1.0% 2.9% 1.6% 967 379 1346
100.0% 100.0% 100.0%
Count
% within Gender
Count
% within Gender
Count % within Gender
Count
% within Gender
Count
% within Gender
Count % within Gender
Very Important
Somewhat Important
Not Very Important
Not At All Important
No Opinion
(b) Understand other cultures and customs? : 1. In order to compete successfully in the job market how important will it be for you to:
Total
Female Male Gender
Total
A.18a: Chi-Square Tests
24.250 a 4 .000 22.258 4 .000
21.616 1 .000
1346
Pearson Chi-Square
Likelihood Ratio Linear-by-Linear Association
N of Valid Cases
Value df Asymp. Sig.
(2-sided)
1 cells (10.0%) have expected count less than 5. The minimum expected count is 2.25.
a.
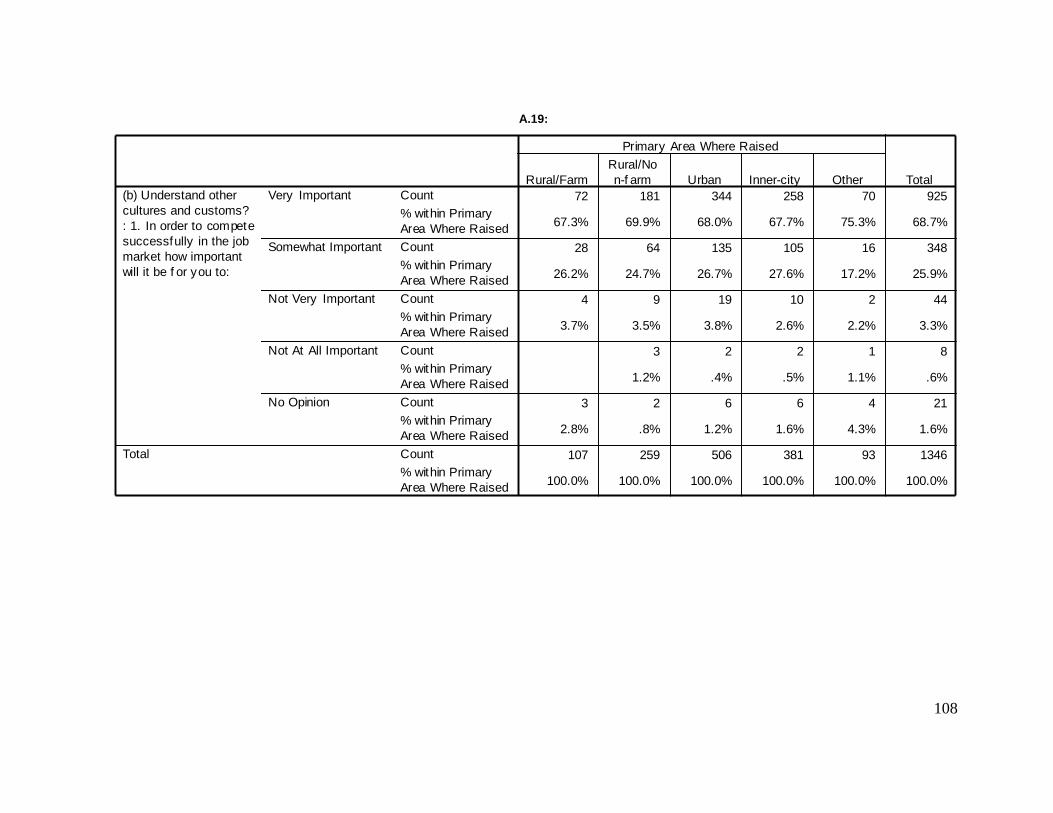
108
Crosstab
72 181 344 258 70 925
67.3% 69.9% 68.0% 67.7% 75.3% 68.7%
28 64 135 105 16 348
26.2% 24.7% 26.7% 27.6% 17.2% 25.9%
4 9 19 10 2 44
3.7% 3.5% 3.8% 2.6% 2.2% 3.3%
3 2 2 1 8
1.2% .4% .5% 1.1% .6%
3 2 6 6 4 21
2.8% .8% 1.2% 1.6% 4.3% 1.6%
107 259 506 381 93 1346
100.0% 100.0% 100.0% 100.0% 100.0% 100.0%
Count
% within Primary
Area Where Raised
Count
% within Primary
Area Where Raised
Count
% within Primary
Area Where Raised
Count
% within Primary
Area Where Raised
Count
% within Primary
Area Where Raised
Count
% within Primary
Area Where Raised
Very Important
Somewhat Important
Not Very Important
Not At All Important
No Opinion
(b) Understand other
cultures and customs?
: 1. In order to compete
successfully in the job
market how important
will it be f or you to:
Total
Rural/Farm
Rural/No
n-f arm Urban Inner-city Other
Primary Area Where Raised
Total
A.19:
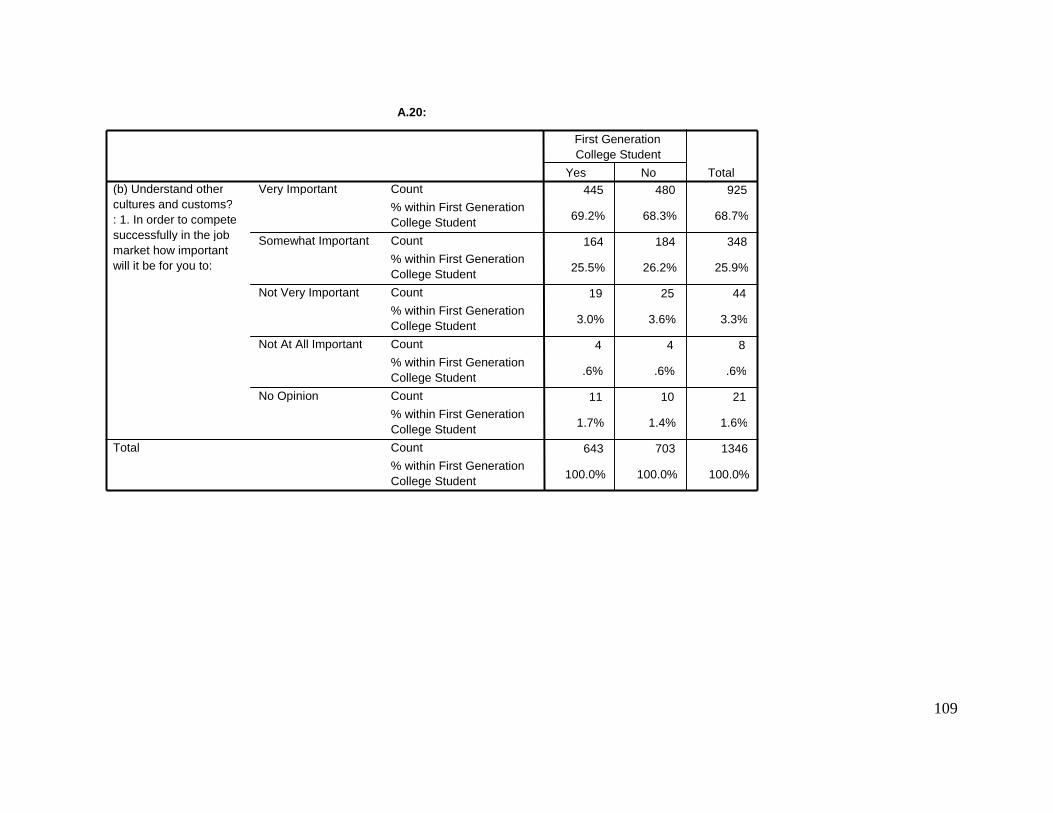
109
A.20:
445 480 925
69.2% 68.3% 68.7%
164 184 348
25.5% 26.2% 25.9%
19 25 44
3.0% 3.6% 3.3%
4 4 8
.6% .6% .6%
11 10 21
1.7% 1.4% 1.6%
643 703 1346
100.0% 100.0% 100.0%
Count
% within First Generation College Student
Count
% within First Generation College Student
Count
% within First Generation College Student
Count
% within First Generation College Student
Count
% within First Generation College Student
Count
% within First Generation College Student
Very Important
Somewhat Important
Not Very Important
Not At All Important
No Opinion
(b) Understand other cultures and customs? : 1. In order to compete successfully in the job market how important will it be for you to:
Total
Yes No
First Generation College Student
Total
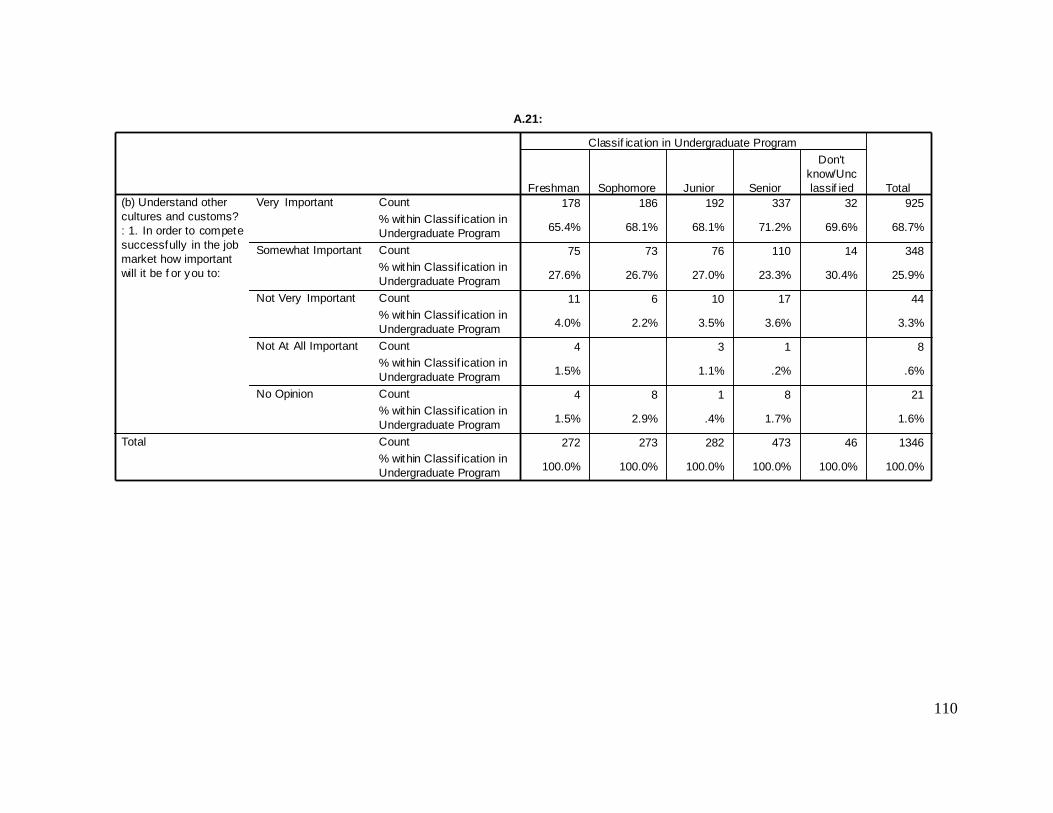
110
Crosstab
178 186 192 337 32 925
65.4% 68.1% 68.1% 71.2% 69.6% 68.7%
75 73 76 110 14 348
27.6% 26.7% 27.0% 23.3% 30.4% 25.9%
11 6 10 17 44
4.0% 2.2% 3.5% 3.6% 3.3%
4 3 1 8
1.5% 1.1% .2% .6%
4 8 1 8 21
1.5% 2.9% .4% 1.7% 1.6%
272 273 282 473 46 1346
100.0% 100.0% 100.0% 100.0% 100.0% 100.0%
Count
% within Classif ication in
Undergraduate Program
Count
% within Classif ication in
Undergraduate Program
Count
% within Classif ication in
Undergraduate Program
Count
% within Classif ication in
Undergraduate Program
Count
% within Classif ication in
Undergraduate Program
Count
% within Classif ication in
Undergraduate Program
Very Important
Somewhat Important
Not Very Important
Not At All Important
No Opinion
(b) Understand other
cultures and customs?
: 1. In order to compete
successfully in the job
market how important
will it be f or you to:
Total
Freshman Sophomore Junior Senior
Don't
know/Unc
lassif ied
Classif icat ion in Undergraduate Program
Total
A.21:
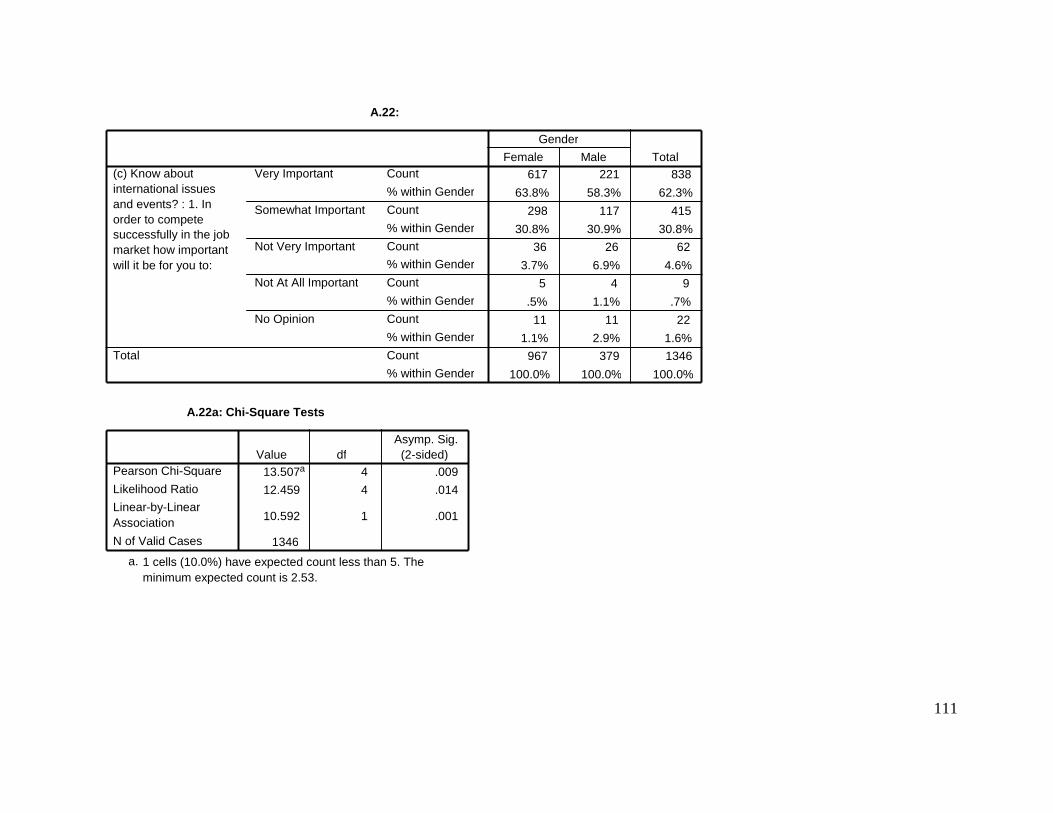
111
A.22:
617 221 838
63.8% 58.3% 62.3%
298 117 415
30.8% 30.9% 30.8% 36 26 62
3.7% 6.9% 4.6% 5 4 9
.5% 1.1% .7%
11 11 22
1.1% 2.9% 1.6% 967 379 1346
100.0% 100.0% 100.0%
Count
% within Gender
Count
% within Gender
Count % within Gender
Count
% within Gender
Count
% within Gender
Count % within Gender
Very Important
Somewhat Important
Not Very Important
Not At All Important
No Opinion
(c) Know about international issues and events? : 1. In order to compete successfully in the job market how important will it be for you to:
Total
Female Male Gender
Total
A.22a: Chi-Square Tests
13.507 a 4 .009 12.459 4 .014
10.592 1 .001
1346
Pearson Chi-Square
Likelihood Ratio Linear-by-Linear Association
N of Valid Cases
Value df Asymp. Sig.
(2-sided)
1 cells (10.0%) have expected count less than 5. The minimum expected count is 2.53.
a.
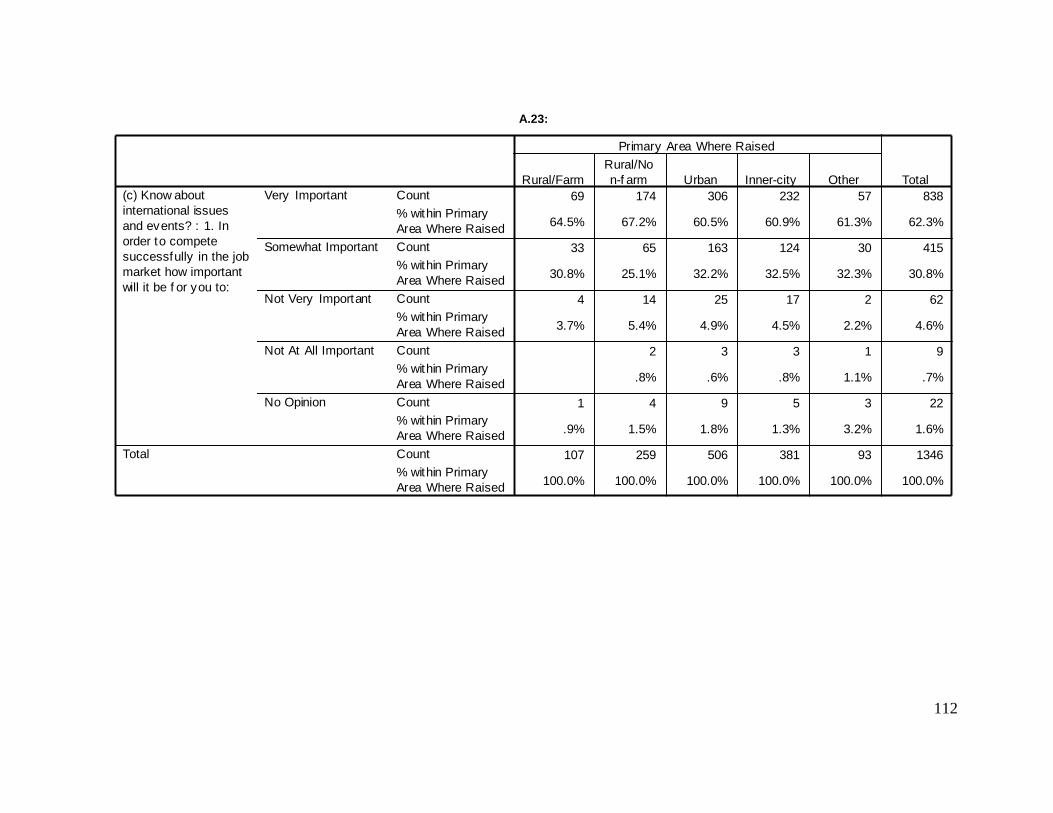
112
Crosstab
69 174 306 232 57 838
64.5% 67.2% 60.5% 60.9% 61.3% 62.3%
33 65 163 124 30 415
30.8% 25.1% 32.2% 32.5% 32.3% 30.8%
4 14 25 17 2 62
3.7% 5.4% 4.9% 4.5% 2.2% 4.6%
2 3 3 1 9
.8% .6% .8% 1.1% .7%
1 4 9 5 3 22
.9% 1.5% 1.8% 1.3% 3.2% 1.6%
107 259 506 381 93 1346
100.0% 100.0% 100.0% 100.0% 100.0% 100.0%
Count
% within Primary
Area Where Raised
Count
% within Primary
Area Where Raised
Count
% within Primary
Area Where Raised
Count
% within Primary
Area Where Raised
Count
% within Primary
Area Where Raised
Count
% within Primary
Area Where Raised
Very Important
Somewhat Important
Not Very Important
Not At All Important
No Opinion
(c) Know about
international issues
and events? : 1. In
order to compete
successfully in the job
market how important
will it be f or you to:
Total
Rural/Farm
Rural/No
n-f arm Urban Inner-city Other
Primary Area Where Raised
Total
A.23:
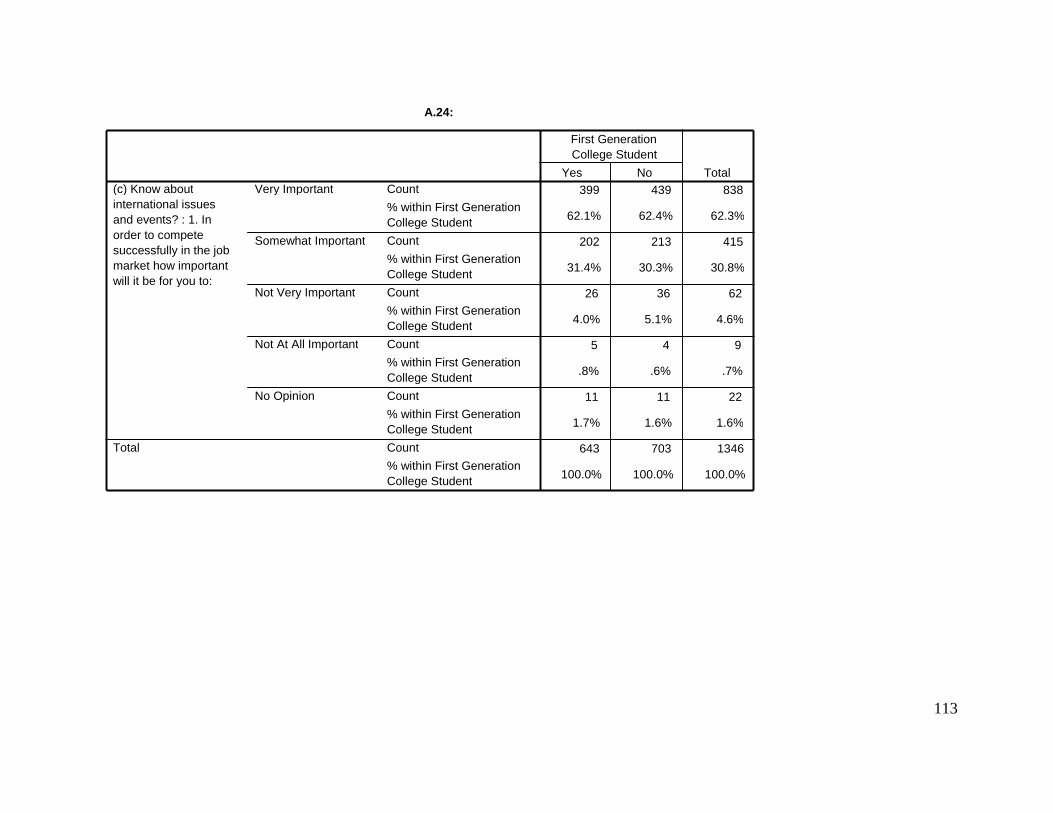
113
A.24:
399 439 838
62.1% 62.4% 62.3%
202 213 415
31.4% 30.3% 30.8%
26 36 62
4.0% 5.1% 4.6%
5 4 9
.8% .6% .7%
11 11 22
1.7% 1.6% 1.6%
643 703 1346
100.0% 100.0% 100.0%
Count
% within First Generation College Student
Count
% within First Generation College Student
Count
% within First Generation College Student
Count
% within First Generation College Student
Count
% within First Generation College Student
Count
% within First Generation College Student
Very Important
Somewhat Important
Not Very Important
Not At All Important
No Opinion
(c) Know about international issues and events? : 1. In order to compete successfully in the job market how important will it be for you to:
Total
Yes No
First Generation College Student
Total
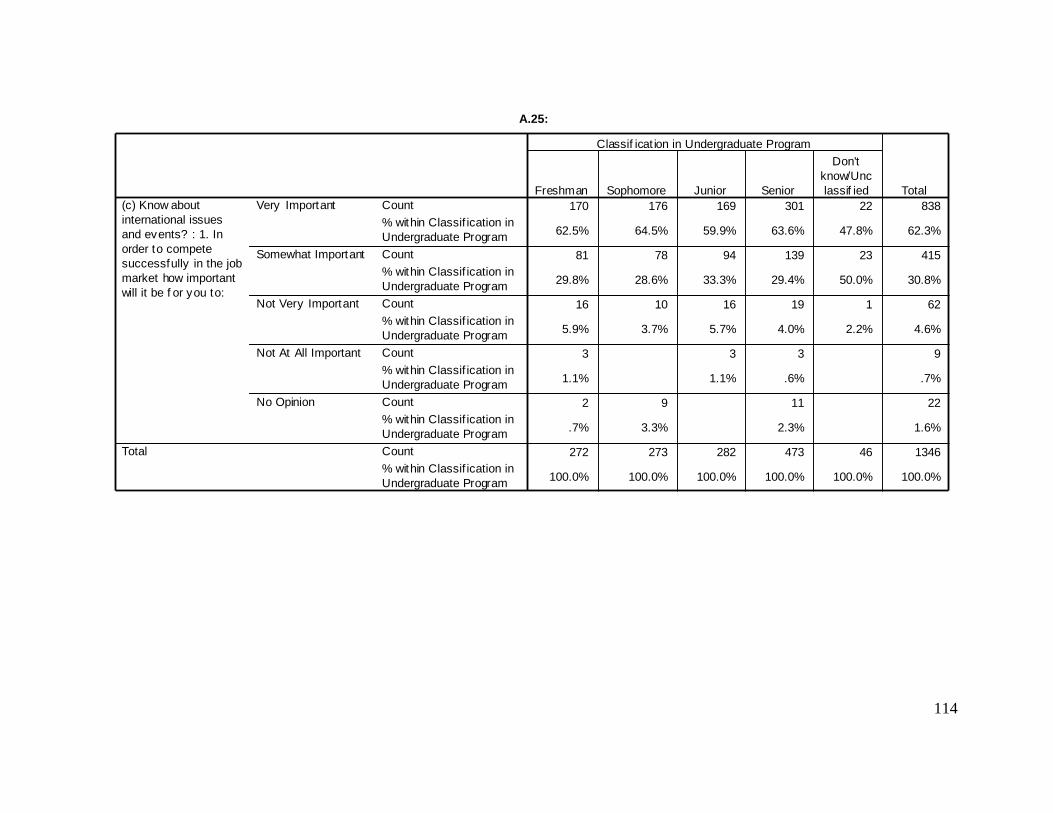
114
Crosstab
170 176 169 301 22 838
62.5% 64.5% 59.9% 63.6% 47.8% 62.3%
81 78 94 139 23 415
29.8% 28.6% 33.3% 29.4% 50.0% 30.8%
16 10 16 19 1 62
5.9% 3.7% 5.7% 4.0% 2.2% 4.6%
3 3 3 9
1.1% 1.1% .6% .7%
2 9 11 22
.7% 3.3% 2.3% 1.6%
272 273 282 473 46 1346
100.0% 100.0% 100.0% 100.0% 100.0% 100.0%
Count
% within Classif ication in
Undergraduate Program
Count
% within Classif ication in
Undergraduate Program
Count
% within Classif ication in
Undergraduate Program
Count
% within Classif ication in
Undergraduate Program
Count
% within Classif ication in
Undergraduate Program
Count
% within Classif ication in
Undergraduate Program
Very Important
Somewhat Important
Not Very Important
Not At All Important
No Opinion
(c) Know about
international issues
and events? : 1. In
order to compete
successfully in the job
market how important
will it be f or you to:
Total
Freshman Sophomore Junior Senior
Don't
know/Unc
lassif ied
Classif icat ion in Undergraduate Program
Total
A.25:
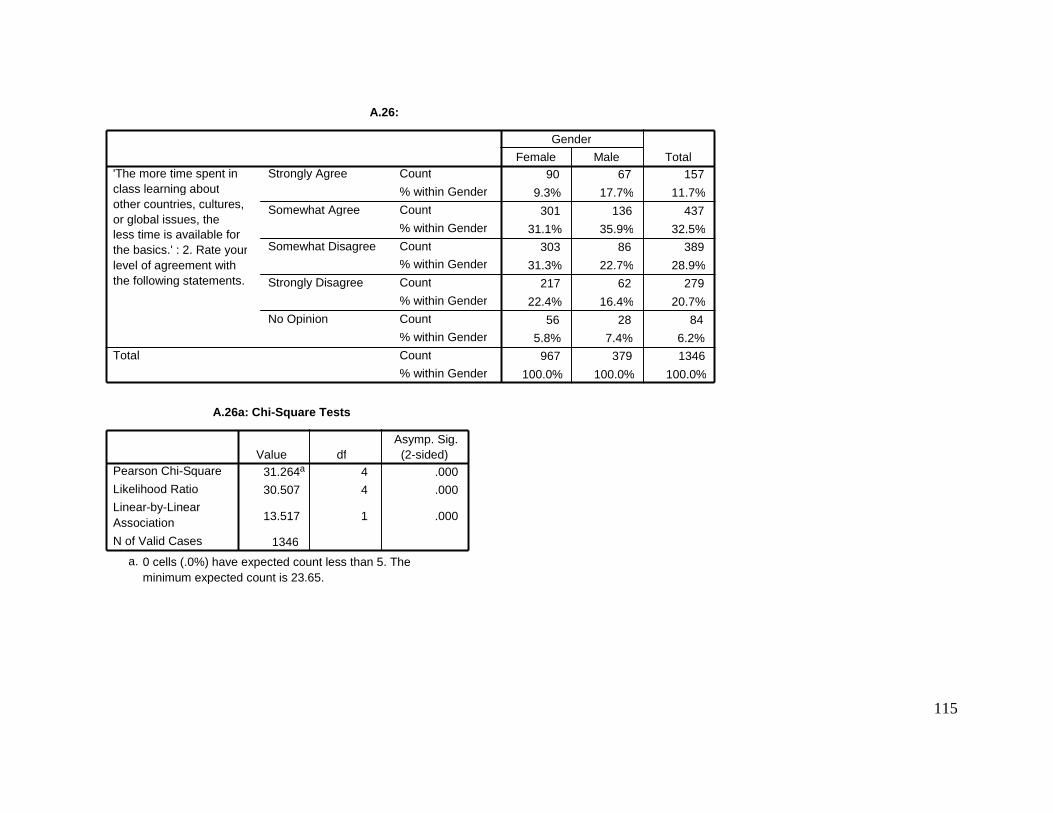
115
A.26:
90 67 157
9.3% 17.7% 11.7%
301 136 437
31.1% 35.9% 32.5% 303 86 389
31.3% 22.7% 28.9% 217 62 279
22.4% 16.4% 20.7%
56 28 84
5.8% 7.4% 6.2% 967 379 1346
100.0% 100.0% 100.0%
Count
% within Gender
Count
% within Gender
Count % within Gender
Count
% within Gender
Count
% within Gender
Count % within Gender
Strongly Agree
Somewhat Agree
Somewhat Disagree
Strongly Disagree
No Opinion
'The more time spent in class learning about other countries, cultures, or global issues, the less time is available for the basics.' : 2. Rate your level of agreement with the following statements.
Total
Female Male Gender
Total
A.26a: Chi-Square Tests
31.264 a 4 .000 30.507 4 .000
13.517 1 .000
1346
Pearson Chi-Square
Likelihood Ratio Linear-by-Linear Association
N of Valid Cases
Value df Asymp. Sig.
(2-sided)
0 cells (.0%) have expected count less than 5. The minimum expected count is 23.65.
a.

116
Crosstab
18 29 48 52 10 157
16.8% 11.2% 9.5% 13.6% 10.8% 11.7%
45 97 157 111 27 437
42.1% 37.5% 31.0% 29.1% 29.0% 32.5%
26 67 153 123 20 389
24.3% 25.9% 30.2% 32.3% 21.5% 28.9%
12 55 113 72 27 279
11.2% 21.2% 22.3% 18.9% 29.0% 20.7%
6 11 35 23 9 84
5.6% 4.2% 6.9% 6.0% 9.7% 6.2%
107 259 506 381 93 1346
100.0% 100.0% 100.0% 100.0% 100.0% 100.0%
Count
% within Primary
Area Where Raised
Count
% within Primary
Area Where Raised
Count
% within Primary
Area Where Raised
Count
% within Primary
Area Where Raised
Count
% within Primary
Area Where Raised
Count
% within Primary
Area Where Raised
Strongly Agree
Somewhat Agree
Somewhat Disagree
Strongly Disagree
No Opinion
'The more time spent in
class learning about
other countries, cultures,
or global issues, the
less time is available f or
the basics.' : 2. Rate y our
level of agreement with
the f ollowing statements.
Total
Rural/Farm
Rural/No
n-f arm Urban Inner-city Other
Primary Area Where Raised
Total
A.27:
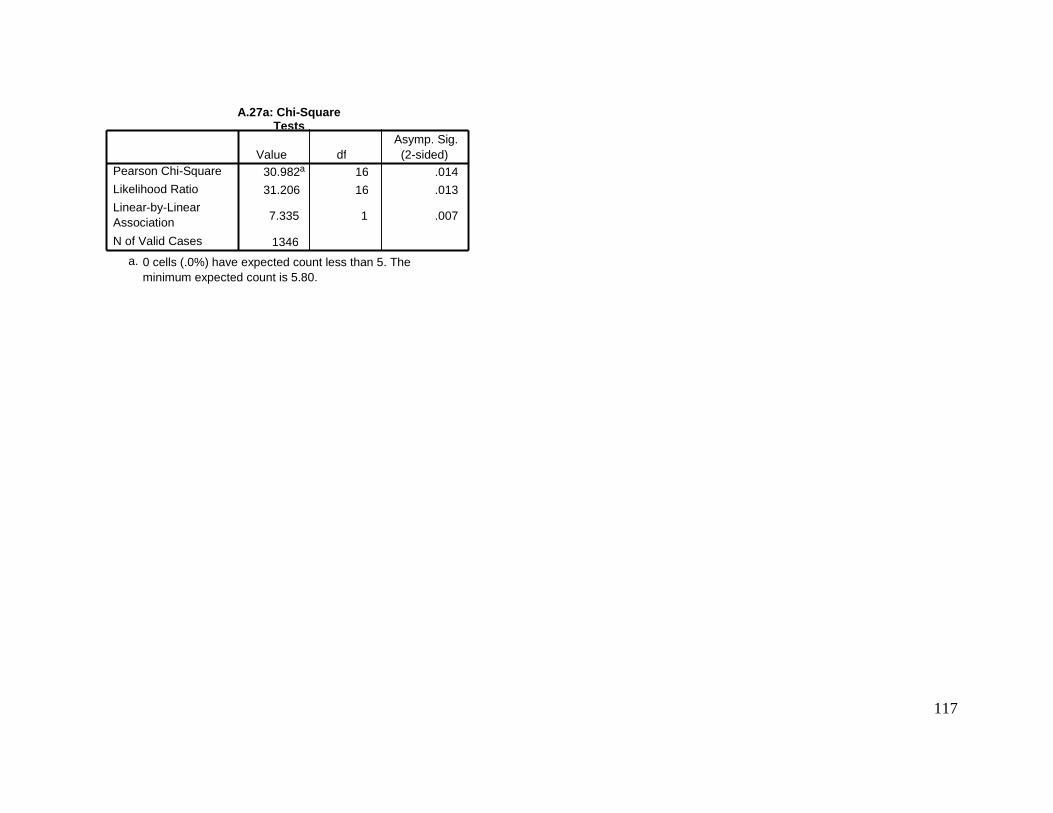
117
A.27a: Chi-Square Tests
30.982 a 16 .014 31.206 16 .013
7.335 1 .007
1346
Pearson Chi-Square
Likelihood Ratio
Linear-by-Linear Association
N of Valid Cases
Value df Asymp. Sig.
(2-sided)
0 cells (.0%) have expected count less than 5. The minimum expected count is 5.80.
a.
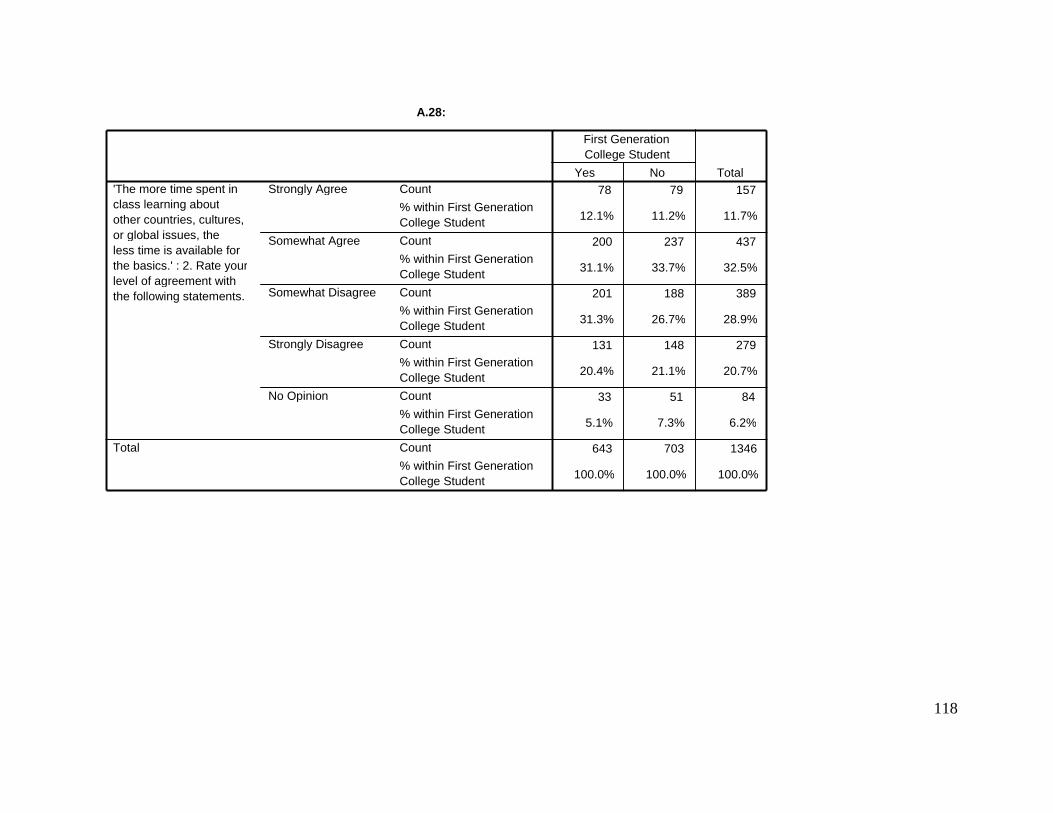
118
A.28:
78 79 157
12.1% 11.2% 11.7%
200 237 437
31.1% 33.7% 32.5%
201 188 389
31.3% 26.7% 28.9%
131 148 279
20.4% 21.1% 20.7%
33 51 84
5.1% 7.3% 6.2%
643 703 1346
100.0% 100.0% 100.0%
Count
% within First Generation College Student
Count
% within First Generation College Student
Count
% within First Generation College Student
Count
% within First Generation College Student
Count
% within First Generation College Student
Count
% within First Generation College Student
Strongly Agree
Somewhat Agree
Somewhat Disagree
Strongly Disagree
No Opinion
'The more time spent in class learning about other countries, cultures, or global issues, the less time is available for the basics.' : 2. Rate your level of agreement with the following statements.
Total
Yes No
First Generation College Student
Total

119
Crosstab
34 27 32 57 7 157
12.5% 9.9% 11.3% 12.1% 15.2% 11.7%
100 86 96 145 10 437
36.8% 31.5% 34.0% 30.7% 21.7% 32.5%
80 80 80 137 12 389
29.4% 29.3% 28.4% 29.0% 26.1% 28.9%
40 56 59 109 15 279
14.7% 20.5% 20.9% 23.0% 32.6% 20.7%
18 24 15 25 2 84
6.6% 8.8% 5.3% 5.3% 4.3% 6.2%
272 273 282 473 46 1346
100.0% 100.0% 100.0% 100.0% 100.0% 100.0%
Count
% within Classif ication in
Undergraduate Program
Count
% within Classif ication in
Undergraduate Program
Count
% within Classif ication in
Undergraduate Program
Count
% within Classif ication in
Undergraduate Program
Count
% within Classif ication in
Undergraduate Program
Count
% within Classif ication in
Undergraduate Program
Strongly Agree
Somewhat Agree
Somewhat Disagree
Strongly Disagree
No Opinion
'The more time spent in
class learning about
other countries, cultures,
or global issues, the
less time is available for
the basics.' : 2. Rate your
level of agreement with
the f ollowing statements.
Total
Freshman Sophomore Junior Senior
Don't
know/Unc
lassif ied
Classif icat ion in Undergraduate Program
Total
A.29:

120
A.30:
100 61 161
10.3% 16.1% 12.0%
247 112 359
25.5% 29.6% 26.7% 258 86 344
26.7% 22.7% 25.6% 326 99 425
33.7% 26.1% 31.6%
36 21 57
3.7% 5.5% 4.2% 967 379 1346
100.0% 100.0% 100.0%
Count
% within Gender
Count
% within Gender
Count % within Gender
Count
% within Gender
Count
% within Gender
Count % within Gender
Strongly Agree
Somewhat Agree
Somewhat Disagree
Strongly Disagree
No Opinion
'Learning about other countries, cultures, and global issues is useful, but not a necessary component of my education.' : 2. Rate your level of agreement with the following statements.
Total
Female Male Gender
Total
A.30a: Chi-Square Tests
17.966 a 4 .001 17.627 4 .001
8.461 1 .004
1346
Pearson Chi-Square
Likelihood Ratio Linear-by-Linear Association
N of Valid Cases
Value df Asymp. Sig.
(2-sided)
0 cells (.0%) have expected count less than 5. The minimum expected count is 16.05.
a.
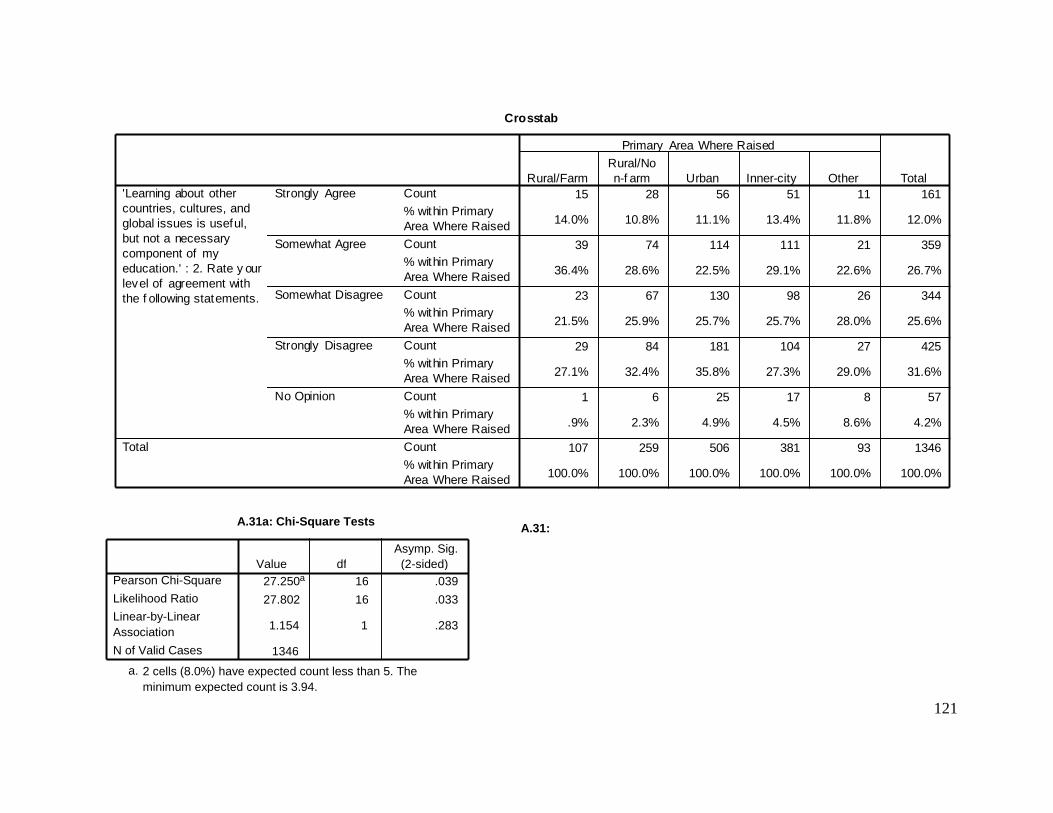
121
A.31a: Chi-Square Tests
27.250 a 16 .039
27.802 16 .033
1.154 1 .283
1346
Pearson Chi-Square
Likelihood Ratio Linear-by-Linear Association
N of Valid Cases
Value df Asymp. Sig.
(2-sided)
2 cells (8.0%) have expected count less than 5. The minimum expected count is 3.94.
a.
Crosstab
15 28 56 51 11 161
14.0% 10.8% 11.1% 13.4% 11.8% 12.0%
39 74 114 111 21 359
36.4% 28.6% 22.5% 29.1% 22.6% 26.7%
23 67 130 98 26 344
21.5% 25.9% 25.7% 25.7% 28.0% 25.6%
29 84 181 104 27 425
27.1% 32.4% 35.8% 27.3% 29.0% 31.6%
1 6 25 17 8 57
.9% 2.3% 4.9% 4.5% 8.6% 4.2%
107 259 506 381 93 1346
100.0% 100.0% 100.0% 100.0% 100.0% 100.0%
Count
% within Primary
Area Where Raised
Count
% within Primary
Area Where Raised
Count
% within Primary
Area Where Raised
Count
% within Primary
Area Where Raised
Count
% within Primary
Area Where Raised
Count
% within Primary
Area Where Raised
Strongly Agree
Somewhat Agree
Somewhat Disagree
Strongly Disagree
No Opinion
'Learning about other
countries, cultures, and
global issues is useful,
but not a necessary
component of my
education.' : 2. Rate y our
level of agreement with
the f ollowing statements.
Total
Rural/Farm
Rural/No
n-f arm Urban Inner-city Other
Primary Area Where Raised
Total
A.31:

122
A.32:
77 84 161
12.0% 11.9% 12.0%
177 182 359
27.5% 25.9% 26.7%
162 182 344
25.2% 25.9% 25.6%
200 225 425
31.1% 32.0% 31.6%
27 30 57
4.2% 4.3% 4.2%
643 703 1346
100.0% 100.0% 100.0%
Count
% within First Generation College Student
Count
% within First Generation College Student
Count
% within First Generation College Student
Count
% within First Generation College Student
Count
% within First Generation College Student
Count
% within First Generation College Student
Strongly Agree
Somewhat Agree
Somewhat Disagree
Strongly Disagree
No Opinion
'Learning about other countries, cultures, and global issues is useful, but not a necessary component of my education.' : 2. Rate your level of agreement with the following statements.
Total
Yes No
First Generation College Student
Total
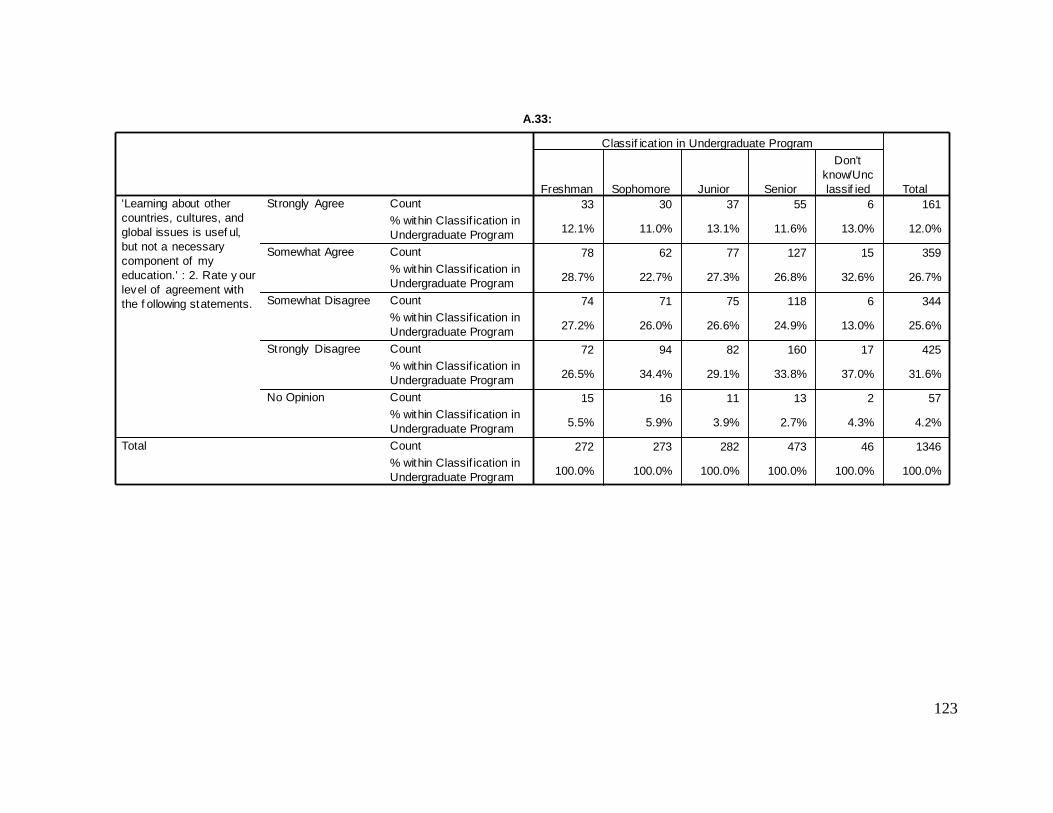
123
Crosstab
33 30 37 55 6 161
12.1% 11.0% 13.1% 11.6% 13.0% 12.0%
78 62 77 127 15 359
28.7% 22.7% 27.3% 26.8% 32.6% 26.7%
74 71 75 118 6 344
27.2% 26.0% 26.6% 24.9% 13.0% 25.6%
72 94 82 160 17 425
26.5% 34.4% 29.1% 33.8% 37.0% 31.6%
15 16 11 13 2 57
5.5% 5.9% 3.9% 2.7% 4.3% 4.2%
272 273 282 473 46 1346
100.0% 100.0% 100.0% 100.0% 100.0% 100.0%
Count
% within Classif ication in
Undergraduate Program
Count
% within Classif ication in
Undergraduate Program
Count
% within Classif ication in
Undergraduate Program
Count
% within Classif ication in
Undergraduate Program
Count
% within Classif ication in
Undergraduate Program
Count
% within Classif ication in
Undergraduate Program
Strongly Agree
Somewhat Agree
Somewhat Disagree
Strongly Disagree
No Opinion
'Learning about other
countries, cultures, and
global issues is usef ul,
but not a necessary
component of my
education.' : 2. Rate y our
level of agreement with
the f ollowing statements.
Total
Freshman Sophomore Junior Senior
Don't
know/Unc
lassif ied
Classif icat ion in Undergraduate Program
Total
A.33:
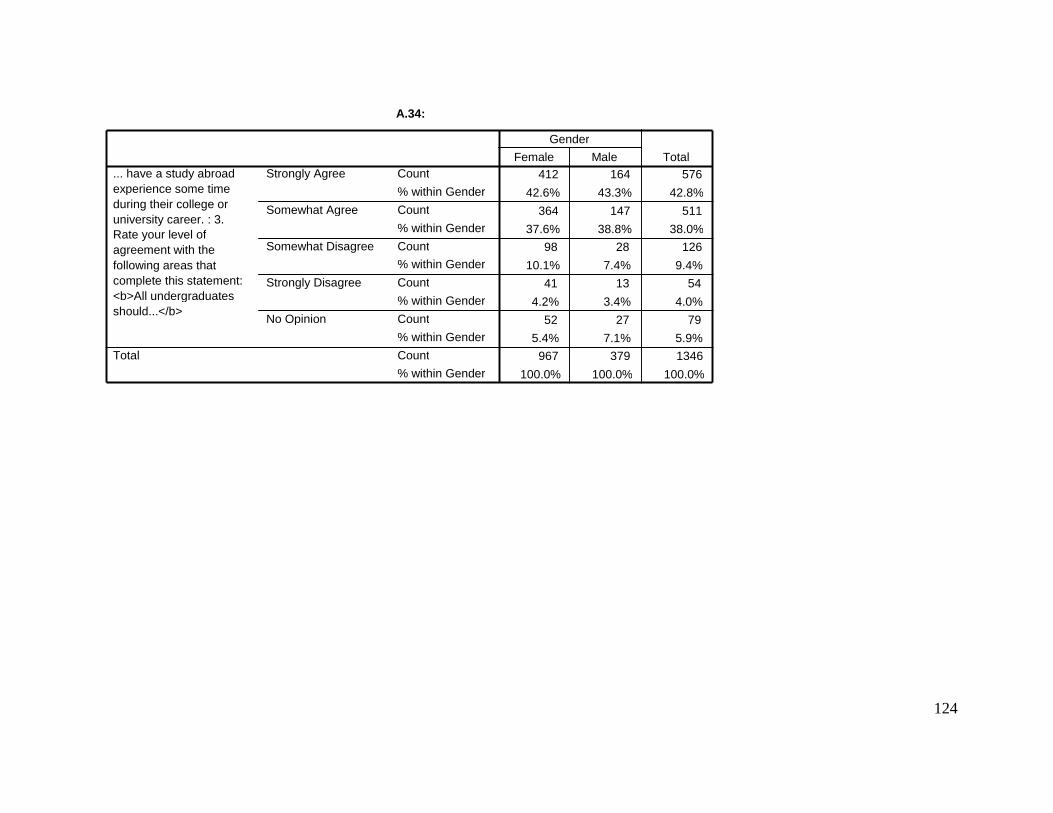
124
A.34:
412 164 576
42.6% 43.3% 42.8%
364 147 511
37.6% 38.8% 38.0% 98 28 126
10.1% 7.4% 9.4% 41 13 54
4.2% 3.4% 4.0%
52 27 79
5.4% 7.1% 5.9% 967 379 1346
100.0% 100.0% 100.0%
Count
% within Gender
Count
% within Gender
Count % within Gender
Count
% within Gender
Count
% within Gender
Count % within Gender
Strongly Agree
Somewhat Agree
Somewhat Disagree
Strongly Disagree
No Opinion
... have a study abroad experience some time during their college or university career. : 3. Rate your level of agreement with the following areas that complete this statement: <b>All undergraduates should...</b>
Total
Female Male Gender
Total

125
Crosstab
46 103 219 174 34 576
43.0% 39.8% 43.3% 45.7% 36.6% 42.8%
44 100 202 133 32 511
41.1% 38.6% 39.9% 34.9% 34.4% 38.0%
11 28 38 37 12 126
10.3% 10.8% 7.5% 9.7% 12.9% 9.4%
4 14 19 14 3 54
3.7% 5.4% 3.8% 3.7% 3.2% 4.0%
2 14 28 23 12 79
1.9% 5.4% 5.5% 6.0% 12.9% 5.9%
107 259 506 381 93 1346
100.0% 100.0% 100.0% 100.0% 100.0% 100.0%
Count
% within Primary
Area Where Raised
Count
% within Primary
Area Where Raised
Count
% within Primary
Area Where Raised
Count
% within Primary
Area Where Raised
Count
% within Primary
Area Where Raised
Count
% within Primary
Area Where Raised
Strongly Agree
Somewhat Agree
Somewhat Disagree
Strongly Disagree
No Opinion
... have a study abroad
experience some time
during their college or
university career. : 3.
Rate your lev el of
agreement with the
f ollowing areas that
complete this statement:
<b>All undergraduates
should...</b>
Total
Rural/Farm
Rural/No
n-f arm Urban Inner-city Other
Primary Area Where Raised
Total
A.35:
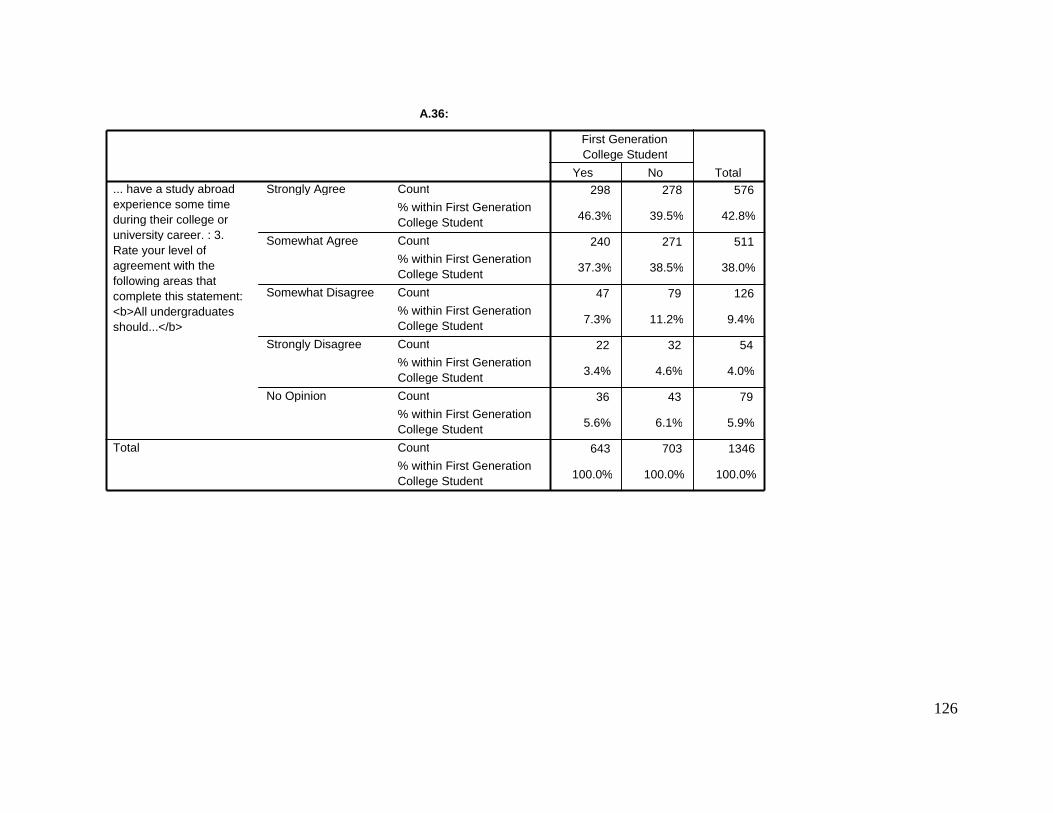
126
A.36:
298 278 576
46.3% 39.5% 42.8%
240 271 511
37.3% 38.5% 38.0%
47 79 126
7.3% 11.2% 9.4%
22 32 54
3.4% 4.6% 4.0%
36 43 79
5.6% 6.1% 5.9%
643 703 1346
100.0% 100.0% 100.0%
Count
% within First Generation College Student
Count
% within First Generation College Student
Count
% within First Generation College Student
Count
% within First Generation College Student
Count
% within First Generation College Student
Count
% within First Generation College Student
Strongly Agree
Somewhat Agree
Somewhat Disagree
Strongly Disagree
No Opinion
... have a study abroad experience some time during their college or university career. : 3. Rate your level of agreement with the following areas that complete this statement: <b>All undergraduates should...</b>
Total
Yes No
First Generation College Student
Total
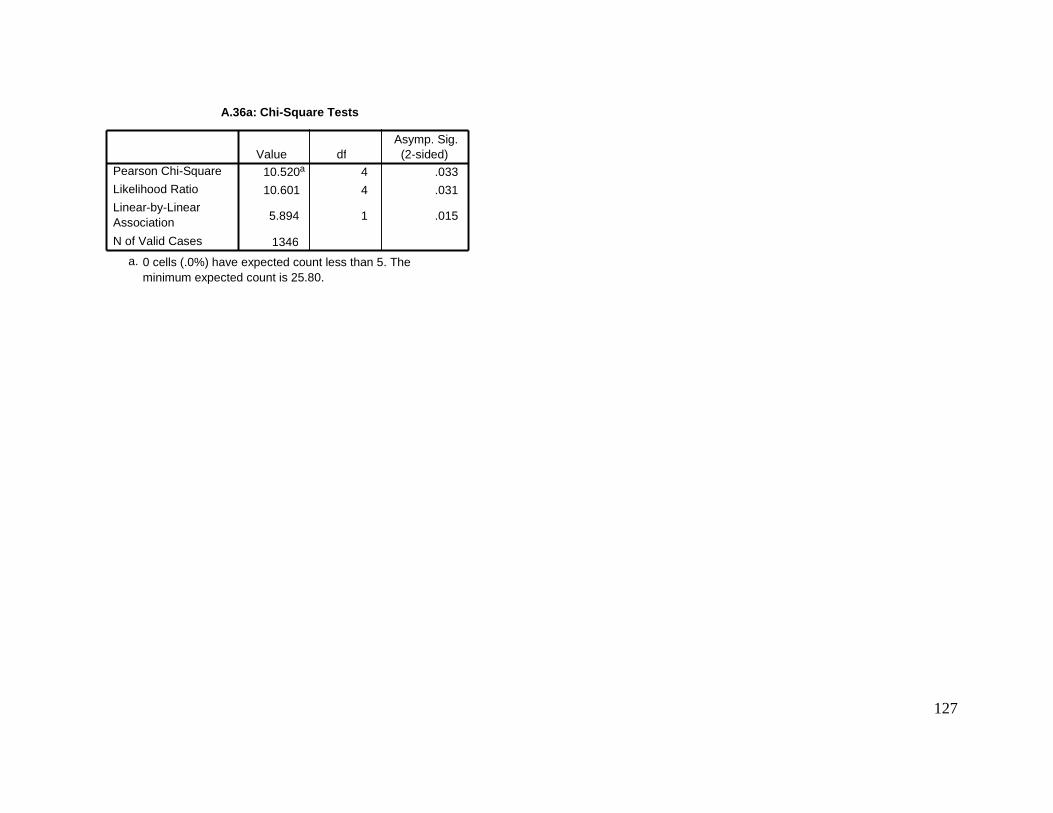
127
A.36a: Chi-Square Tests
10.520 a 4 .033
10.601 4 .031
5.894 1 .015
1346
Pearson Chi-Square
Likelihood Ratio
Linear-by-Linear Association
N of Valid Cases
Value df Asymp. Sig.
(2-sided)
0 cells (.0%) have expected count less than 5. The minimum expected count is 25.80.
a.

128
Crosstab
131 130 110 182 23 576
48.2% 47.6% 39.0% 38.5% 50.0% 42.8%
97 96 109 196 13 511
35.7% 35.2% 38.7% 41.4% 28.3% 38.0%
22 19 34 47 4 126
8.1% 7.0% 12.1% 9.9% 8.7% 9.4%
6 9 13 24 2 54
2.2% 3.3% 4.6% 5.1% 4.3% 4.0%
16 19 16 24 4 79
5.9% 7.0% 5.7% 5.1% 8.7% 5.9%
272 273 282 473 46 1346
100.0% 100.0% 100.0% 100.0% 100.0% 100.0%
Count
% within Classif ication in
Undergraduate Program
Count
% within Classif ication in
Undergraduate Program
Count
% within Classif ication in
Undergraduate Program
Count
% within Classif ication in
Undergraduate Program
Count
% within Classif ication in
Undergraduate Program
Count
% within Classif ication in
Undergraduate Program
Strongly Agree
Somewhat Agree
Somewhat Disagree
Strongly Disagree
No Opinion
... have a study abroad
experience some time
during their college or
university career. : 3.
Rate your lev el of
agreement with the
f ollowing areas that
complete this statement:
<b>All undergraduates
should...</b>
Total
Freshman Sophomore Junior Senior
Don't
know/Unc
lassif ied
Classif icat ion in Undergraduate Program
Total
A.37:
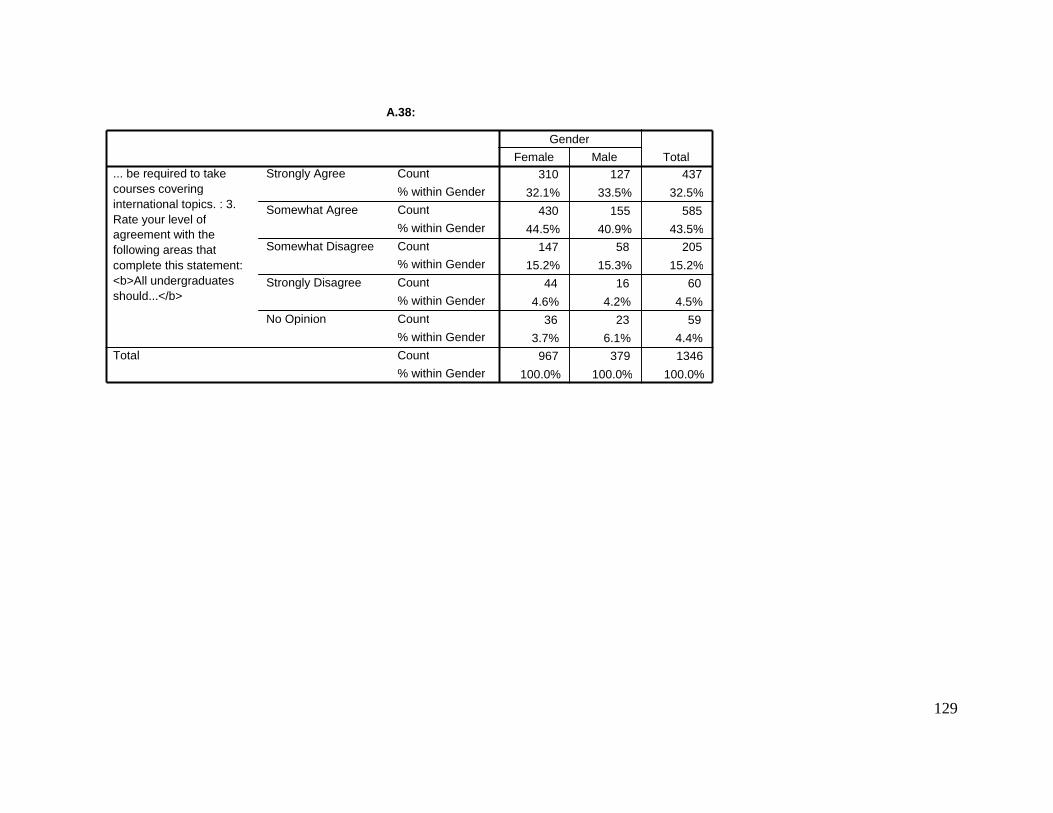
129
A.38:
310 127 437
32.1% 33.5% 32.5%
430 155 585
44.5% 40.9% 43.5% 147 58 205
15.2% 15.3% 15.2% 44 16 60
4.6% 4.2% 4.5%
36 23 59
3.7% 6.1% 4.4% 967 379 1346
100.0% 100.0% 100.0%
Count
% within Gender
Count
% within Gender
Count % within Gender
Count
% within Gender
Count
% within Gender
Count % within Gender
Strongly Agree
Somewhat Agree
Somewhat Disagree
Strongly Disagree
No Opinion
... be required to take courses covering international topics. : 3. Rate your level of agreement with the following areas that complete this statement: <b>All undergraduates should...</b>
Total
Female Male Gender
Total
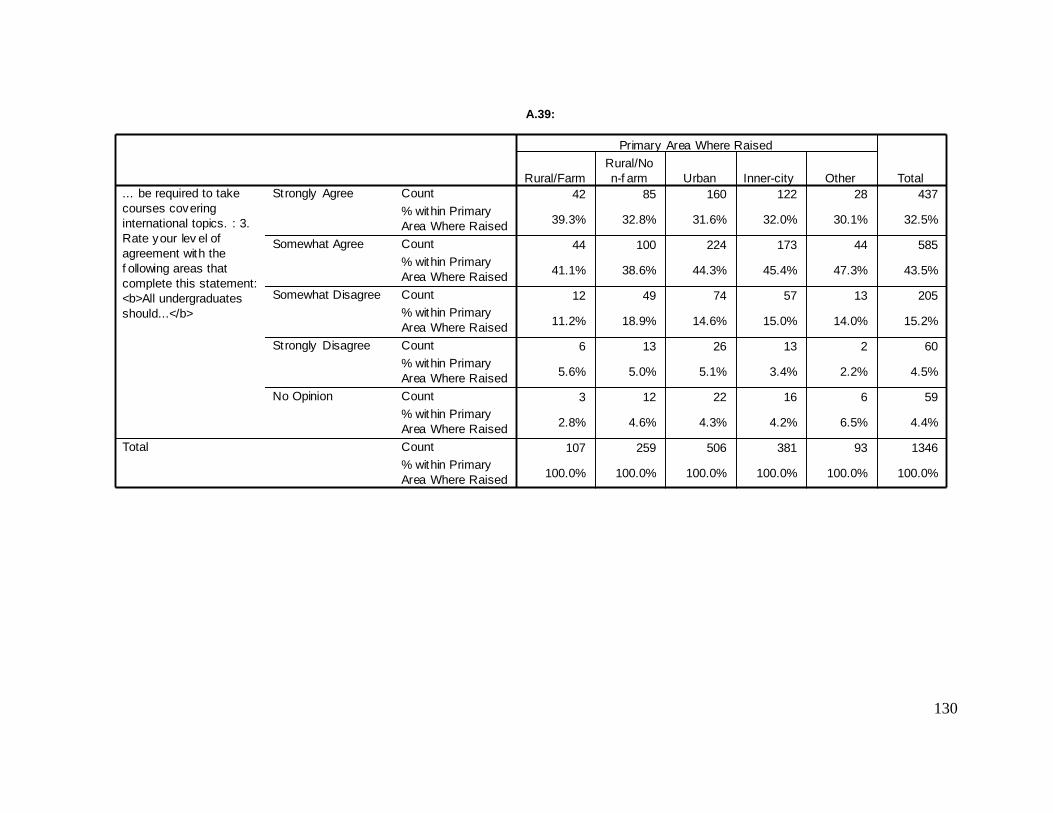
130
Crosstab
42 85 160 122 28 437
39.3% 32.8% 31.6% 32.0% 30.1% 32.5%
44 100 224 173 44 585
41.1% 38.6% 44.3% 45.4% 47.3% 43.5%
12 49 74 57 13 205
11.2% 18.9% 14.6% 15.0% 14.0% 15.2%
6 13 26 13 2 60
5.6% 5.0% 5.1% 3.4% 2.2% 4.5%
3 12 22 16 6 59
2.8% 4.6% 4.3% 4.2% 6.5% 4.4%
107 259 506 381 93 1346
100.0% 100.0% 100.0% 100.0% 100.0% 100.0%
Count
% within Primary
Area Where Raised
Count
% within Primary
Area Where Raised
Count
% within Primary
Area Where Raised
Count
% within Primary
Area Where Raised
Count
% within Primary
Area Where Raised
Count
% within Primary
Area Where Raised
Strongly Agree
Somewhat Agree
Somewhat Disagree
Strongly Disagree
No Opinion
... be required to take
courses covering
international topics. : 3.
Rate your lev el of
agreement with the
f ollowing areas that
complete this statement:
<b>All undergraduates
should...</b>
Total
Rural/Farm
Rural/No
n-f arm Urban Inner-city Other
Primary Area Where Raised
Total
A.39:
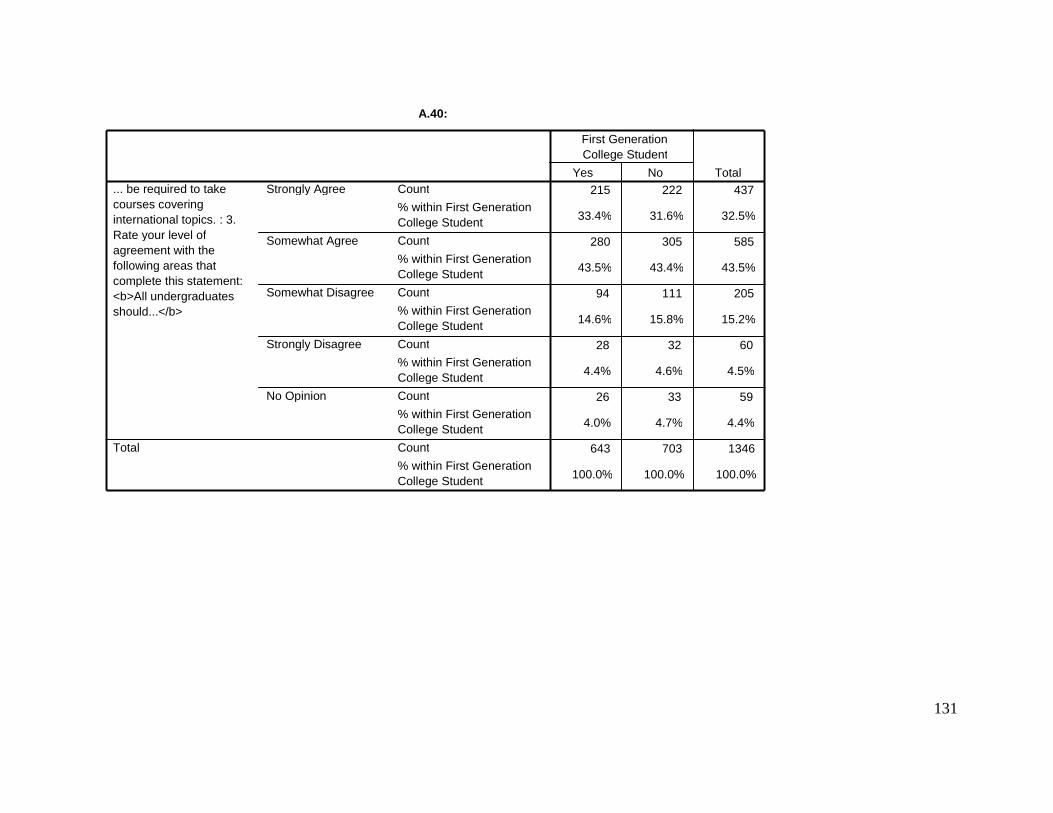
131
A.40:
215 222 437
33.4% 31.6% 32.5%
280 305 585
43.5% 43.4% 43.5%
94 111 205
14.6% 15.8% 15.2%
28 32 60
4.4% 4.6% 4.5%
26 33 59
4.0% 4.7% 4.4%
643 703 1346
100.0% 100.0% 100.0%
Count
% within First Generation College Student
Count
% within First Generation College Student
Count
% within First Generation College Student
Count
% within First Generation College Student
Count
% within First Generation College Student
Count
% within First Generation College Student
Strongly Agree
Somewhat Agree
Somewhat Disagree
Strongly Disagree
No Opinion
... be required to take courses covering international topics. : 3. Rate your level of agreement with the following areas that complete this statement: <b>All undergraduates should...</b>
Total
Yes No
First Generation College Student
Total
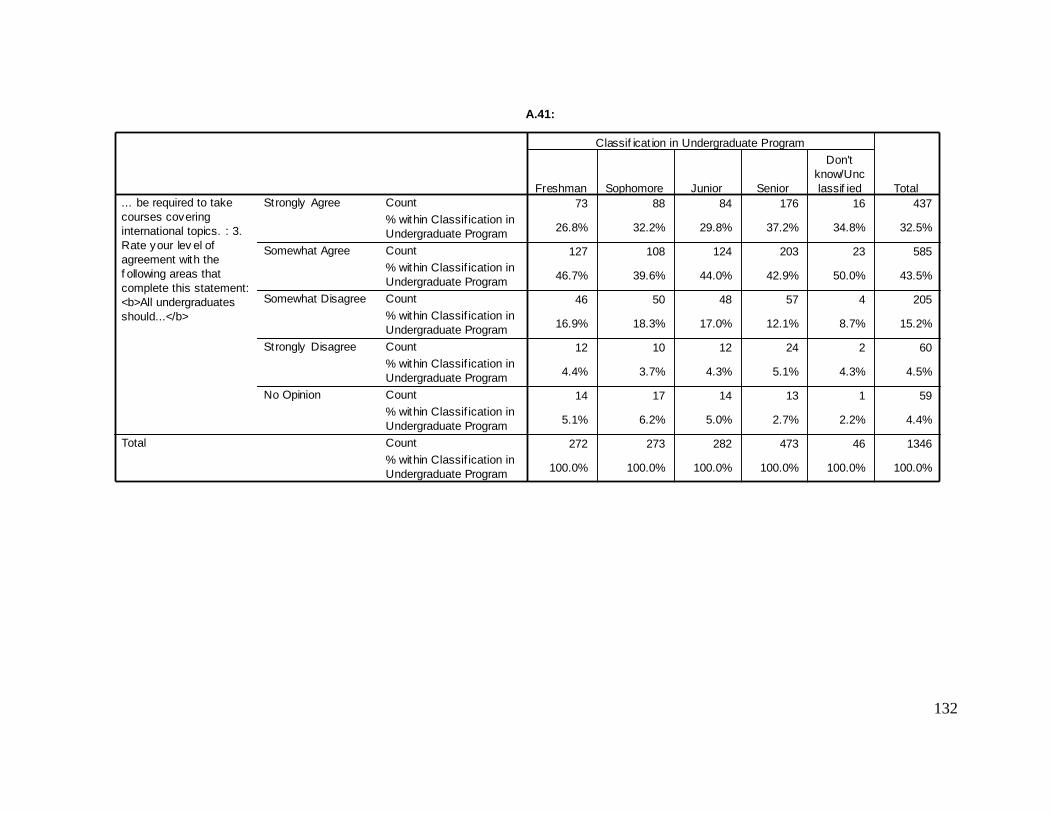
132
Crosstab
73 88 84 176 16 437
26.8% 32.2% 29.8% 37.2% 34.8% 32.5%
127 108 124 203 23 585
46.7% 39.6% 44.0% 42.9% 50.0% 43.5%
46 50 48 57 4 205
16.9% 18.3% 17.0% 12.1% 8.7% 15.2%
12 10 12 24 2 60
4.4% 3.7% 4.3% 5.1% 4.3% 4.5%
14 17 14 13 1 59
5.1% 6.2% 5.0% 2.7% 2.2% 4.4%
272 273 282 473 46 1346
100.0% 100.0% 100.0% 100.0% 100.0% 100.0%
Count
% within Classif ication in
Undergraduate Program
Count
% within Classif ication in
Undergraduate Program
Count
% within Classif ication in
Undergraduate Program
Count
% within Classif ication in
Undergraduate Program
Count
% within Classif ication in
Undergraduate Program
Count
% within Classif ication in
Undergraduate Program
Strongly Agree
Somewhat Agree
Somewhat Disagree
Strongly Disagree
No Opinion
... be required to take
courses covering
international topics. : 3.
Rate your lev el of
agreement with the
f ollowing areas that
complete this statement:
<b>All undergraduates
should...</b>
Total
Freshman Sophomore Junior Senior
Don't
know/Unc
lassif ied
Classif icat ion in Undergraduate Program
Total
A.41:

133
A.42:
498 171 669
51.5% 45.1% 49.7%
349 142 491
36.1% 37.5% 36.5% 63 32 95
6.5% 8.4% 7.1%
37 14 51
3.8% 3.7% 3.8%
20 20 40
2.1% 5.3% 3.0% 967 379 1346
100.0% 100.0% 100.0%
Count
% within Gender
Count % within Gender
Count
% within Gender
Count
% within Gender
Count % within Gender
Count
% within Gender
Strongly Agree
Somewhat Agree
Somewhat Disagree
Strongly Disagree
No Opinion
... be required to study one foreign language if they don’t already know one. : 3. Rate your level of agreement with the following areas that complete this statement: <b>All undergraduates should...</b>
Total
Female Male
Gender
Total
A.42a: Chi-Square Tests
13.253 a 4 .010 12.282 4 .015
9.252 1 .002
1346
Pearson Chi-Square
Likelihood Ratio
Linear-by-Linear Association
N of Valid Cases
Value df Asymp. Sig.
(2-sided)
0 cells (.0%) have expected count less than 5. The minimum expected count is 11.26.
a.

134
Crosstab
55 134 256 185 39 669
51.4% 51.7% 50.6% 48.6% 41.9% 49.7%
38 89 184 148 32 491
35.5% 34.4% 36.4% 38.8% 34.4% 36.5%
5 24 31 26 9 95
4.7% 9.3% 6.1% 6.8% 9.7% 7.1%
7 6 17 14 7 51
6.5% 2.3% 3.4% 3.7% 7.5% 3.8%
2 6 18 8 6 40
1.9% 2.3% 3.6% 2.1% 6.5% 3.0%
107 259 506 381 93 1346
100.0% 100.0% 100.0% 100.0% 100.0% 100.0%
Count
% within Primary
Area Where Raised
Count
% within Primary
Area Where Raised
Count
% within Primary
Area Where Raised
Count
% within Primary
Area Where Raised
Count
% within Primary
Area Where Raised
Count
% within Primary
Area Where Raised
Strongly Agree
Somewhat Agree
Somewhat Disagree
Strongly Disagree
No Opinion
... be required to study
one f oreign language if
they don’t already know
one. : 3. Rate your level
of agreement with the
f ollowing areas that
complete this statement:
<b>All undergraduates
should...</b>
Total
Rural/Farm
Rural/No
n-f arm Urban Inner-city Other
Primary Area Where Raised
Total
A.43:

135
A.44:
334 335 669
51.9% 47.7% 49.7%
231 260 491
35.9% 37.0% 36.5%
34 61 95
5.3% 8.7% 7.1%
27 24 51
4.2% 3.4% 3.8%
17 23 40
2.6% 3.3% 3.0%
643 703 1346
100.0% 100.0% 100.0%
Count
% within First Generation College Student
Count
% within First Generation College Student
Count
% within First Generation College Student
Count
% within First Generation College Student
Count
% within First Generation College Student
Count
% within First Generation College Student
Strongly Agree
Somewhat Agree
Somewhat Disagree
Strongly Disagree
No Opinion
... be required to study one foreign language if they don’t already know one. : 3. Rate your level of agreement with the following areas that complete this statement: <b>All undergraduates should...</b>
Total
Yes No
First Generation College Student
Total
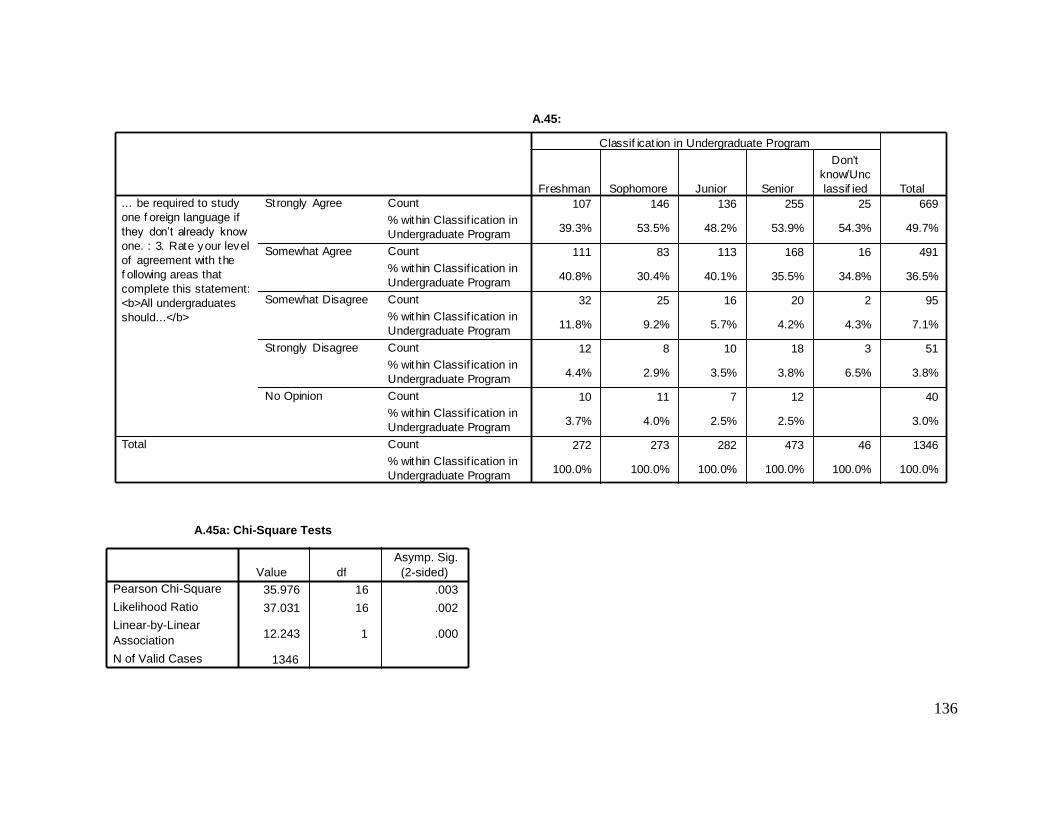
136
A.45a: Chi-Square Tests
35.976 16 .003
37.031 16 .002
12.243 1 .000
1346
Pearson Chi-Square
Likelihood Ratio
Linear-by-Linear Association
N of Valid Cases
Value df Asymp. Sig.
(2-sided)
Crosstab
107 146 136 255 25 669
39.3% 53.5% 48.2% 53.9% 54.3% 49.7%
111 83 113 168 16 491
40.8% 30.4% 40.1% 35.5% 34.8% 36.5%
32 25 16 20 2 95
11.8% 9.2% 5.7% 4.2% 4.3% 7.1%
12 8 10 18 3 51
4.4% 2.9% 3.5% 3.8% 6.5% 3.8%
10 11 7 12 40
3.7% 4.0% 2.5% 2.5% 3.0%
272 273 282 473 46 1346
100.0% 100.0% 100.0% 100.0% 100.0% 100.0%
Count
% within Classif ication in
Undergraduate Program
Count
% within Classif ication in
Undergraduate Program
Count
% within Classif ication in
Undergraduate Program
Count
% within Classif ication in
Undergraduate Program
Count
% within Classif ication in
Undergraduate Program
Count
% within Classif ication in
Undergraduate Program
Strongly Agree
Somewhat Agree
Somewhat Disagree
Strongly Disagree
No Opinion
... be required to study
one f oreign language if
they don’t already know
one. : 3. Rate your level
of agreement with the
f ollowing areas that
complete this statement:
<b>All undergraduates
should...</b>
Total
Freshman Sophomore Junior Senior
Don't
know/Unc
lassif ied
Classif icat ion in Undergraduate Program
Total
A.45:
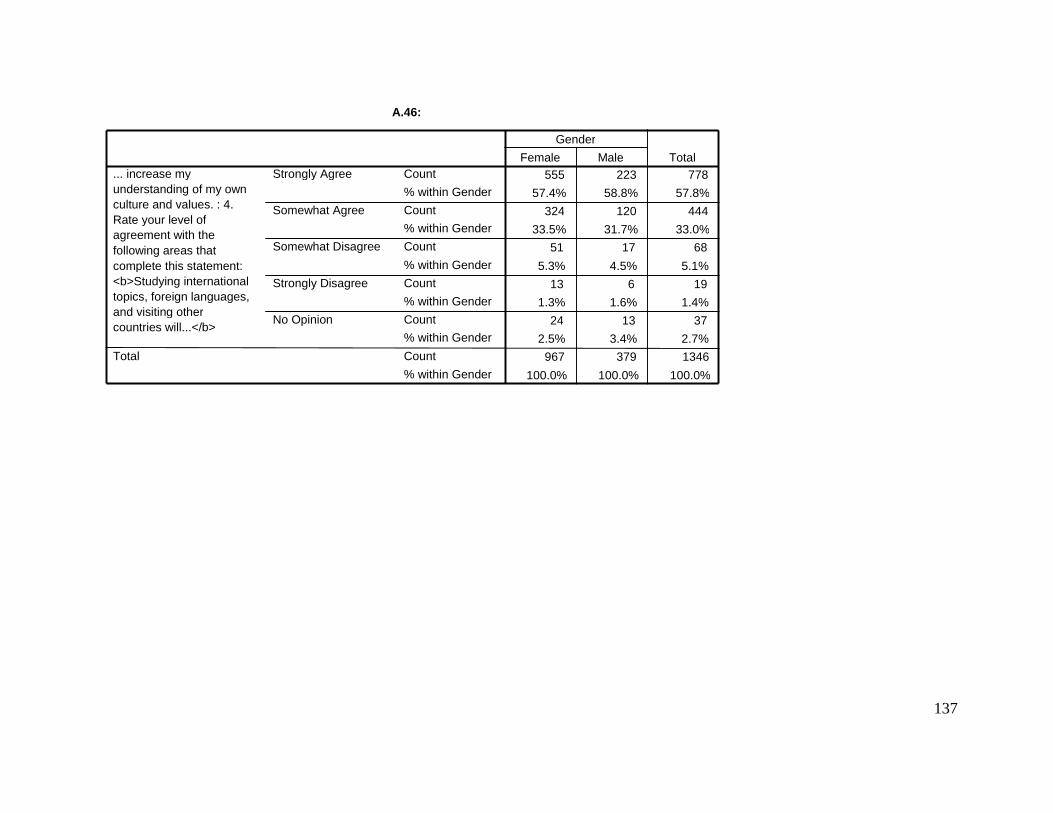
137
A.46:
555 223 778
57.4% 58.8% 57.8%
324 120 444
33.5% 31.7% 33.0% 51 17 68
5.3% 4.5% 5.1%
13 6 19
1.3% 1.6% 1.4%
24 13 37
2.5% 3.4% 2.7% 967 379 1346
100.0% 100.0% 100.0%
Count
% within Gender
Count % within Gender
Count
% within Gender
Count
% within Gender
Count % within Gender
Count
% within Gender
Strongly Agree
Somewhat Agree
Somewhat Disagree
Strongly Disagree
No Opinion
... increase my understanding of my own culture and values. : 4. Rate your level of agreement with the following areas that complete this statement: <b>Studying international topics, foreign languages, and visiting other countries will...</b>
Total
Female Male
Gender
Total

138
Crosstab
63 149 290 223 53 778
58.9% 57.5% 57.3% 58.5% 57.0% 57.8%
35 92 179 115 23 444
32.7% 35.5% 35.4% 30.2% 24.7% 33.0%
6 13 19 25 5 68
5.6% 5.0% 3.8% 6.6% 5.4% 5.1%
1 2 6 6 4 19
.9% .8% 1.2% 1.6% 4.3% 1.4%
2 3 12 12 8 37
1.9% 1.2% 2.4% 3.1% 8.6% 2.7%
107 259 506 381 93 1346
100.0% 100.0% 100.0% 100.0% 100.0% 100.0%
Count
% within Primary
Area Where Raised
Count
% within Primary
Area Where Raised
Count
% within Primary
Area Where Raised
Count
% within Primary
Area Where Raised
Count
% within Primary
Area Where Raised
Count
% within Primary
Area Where Raised
Strongly Agree
Somewhat Agree
Somewhat Disagree
Strongly Disagree
No Opinion
... increase my
understanding of my own
culture and v alues. : 4.
Rate your lev el of
agreement with the
f ollowing areas that
complete this statement:
<b>Study ing internat ional
topics, f oreign languages,
and v isiting other
countries will...</b>
Total
Rural/Farm
Rural/No
n-f arm Urban Inner-city Other
Primary Area Where Raised
Total
A.47:

139
A.47a: Chi-Square Tests
29.230 a 16 .022
24.127 16 .087
5.616 1 .018
1346
Pearson Chi-Square
Likelihood Ratio
Linear-by-Linear Association
N of Valid Cases
Value df Asymp. Sig.
(2-sided)
6 cells (24.0%) have expected count less than 5. The minimum expected count is 1.31.
a.
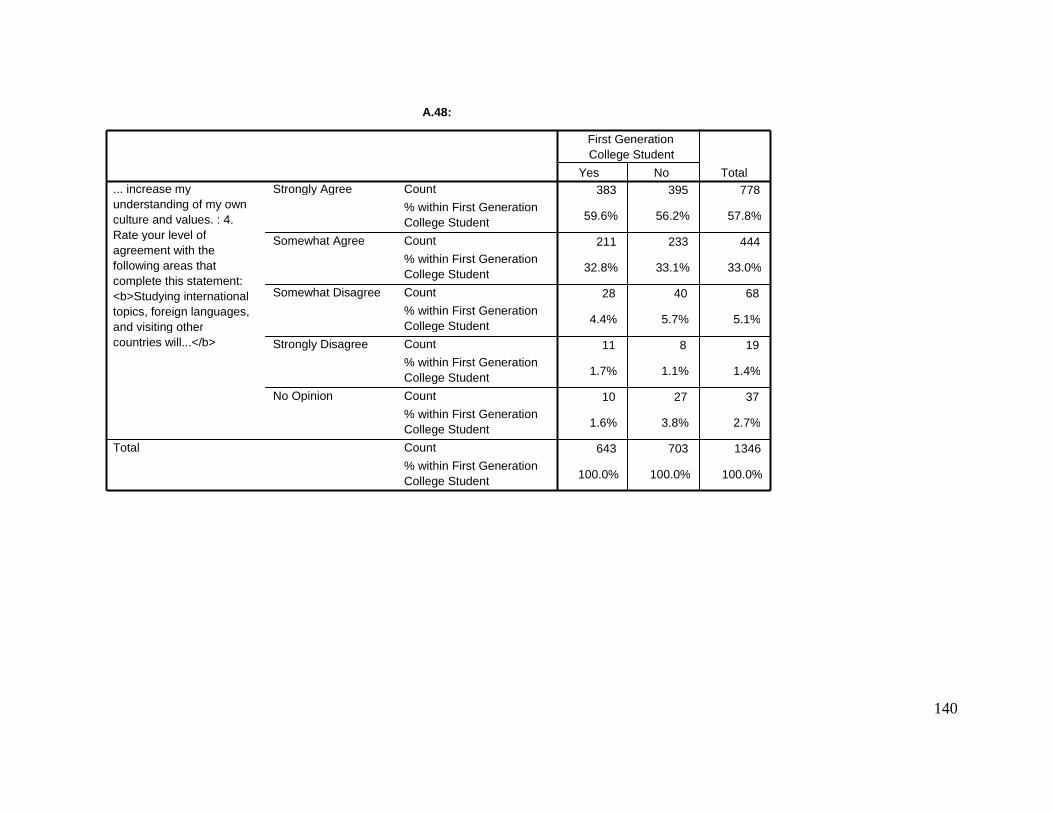
140
A.48:
383 395 778
59.6% 56.2% 57.8%
211 233 444
32.8% 33.1% 33.0%
28 40 68
4.4% 5.7% 5.1%
11 8 19
1.7% 1.1% 1.4%
10 27 37
1.6% 3.8% 2.7%
643 703 1346
100.0% 100.0% 100.0%
Count
% within First Generation College Student
Count
% within First Generation College Student
Count
% within First Generation College Student
Count
% within First Generation College Student
Count
% within First Generation College Student
Count
% within First Generation College Student
Strongly Agree
Somewhat Agree
Somewhat Disagree
Strongly Disagree
No Opinion
... increase my understanding of my own culture and values. : 4. Rate your level of agreement with the following areas that complete this statement: <b>Studying international topics, foreign languages, and visiting other countries will...</b>
Total
Yes No
First Generation College Student
Total
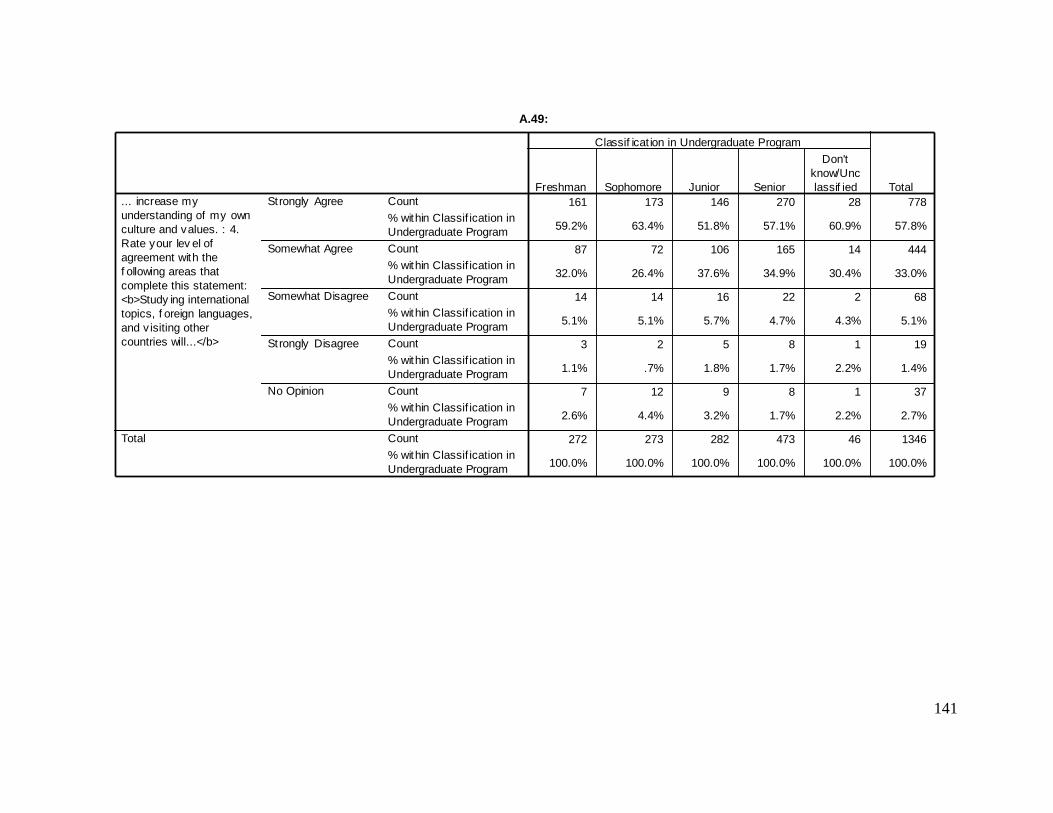
141
Crosstab
161 173 146 270 28 778
59.2% 63.4% 51.8% 57.1% 60.9% 57.8%
87 72 106 165 14 444
32.0% 26.4% 37.6% 34.9% 30.4% 33.0%
14 14 16 22 2 68
5.1% 5.1% 5.7% 4.7% 4.3% 5.1%
3 2 5 8 1 19
1.1% .7% 1.8% 1.7% 2.2% 1.4%
7 12 9 8 1 37
2.6% 4.4% 3.2% 1.7% 2.2% 2.7%
272 273 282 473 46 1346
100.0% 100.0% 100.0% 100.0% 100.0% 100.0%
Count
% within Classif ication in
Undergraduate Program
Count
% within Classif ication in
Undergraduate Program
Count
% within Classif ication in
Undergraduate Program
Count
% within Classif ication in
Undergraduate Program
Count
% within Classif ication in
Undergraduate Program
Count
% within Classif ication in
Undergraduate Program
Strongly Agree
Somewhat Agree
Somewhat Disagree
Strongly Disagree
No Opinion
... increase my
understanding of my own
culture and values. : 4.
Rate your lev el of
agreement with the
f ollowing areas that
complete this statement:
<b>Study ing international
topics, f oreign languages,
and v isiting other
countries will...</b>
Total
Freshman Sophomore Junior Senior
Don't
know/Unc
lassif ied
Classif icat ion in Undergraduate Program
Total
A.49:
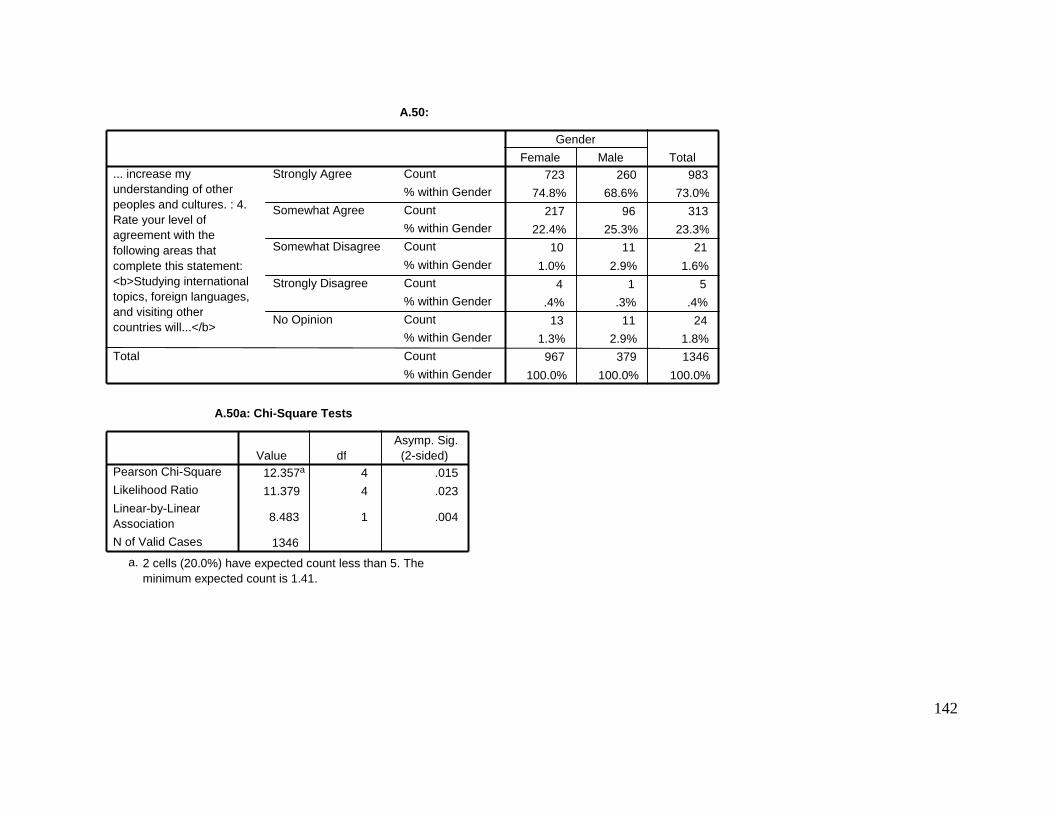
142
A.50:
723 260 983
74.8% 68.6% 73.0%
217 96 313
22.4% 25.3% 23.3% 10 11 21
1.0% 2.9% 1.6%
4 1 5
.4% .3% .4%
13 11 24
1.3% 2.9% 1.8% 967 379 1346
100.0% 100.0% 100.0%
Count
% within Gender
Count % within Gender
Count
% within Gender
Count
% within Gender
Count % within Gender
Count
% within Gender
Strongly Agree
Somewhat Agree
Somewhat Disagree
Strongly Disagree
No Opinion
... increase my understanding of other peoples and cultures. : 4. Rate your level of agreement with the following areas that complete this statement: <b>Studying international topics, foreign languages, and visiting other countries will...</b>
Total
Female Male
Gender
Total
A.50a: Chi-Square Tests
12.357 a 4 .015
11.379 4 .023
8.483 1 .004
1346
Pearson Chi-Square
Likelihood Ratio
Linear-by-Linear Association N of Valid Cases
Value df Asymp. Sig.
(2-sided)
2 cells (20.0%) have expected count less than 5. The minimum expected count is 1.41.
a.
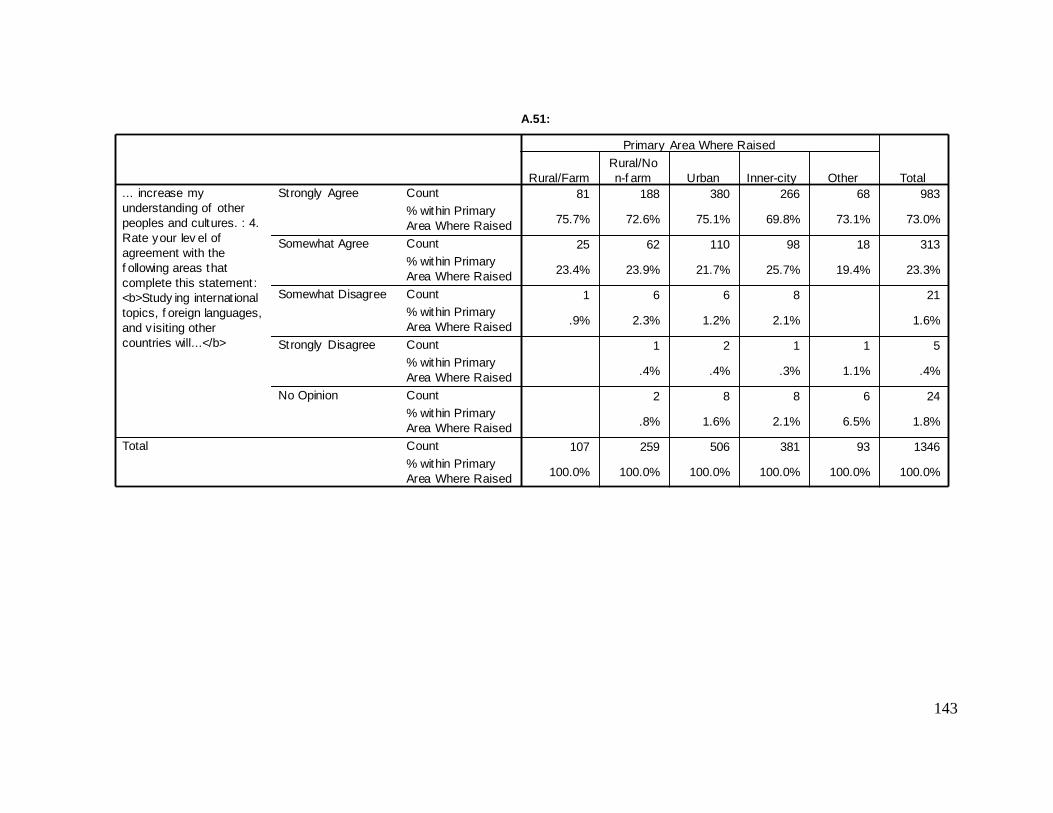
143
Crosstab
81 188 380 266 68 983
75.7% 72.6% 75.1% 69.8% 73.1% 73.0%
25 62 110 98 18 313
23.4% 23.9% 21.7% 25.7% 19.4% 23.3%
1 6 6 8 21
.9% 2.3% 1.2% 2.1% 1.6%
1 2 1 1 5
.4% .4% .3% 1.1% .4%
2 8 8 6 24
.8% 1.6% 2.1% 6.5% 1.8%
107 259 506 381 93 1346
100.0% 100.0% 100.0% 100.0% 100.0% 100.0%
Count
% within Primary
Area Where Raised
Count
% within Primary
Area Where Raised
Count
% within Primary
Area Where Raised
Count
% within Primary
Area Where Raised
Count
% within Primary
Area Where Raised
Count
% within Primary
Area Where Raised
Strongly Agree
Somewhat Agree
Somewhat Disagree
Strongly Disagree
No Opinion
... increase my
understanding of other
peoples and cultures. : 4.
Rate your lev el of
agreement with the
f ollowing areas that
complete this statement:
<b>Study ing internat ional
topics, f oreign languages,
and v isiting other
countries will...</b>
Total
Rural/Farm
Rural/No
n-f arm Urban Inner-city Other
Primary Area Where Raised
Total
A.51:

144
A.52:
462 521 983
71.9% 74.1% 73.0%
158 155 313
24.6% 22.0% 23.3%
9 12 21
1.4% 1.7% 1.6%
3 2 5
.5% .3% .4%
11 13 24
1.7% 1.8% 1.8%
643 703 1346
100.0% 100.0% 100.0%
Count
% within First Generation College Student
Count
% within First Generation College Student
Count
% within First Generation College Student
Count
% within First Generation College Student
Count
% within First Generation College Student
Count
% within First Generation College Student
Strongly Agree
Somewhat Agree
Somewhat Disagree
Strongly Disagree
No Opinion
... increase my understanding of other peoples and cultures. : 4. Rate your level of agreement with the following areas that complete this statement: <b>Studying international topics, foreign languages, and visiting other countries will...</b>
Total
Yes No
First Generation College Student
Total
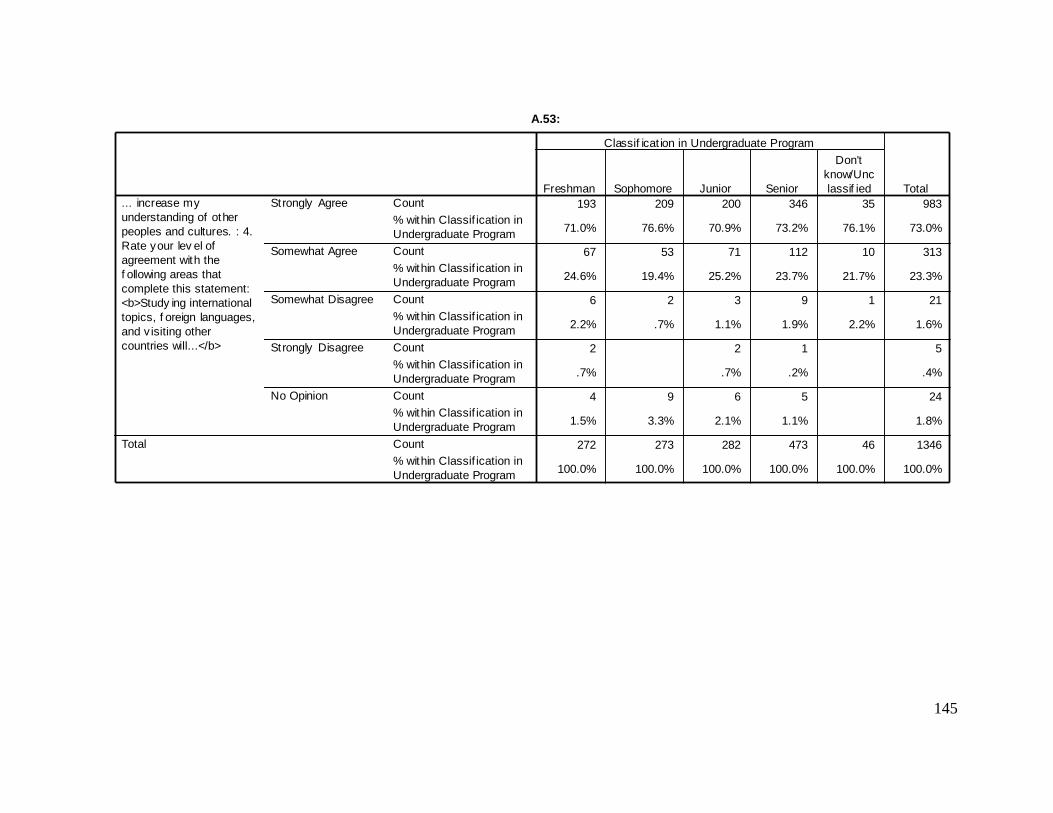
145
Crosstab
193 209 200 346 35 983
71.0% 76.6% 70.9% 73.2% 76.1% 73.0%
67 53 71 112 10 313
24.6% 19.4% 25.2% 23.7% 21.7% 23.3%
6 2 3 9 1 21
2.2% .7% 1.1% 1.9% 2.2% 1.6%
2 2 1 5
.7% .7% .2% .4%
4 9 6 5 24
1.5% 3.3% 2.1% 1.1% 1.8%
272 273 282 473 46 1346
100.0% 100.0% 100.0% 100.0% 100.0% 100.0%
Count
% within Classif ication in
Undergraduate Program
Count
% within Classif ication in
Undergraduate Program
Count
% within Classif ication in
Undergraduate Program
Count
% within Classif ication in
Undergraduate Program
Count
% within Classif ication in
Undergraduate Program
Count
% within Classif ication in
Undergraduate Program
Strongly Agree
Somewhat Agree
Somewhat Disagree
Strongly Disagree
No Opinion
... increase my
understanding of other
peoples and cultures. : 4.
Rate your lev el of
agreement with the
f ollowing areas that
complete this statement:
<b>Study ing international
topics, f oreign languages,
and v isiting other
countries will...</b>
Total
Freshman Sophomore Junior Senior
Don't
know/Unc
lassif ied
Classif icat ion in Undergraduate Program
Total
A.53:
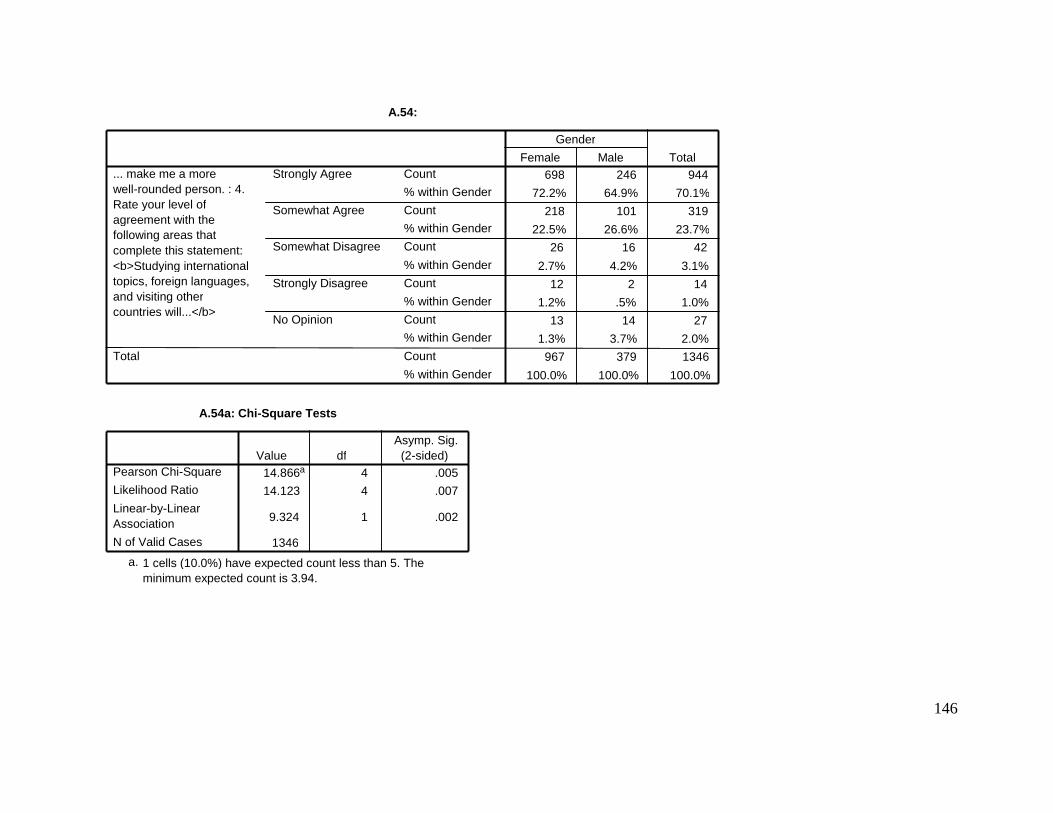
146
A.54:
698 246 944
72.2% 64.9% 70.1%
218 101 319
22.5% 26.6% 23.7% 26 16 42
2.7% 4.2% 3.1%
12 2 14
1.2% .5% 1.0%
13 14 27
1.3% 3.7% 2.0% 967 379 1346
100.0% 100.0% 100.0%
Count
% within Gender
Count % within Gender
Count
% within Gender
Count
% within Gender
Count % within Gender
Count
% within Gender
Strongly Agree
Somewhat Agree
Somewhat Disagree
Strongly Disagree
No Opinion
... make me a more well-rounded person. : 4. Rate your level of agreement with the following areas that complete this statement: <b>Studying international topics, foreign languages, and visiting other countries will...</b>
Total
Female Male
Gender
Total
A.54a: Chi-Square Tests
14.866 a 4 .005 14.123 4 .007
9.324 1 .002
1346
Pearson Chi-Square
Likelihood Ratio
Linear-by-Linear Association
N of Valid Cases
Value df Asymp. Sig.
(2-sided)
1 cells (10.0%) have expected count less than 5. The minimum expected count is 3.94.
a.

147
Crosstab
73 186 354 259 72 944
68.2% 71.8% 70.0% 68.0% 77.4% 70.1%
26 58 123 98 14 319
24.3% 22.4% 24.3% 25.7% 15.1% 23.7%
4 11 15 12 42
3.7% 4.2% 3.0% 3.1% 3.1%
2 2 4 5 1 14
1.9% .8% .8% 1.3% 1.1% 1.0%
2 2 10 7 6 27
1.9% .8% 2.0% 1.8% 6.5% 2.0%
107 259 506 381 93 1346
100.0% 100.0% 100.0% 100.0% 100.0% 100.0%
Count
% within Primary
Area Where Raised
Count
% within Primary
Area Where Raised
Count
% within Primary
Area Where Raised
Count
% within Primary
Area Where Raised
Count
% within Primary
Area Where Raised
Count
% within Primary
Area Where Raised
Strongly Agree
Somewhat Agree
Somewhat Disagree
Strongly Disagree
No Opinion
... make me a more
well-rounded person. : 4.
Rate your lev el of
agreement with the
f ollowing areas that
complete this statement:
<b>Study ing internat ional
topics, f oreign languages,
and v isiting other
countries will...</b>
Total
Rural/Farm
Rural/No
n-f arm Urban Inner-city Other
Primary Area Where Raised
Total
A.55:
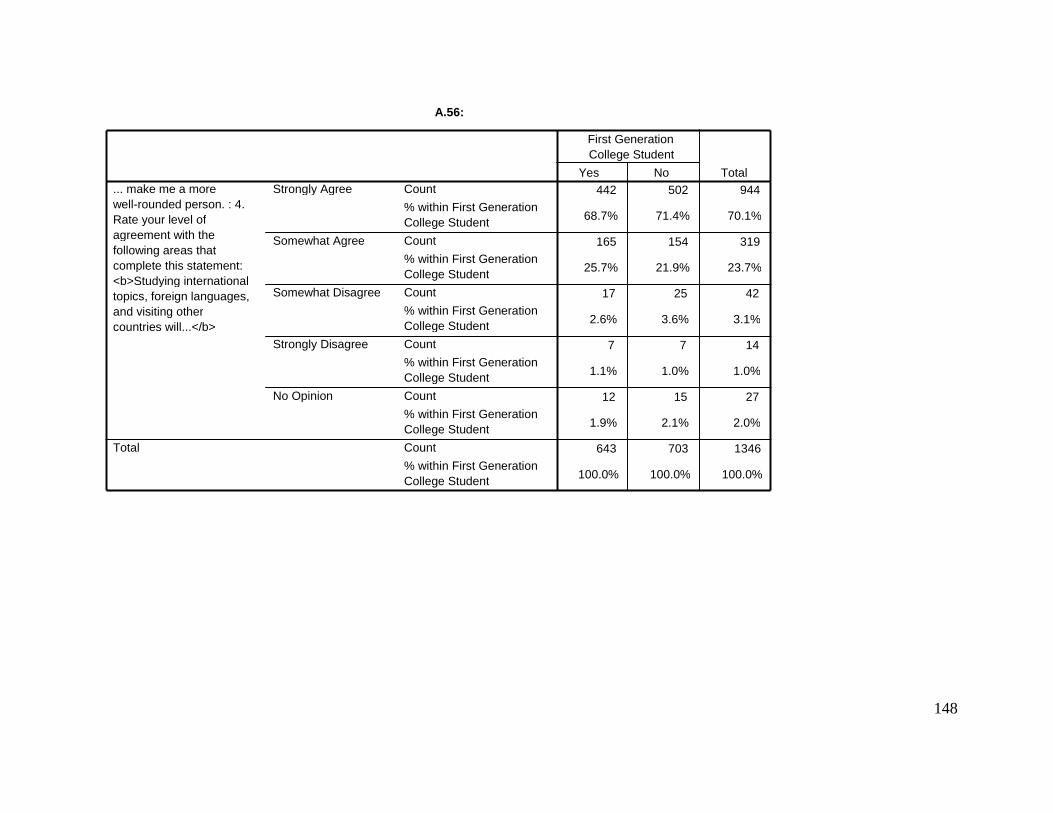
148
A.56:
442 502 944
68.7% 71.4% 70.1%
165 154 319
25.7% 21.9% 23.7%
17 25 42
2.6% 3.6% 3.1%
7 7 14
1.1% 1.0% 1.0%
12 15 27
1.9% 2.1% 2.0%
643 703 1346
100.0% 100.0% 100.0%
Count
% within First Generation College Student
Count
% within First Generation College Student
Count
% within First Generation College Student
Count
% within First Generation College Student
Count
% within First Generation College Student
Count
% within First Generation College Student
Strongly Agree
Somewhat Agree
Somewhat Disagree
Strongly Disagree
No Opinion
... make me a more well-rounded person. : 4. Rate your level of agreement with the following areas that complete this statement: <b>Studying international topics, foreign languages, and visiting other countries will...</b>
Total
Yes No
First Generation College Student
Total

149
Crosstab
188 196 191 333 36 944
69.1% 71.8% 67.7% 70.4% 78.3% 70.1%
70 54 73 114 8 319
25.7% 19.8% 25.9% 24.1% 17.4% 23.7%
8 12 6 14 2 42
2.9% 4.4% 2.1% 3.0% 4.3% 3.1%
2 3 5 4 14
.7% 1.1% 1.8% .8% 1.0%
4 8 7 8 27
1.5% 2.9% 2.5% 1.7% 2.0%
272 273 282 473 46 1346
100.0% 100.0% 100.0% 100.0% 100.0% 100.0%
Count
% within Classif ication in
Undergraduate Program
Count
% within Classif ication in
Undergraduate Program
Count
% within Classif ication in
Undergraduate Program
Count
% within Classif ication in
Undergraduate Program
Count
% within Classif ication in
Undergraduate Program
Count
% within Classif ication in
Undergraduate Program
Strongly Agree
Somewhat Agree
Somewhat Disagree
Strongly Disagree
No Opinion
... make me a more
well-rounded person. : 4.
Rate your lev el of
agreement with the
f ollowing areas that
complete this statement:
<b>Study ing international
topics, f oreign languages,
and v isiting other
countries will...</b>
Total
Freshman Sophomore Junior Senior
Don't
know/Unc
lassif ied
Classif icat ion in Undergraduate Program
Total
A.57:
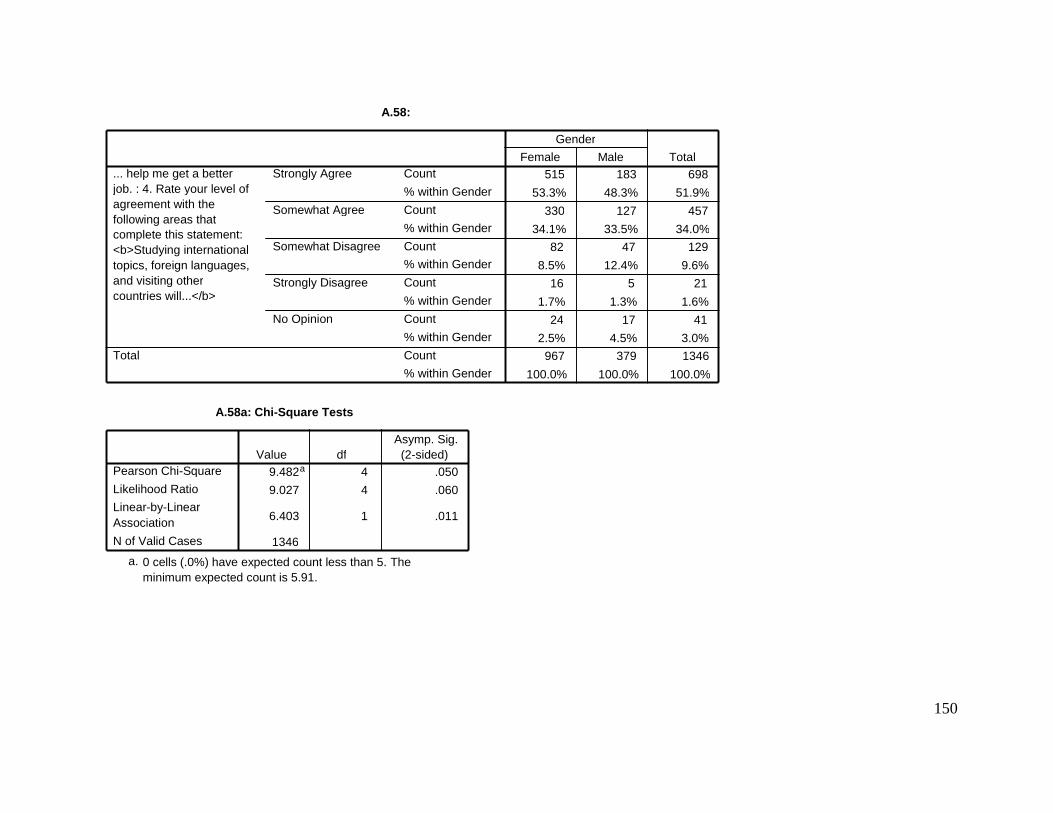
150
A.58:
515 183 698
53.3% 48.3% 51.9%
330 127 457
34.1% 33.5% 34.0% 82 47 129
8.5% 12.4% 9.6% 16 5 21
1.7% 1.3% 1.6%
24 17 41
2.5% 4.5% 3.0% 967 379 1346
100.0% 100.0% 100.0%
Count
% within Gender
Count
% within Gender
Count % within Gender
Count
% within Gender
Count
% within Gender
Count % within Gender
Strongly Agree
Somewhat Agree
Somewhat Disagree
Strongly Disagree
No Opinion
... help me get a better job. : 4. Rate your level of agreement with the following areas that complete this statement: <b>Studying international topics, foreign languages, and visiting other countries will...</b>
Total
Female Male Gender
Total
A.58a: Chi-Square Tests
9.482 a 4 .050
9.027 4 .060
6.403 1 .011
1346
Pearson Chi-Square
Likelihood Ratio Linear-by-Linear Association
N of Valid Cases
Value df Asymp. Sig.
(2-sided)
0 cells (.0%) have expected count less than 5. The minimum expected count is 5.91.
a.

151
Crosstab
55 140 263 192 48 698
51.4% 54.1% 52.0% 50.4% 51.6% 51.9%
36 87 169 136 29 457
33.6% 33.6% 33.4% 35.7% 31.2% 34.0%
12 26 45 39 7 129
11.2% 10.0% 8.9% 10.2% 7.5% 9.6%
2 3 9 5 2 21
1.9% 1.2% 1.8% 1.3% 2.2% 1.6%
2 3 20 9 7 41
1.9% 1.2% 4.0% 2.4% 7.5% 3.0%
107 259 506 381 93 1346
100.0% 100.0% 100.0% 100.0% 100.0% 100.0%
Count
% within Primary
Area Where Raised
Count
% within Primary
Area Where Raised
Count
% within Primary
Area Where Raised
Count
% within Primary
Area Where Raised
Count
% within Primary
Area Where Raised
Count
% within Primary
Area Where Raised
Strongly Agree
Somewhat Agree
Somewhat Disagree
Strongly Disagree
No Opinion
... help me get a better
job. : 4. Rate your level of
agreement with the
f ollowing areas that
complete this statement:
<b>Study ing internat ional
topics, f oreign languages,
and v isiting other
countries will...</b>
Total
Rural/Farm
Rural/No
n-f arm Urban Inner-city Other
Primary Area Where Raised
Total
A.59:
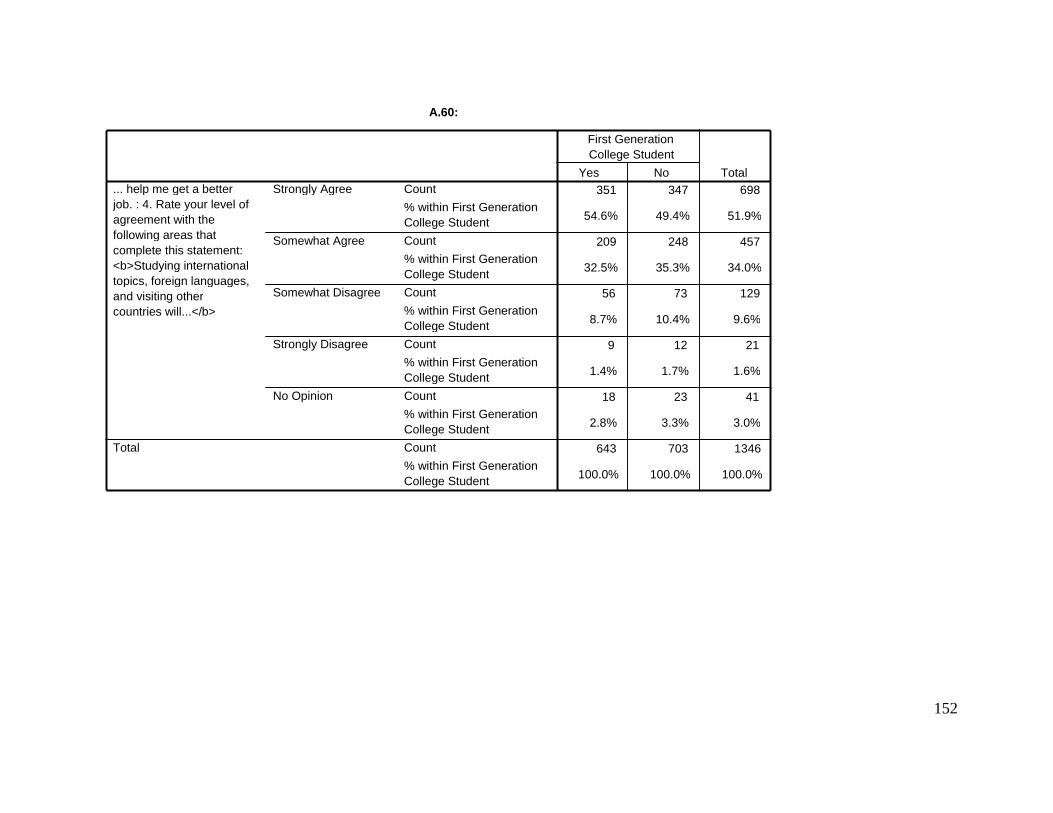
152
A.60:
351 347 698
54.6% 49.4% 51.9%
209 248 457
32.5% 35.3% 34.0%
56 73 129
8.7% 10.4% 9.6%
9 12 21
1.4% 1.7% 1.6%
18 23 41
2.8% 3.3% 3.0%
643 703 1346
100.0% 100.0% 100.0%
Count
% within First Generation College Student
Count
% within First Generation College Student
Count
% within First Generation College Student
Count
% within First Generation College Student
Count
% within First Generation College Student
Count
% within First Generation College Student
Strongly Agree
Somewhat Agree
Somewhat Disagree
Strongly Disagree
No Opinion
... help me get a better job. : 4. Rate your level of agreement with the following areas that complete this statement: <b>Studying international topics, foreign languages, and visiting other countries will...</b>
Total
Yes No
First Generation College Student
Total

153
Crosstab
148 157 140 232 21 698
54.4% 57.5% 49.6% 49.0% 45.7% 51.9%
89 78 98 177 15 457
32.7% 28.6% 34.8% 37.4% 32.6% 34.0%
23 23 26 49 8 129
8.5% 8.4% 9.2% 10.4% 17.4% 9.6%
2 4 5 8 2 21
.7% 1.5% 1.8% 1.7% 4.3% 1.6%
10 11 13 7 41
3.7% 4.0% 4.6% 1.5% 3.0%
272 273 282 473 46 1346
100.0% 100.0% 100.0% 100.0% 100.0% 100.0%
Count
% within Classif ication in
Undergraduate Program
Count
% within Classif ication in
Undergraduate Program
Count
% within Classif ication in
Undergraduate Program
Count
% within Classif ication in
Undergraduate Program
Count
% within Classif ication in
Undergraduate Program
Count
% within Classif ication in
Undergraduate Program
Strongly Agree
Somewhat Agree
Somewhat Disagree
Strongly Disagree
No Opinion
... help me get a better
job. : 4. Rate your level of
agreement with the
f ollowing areas that
complete this statement:
<b>Study ing international
topics, f oreign languages,
and v isiting other
countries will...</b>
Total
Freshman Sophomore Junior Senior
Don't
know/Unc
lassif ied
Classif icat ion in Undergraduate Program
Total
A.61:

154
A.62:
743 259 1002
76.8% 68.3% 74.4%
196 94 290
20.3% 24.8% 21.5% 9 8 17
.9% 2.1% 1.3% 6 5 11
.6% 1.3% .8%
13 13 26
1.3% 3.4% 1.9% 967 379 1346
100.0% 100.0% 100.0%
Count
% within Gender
Count
% within Gender
Count % within Gender
Count
% within Gender
Count
% within Gender
Count % within Gender
Strongly Agree
Somewhat Agree
Somewhat Disagree
Strongly Disagree
No Opinion
... provide me with skills to work with people from diverse backgrounds. : 4. Rate your level of agreement with the following areas that complete this statement: <b>Studying international topics, foreign languages, and visiting other countries will...</b>
Total
Female Male Gender
Total
A.62a: Chi-Square Tests
16.000 a 4 .003 14.923 4 .005
15.385 1 .000
1346
Pearson Chi-Square
Likelihood Ratio Linear-by-Linear Association
N of Valid Cases
Value df Asymp. Sig.
(2-sided)
2 cells (20.0%) have expected count less than 5. The minimum expected count is 3.10.
a.

155
Crosstab
80 192 380 278 72 1002
74.8% 74.1% 75.1% 73.0% 77.4% 74.4%
23 59 106 89 13 290
21.5% 22.8% 20.9% 23.4% 14.0% 21.5%
2 5 7 3 17
1.9% 1.9% 1.4% .8% 1.3%
1 6 3 1 11
.4% 1.2% .8% 1.1% .8%
2 2 7 8 7 26
1.9% .8% 1.4% 2.1% 7.5% 1.9%
107 259 506 381 93 1346
100.0% 100.0% 100.0% 100.0% 100.0% 100.0%
Count
% within Primary
Area Where Raised
Count
% within Primary
Area Where Raised
Count
% within Primary
Area Where Raised
Count
% within Primary
Area Where Raised
Count
% within Primary
Area Where Raised
Count
% within Primary
Area Where Raised
Strongly Agree
Somewhat Agree
Somewhat Disagree
Strongly Disagree
No Opinion
... prov ide me with skills to
work with people f rom
diverse backgrounds. : 4.
Rate your lev el of
agreement with the
f ollowing areas that
complete this statement:
<b>Study ing internat ional
topics, f oreign languages,
and v isiting other
countries will...</b>
Total
Rural/Farm
Rural/No
n-f arm Urban Inner-city Other
Primary Area Where Raised
Total
A.63:
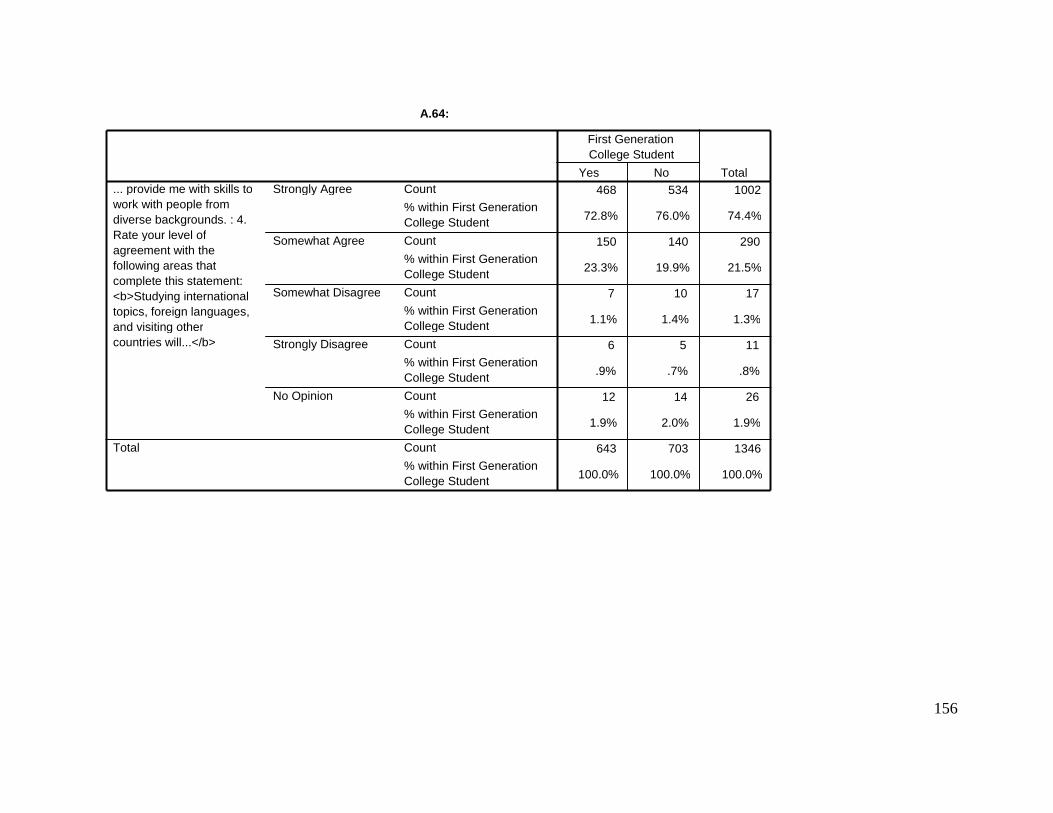
156
A.64:
468 534 1002
72.8% 76.0% 74.4%
150 140 290
23.3% 19.9% 21.5%
7 10 17
1.1% 1.4% 1.3%
6 5 11
.9% .7% .8%
12 14 26
1.9% 2.0% 1.9%
643 703 1346
100.0% 100.0% 100.0%
Count
% within First Generation College Student
Count
% within First Generation College Student
Count
% within First Generation College Student
Count
% within First Generation College Student
Count
% within First Generation College Student
Count
% within First Generation College Student
Strongly Agree
Somewhat Agree
Somewhat Disagree
Strongly Disagree
No Opinion
... provide me with skills to work with people from diverse backgrounds. : 4. Rate your level of agreement with the following areas that complete this statement: <b>Studying international topics, foreign languages, and visiting other countries will...</b>
Total
Yes No
First Generation College Student
Total
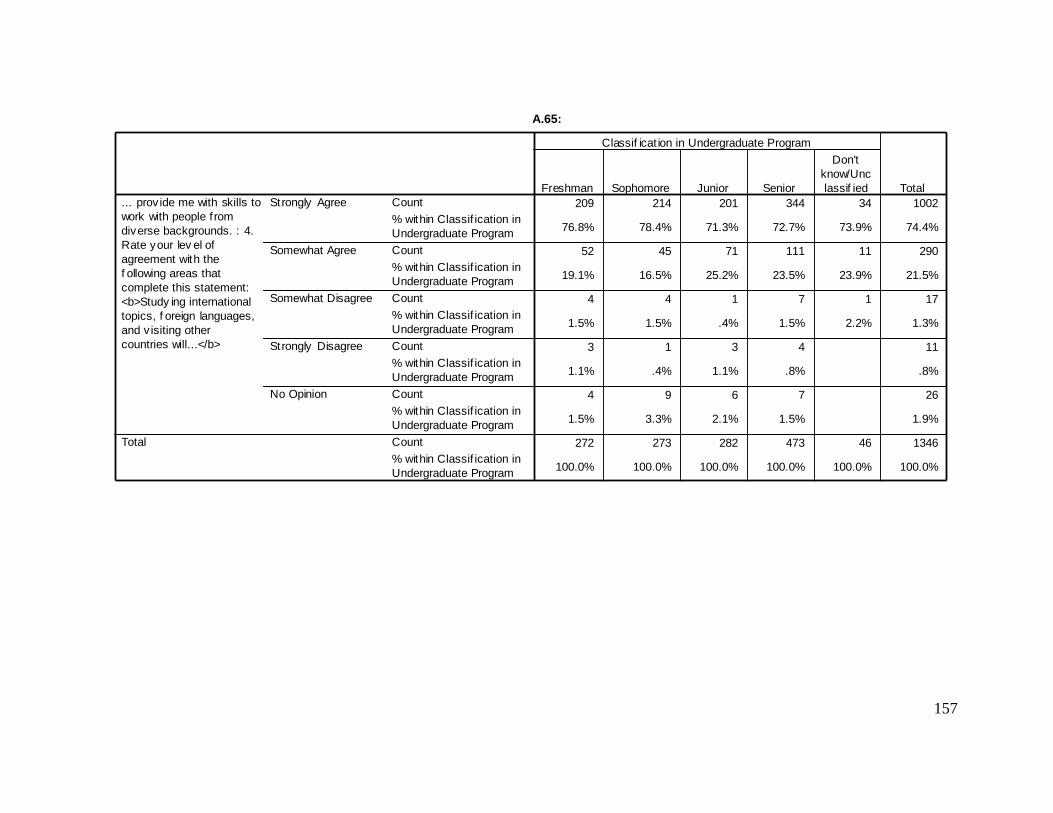
157
Crosstab
209 214 201 344 34 1002
76.8% 78.4% 71.3% 72.7% 73.9% 74.4%
52 45 71 111 11 290
19.1% 16.5% 25.2% 23.5% 23.9% 21.5%
4 4 1 7 1 17
1.5% 1.5% .4% 1.5% 2.2% 1.3%
3 1 3 4 11
1.1% .4% 1.1% .8% .8%
4 9 6 7 26
1.5% 3.3% 2.1% 1.5% 1.9%
272 273 282 473 46 1346
100.0% 100.0% 100.0% 100.0% 100.0% 100.0%
Count
% within Classif ication in
Undergraduate Program
Count
% within Classif ication in
Undergraduate Program
Count
% within Classif ication in
Undergraduate Program
Count
% within Classif ication in
Undergraduate Program
Count
% within Classif ication in
Undergraduate Program
Count
% within Classif ication in
Undergraduate Program
Strongly Agree
Somewhat Agree
Somewhat Disagree
Strongly Disagree
No Opinion
... prov ide me with skills to
work with people f rom
diverse backgrounds. : 4.
Rate your lev el of
agreement with the
f ollowing areas that
complete this statement:
<b>Study ing international
topics, f oreign languages,
and v isiting other
countries will...</b>
Total
Freshman Sophomore Junior Senior
Don't
know/Unc
lassif ied
Classif icat ion in Undergraduate Program
Total
A.65:
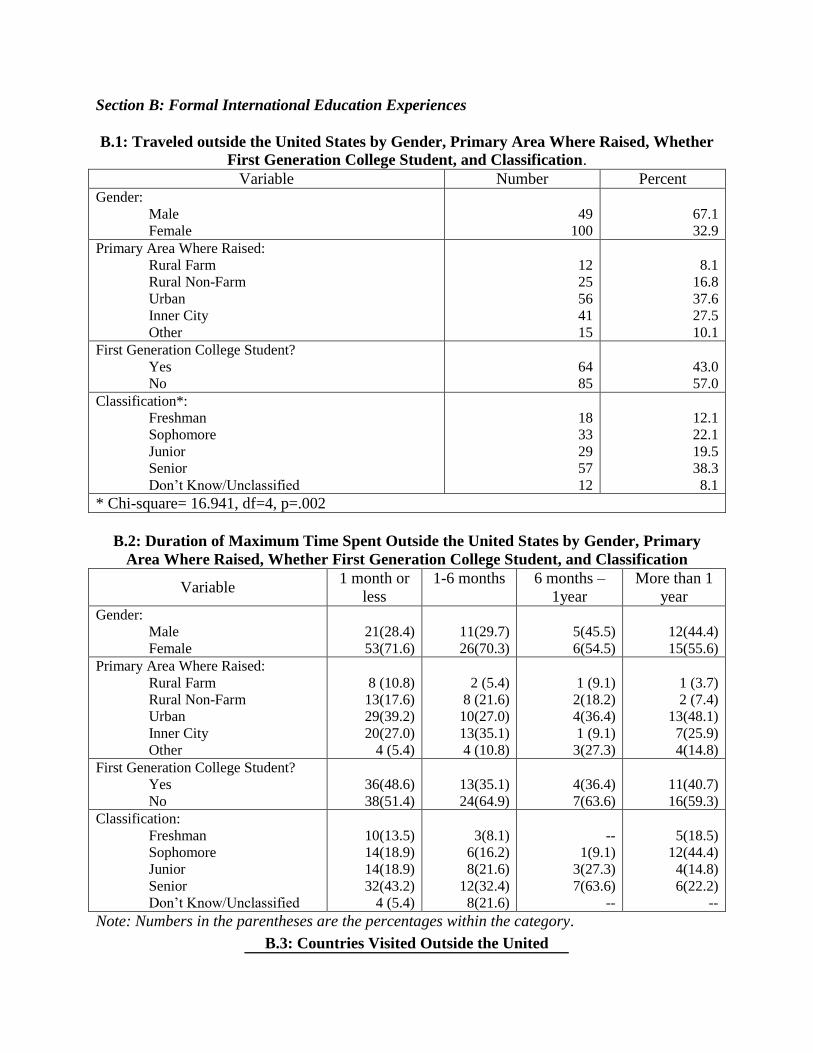
Section B: Formal International Education Experiences
B.1: Traveled outside the United States by Gender, Primary Area Where Raised, Whether
First Generation College Student, and Classification.
Variable Number Percent Gender:
Male
Female
49
100
67.1
32.9
Primary Area Where Raised:
Rural Farm
Rural Non-Farm
Urban
Inner City
Other
12
25
56
41
15
8.1
16.8
37.6
27.5
10.1
First Generation College Student?
Yes
No
64
85
43.0
57.0
Classification*:
Freshman
Sophomore
Junior
Senior
Don‘t Know/Unclassified
18
33
29
57
12
12.1
22.1
19.5
38.3
8.1
* Chi-square= 16.941, df=4, p=.002
B.2: Duration of Maximum Time Spent Outside the United States by Gender, Primary
Area Where Raised, Whether First Generation College Student, and Classification
Variable 1 month or
less
1-6 months 6 months –
1year
More than 1
year Gender:
Male
Female
21(28.4)
53(71.6)
11(29.7)
26(70.3)
5(45.5)
6(54.5)
12(44.4)
15(55.6)
Primary Area Where Raised:
Rural Farm
Rural Non-Farm
Urban
Inner City
Other
8 (10.8)
13(17.6)
29(39.2)
20(27.0)
4 (5.4)
2 (5.4)
8 (21.6)
10(27.0)
13(35.1)
4 (10.8)
1 (9.1)
2(18.2)
4(36.4)
1 (9.1)
3(27.3)
1 (3.7)
2 (7.4)
13(48.1)
7(25.9)
4(14.8)
First Generation College Student?
Yes
No
36(48.6)
38(51.4)
13(35.1)
24(64.9)
4(36.4)
7(63.6)
11(40.7)
16(59.3)
Classification:
Freshman
Sophomore
Junior
Senior
Don‘t Know/Unclassified
10(13.5)
14(18.9)
14(18.9)
32(43.2)
4 (5.4)
3(8.1)
6(16.2)
8(21.6)
12(32.4)
8(21.6)
--
1(9.1)
3(27.3)
7(63.6)
--
5(18.5)
12(44.4)
4(14.8)
6(22.2)
--
Note: Numbers in the parentheses are the percentages within the category.
B.3: Countries Visited Outside the United
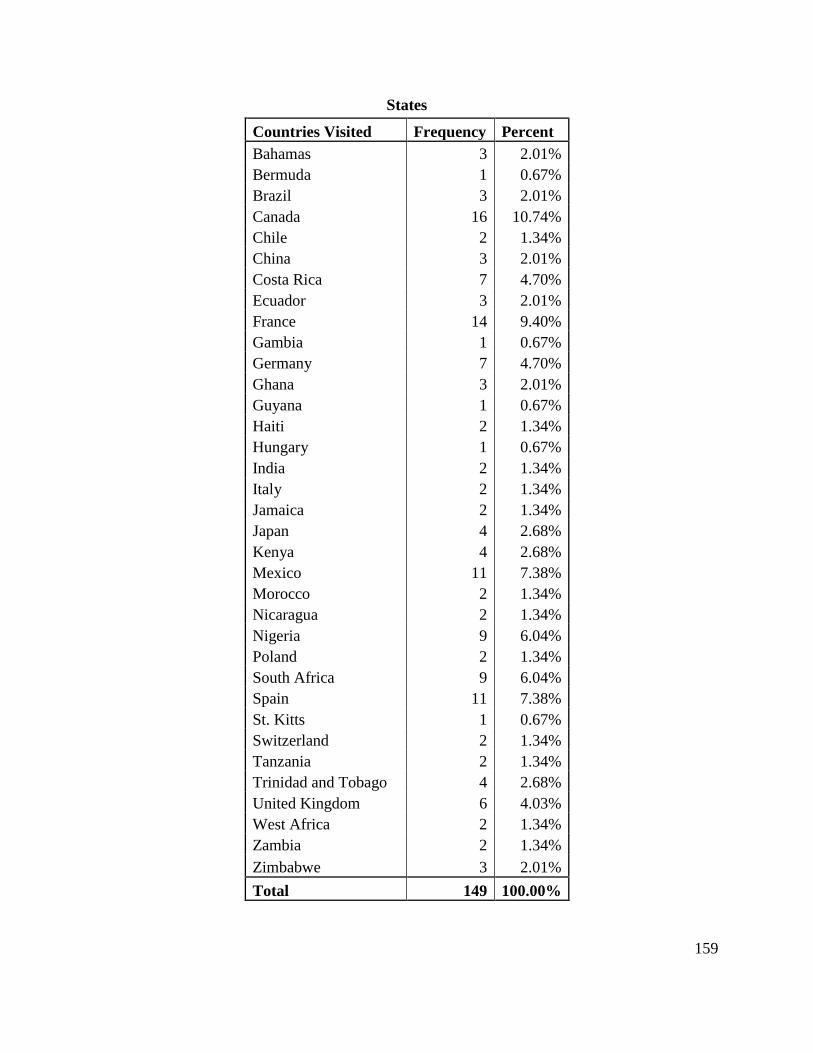
159
States
Countries Visited Frequency Percent
Bahamas 3 2.01%
Bermuda 1 0.67%
Brazil 3 2.01%
Canada 16 10.74%
Chile 2 1.34%
China 3 2.01%
Costa Rica 7 4.70%
Ecuador 3 2.01%
France 14 9.40%
Gambia 1 0.67%
Germany 7 4.70%
Ghana 3 2.01%
Guyana 1 0.67%
Haiti 2 1.34%
Hungary 1 0.67%
India 2 1.34%
Italy 2 1.34%
Jamaica 2 1.34%
Japan 4 2.68%
Kenya 4 2.68%
Mexico 11 7.38%
Morocco 2 1.34%
Nicaragua 2 1.34%
Nigeria 9 6.04%
Poland 2 1.34%
South Africa 9 6.04%
Spain 11 7.38%
St. Kitts 1 0.67%
Switzerland 2 1.34%
Tanzania 2 1.34%
Trinidad and Tobago 4 2.68%
United Kingdom 6 4.03%
West Africa 2 1.34%
Zambia 2 1.34%
Zimbabwe 3 2.01%
Total 149 100.00%
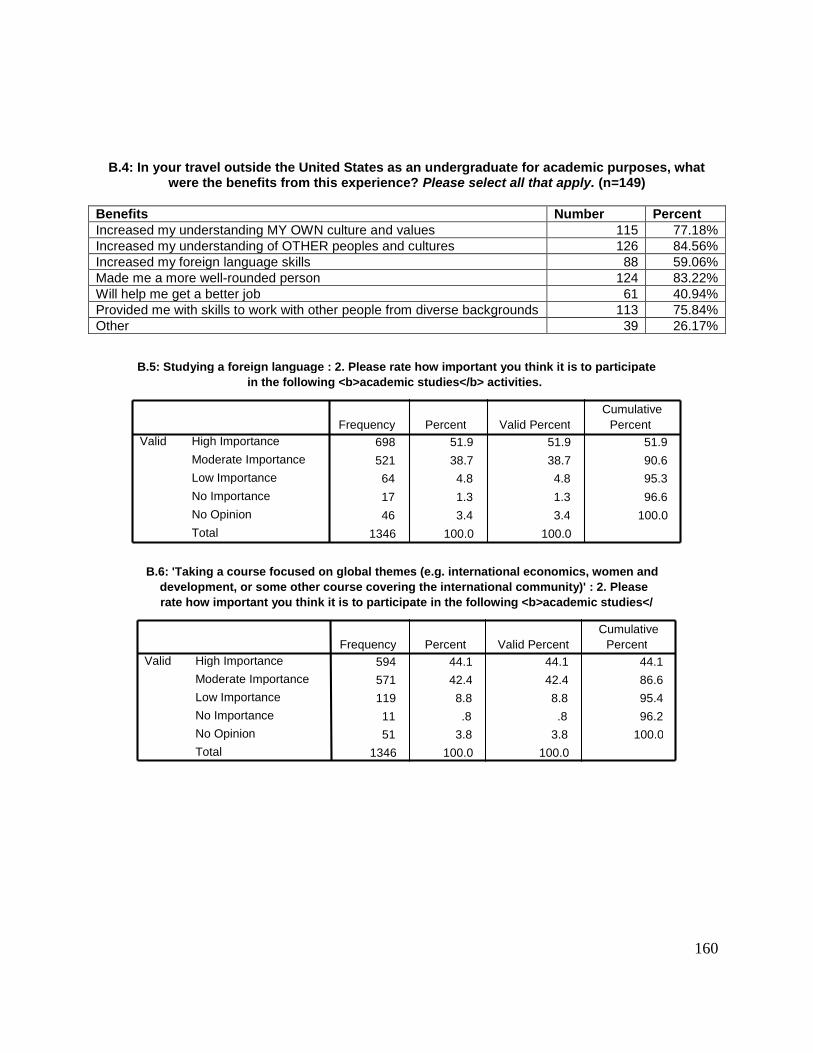
160
B.4: In your travel outside the United States as an undergraduate for academic purposes, what were the benefits from this experience? Please select all that apply. (n=149)
Benefits Number Percent
Increased my understanding MY OWN culture and values 115 77.18%
Increased my understanding of OTHER peoples and cultures 126 84.56%
Increased my foreign language skills 88 59.06%
Made me a more well-rounded person 124 83.22%
Will help me get a better job 61 40.94%
Provided me with skills to work with other people from diverse backgrounds 113 75.84%
Other 39 26.17%
B.5: Studying a foreign language : 2. Please rate how important you think it is to participate in the following <b>academic studies</b> activities.
698 51.9 51.9 51.9
521 38.7 38.7 90.6 64 4.8 4.8 95.3
17 1.3 1.3 96.6
46 3.4 3.4 100.0
1346 100.0 100.0
High Importance
Moderate Importance
Low Importance
No Importance
No Opinion
Total
Valid Frequency Percent Valid Percent
Cumulative Percent
B.6: 'Taking a course focused on global themes (e.g. international economics, women and development, or some other course covering the international community)' : 2. Please rate how important you think it is to participate in the following <b>academic studies</
594 44.1 44.1 44.1
571 42.4 42.4 86.6
119 8.8 8.8 95.4
11 .8 .8 96.2
51 3.8 3.8 100.0
1346 100.0 100.0
High Importance
Moderate Importance
Low Importance
No Importance
No Opinion
Total
Valid Frequency Percent Valid Percent
Cumulative Percent
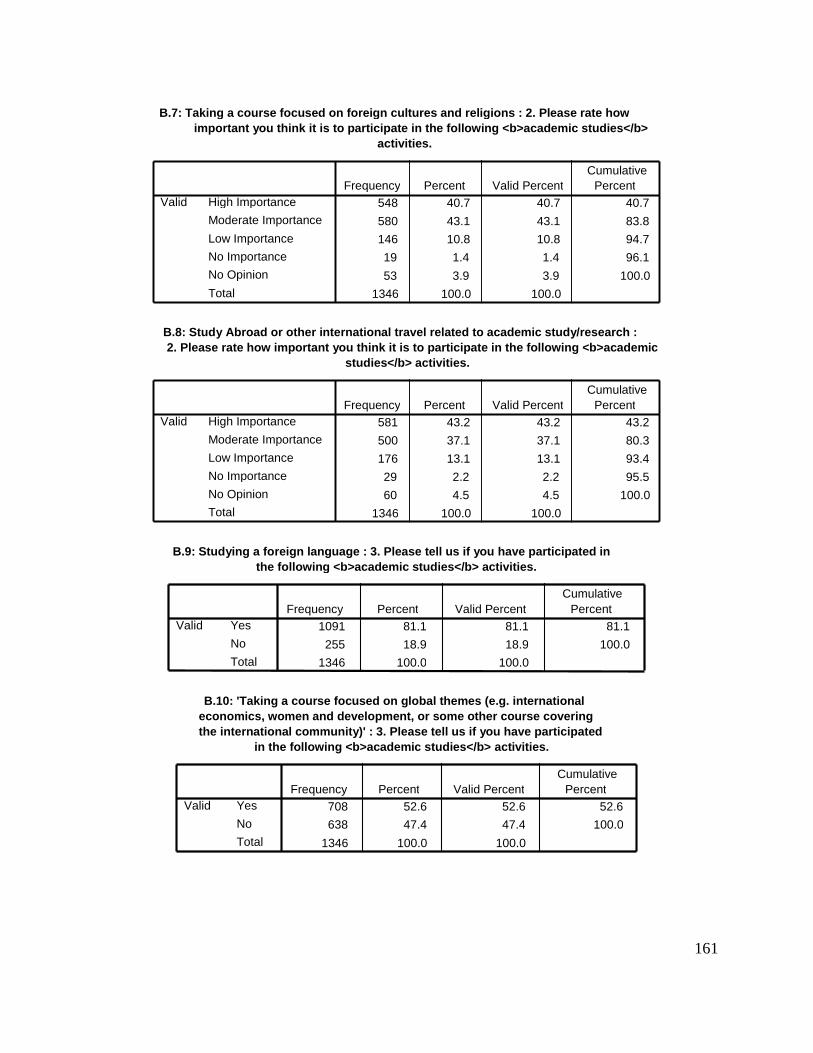
161
B.7: Taking a course focused on foreign cultures and religions : 2. Please rate how important you think it is to participate in the following <b>academic studies</b>
activities.
548 40.7 40.7 40.7
580 43.1 43.1 83.8 146 10.8 10.8 94.7
19 1.4 1.4 96.1
53 3.9 3.9 100.0 1346 100.0 100.0
High Importance Moderate Importance
Low Importance No Importance No Opinion
Total
Valid Frequency Percent Valid Percent
Cumulative Percent
B.8: Study Abroad or other international travel related to academic study/research : 2. Please rate how important you think it is to participate in the following <b>academic
studies</b> activities.
581 43.2 43.2 43.2
500 37.1 37.1 80.3
176 13.1 13.1 93.4
29 2.2 2.2 95.5
60 4.5 4.5 100.0
1346 100.0 100.0
High Importance
Moderate Importance
Low Importance
No Importance
No Opinion Total
Valid Frequency Percent Valid Percent
Cumulative Percent
B.9: Studying a foreign language : 3. Please tell us if you have participated in the following <b>academic studies</b> activities.
1091 81.1 81.1 81.1
255 18.9 18.9 100.0 1346 100.0 100.0
Yes
No
Total
Valid Frequency Percent Valid Percent
Cumulative Percent
B.10: 'Taking a course focused on global themes (e.g. international economics, women and development, or some other course covering the international community)' : 3. Please tell us if you have participated
in the following <b>academic studies</b> activities.
708 52.6 52.6 52.6 638 47.4 47.4 100.0
1346 100.0 100.0
Yes
No Total
Valid Frequency Percent Valid Percent
Cumulative Percent
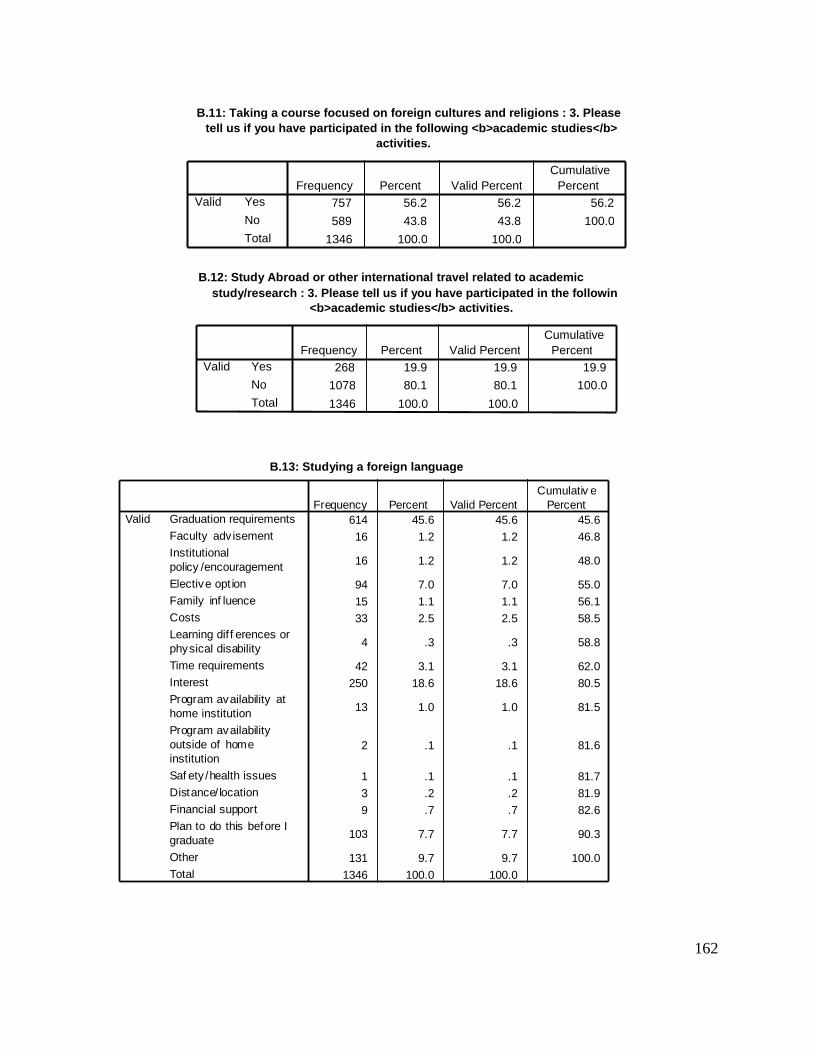
162
B.11: Taking a course focused on foreign cultures and religions : 3. Please tell us if you have participated in the following <b>academic studies</b>
activities.
757 56.2 56.2 56.2
589 43.8 43.8 100.0
1346 100.0 100.0
Yes
No
Total
Valid Frequency Percent Valid Percent
Cumulative Percent
B.12: Study Abroad or other international travel related to academic study/research : 3. Please tell us if you have participated in the following
<b>academic studies</b> activities.
268 19.9 19.9 19.9 1078 80.1 80.1 100.0
1346 100.0 100.0
Yes
No Total
Valid Frequency Percent Valid Percent
Cumulative Percent
Studying a foreign language
614 45.6 45.6 45.6
16 1.2 1.2 46.8
16 1.2 1.2 48.0
94 7.0 7.0 55.0
15 1.1 1.1 56.1
33 2.5 2.5 58.5
4 .3 .3 58.8
42 3.1 3.1 62.0
250 18.6 18.6 80.5
13 1.0 1.0 81.5
2 .1 .1 81.6
1 .1 .1 81.7
3 .2 .2 81.9
9 .7 .7 82.6
103 7.7 7.7 90.3
131 9.7 9.7 100.0
1346 100.0 100.0
Graduation requirements
Faculty adv isement
Institutional
policy /encouragement
Elective opt ion
Family inf luence
Costs
Learning dif f erences or
physical disability
Time requirements
Interest
Program availability at
home institution
Program availability
outside of home
institution
Saf ety /health issues
Distance/ location
Financial support
Plan to do this before I
graduate
Other
Total
Valid
Frequency Percent Valid Percent
Cumulativ e
Percent
B.13: Studying a foreign language
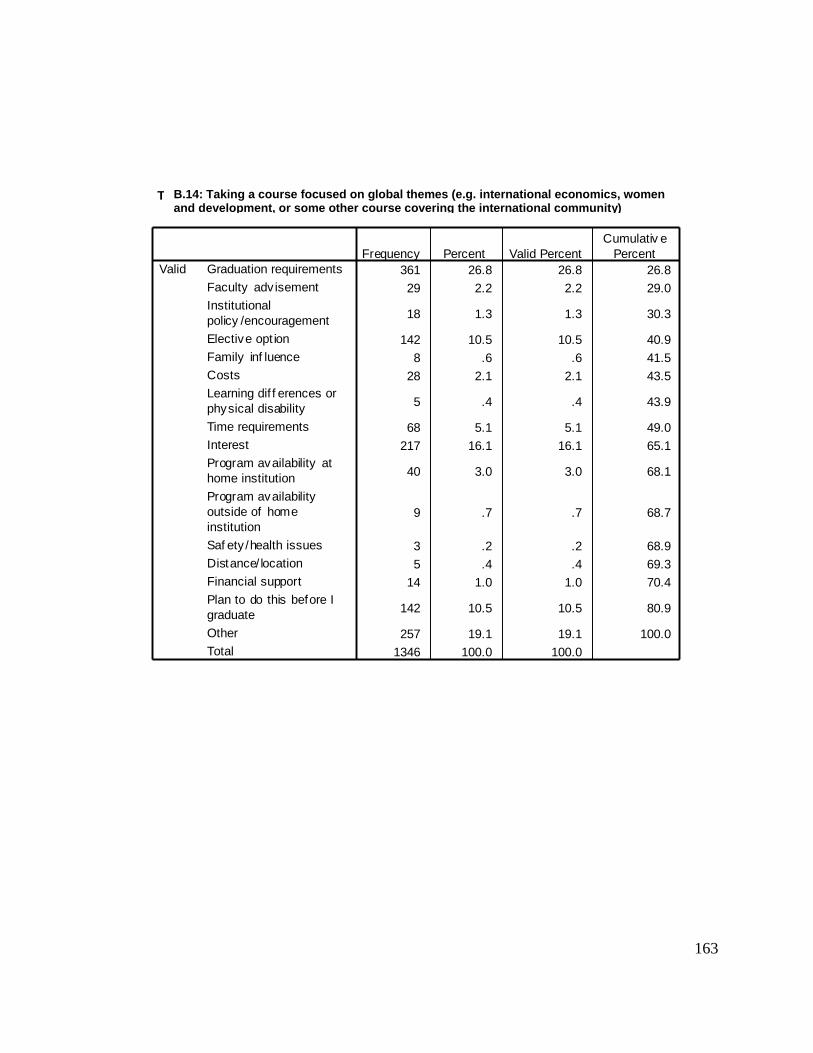
163
Taking a course focused on global themes (e.g. international economics, women and
development, or some other course covering the international community)
361 26.8 26.8 26.8
29 2.2 2.2 29.0
18 1.3 1.3 30.3
142 10.5 10.5 40.9
8 .6 .6 41.5
28 2.1 2.1 43.5
5 .4 .4 43.9
68 5.1 5.1 49.0
217 16.1 16.1 65.1
40 3.0 3.0 68.1
9 .7 .7 68.7
3 .2 .2 68.9
5 .4 .4 69.3
14 1.0 1.0 70.4
142 10.5 10.5 80.9
257 19.1 19.1 100.0
1346 100.0 100.0
Graduation requirements
Faculty adv isement
Institutional
policy /encouragement
Elective opt ion
Family inf luence
Costs
Learning dif f erences or
physical disability
Time requirements
Interest
Program availability at
home institution
Program availability
outside of home
institution
Saf ety /health issues
Distance/ location
Financial support
Plan to do this before I
graduate
Other
Total
Valid
Frequency Percent Valid Percent
Cumulativ e
Percent
B.14: Taking a course focused on global themes (e.g. international economics, women and development, or some other course covering the international community)
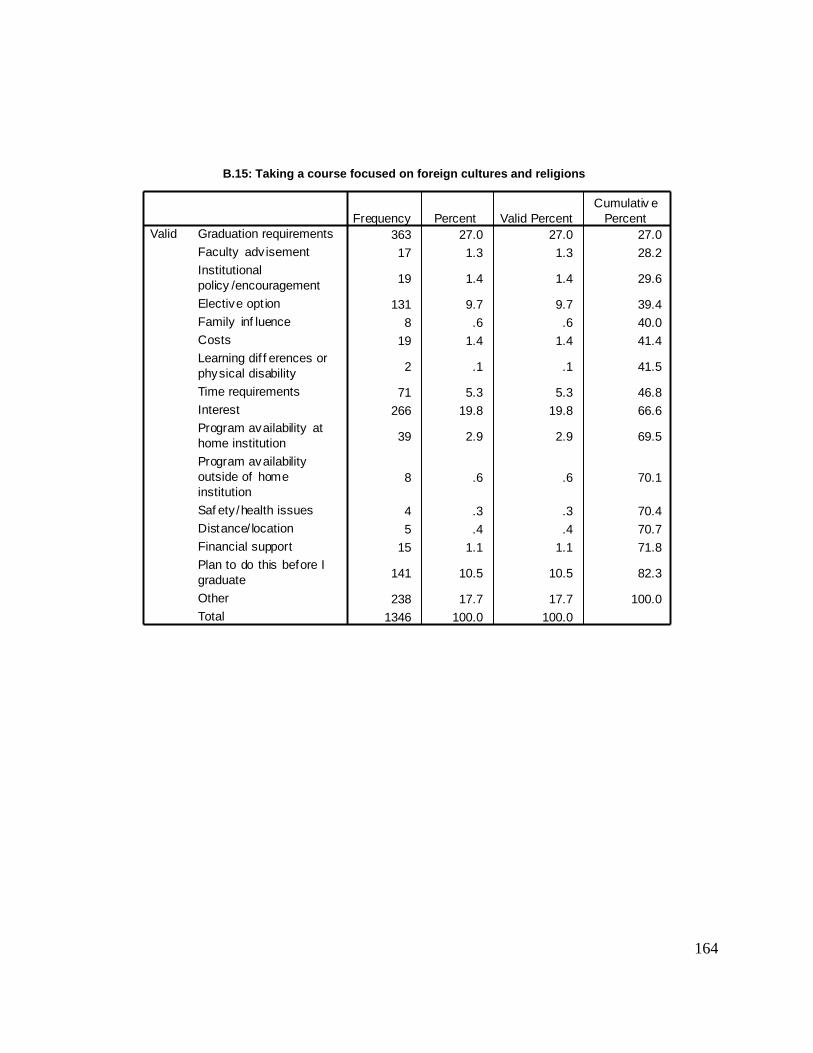
164
Taking a course focused on foreign cultures and rel igions
363 27.0 27.0 27.0
17 1.3 1.3 28.2
19 1.4 1.4 29.6
131 9.7 9.7 39.4
8 .6 .6 40.0
19 1.4 1.4 41.4
2 .1 .1 41.5
71 5.3 5.3 46.8
266 19.8 19.8 66.6
39 2.9 2.9 69.5
8 .6 .6 70.1
4 .3 .3 70.4
5 .4 .4 70.7
15 1.1 1.1 71.8
141 10.5 10.5 82.3
238 17.7 17.7 100.0
1346 100.0 100.0
Graduation requirements
Faculty adv isement
Institutional
policy /encouragement
Elective opt ion
Family inf luence
Costs
Learning dif f erences or
physical disability
Time requirements
Interest
Program availability at
home institution
Program availability
outside of home
institution
Saf ety /health issues
Distance/ location
Financial support
Plan to do this before I
graduate
Other
Total
Valid
Frequency Percent Valid Percent
Cumulativ e
Percent
B.15: Taking a course focused on foreign cultures and religions
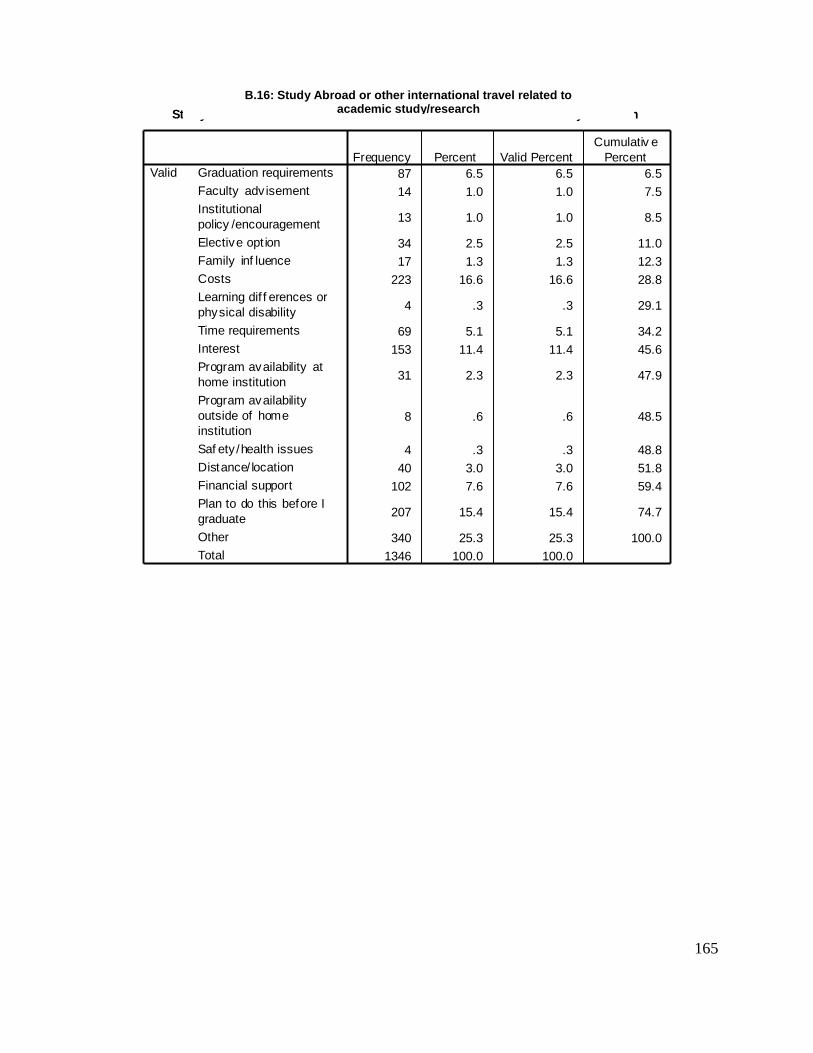
165
Study Abroad or other international travel related to academic study/research
87 6.5 6.5 6.5
14 1.0 1.0 7.5
13 1.0 1.0 8.5
34 2.5 2.5 11.0
17 1.3 1.3 12.3
223 16.6 16.6 28.8
4 .3 .3 29.1
69 5.1 5.1 34.2
153 11.4 11.4 45.6
31 2.3 2.3 47.9
8 .6 .6 48.5
4 .3 .3 48.8
40 3.0 3.0 51.8
102 7.6 7.6 59.4
207 15.4 15.4 74.7
340 25.3 25.3 100.0
1346 100.0 100.0
Graduation requirements
Faculty adv isement
Institutional
policy /encouragement
Elective opt ion
Family inf luence
Costs
Learning dif f erences or
physical disability
Time requirements
Interest
Program availability at
home institution
Program availability
outside of home
institution
Saf ety /health issues
Distance/ location
Financial support
Plan to do this before I
graduate
Other
Total
Valid
Frequency Percent Valid Percent
Cumulativ e
Percent
B.16: Study Abroad or other international travel related to academic study/research
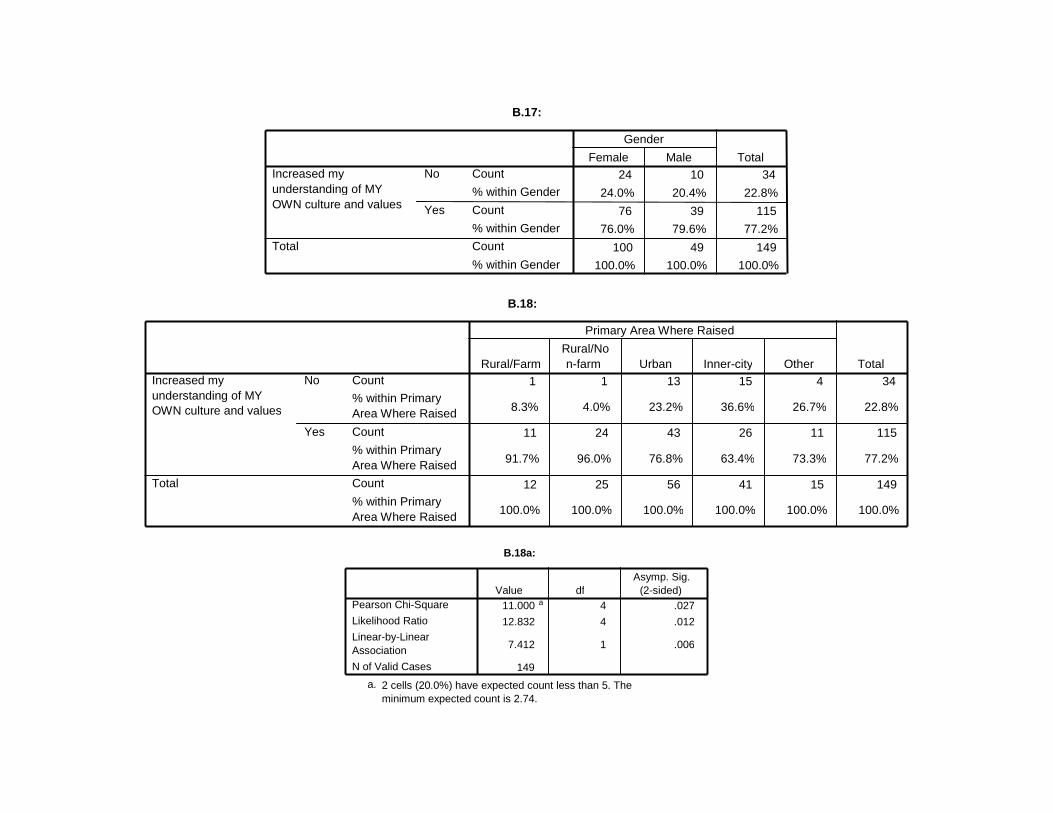
B.17:
24 10 34
24.0% 20.4% 22.8%
76 39 115 76.0% 79.6% 77.2%
100 49 149 100.0% 100.0% 100.0%
Count
% within Gender
Count
% within Gender Count
% within Gender
No
Yes
Increased my understanding of MY OWN culture and values
Total
Female Male
Gender
Total
B.18:
1 1 13 15 4 34
8.3% 4.0% 23.2% 36.6% 26.7% 22.8%
11 24 43 26 11 115
91.7% 96.0% 76.8% 63.4% 73.3% 77.2%
12 25 56 41 15 149
100.0% 100.0% 100.0% 100.0% 100.0% 100.0%
Count % within Primary Area Where Raised
Count
% within Primary Area Where Raised Count
% within Primary Area Where Raised
No
Yes
Increased my understanding of MY OWN culture and values
Total
Rural/Farm Rural/No n-farm Urban Inner-city Other
Primary Area Where Raised
Total
B.18a:
11.000 a 4 .027 12.832 4 .012
7.412 1 .006
149
Pearson Chi-Square Likelihood Ratio Linear-by-Linear Association N of Valid Cases
Value df Asymp. Sig.
(2-sided)
2 cells (20.0%) have expected count less than 5. The minimum expected count is 2.74.
a.

167
B.19:
18 16 34
28.1% 18.8% 22.8%
46 69 115
71.9% 81.2% 77.2%
64 85 149
100.0% 100.0% 100.0%
Count
% within First Generation College Student Count
% within First Generation College Student
Count % within First Generation College Student
No
Yes
Increased my understanding of MY OWN culture and values
Total
Yes No
First Generation College Student
Total
B.20:
5 9 7 13 34
27.8% 27.3% 24.1% 22.8% 22.8%
13 24 22 44 12 115
72.2% 72.7% 75.9% 77.2% 100.0% 77.2%
18 33 29 57 12 149
100.0% 100.0% 100.0% 100.0% 100.0% 100.0%
Count
% within Classification in Undergraduate Program
Count % within Classification in Undergraduate Program Count
% within Classification in Undergraduate Program
No
Yes
Increased my understanding of MY OWN culture and values
Total
Freshman Sophomore Junior Senior
Don't know/Unc lassified
Classification in Undergraduate Program
Total
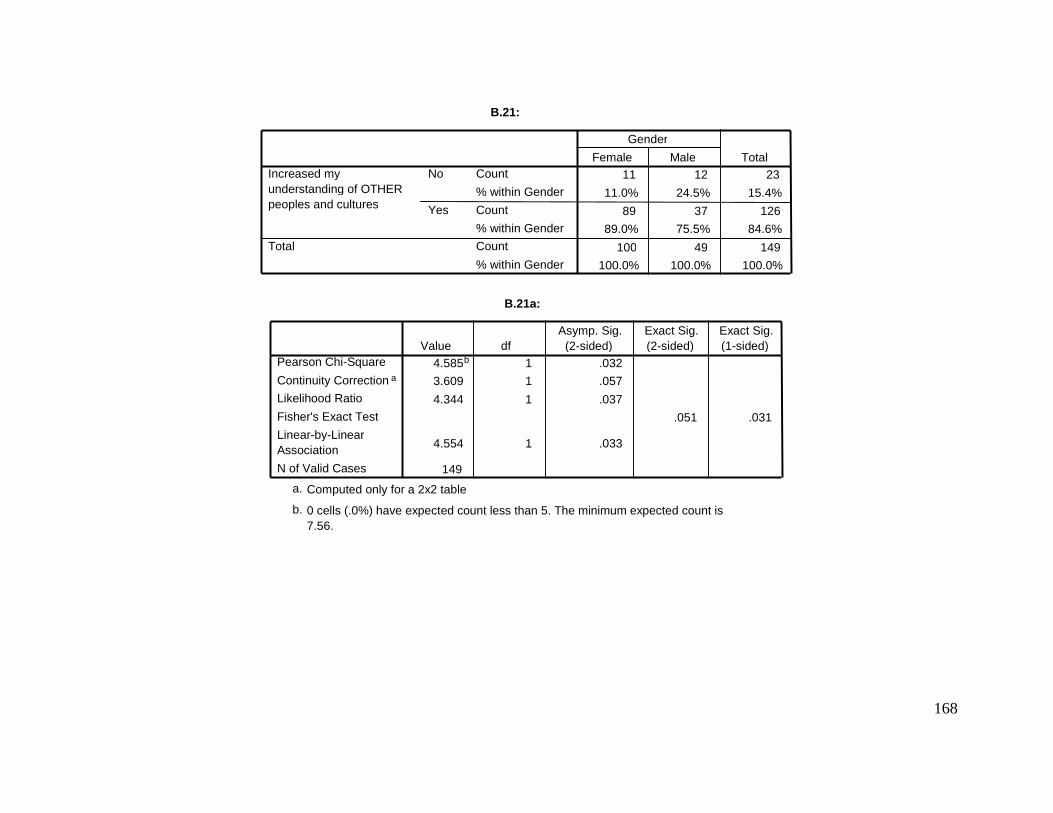
168
B.21:
11 12 23
11.0% 24.5% 15.4%
89 37 126 89.0% 75.5% 84.6%
100 49 149 100.0% 100.0% 100.0%
Count
% within Gender
Count
% within Gender Count
% within Gender
No
Yes
Increased my understanding of OTHER peoples and cultures
Total
Female Male
Gender
Total
B.21a:
4.585 b 1 .032 3.609 1 .057
4.344 1 .037 .051 .031
4.554 1 .033
149
Pearson Chi-Square
Continuity Correction a
Likelihood Ratio
Fisher's Exact Test
Linear-by-Linear Association
N of Valid Cases
Value df Asymp. Sig.
(2-sided) Exact Sig. (2-sided)
Exact Sig. (1-sided)
Computed only for a 2x2 table a.
0 cells (.0%) have expected count less than 5. The minimum expected count is 7.56.
b.
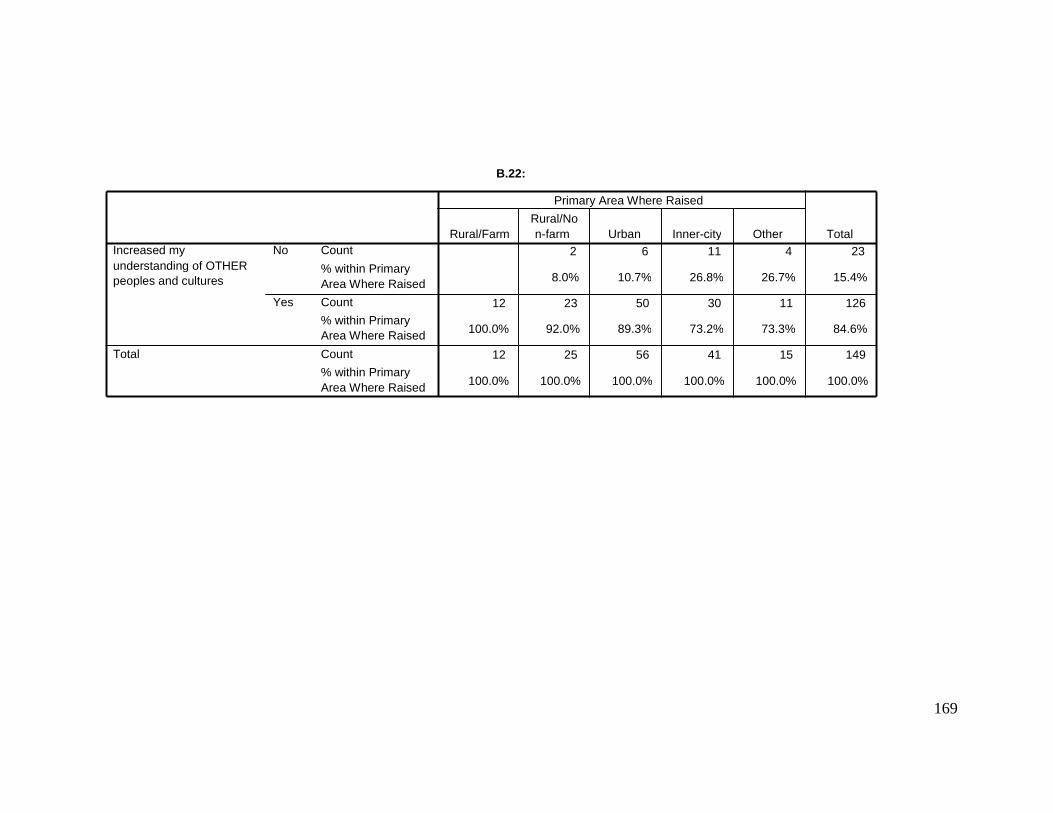
169
B.22:
2 6 11 4 23
8.0% 10.7% 26.8% 26.7% 15.4%
12 23 50 30 11 126
100.0% 92.0% 89.3% 73.2% 73.3% 84.6%
12 25 56 41 15 149
100.0% 100.0% 100.0% 100.0% 100.0% 100.0%
Count
% within Primary Area Where Raised
Count
% within Primary Area Where Raised
Count
% within Primary Area Where Raised
No
Yes
Increased my understanding of OTHER peoples and cultures
Total
Rural/Farm Rural/No n-farm Urban Inner-city Other
Primary Area Where Raised
Total
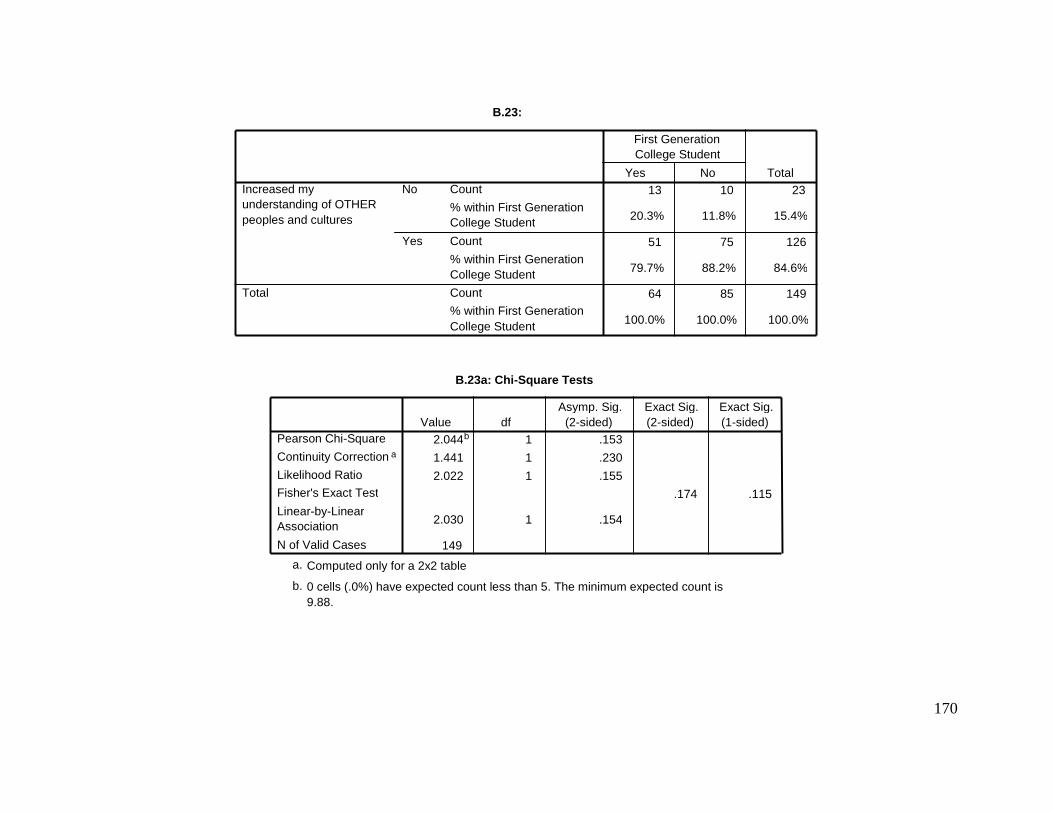
170
B.23:
13 10 23
20.3% 11.8% 15.4%
51 75 126
79.7% 88.2% 84.6%
64 85 149
100.0% 100.0% 100.0%
Count
% within First Generation College Student
Count
% within First Generation College Student
Count % within First Generation College Student
No
Yes
Increased my understanding of OTHER peoples and cultures
Total
Yes No
First Generation College Student
Total
B.23a: Chi-Square Tests
2.044 b 1 .153
1.441 1 .230
2.022 1 .155
.174 .115
2.030 1 .154
149
Pearson Chi-Square
Continuity Correction a
Likelihood Ratio Fisher's Exact Test
Linear-by-Linear Association
N of Valid Cases
Value df Asymp. Sig.
(2-sided) Exact Sig. (2-sided)
Exact Sig. (1-sided)
Computed only for a 2x2 table a.
0 cells (.0%) have expected count less than 5. The minimum expected count is 9.88.
b.
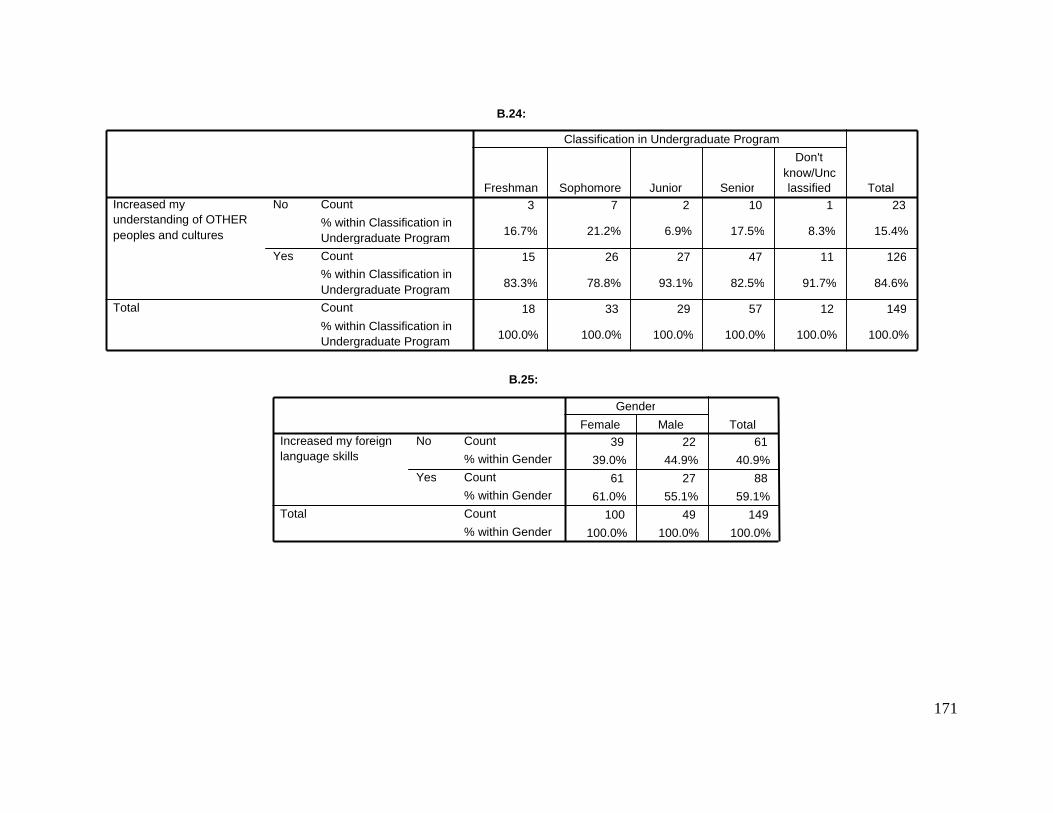
171
B.24:
3 7 2 10 1 23
16.7% 21.2% 6.9% 17.5% 8.3% 15.4%
15 26 27 47 11 126
83.3% 78.8% 93.1% 82.5% 91.7% 84.6%
18 33 29 57 12 149
100.0% 100.0% 100.0% 100.0% 100.0% 100.0%
Count
% within Classification in Undergraduate Program Count % within Classification in Undergraduate Program Count
% within Classification in Undergraduate Program
No
Yes
Increased my understanding of OTHER peoples and cultures
Total
Freshman Sophomore Junior Senior
Don't know/Unc lassified
Classification in Undergraduate Program
Total
B.25:
39 22 61
39.0% 44.9% 40.9%
61 27 88
61.0% 55.1% 59.1%
100 49 149
100.0% 100.0% 100.0%
Count
% within Gender
Count
% within Gender
Count
% within Gender
No
Yes
Increased my foreign language skills
Total
Female Male
Gender
Total
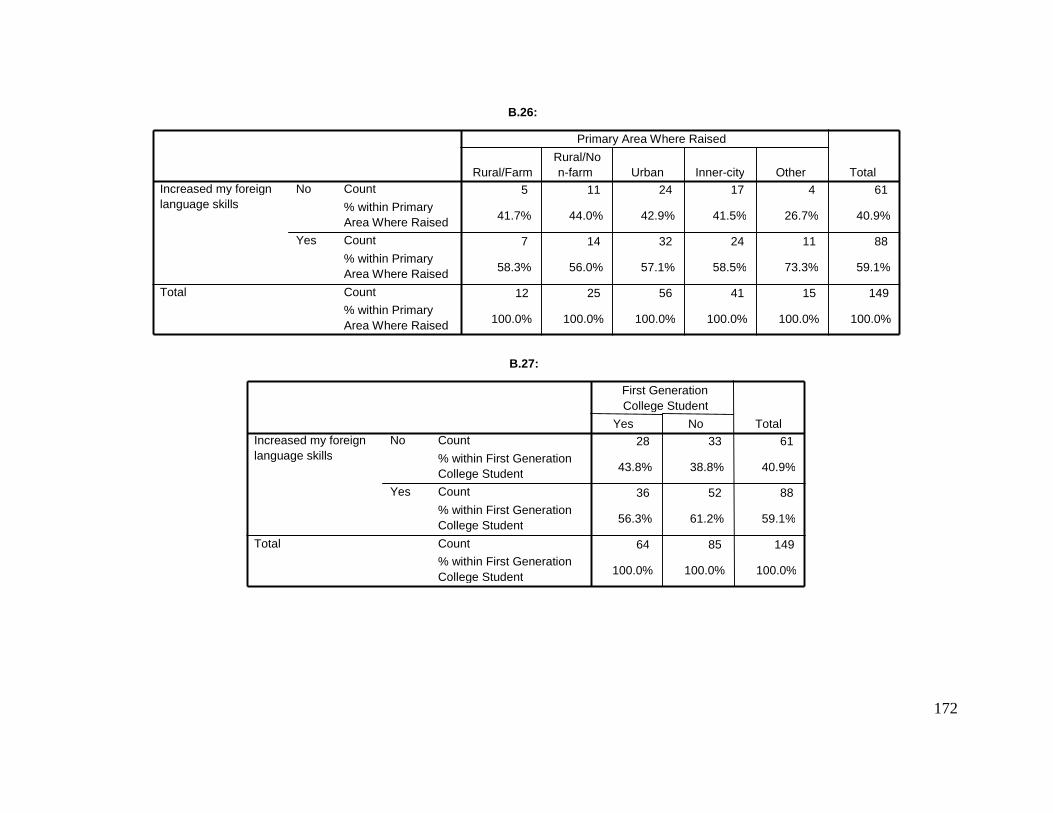
172
B.26:
5 11 24 17 4 61
41.7% 44.0% 42.9% 41.5% 26.7% 40.9%
7 14 32 24 11 88
58.3% 56.0% 57.1% 58.5% 73.3% 59.1%
12 25 56 41 15 149
100.0% 100.0% 100.0% 100.0% 100.0% 100.0%
Count
% within Primary Area Where Raised Count
% within Primary Area Where Raised
Count % within Primary Area Where Raised
No
Yes
Increased my foreign language skills
Total
Rural/Farm Rural/No n-farm Urban Inner-city Other
Primary Area Where Raised
Total
B.27:
28 33 61
43.8% 38.8% 40.9%
36 52 88
56.3% 61.2% 59.1%
64 85 149
100.0% 100.0% 100.0%
Count
% within First Generation College Student Count
% within First Generation College Student
Count % within First Generation College Student
No
Yes
Increased my foreign language skills
Total
Yes No
First Generation College Student
Total
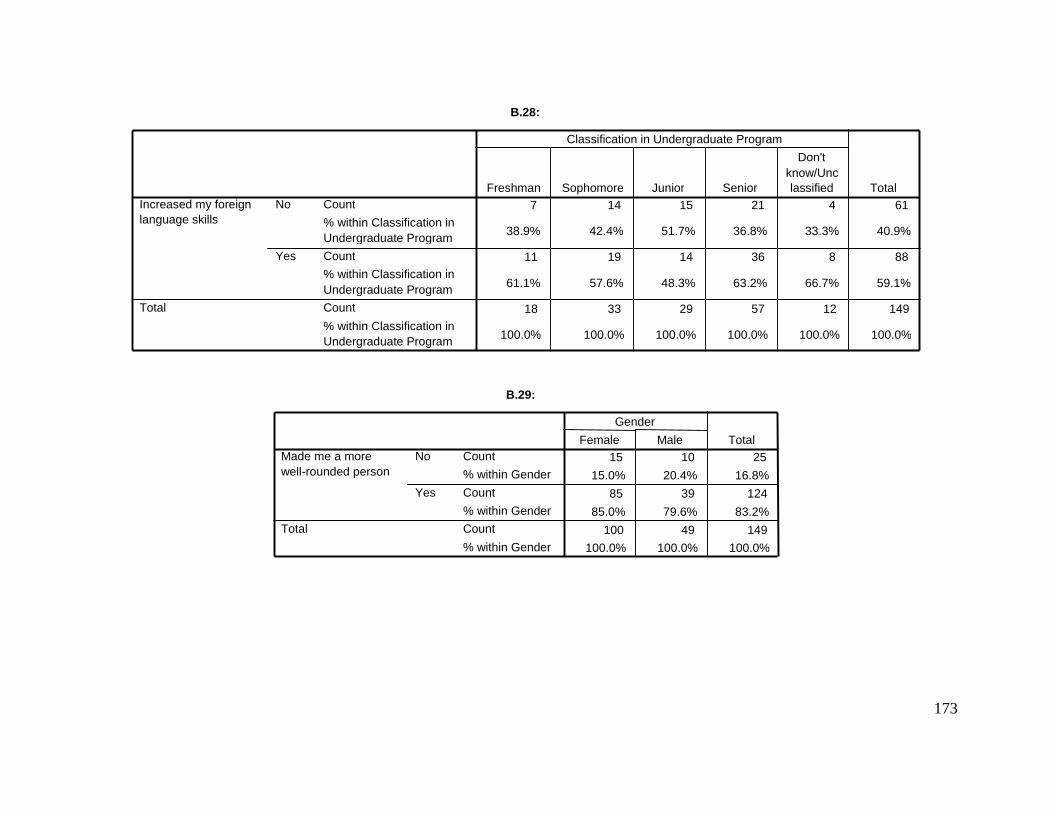
173
B.28:
7 14 15 21 4 61
38.9% 42.4% 51.7% 36.8% 33.3% 40.9%
11 19 14 36 8 88
61.1% 57.6% 48.3% 63.2% 66.7% 59.1%
18 33 29 57 12 149
100.0% 100.0% 100.0% 100.0% 100.0% 100.0%
Count
% within Classification in Undergraduate Program Count % within Classification in Undergraduate Program Count
% within Classification in Undergraduate Program
No
Yes
Increased my foreign language skills
Total
Freshman Sophomore Junior Senior
Don't know/Unc lassified
Classification in Undergraduate Program
Total
B.29:
15 10 25
15.0% 20.4% 16.8%
85 39 124
85.0% 79.6% 83.2%
100 49 149 100.0% 100.0% 100.0%
Count
% within Gender
Count
% within Gender Count
% within Gender
No
Yes
Made me a more well-rounded person
Total
Female Male
Gender
Total

174
B.30:
2 1 8 10 4 25
16.7% 4.0% 14.3% 24.4% 26.7% 16.8%
10 24 48 31 11 124
83.3% 96.0% 85.7% 75.6% 73.3% 83.2%
12 25 56 41 15 149
100.0% 100.0% 100.0% 100.0% 100.0% 100.0%
Count
% within Primary Area Where Raised
Count
% within Primary Area Where Raised
Count % within Primary Area Where Raised
No
Yes
Made me a more well-rounded person
Total
Rural/Farm Rural/No n-farm Urban Inner-city Other
Primary Area Where Raised
Total
B.31:
11 14 25
17.2% 16.5% 16.8%
53 71 124
82.8% 83.5% 83.2%
64 85 149
100.0% 100.0% 100.0%
Count % within First Generation College Student
Count
% within First Generation College Student Count
% within First Generation College Student
No
Yes
Made me a more well-rounded person
Total
Yes No
First Generation College Student
Total
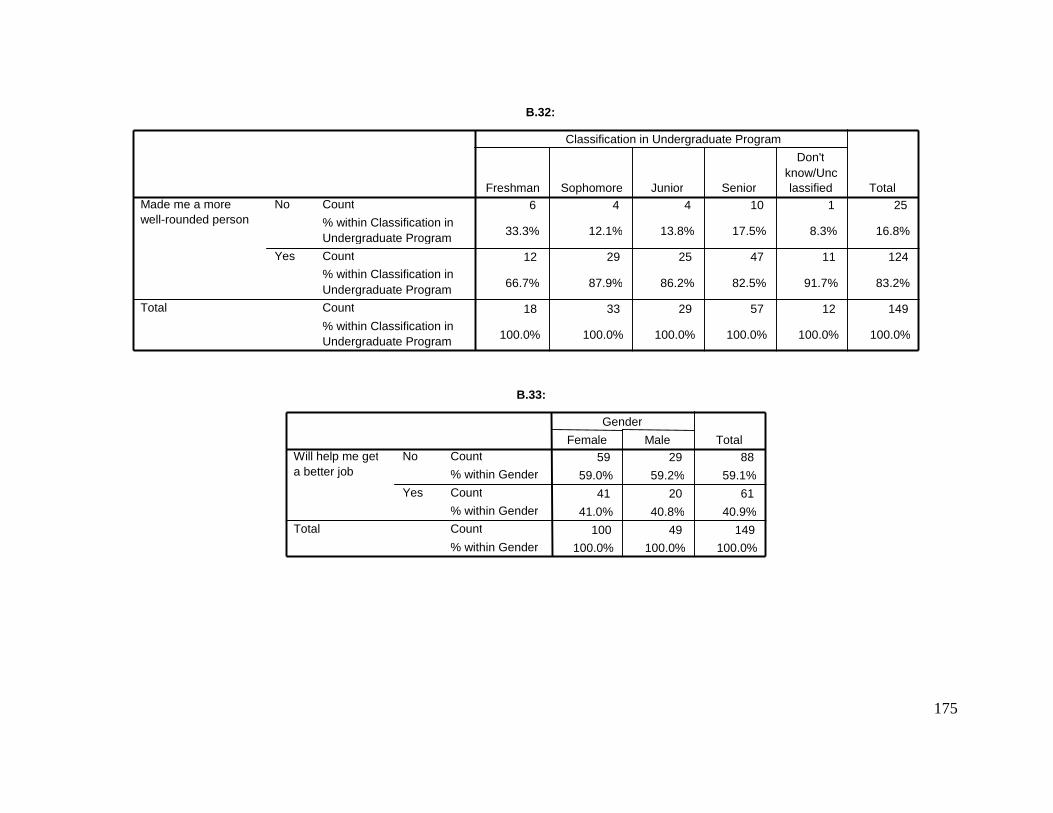
175
B.32:
6 4 4 10 1 25
33.3% 12.1% 13.8% 17.5% 8.3% 16.8%
12 29 25 47 11 124
66.7% 87.9% 86.2% 82.5% 91.7% 83.2%
18 33 29 57 12 149
100.0% 100.0% 100.0% 100.0% 100.0% 100.0%
Count
% within Classification in Undergraduate Program Count % within Classification in Undergraduate Program Count
% within Classification in Undergraduate Program
No
Yes
Made me a more well-rounded person
Total
Freshman Sophomore Junior Senior
Don't know/Unc lassified
Classification in Undergraduate Program
Total
B.33:
59 29 88
59.0% 59.2% 59.1%
41 20 61
41.0% 40.8% 40.9%
100 49 149 100.0% 100.0% 100.0%
Count
% within Gender
Count
% within Gender Count
% within Gender
No
Yes
Will help me get a better job
Total
Female Male
Gender
Total
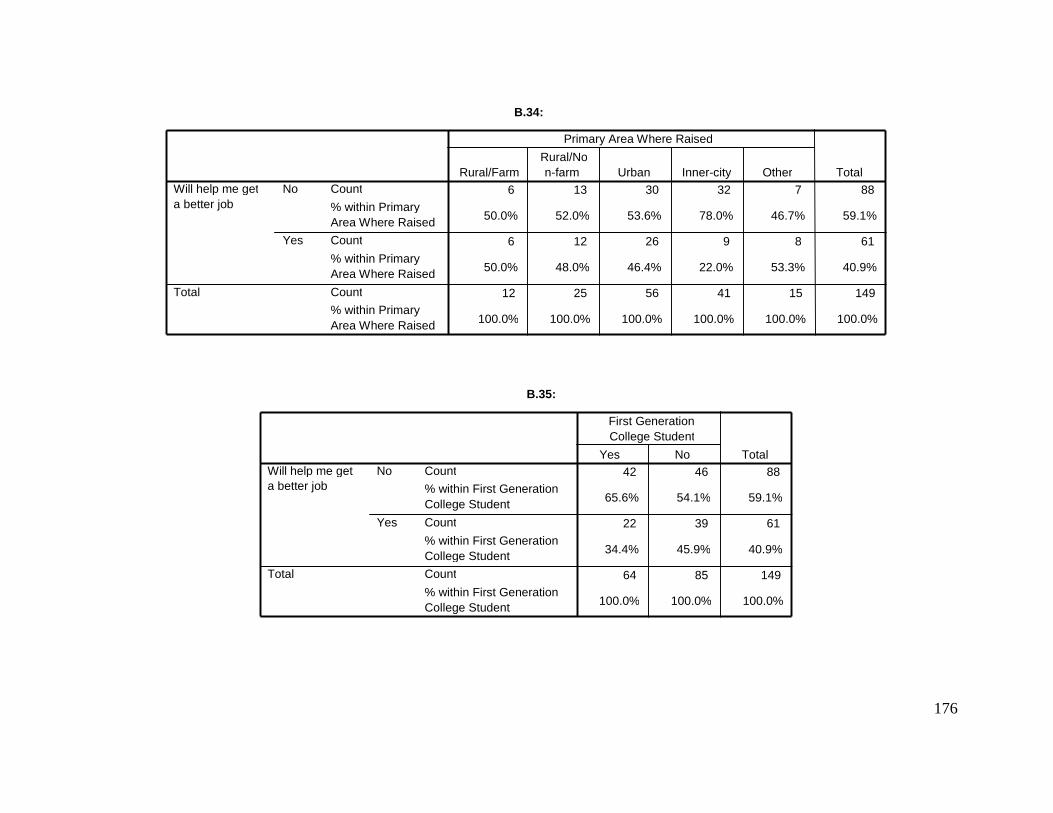
176
B.34:
6 13 30 32 7 88
50.0% 52.0% 53.6% 78.0% 46.7% 59.1%
6 12 26 9 8 61
50.0% 48.0% 46.4% 22.0% 53.3% 40.9%
12 25 56 41 15 149
100.0% 100.0% 100.0% 100.0% 100.0% 100.0%
Count
% within Primary Area Where Raised Count
% within Primary Area Where Raised
Count % within Primary Area Where Raised
No
Yes
Will help me get a better job
Total
Rural/Farm Rural/No n-farm Urban Inner-city Other
Primary Area Where Raised
Total
B.35:
42 46 88
65.6% 54.1% 59.1%
22 39 61
34.4% 45.9% 40.9%
64 85 149
100.0% 100.0% 100.0%
Count % within First Generation College Student
Count
% within First Generation College Student Count
% within First Generation College Student
No
Yes
Will help me get a better job
Total
Yes No
First Generation College Student
Total
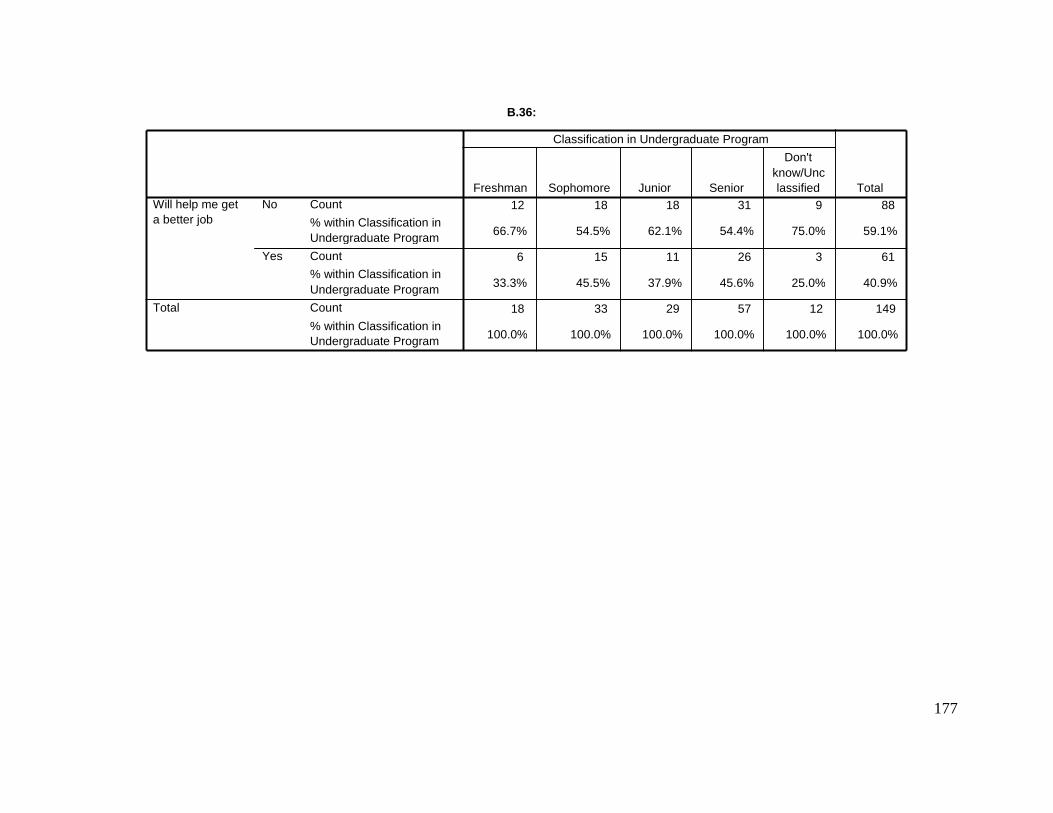
177
B.36:
12 18 18 31 9 88
66.7% 54.5% 62.1% 54.4% 75.0% 59.1%
6 15 11 26 3 61
33.3% 45.5% 37.9% 45.6% 25.0% 40.9%
18 33 29 57 12 149
100.0% 100.0% 100.0% 100.0% 100.0% 100.0%
Count
% within Classification in Undergraduate Program
Count % within Classification in Undergraduate Program Count
% within Classification in Undergraduate Program
No
Yes
Will help me get a better job
Total
Freshman Sophomore Junior Senior
Don't know/Unc lassified
Classification in Undergraduate Program
Total
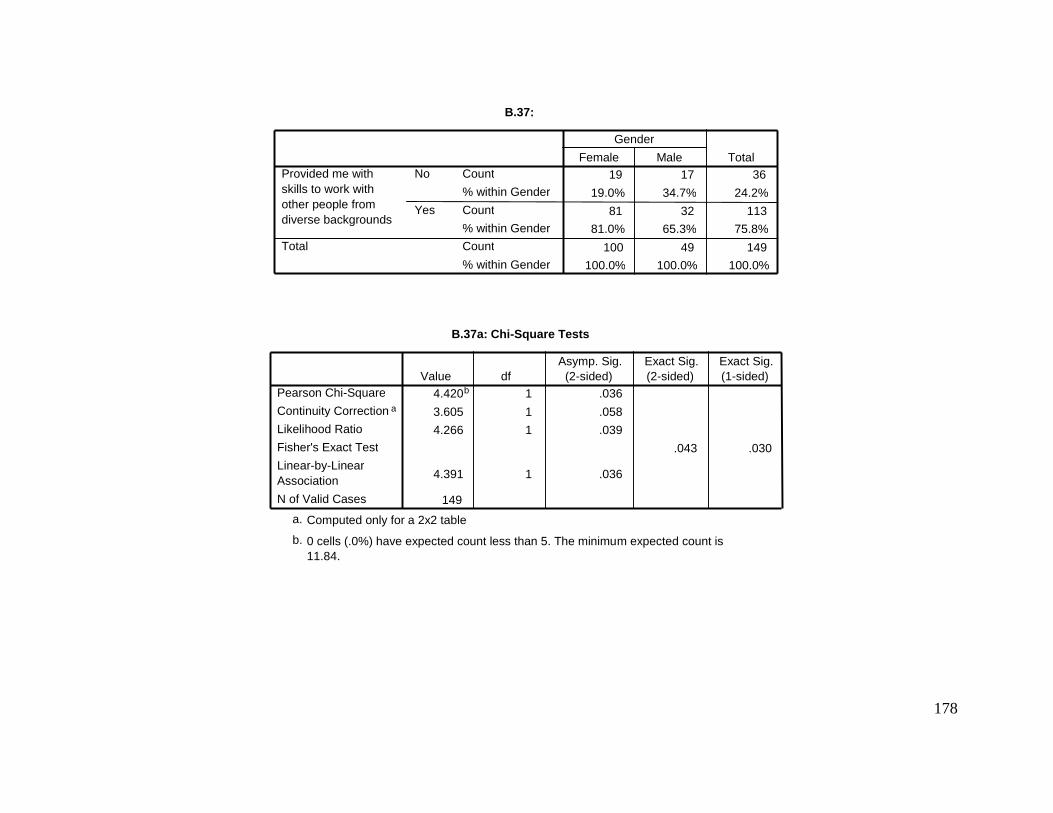
178
B.37:
19 17 36
19.0% 34.7% 24.2%
81 32 113 81.0% 65.3% 75.8%
100 49 149 100.0% 100.0% 100.0%
Count
% within Gender
Count
% within Gender Count
% within Gender
No
Yes
Provided me with skills to work with other people from diverse backgrounds
Total
Female Male
Gender
Total
B.37a: Chi-Square Tests
4.420 b 1 .036
3.605 1 .058
4.266 1 .039
.043 .030
4.391 1 .036
149
Pearson Chi-Square
Continuity Correction a
Likelihood Ratio
Fisher's Exact Test
Linear-by-Linear Association
N of Valid Cases
Value df Asymp. Sig.
(2-sided) Exact Sig. (2-sided)
Exact Sig. (1-sided)
Computed only for a 2x2 table a.
0 cells (.0%) have expected count less than 5. The minimum expected count is 11.84.
b.
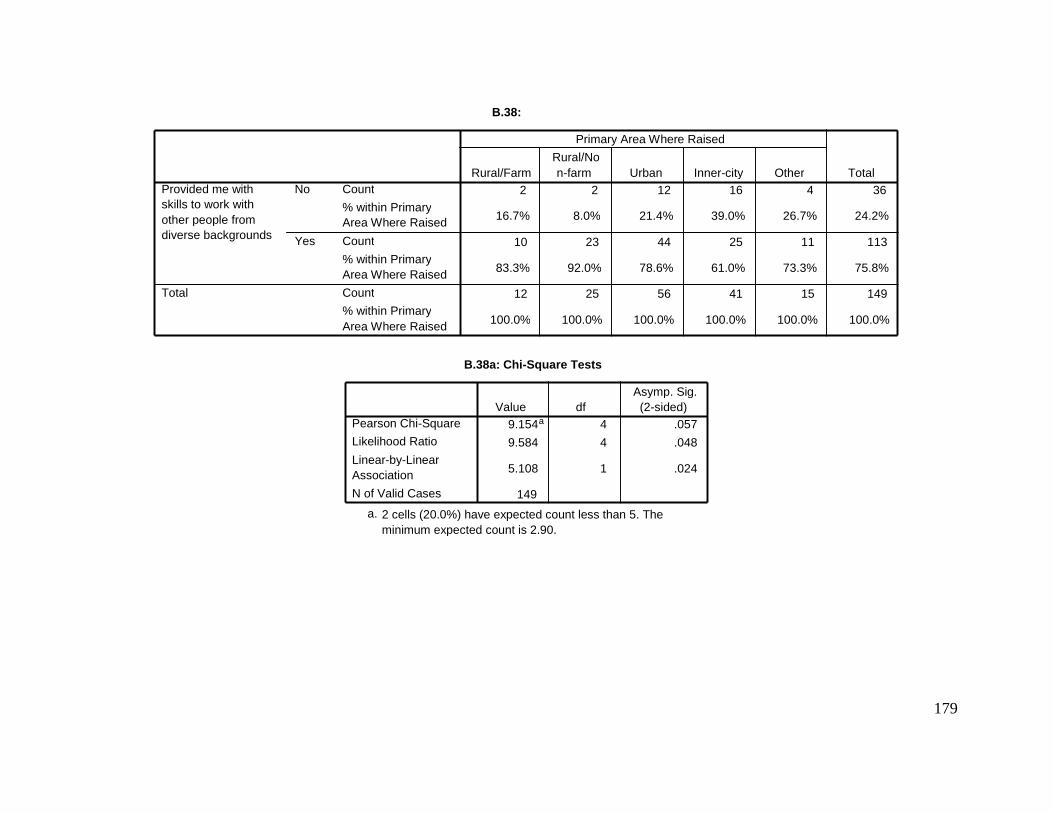
179
B.38:
2 2 12 16 4 36
16.7% 8.0% 21.4% 39.0% 26.7% 24.2%
10 23 44 25 11 113
83.3% 92.0% 78.6% 61.0% 73.3% 75.8%
12 25 56 41 15 149
100.0% 100.0% 100.0% 100.0% 100.0% 100.0%
Count
% within Primary Area Where Raised
Count
% within Primary Area Where Raised
Count % within Primary Area Where Raised
No
Yes
Provided me with skills to work with other people from diverse backgrounds
Total
Rural/Farm Rural/No n-farm Urban Inner-city Other
Primary Area Where Raised
Total
B.38a: Chi-Square Tests
9.154 a 4 .057
9.584 4 .048
5.108 1 .024
149
Pearson Chi-Square Likelihood Ratio
Linear-by-Linear Association
N of Valid Cases
Value df Asymp. Sig. (2-sided)
2 cells (20.0%) have expected count less than 5. The minimum expected count is 2.90.
a.
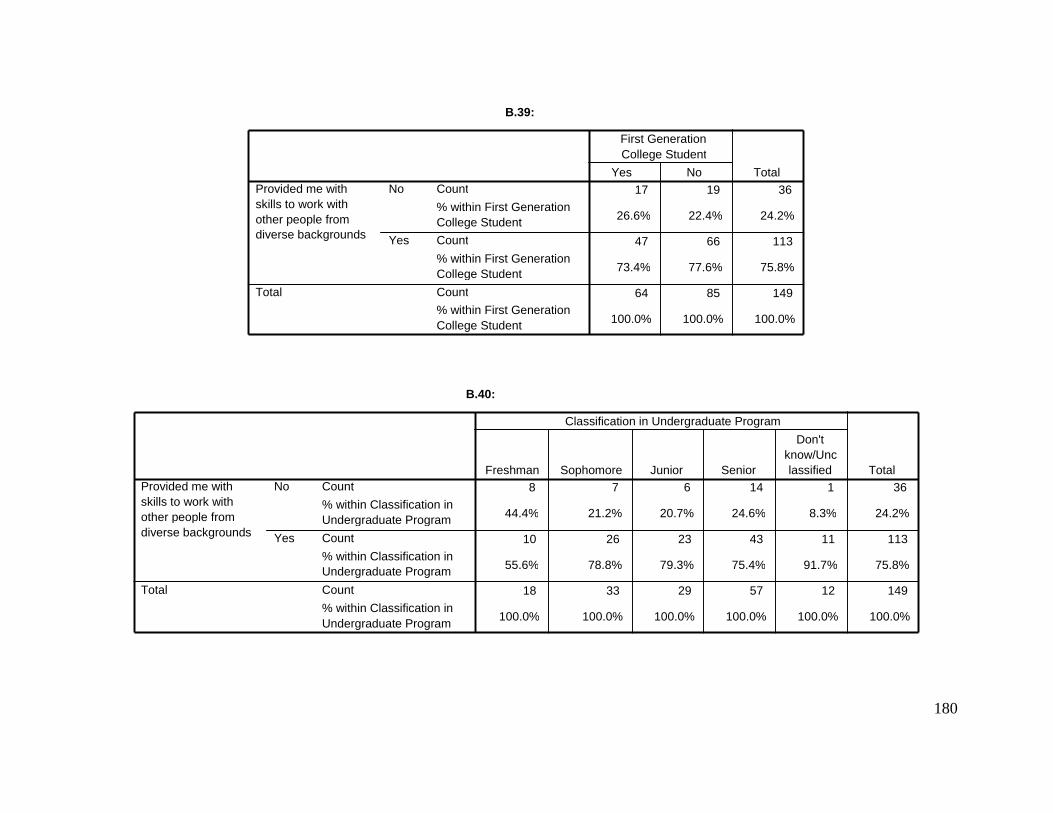
180
B.39:
17 19 36
26.6% 22.4% 24.2%
47 66 113
73.4% 77.6% 75.8%
64 85 149
100.0% 100.0% 100.0%
Count
% within First Generation College Student Count
% within First Generation College Student
Count % within First Generation College Student
No
Yes
Provided me with skills to work with other people from diverse backgrounds
Total
Yes No
First Generation College Student
Total
B.40:
8 7 6 14 1 36
44.4% 21.2% 20.7% 24.6% 8.3% 24.2%
10 26 23 43 11 113
55.6% 78.8% 79.3% 75.4% 91.7% 75.8%
18 33 29 57 12 149
100.0% 100.0% 100.0% 100.0% 100.0% 100.0%
Count
% within Classification in Undergraduate Program
Count
% within Classification in Undergraduate Program
Count
% within Classification in Undergraduate Program
No
Yes
Provided me with skills to work with other people from diverse backgrounds
Total
Freshman Sophomore Junior Senior
Don't know/Unc lassified
Classification in Undergraduate Program
Total
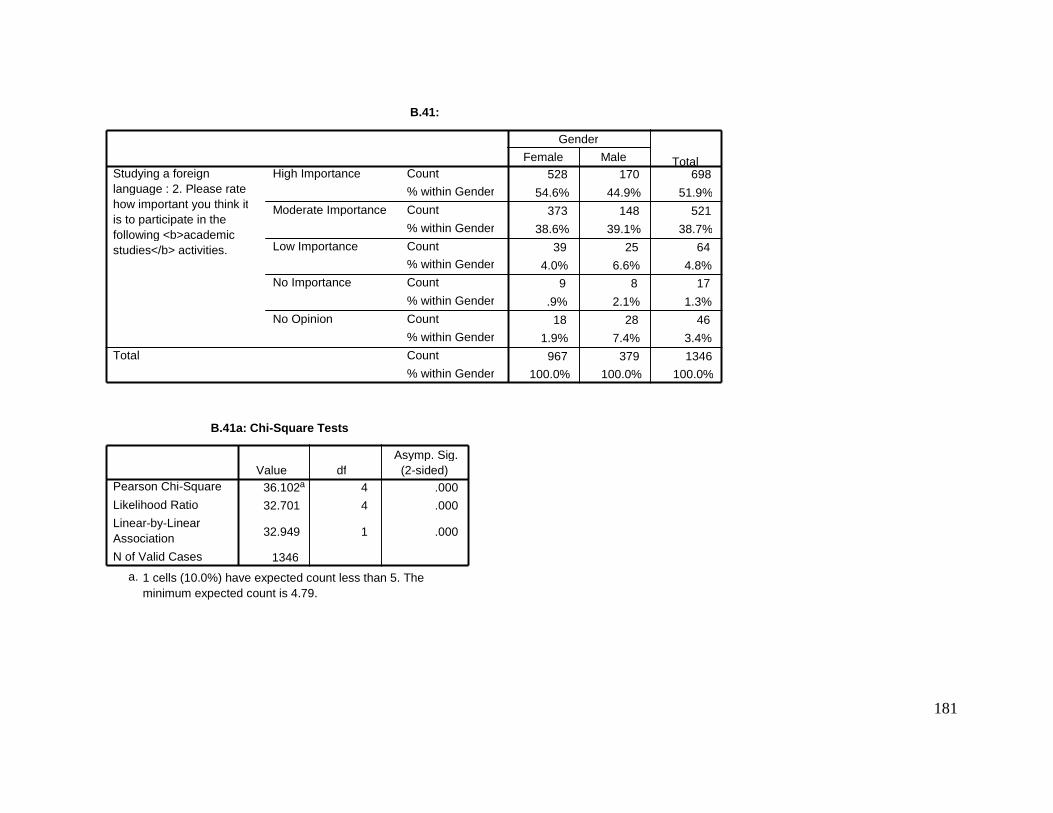
181
B.41:
528 170 698
54.6% 44.9% 51.9%
373 148 521
38.6% 39.1% 38.7%
39 25 64
4.0% 6.6% 4.8% 9 8 17
.9% 2.1% 1.3%
18 28 46
1.9% 7.4% 3.4%
967 379 1346 100.0% 100.0% 100.0%
Count % within Gender
Count
% within Gender
Count % within Gender
Count
% within Gender
Count
% within Gender
Count
% within Gender
High Importance
Moderate Importance
Low Importance
No Importance
No Opinion
Studying a foreign language : 2. Please rate how important you think it is to participate in the following <b>academic studies</b> activities.
Total
Female Male Gender
Total
B.41a: Chi-Square Tests
36.102 a 4 .000 32.701 4 .000
32.949 1 .000
1346
Pearson Chi-Square
Likelihood Ratio
Linear-by-Linear Association
N of Valid Cases
Value df Asymp. Sig.
(2-sided)
1 cells (10.0%) have expected count less than 5. The minimum expected count is 4.79.
a.
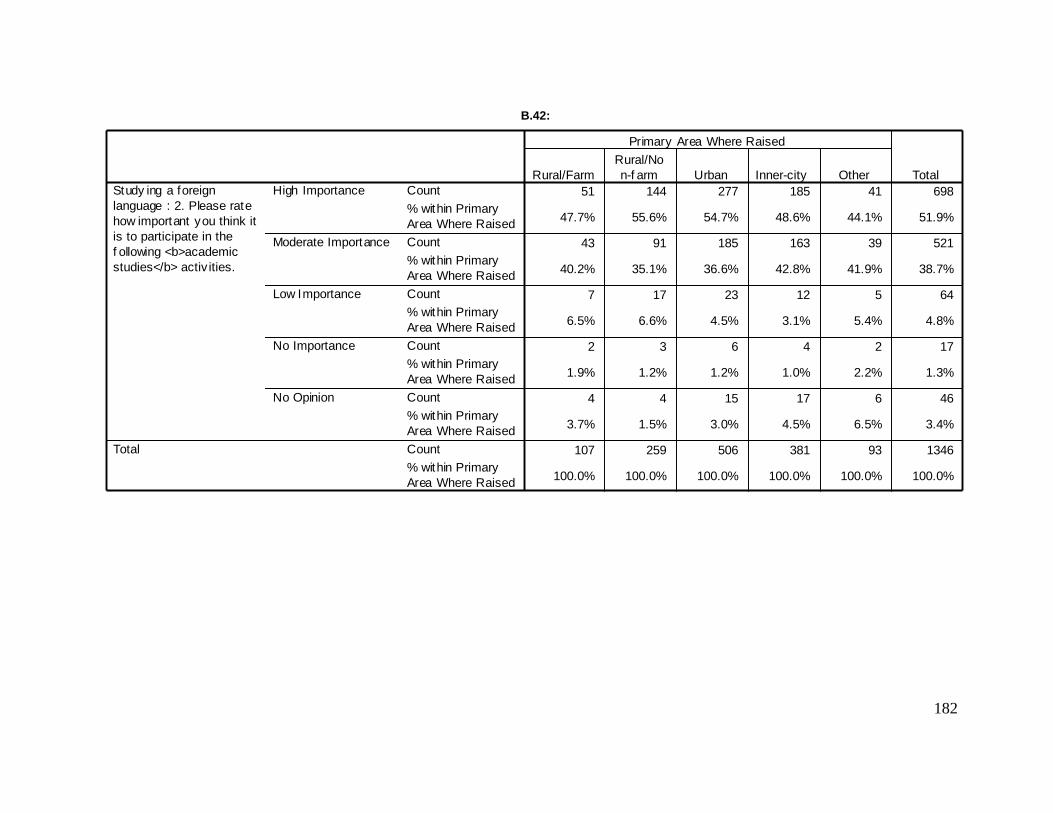
182
Crosstab
51 144 277 185 41 698
47.7% 55.6% 54.7% 48.6% 44.1% 51.9%
43 91 185 163 39 521
40.2% 35.1% 36.6% 42.8% 41.9% 38.7%
7 17 23 12 5 64
6.5% 6.6% 4.5% 3.1% 5.4% 4.8%
2 3 6 4 2 17
1.9% 1.2% 1.2% 1.0% 2.2% 1.3%
4 4 15 17 6 46
3.7% 1.5% 3.0% 4.5% 6.5% 3.4%
107 259 506 381 93 1346
100.0% 100.0% 100.0% 100.0% 100.0% 100.0%
Count
% within Primary
Area Where Raised
Count
% within Primary
Area Where Raised
Count
% within Primary
Area Where Raised
Count
% within Primary
Area Where Raised
Count
% within Primary
Area Where Raised
Count
% within Primary
Area Where Raised
High Importance
Moderate Importance
Low Importance
No Importance
No Opinion
Study ing a foreign
language : 2. Please rate
how important you think it
is to participate in the
f ollowing <b>academic
studies</b> activ ities.
Total
Rural/Farm
Rural/No
n-f arm Urban Inner-city Other
Primary Area Where Raised
Total
B.42:
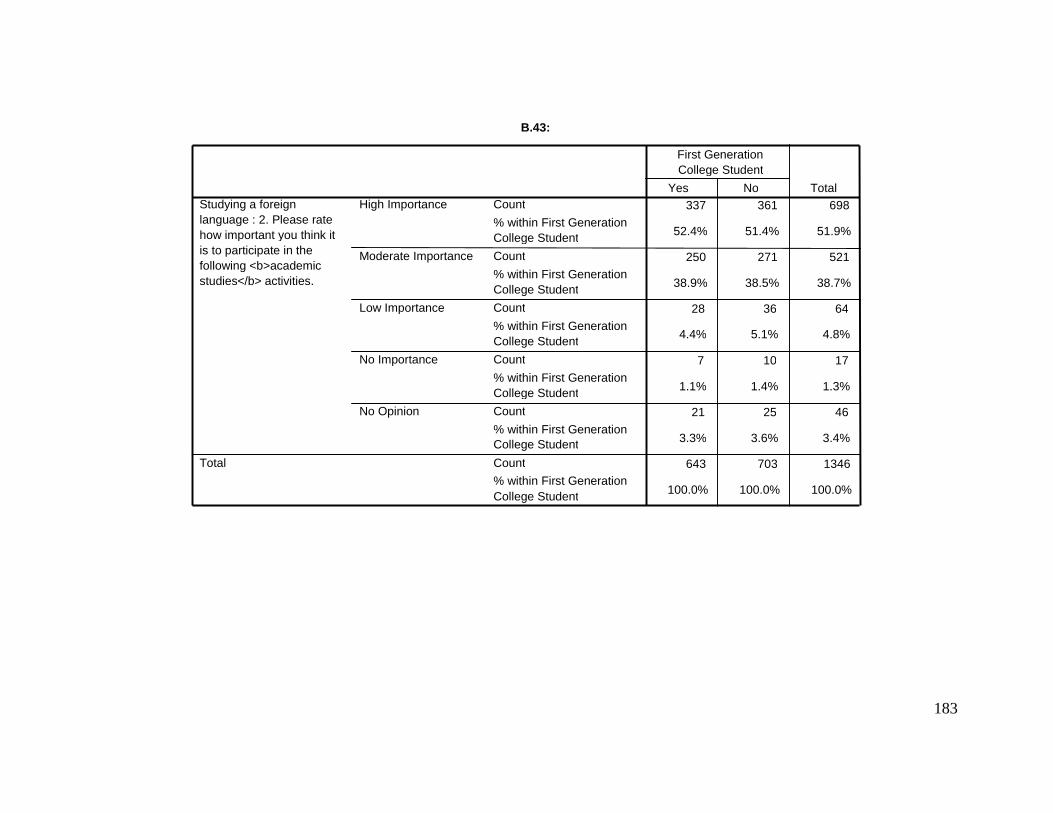
183
B.43:
337 361 698
52.4% 51.4% 51.9%
250 271 521
38.9% 38.5% 38.7%
28 36 64
4.4% 5.1% 4.8%
7 10 17
1.1% 1.4% 1.3%
21 25 46
3.3% 3.6% 3.4%
643 703 1346
100.0% 100.0% 100.0%
Count
% within First Generation College Student
Count
% within First Generation College Student
Count
% within First Generation College Student
Count
% within First Generation College Student
Count
% within First Generation College Student
Count % within First Generation College Student
High Importance
Moderate Importance
Low Importance
No Importance
No Opinion
Studying a foreign language : 2. Please rate how important you think it is to participate in the following <b>academic studies</b> activities.
Total
Yes No
First Generation College Student
Total
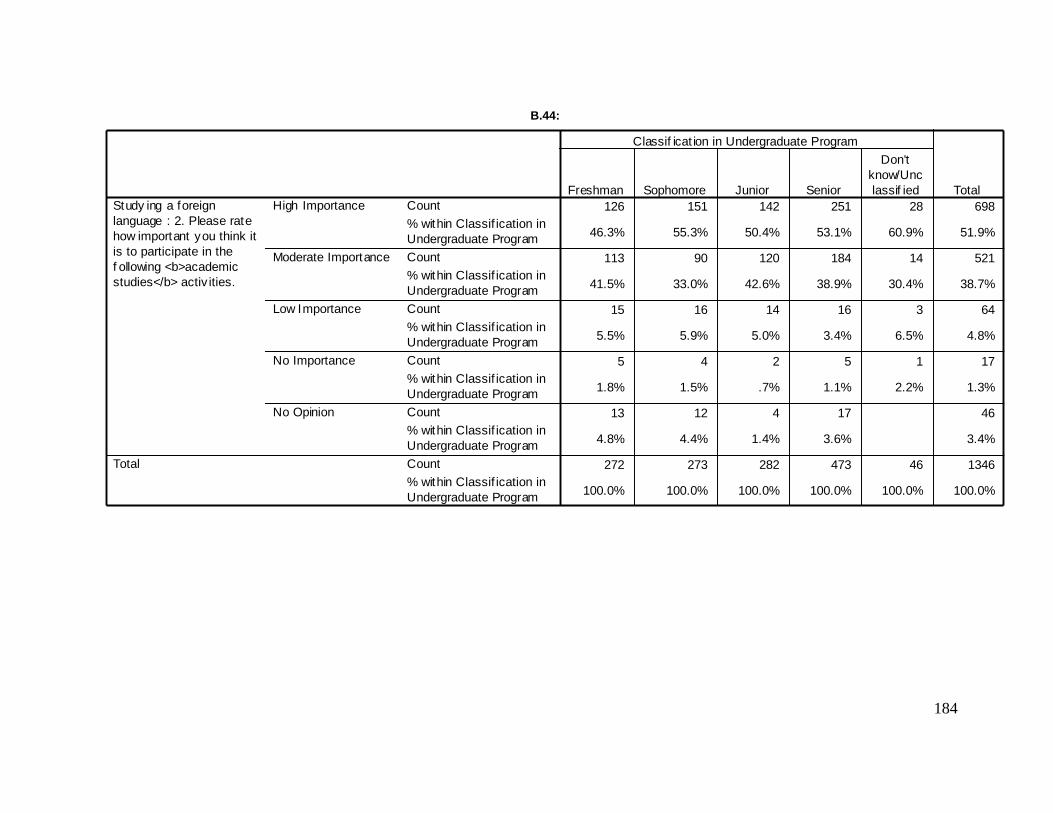
184
Crosstab
126 151 142 251 28 698
46.3% 55.3% 50.4% 53.1% 60.9% 51.9%
113 90 120 184 14 521
41.5% 33.0% 42.6% 38.9% 30.4% 38.7%
15 16 14 16 3 64
5.5% 5.9% 5.0% 3.4% 6.5% 4.8%
5 4 2 5 1 17
1.8% 1.5% .7% 1.1% 2.2% 1.3%
13 12 4 17 46
4.8% 4.4% 1.4% 3.6% 3.4%
272 273 282 473 46 1346
100.0% 100.0% 100.0% 100.0% 100.0% 100.0%
Count
% within Classif ication in
Undergraduate Program
Count
% within Classif ication in
Undergraduate Program
Count
% within Classif ication in
Undergraduate Program
Count
% within Classif ication in
Undergraduate Program
Count
% within Classif ication in
Undergraduate Program
Count
% within Classif ication in
Undergraduate Program
High Importance
Moderate Importance
Low Importance
No Importance
No Opinion
Study ing a foreign
language : 2. Please rate
how important you think it
is to participate in the
f ollowing <b>academic
studies</b> activ ities.
Total
Freshman Sophomore Junior Senior
Don't
know/Unc
lassif ied
Classif icat ion in Undergraduate Program
Total
B.44:
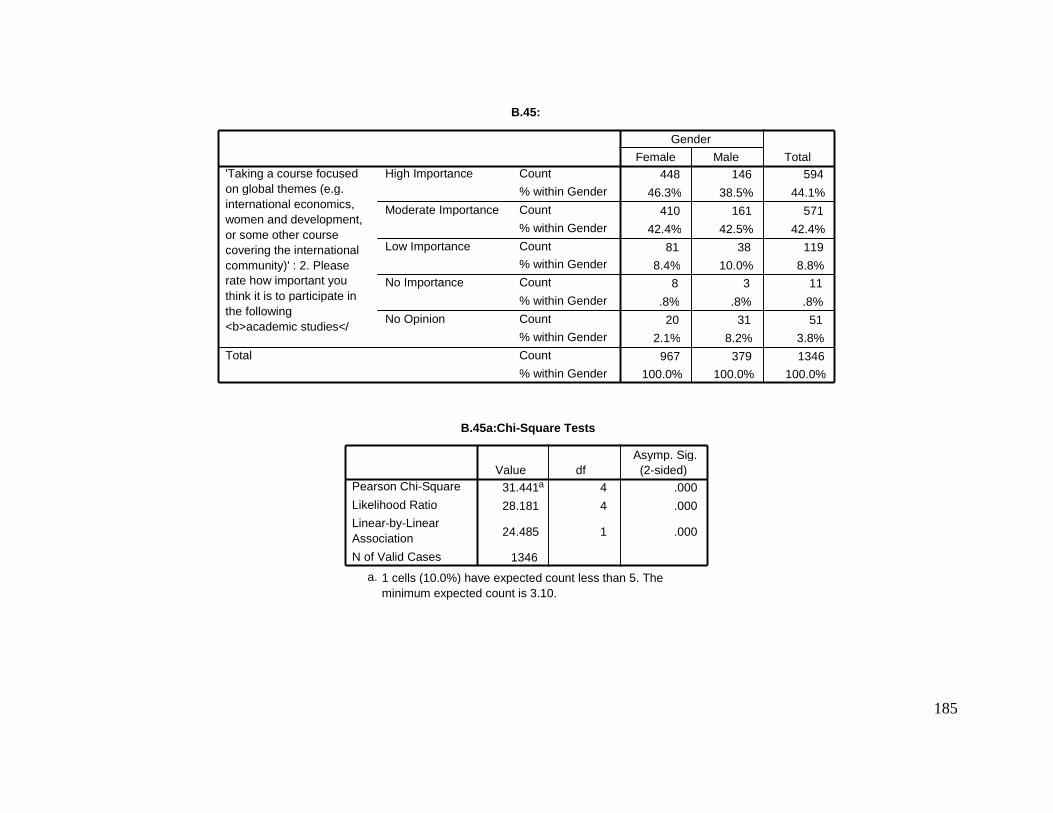
185
B.45:
448 146 594
46.3% 38.5% 44.1%
410 161 571
42.4% 42.5% 42.4%
81 38 119
8.4% 10.0% 8.8% 8 3 11
.8% .8% .8%
20 31 51
2.1% 8.2% 3.8%
967 379 1346 100.0% 100.0% 100.0%
Count % within Gender
Count
% within Gender
Count % within Gender
Count
% within Gender
Count
% within Gender
Count
% within Gender
High Importance
Moderate Importance
Low Importance
No Importance
No Opinion
'Taking a course focused on global themes (e.g. international economics, women and development, or some other course covering the international community)' : 2. Please rate how important you think it is to participate in the following <b>academic studies</
Total
Female Male Gender
Total
B.45a:Chi-Square Tests
31.441 a 4 .000
28.181 4 .000
24.485 1 .000
1346
Pearson Chi-Square
Likelihood Ratio
Linear-by-Linear Association
N of Valid Cases
Value df Asymp. Sig. (2-sided)
1 cells (10.0%) have expected count less than 5. The minimum expected count is 3.10.
a.

186
Crosstab
51 106 231 163 43 594
47.7% 40.9% 45.7% 42.8% 46.2% 44.1%
36 120 210 168 37 571
33.6% 46.3% 41.5% 44.1% 39.8% 42.4%
15 27 43 28 6 119
14.0% 10.4% 8.5% 7.3% 6.5% 8.8%
1 5 4 1 11
.4% 1.0% 1.0% 1.1% .8%
5 5 17 18 6 51
4.7% 1.9% 3.4% 4.7% 6.5% 3.8%
107 259 506 381 93 1346
100.0% 100.0% 100.0% 100.0% 100.0% 100.0%
Count
% within Primary
Area Where Raised
Count
% within Primary
Area Where Raised
Count
% within Primary
Area Where Raised
Count
% within Primary
Area Where Raised
Count
% within Primary
Area Where Raised
Count
% within Primary
Area Where Raised
High Importance
Moderate Importance
Low Importance
No Importance
No Opinion
'Taking a course focused
on global themes (e.g.
international economics,
women and dev elopment,
or some other course
covering the internat ional
community)' : 2. Please
rate how important y ou
think it is to part icipate in
the f ollowing
<b>academic studies</
Total
Rural/Farm
Rural/No
n-f arm Urban Inner-city Other
Primary Area Where Raised
Total
B.46:
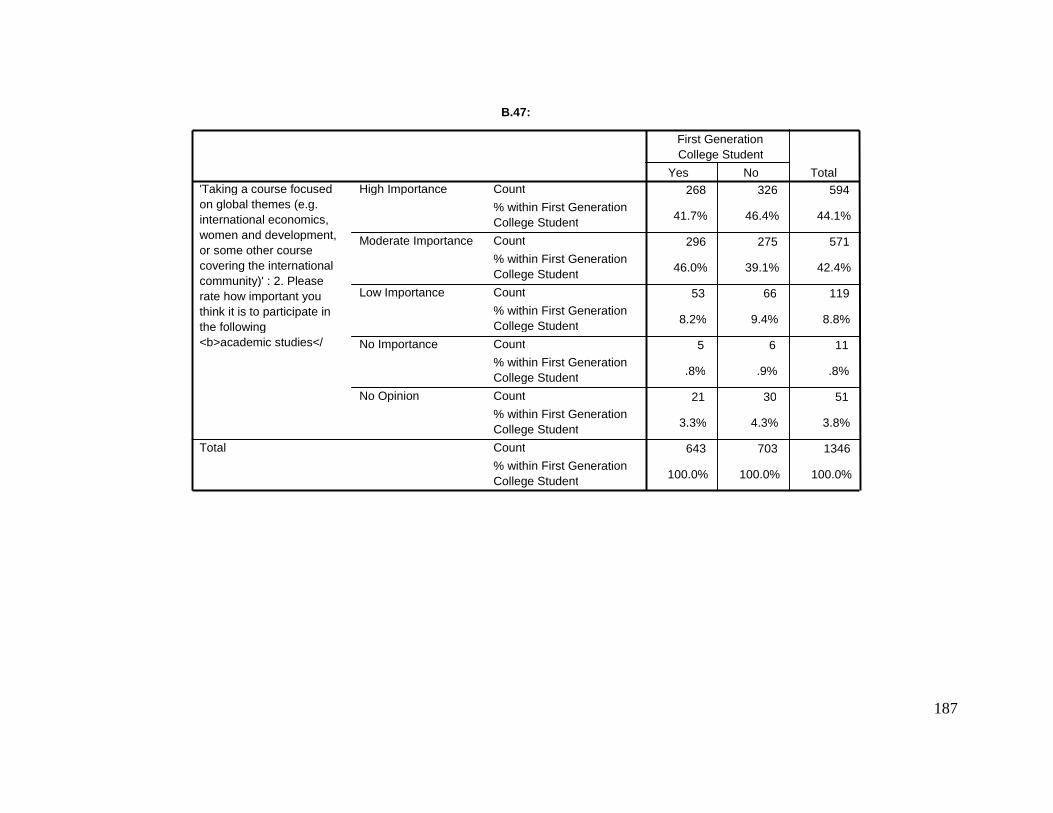
187
B.47:
268 326 594
41.7% 46.4% 44.1%
296 275 571
46.0% 39.1% 42.4%
53 66 119
8.2% 9.4% 8.8%
5 6 11
.8% .9% .8%
21 30 51
3.3% 4.3% 3.8%
643 703 1346
100.0% 100.0% 100.0%
Count
% within First Generation College Student
Count
% within First Generation College Student
Count
% within First Generation College Student
Count
% within First Generation College Student
Count
% within First Generation College Student
Count
% within First Generation College Student
High Importance
Moderate Importance
Low Importance
No Importance
No Opinion
'Taking a course focused on global themes (e.g. international economics, women and development, or some other course covering the international community)' : 2. Please rate how important you think it is to participate in the following <b>academic studies</
Total
Yes No
First Generation College Student
Total
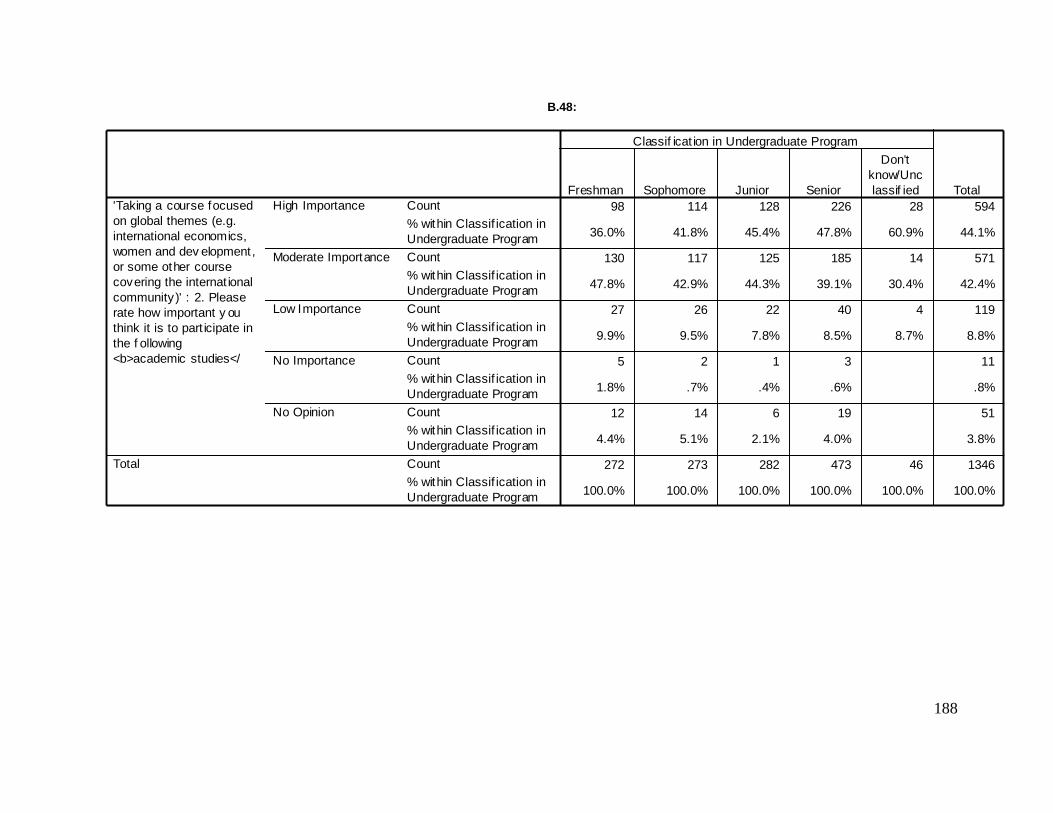
188
Crosstab
98 114 128 226 28 594
36.0% 41.8% 45.4% 47.8% 60.9% 44.1%
130 117 125 185 14 571
47.8% 42.9% 44.3% 39.1% 30.4% 42.4%
27 26 22 40 4 119
9.9% 9.5% 7.8% 8.5% 8.7% 8.8%
5 2 1 3 11
1.8% .7% .4% .6% .8%
12 14 6 19 51
4.4% 5.1% 2.1% 4.0% 3.8%
272 273 282 473 46 1346
100.0% 100.0% 100.0% 100.0% 100.0% 100.0%
Count
% within Classif ication in
Undergraduate Program
Count
% within Classif ication in
Undergraduate Program
Count
% within Classif ication in
Undergraduate Program
Count
% within Classif ication in
Undergraduate Program
Count
% within Classif ication in
Undergraduate Program
Count
% within Classif ication in
Undergraduate Program
High Importance
Moderate Importance
Low Importance
No Importance
No Opinion
'Taking a course focused
on global themes (e.g.
international economics,
women and dev elopment,
or some other course
covering the internat ional
community)' : 2. Please
rate how important y ou
think it is to part icipate in
the f ollowing
<b>academic studies</
Total
Freshman Sophomore Junior Senior
Don't
know/Unc
lassif ied
Classif icat ion in Undergraduate Program
Total
B.48:
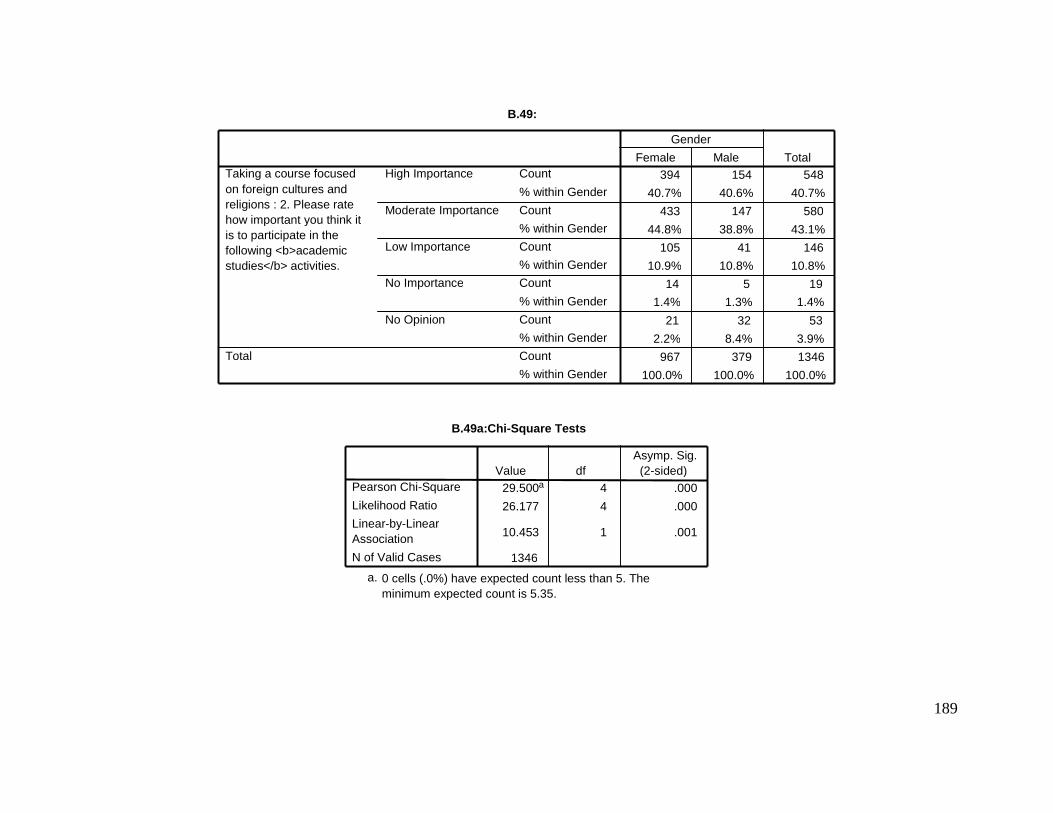
189
B.49:
394 154 548
40.7% 40.6% 40.7%
433 147 580
44.8% 38.8% 43.1%
105 41 146
10.9% 10.8% 10.8%
14 5 19 1.4% 1.3% 1.4%
21 32 53
2.2% 8.4% 3.9%
967 379 1346
100.0% 100.0% 100.0%
Count
% within Gender
Count
% within Gender
Count
% within Gender Count
% within Gender
Count
% within Gender
Count
% within Gender
High Importance
Moderate Importance
Low Importance
No Importance
No Opinion
Taking a course focused on foreign cultures and religions : 2. Please rate how important you think it is to participate in the following <b>academic studies</b> activities.
Total
Female Male
Gender
Total
B.49a:Chi-Square Tests
29.500 a 4 .000
26.177 4 .000
10.453 1 .001
1346
Pearson Chi-Square
Likelihood Ratio
Linear-by-Linear Association
N of Valid Cases
Value df Asymp. Sig. (2-sided)
0 cells (.0%) have expected count less than 5. The minimum expected count is 5.35.
a.

190
Crosstab
48 111 209 142 38 548
44.9% 42.9% 41.3% 37.3% 40.9% 40.7%
36 109 217 179 39 580
33.6% 42.1% 42.9% 47.0% 41.9% 43.1%
16 33 55 35 7 146
15.0% 12.7% 10.9% 9.2% 7.5% 10.8%
1 2 8 5 3 19
.9% .8% 1.6% 1.3% 3.2% 1.4%
6 4 17 20 6 53
5.6% 1.5% 3.4% 5.2% 6.5% 3.9%
107 259 506 381 93 1346
100.0% 100.0% 100.0% 100.0% 100.0% 100.0%
Count
% within Primary
Area Where Raised
Count
% within Primary
Area Where Raised
Count
% within Primary
Area Where Raised
Count
% within Primary
Area Where Raised
Count
% within Primary
Area Where Raised
Count
% within Primary
Area Where Raised
High Importance
Moderate Importance
Low Importance
No Importance
No Opinion
Taking a course focused
on f oreign cultures and
religions : 2. Please rate
how important you think it
is to participate in the
f ollowing <b>academic
studies</b> activ ities.
Total
Rural/Farm
Rural/No
n-f arm Urban Inner-city Other
Primary Area Where Raised
Total
B.50:

191
B.51:
261 287 548
40.6% 40.8% 40.7%
288 292 580
44.8% 41.5% 43.1%
61 85 146
9.5% 12.1% 10.8%
10 9 19
1.6% 1.3% 1.4%
23 30 53
3.6% 4.3% 3.9%
643 703 1346
100.0% 100.0% 100.0%
Count
% within First Generation College Student
Count
% within First Generation College Student
Count
% within First Generation College Student
Count
% within First Generation College Student
Count
% within First Generation College Student
Count
% within First Generation College Student
High Importance
Moderate Importance
Low Importance
No Importance
No Opinion
Taking a course focused on foreign cultures and religions : 2. Please rate how important you think it is to participate in the following <b>academic studies</b> activities.
Total
Yes No
First Generation College Student
Total
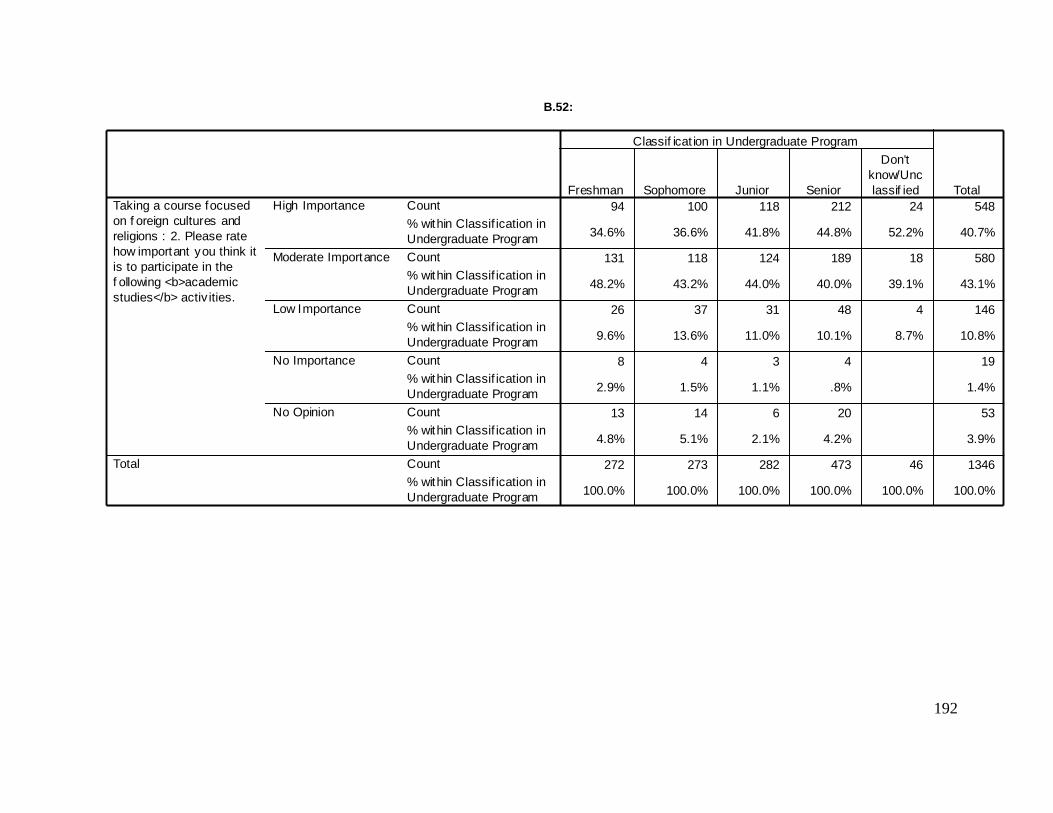
192
Crosstab
94 100 118 212 24 548
34.6% 36.6% 41.8% 44.8% 52.2% 40.7%
131 118 124 189 18 580
48.2% 43.2% 44.0% 40.0% 39.1% 43.1%
26 37 31 48 4 146
9.6% 13.6% 11.0% 10.1% 8.7% 10.8%
8 4 3 4 19
2.9% 1.5% 1.1% .8% 1.4%
13 14 6 20 53
4.8% 5.1% 2.1% 4.2% 3.9%
272 273 282 473 46 1346
100.0% 100.0% 100.0% 100.0% 100.0% 100.0%
Count
% within Classif ication in
Undergraduate Program
Count
% within Classif ication in
Undergraduate Program
Count
% within Classif ication in
Undergraduate Program
Count
% within Classif ication in
Undergraduate Program
Count
% within Classif ication in
Undergraduate Program
Count
% within Classif ication in
Undergraduate Program
High Importance
Moderate Importance
Low Importance
No Importance
No Opinion
Taking a course focused
on f oreign cultures and
religions : 2. Please rate
how important you think it
is to participate in the
f ollowing <b>academic
studies</b> activ ities.
Total
Freshman Sophomore Junior Senior
Don't
know/Unc
lassif ied
Classif icat ion in Undergraduate Program
Total
B.52:

193
B.53:
430 151 581
44.5% 39.8% 43.2%
369 131 500
38.2% 34.6% 37.1%
123 53 176
12.7% 14.0% 13.1%
17 12 29 1.8% 3.2% 2.2%
28 32 60
2.9% 8.4% 4.5%
967 379 1346
100.0% 100.0% 100.0%
Count
% within Gender
Count
% within Gender
Count
% within Gender Count
% within Gender
Count
% within Gender
Count
% within Gender
High Importance
Moderate Importance
Low Importance
No Importance
No Opinion
Study Abroad or other international travel related to academic study/research : 2. Please rate how important you think it is to participate in the following <b>academic studies</b> activities.
Total
Female Male
Gender
Total
B.53a: Chi-Square Tests
23.935 a 4 .000 21.704 4 .000
16.903 1 .000
1346
Pearson Chi-Square
Likelihood Ratio
Linear-by-Linear Association
N of Valid Cases
Value df Asymp. Sig. (2-sided)
0 cells (.0%) have expected count less than 5. The minimum expected count is 8.17.
a.
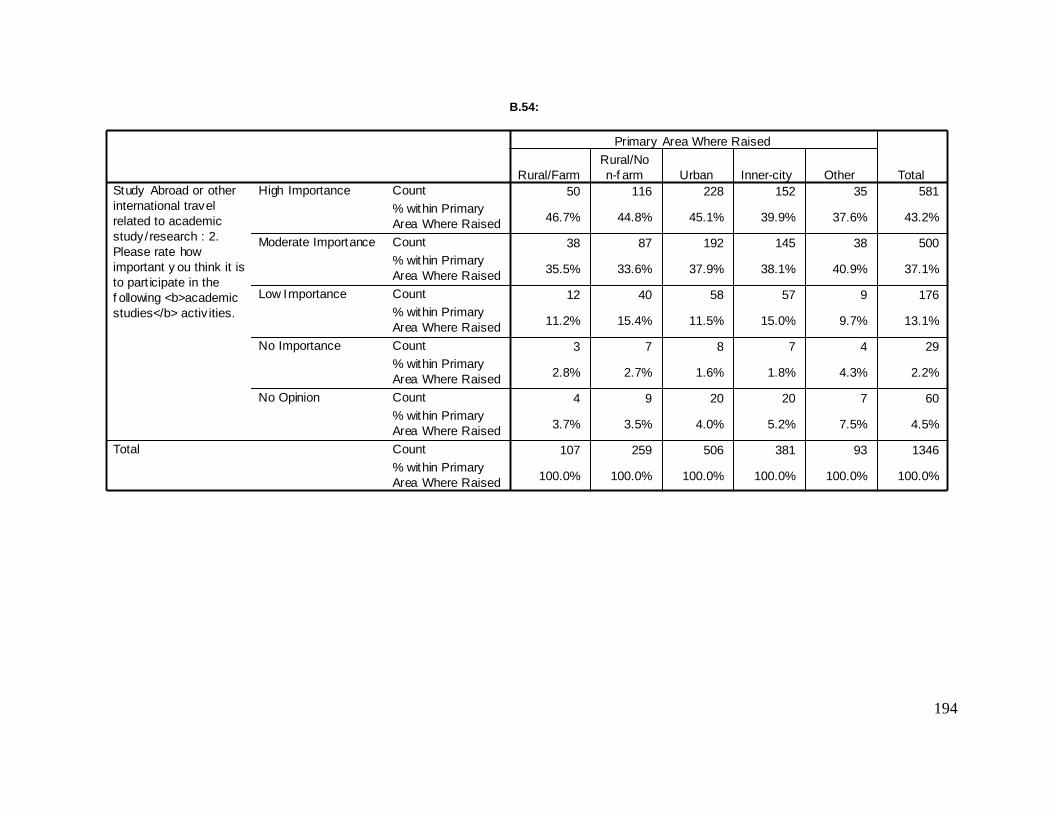
194
Crosstab
50 116 228 152 35 581
46.7% 44.8% 45.1% 39.9% 37.6% 43.2%
38 87 192 145 38 500
35.5% 33.6% 37.9% 38.1% 40.9% 37.1%
12 40 58 57 9 176
11.2% 15.4% 11.5% 15.0% 9.7% 13.1%
3 7 8 7 4 29
2.8% 2.7% 1.6% 1.8% 4.3% 2.2%
4 9 20 20 7 60
3.7% 3.5% 4.0% 5.2% 7.5% 4.5%
107 259 506 381 93 1346
100.0% 100.0% 100.0% 100.0% 100.0% 100.0%
Count
% within Primary
Area Where Raised
Count
% within Primary
Area Where Raised
Count
% within Primary
Area Where Raised
Count
% within Primary
Area Where Raised
Count
% within Primary
Area Where Raised
Count
% within Primary
Area Where Raised
High Importance
Moderate Importance
Low Importance
No Importance
No Opinion
Study Abroad or other
international travel
related to academic
study/research : 2.
Please rate how
important y ou think it is
to part icipate in the
f ollowing <b>academic
studies</b> activ ities.
Total
Rural/Farm
Rural/No
n-f arm Urban Inner-city Other
Primary Area Where Raised
Total
B.54:

195
B.55:
284 297 581
44.2% 42.2% 43.2%
249 251 500
38.7% 35.7% 37.1%
72 104 176
11.2% 14.8% 13.1%
13 16 29
2.0% 2.3% 2.2%
25 35 60
3.9% 5.0% 4.5%
643 703 1346
100.0% 100.0% 100.0%
Count
% within First Generation College Student
Count
% within First Generation College Student
Count
% within First Generation College Student
Count
% within First Generation College Student
Count
% within First Generation College Student
Count
% within First Generation College Student
High Importance
Moderate Importance
Low Importance
No Importance
No Opinion
Study Abroad or other international travel related to academic study/research : 2. Please rate how important you think it is to participate in the following <b>academic studies</b> activities.
Total
Yes No
First Generation College Student
Total
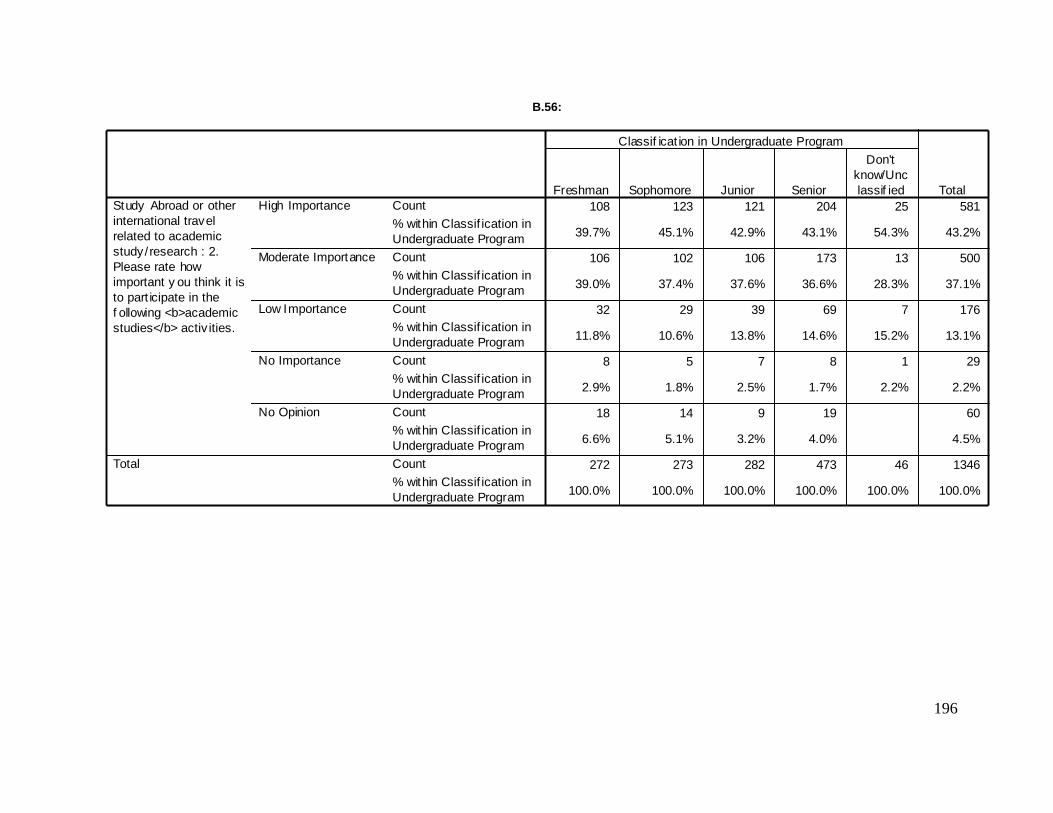
196
Crosstab
108 123 121 204 25 581
39.7% 45.1% 42.9% 43.1% 54.3% 43.2%
106 102 106 173 13 500
39.0% 37.4% 37.6% 36.6% 28.3% 37.1%
32 29 39 69 7 176
11.8% 10.6% 13.8% 14.6% 15.2% 13.1%
8 5 7 8 1 29
2.9% 1.8% 2.5% 1.7% 2.2% 2.2%
18 14 9 19 60
6.6% 5.1% 3.2% 4.0% 4.5%
272 273 282 473 46 1346
100.0% 100.0% 100.0% 100.0% 100.0% 100.0%
Count
% within Classif ication in
Undergraduate Program
Count
% within Classif ication in
Undergraduate Program
Count
% within Classif ication in
Undergraduate Program
Count
% within Classif ication in
Undergraduate Program
Count
% within Classif ication in
Undergraduate Program
Count
% within Classif ication in
Undergraduate Program
High Importance
Moderate Importance
Low Importance
No Importance
No Opinion
Study Abroad or other
international travel
related to academic
study/research : 2.
Please rate how
important y ou think it is
to part icipate in the
f ollowing <b>academic
studies</b> activ ities.
Total
Freshman Sophomore Junior Senior
Don't
know/Unc
lassif ied
Classif icat ion in Undergraduate Program
Total
B.56:
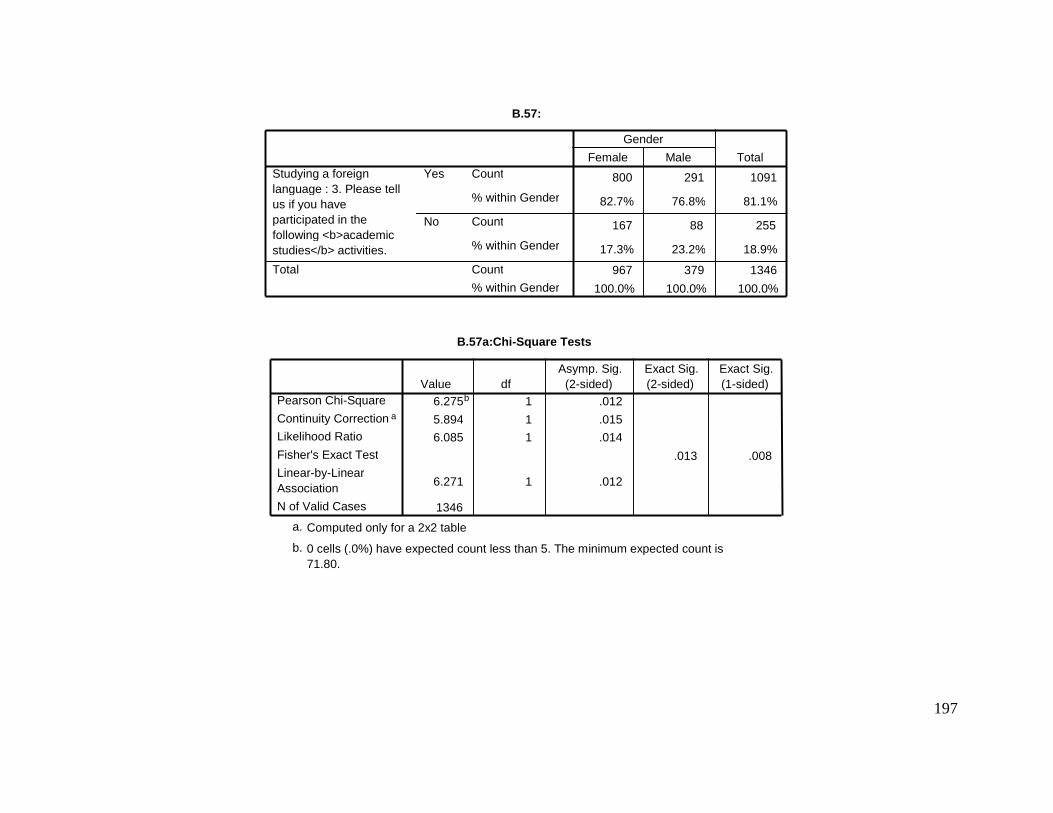
197
B.57:
800 291 1091
82.7% 76.8% 81.1%
167 88 255
17.3% 23.2% 18.9%
967 379 1346
100.0% 100.0% 100.0%
Count
% within Gender
Count
% within Gender
Count
% within Gender
Yes
No
Studying a foreign language : 3. Please tell us if you have participated in the following <b>academic studies</b> activities.
Total
Female Male
Gender
Total
B.57a:Chi-Square Tests
6.275 b 1 .012
5.894 1 .015 6.085 1 .014
.013 .008
6.271 1 .012
1346
Pearson Chi-Square
Continuity Correction a
Likelihood Ratio
Fisher's Exact Test Linear-by-Linear Association N of Valid Cases
Value df Asymp. Sig.
(2-sided) Exact Sig. (2-sided)
Exact Sig. (1-sided)
Computed only for a 2x2 table a.
0 cells (.0%) have expected count less than 5. The minimum expected count is 71.80.
b.
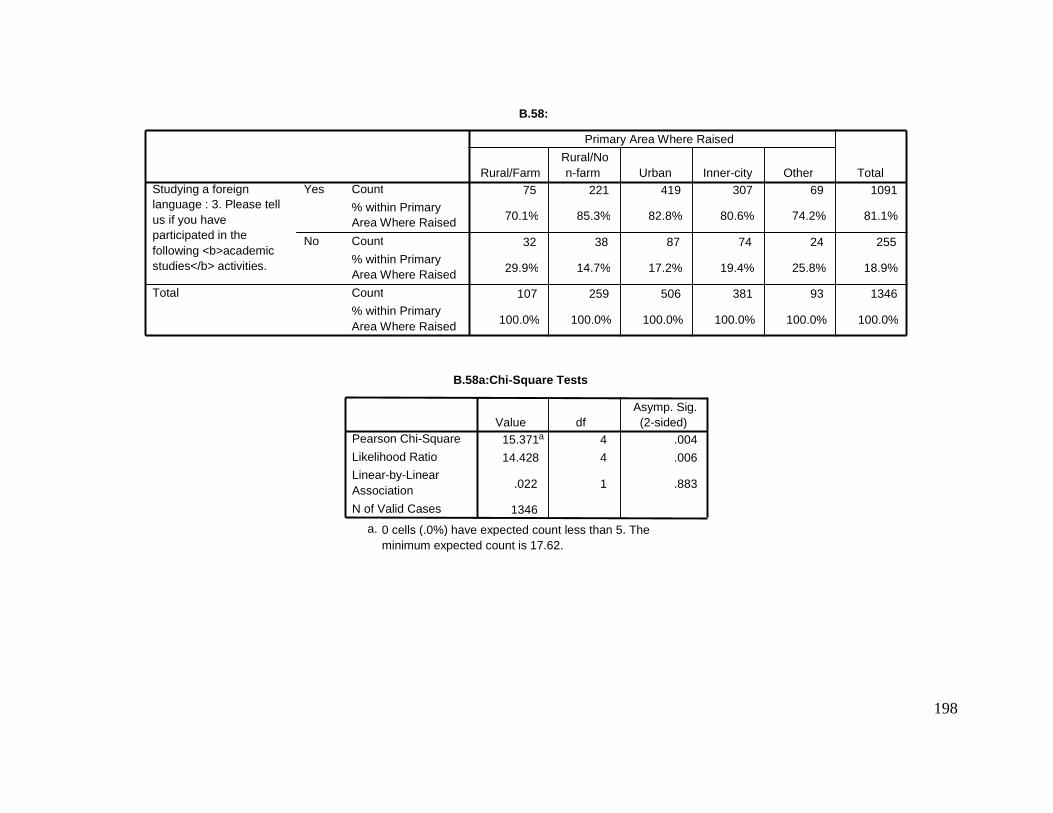
198
B.58:
75 221 419 307 69 1091
70.1% 85.3% 82.8% 80.6% 74.2% 81.1%
32 38 87 74 24 255
29.9% 14.7% 17.2% 19.4% 25.8% 18.9%
107 259 506 381 93 1346
100.0% 100.0% 100.0% 100.0% 100.0% 100.0%
Count
% within Primary Area Where Raised
Count
% within Primary Area Where Raised
Count % within Primary Area Where Raised
Yes
No
Studying a foreign language : 3. Please tell us if you have participated in the following <b>academic studies</b> activities.
Total
Rural/Farm Rural/No n-farm Urban Inner-city Other
Primary Area Where Raised
Total
B.58a:Chi-Square Tests
15.371 a 4 .004 14.428 4 .006
.022 1 .883
1346
Pearson Chi-Square
Likelihood Ratio Linear-by-Linear Association
N of Valid Cases
Value df Asymp. Sig. (2-sided)
0 cells (.0%) have expected count less than 5. The minimum expected count is 17.62.
a.
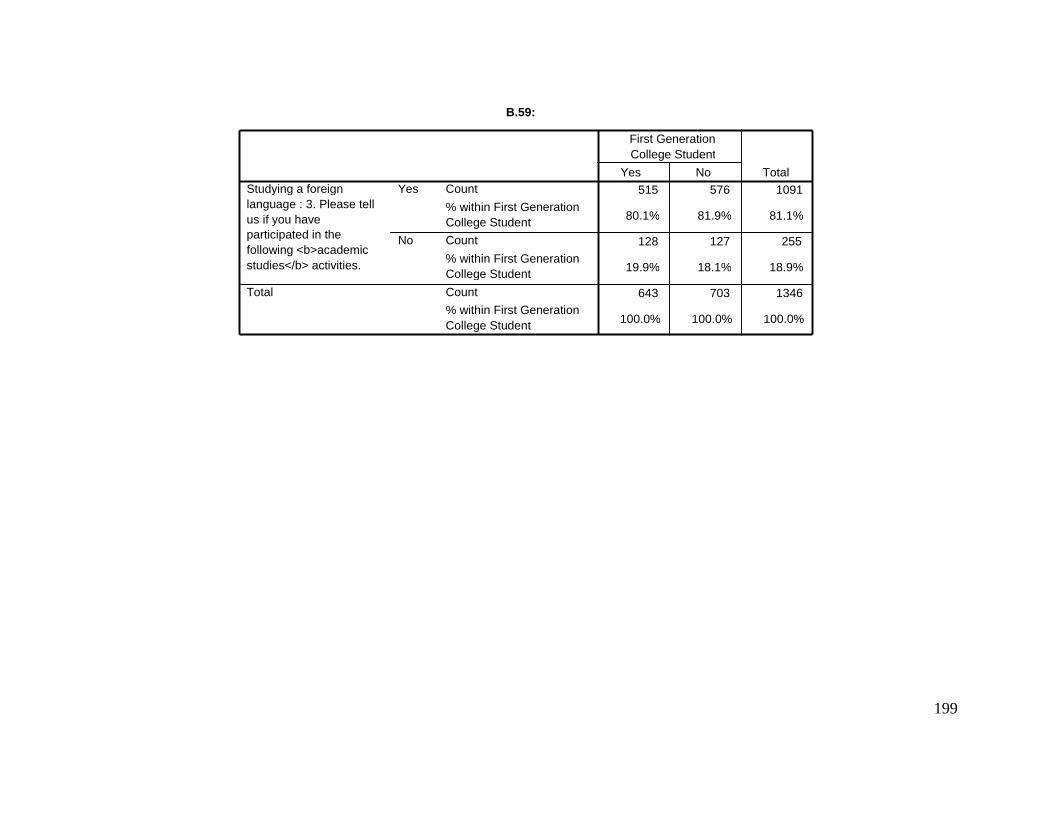
199
B.59:
515 576 1091
80.1% 81.9% 81.1%
128 127 255
19.9% 18.1% 18.9%
643 703 1346
100.0% 100.0% 100.0%
Count
% within First Generation College Student Count
% within First Generation College Student
Count % within First Generation College Student
Yes
No
Studying a foreign language : 3. Please tell us if you have participated in the following <b>academic studies</b> activities.
Total
Yes No
First Generation College Student
Total
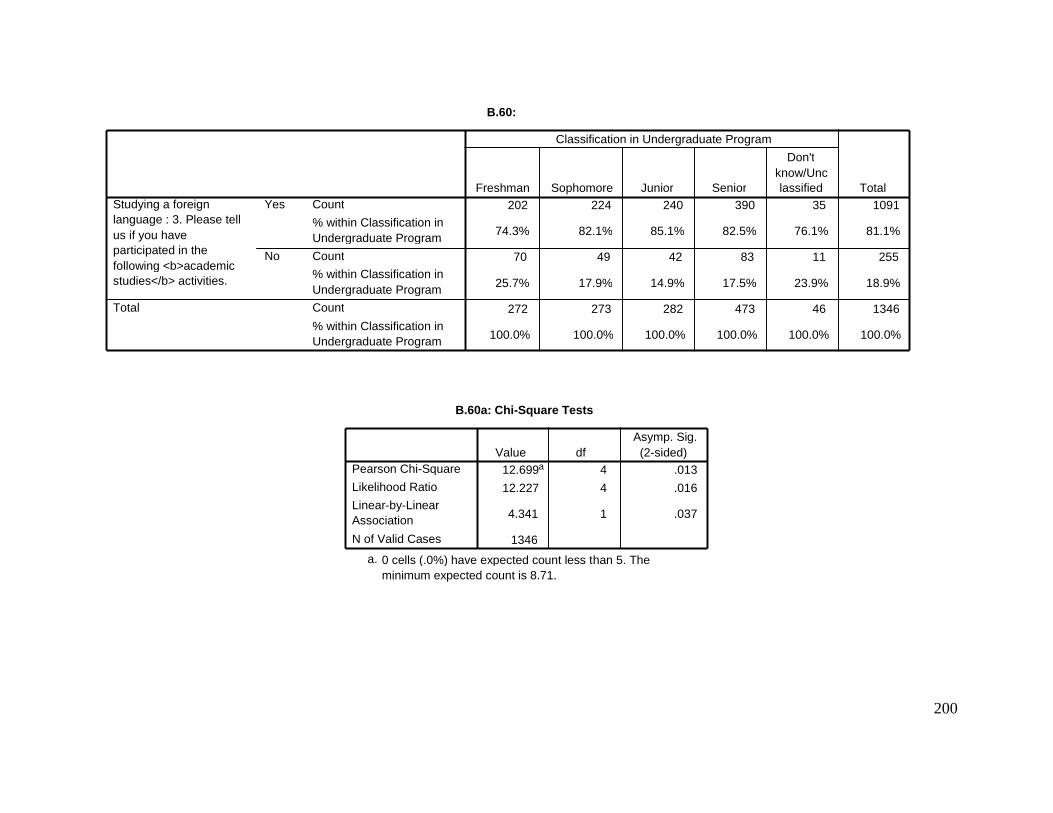
200
B.60:
202 224 240 390 35 1091
74.3% 82.1% 85.1% 82.5% 76.1% 81.1%
70 49 42 83 11 255
25.7% 17.9% 14.9% 17.5% 23.9% 18.9%
272 273 282 473 46 1346
100.0% 100.0% 100.0% 100.0% 100.0% 100.0%
Count
% within Classification in Undergraduate Program Count % within Classification in Undergraduate Program Count
% within Classification in Undergraduate Program
Yes
No
Studying a foreign language : 3. Please tell us if you have participated in the following <b>academic studies</b> activities.
Total
Freshman Sophomore Junior Senior
Don't know/Unc lassified
Classification in Undergraduate Program
Total
B.60a: Chi-Square Tests
12.699 a 4 .013
12.227 4 .016
4.341 1 .037
1346
Pearson Chi-Square
Likelihood Ratio
Linear-by-Linear Association
N of Valid Cases
Value df Asymp. Sig. (2-sided)
0 cells (.0%) have expected count less than 5. The minimum expected count is 8.71.
a.
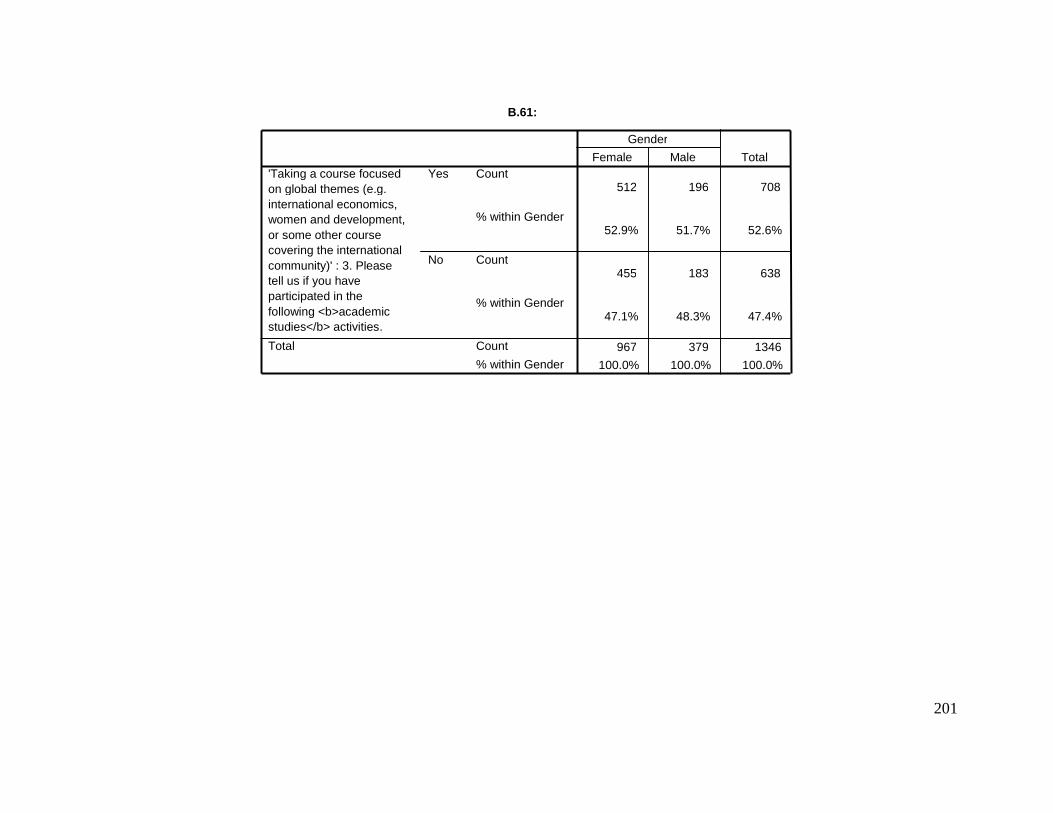
201
B.61:
512 196 708
52.9% 51.7% 52.6%
455 183 638
47.1% 48.3% 47.4%
967 379 1346 100.0% 100.0% 100.0%
Count
% within Gender
Count
% within Gender
Count
% within Gender
Yes
No
'Taking a course focused on global themes (e.g. international economics, women and development, or some other course covering the international community)' : 3. Please tell us if you have participated in the following <b>academic studies</b> activities.
Total
Female Male Gender
Total
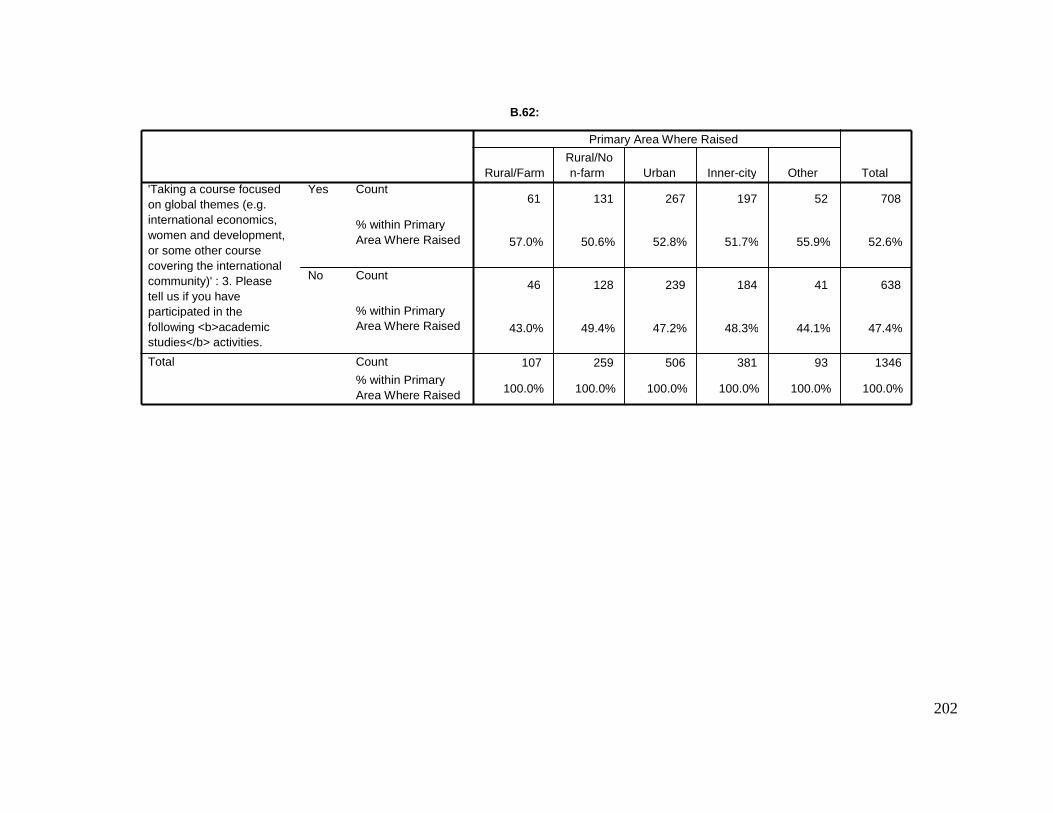
202
B.62:
61 131 267 197 52 708
57.0% 50.6% 52.8% 51.7% 55.9% 52.6%
46 128 239 184 41 638
43.0% 49.4% 47.2% 48.3% 44.1% 47.4%
107 259 506 381 93 1346
100.0% 100.0% 100.0% 100.0% 100.0% 100.0%
Count
% within Primary Area Where Raised
Count
% within Primary Area Where Raised
Count
% within Primary Area Where Raised
Yes
No
'Taking a course focused on global themes (e.g. international economics, women and development, or some other course covering the international community)' : 3. Please tell us if you have participated in the following <b>academic studies</b> activities.
Total
Rural/Farm Rural/No n-farm Urban Inner-city Other
Primary Area Where Raised
Total
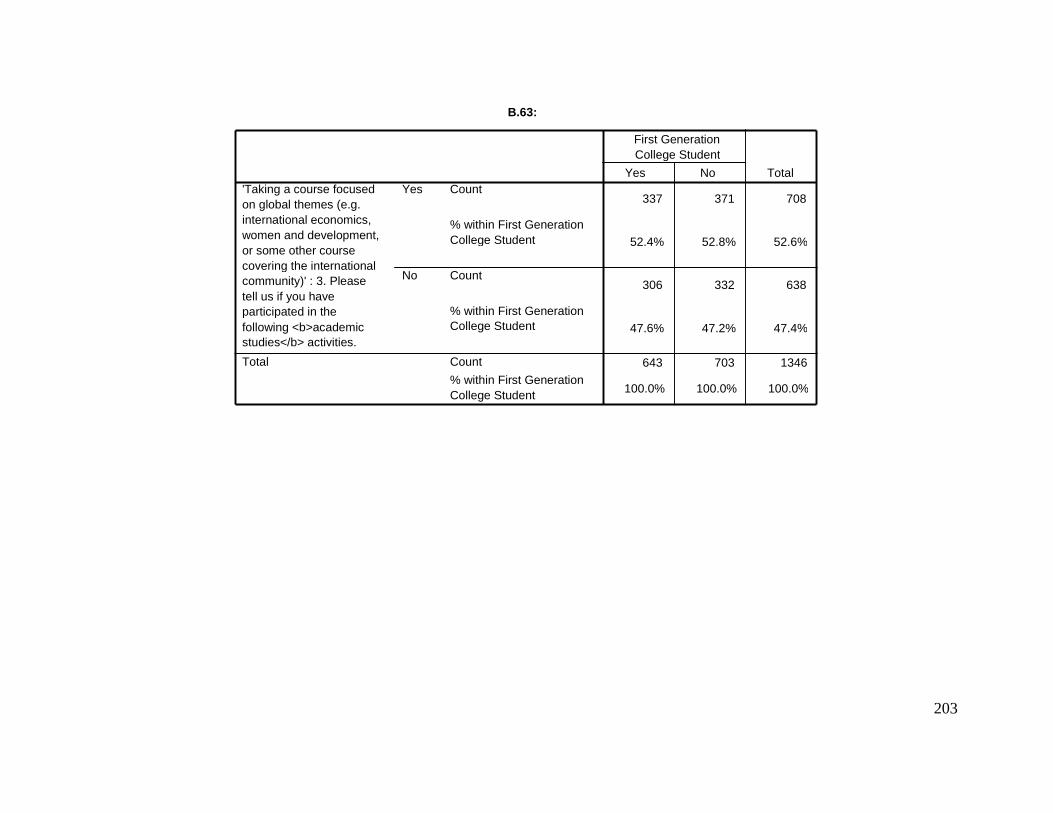
203
B.63:
337 371 708
52.4% 52.8% 52.6%
306 332 638
47.6% 47.2% 47.4%
643 703 1346
100.0% 100.0% 100.0%
Count
% within First Generation College Student
Count
% within First Generation College Student
Count
% within First Generation College Student
Yes
No
'Taking a course focused on global themes (e.g. international economics, women and development, or some other course covering the international community)' : 3. Please tell us if you have participated in the following <b>academic studies</b> activities.
Total
Yes No
First Generation College Student
Total
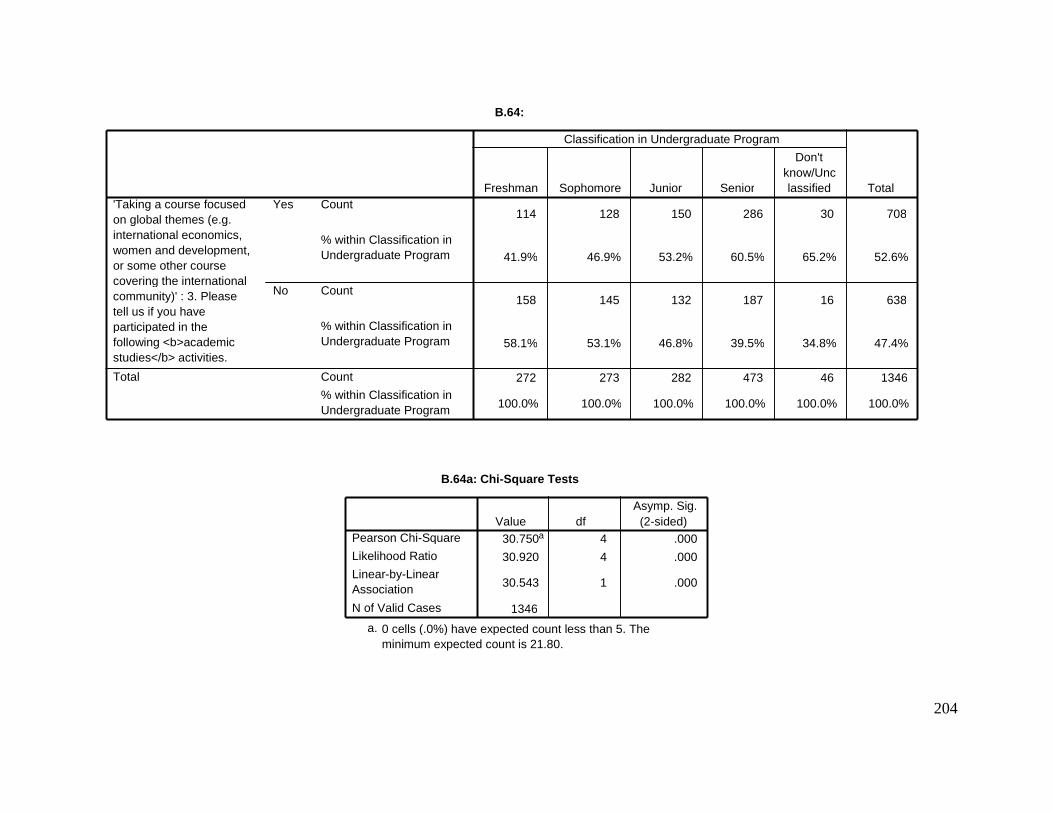
204
B.64:
114 128 150 286 30 708
41.9% 46.9% 53.2% 60.5% 65.2% 52.6%
158 145 132 187 16 638
58.1% 53.1% 46.8% 39.5% 34.8% 47.4%
272 273 282 473 46 1346
100.0% 100.0% 100.0% 100.0% 100.0% 100.0%
Count
% within Classification in Undergraduate Program
Count
% within Classification in Undergraduate Program
Count
% within Classification in Undergraduate Program
Yes
No
'Taking a course focused on global themes (e.g. international economics, women and development, or some other course covering the international community)' : 3. Please tell us if you have participated in the following <b>academic studies</b> activities.
Total
Freshman Sophomore Junior Senior
Don't know/Unc lassified
Classification in Undergraduate Program
Total
B.64a: Chi-Square Tests
30.750 a 4 .000
30.920 4 .000
30.543 1 .000
1346
Pearson Chi-Square
Likelihood Ratio
Linear-by-Linear Association
N of Valid Cases
Value df Asymp. Sig. (2-sided)
0 cells (.0%) have expected count less than 5. The minimum expected count is 21.80.
a.
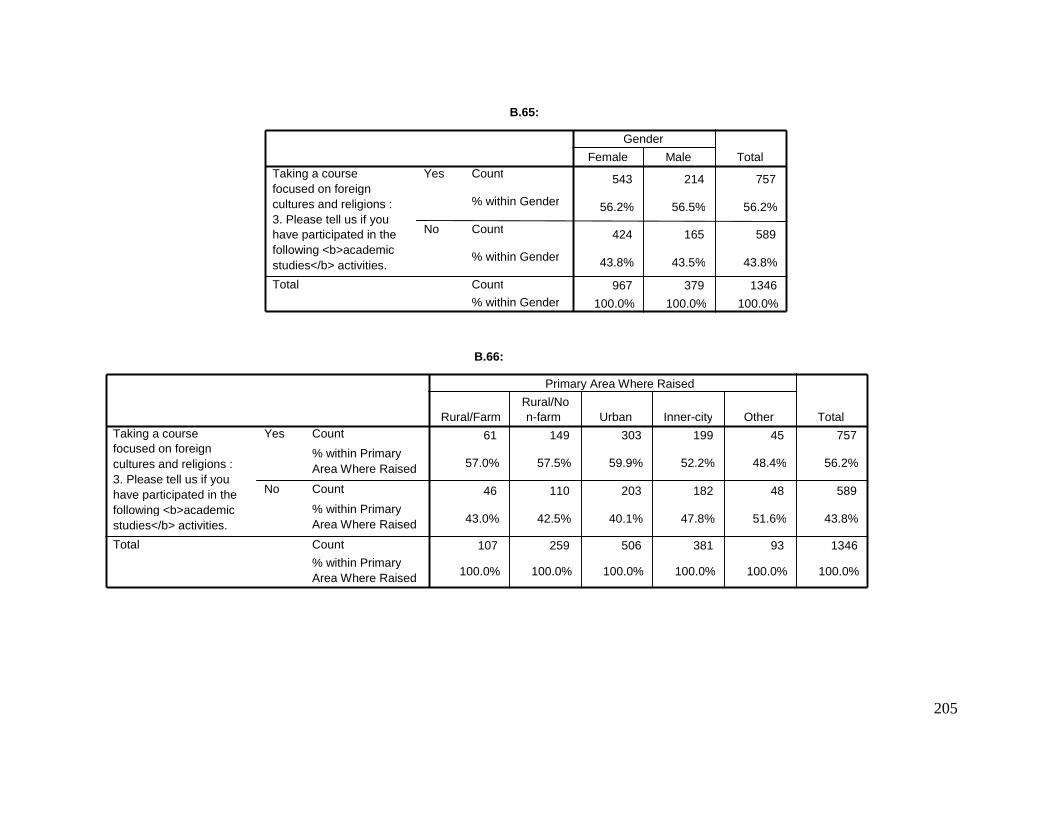
205
B.65:
543 214 757
56.2% 56.5% 56.2%
424 165 589
43.8% 43.5% 43.8%
967 379 1346
100.0% 100.0% 100.0%
Count
% within Gender
Count
% within Gender
Count % within Gender
Yes
No
Taking a course focused on foreign cultures and religions : 3. Please tell us if you have participated in the following <b>academic studies</b> activities.
Total
Female Male
Gender
Total
B.66:
61 149 303 199 45 757
57.0% 57.5% 59.9% 52.2% 48.4% 56.2%
46 110 203 182 48 589
43.0% 42.5% 40.1% 47.8% 51.6% 43.8%
107 259 506 381 93 1346
100.0% 100.0% 100.0% 100.0% 100.0% 100.0%
Count
% within Primary Area Where Raised
Count
% within Primary Area Where Raised
Count
% within Primary Area Where Raised
Yes
No
Taking a course focused on foreign cultures and religions : 3. Please tell us if you have participated in the following <b>academic studies</b> activities.
Total
Rural/Farm Rural/No n-farm Urban Inner-city Other
Primary Area Where Raised
Total
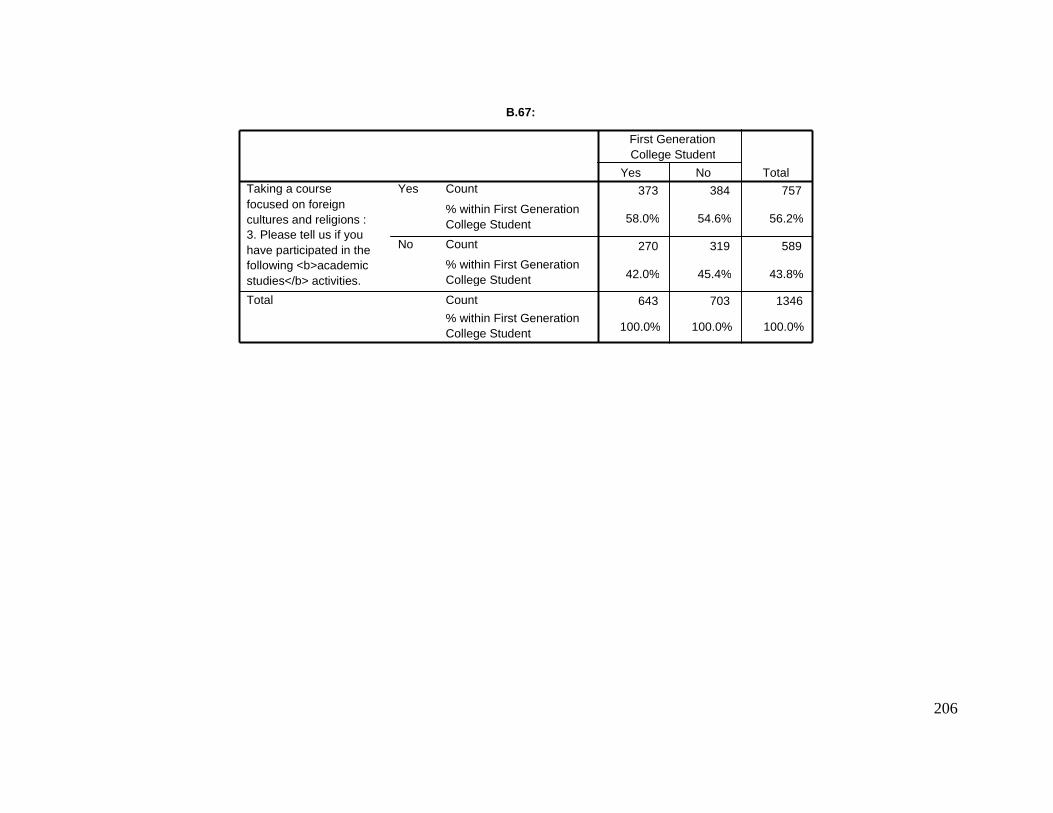
206
B.67:
373 384 757
58.0% 54.6% 56.2%
270 319 589
42.0% 45.4% 43.8%
643 703 1346
100.0% 100.0% 100.0%
Count
% within First Generation College Student
Count
% within First Generation College Student
Count
% within First Generation College Student
Yes
No
Taking a course focused on foreign cultures and religions : 3. Please tell us if you have participated in the following <b>academic studies</b> activities.
Total
Yes No
First Generation College Student
Total
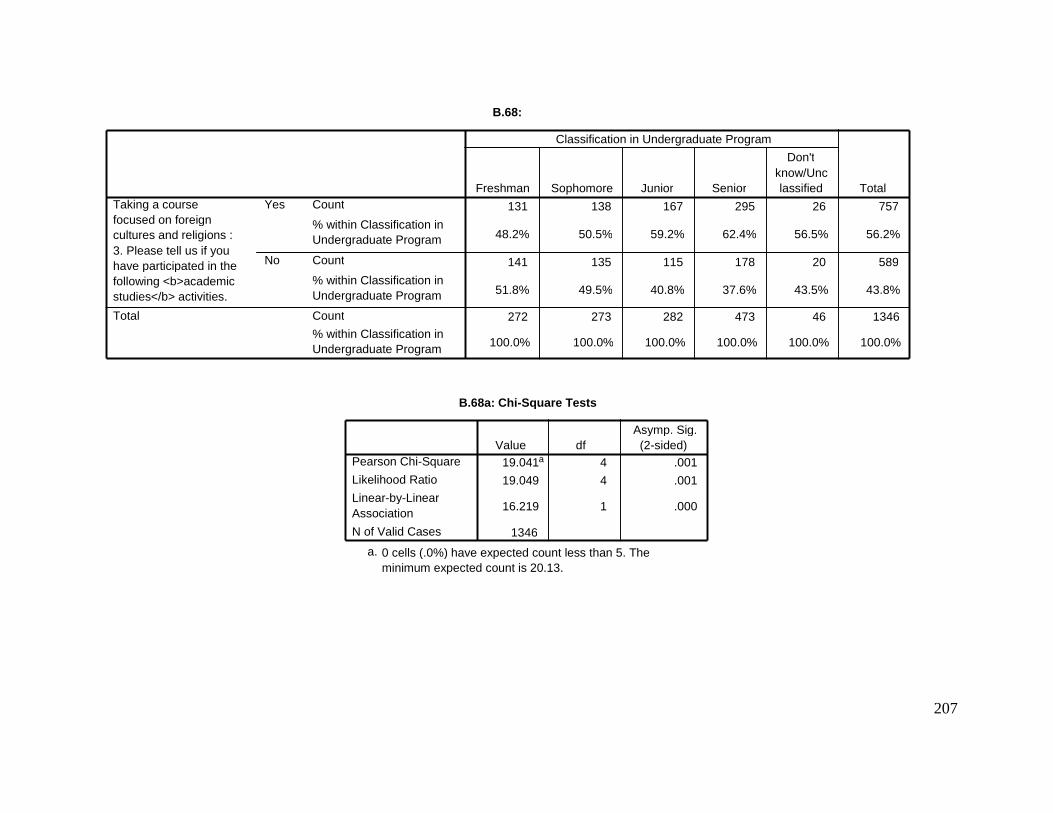
207
B.68:
131 138 167 295 26 757
48.2% 50.5% 59.2% 62.4% 56.5% 56.2%
141 135 115 178 20 589
51.8% 49.5% 40.8% 37.6% 43.5% 43.8%
272 273 282 473 46 1346
100.0% 100.0% 100.0% 100.0% 100.0% 100.0%
Count
% within Classification in Undergraduate Program
Count
% within Classification in Undergraduate Program
Count
% within Classification in Undergraduate Program
Yes
No
Taking a course focused on foreign cultures and religions : 3. Please tell us if you have participated in the following <b>academic studies</b> activities.
Total
Freshman Sophomore Junior Senior
Don't know/Unc lassified
Classification in Undergraduate Program
Total
B.68a: Chi-Square Tests
19.041 a 4 .001 19.049 4 .001
16.219 1 .000
1346
Pearson Chi-Square
Likelihood Ratio
Linear-by-Linear Association
N of Valid Cases
Value df Asymp. Sig. (2-sided)
0 cells (.0%) have expected count less than 5. The minimum expected count is 20.13.
a.
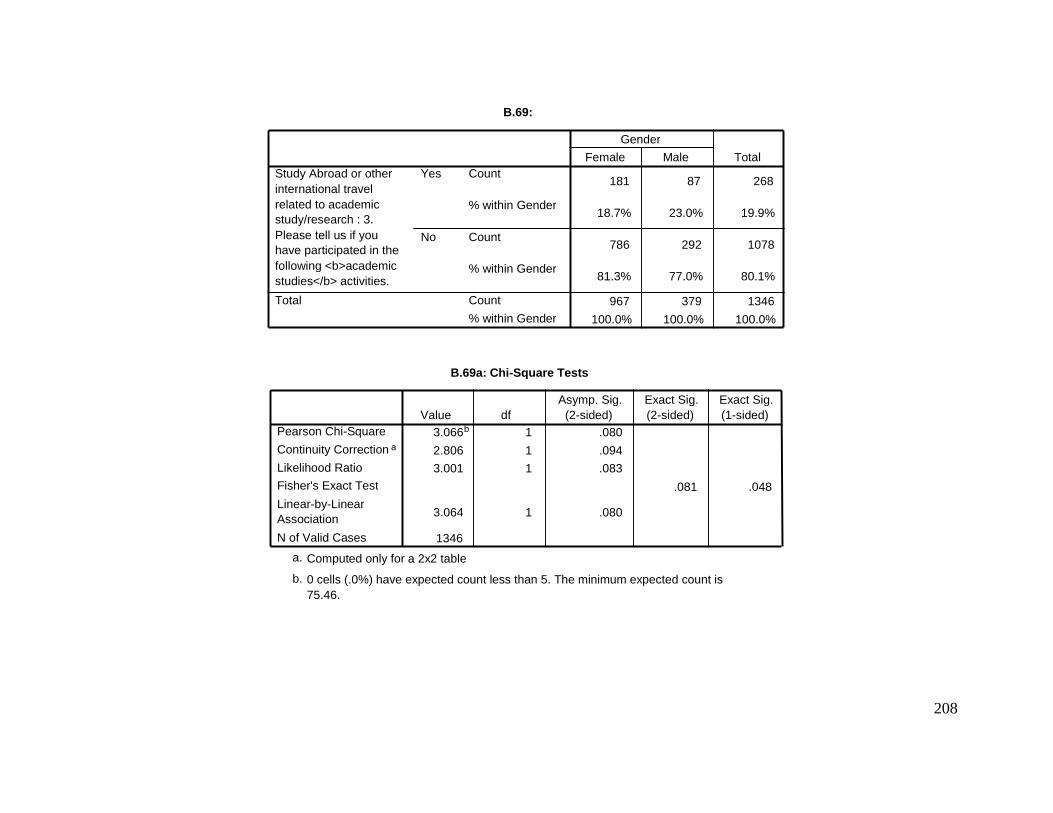
208
B.69:
181 87 268
18.7% 23.0% 19.9%
786 292 1078
81.3% 77.0% 80.1%
967 379 1346
100.0% 100.0% 100.0%
Count
% within Gender
Count
% within Gender
Count
% within Gender
Yes
No
Study Abroad or other international travel related to academic study/research : 3. Please tell us if you have participated in the following <b>academic studies</b> activities.
Total
Female Male Gender
Total
B.69a: Chi-Square Tests
3.066 b 1 .080
2.806 1 .094 3.001 1 .083
.081 .048
3.064 1 .080
1346
Pearson Chi-Square
Continuity Correction a
Likelihood Ratio Fisher's Exact Test
Linear-by-Linear Association
N of Valid Cases
Value df Asymp. Sig.
(2-sided) Exact Sig. (2-sided)
Exact Sig. (1-sided)
Computed only for a 2x2 table a.
0 cells (.0%) have expected count less than 5. The minimum expected count is 75.46.
b.
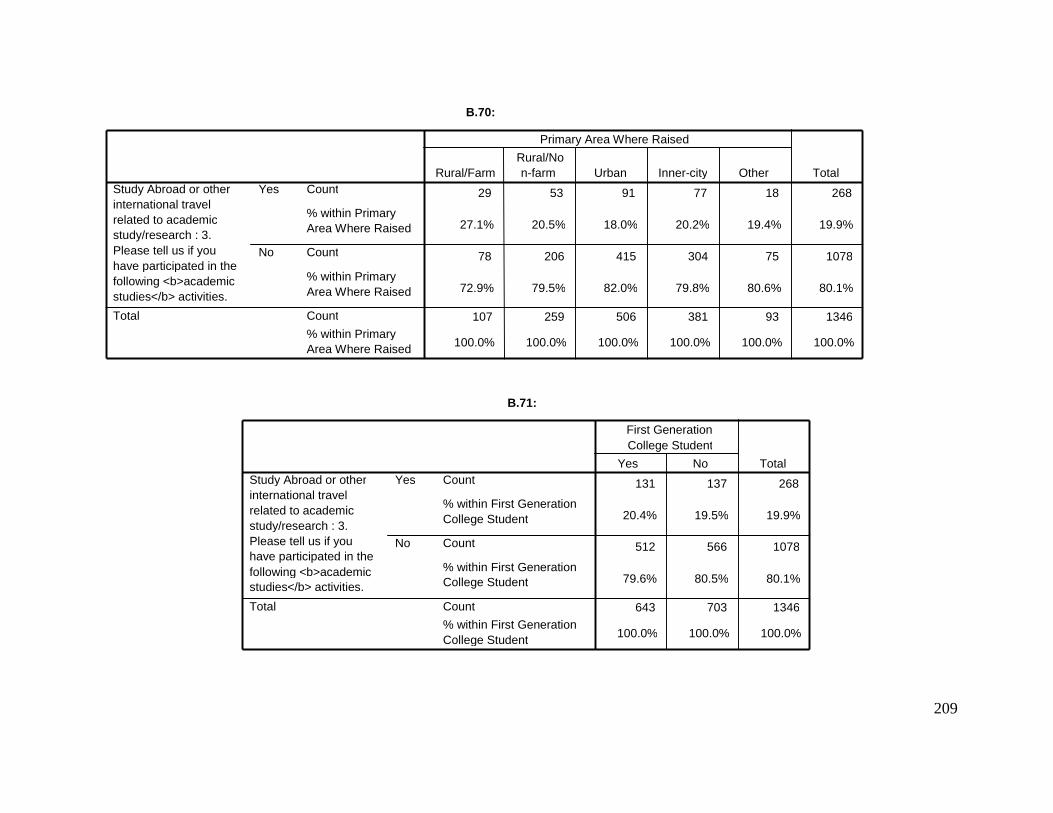
209
B.70:
29 53 91 77 18 268
27.1% 20.5% 18.0% 20.2% 19.4% 19.9%
78 206 415 304 75 1078
72.9% 79.5% 82.0% 79.8% 80.6% 80.1%
107 259 506 381 93 1346
100.0% 100.0% 100.0% 100.0% 100.0% 100.0%
Count
% within Primary Area Where Raised
Count
% within Primary Area Where Raised
Count
% within Primary Area Where Raised
Yes
No
Study Abroad or other international travel related to academic study/research : 3. Please tell us if you have participated in the following <b>academic studies</b> activities.
Total
Rural/Farm Rural/No n-farm Urban Inner-city Other
Primary Area Where Raised
Total
B.71:
131 137 268
20.4% 19.5% 19.9%
512 566 1078
79.6% 80.5% 80.1%
643 703 1346
100.0% 100.0% 100.0%
Count
% within First Generation College Student
Count
% within First Generation College Student
Count
% within First Generation College Student
Yes
No
Study Abroad or other international travel related to academic study/research : 3. Please tell us if you have participated in the following <b>academic studies</b> activities.
Total
Yes No
First Generation College Student
Total
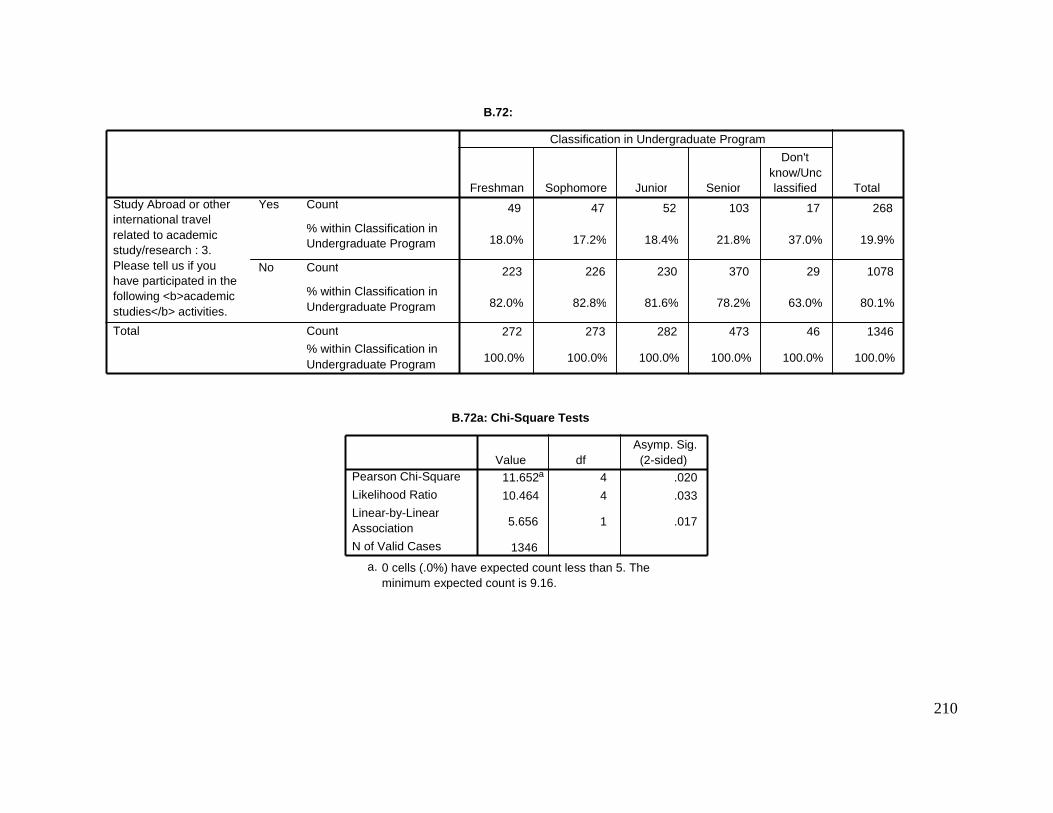
210
B.72:
49 47 52 103 17 268
18.0% 17.2% 18.4% 21.8% 37.0% 19.9%
223 226 230 370 29 1078
82.0% 82.8% 81.6% 78.2% 63.0% 80.1%
272 273 282 473 46 1346
100.0% 100.0% 100.0% 100.0% 100.0% 100.0%
Count
% within Classification in Undergraduate Program
Count
% within Classification in Undergraduate Program
Count % within Classification in Undergraduate Program
Yes
No
Study Abroad or other international travel related to academic study/research : 3. Please tell us if you have participated in the following <b>academic studies</b> activities.
Total
Freshman Sophomore Junior Senior
Don't know/Unc lassified
Classification in Undergraduate Program
Total
B.72a: Chi-Square Tests
11.652 a 4 .020
10.464 4 .033
5.656 1 .017
1346
Pearson Chi-Square
Likelihood Ratio
Linear-by-Linear Association N of Valid Cases
Value df Asymp. Sig. (2-sided)
0 cells (.0%) have expected count less than 5. The minimum expected count is 9.16.
a.
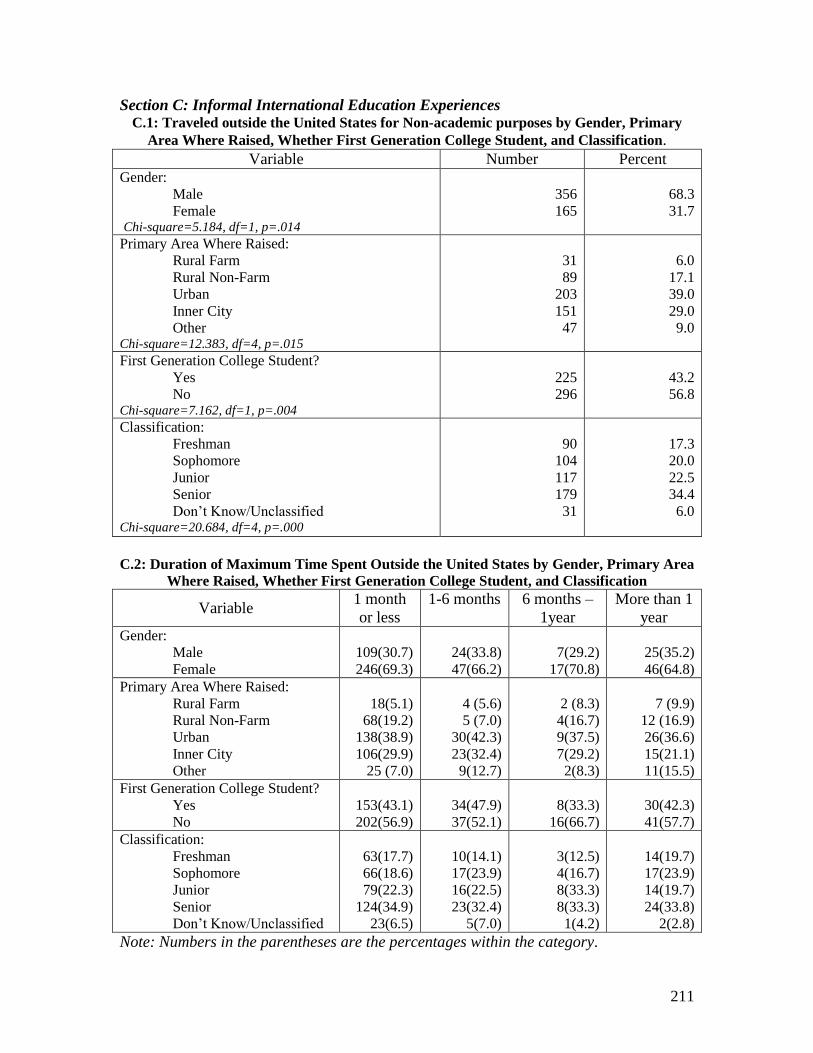
211
Section C: Informal International Education Experiences C.1: Traveled outside the United States for Non-academic purposes by Gender, Primary
Area Where Raised, Whether First Generation College Student, and Classification.
Variable Number Percent Gender:
Male
Female Chi-square=5.184, df=1, p=.014
356
165
68.3
31.7
Primary Area Where Raised:
Rural Farm
Rural Non-Farm
Urban
Inner City
Other Chi-square=12.383, df=4, p=.015
31
89
203
151
47
6.0
17.1
39.0
29.0
9.0
First Generation College Student?
Yes
No Chi-square=7.162, df=1, p=.004
225
296
43.2
56.8
Classification:
Freshman
Sophomore
Junior
Senior
Don‘t Know/Unclassified Chi-square=20.684, df=4, p=.000
90
104
117
179
31
17.3
20.0
22.5
34.4
6.0
C.2: Duration of Maximum Time Spent Outside the United States by Gender, Primary Area
Where Raised, Whether First Generation College Student, and Classification
Variable 1 month
or less
1-6 months 6 months –
1year
More than 1
year Gender:
Male
Female
109(30.7)
246(69.3)
24(33.8)
47(66.2)
7(29.2)
17(70.8)
25(35.2)
46(64.8)
Primary Area Where Raised:
Rural Farm
Rural Non-Farm
Urban
Inner City
Other
18(5.1)
68(19.2)
138(38.9)
106(29.9)
25 (7.0)
4 (5.6)
5 (7.0)
30(42.3)
23(32.4)
9(12.7)
2 (8.3)
4(16.7)
9(37.5)
7(29.2)
2(8.3)
7 (9.9)
12 (16.9)
26(36.6)
15(21.1)
11(15.5)
First Generation College Student?
Yes
No
153(43.1)
202(56.9)
34(47.9)
37(52.1)
8(33.3)
16(66.7)
30(42.3)
41(57.7)
Classification:
Freshman
Sophomore
Junior
Senior
Don‘t Know/Unclassified
63(17.7)
66(18.6)
79(22.3)
124(34.9)
23(6.5)
10(14.1)
17(23.9)
16(22.5)
23(32.4)
5(7.0)
3(12.5)
4(16.7)
8(33.3)
8(33.3)
1(4.2)
14(19.7)
17(23.9)
14(19.7)
24(33.8)
2(2.8)
Note: Numbers in the parentheses are the percentages within the category.
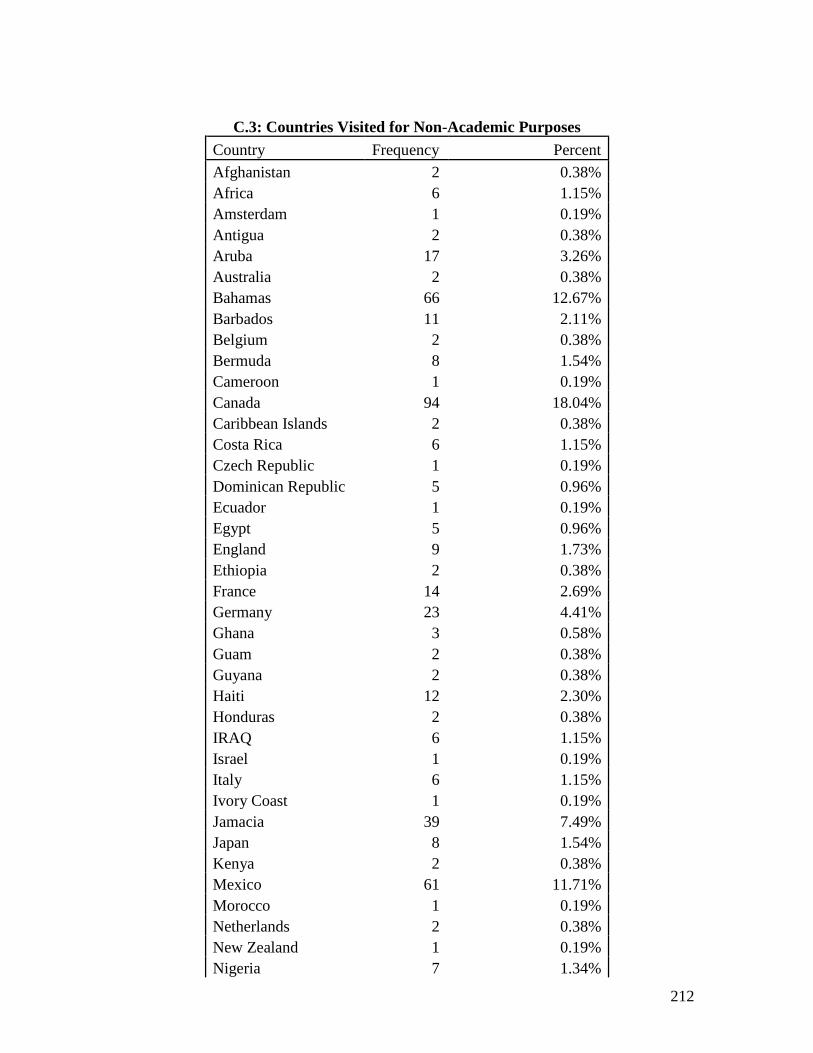
212
C.3: Countries Visited for Non-Academic Purposes
Country Frequency Percent
Afghanistan 2 0.38%
Africa 6 1.15%
Amsterdam 1 0.19%
Antigua 2 0.38%
Aruba 17 3.26%
Australia 2 0.38%
Bahamas 66 12.67%
Barbados 11 2.11%
Belgium 2 0.38%
Bermuda 8 1.54%
Cameroon 1 0.19%
Canada 94 18.04%
Caribbean Islands 2 0.38%
Costa Rica 6 1.15%
Czech Republic 1 0.19%
Dominican Republic 5 0.96%
Ecuador 1 0.19%
Egypt 5 0.96%
England 9 1.73%
Ethiopia 2 0.38%
France 14 2.69%
Germany 23 4.41%
Ghana 3 0.58%
Guam 2 0.38%
Guyana 2 0.38%
Haiti 12 2.30%
Honduras 2 0.38%
IRAQ 6 1.15%
Israel 1 0.19%
Italy 6 1.15%
Ivory Coast 1 0.19%
Jamacia 39 7.49%
Japan 8 1.54%
Kenya 2 0.38%
Mexico 61 11.71%
Morocco 1 0.19%
Netherlands 2 0.38%
New Zealand 1 0.19%
Nigeria 7 1.34%
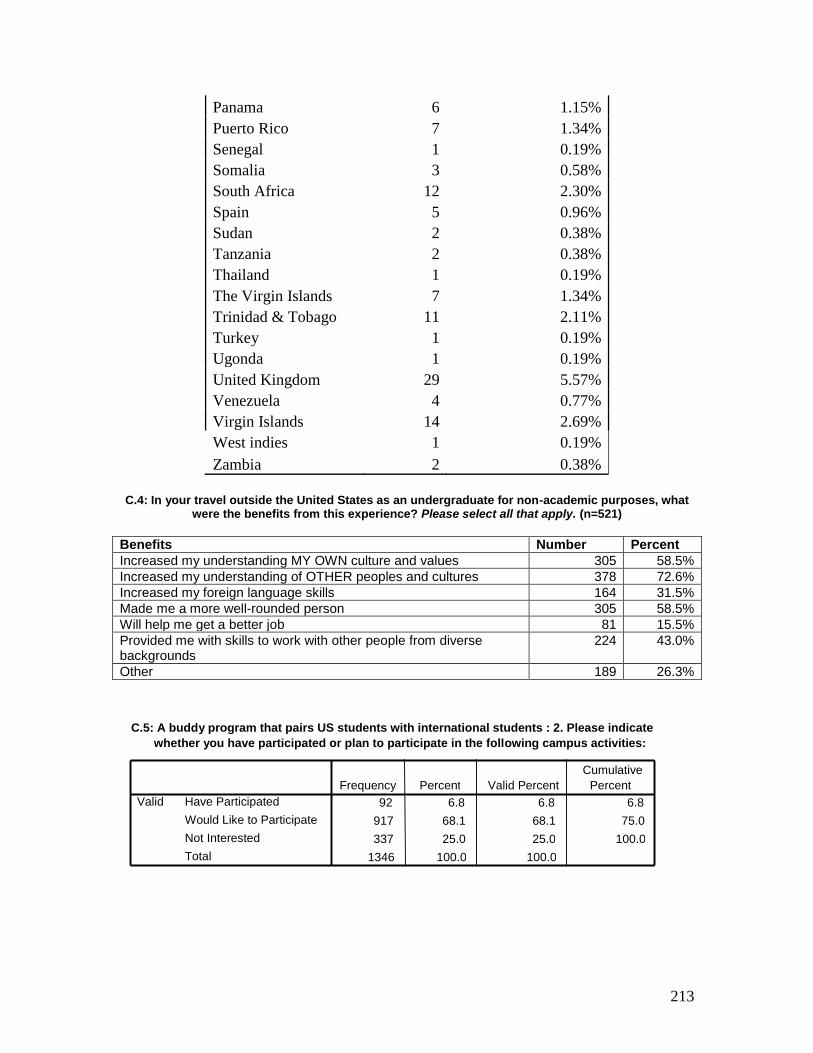
213
Panama 6 1.15%
Puerto Rico 7 1.34%
Senegal 1 0.19%
Somalia 3 0.58%
South Africa 12 2.30%
Spain 5 0.96%
Sudan 2 0.38%
Tanzania 2 0.38%
Thailand 1 0.19%
The Virgin Islands 7 1.34%
Trinidad & Tobago 11 2.11%
Turkey 1 0.19%
Ugonda 1 0.19%
United Kingdom 29 5.57%
Venezuela 4 0.77%
Virgin Islands 14 2.69%
West indies 1 0.19%
Zambia 2 0.38%
C.4: In your travel outside the United States as an undergraduate for non-academic purposes, what
were the benefits from this experience? Please select all that apply. (n=521)
Benefits Number Percent
Increased my understanding MY OWN culture and values 305 58.5%
Increased my understanding of OTHER peoples and cultures 378 72.6%
Increased my foreign language skills 164 31.5%
Made me a more well-rounded person 305 58.5%
Will help me get a better job 81 15.5%
Provided me with skills to work with other people from diverse backgrounds
224 43.0%
Other 189 26.3%
C.5: A buddy program that pairs US students with international students : 2. Please indicate whether you have participated or plan to participate in the following campus activities:
92 6.8 6.8 6.8
917 68.1 68.1 75.0
337 25.0 25.0 100.0
1346 100.0 100.0
Have Participated
Would Like to Participate
Not Interested
Total
Valid Frequency Percent Valid Percent
Cumulative Percent
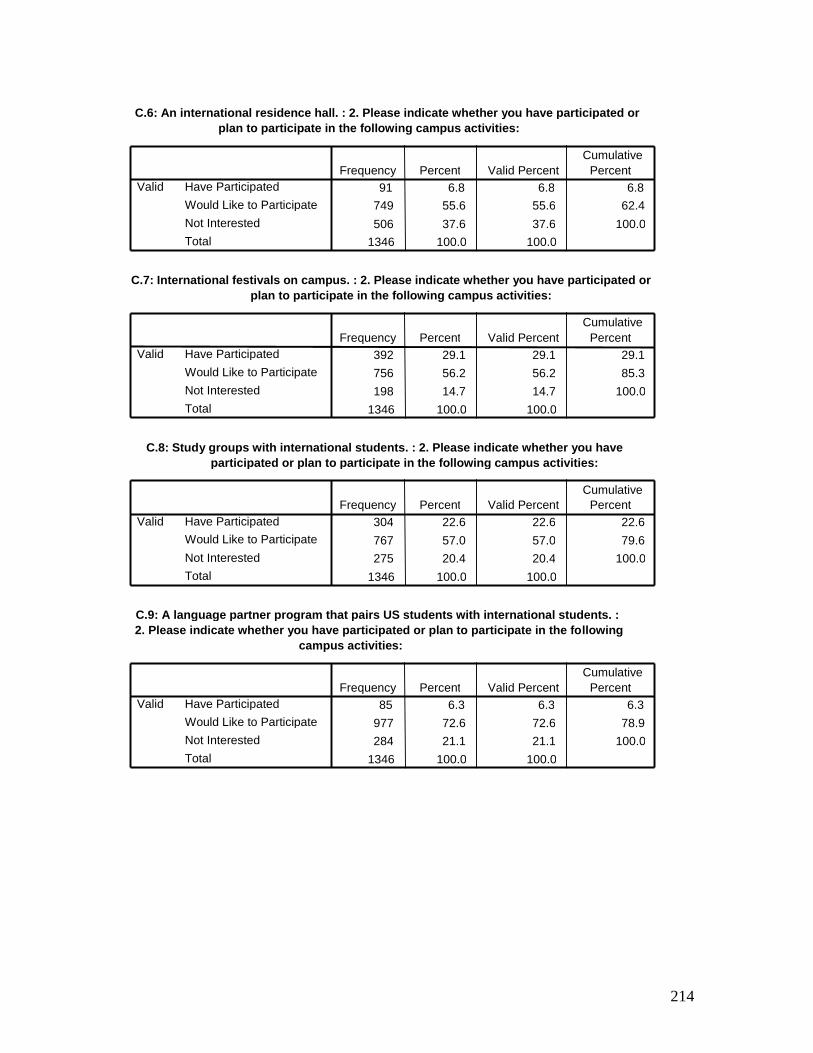
214
C.6: An international residence hall. : 2. Please indicate whether you have participated or plan to participate in the following campus activities:
91 6.8 6.8 6.8 749 55.6 55.6 62.4
506 37.6 37.6 100.0 1346 100.0 100.0
Have Participated
Would Like to Participate
Not Interested
Total
Valid Frequency Percent Valid Percent
Cumulative Percent
C.7: International festivals on campus. : 2. Please indicate whether you have participated or plan to participate in the following campus activities:
392 29.1 29.1 29.1
756 56.2 56.2 85.3
198 14.7 14.7 100.0
1346 100.0 100.0
Have Participated
Would Like to Participate
Not Interested
Total
Valid Frequency Percent Valid Percent
Cumulative Percent
C.8: Study groups with international students. : 2. Please indicate whether you have participated or plan to participate in the following campus activities:
304 22.6 22.6 22.6
767 57.0 57.0 79.6 275 20.4 20.4 100.0
1346 100.0 100.0
Have Participated Would Like to Participate
Not Interested Total
Valid Frequency Percent Valid Percent
Cumulative Percent
C.9: A language partner program that pairs US students with international students. : 2. Please indicate whether you have participated or plan to participate in the following
campus activities:
85 6.3 6.3 6.3
977 72.6 72.6 78.9 284 21.1 21.1 100.0
1346 100.0 100.0
Have Participated Would Like to Participate
Not Interested
Total
Valid Frequency Percent Valid Percent
Cumulative Percent
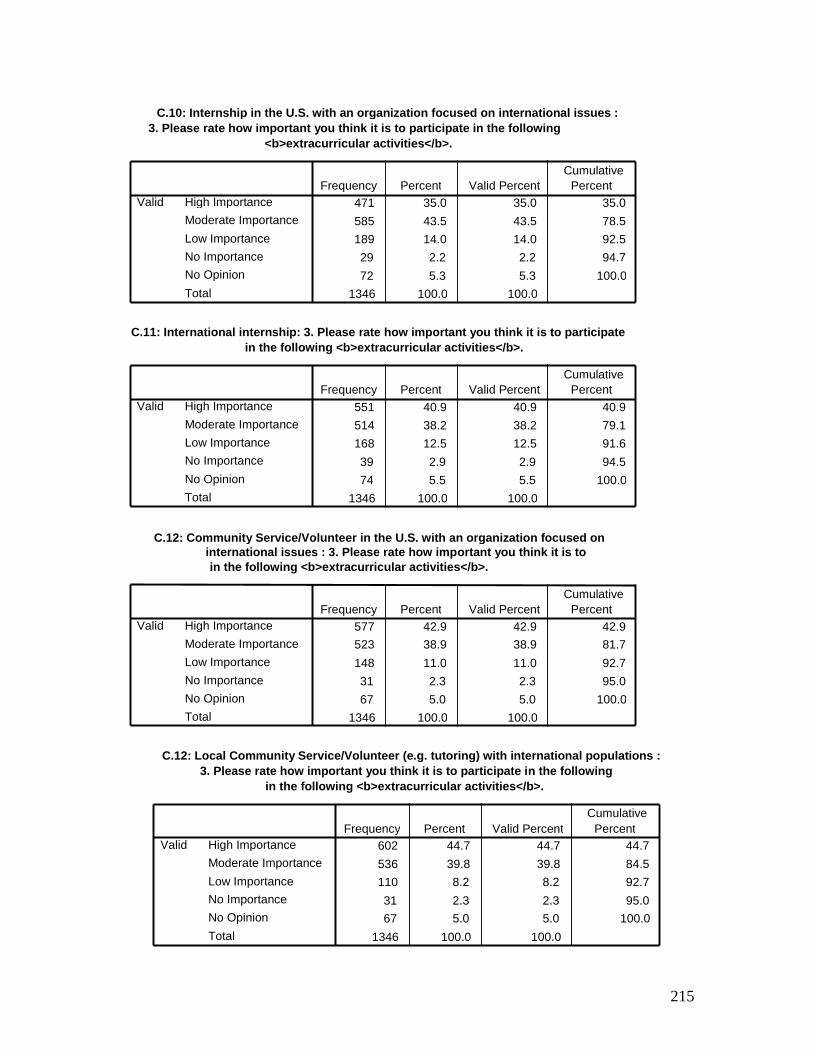
215
C.10: Internship in the U.S. with an organization focused on international issues : 3. Please rate how important you think it is to participate in the following
<b>extracurricular activities</b>.
471 35.0 35.0 35.0
585 43.5 43.5 78.5 189 14.0 14.0 92.5
29 2.2 2.2 94.7
72 5.3 5.3 100.0 1346 100.0 100.0
High Importance Moderate Importance
Low Importance No Importance No Opinion
Total
Valid Frequency Percent Valid Percent
Cumulative Percent
C.11: International internship: 3. Please rate how important you think it is to participate in the following <b>extracurricular activities</b>.
551 40.9 40.9 40.9
514 38.2 38.2 79.1
168 12.5 12.5 91.6
39 2.9 2.9 94.5
74 5.5 5.5 100.0
1346 100.0 100.0
High Importance
Moderate Importance
Low Importance No Importance
No Opinion
Total
Valid Frequency Percent Valid Percent
Cumulative Percent
C.12: Community Service/Volunteer in the U.S. with an organization focused on international issues : 3. Please rate how important you think it is to in the following <b>extracurricular activities</b>.
577 42.9 42.9 42.9 523 38.9 38.9 81.7
148 11.0 11.0 92.7
31 2.3 2.3 95.0
67 5.0 5.0 100.0
1346 100.0 100.0
High Importance
Moderate Importance
Low Importance
No Importance
No Opinion
Total
Valid Frequency Percent Valid Percent
Cumulative Percent
C.12: Local Community Service/Volunteer (e.g. tutoring) with international populations : 3. Please rate how important you think it is to participate in the following
in the following <b>extracurricular activities</b>.
602 44.7 44.7 44.7
536 39.8 39.8 84.5 110 8.2 8.2 92.7
31 2.3 2.3 95.0 67 5.0 5.0 100.0
1346 100.0 100.0
High Importance Moderate Importance
Low Importance No Importance
No Opinion
Total
Valid Frequency Percent Valid Percent
Cumulative Percent
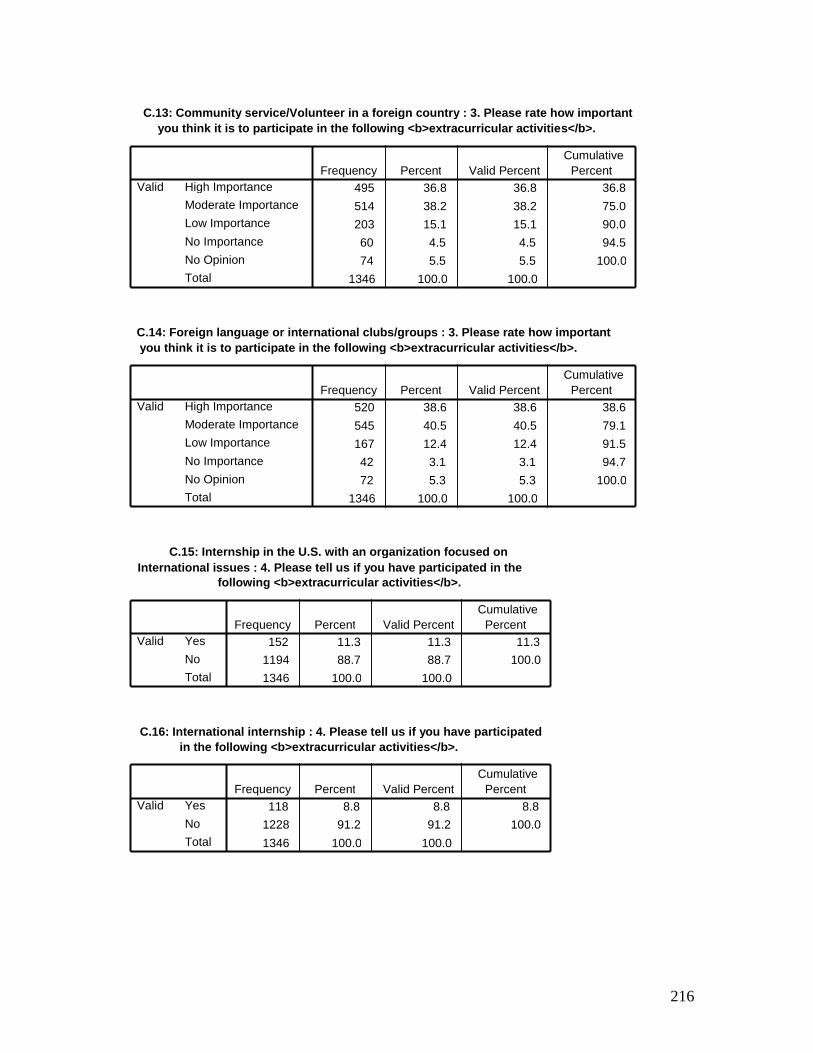
216
C.13: Community service/Volunteer in a foreign country : 3. Please rate how important you think it is to participate in the following <b>extracurricular activities</b>.
495 36.8 36.8 36.8
514 38.2 38.2 75.0
203 15.1 15.1 90.0
60 4.5 4.5 94.5
74 5.5 5.5 100.0
1346 100.0 100.0
High Importance Moderate Importance
Low Importance
No Importance
No Opinion Total
Valid Frequency Percent Valid Percent
Cumulative Percent
C.14: Foreign language or international clubs/groups : 3. Please rate how important you think it is to participate in the following <b>extracurricular activities</b>.
520 38.6 38.6 38.6
545 40.5 40.5 79.1
167 12.4 12.4 91.5
42 3.1 3.1 94.7
72 5.3 5.3 100.0
1346 100.0 100.0
High Importance Moderate Importance
Low Importance
No Importance
No Opinion Total
Valid Frequency Percent Valid Percent
Cumulative Percent
C.15: Internship in the U.S. with an organization focused on International issues : 4. Please tell us if you have participated in the
following <b>extracurricular activities</b>.
152 11.3 11.3 11.3 1194 88.7 88.7 100.0
1346 100.0 100.0
Yes
No Total
Valid Frequency Percent Valid Percent
Cumulative Percent
C.16: International internship : 4. Please tell us if you have participated in the following <b>extracurricular activities</b>.
118 8.8 8.8 8.8 1228 91.2 91.2 100.0
1346 100.0 100.0
Yes
No Total
Valid Frequency Percent Valid Percent
Cumulative Percent
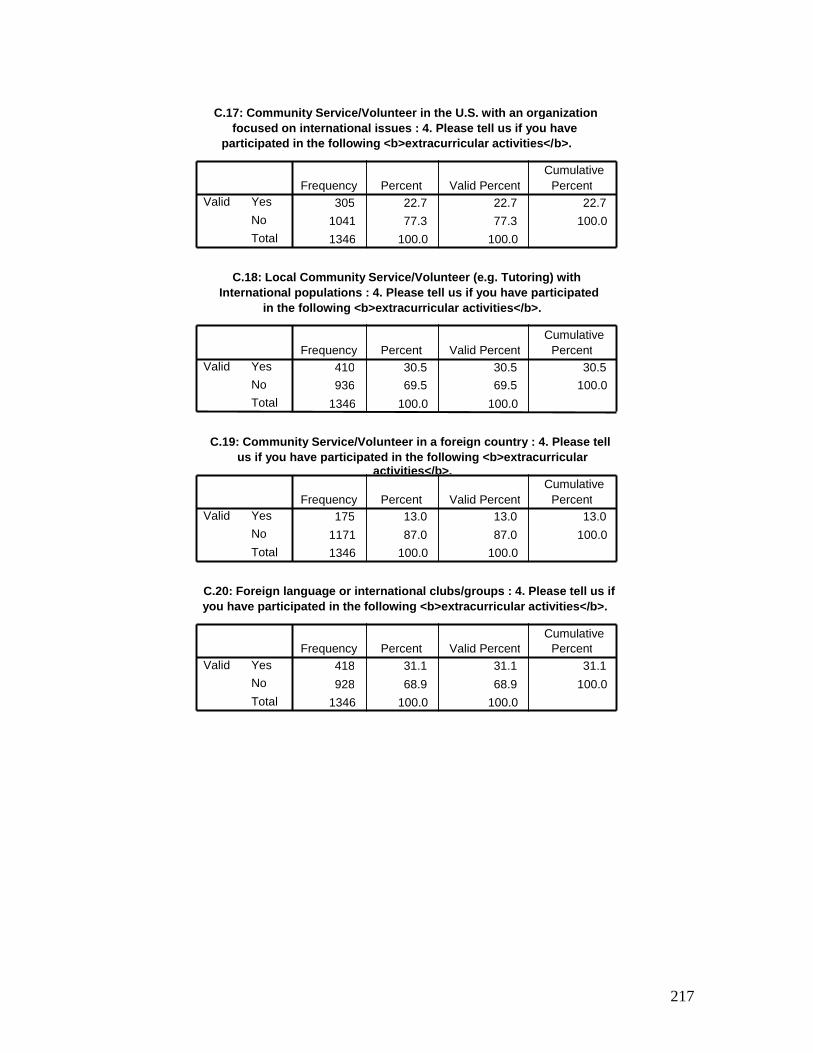
217
C.17: Community Service/Volunteer in the U.S. with an organization focused on international issues : 4. Please tell us if you have
participated in the following <b>extracurricular activities</b>.
305 22.7 22.7 22.7
1041 77.3 77.3 100.0
1346 100.0 100.0
Yes
No
Total
Valid Frequency Percent Valid Percent
Cumulative Percent
C.18: Local Community Service/Volunteer (e.g. Tutoring) with International populations : 4. Please tell us if you have participated
in the following <b>extracurricular activities</b>.
410 30.5 30.5 30.5 936 69.5 69.5 100.0
1346 100.0 100.0
Yes
No Total
Valid Frequency Percent Valid Percent
Cumulative Percent
C.19: Community Service/Volunteer in a foreign country : 4. Please tell us if you have participated in the following <b>extracurricular
activities</b>.
175 13.0 13.0 13.0
1171 87.0 87.0 100.0 1346 100.0 100.0
Yes No
Total
Valid Frequency Percent Valid Percent
Cumulative Percent
C.20: Foreign language or international clubs/groups : 4. Please tell us if you have participated in the following <b>extracurricular activities</b>.
418 31.1 31.1 31.1
928 68.9 68.9 100.0
1346 100.0 100.0
Yes No
Total
Valid Frequency Percent Valid Percent
Cumulative Percent
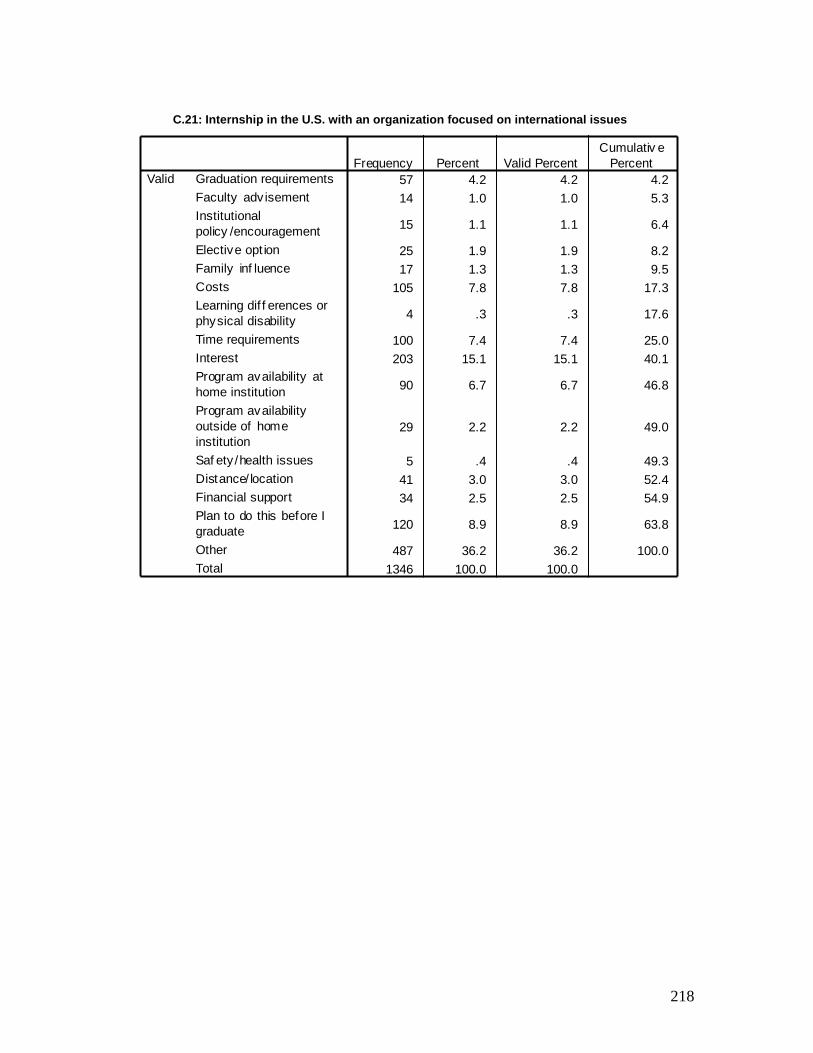
218
Internship in the U.S. with an organization focused on international issues
57 4.2 4.2 4.2
14 1.0 1.0 5.3
15 1.1 1.1 6.4
25 1.9 1.9 8.2
17 1.3 1.3 9.5
105 7.8 7.8 17.3
4 .3 .3 17.6
100 7.4 7.4 25.0
203 15.1 15.1 40.1
90 6.7 6.7 46.8
29 2.2 2.2 49.0
5 .4 .4 49.3
41 3.0 3.0 52.4
34 2.5 2.5 54.9
120 8.9 8.9 63.8
487 36.2 36.2 100.0
1346 100.0 100.0
Graduation requirements
Faculty adv isement
Institutional
policy /encouragement
Elective opt ion
Family inf luence
Costs
Learning dif f erences or
physical disability
Time requirements
Interest
Program availability at
home institution
Program availability
outside of home
institution
Saf ety /health issues
Distance/ location
Financial support
Plan to do this before I
graduate
Other
Total
Valid
Frequency Percent Valid Percent
Cumulativ e
Percent
C.21: Internship in the U.S. with an organization focused on international issues
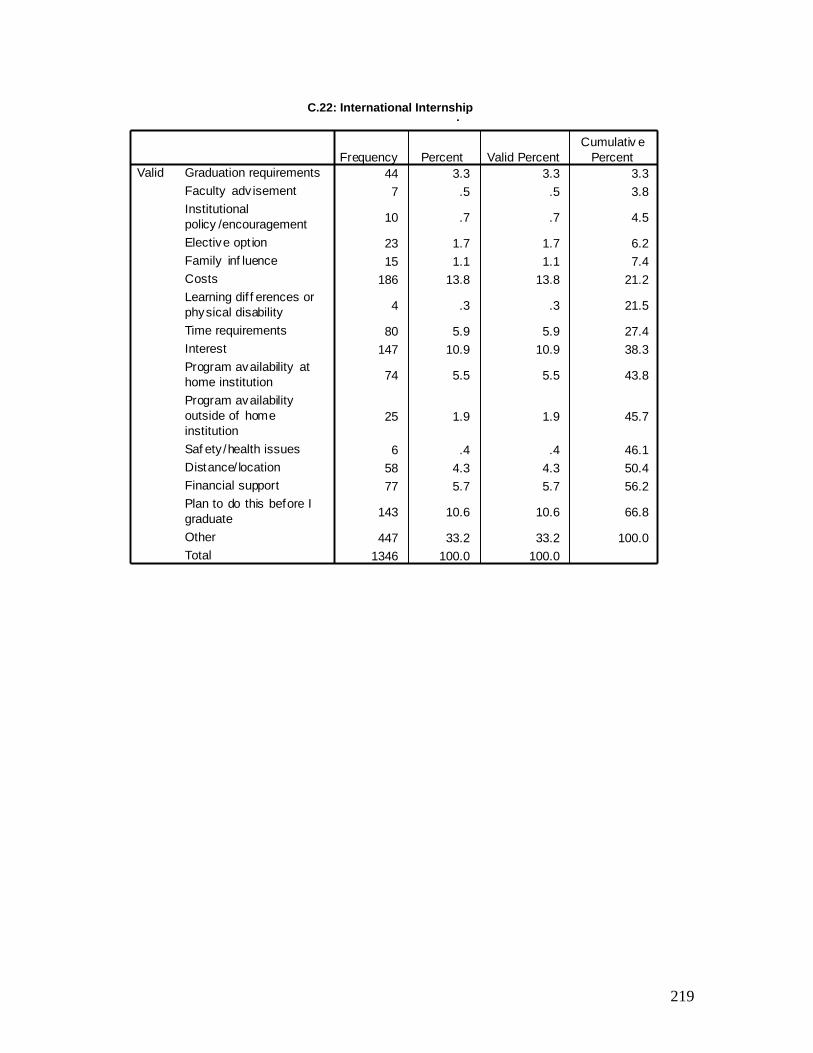
219
International internship
44 3.3 3.3 3.3
7 .5 .5 3.8
10 .7 .7 4.5
23 1.7 1.7 6.2
15 1.1 1.1 7.4
186 13.8 13.8 21.2
4 .3 .3 21.5
80 5.9 5.9 27.4
147 10.9 10.9 38.3
74 5.5 5.5 43.8
25 1.9 1.9 45.7
6 .4 .4 46.1
58 4.3 4.3 50.4
77 5.7 5.7 56.2
143 10.6 10.6 66.8
447 33.2 33.2 100.0
1346 100.0 100.0
Graduation requirements
Faculty adv isement
Institutional
policy /encouragement
Elective opt ion
Family inf luence
Costs
Learning dif f erences or
physical disability
Time requirements
Interest
Program availability at
home institution
Program availability
outside of home
institution
Saf ety /health issues
Distance/ location
Financial support
Plan to do this before I
graduate
Other
Total
Valid
Frequency Percent Valid Percent
Cumulativ e
Percent
C.22: International Internship
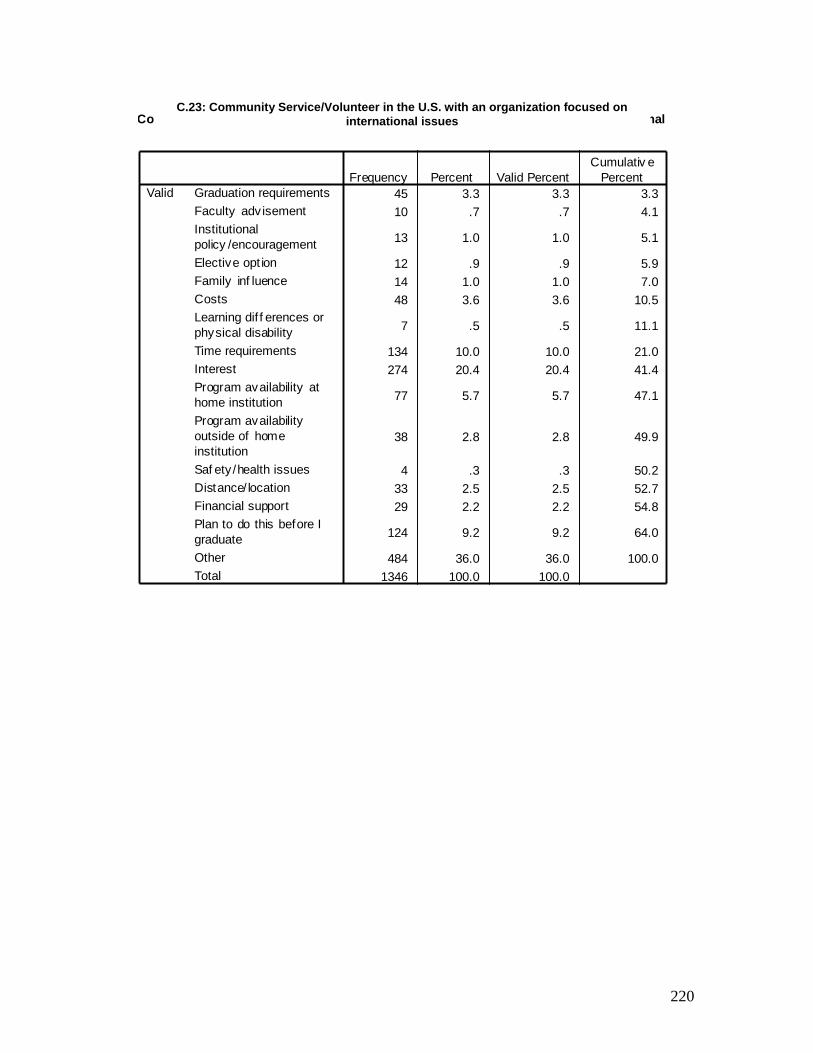
220
Community Service/Volunteer in the U.S. with an organization focused on international
issues
45 3.3 3.3 3.3
10 .7 .7 4.1
13 1.0 1.0 5.1
12 .9 .9 5.9
14 1.0 1.0 7.0
48 3.6 3.6 10.5
7 .5 .5 11.1
134 10.0 10.0 21.0
274 20.4 20.4 41.4
77 5.7 5.7 47.1
38 2.8 2.8 49.9
4 .3 .3 50.2
33 2.5 2.5 52.7
29 2.2 2.2 54.8
124 9.2 9.2 64.0
484 36.0 36.0 100.0
1346 100.0 100.0
Graduation requirements
Faculty adv isement
Institutional
policy /encouragement
Elective opt ion
Family inf luence
Costs
Learning dif f erences or
physical disability
Time requirements
Interest
Program availability at
home institution
Program availability
outside of home
institution
Saf ety /health issues
Distance/ location
Financial support
Plan to do this before I
graduate
Other
Total
Valid
Frequency Percent Valid Percent
Cumulativ e
Percent
C.23: Community Service/Volunteer in the U.S. with an organization focused on
international issues
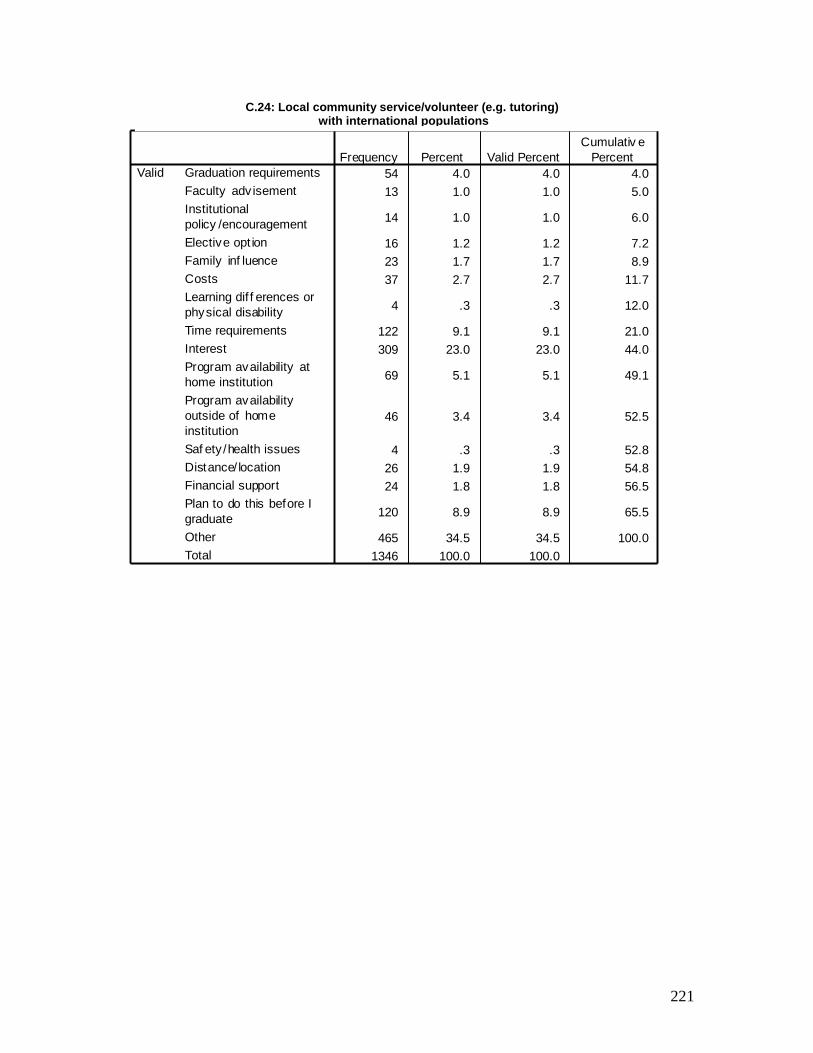
221
Local community service/volunteer (e.g. tutoring) with international populations
54 4.0 4.0 4.0
13 1.0 1.0 5.0
14 1.0 1.0 6.0
16 1.2 1.2 7.2
23 1.7 1.7 8.9
37 2.7 2.7 11.7
4 .3 .3 12.0
122 9.1 9.1 21.0
309 23.0 23.0 44.0
69 5.1 5.1 49.1
46 3.4 3.4 52.5
4 .3 .3 52.8
26 1.9 1.9 54.8
24 1.8 1.8 56.5
120 8.9 8.9 65.5
465 34.5 34.5 100.0
1346 100.0 100.0
Graduation requirements
Faculty adv isement
Institutional
policy /encouragement
Elective opt ion
Family inf luence
Costs
Learning dif f erences or
physical disability
Time requirements
Interest
Program availability at
home institution
Program availability
outside of home
institution
Saf ety /health issues
Distance/ location
Financial support
Plan to do this before I
graduate
Other
Total
Valid
Frequency Percent Valid Percent
Cumulativ e
Percent
C.24: Local community service/volunteer (e.g. tutoring) with international populations
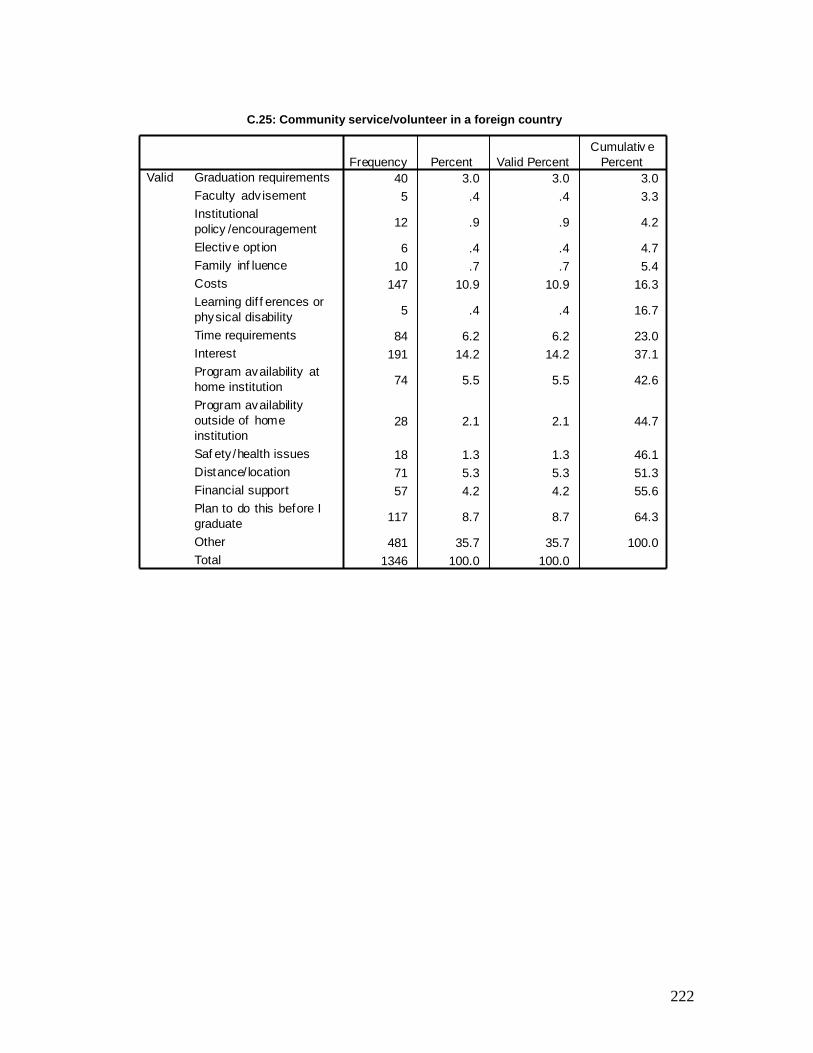
222
Community service/volunteer in a foreign country
40 3.0 3.0 3.0
5 .4 .4 3.3
12 .9 .9 4.2
6 .4 .4 4.7
10 .7 .7 5.4
147 10.9 10.9 16.3
5 .4 .4 16.7
84 6.2 6.2 23.0
191 14.2 14.2 37.1
74 5.5 5.5 42.6
28 2.1 2.1 44.7
18 1.3 1.3 46.1
71 5.3 5.3 51.3
57 4.2 4.2 55.6
117 8.7 8.7 64.3
481 35.7 35.7 100.0
1346 100.0 100.0
Graduation requirements
Faculty adv isement
Institutional
policy /encouragement
Elective opt ion
Family inf luence
Costs
Learning dif f erences or
physical disability
Time requirements
Interest
Program availability at
home institution
Program availability
outside of home
institution
Saf ety /health issues
Distance/ location
Financial support
Plan to do this before I
graduate
Other
Total
Valid
Frequency Percent Valid Percent
Cumulativ e
Percent
C.25: Community service/volunteer in a foreign country
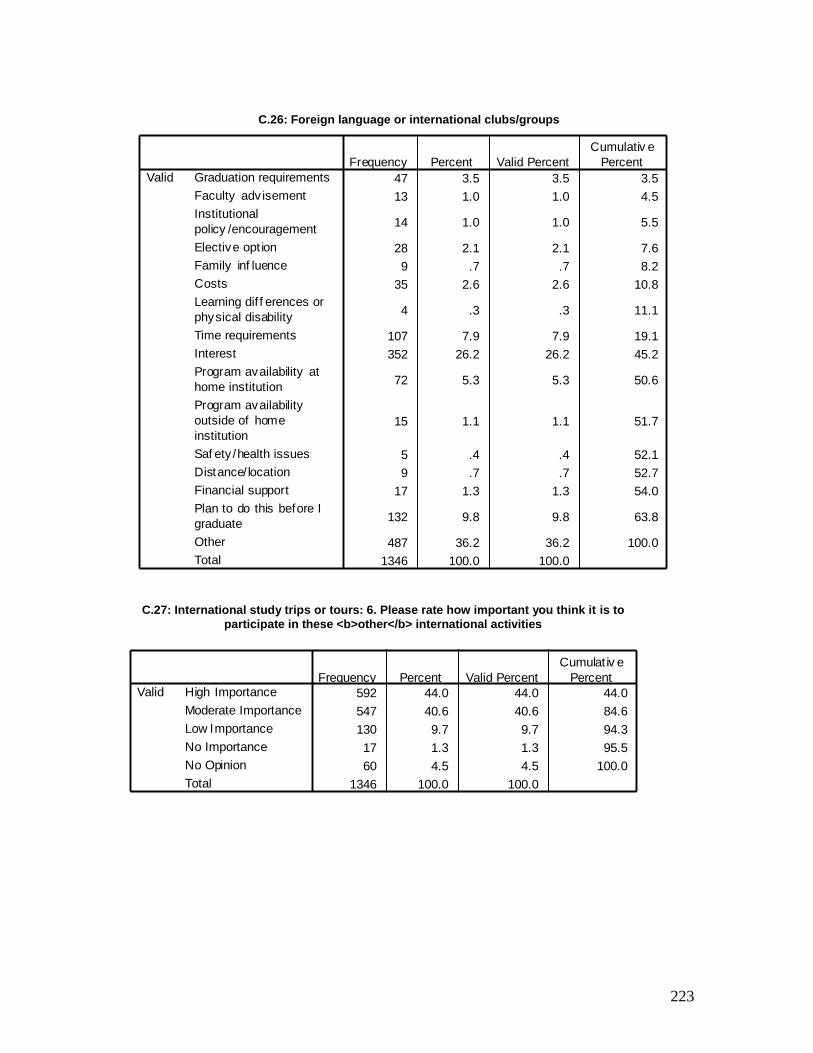
223
International study trips or tours : 6. Please rate how important you think it is to
participate in these <b>other</b> international activities
592 44.0 44.0 44.0
547 40.6 40.6 84.6
130 9.7 9.7 94.3
17 1.3 1.3 95.5
60 4.5 4.5 100.0
1346 100.0 100.0
High Importance
Moderate Importance
Low Importance
No Importance
No Opinion
Total
ValidFrequency Percent Valid Percent
Cumulat iv e
Percent
Foreign language or international clubs/groups
47 3.5 3.5 3.5
13 1.0 1.0 4.5
14 1.0 1.0 5.5
28 2.1 2.1 7.6
9 .7 .7 8.2
35 2.6 2.6 10.8
4 .3 .3 11.1
107 7.9 7.9 19.1
352 26.2 26.2 45.2
72 5.3 5.3 50.6
15 1.1 1.1 51.7
5 .4 .4 52.1
9 .7 .7 52.7
17 1.3 1.3 54.0
132 9.8 9.8 63.8
487 36.2 36.2 100.0
1346 100.0 100.0
Graduation requirements
Faculty adv isement
Institutional
policy /encouragement
Elective opt ion
Family inf luence
Costs
Learning dif f erences or
physical disability
Time requirements
Interest
Program availability at
home institution
Program availability
outside of home
institution
Saf ety /health issues
Distance/ location
Financial support
Plan to do this before I
graduate
Other
Total
Valid
Frequency Percent Valid Percent
Cumulativ e
Percent
C.26: Foreign language or international clubs/groups
C.27: International study trips or tours: 6. Please rate how important you think it is to
participate in these <b>other</b> international activities
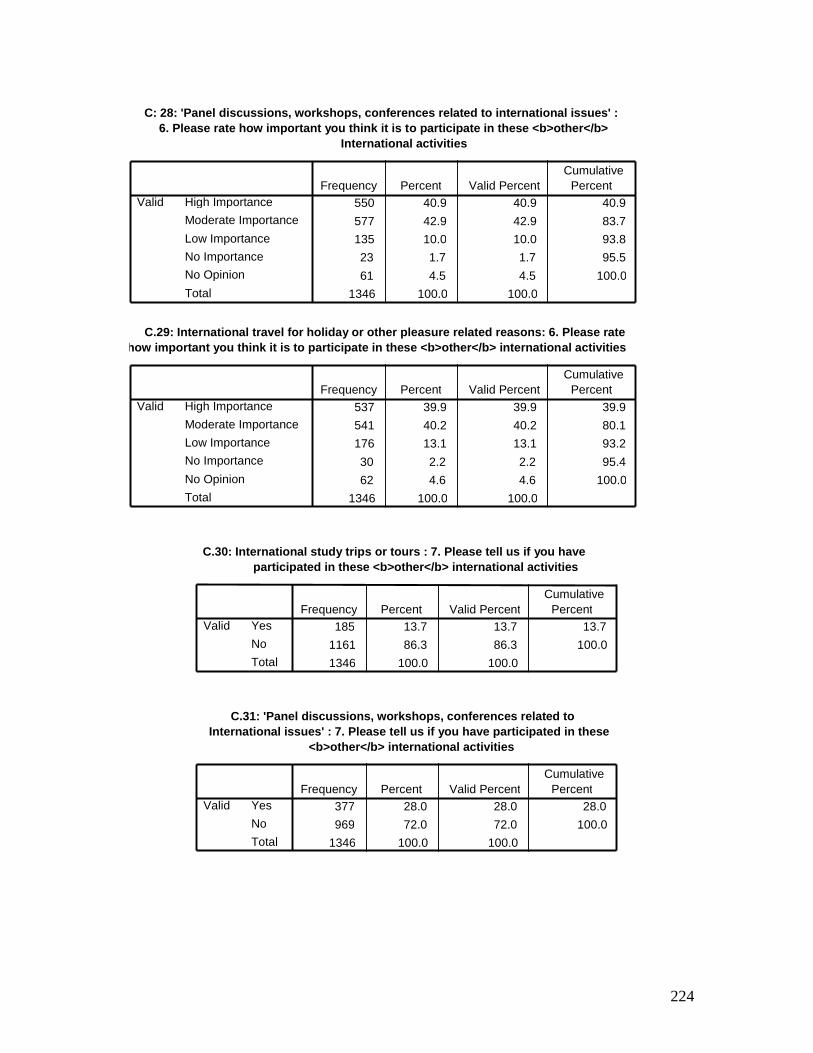
224
C: 28: 'Panel discussions, workshops, conferences related to international issues' : 6. Please rate how important you think it is to participate in these <b>other</b>
International activities
550 40.9 40.9 40.9
577 42.9 42.9 83.7 135 10.0 10.0 93.8
23 1.7 1.7 95.5
61 4.5 4.5 100.0 1346 100.0 100.0
High Importance Moderate Importance
Low Importance No Importance No Opinion
Total
Valid Frequency Percent Valid Percent
Cumulative Percent
C.29: International travel for holiday or other pleasure related reasons: 6. Please rate how important you think it is to participate in these <b>other</b> international activities
537 39.9 39.9 39.9
541 40.2 40.2 80.1
176 13.1 13.1 93.2
30 2.2 2.2 95.4
62 4.6 4.6 100.0
1346 100.0 100.0
High Importance
Moderate Importance
Low Importance No Importance
No Opinion
Total
Valid Frequency Percent Valid Percent
Cumulative Percent
C.30: International study trips or tours : 7. Please tell us if you have participated in these <b>other</b> international activities
185 13.7 13.7 13.7
1161 86.3 86.3 100.0
1346 100.0 100.0
Yes
No
Total
Valid Frequency Percent Valid Percent
Cumulative Percent
C.31: 'Panel discussions, workshops, conferences related to International issues' : 7. Please tell us if you have participated in these
<b>other</b> international activities
377 28.0 28.0 28.0
969 72.0 72.0 100.0
1346 100.0 100.0
Yes
No
Total
Valid Frequency Percent Valid Percent
Cumulative Percent
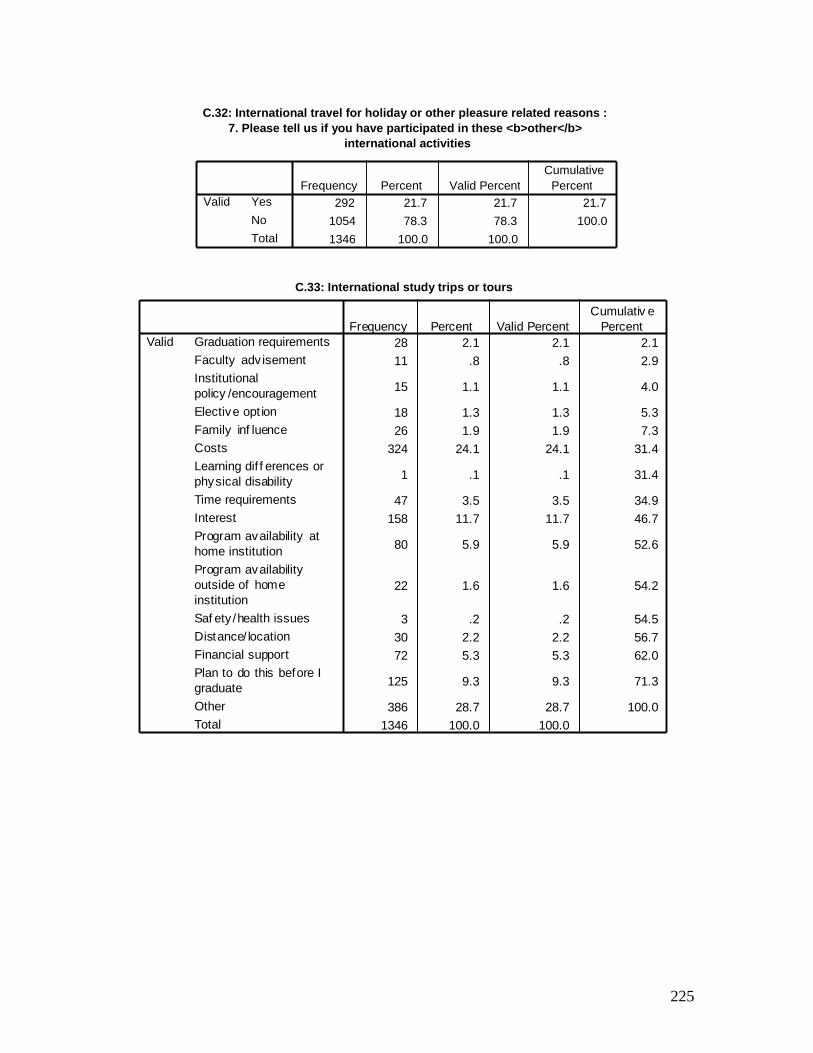
225
C.32: International travel for holiday or other pleasure related reasons : 7. Please tell us if you have participated in these <b>other</b>
international activities
292 21.7 21.7 21.7
1054 78.3 78.3 100.0
1346 100.0 100.0
Yes
No
Total
Valid Frequency Percent Valid Percent
Cumulative Percent
International study trips or tours
28 2.1 2.1 2.1
11 .8 .8 2.9
15 1.1 1.1 4.0
18 1.3 1.3 5.3
26 1.9 1.9 7.3
324 24.1 24.1 31.4
1 .1 .1 31.4
47 3.5 3.5 34.9
158 11.7 11.7 46.7
80 5.9 5.9 52.6
22 1.6 1.6 54.2
3 .2 .2 54.5
30 2.2 2.2 56.7
72 5.3 5.3 62.0
125 9.3 9.3 71.3
386 28.7 28.7 100.0
1346 100.0 100.0
Graduation requirements
Faculty adv isement
Institutional
policy /encouragement
Elective opt ion
Family inf luence
Costs
Learning dif f erences or
physical disability
Time requirements
Interest
Program availability at
home institution
Program availability
outside of home
institution
Saf ety /health issues
Distance/ location
Financial support
Plan to do this before I
graduate
Other
Total
Valid
Frequency Percent Valid Percent
Cumulativ e
Percent
C.33: International study trips or tours
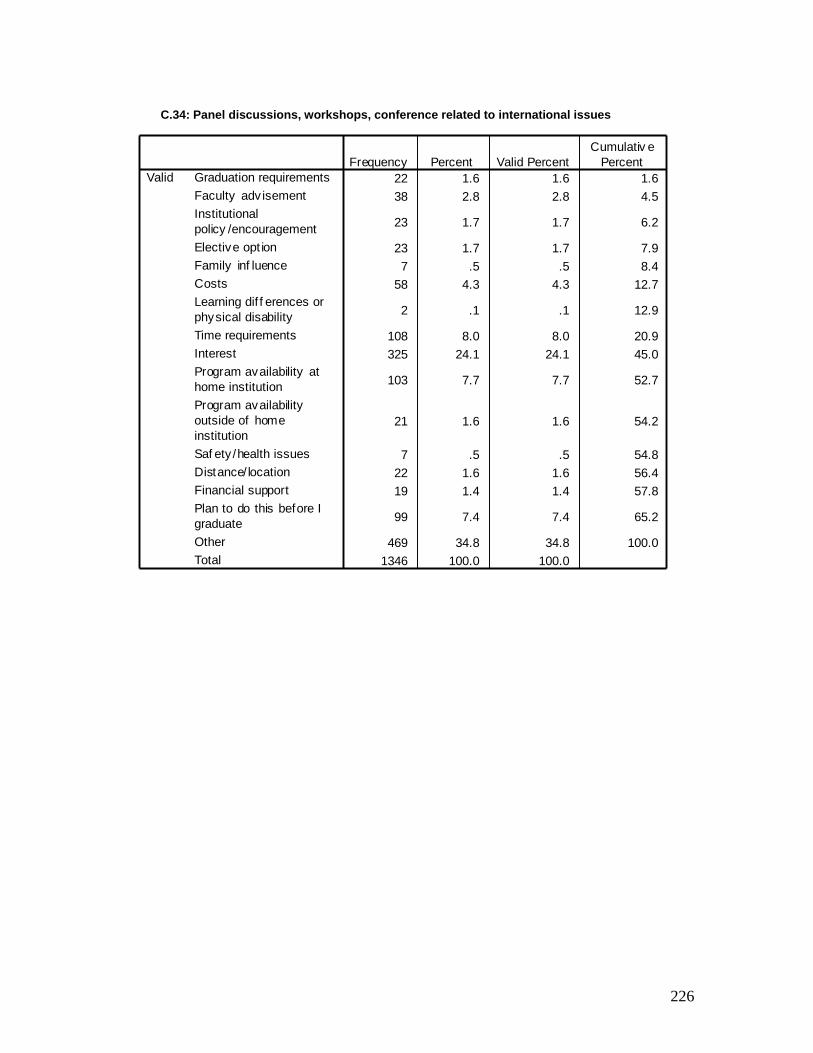
226
Panel discussions, workshops, conferences related to international issues
22 1.6 1.6 1.6
38 2.8 2.8 4.5
23 1.7 1.7 6.2
23 1.7 1.7 7.9
7 .5 .5 8.4
58 4.3 4.3 12.7
2 .1 .1 12.9
108 8.0 8.0 20.9
325 24.1 24.1 45.0
103 7.7 7.7 52.7
21 1.6 1.6 54.2
7 .5 .5 54.8
22 1.6 1.6 56.4
19 1.4 1.4 57.8
99 7.4 7.4 65.2
469 34.8 34.8 100.0
1346 100.0 100.0
Graduation requirements
Faculty adv isement
Institutional
policy /encouragement
Elective opt ion
Family inf luence
Costs
Learning dif f erences or
physical disability
Time requirements
Interest
Program availability at
home institution
Program availability
outside of home
institution
Saf ety /health issues
Distance/ location
Financial support
Plan to do this before I
graduate
Other
Total
Valid
Frequency Percent Valid Percent
Cumulativ e
Percent
C.34: Panel discussions, workshops, conference related to international issues

227
International travel for holiday or other pleasure related reasons
13 1.0 1.0 1.0
6 .4 .4 1.4
1 .1 .1 1.5
9 .7 .7 2.2
68 5.1 5.1 7.2
282 21.0 21.0 28.2
6 .4 .4 28.6
43 3.2 3.2 31.8
228 16.9 16.9 48.7
40 3.0 3.0 51.7
12 .9 .9 52.6
3 .2 .2 52.8
17 1.3 1.3 54.1
83 6.2 6.2 60.3
108 8.0 8.0 68.3
427 31.7 31.7 100.0
1346 100.0 100.0
Graduation requirements
Faculty adv isement
Institutional
policy /encouragement
Elective opt ion
Family inf luence
Costs
Learning dif f erences or
physical disability
Time requirements
Interest
Program availability at
home institution
Program availability
outside of home
institution
Saf ety /health issues
Distance/ location
Financial support
Plan to do this before I
graduate
Other
Total
Valid
Frequency Percent Valid Percent
Cumulativ e
Percent
C.35: International travel for holiday or other pleasures related reasons
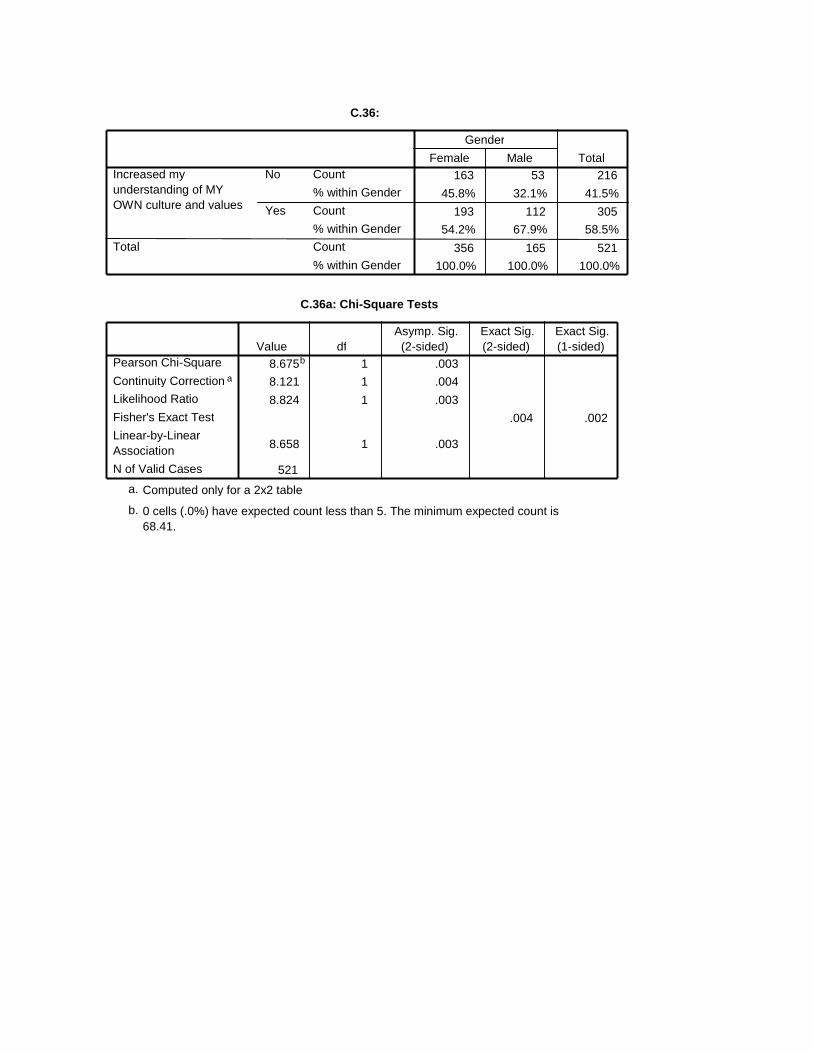
C.36:
163 53 216
45.8% 32.1% 41.5%
193 112 305 54.2% 67.9% 58.5%
356 165 521 100.0% 100.0% 100.0%
Count
% within Gender
Count
% within Gender Count
% within Gender
No
Yes
Increased my understanding of MY OWN culture and values
Total
Female Male
Gender
Total
C.36a: Chi-Square Tests
8.675 b 1 .003 8.121 1 .004
8.824 1 .003 .004 .002
8.658 1 .003
521
Pearson Chi-Square
Continuity Correction a
Likelihood Ratio
Fisher's Exact Test
Linear-by-Linear Association
N of Valid Cases
Value df Asymp. Sig.
(2-sided) Exact Sig. (2-sided)
Exact Sig. (1-sided)
Computed only for a 2x2 table a.
0 cells (.0%) have expected count less than 5. The minimum expected count is 68.41.
b.

229
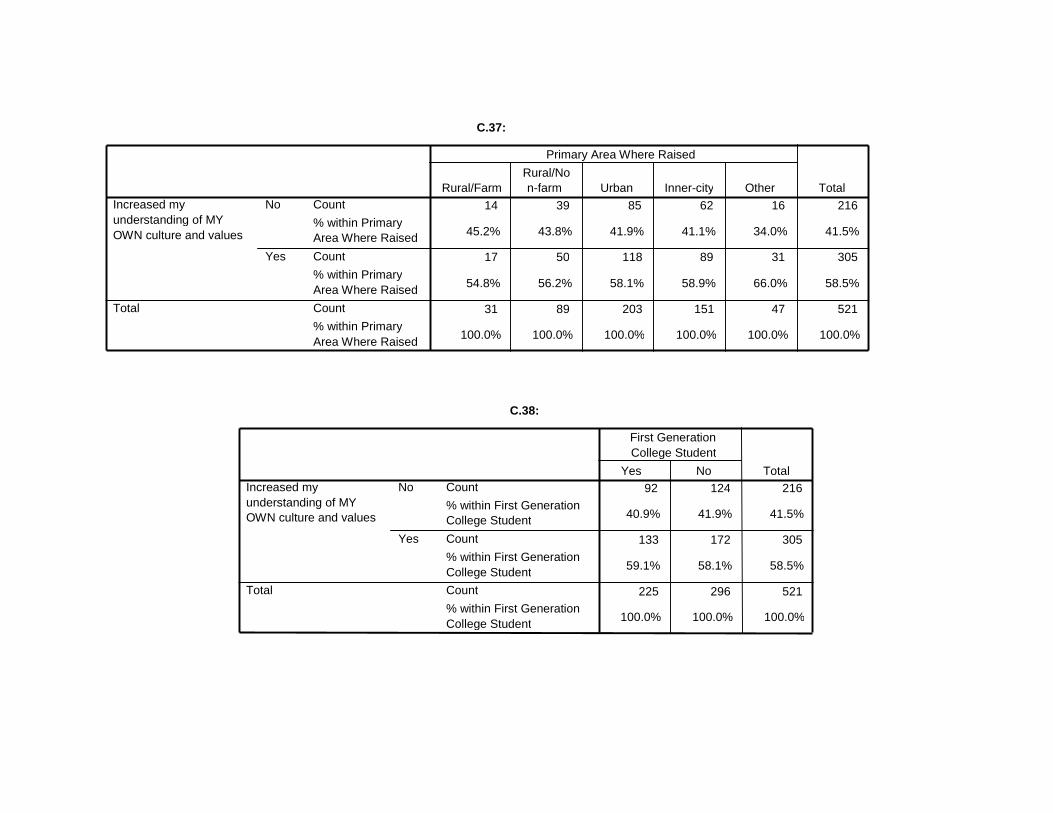
C.37:
14 39 85 62 16 216
45.2% 43.8% 41.9% 41.1% 34.0% 41.5%
17 50 118 89 31 305
54.8% 56.2% 58.1% 58.9% 66.0% 58.5%
31 89 203 151 47 521
100.0% 100.0% 100.0% 100.0% 100.0% 100.0%
Count
% within Primary Area Where Raised
Count
% within Primary Area Where Raised
Count
% within Primary Area Where Raised
No
Yes
Increased my understanding of MY OWN culture and values
Total
Rural/Farm Rural/No n-farm Urban Inner-city Other
Primary Area Where Raised
Total
C.38:
92 124 216
40.9% 41.9% 41.5%
133 172 305
59.1% 58.1% 58.5%
225 296 521
100.0% 100.0% 100.0%
Count
% within First Generation College Student
Count
% within First Generation College Student Count
% within First Generation College Student
No
Yes
Increased my understanding of MY OWN culture and values
Total
Yes No
First Generation College Student
Total
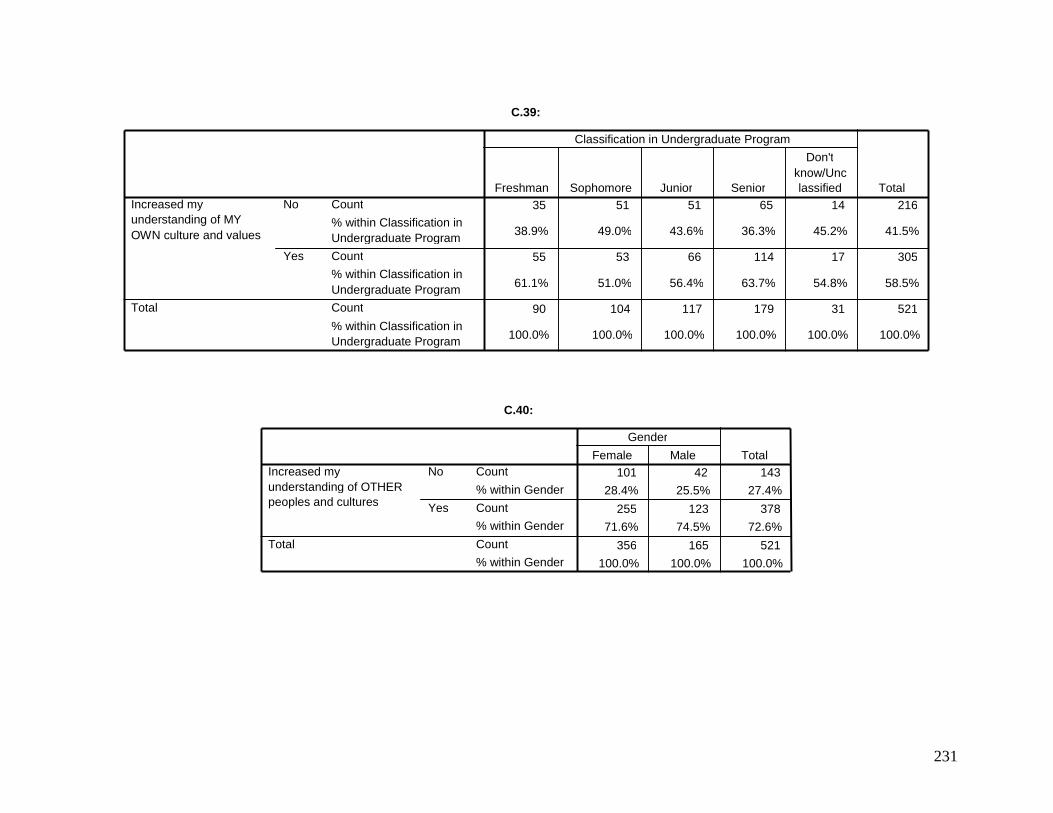
231
C.39:
35 51 51 65 14 216
38.9% 49.0% 43.6% 36.3% 45.2% 41.5%
55 53 66 114 17 305
61.1% 51.0% 56.4% 63.7% 54.8% 58.5%
90 104 117 179 31 521
100.0% 100.0% 100.0% 100.0% 100.0% 100.0%
Count
% within Classification in Undergraduate Program Count % within Classification in Undergraduate Program Count
% within Classification in Undergraduate Program
No
Yes
Increased my understanding of MY OWN culture and values
Total
Freshman Sophomore Junior Senior
Don't know/Unc lassified
Classification in Undergraduate Program
Total
C.40:
101 42 143 28.4% 25.5% 27.4%
255 123 378 71.6% 74.5% 72.6%
356 165 521 100.0% 100.0% 100.0%
Count
% within Gender
Count % within Gender
Count % within Gender
No
Yes
Increased my understanding of OTHER peoples and cultures
Total
Female Male
Gender
Total
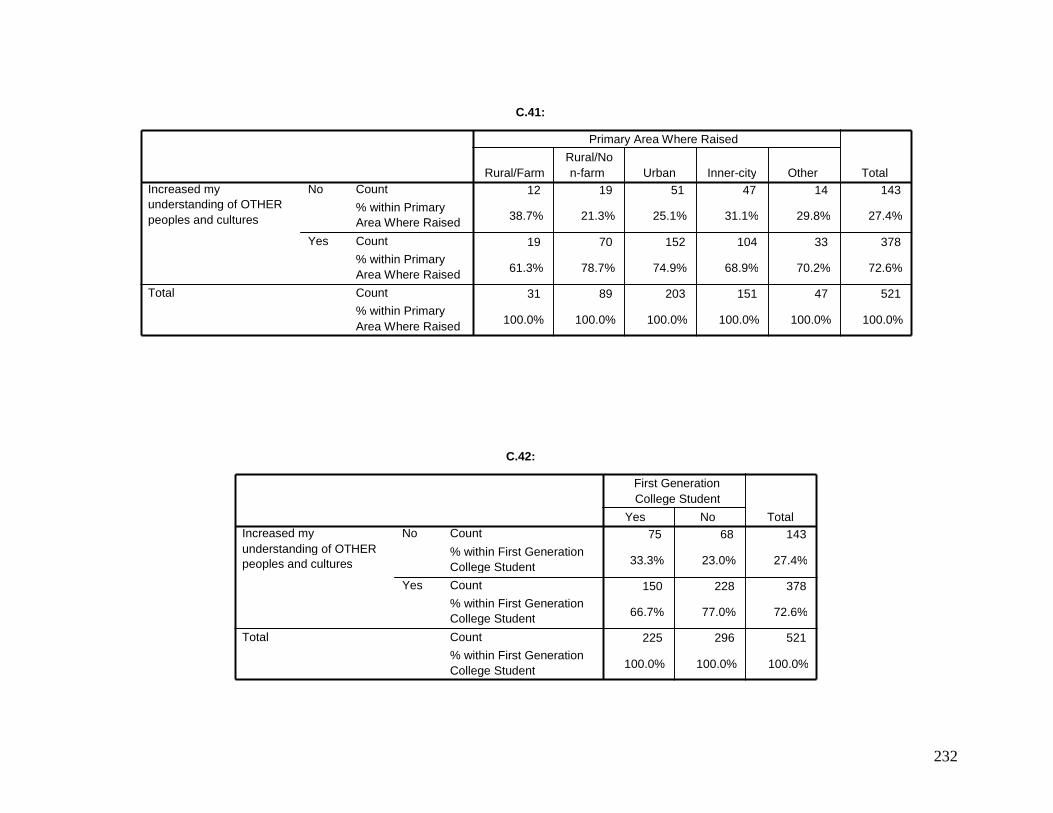
232
C.41:
12 19 51 47 14 143
38.7% 21.3% 25.1% 31.1% 29.8% 27.4%
19 70 152 104 33 378
61.3% 78.7% 74.9% 68.9% 70.2% 72.6%
31 89 203 151 47 521
100.0% 100.0% 100.0% 100.0% 100.0% 100.0%
Count
% within Primary Area Where Raised
Count
% within Primary Area Where Raised
Count % within Primary Area Where Raised
No
Yes
Increased my understanding of OTHER peoples and cultures
Total
Rural/Farm Rural/No n-farm Urban Inner-city Other
Primary Area Where Raised
Total
C.42:
75 68 143
33.3% 23.0% 27.4%
150 228 378
66.7% 77.0% 72.6%
225 296 521
100.0% 100.0% 100.0%
Count
% within First Generation College Student
Count
% within First Generation College Student
Count
% within First Generation College Student
No
Yes
Increased my understanding of OTHER peoples and cultures
Total
Yes No
First Generation College Student
Total
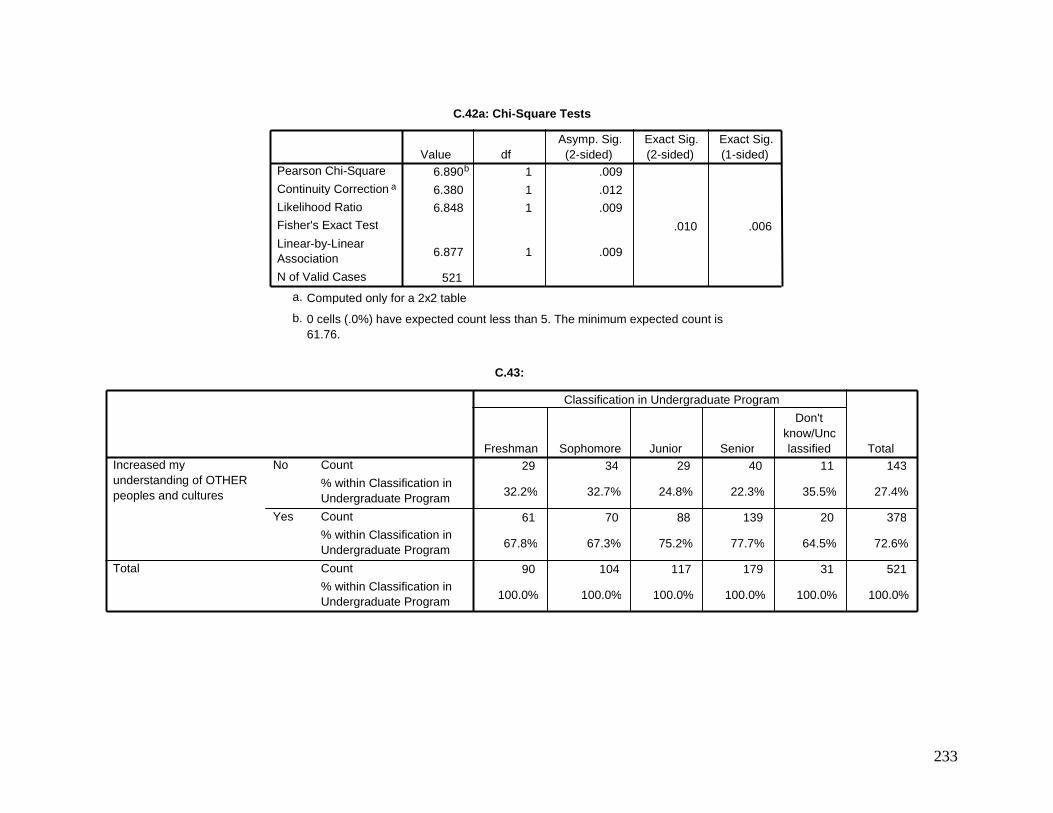
233
C.42a: Chi-Square Tests
6.890 b 1 .009
6.380 1 .012 6.848 1 .009
.010 .006
6.877 1 .009
521
Pearson Chi-Square
Continuity Correction a
Likelihood Ratio Fisher's Exact Test
Linear-by-Linear Association
N of Valid Cases
Value df Asymp. Sig.
(2-sided) Exact Sig. (2-sided)
Exact Sig. (1-sided)
Computed only for a 2x2 table a.
0 cells (.0%) have expected count less than 5. The minimum expected count is 61.76.
b.
C.43:
29 34 29 40 11 143
32.2% 32.7% 24.8% 22.3% 35.5% 27.4%
61 70 88 139 20 378
67.8% 67.3% 75.2% 77.7% 64.5% 72.6%
90 104 117 179 31 521
100.0% 100.0% 100.0% 100.0% 100.0% 100.0%
Count
% within Classification in Undergraduate Program
Count
% within Classification in Undergraduate Program
Count
% within Classification in Undergraduate Program
No
Yes
Increased my understanding of OTHER peoples and cultures
Total
Freshman Sophomore Junior Senior
Don't know/Unc lassified
Classification in Undergraduate Program
Total
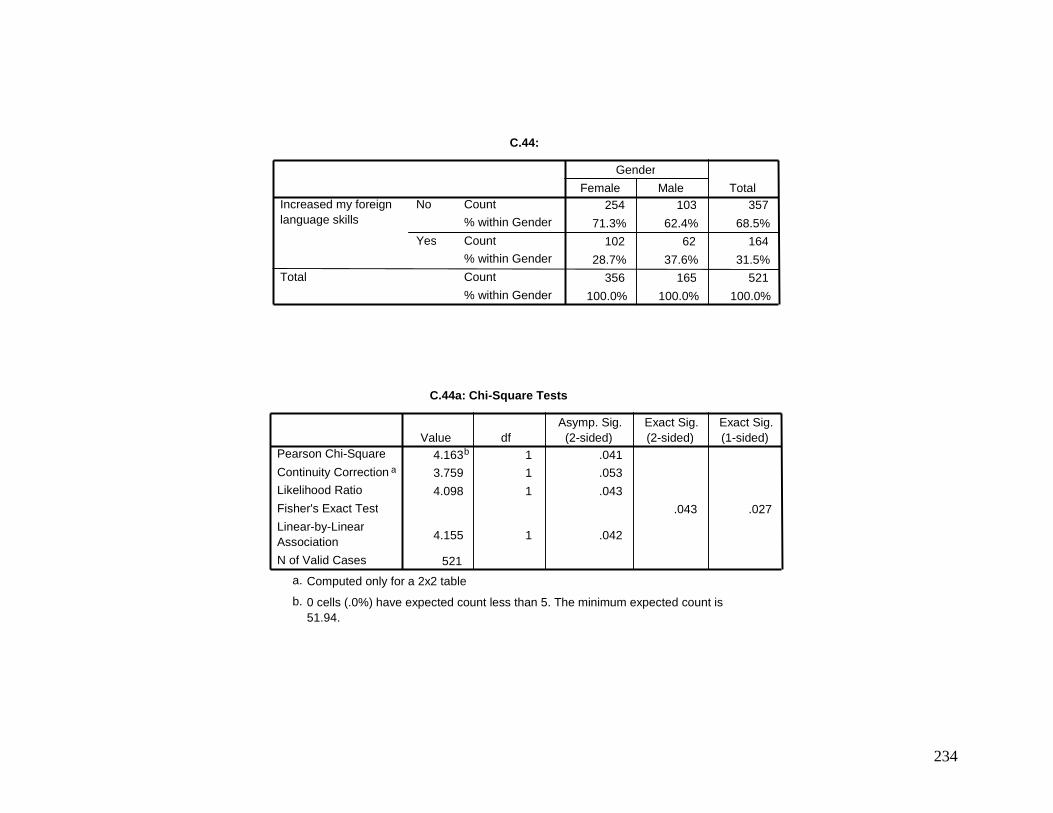
234
C.44:
254 103 357
71.3% 62.4% 68.5% 102 62 164
28.7% 37.6% 31.5% 356 165 521
100.0% 100.0% 100.0%
Count % within Gender
Count % within Gender
Count
% within Gender
No
Yes
Increased my foreign language skills
Total
Female Male
Gender
Total
C.44a: Chi-Square Tests
4.163 b 1 .041 3.759 1 .053
4.098 1 .043 .043 .027
4.155 1 .042
521
Pearson Chi-Square
Continuity Correction a
Likelihood Ratio
Fisher's Exact Test
Linear-by-Linear Association
N of Valid Cases
Value df Asymp. Sig.
(2-sided) Exact Sig. (2-sided)
Exact Sig. (1-sided)
Computed only for a 2x2 table a.
0 cells (.0%) have expected count less than 5. The minimum expected count is 51.94.
b.

235
C.45:
20 62 137 108 30 357
64.5% 69.7% 67.5% 71.5% 63.8% 68.5%
11 27 66 43 17 164
35.5% 30.3% 32.5% 28.5% 36.2% 31.5%
31 89 203 151 47 521
100.0% 100.0% 100.0% 100.0% 100.0% 100.0%
Count
% within Primary Area Where Raised
Count
% within Primary Area Where Raised
Count % within Primary Area Where Raised
No
Yes
Increased my foreign language skills
Total
Rural/Farm Rural/No n-farm Urban Inner-city Other
Primary Area Where Raised
Total
C.46:
168 189 357
74.7% 63.9% 68.5%
57 107 164
25.3% 36.1% 31.5%
225 296 521
100.0% 100.0% 100.0%
Count
% within First Generation College Student Count
% within First Generation College Student
Count % within First Generation College Student
No
Yes
Increased my foreign language skills
Total
Yes No
First Generation College Student
Total
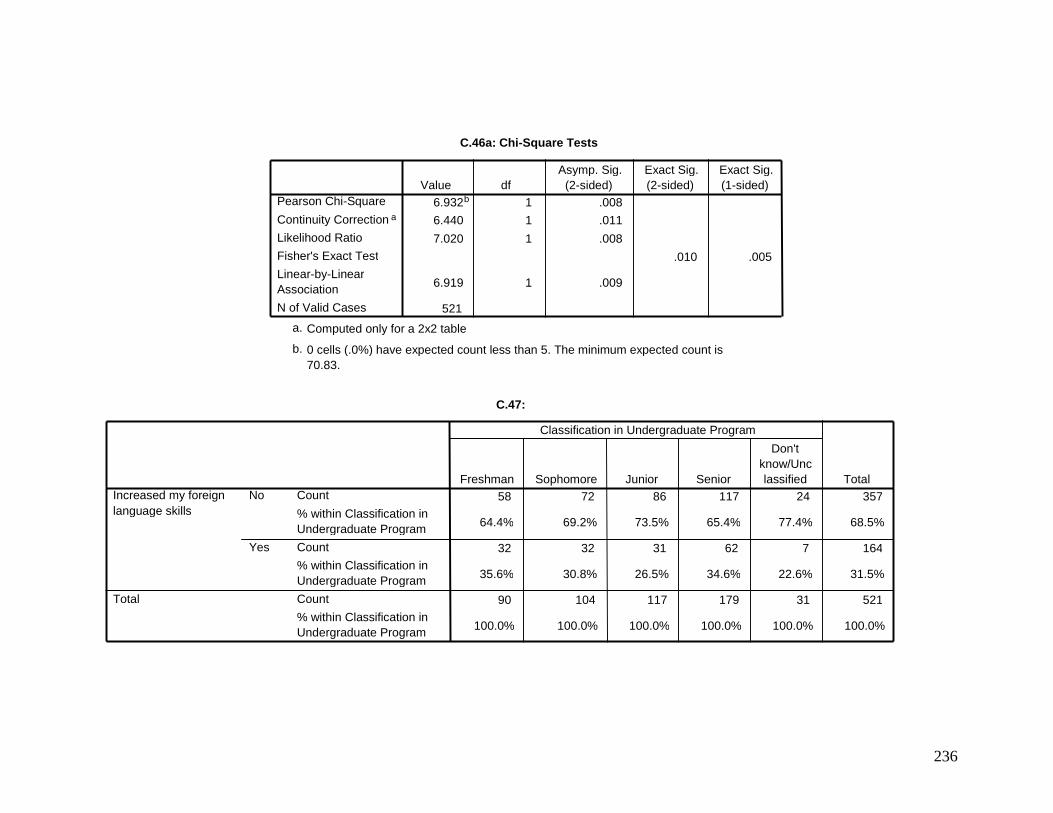
236
C.46a: Chi-Square Tests
6.932 b 1 .008 6.440 1 .011
7.020 1 .008
.010 .005
6.919 1 .009
521
Pearson Chi-Square
Continuity Correction a
Likelihood Ratio
Fisher's Exact Test
Linear-by-Linear Association
N of Valid Cases
Value df Asymp. Sig.
(2-sided) Exact Sig. (2-sided)
Exact Sig. (1-sided)
Computed only for a 2x2 table a.
0 cells (.0%) have expected count less than 5. The minimum expected count is 70.83.
b.
C.47:
58 72 86 117 24 357
64.4% 69.2% 73.5% 65.4% 77.4% 68.5%
32 32 31 62 7 164
35.6% 30.8% 26.5% 34.6% 22.6% 31.5%
90 104 117 179 31 521
100.0% 100.0% 100.0% 100.0% 100.0% 100.0%
Count
% within Classification in Undergraduate Program
Count
% within Classification in Undergraduate Program
Count
% within Classification in Undergraduate Program
No
Yes
Increased my foreign language skills
Total
Freshman Sophomore Junior Senior
Don't know/Unc lassified
Classification in Undergraduate Program
Total
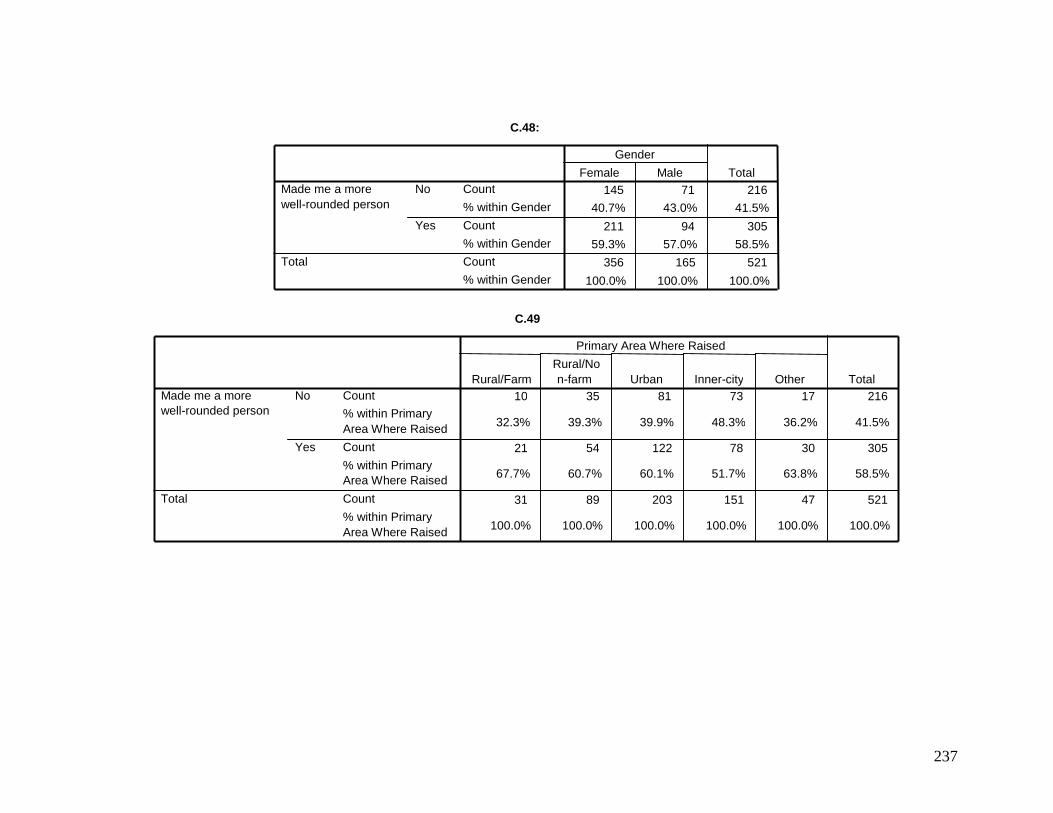
237
C.48:
145 71 216 40.7% 43.0% 41.5%
211 94 305 59.3% 57.0% 58.5%
356 165 521
100.0% 100.0% 100.0%
Count
% within Gender
Count
% within Gender Count % within Gender
No
Yes
Made me a more well-rounded person
Total
Female Male
Gender
Total
C.49
10 35 81 73 17 216
32.3% 39.3% 39.9% 48.3% 36.2% 41.5%
21 54 122 78 30 305
67.7% 60.7% 60.1% 51.7% 63.8% 58.5%
31 89 203 151 47 521
100.0% 100.0% 100.0% 100.0% 100.0% 100.0%
Count % within Primary Area Where Raised
Count
% within Primary Area Where Raised
Count
% within Primary Area Where Raised
No
Yes
Made me a more well-rounded person
Total
Rural/Farm Rural/No n-farm Urban Inner-city Other
Primary Area Where Raised
Total
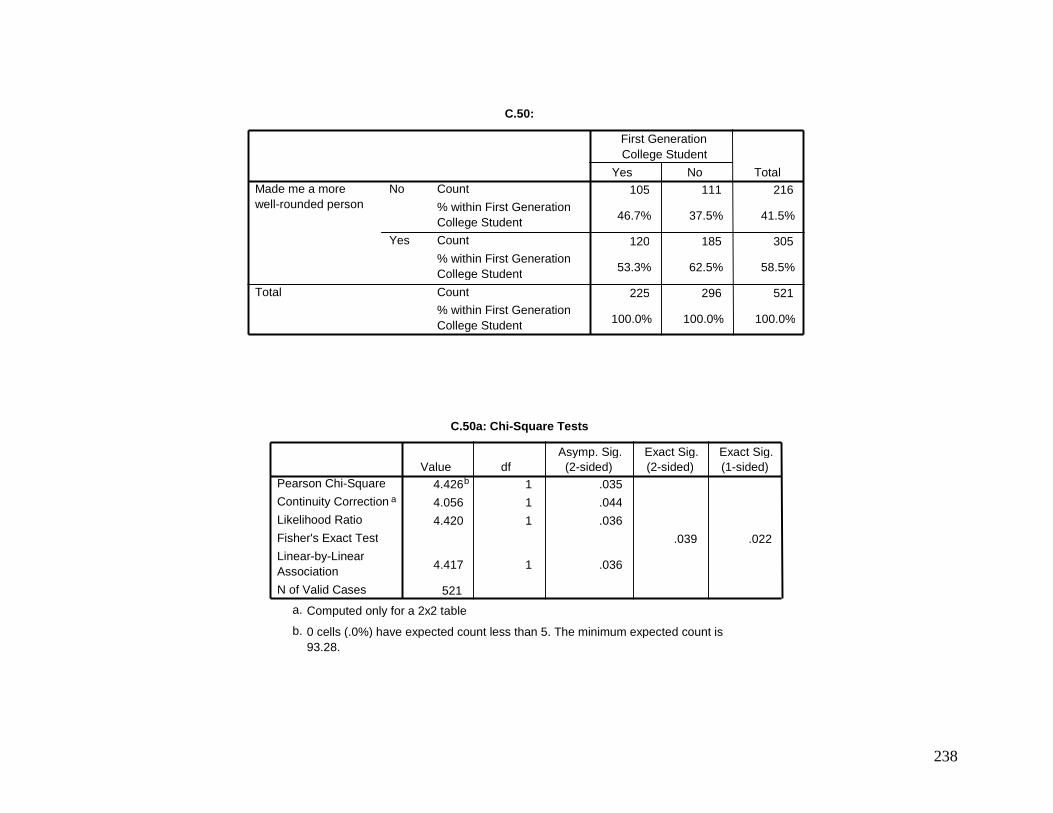
238
C.50:
105 111 216
46.7% 37.5% 41.5%
120 185 305
53.3% 62.5% 58.5%
225 296 521
100.0% 100.0% 100.0%
Count
% within First Generation College Student Count
% within First Generation College Student
Count % within First Generation College Student
No
Yes
Made me a more well-rounded person
Total
Yes No
First Generation College Student
Total
C.50a: Chi-Square Tests
4.426 b 1 .035
4.056 1 .044
4.420 1 .036
.039 .022
4.417 1 .036
521
Pearson Chi-Square
Continuity Correction a
Likelihood Ratio
Fisher's Exact Test
Linear-by-Linear Association
N of Valid Cases
Value df Asymp. Sig.
(2-sided) Exact Sig. (2-sided)
Exact Sig. (1-sided)
Computed only for a 2x2 table a.
0 cells (.0%) have expected count less than 5. The minimum expected count is 93.28.
b.
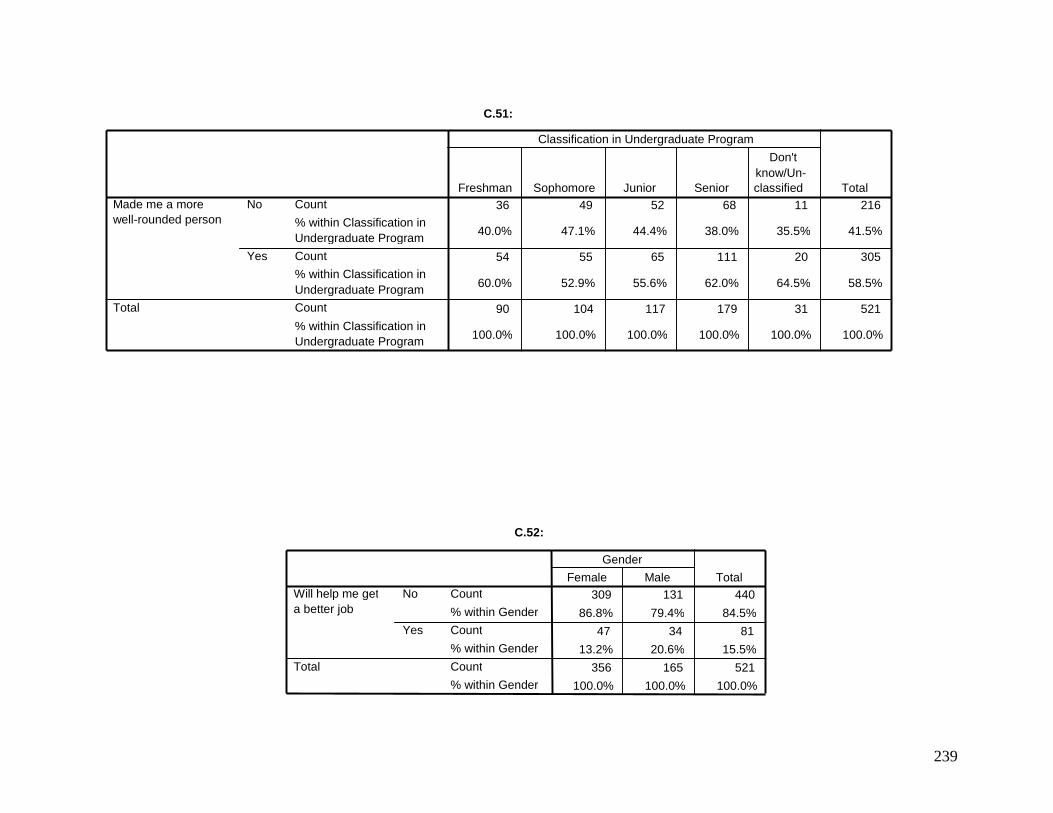
239
C.51:
36 49 52 68 11 216
40.0% 47.1% 44.4% 38.0% 35.5% 41.5%
54 55 65 111 20 305
60.0% 52.9% 55.6% 62.0% 64.5% 58.5%
90 104 117 179 31 521
100.0% 100.0% 100.0% 100.0% 100.0% 100.0%
Count
% within Classification in Undergraduate Program Count % within Classification in Undergraduate Program Count
% within Classification in Undergraduate Program
No
Yes
Made me a more well-rounded person
Total
Freshman Sophomore Junior Senior
Don't know/Un- classified
Classification in Undergraduate Program
Total
C.52:
309 131 440
86.8% 79.4% 84.5%
47 34 81
13.2% 20.6% 15.5%
356 165 521
100.0% 100.0% 100.0%
Count
% within Gender Count
% within Gender
Count
% within Gender
No
Yes
Will help me get a better job
Total
Female Male Gender
Total
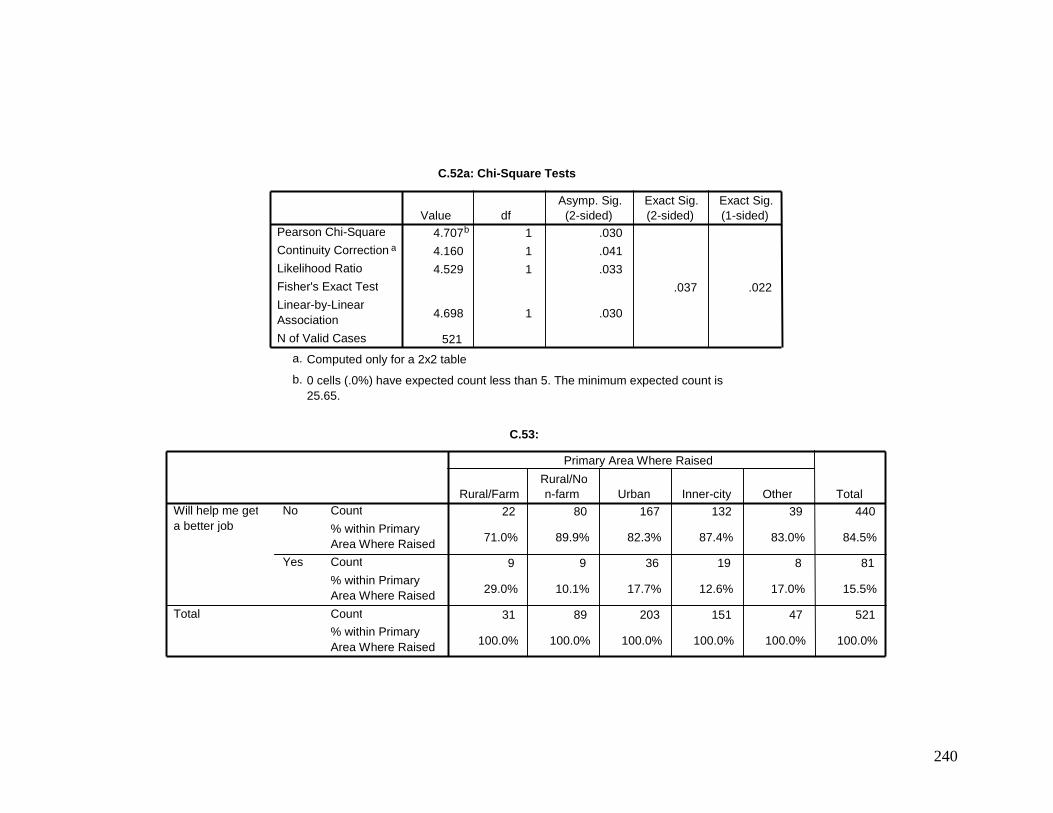
240
C.52a: Chi-Square Tests
4.707 b 1 .030
4.160 1 .041
4.529 1 .033
.037 .022
4.698 1 .030
521
Pearson Chi-Square
Continuity Correction a
Likelihood Ratio
Fisher's Exact Test
Linear-by-Linear Association
N of Valid Cases
Value df Asymp. Sig.
(2-sided) Exact Sig. (2-sided)
Exact Sig. (1-sided)
Computed only for a 2x2 table a.
0 cells (.0%) have expected count less than 5. The minimum expected count is 25.65.
b.
C.53:
22 80 167 132 39 440
71.0% 89.9% 82.3% 87.4% 83.0% 84.5%
9 9 36 19 8 81
29.0% 10.1% 17.7% 12.6% 17.0% 15.5%
31 89 203 151 47 521
100.0% 100.0% 100.0% 100.0% 100.0% 100.0%
Count
% within Primary Area Where Raised Count
% within Primary Area Where Raised
Count % within Primary Area Where Raised
No
Yes
Will help me get a better job
Total
Rural/Farm Rural/No n-farm Urban Inner-city Other
Primary Area Where Raised
Total
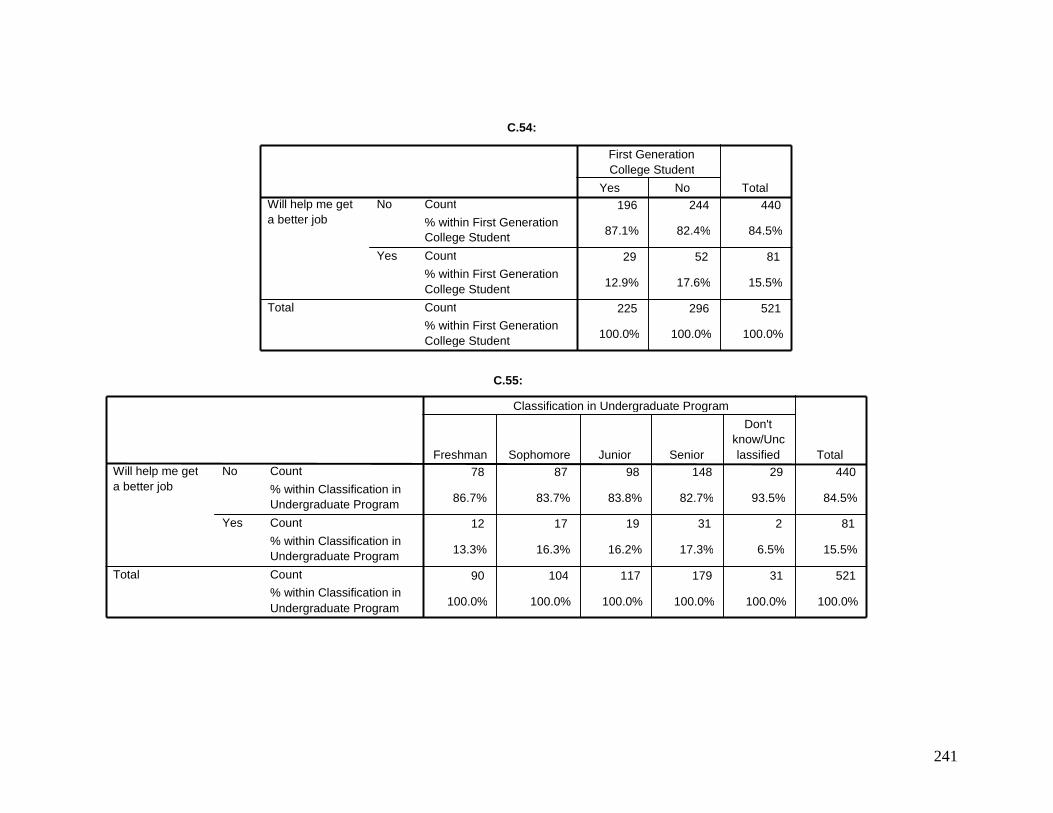
241
C.54:
196 244 440
87.1% 82.4% 84.5%
29 52 81
12.9% 17.6% 15.5%
225 296 521
100.0% 100.0% 100.0%
Count
% within First Generation College Student
Count
% within First Generation College Student
Count % within First Generation College Student
No
Yes
Will help me get a better job
Total
Yes No
First Generation College Student
Total
C.55:
78 87 98 148 29 440
86.7% 83.7% 83.8% 82.7% 93.5% 84.5%
12 17 19 31 2 81
13.3% 16.3% 16.2% 17.3% 6.5% 15.5%
90 104 117 179 31 521
100.0% 100.0% 100.0% 100.0% 100.0% 100.0%
Count
% within Classification in Undergraduate Program
Count
% within Classification in Undergraduate Program
Count % within Classification in Undergraduate Program
No
Yes
Will help me get a better job
Total
Freshman Sophomore Junior Senior
Don't know/Unc lassified
Classification in Undergraduate Program
Total
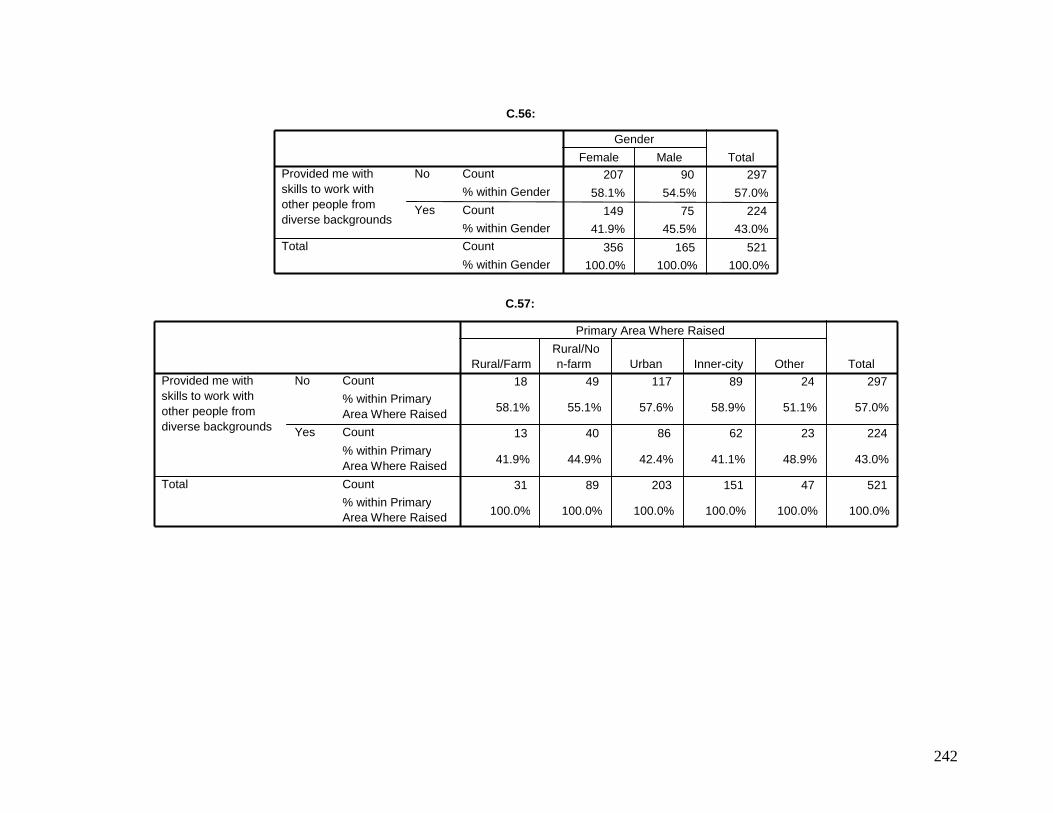
242
C.56:
207 90 297
58.1% 54.5% 57.0%
149 75 224 41.9% 45.5% 43.0%
356 165 521 100.0% 100.0% 100.0%
Count
% within Gender
Count
% within Gender Count
% within Gender
No
Yes
Provided me with skills to work with other people from diverse backgrounds
Total
Female Male
Gender
Total
C.57:
18 49 117 89 24 297
58.1% 55.1% 57.6% 58.9% 51.1% 57.0%
13 40 86 62 23 224
41.9% 44.9% 42.4% 41.1% 48.9% 43.0%
31 89 203 151 47 521
100.0% 100.0% 100.0% 100.0% 100.0% 100.0%
Count
% within Primary Area Where Raised Count
% within Primary Area Where Raised
Count
% within Primary Area Where Raised
No
Yes
Provided me with skills to work with other people from diverse backgrounds
Total
Rural/Farm Rural/No n-farm Urban Inner-city Other
Primary Area Where Raised
Total
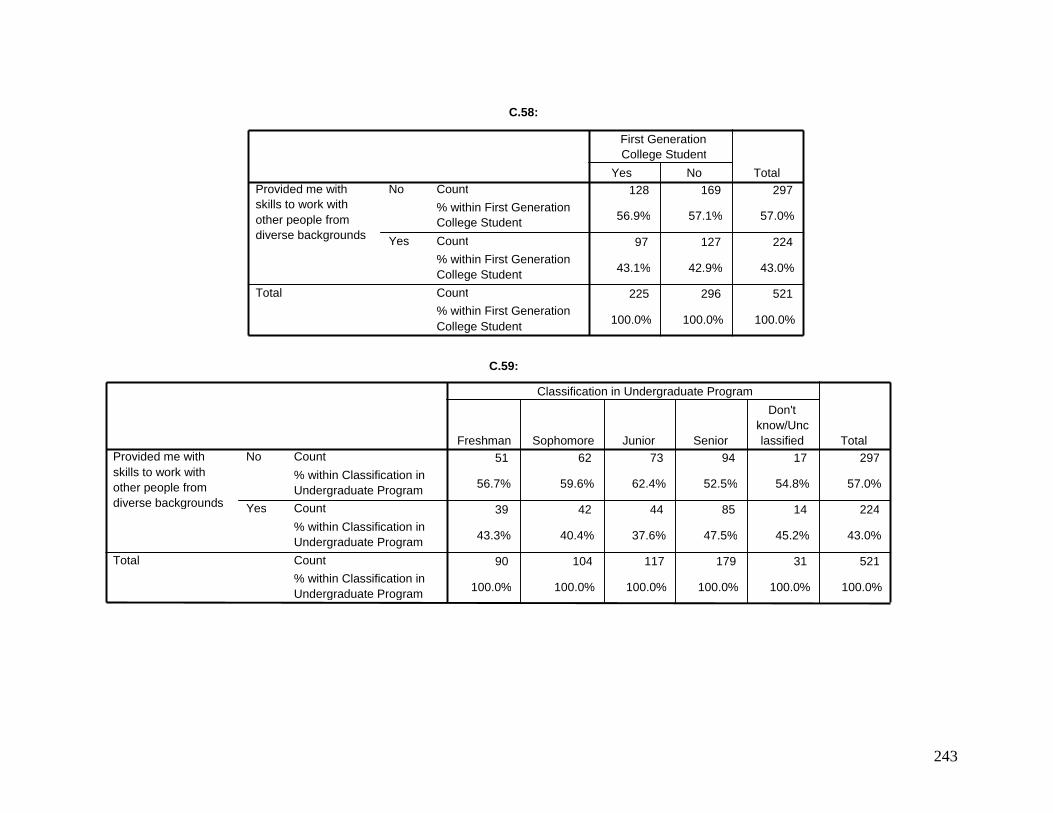
243
C.58:
128 169 297
56.9% 57.1% 57.0%
97 127 224
43.1% 42.9% 43.0%
225 296 521
100.0% 100.0% 100.0%
Count
% within First Generation College Student
Count
% within First Generation College Student
Count % within First Generation College Student
No
Yes
Provided me with skills to work with other people from diverse backgrounds
Total
Yes No
First Generation College Student
Total
C.59:
51 62 73 94 17 297
56.7% 59.6% 62.4% 52.5% 54.8% 57.0%
39 42 44 85 14 224
43.3% 40.4% 37.6% 47.5% 45.2% 43.0%
90 104 117 179 31 521
100.0% 100.0% 100.0% 100.0% 100.0% 100.0%
Count
% within Classification in Undergraduate Program Count
% within Classification in Undergraduate Program
Count
% within Classification in Undergraduate Program
No
Yes
Provided me with skills to work with other people from diverse backgrounds
Total
Freshman Sophomore Junior Senior
Don't know/Unc lassified
Classification in Undergraduate Program
Total
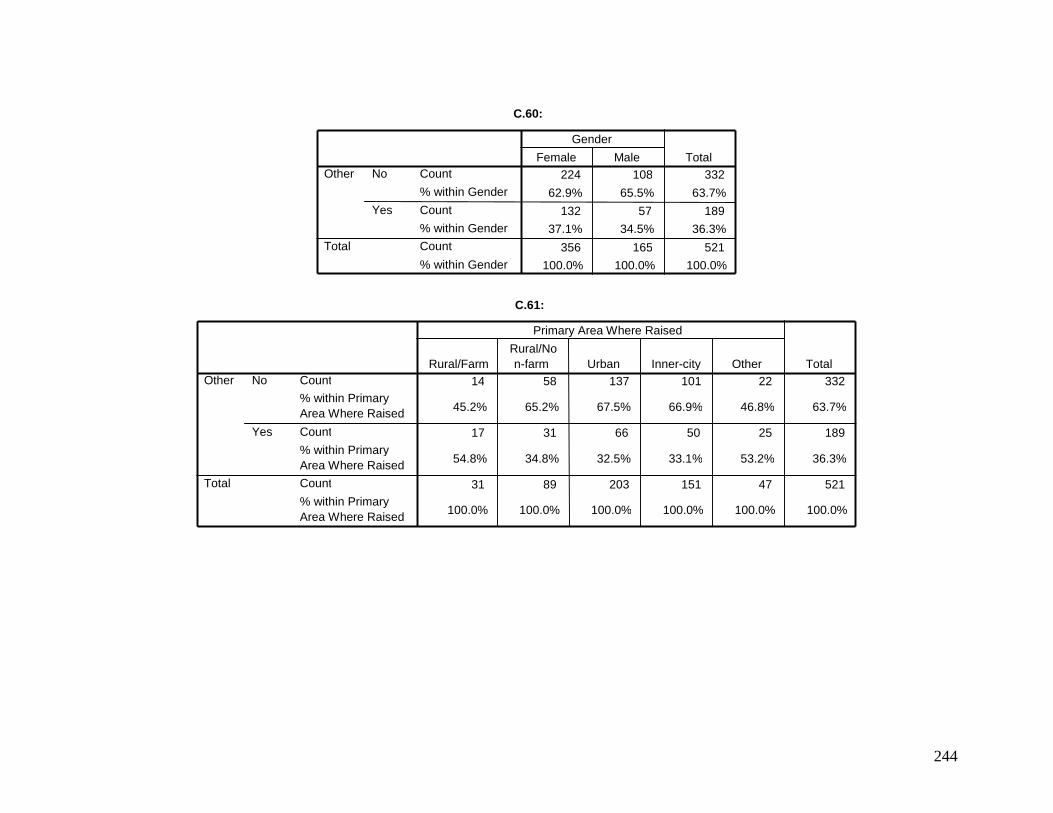
244
C.60:
224 108 332
62.9% 65.5% 63.7%
132 57 189 37.1% 34.5% 36.3%
356 165 521 100.0% 100.0% 100.0%
Count
% within Gender
Count
% within Gender Count
% within Gender
No
Yes
Other
Total
Female Male
Gender
Total
C.61:
14 58 137 101 22 332
45.2% 65.2% 67.5% 66.9% 46.8% 63.7%
17 31 66 50 25 189
54.8% 34.8% 32.5% 33.1% 53.2% 36.3%
31 89 203 151 47 521
100.0% 100.0% 100.0% 100.0% 100.0% 100.0%
Count % within Primary Area Where Raised
Count
% within Primary Area Where Raised Count
% within Primary Area Where Raised
No
Yes
Other
Total
Rural/Farm Rural/No n-farm Urban Inner-city Other
Primary Area Where Raised
Total
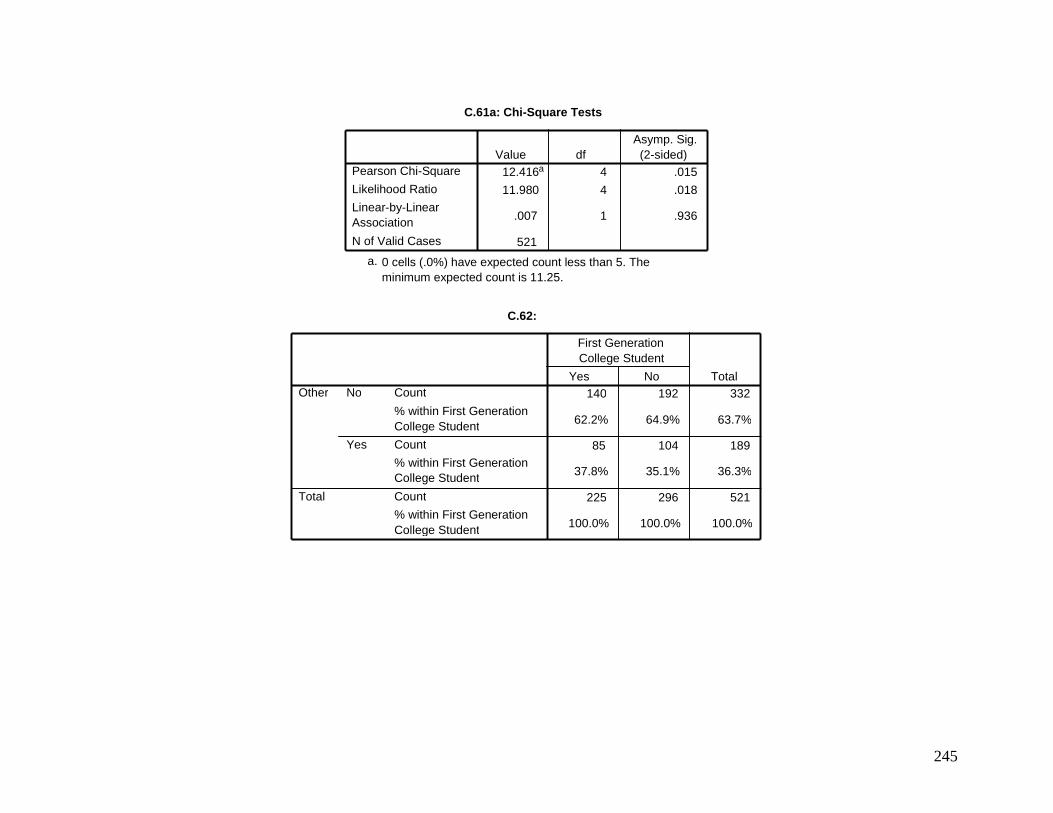
245
C.61a: Chi-Square Tests
12.416 a 4 .015 11.980 4 .018
.007 1 .936
521
Pearson Chi-Square
Likelihood Ratio
Linear-by-Linear Association
N of Valid Cases
Value df Asymp. Sig. (2-sided)
0 cells (.0%) have expected count less than 5. The minimum expected count is 11.25.
a.
C.62:
140 192 332
62.2% 64.9% 63.7%
85 104 189
37.8% 35.1% 36.3%
225 296 521
100.0% 100.0% 100.0%
Count
% within First Generation College Student
Count
% within First Generation College Student
Count
% within First Generation College Student
No
Yes
Other
Total
Yes No
First Generation College Student
Total
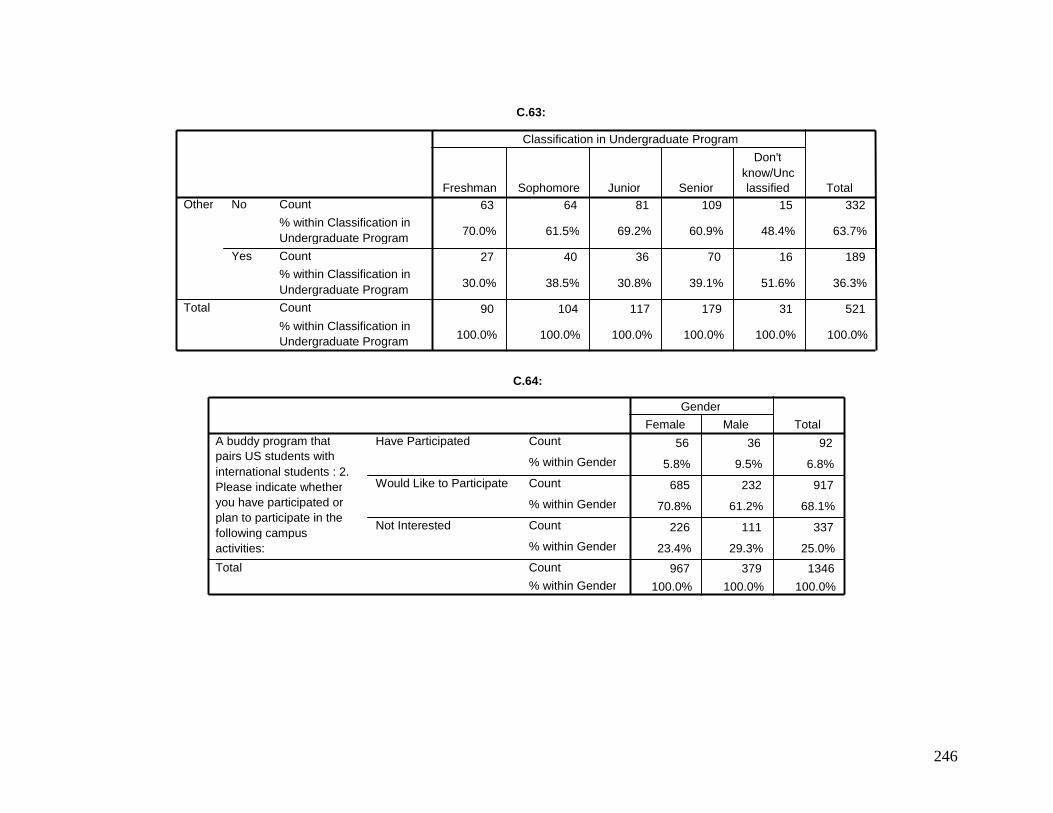
246
C.63:
63 64 81 109 15 332
70.0% 61.5% 69.2% 60.9% 48.4% 63.7%
27 40 36 70 16 189
30.0% 38.5% 30.8% 39.1% 51.6% 36.3%
90 104 117 179 31 521
100.0% 100.0% 100.0% 100.0% 100.0% 100.0%
Count
% within Classification in Undergraduate Program Count % within Classification in Undergraduate Program Count
% within Classification in Undergraduate Program
No
Yes
Other
Total
Freshman Sophomore Junior Senior
Don't know/Unc lassified
Classification in Undergraduate Program
Total
C.64:
56 36 92
5.8% 9.5% 6.8%
685 232 917
70.8% 61.2% 68.1%
226 111 337
23.4% 29.3% 25.0%
967 379 1346
100.0% 100.0% 100.0%
Count
% within Gender
Count
% within Gender
Count
% within Gender
Count
% within Gender
Have Participated
Would Like to Participate
Not Interested
A buddy program that pairs US students with international students : 2. Please indicate whether you have participated or plan to participate in the following campus activities:
Total
Female Male Gender
Total
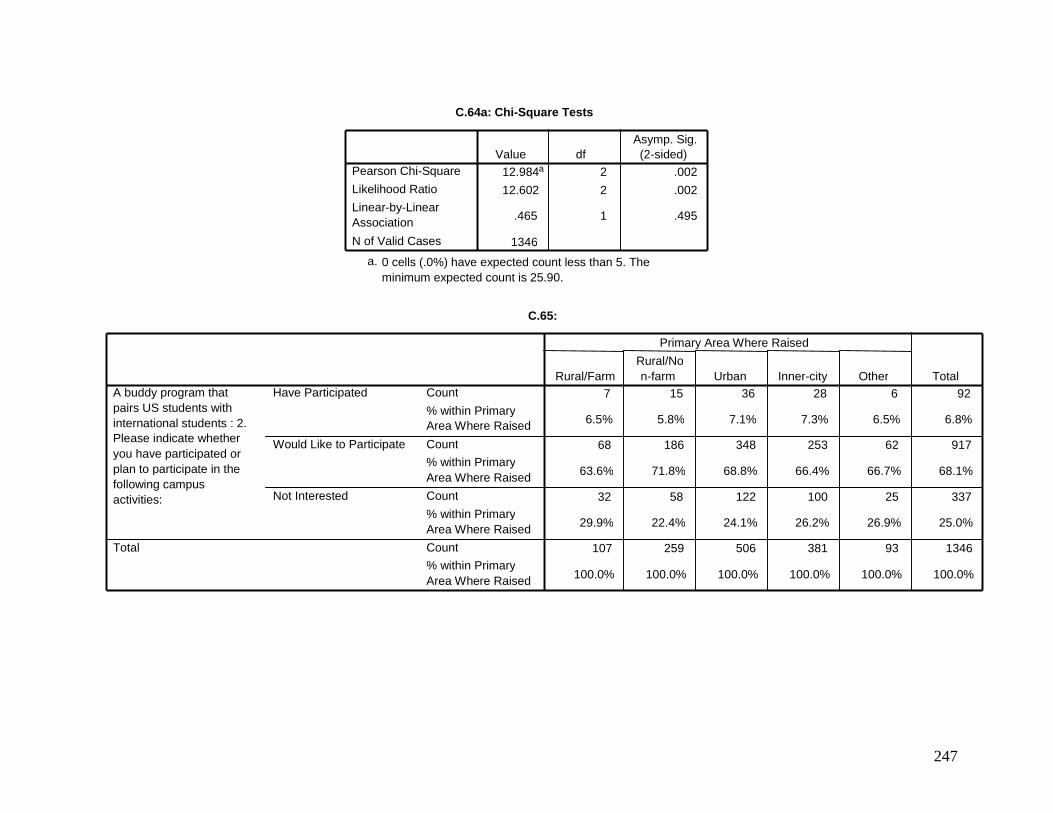
247
C.64a: Chi-Square Tests
12.984 a 2 .002
12.602 2 .002
.465 1 .495
1346
Pearson Chi-Square
Likelihood Ratio
Linear-by-Linear Association
N of Valid Cases
Value df Asymp. Sig. (2-sided)
0 cells (.0%) have expected count less than 5. The minimum expected count is 25.90.
a.
C.65:
7 15 36 28 6 92
6.5% 5.8% 7.1% 7.3% 6.5% 6.8%
68 186 348 253 62 917
63.6% 71.8% 68.8% 66.4% 66.7% 68.1%
32 58 122 100 25 337
29.9% 22.4% 24.1% 26.2% 26.9% 25.0%
107 259 506 381 93 1346
100.0% 100.0% 100.0% 100.0% 100.0% 100.0%
Count
% within Primary Area Where Raised
Count % within Primary Area Where Raised
Count
% within Primary Area Where Raised
Count % within Primary Area Where Raised
Have Participated
Would Like to Participate
Not Interested
A buddy program that pairs US students with international students : 2. Please indicate whether you have participated or plan to participate in the following campus activities:
Total
Rural/Farm Rural/No n-farm Urban Inner-city Other
Primary Area Where Raised
Total
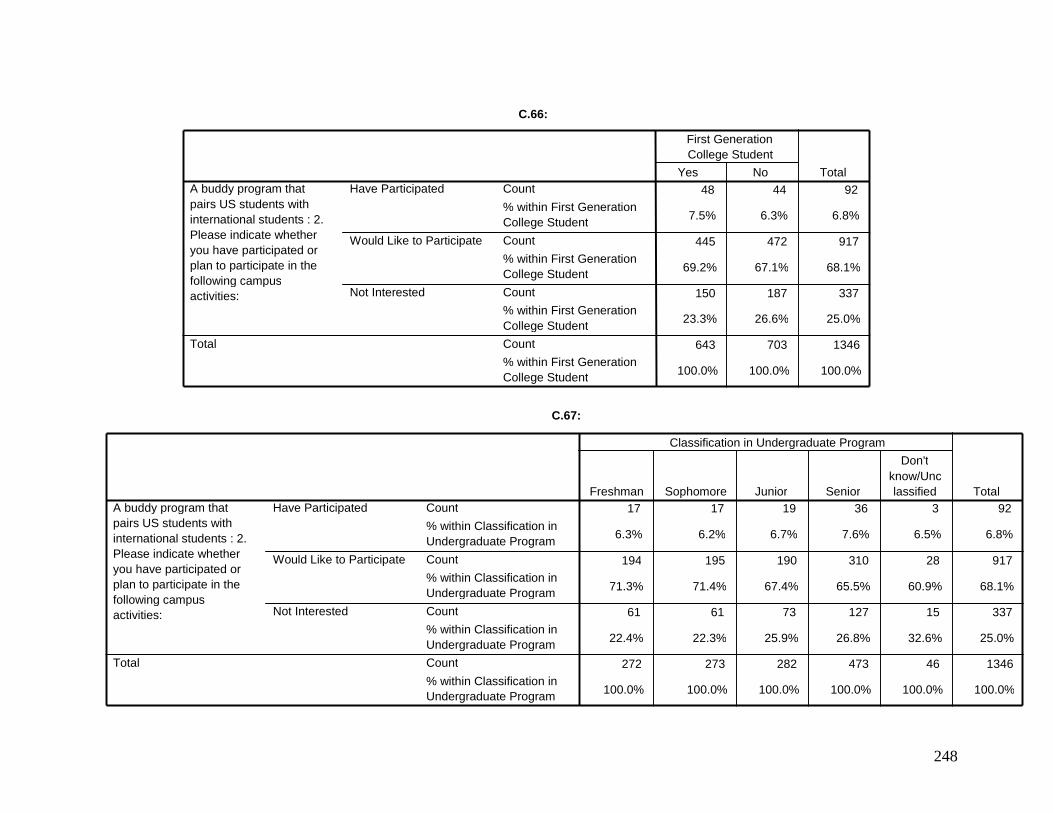
248
C.66:
48 44 92
7.5% 6.3% 6.8%
445 472 917
69.2% 67.1% 68.1%
150 187 337
23.3% 26.6% 25.0%
643 703 1346
100.0% 100.0% 100.0%
Count
% within First Generation College Student
Count
% within First Generation College Student
Count % within First Generation College Student Count
% within First Generation College Student
Have Participated
Would Like to Participate
Not Interested
A buddy program that pairs US students with international students : 2. Please indicate whether you have participated or plan to participate in the following campus activities:
Total
Yes No
First Generation College Student
Total
C.67:
17 17 19 36 3 92
6.3% 6.2% 6.7% 7.6% 6.5% 6.8%
194 195 190 310 28 917
71.3% 71.4% 67.4% 65.5% 60.9% 68.1%
61 61 73 127 15 337
22.4% 22.3% 25.9% 26.8% 32.6% 25.0%
272 273 282 473 46 1346
100.0% 100.0% 100.0% 100.0% 100.0% 100.0%
Count
% within Classification in Undergraduate Program
Count
% within Classification in Undergraduate Program
Count
% within Classification in Undergraduate Program Count
% within Classification in Undergraduate Program
Have Participated
Would Like to Participate
Not Interested
A buddy program that pairs US students with international students : 2. Please indicate whether you have participated or plan to participate in the following campus activities:
Total
Freshman Sophomore Junior Senior
Don't know/Unc lassified
Classification in Undergraduate Program
Total
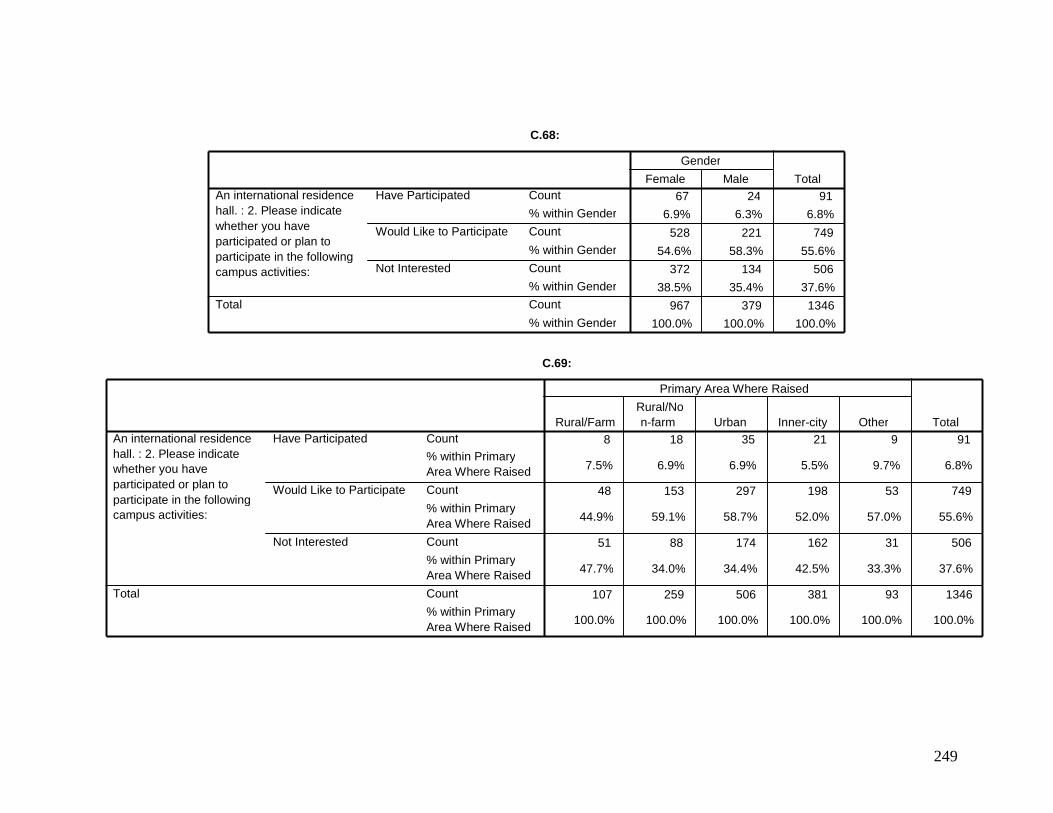
249
C.68:
67 24 91 6.9% 6.3% 6.8%
528 221 749
54.6% 58.3% 55.6%
372 134 506
38.5% 35.4% 37.6%
967 379 1346 100.0% 100.0% 100.0%
Count
% within Gender Count
% within Gender
Count
% within Gender Count
% within Gender
Have Participated
Would Like to Participate
Not Interested
An international residence hall. : 2. Please indicate whether you have participated or plan to participate in the following campus activities:
Total
Female Male
Gender
Total
C.69:
8 18 35 21 9 91
7.5% 6.9% 6.9% 5.5% 9.7% 6.8%
48 153 297 198 53 749
44.9% 59.1% 58.7% 52.0% 57.0% 55.6%
51 88 174 162 31 506
47.7% 34.0% 34.4% 42.5% 33.3% 37.6%
107 259 506 381 93 1346
100.0% 100.0% 100.0% 100.0% 100.0% 100.0%
Count % within Primary Area Where Raised
Count
% within Primary Area Where Raised
Count
% within Primary Area Where Raised
Count
% within Primary Area Where Raised
Have Participated
Would Like to Participate
Not Interested
An international residence hall. : 2. Please indicate whether you have participated or plan to participate in the following campus activities:
Total
Rural/Farm Rural/No n-farm Urban Inner-city Other
Primary Area Where Raised
Total
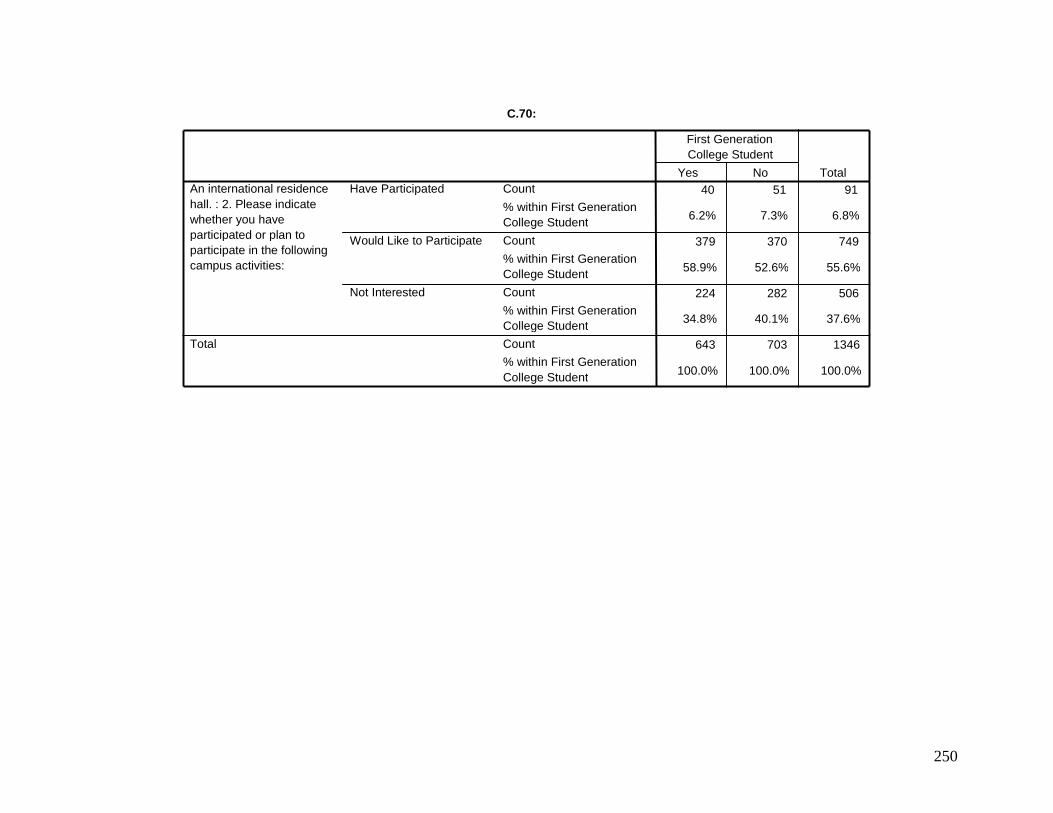
250
C.70:
40 51 91
6.2% 7.3% 6.8%
379 370 749
58.9% 52.6% 55.6%
224 282 506
34.8% 40.1% 37.6%
643 703 1346
100.0% 100.0% 100.0%
Count
% within First Generation College Student
Count
% within First Generation College Student
Count
% within First Generation College Student Count % within First Generation College Student
Have Participated
Would Like to Participate
Not Interested
An international residence hall. : 2. Please indicate whether you have participated or plan to participate in the following campus activities:
Total
Yes No
First Generation College Student
Total
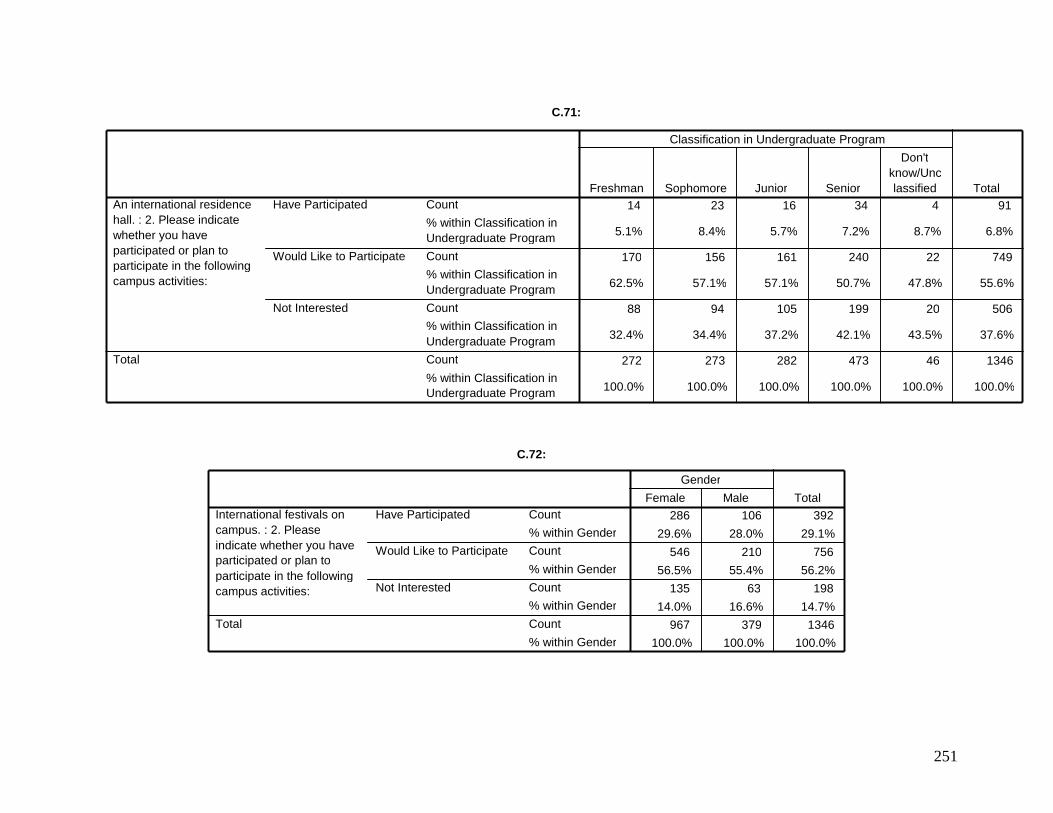
251
C.71:
14 23 16 34 4 91
5.1% 8.4% 5.7% 7.2% 8.7% 6.8%
170 156 161 240 22 749
62.5% 57.1% 57.1% 50.7% 47.8% 55.6%
88 94 105 199 20 506
32.4% 34.4% 37.2% 42.1% 43.5% 37.6%
272 273 282 473 46 1346
100.0% 100.0% 100.0% 100.0% 100.0% 100.0%
Count
% within Classification in Undergraduate Program
Count
% within Classification in Undergraduate Program
Count % within Classification in Undergraduate Program Count
% within Classification in Undergraduate Program
Have Participated
Would Like to Participate
Not Interested
An international residence hall. : 2. Please indicate whether you have participated or plan to participate in the following campus activities:
Total
Freshman Sophomore Junior Senior
Don't know/Unc lassified
Classification in Undergraduate Program
Total
C.72:
286 106 392
29.6% 28.0% 29.1%
546 210 756
56.5% 55.4% 56.2%
135 63 198
14.0% 16.6% 14.7%
967 379 1346 100.0% 100.0% 100.0%
Count
% within Gender Count
% within Gender
Count
% within Gender
Count
% within Gender
Have Participated
Would Like to Participate
Not Interested
International festivals on campus. : 2. Please indicate whether you have participated or plan to participate in the following campus activities:
Total
Female Male
Gender
Total
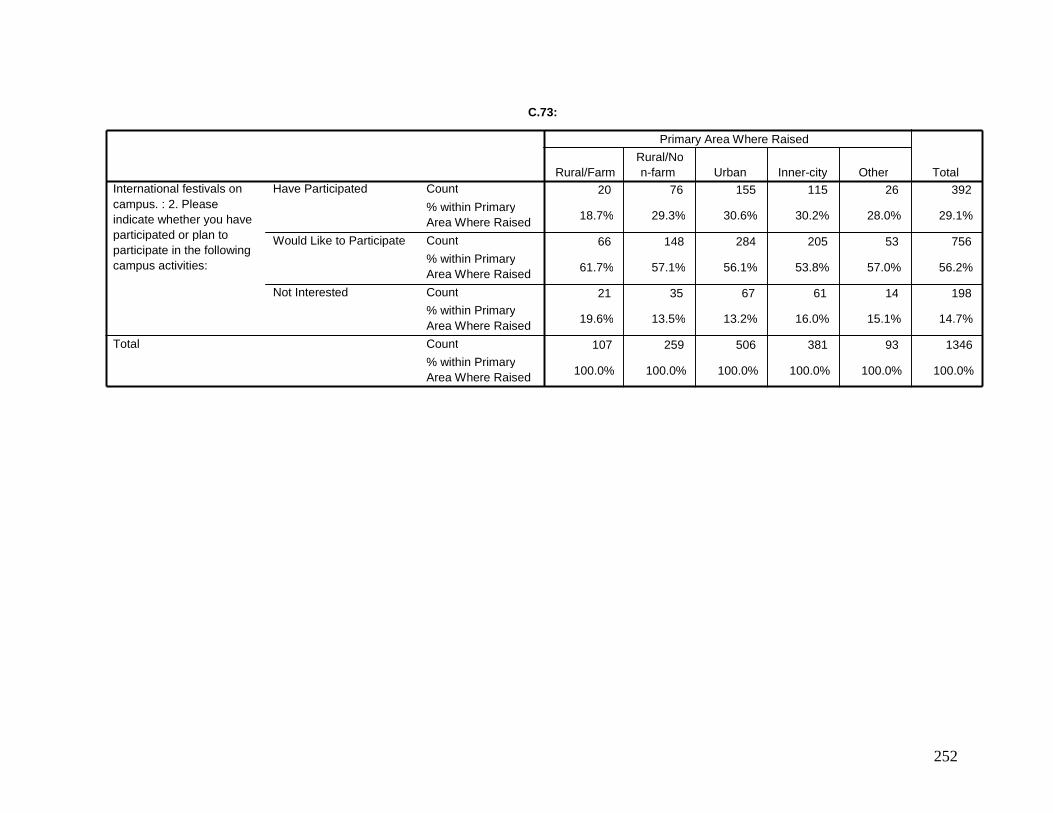
252
C.73:
20 76 155 115 26 392
18.7% 29.3% 30.6% 30.2% 28.0% 29.1%
66 148 284 205 53 756
61.7% 57.1% 56.1% 53.8% 57.0% 56.2%
21 35 67 61 14 198
19.6% 13.5% 13.2% 16.0% 15.1% 14.7%
107 259 506 381 93 1346
100.0% 100.0% 100.0% 100.0% 100.0% 100.0%
Count
% within Primary Area Where Raised
Count
% within Primary Area Where Raised
Count % within Primary Area Where Raised Count
% within Primary Area Where Raised
Have Participated
Would Like to Participate
Not Interested
International festivals on campus. : 2. Please indicate whether you have participated or plan to participate in the following campus activities:
Total
Rural/Farm Rural/No n-farm Urban Inner-city Other
Primary Area Where Raised
Total
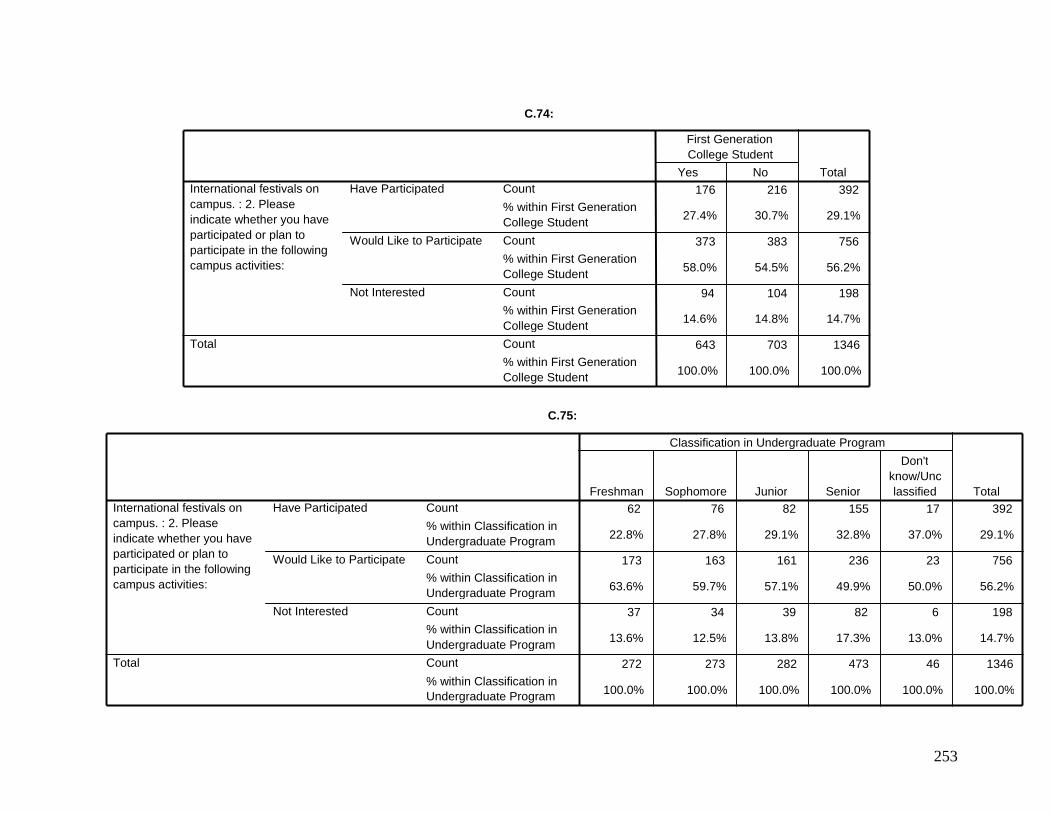
253
C.74:
176 216 392
27.4% 30.7% 29.1%
373 383 756
58.0% 54.5% 56.2%
94 104 198
14.6% 14.8% 14.7%
643 703 1346
100.0% 100.0% 100.0%
Count
% within First Generation College Student
Count
% within First Generation College Student
Count % within First Generation College Student Count
% within First Generation College Student
Have Participated
Would Like to Participate
Not Interested
International festivals on campus. : 2. Please indicate whether you have participated or plan to participate in the following campus activities:
Total
Yes No
First Generation College Student
Total
C.75:
62 76 82 155 17 392
22.8% 27.8% 29.1% 32.8% 37.0% 29.1%
173 163 161 236 23 756
63.6% 59.7% 57.1% 49.9% 50.0% 56.2%
37 34 39 82 6 198
13.6% 12.5% 13.8% 17.3% 13.0% 14.7%
272 273 282 473 46 1346
100.0% 100.0% 100.0% 100.0% 100.0% 100.0%
Count
% within Classification in Undergraduate Program
Count
% within Classification in Undergraduate Program
Count % within Classification in Undergraduate Program Count
% within Classification in Undergraduate Program
Have Participated
Would Like to Participate
Not Interested
International festivals on campus. : 2. Please indicate whether you have participated or plan to participate in the following campus activities:
Total
Freshman Sophomore Junior Senior
Don't know/Unc lassified
Classification in Undergraduate Program
Total
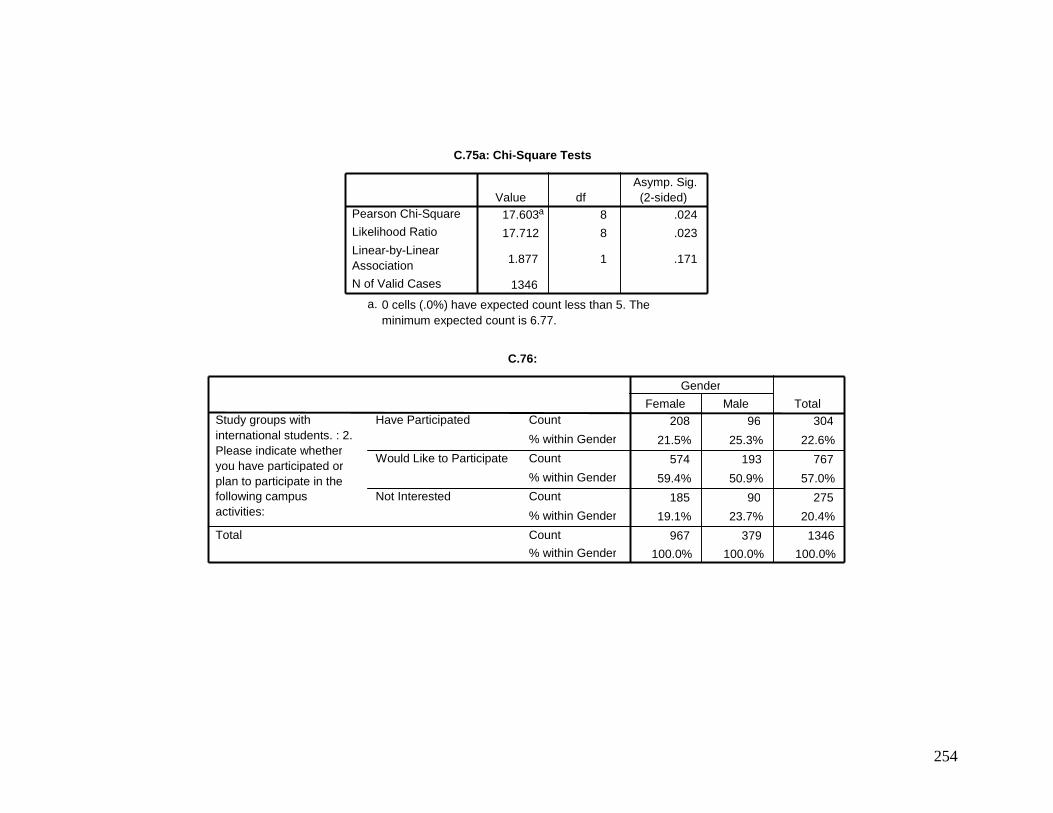
254
C.75a: Chi-Square Tests
17.603 a 8 .024
17.712 8 .023
1.877 1 .171
1346
Pearson Chi-Square Likelihood Ratio
Linear-by-Linear Association N of Valid Cases
Value df Asymp. Sig. (2-sided)
0 cells (.0%) have expected count less than 5. The minimum expected count is 6.77.
a.
C.76:
208 96 304
21.5% 25.3% 22.6%
574 193 767
59.4% 50.9% 57.0%
185 90 275
19.1% 23.7% 20.4%
967 379 1346
100.0% 100.0% 100.0%
Count
% within Gender
Count
% within Gender
Count
% within Gender
Count % within Gender
Have Participated
Would Like to Participate
Not Interested
Study groups with international students. : 2. Please indicate whether you have participated or plan to participate in the following campus activities:
Total
Female Male Gender
Total
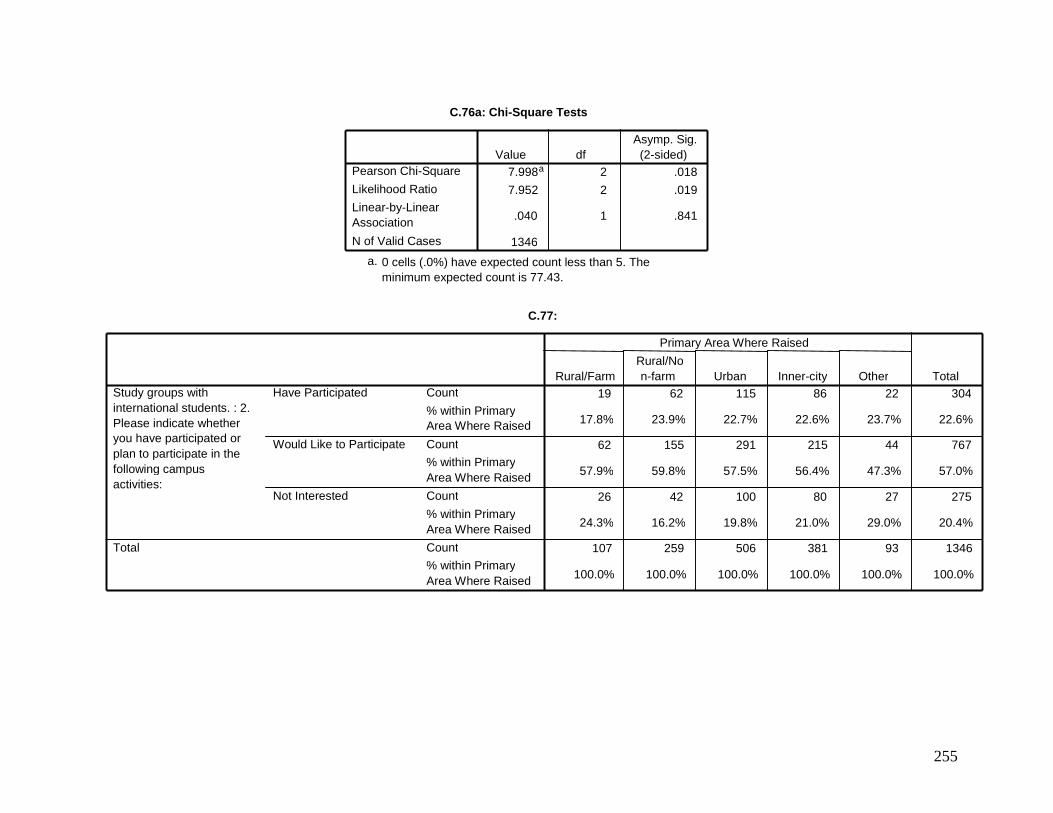
255
C.76a: Chi-Square Tests
7.998 a 2 .018 7.952 2 .019
.040 1 .841
1346
Pearson Chi-Square
Likelihood Ratio
Linear-by-Linear Association
N of Valid Cases
Value df Asymp. Sig. (2-sided)
0 cells (.0%) have expected count less than 5. The minimum expected count is 77.43.
a.
C.77:
19 62 115 86 22 304
17.8% 23.9% 22.7% 22.6% 23.7% 22.6%
62 155 291 215 44 767
57.9% 59.8% 57.5% 56.4% 47.3% 57.0%
26 42 100 80 27 275
24.3% 16.2% 19.8% 21.0% 29.0% 20.4%
107 259 506 381 93 1346
100.0% 100.0% 100.0% 100.0% 100.0% 100.0%
Count
% within Primary Area Where Raised
Count % within Primary Area Where Raised
Count
% within Primary Area Where Raised
Count % within Primary Area Where Raised
Have Participated
Would Like to Participate
Not Interested
Study groups with international students. : 2. Please indicate whether you have participated or plan to participate in the following campus activities:
Total
Rural/Farm Rural/No n-farm Urban Inner-city Other
Primary Area Where Raised
Total

256
C.78:
136 168 304
21.2% 23.9% 22.6%
374 393 767
58.2% 55.9% 57.0%
133 142 275
20.7% 20.2% 20.4%
643 703 1346
100.0% 100.0% 100.0%
Count
% within First Generation College Student
Count
% within First Generation College Student
Count % within First Generation College Student Count
% within First Generation College Student
Have Participated
Would Like to Participate
Not Interested
Study groups with international students. : 2. Please indicate whether you have participated or plan to participate in the following campus activities:
Total
Yes No
First Generation College Student
Total
C.79:
42 54 67 125 16 304
15.4% 19.8% 23.8% 26.4% 34.8% 22.6%
169 165 164 250 19 767
62.1% 60.4% 58.2% 52.9% 41.3% 57.0%
61 54 51 98 11 275
22.4% 19.8% 18.1% 20.7% 23.9% 20.4%
272 273 282 473 46 1346
100.0% 100.0% 100.0% 100.0% 100.0% 100.0%
Count
% within Classification in Undergraduate Program
Count
% within Classification in Undergraduate Program
Count
% within Classification in Undergraduate Program Count
% within Classification in Undergraduate Program
Have Participated
Would Like to Participate
Not Interested
Study groups with international students. : 2. Please indicate whether you have participated or plan to participate in the following campus activities:
Total
Freshman Sophomore Junior Senior
Don't know/Unc lassified
Classification in Undergraduate Program
Total
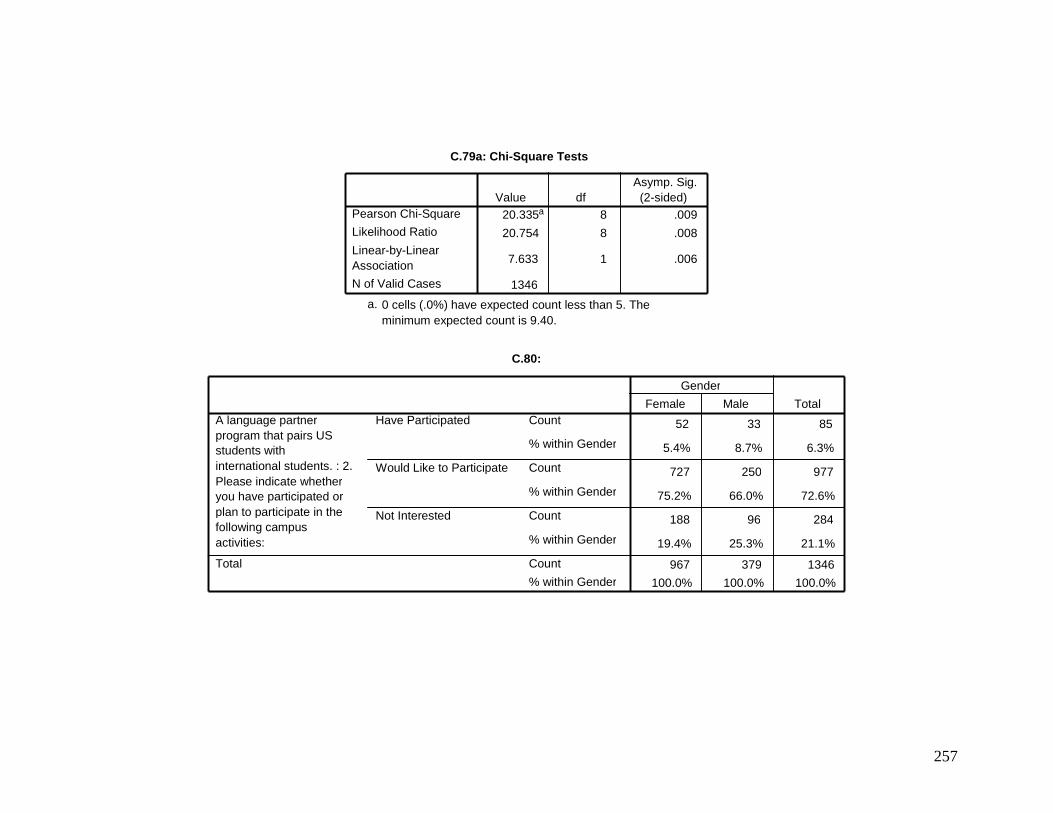
257
C.79a: Chi-Square Tests
20.335 a 8 .009
20.754 8 .008
7.633 1 .006
1346
Pearson Chi-Square Likelihood Ratio
Linear-by-Linear Association N of Valid Cases
Value df Asymp. Sig. (2-sided)
0 cells (.0%) have expected count less than 5. The minimum expected count is 9.40.
a.
C.80:
52 33 85
5.4% 8.7% 6.3%
727 250 977
75.2% 66.0% 72.6%
188 96 284
19.4% 25.3% 21.1%
967 379 1346
100.0% 100.0% 100.0%
Count
% within Gender
Count
% within Gender
Count
% within Gender
Count
% within Gender
Have Participated
Would Like to Participate
Not Interested
A language partner program that pairs US students with international students. : 2. Please indicate whether you have participated or plan to participate in the following campus activities:
Total
Female Male
Gender
Total
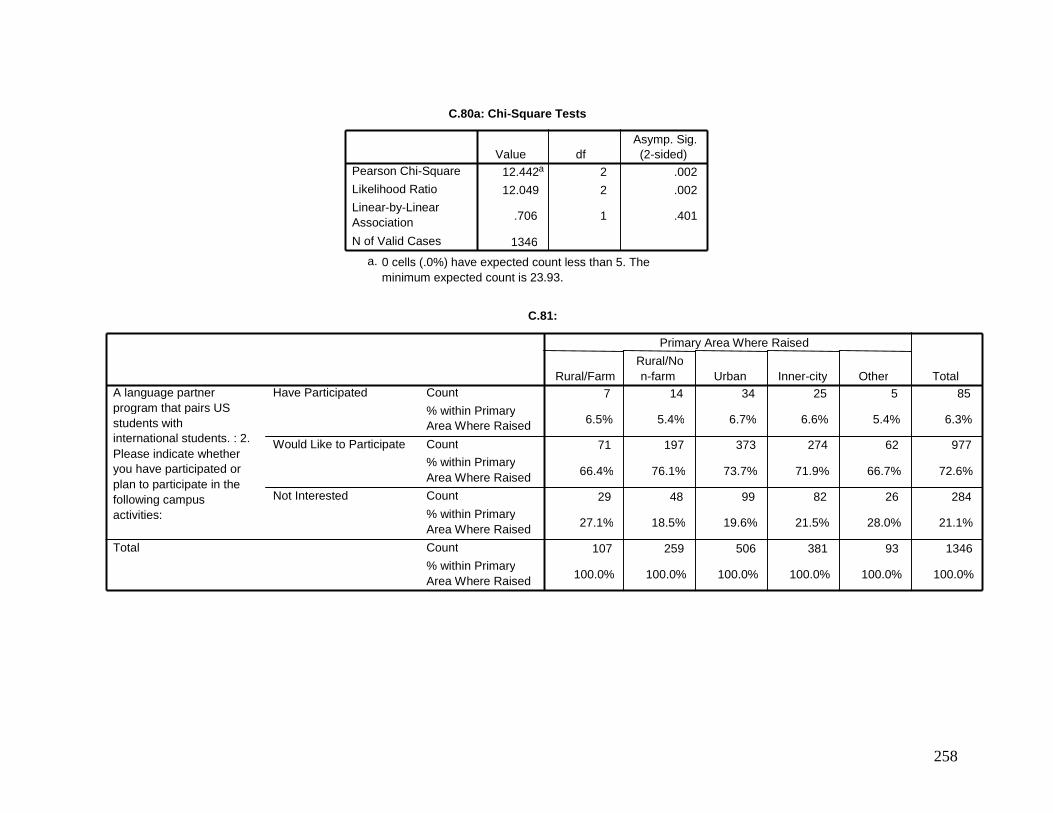
258
C.80a: Chi-Square Tests
12.442 a 2 .002
12.049 2 .002
.706 1 .401
1346
Pearson Chi-Square
Likelihood Ratio
Linear-by-Linear Association
N of Valid Cases
Value df Asymp. Sig. (2-sided)
0 cells (.0%) have expected count less than 5. The minimum expected count is 23.93.
a.
C.81:
7 14 34 25 5 85
6.5% 5.4% 6.7% 6.6% 5.4% 6.3%
71 197 373 274 62 977
66.4% 76.1% 73.7% 71.9% 66.7% 72.6%
29 48 99 82 26 284
27.1% 18.5% 19.6% 21.5% 28.0% 21.1%
107 259 506 381 93 1346
100.0% 100.0% 100.0% 100.0% 100.0% 100.0%
Count
% within Primary Area Where Raised
Count % within Primary Area Where Raised Count
% within Primary Area Where Raised
Count
% within Primary Area Where Raised
Have Participated
Would Like to Participate
Not Interested
A language partner program that pairs US students with international students. : 2. Please indicate whether you have participated or plan to participate in the following campus activities:
Total
Rural/Farm Rural/No n-farm Urban Inner-city Other
Primary Area Where Raised
Total
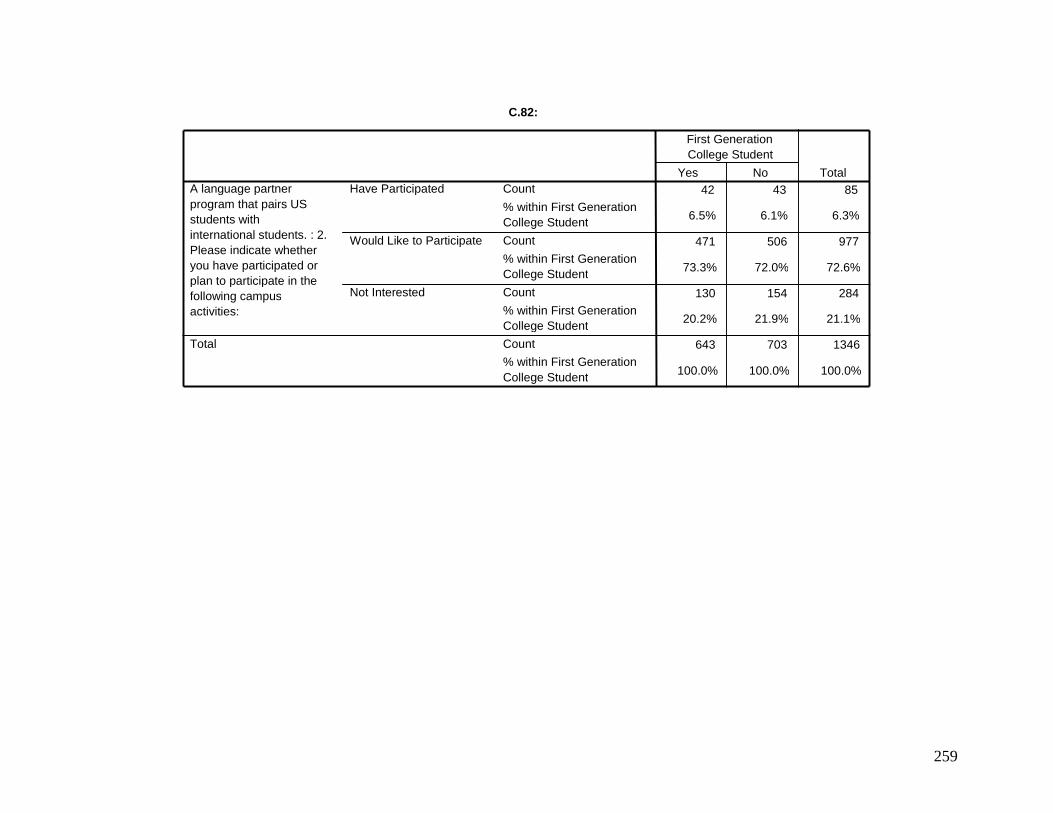
259
C.82:
42 43 85
6.5% 6.1% 6.3%
471 506 977
73.3% 72.0% 72.6%
130 154 284
20.2% 21.9% 21.1%
643 703 1346
100.0% 100.0% 100.0%
Count
% within First Generation College Student
Count
% within First Generation College Student
Count
% within First Generation College Student Count % within First Generation College Student
Have Participated
Would Like to Participate
Not Interested
A language partner program that pairs US students with international students. : 2. Please indicate whether you have participated or plan to participate in the following campus activities:
Total
Yes No
First Generation College Student
Total
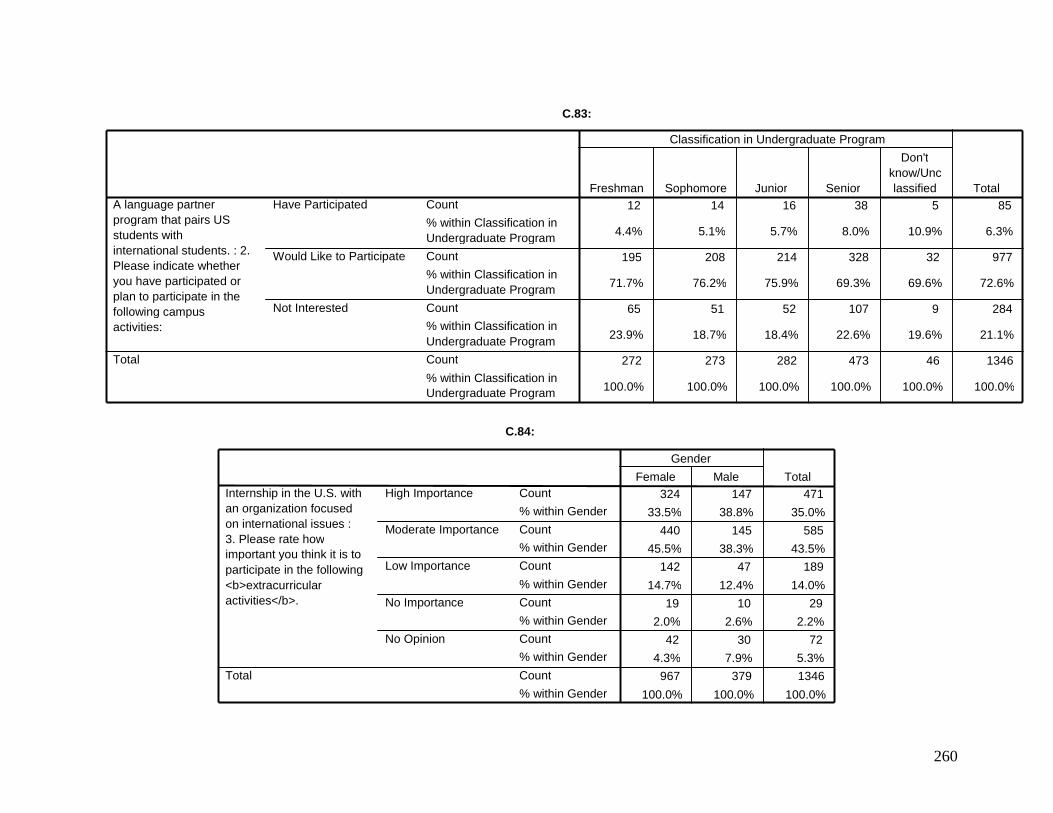
260
C.83:
12 14 16 38 5 85
4.4% 5.1% 5.7% 8.0% 10.9% 6.3%
195 208 214 328 32 977
71.7% 76.2% 75.9% 69.3% 69.6% 72.6%
65 51 52 107 9 284
23.9% 18.7% 18.4% 22.6% 19.6% 21.1%
272 273 282 473 46 1346
100.0% 100.0% 100.0% 100.0% 100.0% 100.0%
Count
% within Classification in Undergraduate Program
Count
% within Classification in Undergraduate Program
Count % within Classification in Undergraduate Program Count
% within Classification in Undergraduate Program
Have Participated
Would Like to Participate
Not Interested
A language partner program that pairs US students with international students. : 2. Please indicate whether you have participated or plan to participate in the following campus activities:
Total
Freshman Sophomore Junior Senior
Don't know/Unc lassified
Classification in Undergraduate Program
Total
C.84:
324 147 471
33.5% 38.8% 35.0%
440 145 585
45.5% 38.3% 43.5% 142 47 189
14.7% 12.4% 14.0%
19 10 29
2.0% 2.6% 2.2%
42 30 72
4.3% 7.9% 5.3% 967 379 1346
100.0% 100.0% 100.0%
Count
% within Gender
Count % within Gender
Count
% within Gender
Count
% within Gender
Count % within Gender
Count
% within Gender
High Importance
Moderate Importance
Low Importance
No Importance
No Opinion
Internship in the U.S. with an organization focused on international issues : 3. Please rate how important you think it is to participate in the following <b>extracurricular activities</b>.
Total
Female Male
Gender
Total
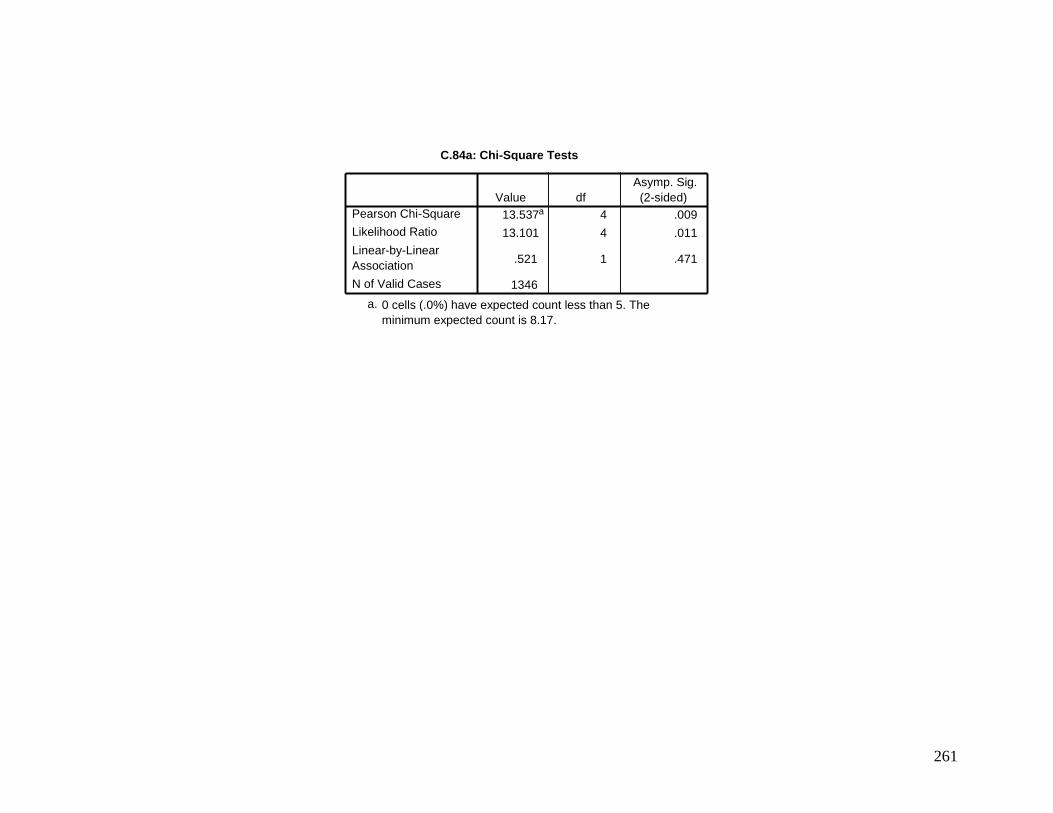
261
C.84a: Chi-Square Tests
13.537 a 4 .009
13.101 4 .011
.521 1 .471
1346
Pearson Chi-Square Likelihood Ratio
Linear-by-Linear Association
N of Valid Cases
Value df Asymp. Sig. (2-sided)
0 cells (.0%) have expected count less than 5. The minimum expected count is 8.17.
a.
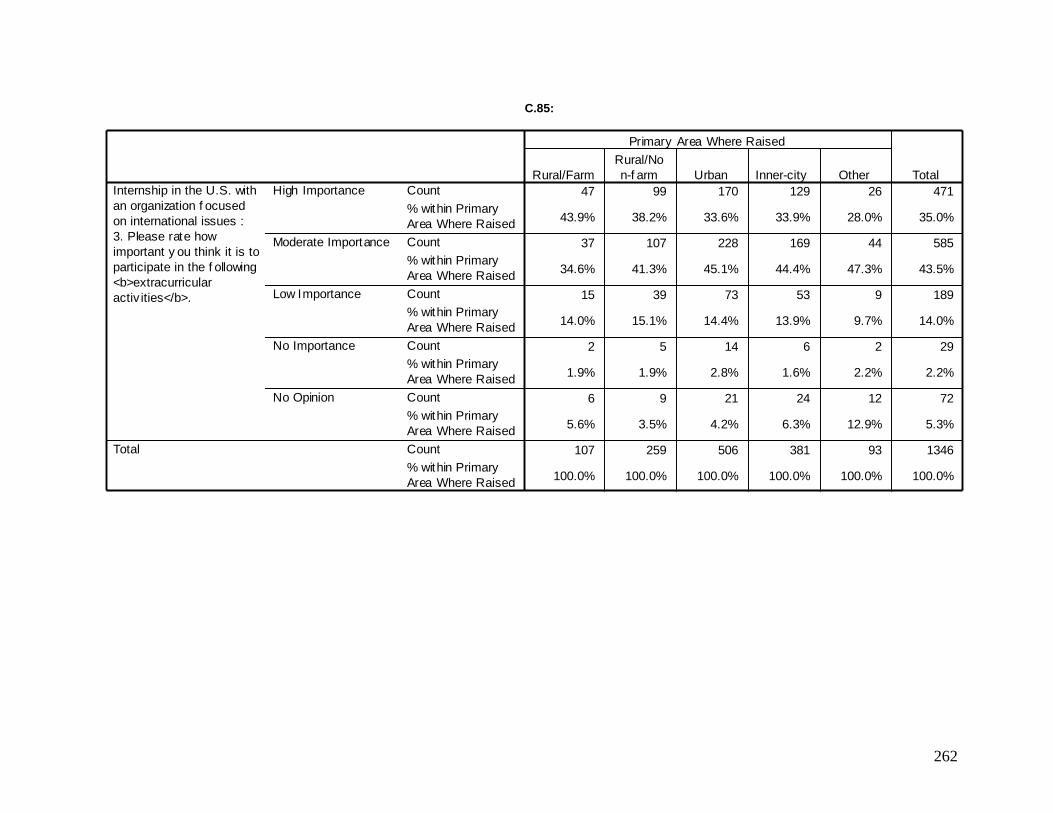
262
Crosstab
47 99 170 129 26 471
43.9% 38.2% 33.6% 33.9% 28.0% 35.0%
37 107 228 169 44 585
34.6% 41.3% 45.1% 44.4% 47.3% 43.5%
15 39 73 53 9 189
14.0% 15.1% 14.4% 13.9% 9.7% 14.0%
2 5 14 6 2 29
1.9% 1.9% 2.8% 1.6% 2.2% 2.2%
6 9 21 24 12 72
5.6% 3.5% 4.2% 6.3% 12.9% 5.3%
107 259 506 381 93 1346
100.0% 100.0% 100.0% 100.0% 100.0% 100.0%
Count
% within Primary
Area Where Raised
Count
% within Primary
Area Where Raised
Count
% within Primary
Area Where Raised
Count
% within Primary
Area Where Raised
Count
% within Primary
Area Where Raised
Count
% within Primary
Area Where Raised
High Importance
Moderate Importance
Low Importance
No Importance
No Opinion
Internship in the U.S. with
an organization f ocused
on international issues :
3. Please rate how
important y ou think it is to
participate in the f ollowing
<b>extracurricular
activ ities</b>.
Total
Rural/Farm
Rural/No
n-f arm Urban Inner-city Other
Primary Area Where Raised
Total
C.85:

263
C.86:
229 242 471
35.6% 34.4% 35.0%
283 302 585
44.0% 43.0% 43.5%
84 105 189
13.1% 14.9% 14.0%
14 15 29
2.2% 2.1% 2.2%
33 39 72
5.1% 5.5% 5.3%
643 703 1346
100.0% 100.0% 100.0%
Count
% within First Generation College Student
Count
% within First Generation College Student
Count
% within First Generation College Student
Count
% within First Generation College Student
Count
% within First Generation College Student
Count
% within First Generation College Student
High Importance
Moderate Importance
Low Importance
No Importance
No Opinion
Internship in the U.S. with an organization focused on international issues : 3. Please rate how important you think it is to participate in the following <b>extracurricular activities</b>.
Total
Yes No
First Generation College Student
Total
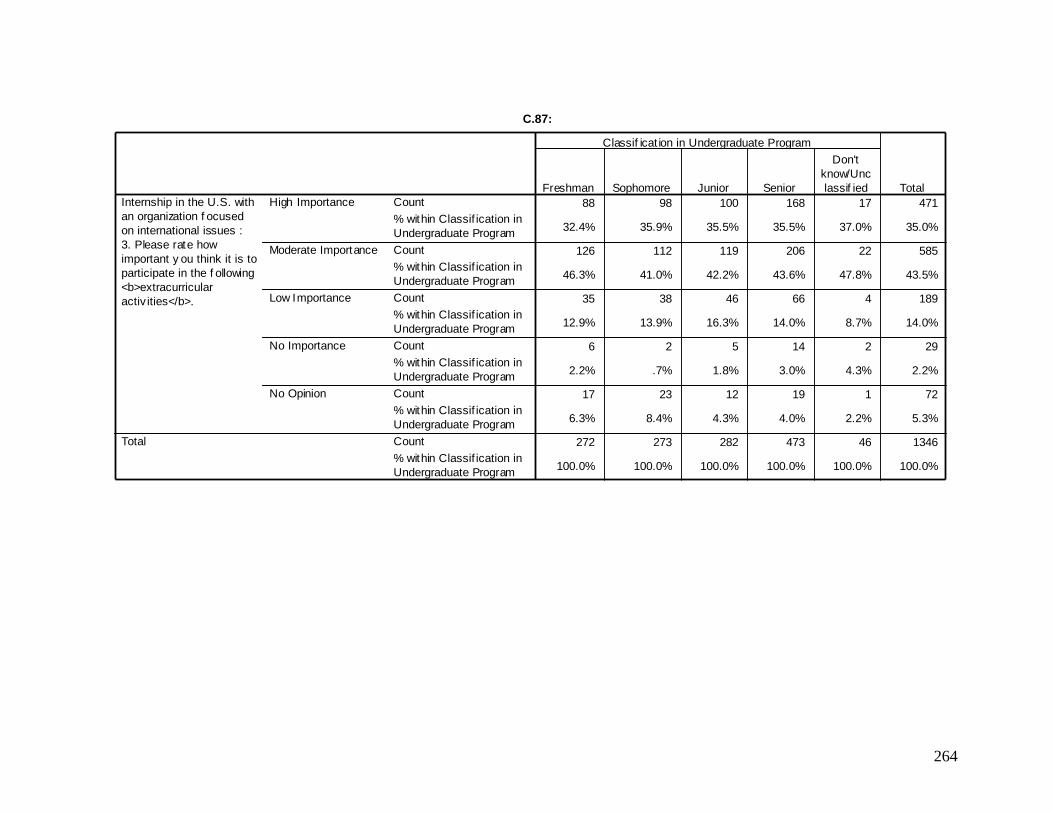
264
Crosstab
88 98 100 168 17 471
32.4% 35.9% 35.5% 35.5% 37.0% 35.0%
126 112 119 206 22 585
46.3% 41.0% 42.2% 43.6% 47.8% 43.5%
35 38 46 66 4 189
12.9% 13.9% 16.3% 14.0% 8.7% 14.0%
6 2 5 14 2 29
2.2% .7% 1.8% 3.0% 4.3% 2.2%
17 23 12 19 1 72
6.3% 8.4% 4.3% 4.0% 2.2% 5.3%
272 273 282 473 46 1346
100.0% 100.0% 100.0% 100.0% 100.0% 100.0%
Count
% within Classif ication in
Undergraduate Program
Count
% within Classif ication in
Undergraduate Program
Count
% within Classif ication in
Undergraduate Program
Count
% within Classif ication in
Undergraduate Program
Count
% within Classif ication in
Undergraduate Program
Count
% within Classif ication in
Undergraduate Program
High Importance
Moderate Importance
Low Importance
No Importance
No Opinion
Internship in the U.S. with
an organization f ocused
on international issues :
3. Please rate how
important y ou think it is to
participate in the f ollowing
<b>extracurricular
activ ities</b>.
Total
Freshman Sophomore Junior Senior
Don't
know/Unc
lassif ied
Classif icat ion in Undergraduate Program
Total
C.87:
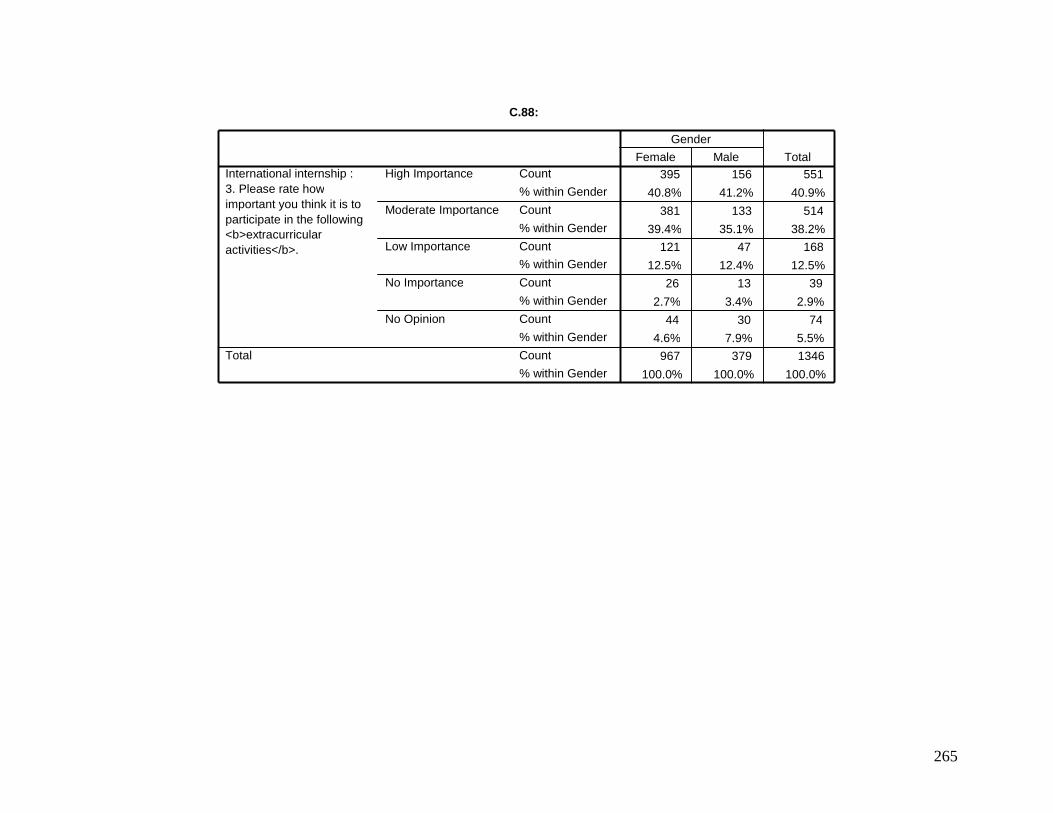
265
C.88:
395 156 551
40.8% 41.2% 40.9%
381 133 514
39.4% 35.1% 38.2% 121 47 168
12.5% 12.4% 12.5% 26 13 39
2.7% 3.4% 2.9%
44 30 74
4.6% 7.9% 5.5% 967 379 1346
100.0% 100.0% 100.0%
Count
% within Gender
Count
% within Gender
Count % within Gender
Count
% within Gender
Count
% within Gender
Count % within Gender
High Importance
Moderate Importance
Low Importance
No Importance
No Opinion
International internship : 3. Please rate how important you think it is to participate in the following <b>extracurricular activities</b>.
Total
Female Male Gender
Total
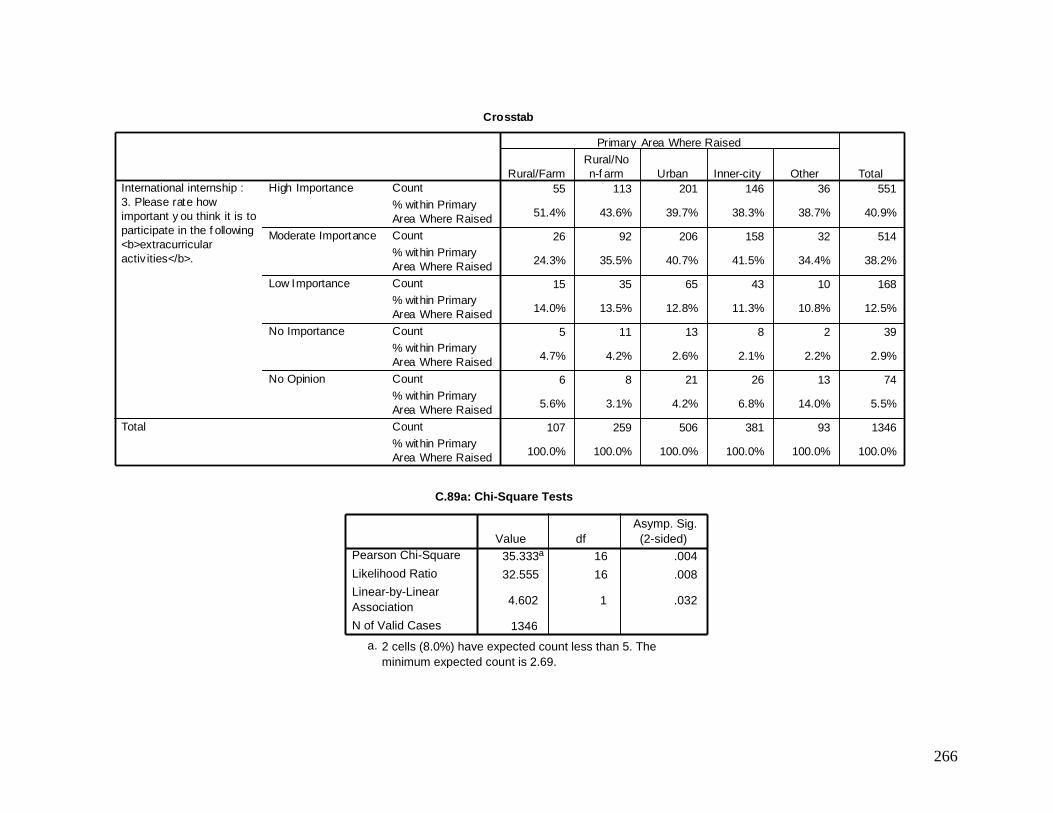
266
C.89a: Chi-Square Tests
35.333 a 16 .004
32.555 16 .008
4.602 1 .032
1346
Pearson Chi-Square
Likelihood Ratio
Linear-by-Linear Association
N of Valid Cases
Value df Asymp. Sig. (2-sided)
2 cells (8.0%) have expected count less than 5. The minimum expected count is 2.69.
a.
Crosstab
55 113 201 146 36 551
51.4% 43.6% 39.7% 38.3% 38.7% 40.9%
26 92 206 158 32 514
24.3% 35.5% 40.7% 41.5% 34.4% 38.2%
15 35 65 43 10 168
14.0% 13.5% 12.8% 11.3% 10.8% 12.5%
5 11 13 8 2 39
4.7% 4.2% 2.6% 2.1% 2.2% 2.9%
6 8 21 26 13 74
5.6% 3.1% 4.2% 6.8% 14.0% 5.5%
107 259 506 381 93 1346
100.0% 100.0% 100.0% 100.0% 100.0% 100.0%
Count
% within Primary
Area Where Raised
Count
% within Primary
Area Where Raised
Count
% within Primary
Area Where Raised
Count
% within Primary
Area Where Raised
Count
% within Primary
Area Where Raised
Count
% within Primary
Area Where Raised
High Importance
Moderate Importance
Low Importance
No Importance
No Opinion
International internship :
3. Please rate how
important y ou think it is to
participate in the f ollowing
<b>extracurricular
activ ities</b>.
Total
Rural/Farm
Rural/No
n-f arm Urban Inner-city Other
Primary Area Where Raised
Total
C.89:
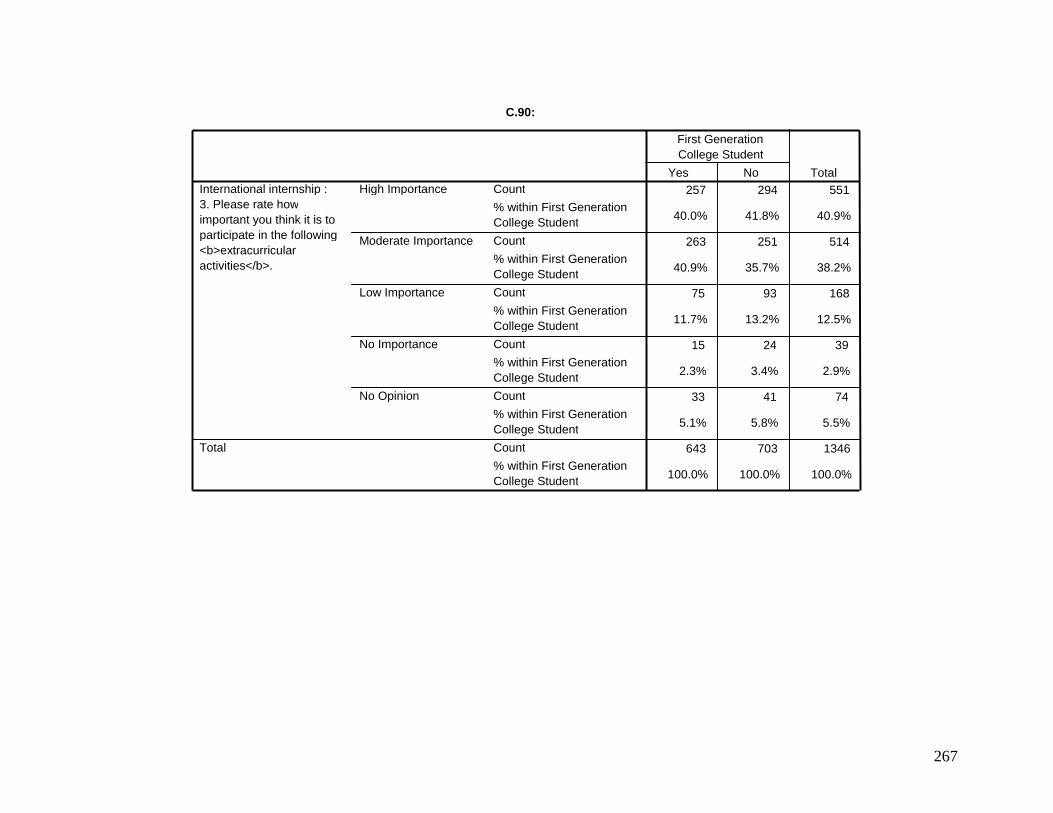
267
C.90:
257 294 551
40.0% 41.8% 40.9%
263 251 514
40.9% 35.7% 38.2%
75 93 168
11.7% 13.2% 12.5%
15 24 39
2.3% 3.4% 2.9%
33 41 74
5.1% 5.8% 5.5%
643 703 1346
100.0% 100.0% 100.0%
Count
% within First Generation College Student
Count
% within First Generation College Student
Count
% within First Generation College Student
Count
% within First Generation College Student
Count
% within First Generation College Student
Count
% within First Generation College Student
High Importance
Moderate Importance
Low Importance
No Importance
No Opinion
International internship : 3. Please rate how important you think it is to participate in the following <b>extracurricular activities</b>.
Total
Yes No
First Generation College Student
Total
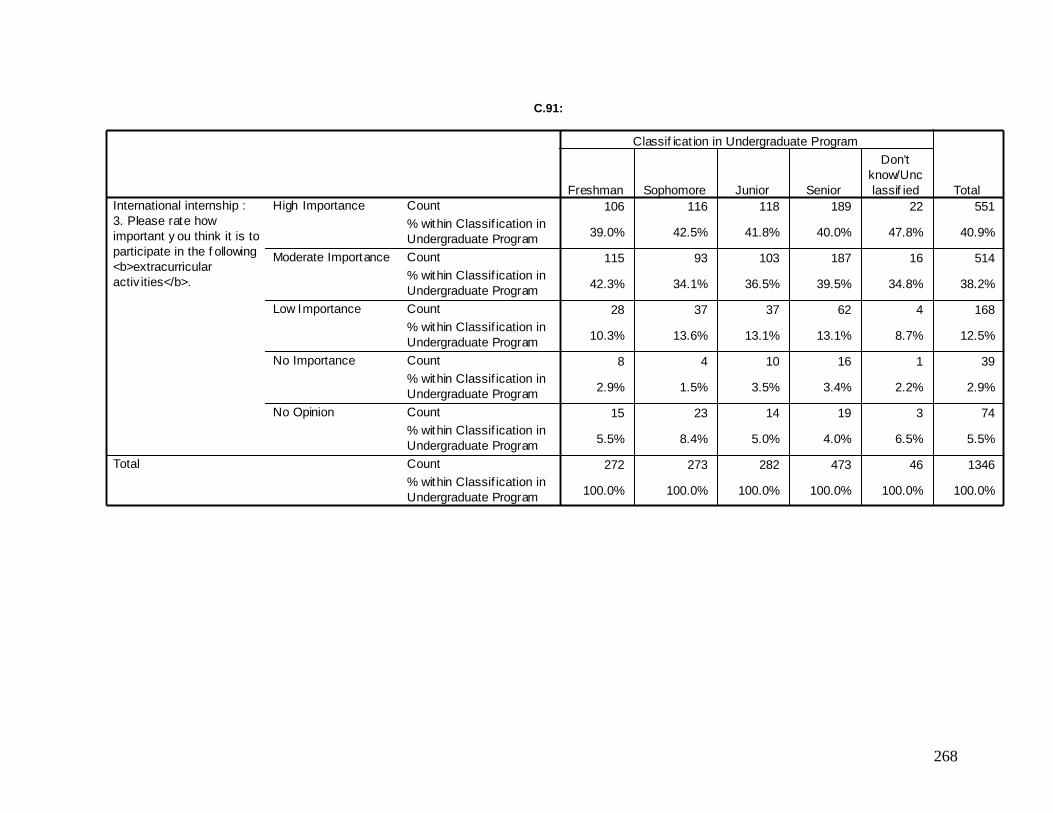
268
Crosstab
106 116 118 189 22 551
39.0% 42.5% 41.8% 40.0% 47.8% 40.9%
115 93 103 187 16 514
42.3% 34.1% 36.5% 39.5% 34.8% 38.2%
28 37 37 62 4 168
10.3% 13.6% 13.1% 13.1% 8.7% 12.5%
8 4 10 16 1 39
2.9% 1.5% 3.5% 3.4% 2.2% 2.9%
15 23 14 19 3 74
5.5% 8.4% 5.0% 4.0% 6.5% 5.5%
272 273 282 473 46 1346
100.0% 100.0% 100.0% 100.0% 100.0% 100.0%
Count
% within Classif ication in
Undergraduate Program
Count
% within Classif ication in
Undergraduate Program
Count
% within Classif ication in
Undergraduate Program
Count
% within Classif ication in
Undergraduate Program
Count
% within Classif ication in
Undergraduate Program
Count
% within Classif ication in
Undergraduate Program
High Importance
Moderate Importance
Low Importance
No Importance
No Opinion
International internship :
3. Please rate how
important y ou think it is to
participate in the f ollowing
<b>extracurricular
activ ities</b>.
Total
Freshman Sophomore Junior Senior
Don't
know/Unc
lassif ied
Classif icat ion in Undergraduate Program
Total
C.91:
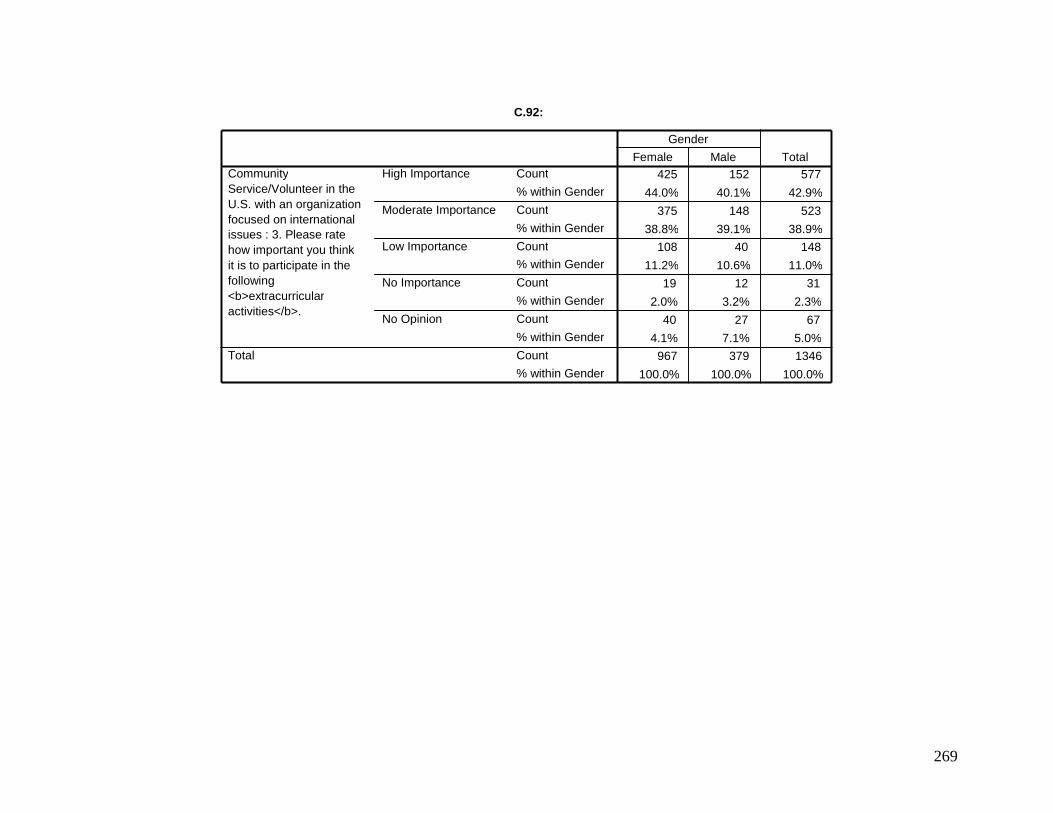
269
C.92:
425 152 577
44.0% 40.1% 42.9%
375 148 523
38.8% 39.1% 38.9% 108 40 148
11.2% 10.6% 11.0% 19 12 31
2.0% 3.2% 2.3%
40 27 67
4.1% 7.1% 5.0% 967 379 1346
100.0% 100.0% 100.0%
Count
% within Gender
Count
% within Gender
Count % within Gender
Count
% within Gender
Count
% within Gender
Count % within Gender
High Importance
Moderate Importance
Low Importance
No Importance
No Opinion
Community Service/Volunteer in the U.S. with an organization focused on international issues : 3. Please rate how important you think it is to participate in the following <b>extracurricular activities</b>.
Total
Female Male Gender
Total
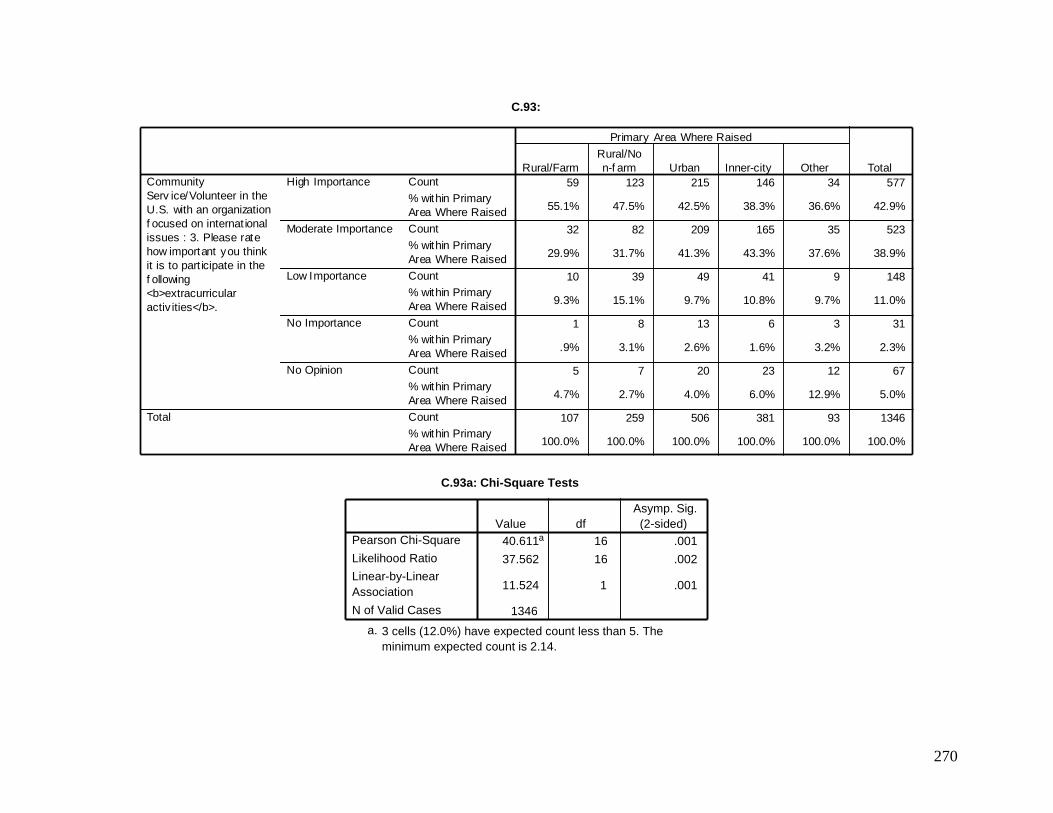
270
Crosstab
59 123 215 146 34 577
55.1% 47.5% 42.5% 38.3% 36.6% 42.9%
32 82 209 165 35 523
29.9% 31.7% 41.3% 43.3% 37.6% 38.9%
10 39 49 41 9 148
9.3% 15.1% 9.7% 10.8% 9.7% 11.0%
1 8 13 6 3 31
.9% 3.1% 2.6% 1.6% 3.2% 2.3%
5 7 20 23 12 67
4.7% 2.7% 4.0% 6.0% 12.9% 5.0%
107 259 506 381 93 1346
100.0% 100.0% 100.0% 100.0% 100.0% 100.0%
Count
% within Primary
Area Where Raised
Count
% within Primary
Area Where Raised
Count
% within Primary
Area Where Raised
Count
% within Primary
Area Where Raised
Count
% within Primary
Area Where Raised
Count
% within Primary
Area Where Raised
High Importance
Moderate Importance
Low Importance
No Importance
No Opinion
Community
Serv ice/Volunteer in the
U.S. with an organization
f ocused on internat ional
issues : 3. Please rate
how important you think
it is to part icipate in the
f ollowing
<b>extracurricular
activ ities</b>.
Total
Rural/Farm
Rural/No
n-f arm Urban Inner-city Other
Primary Area Where Raised
Total
C.93a: Chi-Square Tests
40.611 a 16 .001
37.562 16 .002
11.524 1 .001
1346
Pearson Chi-Square
Likelihood Ratio Linear-by-Linear Association
N of Valid Cases
Value df Asymp. Sig. (2-sided)
3 cells (12.0%) have expected count less than 5. The minimum expected count is 2.14.
a.
C.93:

271
C.94:
283 294 577
44.0% 41.8% 42.9%
246 277 523
38.3% 39.4% 38.9%
73 75 148
11.4% 10.7% 11.0%
13 18 31
2.0% 2.6% 2.3%
28 39 67
4.4% 5.5% 5.0%
643 703 1346
100.0% 100.0% 100.0%
Count
% within First Generation College Student
Count
% within First Generation College Student
Count
% within First Generation College Student
Count
% within First Generation College Student
Count
% within First Generation College Student
Count
% within First Generation College Student
High Importance
Moderate Importance
Low Importance
No Importance
No Opinion
Community Service/Volunteer in the U.S. with an organization focused on international issues : 3. Please rate how important you think it is to participate in the following <b>extracurricular activities</b>.
Total
Yes No
First Generation College Student
Total
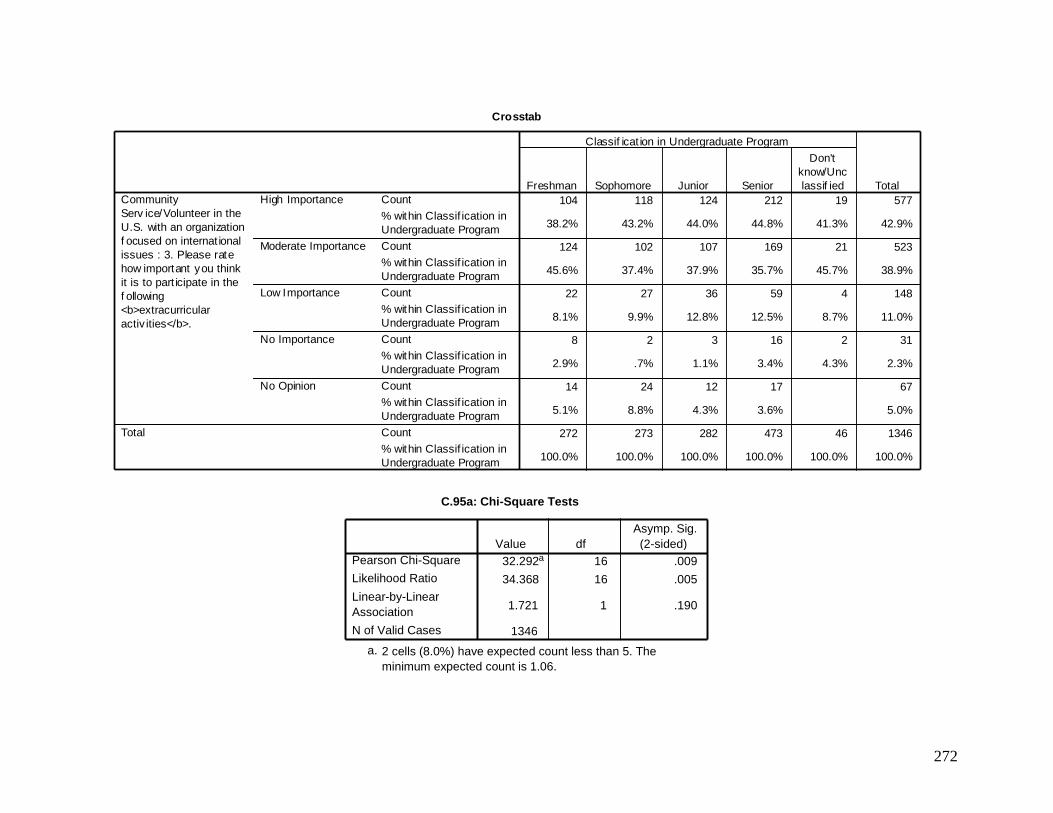
272
C.95a: Chi-Square Tests
32.292 a 16 .009
34.368 16 .005
1.721 1 .190
1346
Pearson Chi-Square Likelihood Ratio
Linear-by-Linear Association
N of Valid Cases
Value df Asymp. Sig. (2-sided)
2 cells (8.0%) have expected count less than 5. The minimum expected count is 1.06.
a.
Crosstab
104 118 124 212 19 577
38.2% 43.2% 44.0% 44.8% 41.3% 42.9%
124 102 107 169 21 523
45.6% 37.4% 37.9% 35.7% 45.7% 38.9%
22 27 36 59 4 148
8.1% 9.9% 12.8% 12.5% 8.7% 11.0%
8 2 3 16 2 31
2.9% .7% 1.1% 3.4% 4.3% 2.3%
14 24 12 17 67
5.1% 8.8% 4.3% 3.6% 5.0%
272 273 282 473 46 1346
100.0% 100.0% 100.0% 100.0% 100.0% 100.0%
Count
% within Classif ication in
Undergraduate Program
Count
% within Classif ication in
Undergraduate Program
Count
% within Classif ication in
Undergraduate Program
Count
% within Classif ication in
Undergraduate Program
Count
% within Classif ication in
Undergraduate Program
Count
% within Classif ication in
Undergraduate Program
High Importance
Moderate Importance
Low Importance
No Importance
No Opinion
Community
Serv ice/Volunteer in the
U.S. with an organization
f ocused on internat ional
issues : 3. Please rate
how important you think
it is to part icipate in the
f ollowing
<b>extracurricular
activ ities</b>.
Total
Freshman Sophomore Junior Senior
Don't
know/Unc
lassif ied
Classif icat ion in Undergraduate Program
Total
C.95:
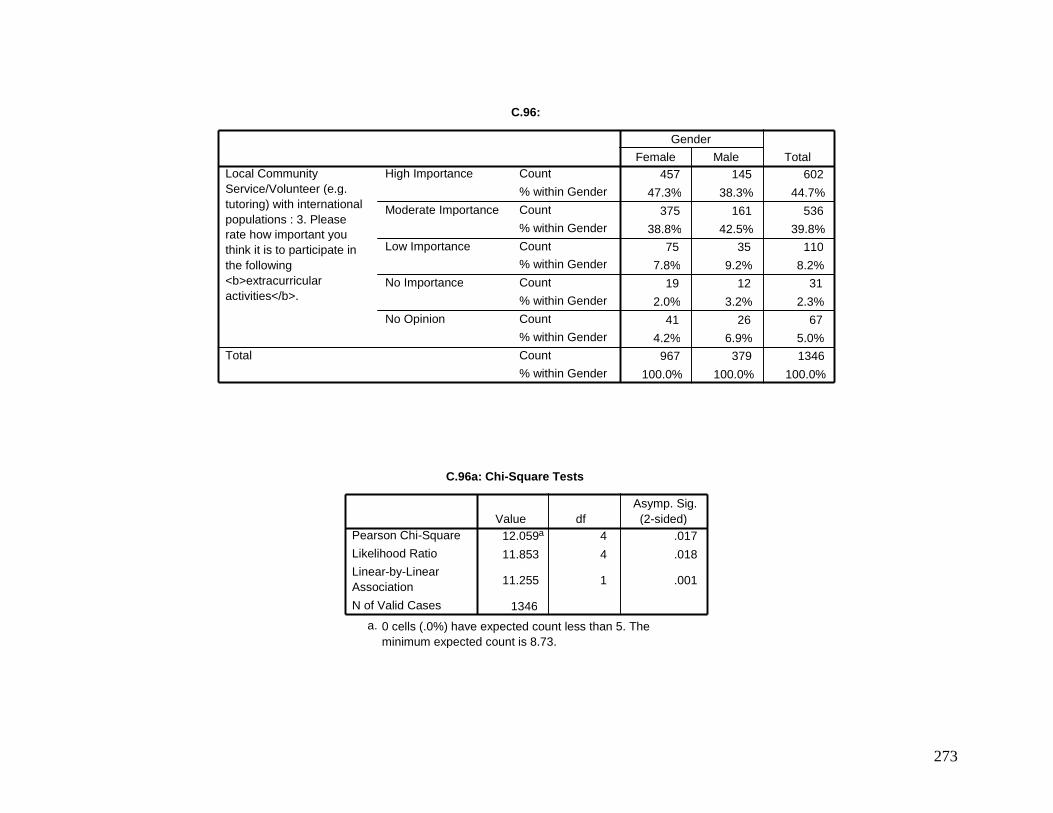
273
C.96:
457 145 602
47.3% 38.3% 44.7%
375 161 536
38.8% 42.5% 39.8% 75 35 110
7.8% 9.2% 8.2% 19 12 31
2.0% 3.2% 2.3%
41 26 67
4.2% 6.9% 5.0% 967 379 1346
100.0% 100.0% 100.0%
Count
% within Gender
Count
% within Gender
Count % within Gender
Count
% within Gender
Count
% within Gender
Count % within Gender
High Importance
Moderate Importance
Low Importance
No Importance
No Opinion
Local Community Service/Volunteer (e.g. tutoring) with international populations : 3. Please rate how important you think it is to participate in the following <b>extracurricular activities</b>.
Total
Female Male Gender
Total
C.96a: Chi-Square Tests
12.059 a 4 .017
11.853 4 .018
11.255 1 .001
1346
Pearson Chi-Square
Likelihood Ratio
Linear-by-Linear Association
N of Valid Cases
Value df Asymp. Sig. (2-sided)
0 cells (.0%) have expected count less than 5. The minimum expected count is 8.73.
a.
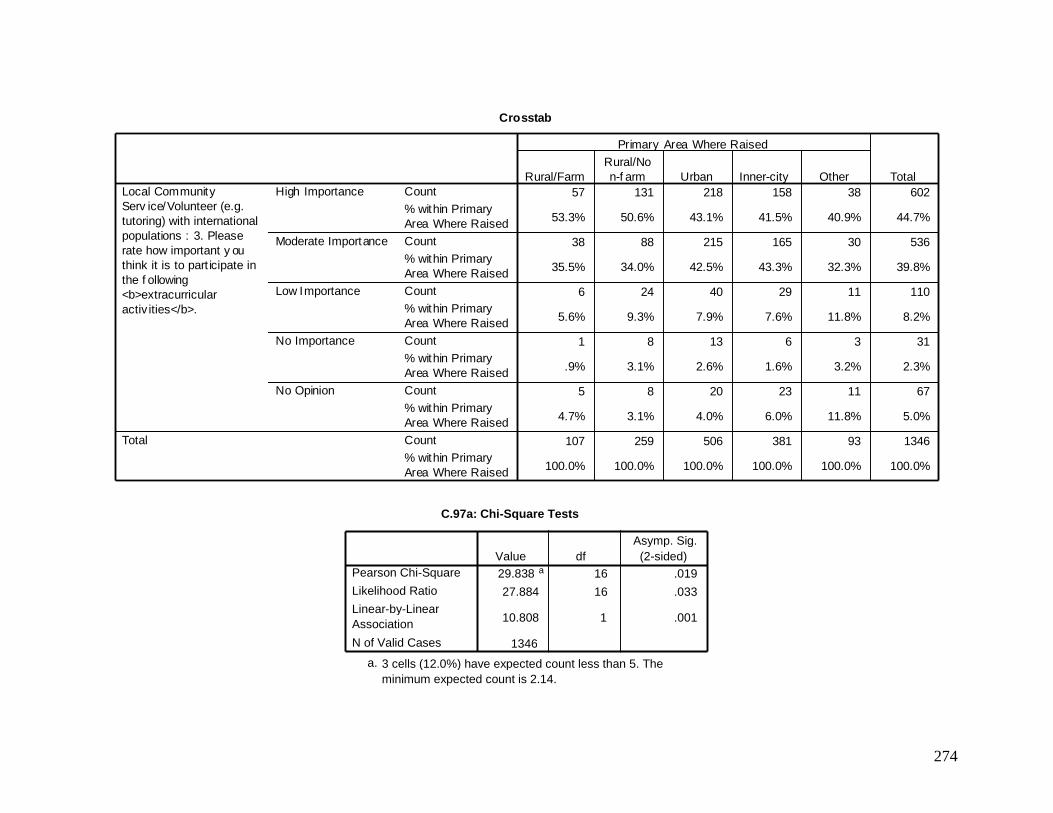
274
C.97a: Chi-Square Tests
29.838 a 16 .019
27.884 16 .033
10.808 1 .001
1346
Pearson Chi-Square
Likelihood Ratio
Linear-by-Linear Association
N of Valid Cases
Value df Asymp. Sig. (2-sided)
3 cells (12.0%) have expected count less than 5. The minimum expected count is 2.14.
a.
Crosstab
57 131 218 158 38 602
53.3% 50.6% 43.1% 41.5% 40.9% 44.7%
38 88 215 165 30 536
35.5% 34.0% 42.5% 43.3% 32.3% 39.8%
6 24 40 29 11 110
5.6% 9.3% 7.9% 7.6% 11.8% 8.2%
1 8 13 6 3 31
.9% 3.1% 2.6% 1.6% 3.2% 2.3%
5 8 20 23 11 67
4.7% 3.1% 4.0% 6.0% 11.8% 5.0%
107 259 506 381 93 1346
100.0% 100.0% 100.0% 100.0% 100.0% 100.0%
Count
% within Primary
Area Where Raised
Count
% within Primary
Area Where Raised
Count
% within Primary
Area Where Raised
Count
% within Primary
Area Where Raised
Count
% within Primary
Area Where Raised
Count
% within Primary
Area Where Raised
High Importance
Moderate Importance
Low Importance
No Importance
No Opinion
Local Community
Serv ice/Volunteer (e.g.
tutoring) with international
populations : 3. Please
rate how important y ou
think it is to part icipate in
the f ollowing
<b>extracurricular
activ ities</b>.
Total
Rural/Farm
Rural/No
n-f arm Urban Inner-city Other
Primary Area Where Raised
Total
C.97:

275
C.98:
290 312 602
45.1% 44.4% 44.7%
264 272 536
41.1% 38.7% 39.8%
50 60 110
7.8% 8.5% 8.2%
13 18 31
2.0% 2.6% 2.3%
26 41 67
4.0% 5.8% 5.0%
643 703 1346
100.0% 100.0% 100.0%
Count
% within First Generation College Student
Count
% within First Generation College Student
Count
% within First Generation College Student
Count
% within First Generation College Student
Count
% within First Generation College Student
Count
% within First Generation College Student
High Importance
Moderate Importance
Low Importance
No Importance
No Opinion
Local Community Service/Volunteer (e.g. tutoring) with international populations : 3. Please rate how important you think it is to participate in the following <b>extracurricular activities</b>.
Total
Yes No
First Generation College Student
Total
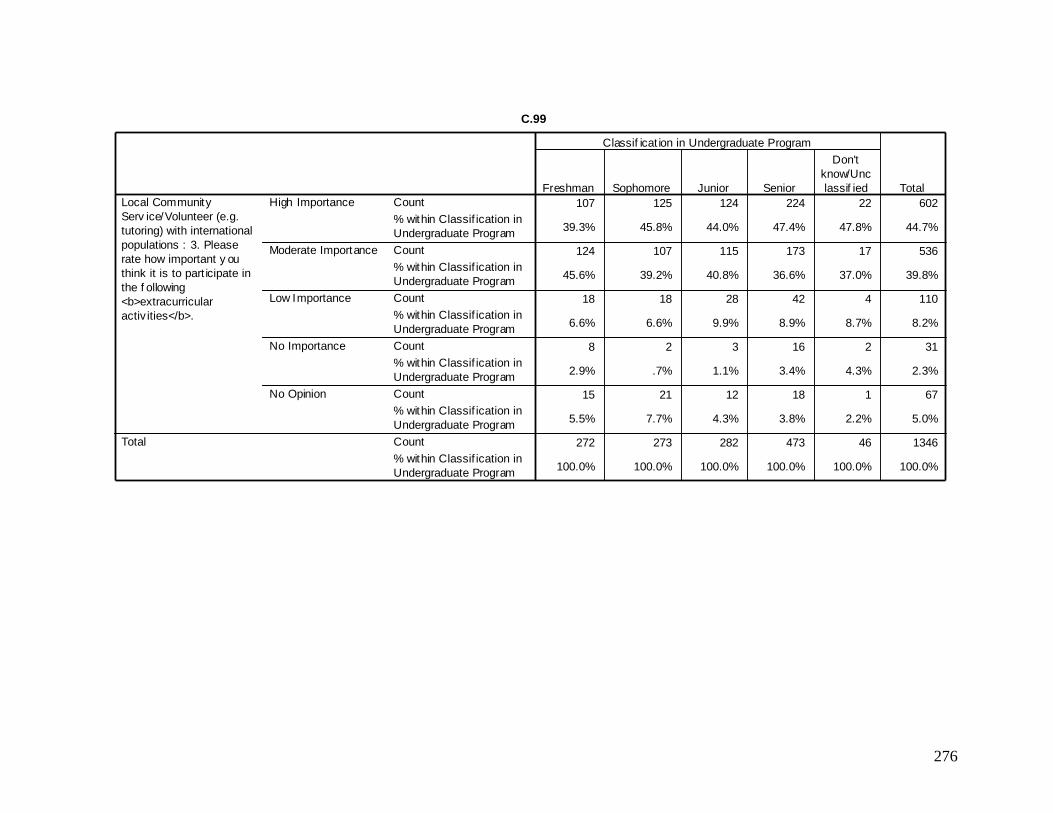
276
Crosstab
107 125 124 224 22 602
39.3% 45.8% 44.0% 47.4% 47.8% 44.7%
124 107 115 173 17 536
45.6% 39.2% 40.8% 36.6% 37.0% 39.8%
18 18 28 42 4 110
6.6% 6.6% 9.9% 8.9% 8.7% 8.2%
8 2 3 16 2 31
2.9% .7% 1.1% 3.4% 4.3% 2.3%
15 21 12 18 1 67
5.5% 7.7% 4.3% 3.8% 2.2% 5.0%
272 273 282 473 46 1346
100.0% 100.0% 100.0% 100.0% 100.0% 100.0%
Count
% within Classif ication in
Undergraduate Program
Count
% within Classif ication in
Undergraduate Program
Count
% within Classif ication in
Undergraduate Program
Count
% within Classif ication in
Undergraduate Program
Count
% within Classif ication in
Undergraduate Program
Count
% within Classif ication in
Undergraduate Program
High Importance
Moderate Importance
Low Importance
No Importance
No Opinion
Local Community
Serv ice/Volunteer (e.g.
tutoring) with international
populations : 3. Please
rate how important y ou
think it is to part icipate in
the f ollowing
<b>extracurricular
activ ities</b>.
Total
Freshman Sophomore Junior Senior
Don't
know/Unc
lassif ied
Classif icat ion in Undergraduate Program
Total
C.99

277
C.100
366 129 495
37.8% 34.0% 36.8%
367 147 514
38.0% 38.8% 38.2% 149 54 203
15.4% 14.2% 15.1% 40 20 60
4.1% 5.3% 4.5%
45 29 74
4.7% 7.7% 5.5% 967 379 1346
100.0% 100.0% 100.0%
Count
% within Gender
Count
% within Gender
Count % within Gender
Count
% within Gender
Count
% within Gender
Count % within Gender
High Importance
Moderate Importance
Low Importance
No Importance
No Opinion
Community service/Volunteer in a foreign country : 3. Please rate how important you think it is to participate in the following <b>extracurricular activities</b>.
Total
Female Male Gender
Total
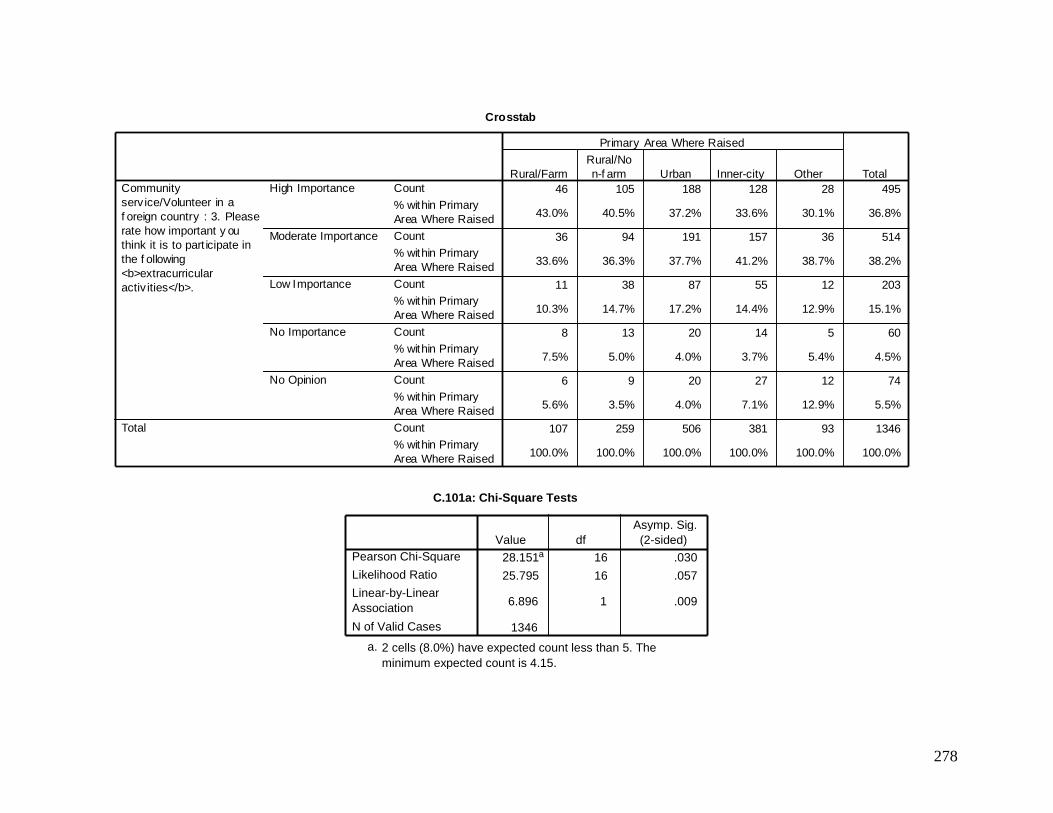
278
C.101a: Chi-Square Tests
28.151 a 16 .030
25.795 16 .057
6.896 1 .009
1346
Pearson Chi-Square
Likelihood Ratio
Linear-by-Linear Association
N of Valid Cases
Value df Asymp. Sig. (2-sided)
2 cells (8.0%) have expected count less than 5. The minimum expected count is 4.15.
a.
Crosstab
46 105 188 128 28 495
43.0% 40.5% 37.2% 33.6% 30.1% 36.8%
36 94 191 157 36 514
33.6% 36.3% 37.7% 41.2% 38.7% 38.2%
11 38 87 55 12 203
10.3% 14.7% 17.2% 14.4% 12.9% 15.1%
8 13 20 14 5 60
7.5% 5.0% 4.0% 3.7% 5.4% 4.5%
6 9 20 27 12 74
5.6% 3.5% 4.0% 7.1% 12.9% 5.5%
107 259 506 381 93 1346
100.0% 100.0% 100.0% 100.0% 100.0% 100.0%
Count
% within Primary
Area Where Raised
Count
% within Primary
Area Where Raised
Count
% within Primary
Area Where Raised
Count
% within Primary
Area Where Raised
Count
% within Primary
Area Where Raised
Count
% within Primary
Area Where Raised
High Importance
Moderate Importance
Low Importance
No Importance
No Opinion
Community
serv ice/Volunteer in a
f oreign country : 3. Please
rate how important y ou
think it is to part icipate in
the f ollowing
<b>extracurricular
activ ities</b>.
Total
Rural/Farm
Rural/No
n-f arm Urban Inner-city Other
Primary Area Where Raised
Total
C.101
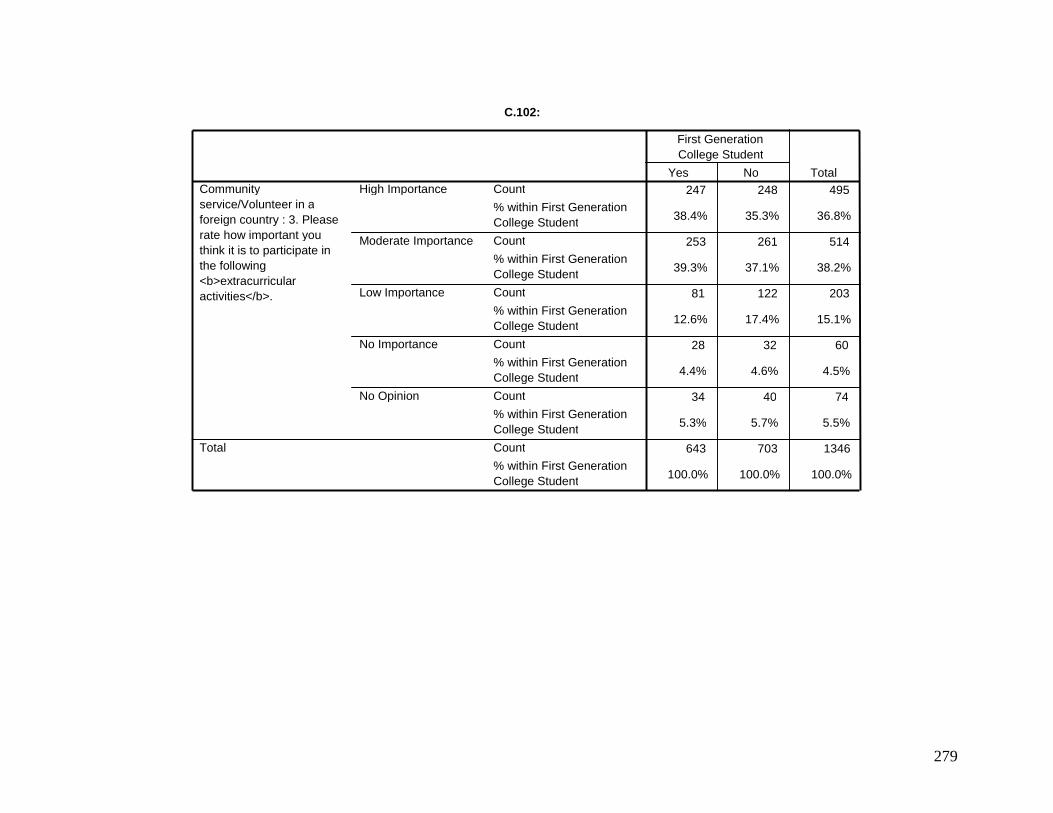
279
C.102:
247 248 495
38.4% 35.3% 36.8%
253 261 514
39.3% 37.1% 38.2%
81 122 203
12.6% 17.4% 15.1%
28 32 60
4.4% 4.6% 4.5%
34 40 74
5.3% 5.7% 5.5%
643 703 1346
100.0% 100.0% 100.0%
Count
% within First Generation College Student
Count
% within First Generation College Student
Count
% within First Generation College Student
Count
% within First Generation College Student
Count
% within First Generation College Student
Count
% within First Generation College Student
High Importance
Moderate Importance
Low Importance
No Importance
No Opinion
Community service/Volunteer in a foreign country : 3. Please rate how important you think it is to participate in the following <b>extracurricular activities</b>.
Total
Yes No
First Generation College Student
Total
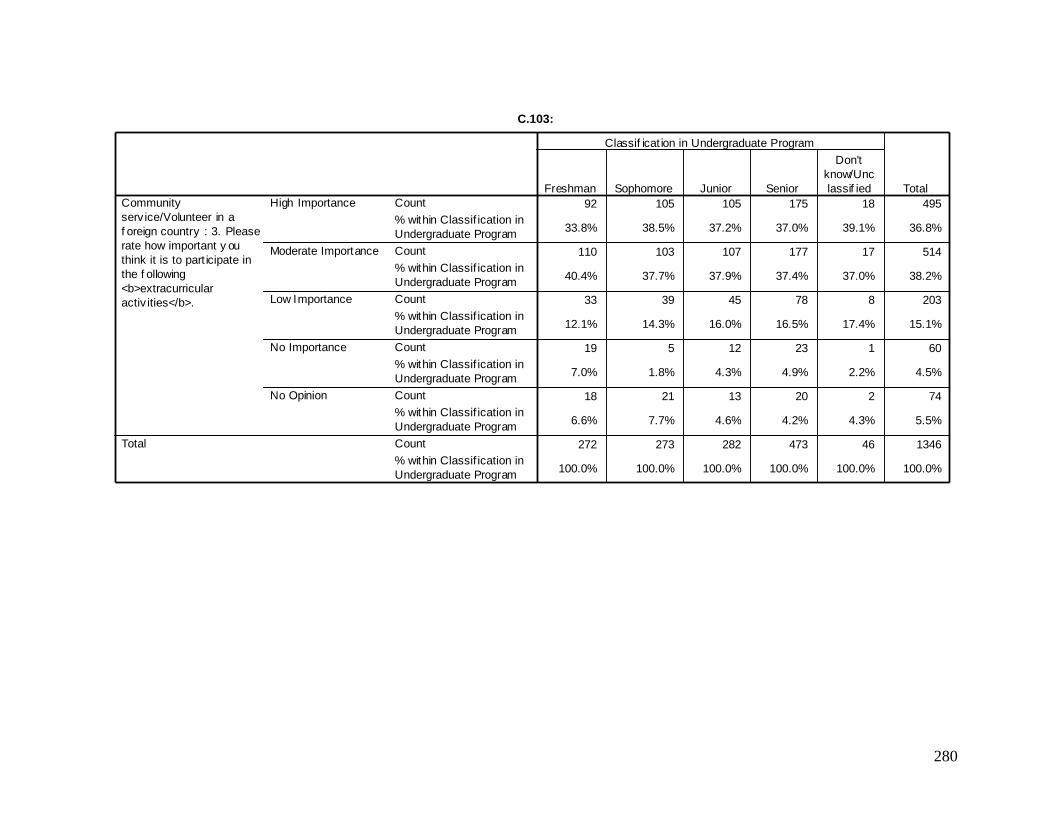
280
Crosstab
92 105 105 175 18 495
33.8% 38.5% 37.2% 37.0% 39.1% 36.8%
110 103 107 177 17 514
40.4% 37.7% 37.9% 37.4% 37.0% 38.2%
33 39 45 78 8 203
12.1% 14.3% 16.0% 16.5% 17.4% 15.1%
19 5 12 23 1 60
7.0% 1.8% 4.3% 4.9% 2.2% 4.5%
18 21 13 20 2 74
6.6% 7.7% 4.6% 4.2% 4.3% 5.5%
272 273 282 473 46 1346
100.0% 100.0% 100.0% 100.0% 100.0% 100.0%
Count
% within Classif ication in
Undergraduate Program
Count
% within Classif ication in
Undergraduate Program
Count
% within Classif ication in
Undergraduate Program
Count
% within Classif ication in
Undergraduate Program
Count
% within Classif ication in
Undergraduate Program
Count
% within Classif ication in
Undergraduate Program
High Importance
Moderate Importance
Low Importance
No Importance
No Opinion
Community
serv ice/Volunteer in a
f oreign country : 3. Please
rate how important y ou
think it is to part icipate in
the f ollowing
<b>extracurricular
activ ities</b>.
Total
Freshman Sophomore Junior Senior
Don't
know/Unc
lassif ied
Classif icat ion in Undergraduate Program
Total
C.103:
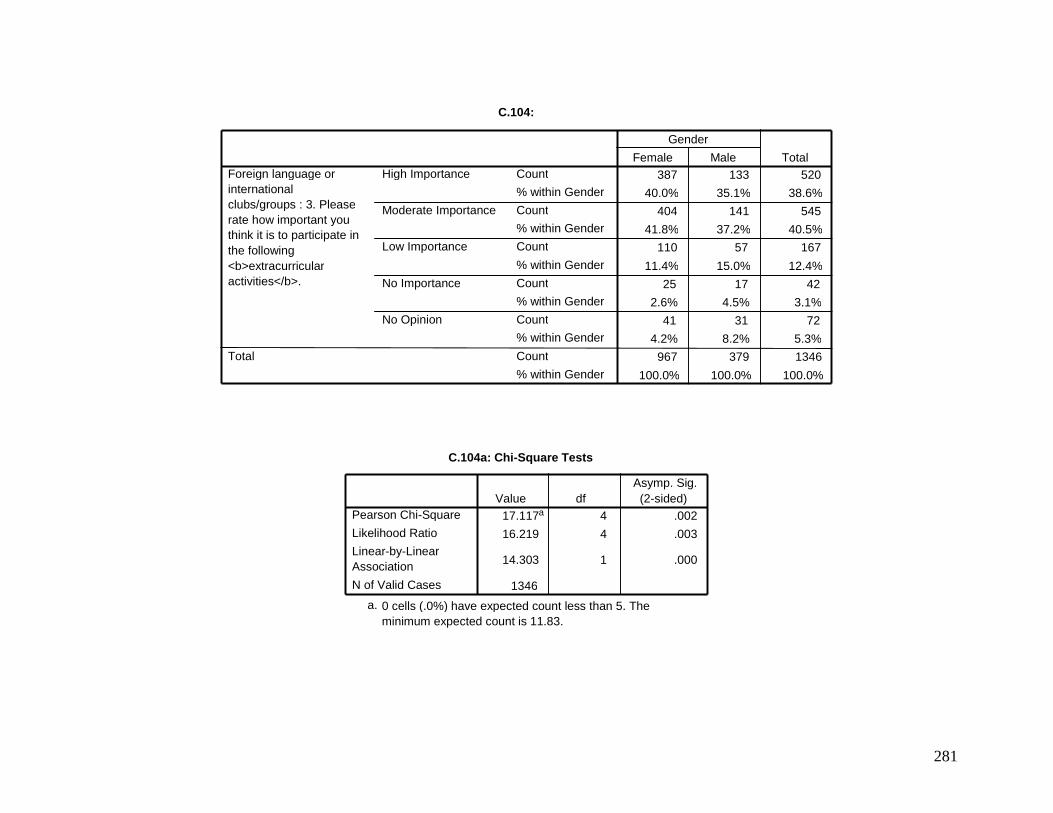
281
C.104:
387 133 520
40.0% 35.1% 38.6%
404 141 545
41.8% 37.2% 40.5% 110 57 167
11.4% 15.0% 12.4%
25 17 42
2.6% 4.5% 3.1%
41 31 72
4.2% 8.2% 5.3% 967 379 1346
100.0% 100.0% 100.0%
Count
% within Gender
Count % within Gender
Count
% within Gender
Count
% within Gender
Count % within Gender
Count
% within Gender
High Importance
Moderate Importance
Low Importance
No Importance
No Opinion
Foreign language or international clubs/groups : 3. Please rate how important you think it is to participate in the following <b>extracurricular activities</b>.
Total
Female Male
Gender
Total
C.104a: Chi-Square Tests
17.117 a 4 .002
16.219 4 .003
14.303 1 .000
1346
Pearson Chi-Square
Likelihood Ratio
Linear-by-Linear Association
N of Valid Cases
Value df Asymp. Sig. (2-sided)
0 cells (.0%) have expected count less than 5. The minimum expected count is 11.83.
a.
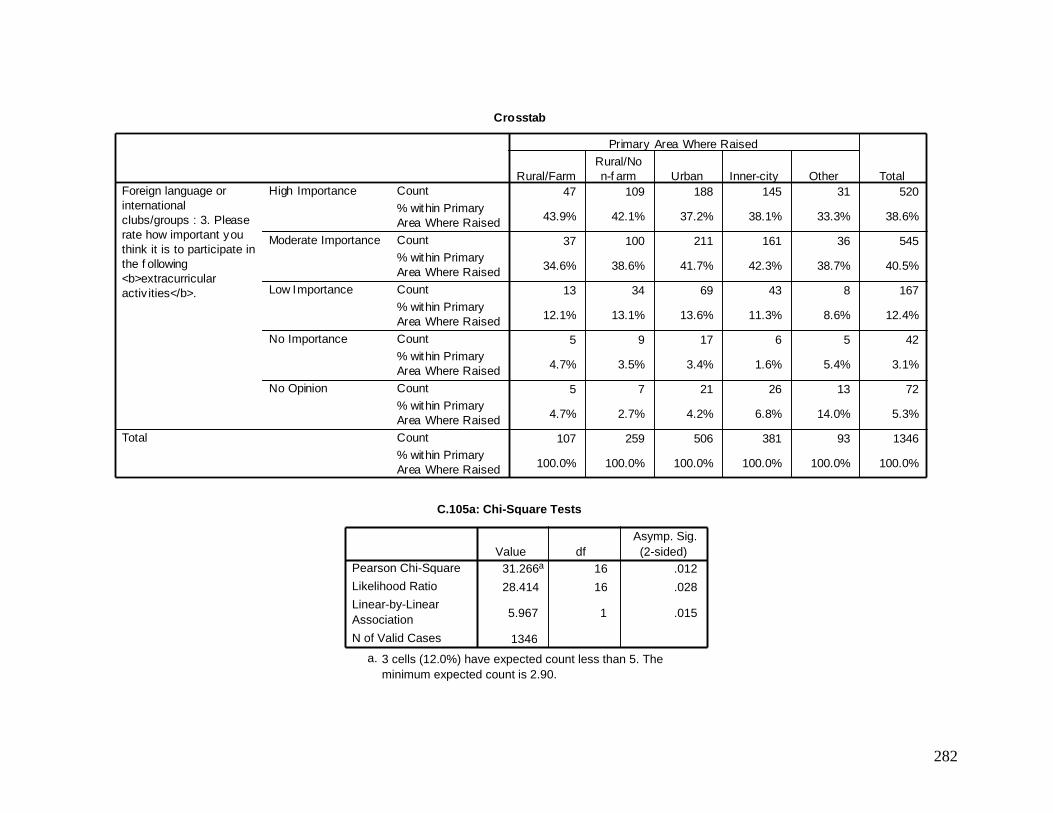
282
C.105a: Chi-Square Tests
31.266 a 16 .012
28.414 16 .028
5.967 1 .015
1346
Pearson Chi-Square
Likelihood Ratio
Linear-by-Linear Association
N of Valid Cases
Value df Asymp. Sig. (2-sided)
3 cells (12.0%) have expected count less than 5. The minimum expected count is 2.90.
a.
Crosstab
47 109 188 145 31 520
43.9% 42.1% 37.2% 38.1% 33.3% 38.6%
37 100 211 161 36 545
34.6% 38.6% 41.7% 42.3% 38.7% 40.5%
13 34 69 43 8 167
12.1% 13.1% 13.6% 11.3% 8.6% 12.4%
5 9 17 6 5 42
4.7% 3.5% 3.4% 1.6% 5.4% 3.1%
5 7 21 26 13 72
4.7% 2.7% 4.2% 6.8% 14.0% 5.3%
107 259 506 381 93 1346
100.0% 100.0% 100.0% 100.0% 100.0% 100.0%
Count
% within Primary
Area Where Raised
Count
% within Primary
Area Where Raised
Count
% within Primary
Area Where Raised
Count
% within Primary
Area Where Raised
Count
% within Primary
Area Where Raised
Count
% within Primary
Area Where Raised
High Importance
Moderate Importance
Low Importance
No Importance
No Opinion
Foreign language or
international
clubs/groups : 3. Please
rate how important you
think it is to participate in
the f ollowing
<b>extracurricular
activ ities</b>.
Total
Rural/Farm
Rural/No
n-f arm Urban Inner-city Other
Primary Area Where Raised
Total
C.105
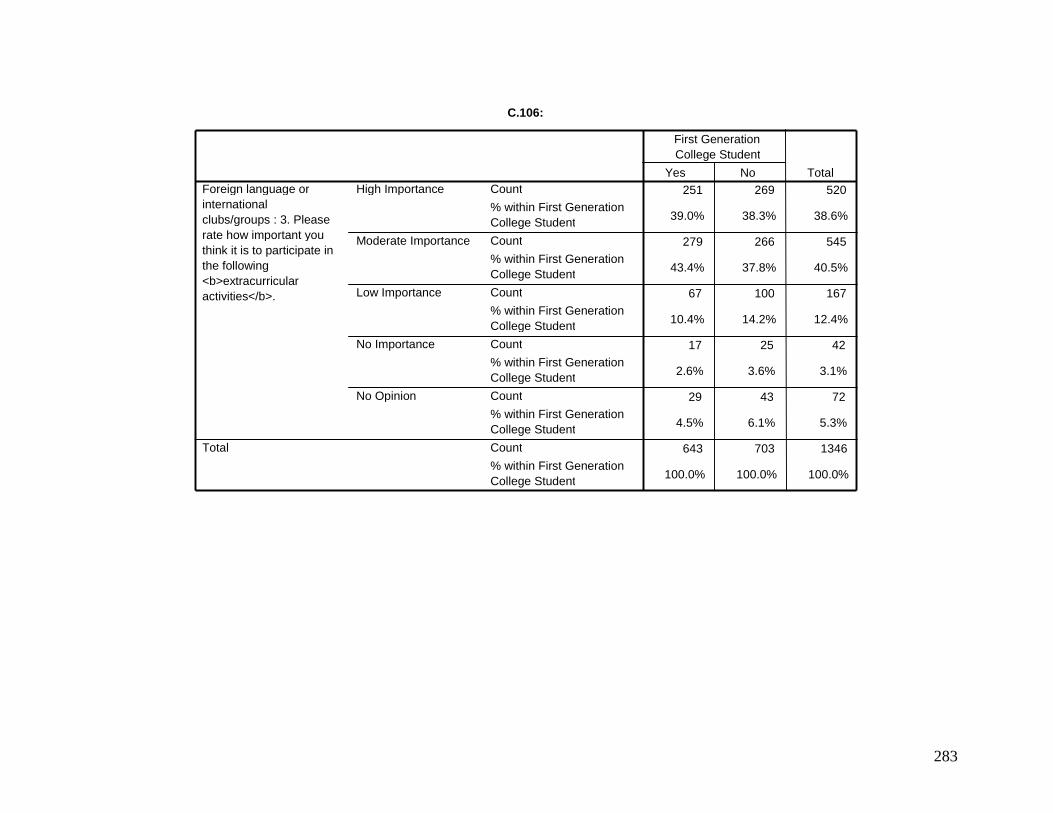
283
C.106:
251 269 520
39.0% 38.3% 38.6%
279 266 545
43.4% 37.8% 40.5%
67 100 167
10.4% 14.2% 12.4%
17 25 42
2.6% 3.6% 3.1%
29 43 72
4.5% 6.1% 5.3%
643 703 1346
100.0% 100.0% 100.0%
Count
% within First Generation College Student
Count
% within First Generation College Student
Count
% within First Generation College Student
Count
% within First Generation College Student
Count
% within First Generation College Student
Count
% within First Generation College Student
High Importance
Moderate Importance
Low Importance
No Importance
No Opinion
Foreign language or international clubs/groups : 3. Please rate how important you think it is to participate in the following <b>extracurricular activities</b>.
Total
Yes No
First Generation College Student
Total
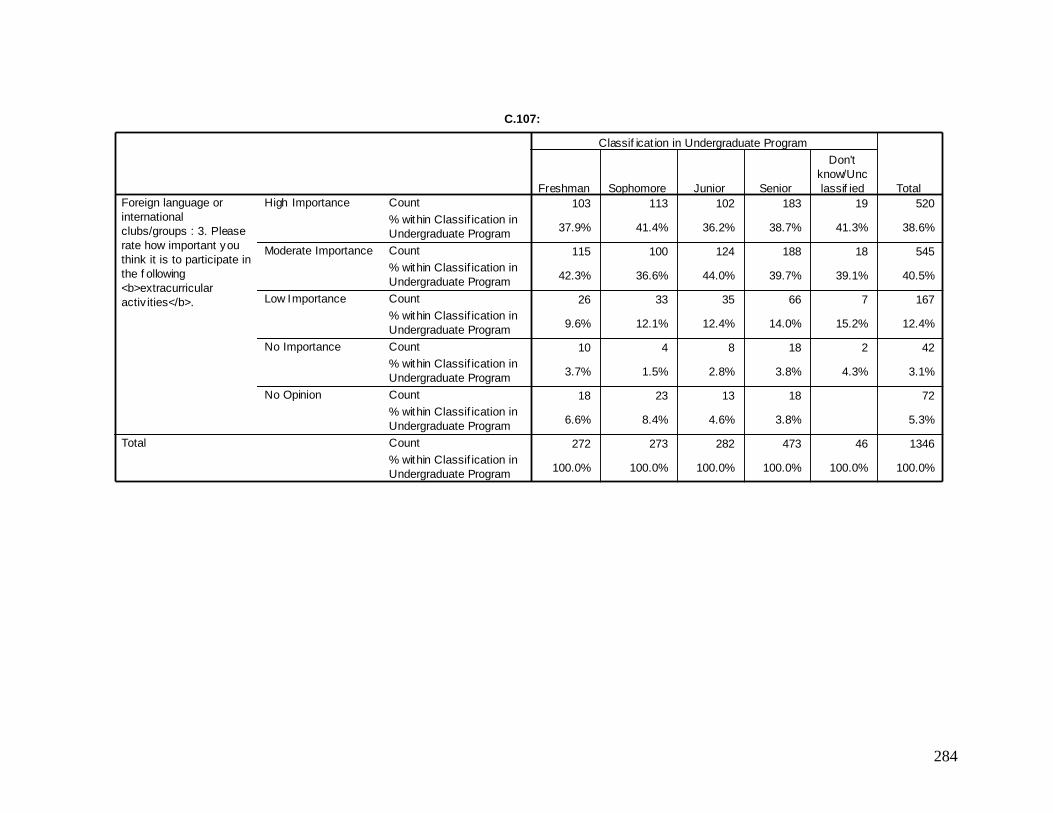
284
Crosstab
103 113 102 183 19 520
37.9% 41.4% 36.2% 38.7% 41.3% 38.6%
115 100 124 188 18 545
42.3% 36.6% 44.0% 39.7% 39.1% 40.5%
26 33 35 66 7 167
9.6% 12.1% 12.4% 14.0% 15.2% 12.4%
10 4 8 18 2 42
3.7% 1.5% 2.8% 3.8% 4.3% 3.1%
18 23 13 18 72
6.6% 8.4% 4.6% 3.8% 5.3%
272 273 282 473 46 1346
100.0% 100.0% 100.0% 100.0% 100.0% 100.0%
Count
% within Classif ication in
Undergraduate Program
Count
% within Classif ication in
Undergraduate Program
Count
% within Classif ication in
Undergraduate Program
Count
% within Classif ication in
Undergraduate Program
Count
% within Classif ication in
Undergraduate Program
Count
% within Classif ication in
Undergraduate Program
High Importance
Moderate Importance
Low Importance
No Importance
No Opinion
Foreign language or
international
clubs/groups : 3. Please
rate how important you
think it is to participate in
the f ollowing
<b>extracurricular
activ ities</b>.
Total
Freshman Sophomore Junior Senior
Don't
know/Unc
lassif ied
Classif icat ion in Undergraduate Program
Total
C.107:

285
C.108:
91 61 152
9.4% 16.1% 11.3%
876 318 1194
90.6% 83.9% 88.7%
967 379 1346
100.0% 100.0% 100.0%
Count
% within Gender
Count
% within Gender
Count
% within Gender
Yes
No
Internship in the U.S. with an organization focused on international issues : 4. Please tell us if you have participated in the following <b>extracurricular activities</b>.
Total
Female Male Gender
Total
C.108a: Chi-Square Tests
12.145 b 1 .000 11.487 1 .001 11.434 1 .001
.001 .000
12.136 1 .000
1346
Pearson Chi-Square Continuity Correction a
Likelihood Ratio Fisher's Exact Test
Linear-by-Linear Association
N of Valid Cases
Value df Asymp. Sig.
(2-sided) Exact Sig. (2-sided)
Exact Sig. (1-sided)
Computed only for a 2x2 table a.
0 cells (.0%) have expected count less than 5. The minimum expected count is 42.80.
b.
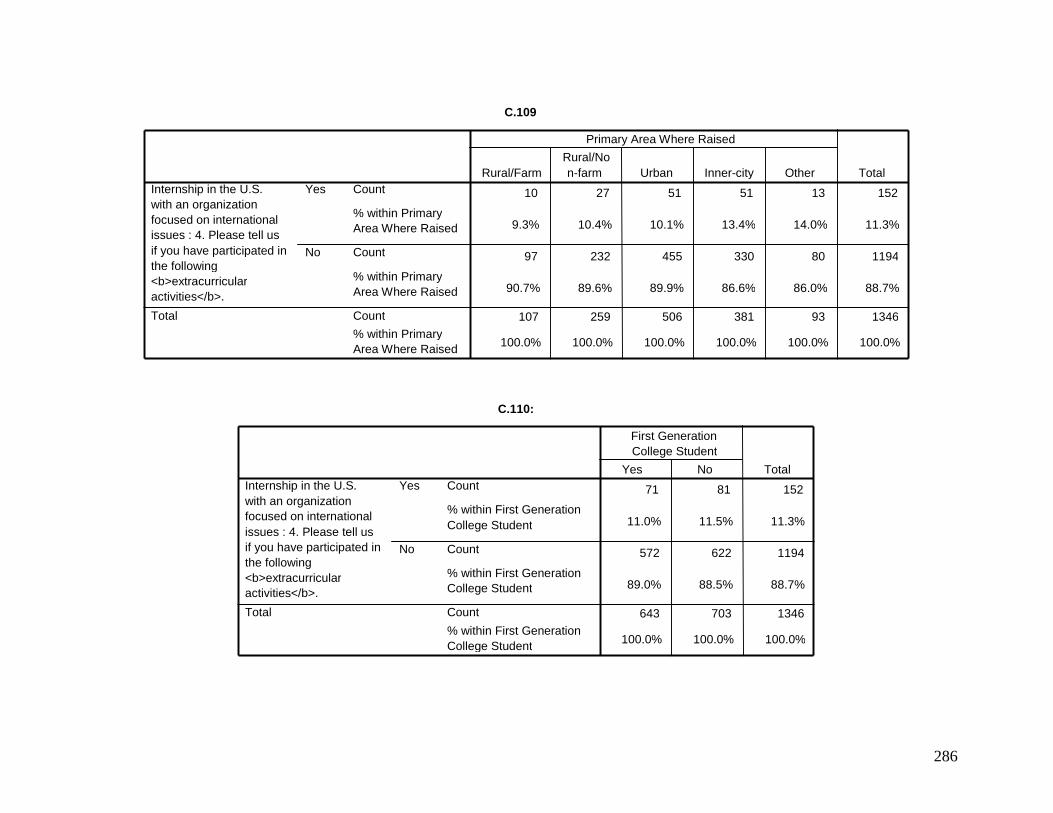
286
C.109
10 27 51 51 13 152
9.3% 10.4% 10.1% 13.4% 14.0% 11.3%
97 232 455 330 80 1194
90.7% 89.6% 89.9% 86.6% 86.0% 88.7%
107 259 506 381 93 1346
100.0% 100.0% 100.0% 100.0% 100.0% 100.0%
Count
% within Primary Area Where Raised
Count
% within Primary Area Where Raised
Count
% within Primary Area Where Raised
Yes
No
Internship in the U.S. with an organization focused on international issues : 4. Please tell us if you have participated in the following <b>extracurricular activities</b>.
Total
Rural/Farm Rural/No n-farm Urban Inner-city Other
Primary Area Where Raised
Total
C.110:
71 81 152
11.0% 11.5% 11.3%
572 622 1194
89.0% 88.5% 88.7%
643 703 1346
100.0% 100.0% 100.0%
Count
% within First Generation College Student
Count
% within First Generation College Student
Count
% within First Generation College Student
Yes
No
Internship in the U.S. with an organization focused on international issues : 4. Please tell us if you have participated in the following <b>extracurricular activities</b>.
Total
Yes No
First Generation College Student
Total
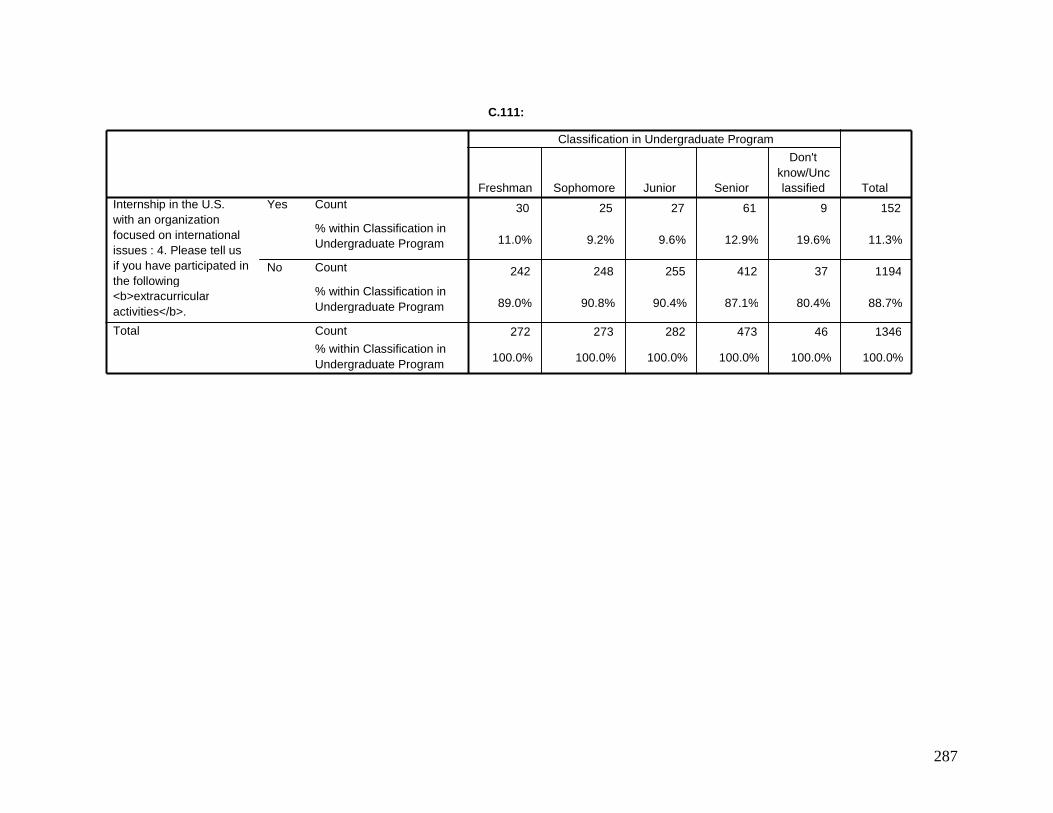
287
C.111:
30 25 27 61 9 152
11.0% 9.2% 9.6% 12.9% 19.6% 11.3%
242 248 255 412 37 1194
89.0% 90.8% 90.4% 87.1% 80.4% 88.7%
272 273 282 473 46 1346
100.0% 100.0% 100.0% 100.0% 100.0% 100.0%
Count
% within Classification in Undergraduate Program
Count
% within Classification in Undergraduate Program
Count % within Classification in Undergraduate Program
Yes
No
Internship in the U.S. with an organization focused on international issues : 4. Please tell us if you have participated in the following <b>extracurricular activities</b>.
Total
Freshman Sophomore Junior Senior
Don't know/Unc lassified
Classification in Undergraduate Program
Total
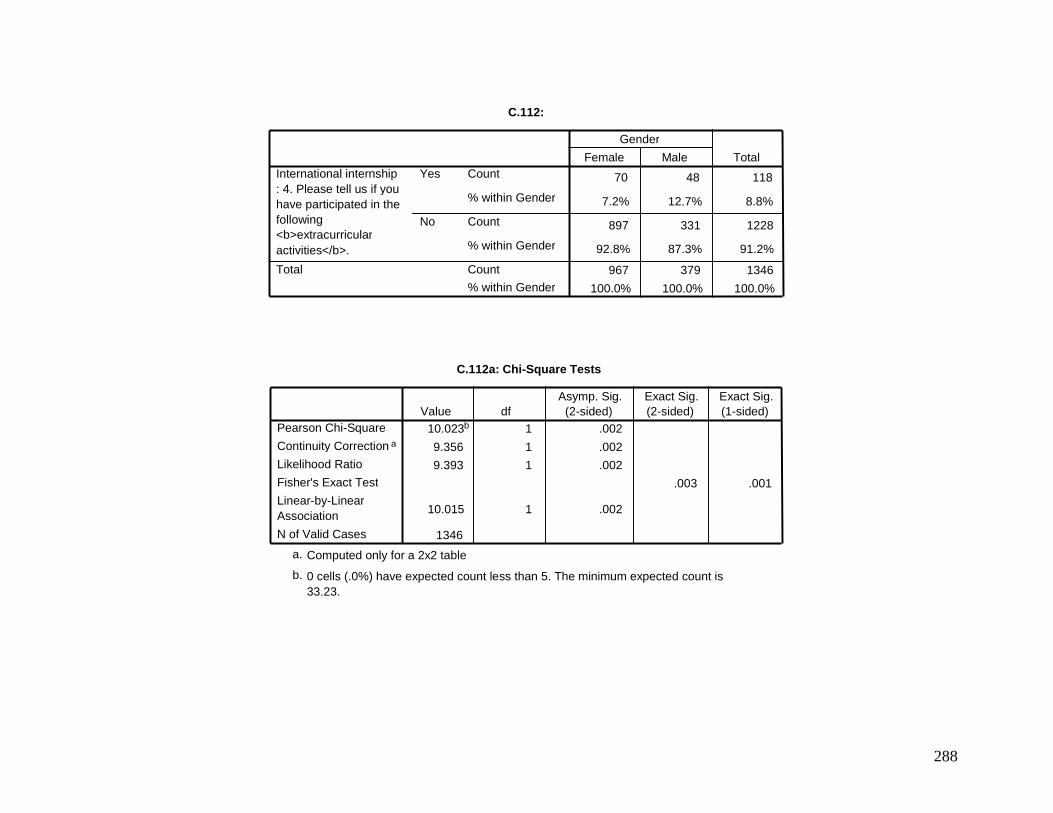
288
C.112:
70 48 118
7.2% 12.7% 8.8%
897 331 1228
92.8% 87.3% 91.2%
967 379 1346
100.0% 100.0% 100.0%
Count
% within Gender
Count
% within Gender
Count % within Gender
Yes
No
International internship : 4. Please tell us if you have participated in the following <b>extracurricular activities</b>.
Total
Female Male
Gender
Total
C.112a: Chi-Square Tests
10.023 b 1 .002
9.356 1 .002
9.393 1 .002
.003 .001
10.015 1 .002
1346
Pearson Chi-Square
Continuity Correction a
Likelihood Ratio
Fisher's Exact Test
Linear-by-Linear Association
N of Valid Cases
Value df Asymp. Sig.
(2-sided) Exact Sig. (2-sided)
Exact Sig. (1-sided)
Computed only for a 2x2 table a.
0 cells (.0%) have expected count less than 5. The minimum expected count is 33.23.
b.
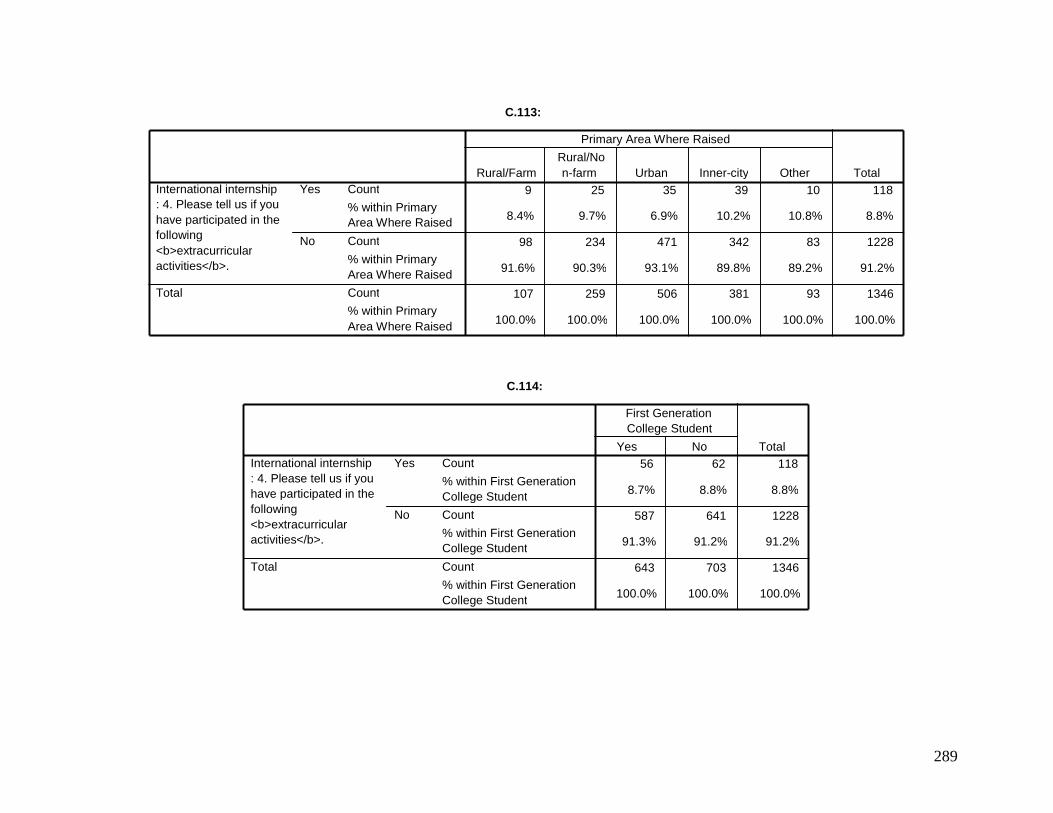
289
C.113:
9 25 35 39 10 118
8.4% 9.7% 6.9% 10.2% 10.8% 8.8%
98 234 471 342 83 1228
91.6% 90.3% 93.1% 89.8% 89.2% 91.2%
107 259 506 381 93 1346
100.0% 100.0% 100.0% 100.0% 100.0% 100.0%
Count
% within Primary Area Where Raised
Count
% within Primary Area Where Raised
Count % within Primary Area Where Raised
Yes
No
International internship : 4. Please tell us if you have participated in the following <b>extracurricular activities</b>.
Total
Rural/Farm Rural/No n-farm Urban Inner-city Other
Primary Area Where Raised
Total
C.114:
56 62 118
8.7% 8.8% 8.8%
587 641 1228
91.3% 91.2% 91.2%
643 703 1346
100.0% 100.0% 100.0%
Count
% within First Generation College Student
Count
% within First Generation College Student
Count
% within First Generation College Student
Yes
No
International internship : 4. Please tell us if you have participated in the following <b>extracurricular activities</b>.
Total
Yes No
First Generation College Student
Total
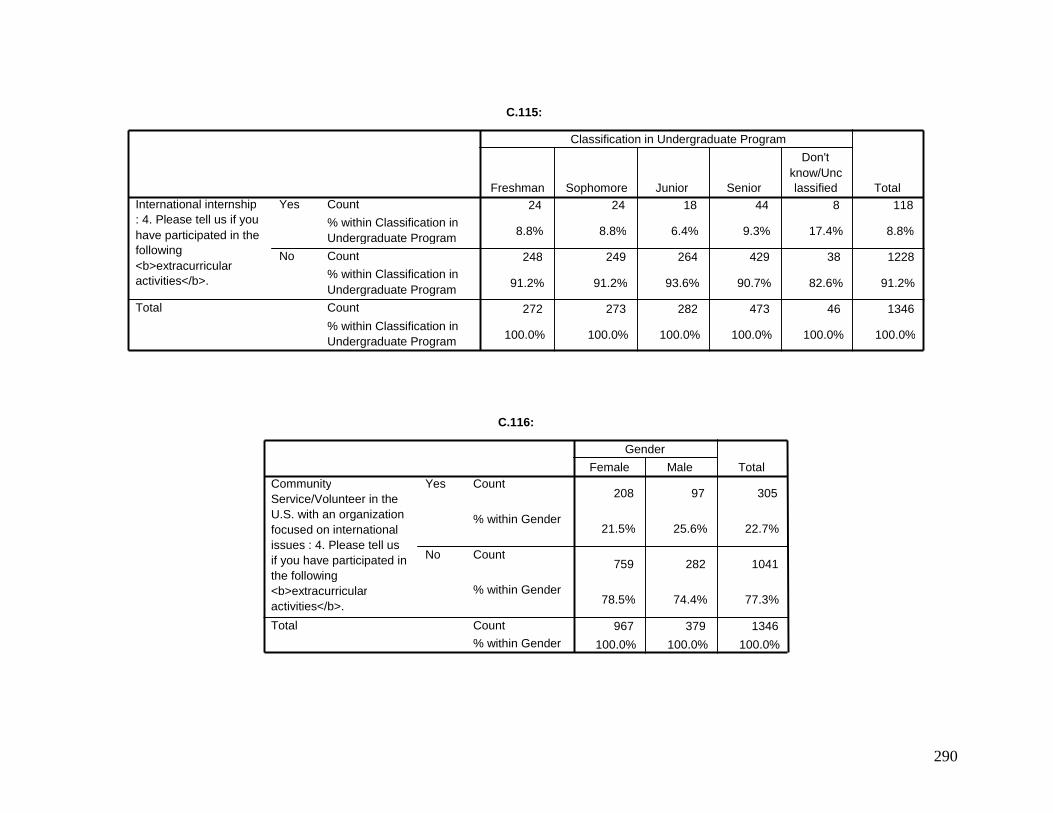
290
C.115:
24 24 18 44 8 118
8.8% 8.8% 6.4% 9.3% 17.4% 8.8%
248 249 264 429 38 1228
91.2% 91.2% 93.6% 90.7% 82.6% 91.2%
272 273 282 473 46 1346
100.0% 100.0% 100.0% 100.0% 100.0% 100.0%
Count
% within Classification in Undergraduate Program Count % within Classification in Undergraduate Program Count
% within Classification in Undergraduate Program
Yes
No
International internship : 4. Please tell us if you have participated in the following <b>extracurricular activities</b>.
Total
Freshman Sophomore Junior Senior
Don't know/Unc lassified
Classification in Undergraduate Program
Total
C.116:
208 97 305
21.5% 25.6% 22.7%
759 282 1041
78.5% 74.4% 77.3%
967 379 1346
100.0% 100.0% 100.0%
Count
% within Gender
Count
% within Gender
Count % within Gender
Yes
No
Community Service/Volunteer in the U.S. with an organization focused on international issues : 4. Please tell us if you have participated in the following <b>extracurricular activities</b>.
Total
Female Male Gender
Total

291
C.117:
28 62 108 84 23 305
26.2% 23.9% 21.3% 22.0% 24.7% 22.7%
79 197 398 297 70 1041
73.8% 76.1% 78.7% 78.0% 75.3% 77.3%
107 259 506 381 93 1346
100.0% 100.0% 100.0% 100.0% 100.0% 100.0%
Count
% within Primary Area Where Raised
Count
% within Primary Area Where Raised
Count % within Primary Area Where Raised
Yes
No
Community Service/Volunteer in the U.S. with an organization focused on international issues : 4. Please tell us if you have participated in the following <b>extracurricular activities</b>.
Total
Rural/Farm Rural/No n-farm Urban Inner-city Other
Primary Area Where Raised
Total
C.118:
146 159 305
22.7% 22.6% 22.7%
497 544 1041
77.3% 77.4% 77.3%
643 703 1346
100.0% 100.0% 100.0%
Count
% within First Generation College Student
Count
% within First Generation College Student
Count
% within First Generation College Student
Yes
No
Community Service/Volunteer in the U.S. with an organization focused on international issues : 4. Please tell us if you have participated in the following <b>extracurricular activities</b>.
Total
Yes No
First Generation College Student
Total
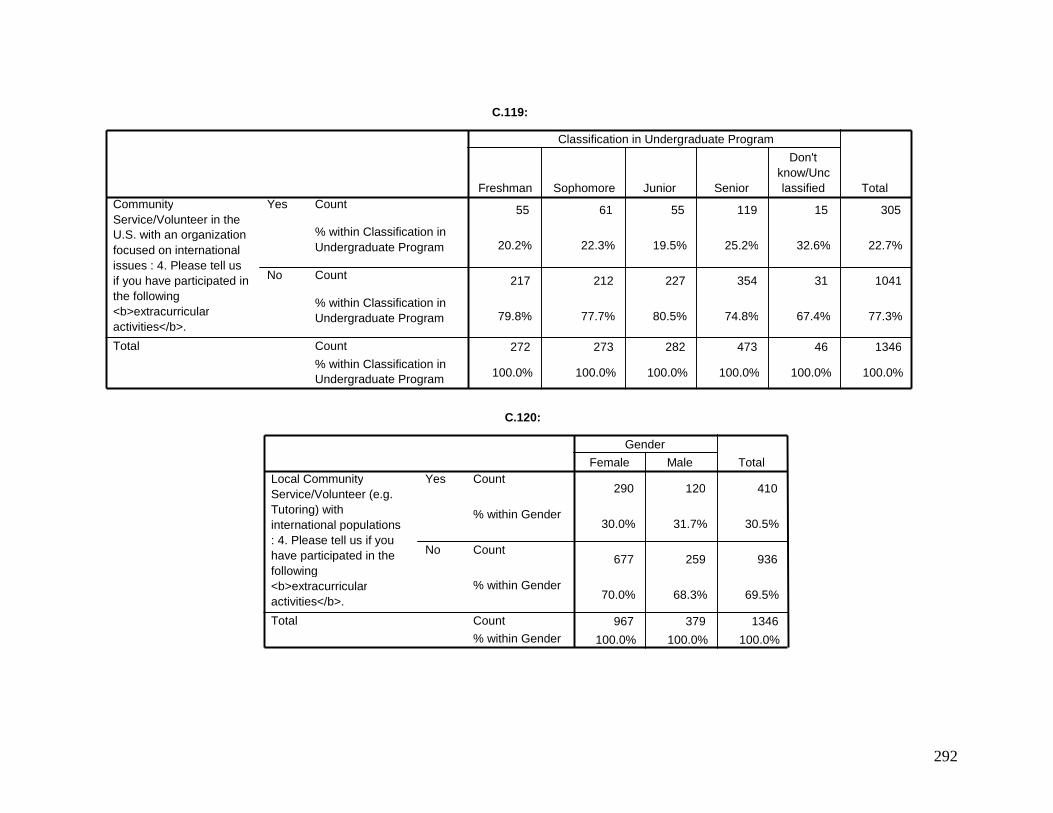
292
C.119:
55 61 55 119 15 305
20.2% 22.3% 19.5% 25.2% 32.6% 22.7%
217 212 227 354 31 1041
79.8% 77.7% 80.5% 74.8% 67.4% 77.3%
272 273 282 473 46 1346
100.0% 100.0% 100.0% 100.0% 100.0% 100.0%
Count
% within Classification in Undergraduate Program
Count
% within Classification in Undergraduate Program
Count
% within Classification in Undergraduate Program
Yes
No
Community Service/Volunteer in the U.S. with an organization focused on international issues : 4. Please tell us if you have participated in the following <b>extracurricular activities</b>.
Total
Freshman Sophomore Junior Senior
Don't know/Unc lassified
Classification in Undergraduate Program
Total
C.120:
290 120 410
30.0% 31.7% 30.5%
677 259 936
70.0% 68.3% 69.5%
967 379 1346
100.0% 100.0% 100.0%
Count
% within Gender
Count
% within Gender
Count % within Gender
Yes
No
Local Community Service/Volunteer (e.g. Tutoring) with international populations : 4. Please tell us if you have participated in the following <b>extracurricular activities</b>.
Total
Female Male Gender
Total
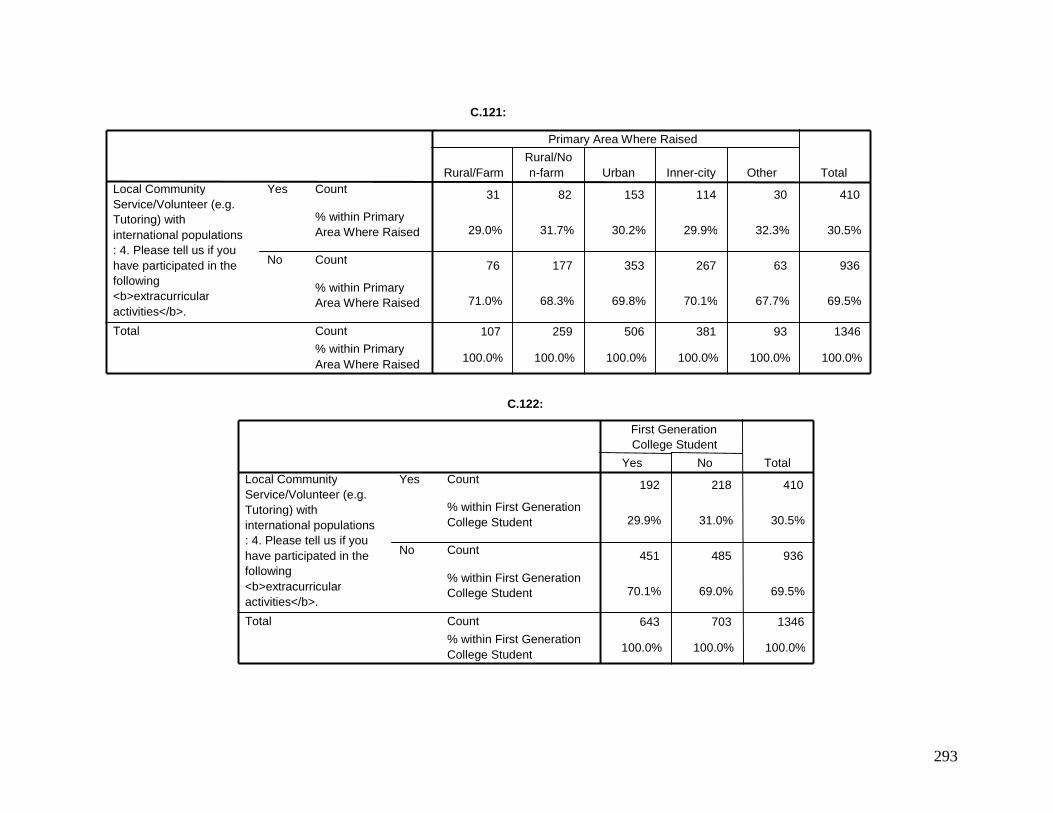
293
C.121:
31 82 153 114 30 410
29.0% 31.7% 30.2% 29.9% 32.3% 30.5%
76 177 353 267 63 936
71.0% 68.3% 69.8% 70.1% 67.7% 69.5%
107 259 506 381 93 1346
100.0% 100.0% 100.0% 100.0% 100.0% 100.0%
Count
% within Primary Area Where Raised
Count
% within Primary Area Where Raised
Count % within Primary Area Where Raised
Yes
No
Local Community Service/Volunteer (e.g. Tutoring) with international populations : 4. Please tell us if you have participated in the following <b>extracurricular activities</b>.
Total
Rural/Farm Rural/No n-farm Urban Inner-city Other
Primary Area Where Raised
Total
C.122:
192 218 410
29.9% 31.0% 30.5%
451 485 936
70.1% 69.0% 69.5%
643 703 1346
100.0% 100.0% 100.0%
Count
% within First Generation College Student
Count
% within First Generation College Student
Count % within First Generation College Student
Yes
No
Local Community Service/Volunteer (e.g. Tutoring) with international populations : 4. Please tell us if you have participated in the following <b>extracurricular activities</b>.
Total
Yes No
First Generation College Student
Total
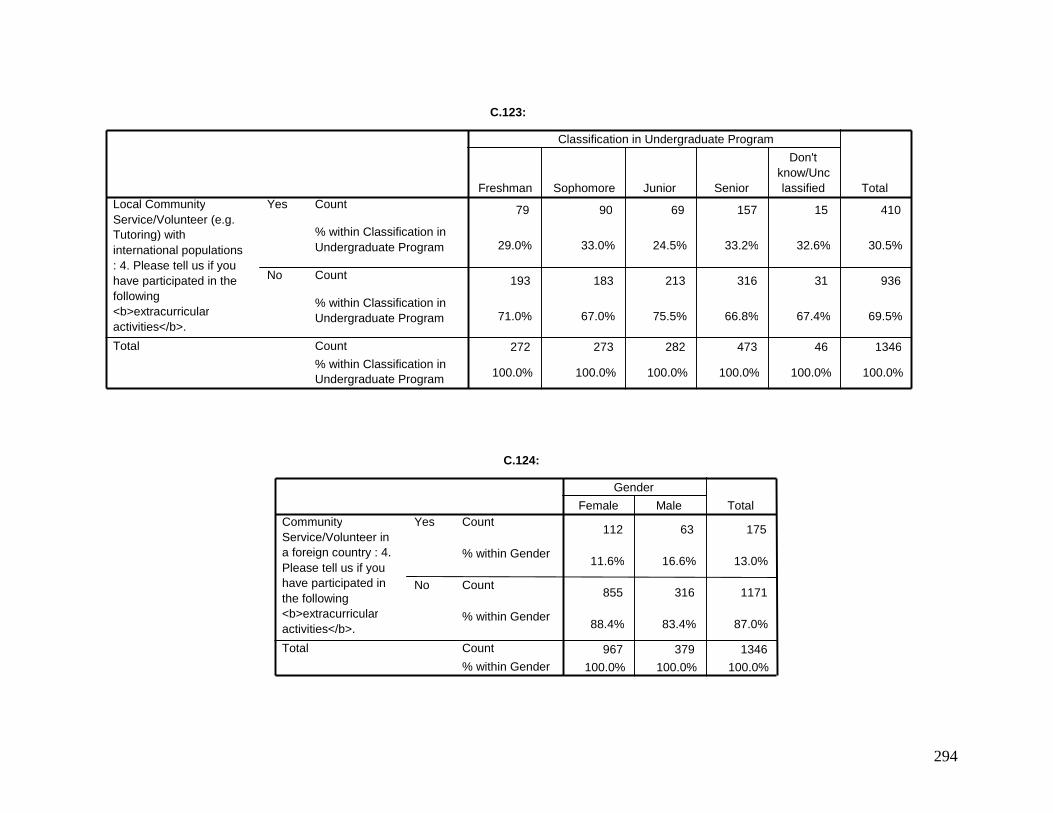
294
C.123:
79 90 69 157 15 410
29.0% 33.0% 24.5% 33.2% 32.6% 30.5%
193 183 213 316 31 936
71.0% 67.0% 75.5% 66.8% 67.4% 69.5%
272 273 282 473 46 1346
100.0% 100.0% 100.0% 100.0% 100.0% 100.0%
Count
% within Classification in Undergraduate Program
Count
% within Classification in Undergraduate Program
Count
% within Classification in Undergraduate Program
Yes
No
Local Community Service/Volunteer (e.g. Tutoring) with international populations : 4. Please tell us if you have participated in the following <b>extracurricular activities</b>.
Total
Freshman Sophomore Junior Senior
Don't know/Unc lassified
Classification in Undergraduate Program
Total
C.124:
112 63 175
11.6% 16.6% 13.0%
855 316 1171
88.4% 83.4% 87.0%
967 379 1346 100.0% 100.0% 100.0%
Count
% within Gender
Count
% within Gender
Count
% within Gender
Yes
No
Community Service/Volunteer in a foreign country : 4. Please tell us if you have participated in the following <b>extracurricular activities</b>.
Total
Female Male
Gender
Total
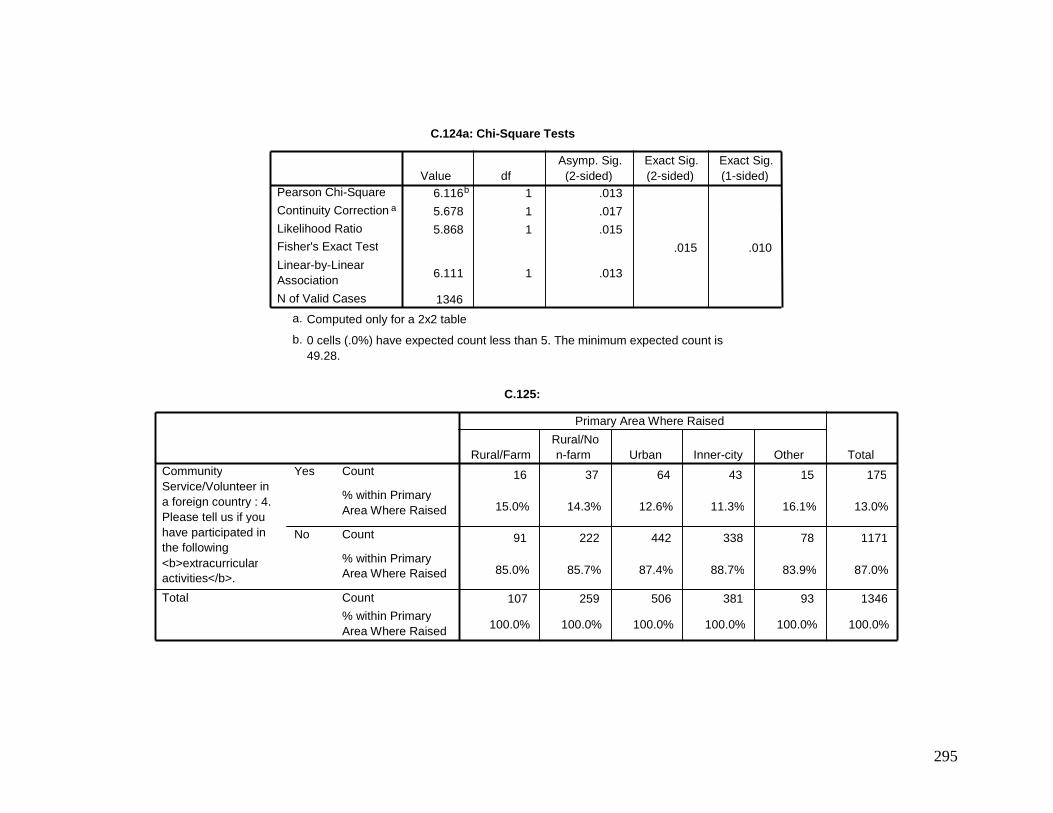
295
C.124a: Chi-Square Tests
6.116 b 1 .013
5.678 1 .017
5.868 1 .015
.015 .010
6.111 1 .013
1346
Pearson Chi-Square
Continuity Correction a
Likelihood Ratio Fisher's Exact Test
Linear-by-Linear Association
N of Valid Cases
Value df Asymp. Sig.
(2-sided) Exact Sig. (2-sided)
Exact Sig. (1-sided)
Computed only for a 2x2 table a.
0 cells (.0%) have expected count less than 5. The minimum expected count is 49.28.
b.
C.125:
16 37 64 43 15 175
15.0% 14.3% 12.6% 11.3% 16.1% 13.0%
91 222 442 338 78 1171
85.0% 85.7% 87.4% 88.7% 83.9% 87.0%
107 259 506 381 93 1346
100.0% 100.0% 100.0% 100.0% 100.0% 100.0%
Count
% within Primary Area Where Raised
Count
% within Primary Area Where Raised
Count
% within Primary Area Where Raised
Yes
No
Community Service/Volunteer in a foreign country : 4. Please tell us if you have participated in the following <b>extracurricular activities</b>.
Total
Rural/Farm Rural/No n-farm Urban Inner-city Other
Primary Area Where Raised
Total
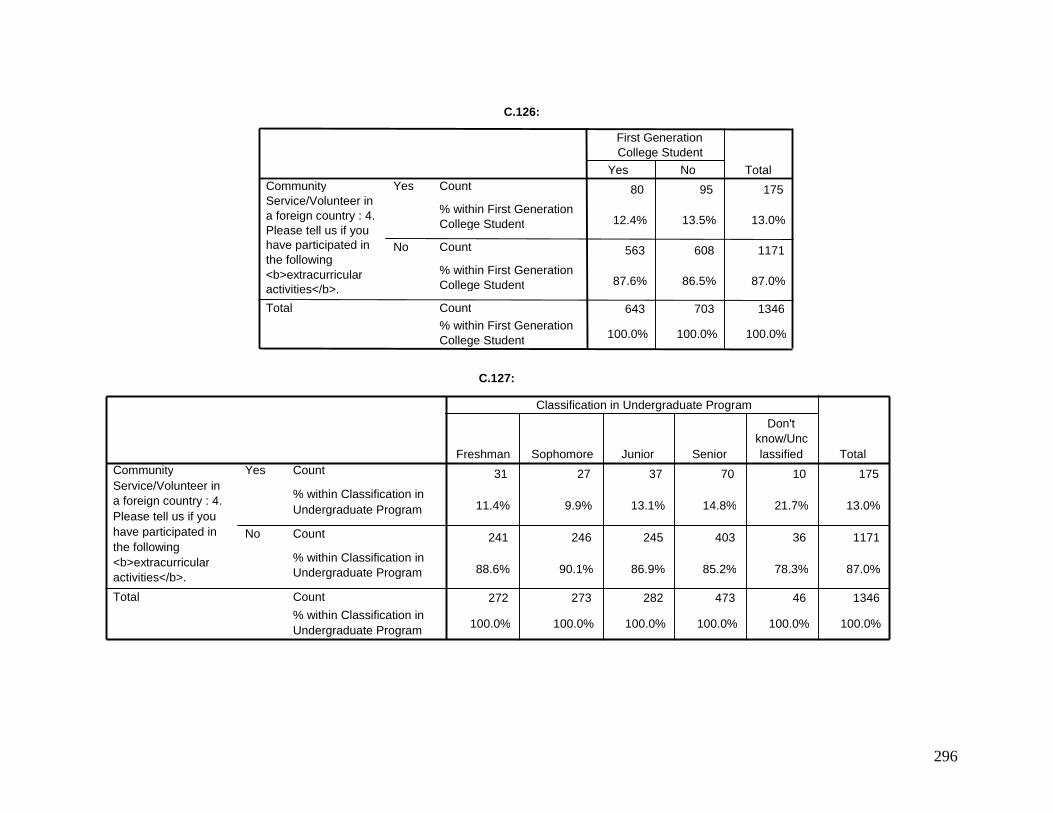
296
C.126:
80 95 175
12.4% 13.5% 13.0%
563 608 1171
87.6% 86.5% 87.0%
643 703 1346
100.0% 100.0% 100.0%
Count
% within First Generation College Student
Count
% within First Generation College Student
Count % within First Generation College Student
Yes
No
Community Service/Volunteer in a foreign country : 4. Please tell us if you have participated in the following <b>extracurricular activities</b>.
Total
Yes No
First Generation College Student
Total
C.127:
31 27 37 70 10 175
11.4% 9.9% 13.1% 14.8% 21.7% 13.0%
241 246 245 403 36 1171
88.6% 90.1% 86.9% 85.2% 78.3% 87.0%
272 273 282 473 46 1346
100.0% 100.0% 100.0% 100.0% 100.0% 100.0%
Count
% within Classification in Undergraduate Program
Count
% within Classification in Undergraduate Program
Count
% within Classification in Undergraduate Program
Yes
No
Community Service/Volunteer in a foreign country : 4. Please tell us if you have participated in the following <b>extracurricular activities</b>.
Total
Freshman Sophomore Junior Senior
Don't know/Unc lassified
Classification in Undergraduate Program
Total
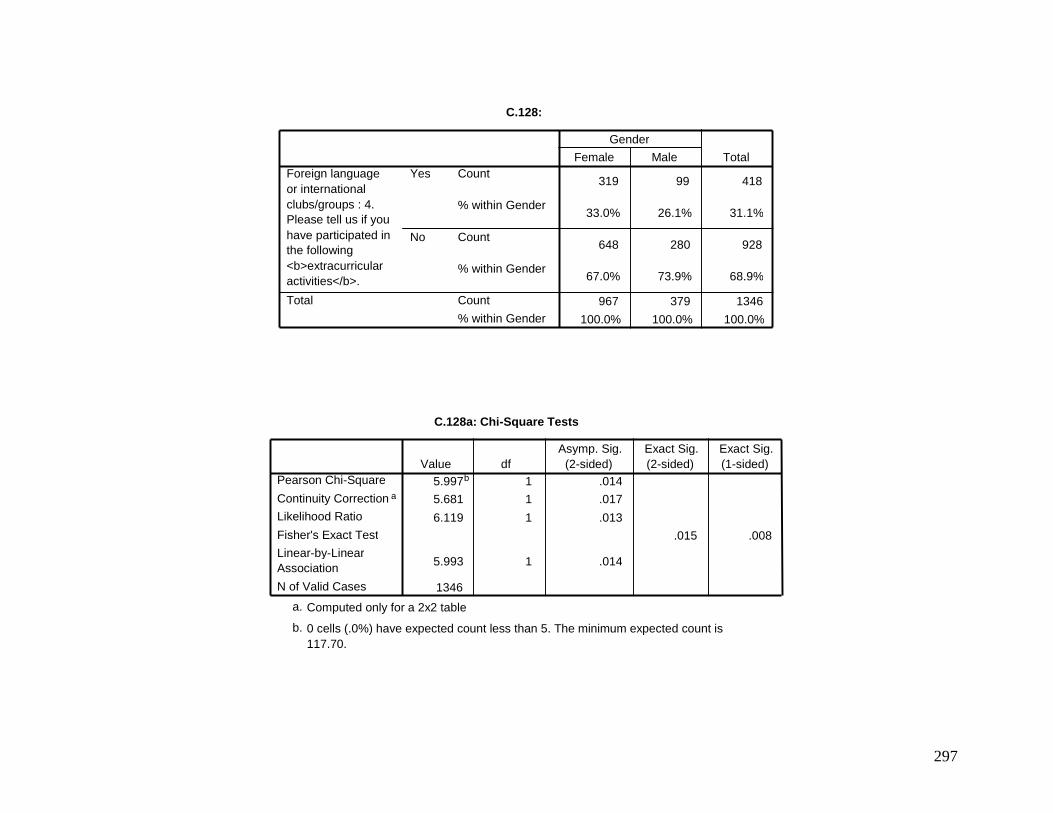
297
C.128:
319 99 418
33.0% 26.1% 31.1%
648 280 928
67.0% 73.9% 68.9%
967 379 1346
100.0% 100.0% 100.0%
Count
% within Gender
Count
% within Gender
Count
% within Gender
Yes
No
Foreign language or international clubs/groups : 4. Please tell us if you have participated in the following <b>extracurricular activities</b>.
Total
Female Male Gender
Total
C.128a: Chi-Square Tests
5.997 b 1 .014 5.681 1 .017
6.119 1 .013 .015 .008
5.993 1 .014
1346
Pearson Chi-Square
Continuity Correction a
Likelihood Ratio
Fisher's Exact Test Linear-by-Linear Association
N of Valid Cases
Value df Asymp. Sig.
(2-sided) Exact Sig. (2-sided)
Exact Sig. (1-sided)
Computed only for a 2x2 table a.
0 cells (.0%) have expected count less than 5. The minimum expected count is 117.70.
b.
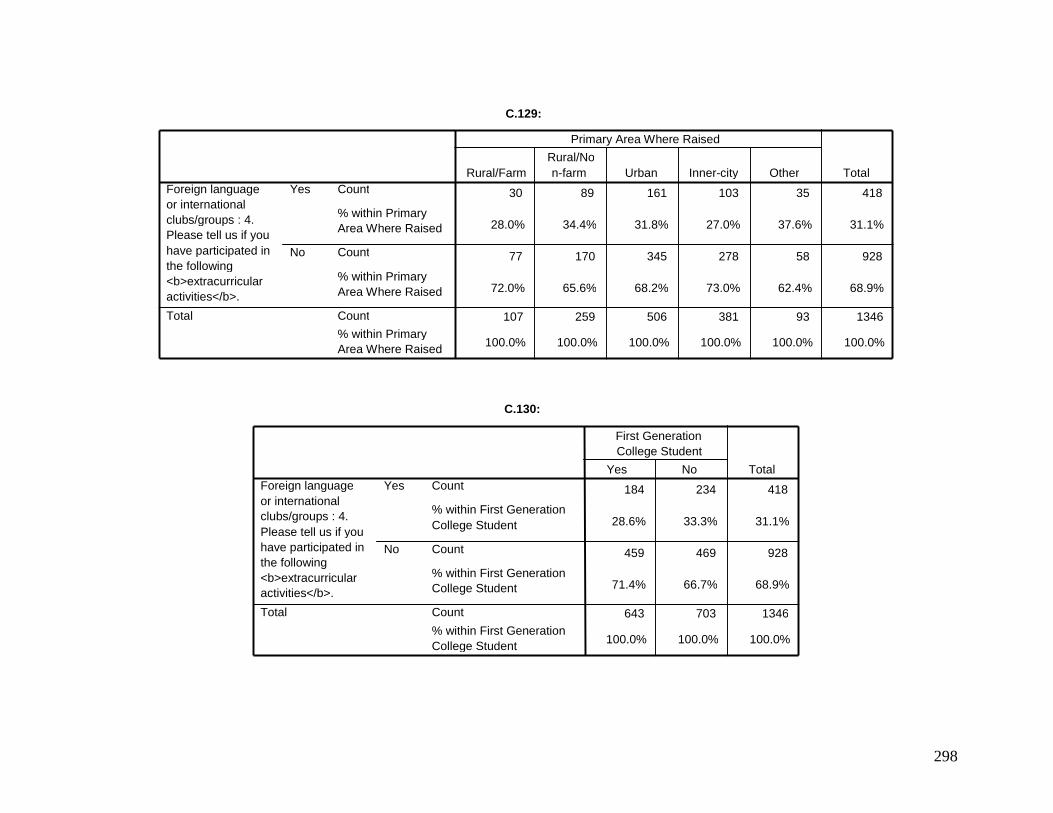
298
C.129:
30 89 161 103 35 418
28.0% 34.4% 31.8% 27.0% 37.6% 31.1%
77 170 345 278 58 928
72.0% 65.6% 68.2% 73.0% 62.4% 68.9%
107 259 506 381 93 1346
100.0% 100.0% 100.0% 100.0% 100.0% 100.0%
Count
% within Primary Area Where Raised
Count
% within Primary Area Where Raised
Count
% within Primary Area Where Raised
Yes
No
Foreign language or international clubs/groups : 4. Please tell us if you have participated in the following <b>extracurricular activities</b>.
Total
Rural/Farm Rural/No n-farm Urban Inner-city Other
Primary Area Where Raised
Total
C.130:
184 234 418
28.6% 33.3% 31.1%
459 469 928
71.4% 66.7% 68.9%
643 703 1346
100.0% 100.0% 100.0%
Count
% within First Generation College Student
Count
% within First Generation College Student
Count
% within First Generation College Student
Yes
No
Foreign language or international clubs/groups : 4. Please tell us if you have participated in the following <b>extracurricular activities</b>.
Total
Yes No
First Generation College Student
Total
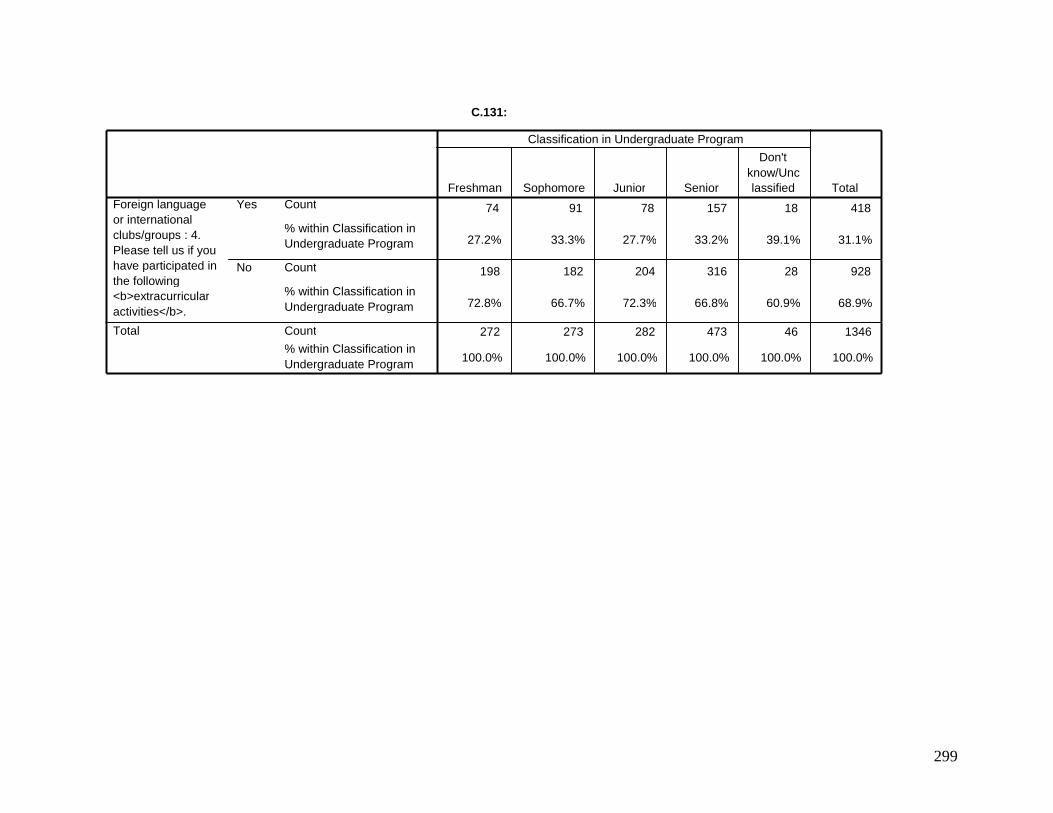
299
C.131:
74 91 78 157 18 418
27.2% 33.3% 27.7% 33.2% 39.1% 31.1%
198 182 204 316 28 928
72.8% 66.7% 72.3% 66.8% 60.9% 68.9%
272 273 282 473 46 1346
100.0% 100.0% 100.0% 100.0% 100.0% 100.0%
Count
% within Classification in Undergraduate Program
Count
% within Classification in Undergraduate Program
Count % within Classification in Undergraduate Program
Yes
No
Foreign language or international clubs/groups : 4. Please tell us if you have participated in the following <b>extracurricular activities</b>.
Total
Freshman Sophomore Junior Senior
Don't know/Unc lassified
Classification in Undergraduate Program
Total
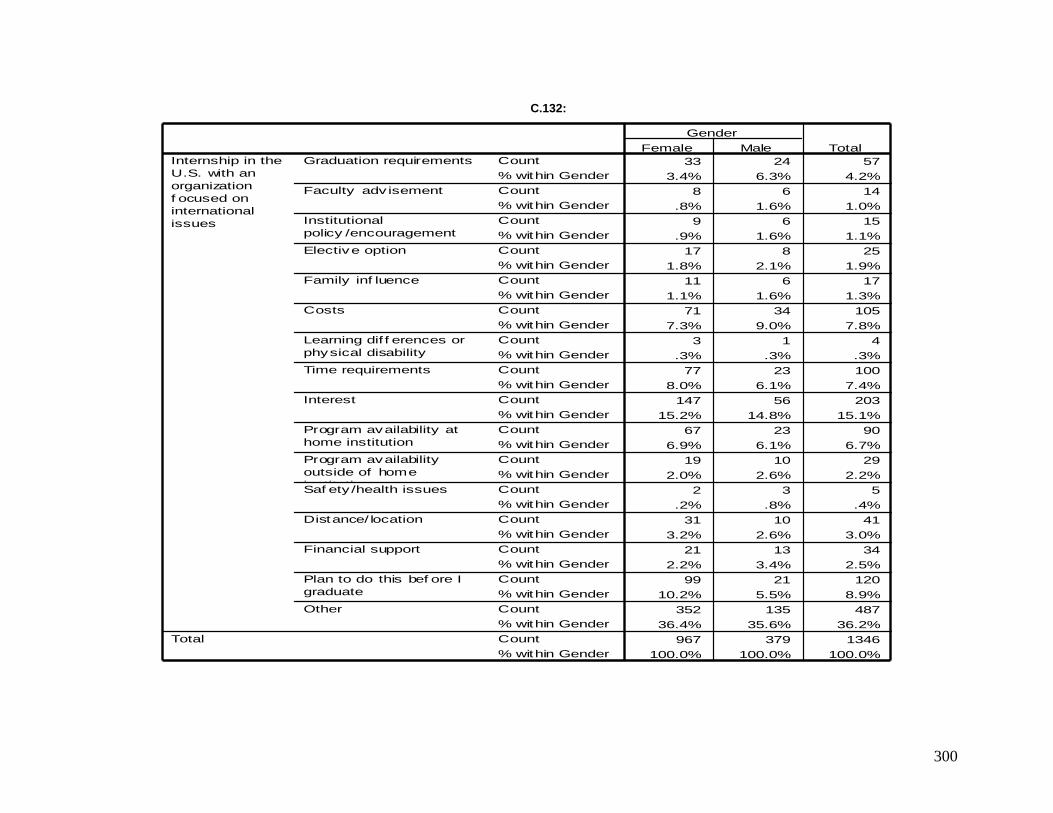
300
Crosstab
33 24 57
3.4% 6.3% 4.2%
8 6 14
.8% 1.6% 1.0%
9 6 15
.9% 1.6% 1.1%
17 8 25
1.8% 2.1% 1.9%
11 6 17
1.1% 1.6% 1.3%
71 34 105
7.3% 9.0% 7.8%
3 1 4
.3% .3% .3%
77 23 100
8.0% 6.1% 7.4%
147 56 203
15.2% 14.8% 15.1%
67 23 90
6.9% 6.1% 6.7%
19 10 29
2.0% 2.6% 2.2%
2 3 5
.2% .8% .4%
31 10 41
3.2% 2.6% 3.0%
21 13 34
2.2% 3.4% 2.5%
99 21 120
10.2% 5.5% 8.9%
352 135 487
36.4% 35.6% 36.2%
967 379 1346
100.0% 100.0% 100.0%
Count
% within Gender
Count
% within Gender
Count
% within Gender
Count
% within Gender
Count
% within Gender
Count
% within Gender
Count
% within Gender
Count
% within Gender
Count
% within Gender
Count
% within Gender
Count
% within Gender
Count
% within Gender
Count
% within Gender
Count
% within Gender
Count
% within Gender
Count
% within Gender
Count
% within Gender
Graduation requirements
Faculty adv isement
Institutional
policy /encouragement
Elective option
Family inf luence
Costs
Learning dif f erences or
physical disability
Time requirements
Interest
Program availability at
home institution
Program availability
outside of home
institutionSaf ety /health issues
Distance/ location
Financial support
Plan to do this bef ore I
graduate
Other
Internship in the
U.S. with an
organization
f ocused on
international
issues
Total
Female Male
Gender
Total
C.132:
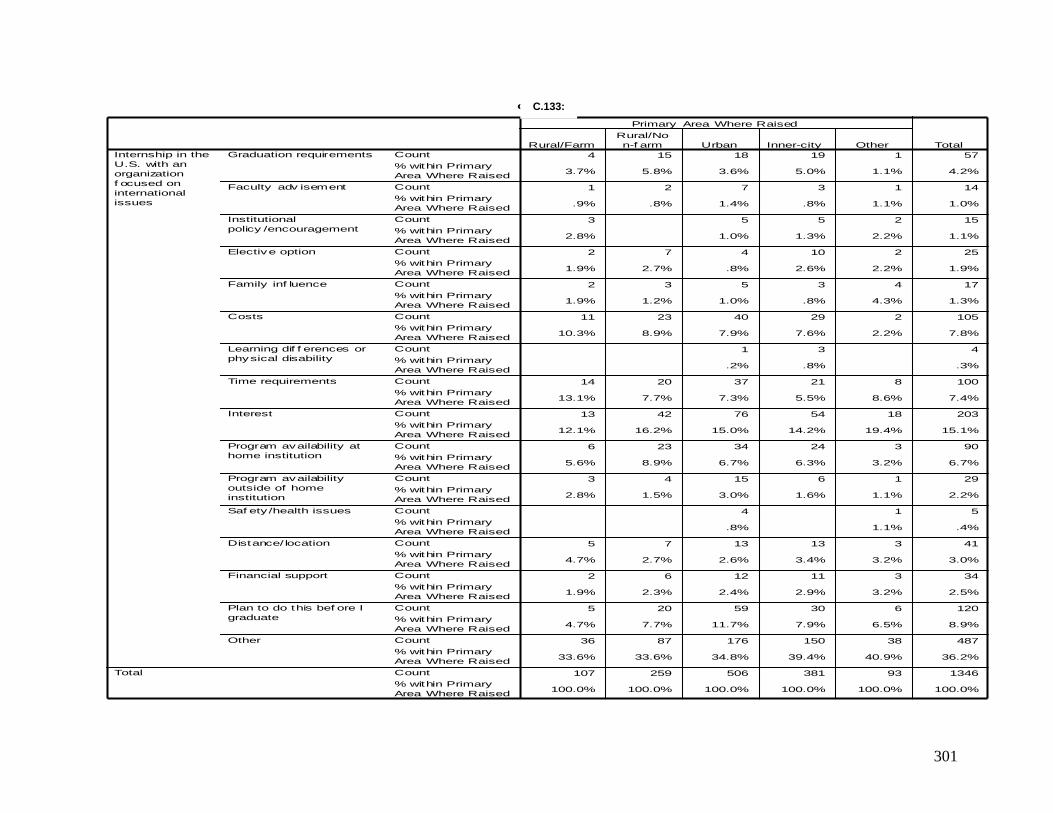
301
Crosstab
4 15 18 19 1 57
3.7% 5.8% 3.6% 5.0% 1.1% 4.2%
1 2 7 3 1 14
.9% .8% 1.4% .8% 1.1% 1.0%
3 5 5 2 15
2.8% 1.0% 1.3% 2.2% 1.1%
2 7 4 10 2 25
1.9% 2.7% .8% 2.6% 2.2% 1.9%
2 3 5 3 4 17
1.9% 1.2% 1.0% .8% 4.3% 1.3%
11 23 40 29 2 105
10.3% 8.9% 7.9% 7.6% 2.2% 7.8%
1 3 4
.2% .8% .3%
14 20 37 21 8 100
13.1% 7.7% 7.3% 5.5% 8.6% 7.4%
13 42 76 54 18 203
12.1% 16.2% 15.0% 14.2% 19.4% 15.1%
6 23 34 24 3 90
5.6% 8.9% 6.7% 6.3% 3.2% 6.7%
3 4 15 6 1 29
2.8% 1.5% 3.0% 1.6% 1.1% 2.2%
4 1 5
.8% 1.1% .4%
5 7 13 13 3 41
4.7% 2.7% 2.6% 3.4% 3.2% 3.0%
2 6 12 11 3 34
1.9% 2.3% 2.4% 2.9% 3.2% 2.5%
5 20 59 30 6 120
4.7% 7.7% 11.7% 7.9% 6.5% 8.9%
36 87 176 150 38 487
33.6% 33.6% 34.8% 39.4% 40.9% 36.2%
107 259 506 381 93 1346
100.0% 100.0% 100.0% 100.0% 100.0% 100.0%
Count
% within Primary
Area Where Raised
Count
% within Primary
Area Where Raised
Count
% within Primary
Area Where Raised
Count
% within Primary
Area Where Raised
Count
% within Primary
Area Where Raised
Count
% within Primary
Area Where Raised
Count
% within Primary
Area Where Raised
Count
% within Primary
Area Where Raised
Count
% within Primary
Area Where Raised
Count
% within Primary
Area Where Raised
Count
% within Primary
Area Where Raised
Count
% within Primary
Area Where Raised
Count
% within Primary
Area Where Raised
Count
% within Primary
Area Where Raised
Count
% within Primary
Area Where Raised
Count
% within Primary
Area Where Raised
Count
% within Primary
Area Where Raised
Graduation requirements
Faculty adv isement
Institutional
policy /encouragement
Elective option
Family inf luence
Costs
Learning dif f erences or
physical disability
Time requirements
Interest
Program availability at
home institution
Program availability
outside of home
institution
Saf ety /health issues
Distance/ location
Financial support
Plan to do this bef ore I
graduate
Other
Internship in the
U.S. with an
organization
f ocused on
international
issues
Total
Rural/Farm
Rural/No
n-f arm Urban Inner-city Other
Primary Area Where Raised
Total
C.133:

302
Crosstab
28 29 57
4.4% 4.1% 4.2%
3 11 14
.5% 1.6% 1.0%
6 9 15
.9% 1.3% 1.1%
14 11 25
2.2% 1.6% 1.9%
10 7 17
1.6% 1.0% 1.3%
52 53 105
8.1% 7.5% 7.8%
1 3 4
.2% .4% .3%
50 50 100
7.8% 7.1% 7.4%
93 110 203
14.5% 15.6% 15.1%
41 49 90
6.4% 7.0% 6.7%
13 16 29
2.0% 2.3% 2.2%
2 3 5
.3% .4% .4%
22 19 41
3.4% 2.7% 3.0%
19 15 34
3.0% 2.1% 2.5%
61 59 120
9.5% 8.4% 8.9%
228 259 487
35.5% 36.8% 36.2%
643 703 1346
100.0% 100.0% 100.0%
Count
% within First Generation
College Student
Count
% within First Generation
College Student
Count
% within First Generation
College Student
Count
% within First Generation
College Student
Count
% within First Generation
College Student
Count
% within First Generation
College Student
Count
% within First Generation
College Student
Count
% within First Generation
College Student
Count
% within First Generation
College Student
Count
% within First Generation
College Student
Count
% within First Generation
College Student
Count
% within First Generation
College Student
Count
% within First Generation
College Student
Count
% within First Generation
College Student
Count
% within First Generation
College Student
Count
% within First Generation
College Student
Count
% within First Generation
College Student
Graduation requirements
Faculty adv isement
Institutional
policy /encouragement
Elective option
Family inf luence
Costs
Learning dif f erences or
physical disability
Time requirements
Interest
Program availability at
home institution
Program availability
outside of home
institution
Saf ety /health issues
Distance/ location
Financial support
Plan to do this bef ore I
graduate
Other
Internship in the
U.S. with an
organization
f ocused on
international
issues
Total
Yes No
First Generation
College Student
Total
C.133:
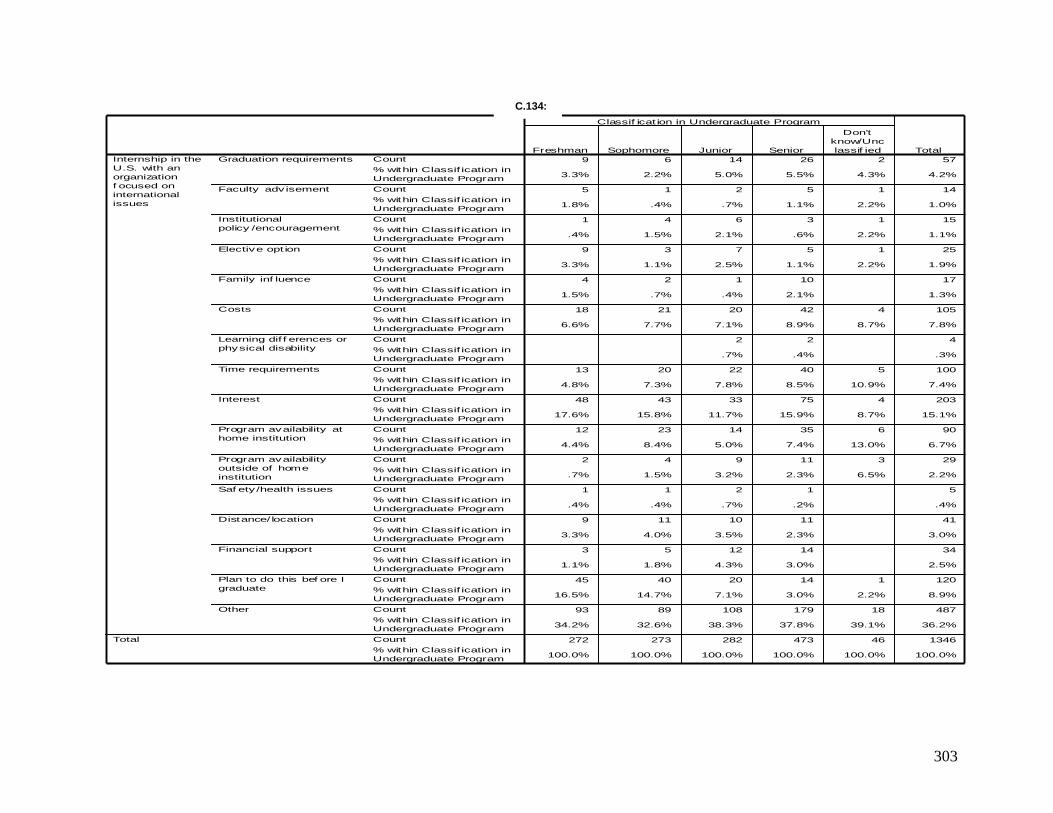
303
Crosstab
9 6 14 26 2 57
3.3% 2.2% 5.0% 5.5% 4.3% 4.2%
5 1 2 5 1 14
1.8% .4% .7% 1.1% 2.2% 1.0%
1 4 6 3 1 15
.4% 1.5% 2.1% .6% 2.2% 1.1%
9 3 7 5 1 25
3.3% 1.1% 2.5% 1.1% 2.2% 1.9%
4 2 1 10 17
1.5% .7% .4% 2.1% 1.3%
18 21 20 42 4 105
6.6% 7.7% 7.1% 8.9% 8.7% 7.8%
2 2 4
.7% .4% .3%
13 20 22 40 5 100
4.8% 7.3% 7.8% 8.5% 10.9% 7.4%
48 43 33 75 4 203
17.6% 15.8% 11.7% 15.9% 8.7% 15.1%
12 23 14 35 6 90
4.4% 8.4% 5.0% 7.4% 13.0% 6.7%
2 4 9 11 3 29
.7% 1.5% 3.2% 2.3% 6.5% 2.2%
1 1 2 1 5
.4% .4% .7% .2% .4%
9 11 10 11 41
3.3% 4.0% 3.5% 2.3% 3.0%
3 5 12 14 34
1.1% 1.8% 4.3% 3.0% 2.5%
45 40 20 14 1 120
16.5% 14.7% 7.1% 3.0% 2.2% 8.9%
93 89 108 179 18 487
34.2% 32.6% 38.3% 37.8% 39.1% 36.2%
272 273 282 473 46 1346
100.0% 100.0% 100.0% 100.0% 100.0% 100.0%
Count
% within Classif ication in
Undergraduate Program
Count
% within Classif ication in
Undergraduate Program
Count
% within Classif ication in
Undergraduate Program
Count
% within Classif ication in
Undergraduate Program
Count
% within Classif ication in
Undergraduate Program
Count
% within Classif ication in
Undergraduate Program
Count
% within Classif ication in
Undergraduate Program
Count
% within Classif ication in
Undergraduate Program
Count
% within Classif ication in
Undergraduate Program
Count
% within Classif ication in
Undergraduate Program
Count
% within Classif ication in
Undergraduate Program
Count
% within Classif ication in
Undergraduate Program
Count
% within Classif ication in
Undergraduate Program
Count
% within Classif ication in
Undergraduate Program
Count
% within Classif ication in
Undergraduate Program
Count
% within Classif ication in
Undergraduate Program
Count
% within Classif ication in
Undergraduate Program
Graduation requirements
Faculty adv isement
Institutional
policy /encouragement
Elective opt ion
Family inf luence
Costs
Learning dif f erences or
physical disability
Time requirements
Interest
Program availability at
home institution
Program availability
outside of home
institution
Saf ety /health issues
Distance/ location
Financial support
Plan to do this bef ore I
graduate
Other
Internship in the
U.S. with an
organization
f ocused on
international
issues
Total
Freshman Sophomore Junior Senior
Don't
know/Unc
lassif ied
Classif icat ion in Undergraduate Program
Total
C.134:
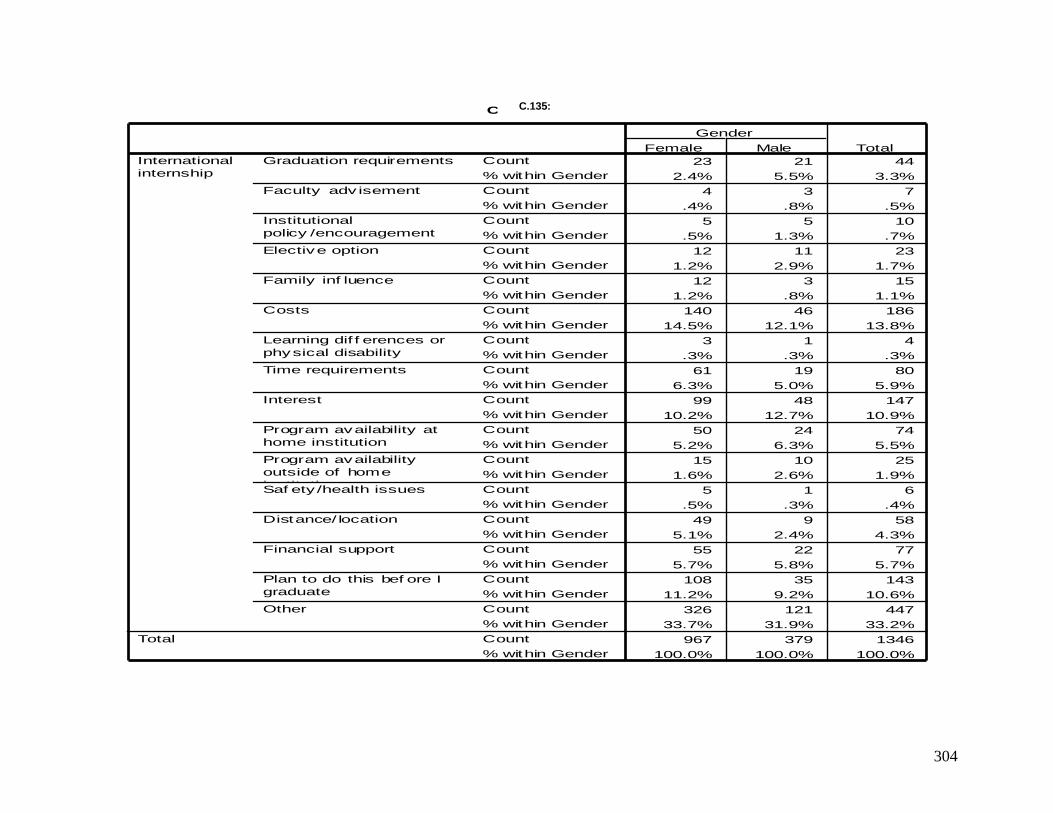
304
Crosstab
23 21 44
2.4% 5.5% 3.3%
4 3 7
.4% .8% .5%
5 5 10
.5% 1.3% .7%
12 11 23
1.2% 2.9% 1.7%
12 3 15
1.2% .8% 1.1%
140 46 186
14.5% 12.1% 13.8%
3 1 4
.3% .3% .3%
61 19 80
6.3% 5.0% 5.9%
99 48 147
10.2% 12.7% 10.9%
50 24 74
5.2% 6.3% 5.5%
15 10 25
1.6% 2.6% 1.9%
5 1 6
.5% .3% .4%
49 9 58
5.1% 2.4% 4.3%
55 22 77
5.7% 5.8% 5.7%
108 35 143
11.2% 9.2% 10.6%
326 121 447
33.7% 31.9% 33.2%
967 379 1346
100.0% 100.0% 100.0%
Count
% within Gender
Count
% within Gender
Count
% within Gender
Count
% within Gender
Count
% within Gender
Count
% within Gender
Count
% within Gender
Count
% within Gender
Count
% within Gender
Count
% within Gender
Count
% within Gender
Count
% within Gender
Count
% within Gender
Count
% within Gender
Count
% within Gender
Count
% within Gender
Count
% within Gender
Graduation requirements
Faculty adv isement
Institutional
policy /encouragement
Elective option
Family inf luence
Costs
Learning dif f erences or
physical disability
Time requirements
Interest
Program availability at
home institution
Program availability
outside of home
institutionSaf ety /health issues
Distance/ location
Financial support
Plan to do this bef ore I
graduate
Other
International
internship
Total
Female Male
Gender
Total
C.135:
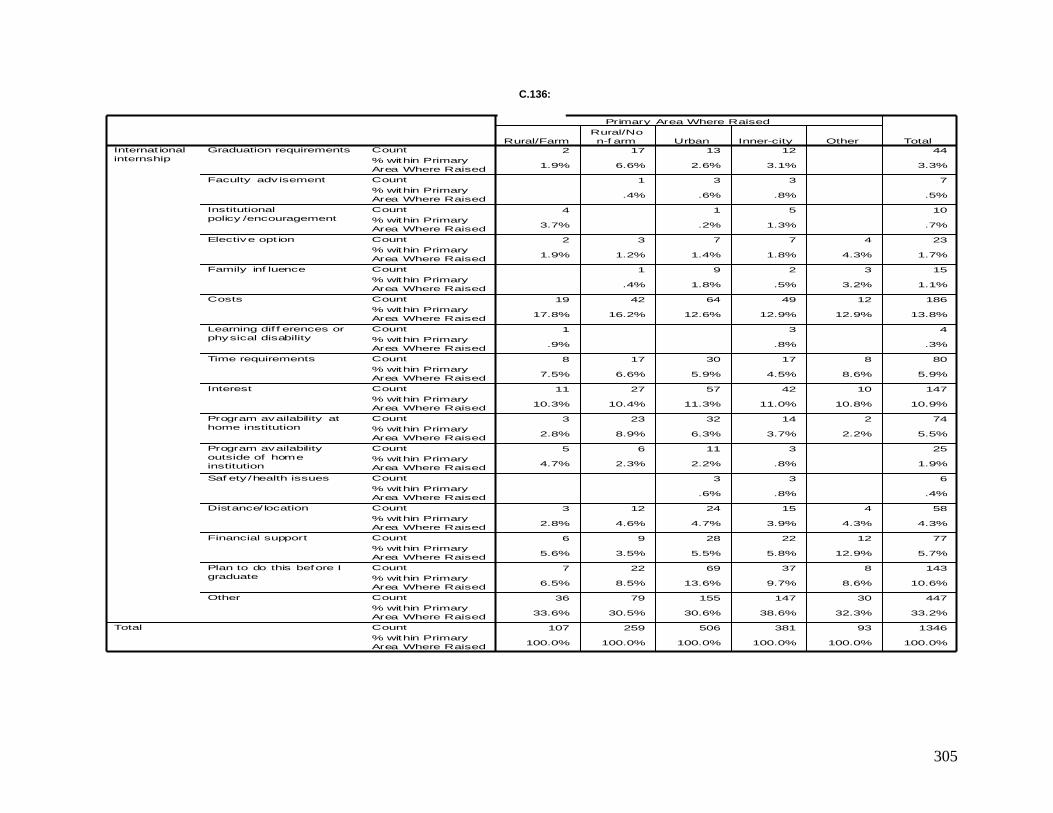
305
Crosstab
2 17 13 12 44
1.9% 6.6% 2.6% 3.1% 3.3%
1 3 3 7
.4% .6% .8% .5%
4 1 5 10
3.7% .2% 1.3% .7%
2 3 7 7 4 23
1.9% 1.2% 1.4% 1.8% 4.3% 1.7%
1 9 2 3 15
.4% 1.8% .5% 3.2% 1.1%
19 42 64 49 12 186
17.8% 16.2% 12.6% 12.9% 12.9% 13.8%
1 3 4
.9% .8% .3%
8 17 30 17 8 80
7.5% 6.6% 5.9% 4.5% 8.6% 5.9%
11 27 57 42 10 147
10.3% 10.4% 11.3% 11.0% 10.8% 10.9%
3 23 32 14 2 74
2.8% 8.9% 6.3% 3.7% 2.2% 5.5%
5 6 11 3 25
4.7% 2.3% 2.2% .8% 1.9%
3 3 6
.6% .8% .4%
3 12 24 15 4 58
2.8% 4.6% 4.7% 3.9% 4.3% 4.3%
6 9 28 22 12 77
5.6% 3.5% 5.5% 5.8% 12.9% 5.7%
7 22 69 37 8 143
6.5% 8.5% 13.6% 9.7% 8.6% 10.6%
36 79 155 147 30 447
33.6% 30.5% 30.6% 38.6% 32.3% 33.2%
107 259 506 381 93 1346
100.0% 100.0% 100.0% 100.0% 100.0% 100.0%
Count
% within Primary
Area Where Raised
Count
% within Primary
Area Where Raised
Count
% within Primary
Area Where Raised
Count
% within Primary
Area Where Raised
Count
% within Primary
Area Where Raised
Count
% within Primary
Area Where Raised
Count
% within Primary
Area Where Raised
Count
% within Primary
Area Where Raised
Count
% within Primary
Area Where Raised
Count
% within Primary
Area Where Raised
Count
% within Primary
Area Where Raised
Count
% within Primary
Area Where Raised
Count
% within Primary
Area Where Raised
Count
% within Primary
Area Where Raised
Count
% within Primary
Area Where Raised
Count
% within Primary
Area Where Raised
Count
% within Primary
Area Where Raised
Graduation requirements
Faculty adv isement
Institutional
policy /encouragement
Elective opt ion
Family inf luence
Costs
Learning dif f erences or
physical disability
Time requirements
Interest
Program availability at
home institution
Program availability
outside of home
institution
Saf ety /health issues
Distance/ location
Financial support
Plan to do this before I
graduate
Other
Internat ional
internship
Total
Rural/Farm
Rural/No
n-f arm Urban Inner-city Other
Primary Area Where Raised
Total
C.136:
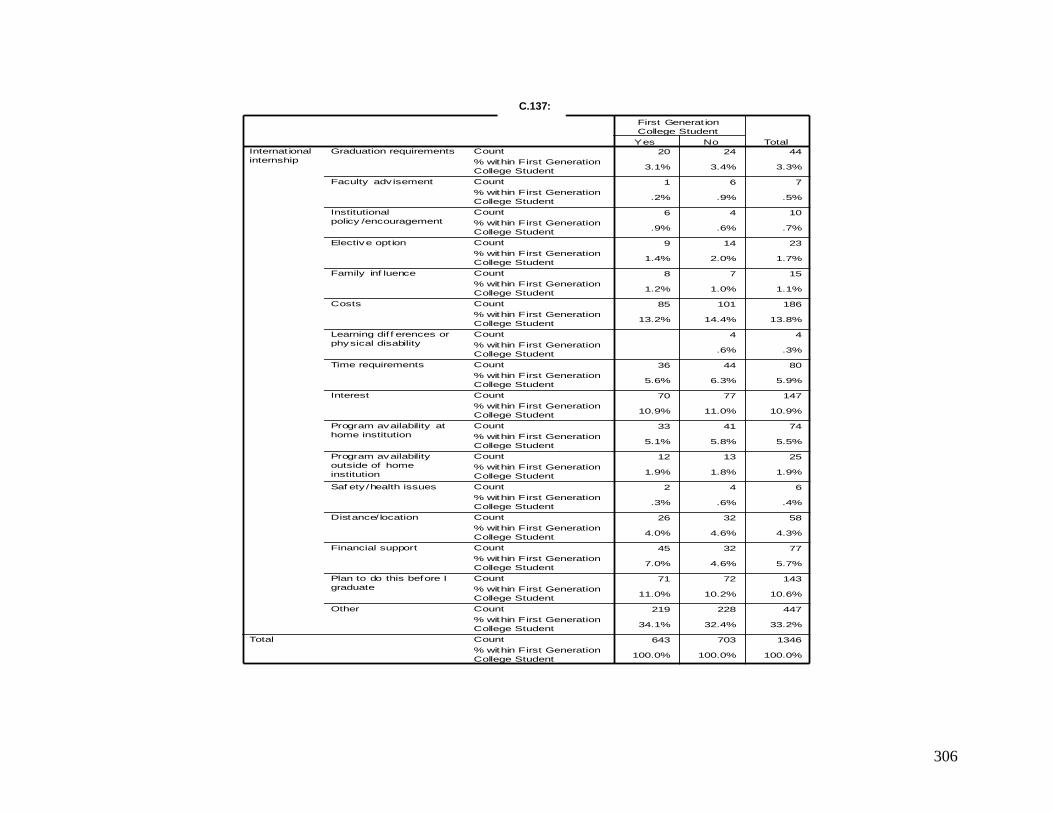
306
Crosstab
20 24 44
3.1% 3.4% 3.3%
1 6 7
.2% .9% .5%
6 4 10
.9% .6% .7%
9 14 23
1.4% 2.0% 1.7%
8 7 15
1.2% 1.0% 1.1%
85 101 186
13.2% 14.4% 13.8%
4 4
.6% .3%
36 44 80
5.6% 6.3% 5.9%
70 77 147
10.9% 11.0% 10.9%
33 41 74
5.1% 5.8% 5.5%
12 13 25
1.9% 1.8% 1.9%
2 4 6
.3% .6% .4%
26 32 58
4.0% 4.6% 4.3%
45 32 77
7.0% 4.6% 5.7%
71 72 143
11.0% 10.2% 10.6%
219 228 447
34.1% 32.4% 33.2%
643 703 1346
100.0% 100.0% 100.0%
Count
% within First Generation
College Student
Count
% within First Generation
College Student
Count
% within First Generation
College Student
Count
% within First Generation
College Student
Count
% within First Generation
College Student
Count
% within First Generation
College Student
Count
% within First Generation
College Student
Count
% within First Generation
College Student
Count
% within First Generation
College Student
Count
% within First Generation
College Student
Count
% within First Generation
College Student
Count
% within First Generation
College Student
Count
% within First Generation
College Student
Count
% within First Generation
College Student
Count
% within First Generation
College Student
Count
% within First Generation
College Student
Count
% within First Generation
College Student
Graduation requirements
Faculty adv isement
Institutional
policy /encouragement
Elective opt ion
Family inf luence
Costs
Learning dif f erences or
physical disability
Time requirements
Interest
Program availability at
home institution
Program availability
outside of home
institution
Saf ety /health issues
Distance/ location
Financial support
Plan to do this before I
graduate
Other
Internat ional
internship
Total
Yes No
First Generat ion
College Student
Total
C.137:
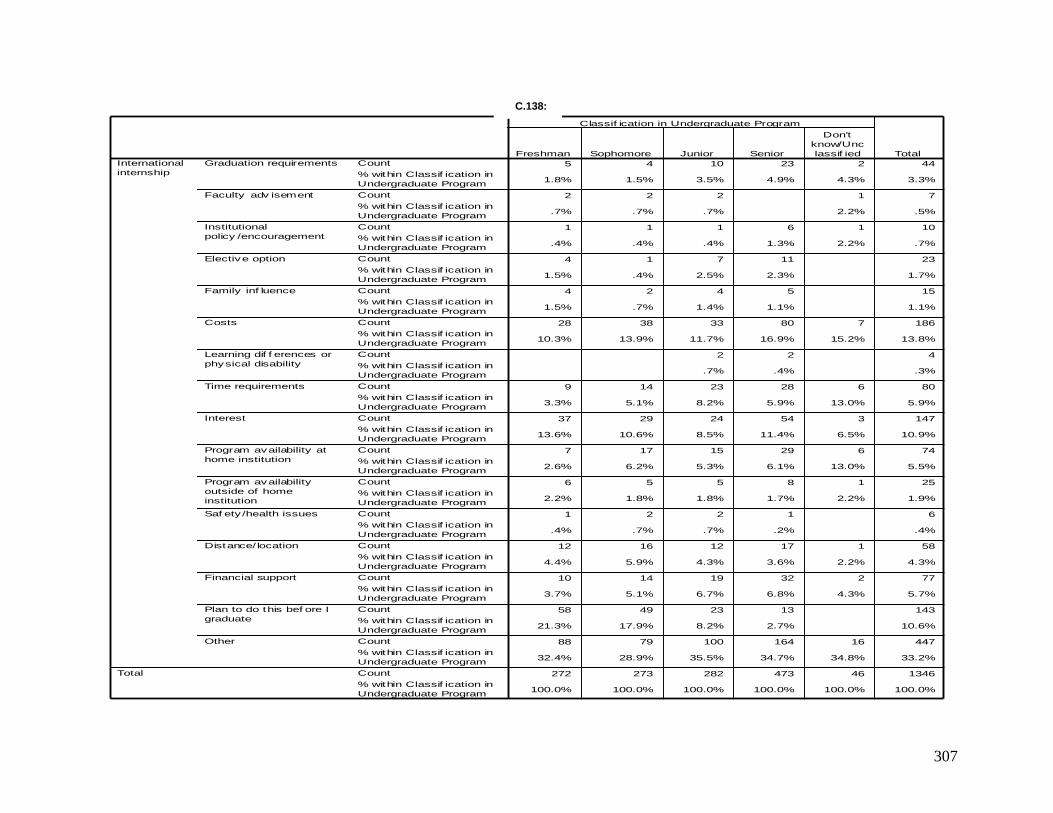
307
Crosstab
5 4 10 23 2 44
1.8% 1.5% 3.5% 4.9% 4.3% 3.3%
2 2 2 1 7
.7% .7% .7% 2.2% .5%
1 1 1 6 1 10
.4% .4% .4% 1.3% 2.2% .7%
4 1 7 11 23
1.5% .4% 2.5% 2.3% 1.7%
4 2 4 5 15
1.5% .7% 1.4% 1.1% 1.1%
28 38 33 80 7 186
10.3% 13.9% 11.7% 16.9% 15.2% 13.8%
2 2 4
.7% .4% .3%
9 14 23 28 6 80
3.3% 5.1% 8.2% 5.9% 13.0% 5.9%
37 29 24 54 3 147
13.6% 10.6% 8.5% 11.4% 6.5% 10.9%
7 17 15 29 6 74
2.6% 6.2% 5.3% 6.1% 13.0% 5.5%
6 5 5 8 1 25
2.2% 1.8% 1.8% 1.7% 2.2% 1.9%
1 2 2 1 6
.4% .7% .7% .2% .4%
12 16 12 17 1 58
4.4% 5.9% 4.3% 3.6% 2.2% 4.3%
10 14 19 32 2 77
3.7% 5.1% 6.7% 6.8% 4.3% 5.7%
58 49 23 13 143
21.3% 17.9% 8.2% 2.7% 10.6%
88 79 100 164 16 447
32.4% 28.9% 35.5% 34.7% 34.8% 33.2%
272 273 282 473 46 1346
100.0% 100.0% 100.0% 100.0% 100.0% 100.0%
Count
% within Classif ication in
Undergraduate Program
Count
% within Classif ication in
Undergraduate Program
Count
% within Classif ication in
Undergraduate Program
Count
% within Classif ication in
Undergraduate Program
Count
% within Classif ication in
Undergraduate Program
Count
% within Classif ication in
Undergraduate Program
Count
% within Classif ication in
Undergraduate Program
Count
% within Classif ication in
Undergraduate Program
Count
% within Classif ication in
Undergraduate Program
Count
% within Classif ication in
Undergraduate Program
Count
% within Classif ication in
Undergraduate Program
Count
% within Classif ication in
Undergraduate Program
Count
% within Classif ication in
Undergraduate Program
Count
% within Classif ication in
Undergraduate Program
Count
% within Classif ication in
Undergraduate Program
Count
% within Classif ication in
Undergraduate Program
Count
% within Classif ication in
Undergraduate Program
Graduation requirements
Faculty adv isement
Institutional
policy /encouragement
Elective option
Family inf luence
Costs
Learning dif f erences or
physical disability
Time requirements
Interest
Program availability at
home institution
Program availability
outside of home
institution
Saf ety /health issues
Distance/ location
Financial support
Plan to do this bef ore I
graduate
Other
International
internship
Total
Freshman Sophomore Junior Senior
Don't
know/Unc
lassif ied
Classif ication in Undergraduate Program
Total
C.138:
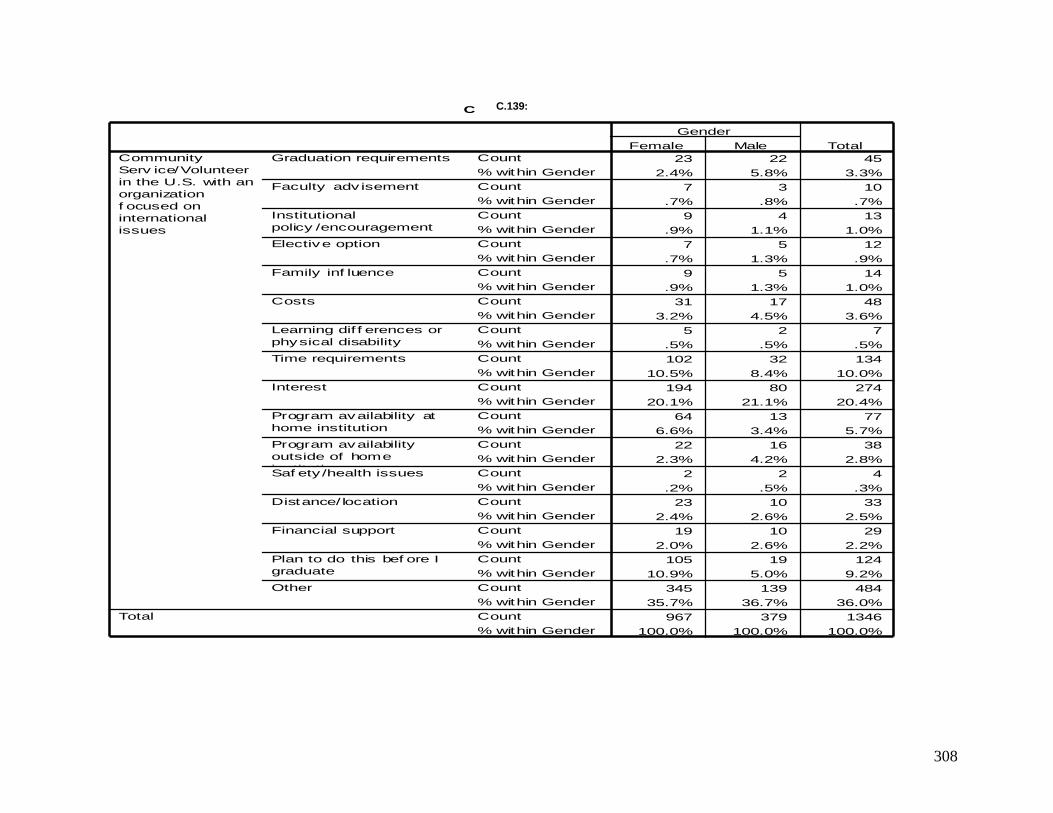
308
Crosstab
23 22 45
2.4% 5.8% 3.3%
7 3 10
.7% .8% .7%
9 4 13
.9% 1.1% 1.0%
7 5 12
.7% 1.3% .9%
9 5 14
.9% 1.3% 1.0%
31 17 48
3.2% 4.5% 3.6%
5 2 7
.5% .5% .5%
102 32 134
10.5% 8.4% 10.0%
194 80 274
20.1% 21.1% 20.4%
64 13 77
6.6% 3.4% 5.7%
22 16 38
2.3% 4.2% 2.8%
2 2 4
.2% .5% .3%
23 10 33
2.4% 2.6% 2.5%
19 10 29
2.0% 2.6% 2.2%
105 19 124
10.9% 5.0% 9.2%
345 139 484
35.7% 36.7% 36.0%
967 379 1346
100.0% 100.0% 100.0%
Count
% within Gender
Count
% within Gender
Count
% within Gender
Count
% within Gender
Count
% within Gender
Count
% within Gender
Count
% within Gender
Count
% within Gender
Count
% within Gender
Count
% within Gender
Count
% within Gender
Count
% within Gender
Count
% within Gender
Count
% within Gender
Count
% within Gender
Count
% within Gender
Count
% within Gender
Graduation requirements
Faculty adv isement
Institutional
policy /encouragement
Elective option
Family inf luence
Costs
Learning dif f erences or
physical disability
Time requirements
Interest
Program availability at
home institution
Program availability
outside of home
institutionSaf ety /health issues
Distance/ location
Financial support
Plan to do this bef ore I
graduate
Other
Community
Serv ice/Volunteer
in the U.S. with an
organization
f ocused on
international
issues
Total
Female Male
Gender
Total
C.139:
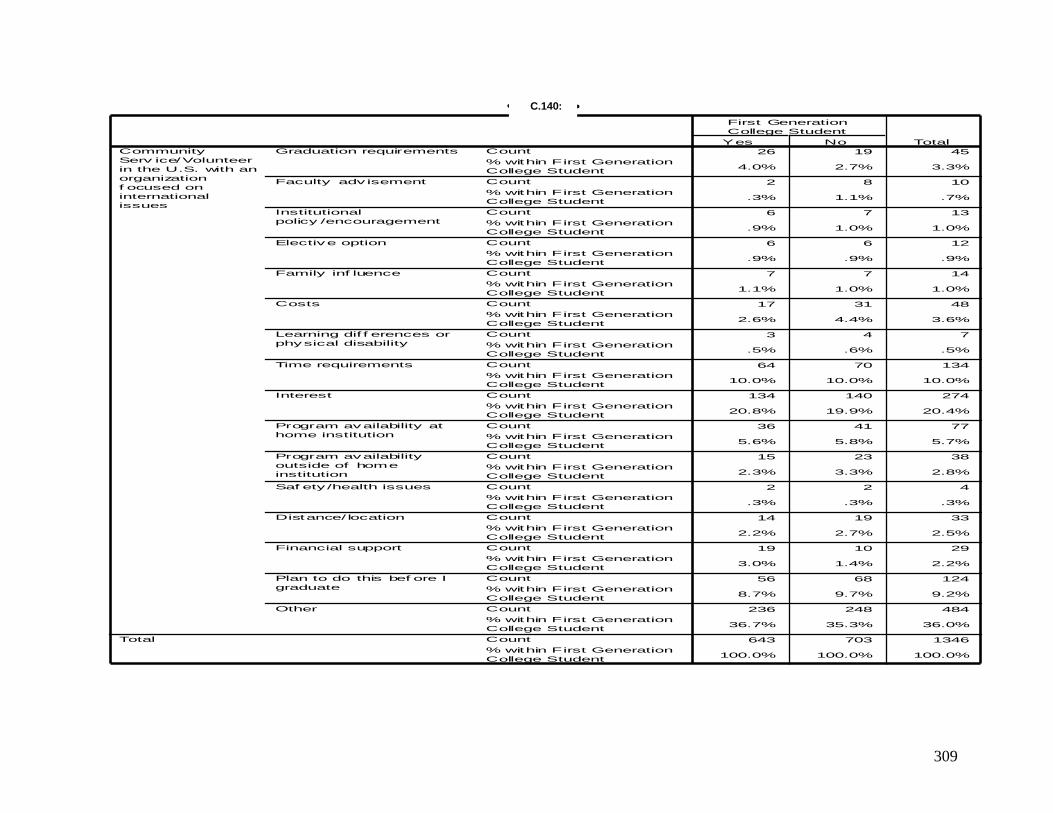
309
Crosstab
26 19 45
4.0% 2.7% 3.3%
2 8 10
.3% 1.1% .7%
6 7 13
.9% 1.0% 1.0%
6 6 12
.9% .9% .9%
7 7 14
1.1% 1.0% 1.0%
17 31 48
2.6% 4.4% 3.6%
3 4 7
.5% .6% .5%
64 70 134
10.0% 10.0% 10.0%
134 140 274
20.8% 19.9% 20.4%
36 41 77
5.6% 5.8% 5.7%
15 23 38
2.3% 3.3% 2.8%
2 2 4
.3% .3% .3%
14 19 33
2.2% 2.7% 2.5%
19 10 29
3.0% 1.4% 2.2%
56 68 124
8.7% 9.7% 9.2%
236 248 484
36.7% 35.3% 36.0%
643 703 1346
100.0% 100.0% 100.0%
Count
% within First Generation
College Student
Count
% within First Generation
College Student
Count
% within First Generation
College Student
Count
% within First Generation
College Student
Count
% within First Generation
College Student
Count
% within First Generation
College Student
Count
% within First Generation
College Student
Count
% within First Generation
College Student
Count
% within First Generation
College Student
Count
% within First Generation
College Student
Count
% within First Generation
College Student
Count
% within First Generation
College Student
Count
% within First Generation
College Student
Count
% within First Generation
College Student
Count
% within First Generation
College Student
Count
% within First Generation
College Student
Count
% within First Generation
College Student
Graduation requirements
Faculty adv isement
Institutional
policy /encouragement
Elective option
Family inf luence
Costs
Learning dif f erences or
physical disability
Time requirements
Interest
Program availability at
home institution
Program availability
outside of home
institution
Saf ety /health issues
Distance/ location
Financial support
Plan to do this bef ore I
graduate
Other
Community
Serv ice/Volunteer
in the U.S. with an
organization
f ocused on
international
issues
Total
Yes No
First Generation
College Student
Total
C.140:
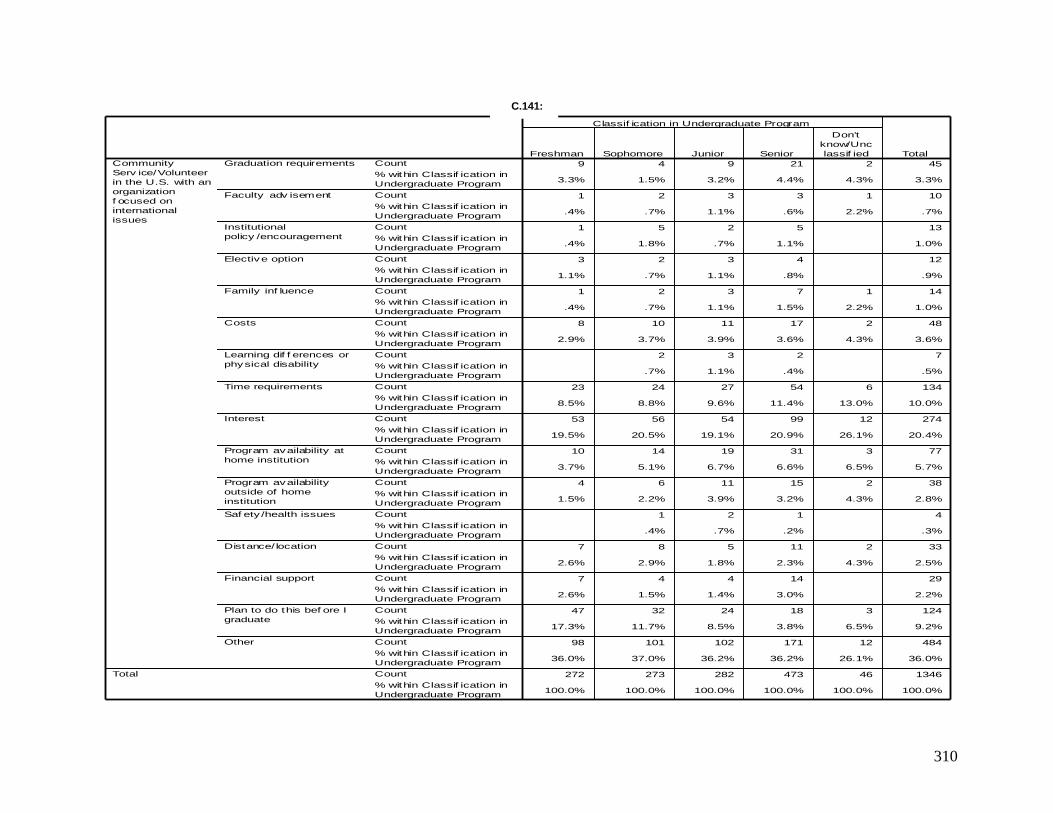
310
Crosstab
9 4 9 21 2 45
3.3% 1.5% 3.2% 4.4% 4.3% 3.3%
1 2 3 3 1 10
.4% .7% 1.1% .6% 2.2% .7%
1 5 2 5 13
.4% 1.8% .7% 1.1% 1.0%
3 2 3 4 12
1.1% .7% 1.1% .8% .9%
1 2 3 7 1 14
.4% .7% 1.1% 1.5% 2.2% 1.0%
8 10 11 17 2 48
2.9% 3.7% 3.9% 3.6% 4.3% 3.6%
2 3 2 7
.7% 1.1% .4% .5%
23 24 27 54 6 134
8.5% 8.8% 9.6% 11.4% 13.0% 10.0%
53 56 54 99 12 274
19.5% 20.5% 19.1% 20.9% 26.1% 20.4%
10 14 19 31 3 77
3.7% 5.1% 6.7% 6.6% 6.5% 5.7%
4 6 11 15 2 38
1.5% 2.2% 3.9% 3.2% 4.3% 2.8%
1 2 1 4
.4% .7% .2% .3%
7 8 5 11 2 33
2.6% 2.9% 1.8% 2.3% 4.3% 2.5%
7 4 4 14 29
2.6% 1.5% 1.4% 3.0% 2.2%
47 32 24 18 3 124
17.3% 11.7% 8.5% 3.8% 6.5% 9.2%
98 101 102 171 12 484
36.0% 37.0% 36.2% 36.2% 26.1% 36.0%
272 273 282 473 46 1346
100.0% 100.0% 100.0% 100.0% 100.0% 100.0%
Count
% within Classif ication in
Undergraduate Program
Count
% within Classif ication in
Undergraduate Program
Count
% within Classif ication in
Undergraduate Program
Count
% within Classif ication in
Undergraduate Program
Count
% within Classif ication in
Undergraduate Program
Count
% within Classif ication in
Undergraduate Program
Count
% within Classif ication in
Undergraduate Program
Count
% within Classif ication in
Undergraduate Program
Count
% within Classif ication in
Undergraduate Program
Count
% within Classif ication in
Undergraduate Program
Count
% within Classif ication in
Undergraduate Program
Count
% within Classif ication in
Undergraduate Program
Count
% within Classif ication in
Undergraduate Program
Count
% within Classif ication in
Undergraduate Program
Count
% within Classif ication in
Undergraduate Program
Count
% within Classif ication in
Undergraduate Program
Count
% within Classif ication in
Undergraduate Program
Graduation requirements
Faculty adv isement
Institutional
policy /encouragement
Elective option
Family inf luence
Costs
Learning dif f erences or
physical disability
Time requirements
Interest
Program availability at
home institution
Program availability
outside of home
institution
Saf ety /health issues
Distance/ location
Financial support
Plan to do this bef ore I
graduate
Other
Community
Serv ice/Volunteer
in the U.S. with an
organization
f ocused on
international
issues
Total
Freshman Sophomore Junior Senior
Don't
know/Unc
lassif ied
Classif ication in Undergraduate Program
Total
C.141:
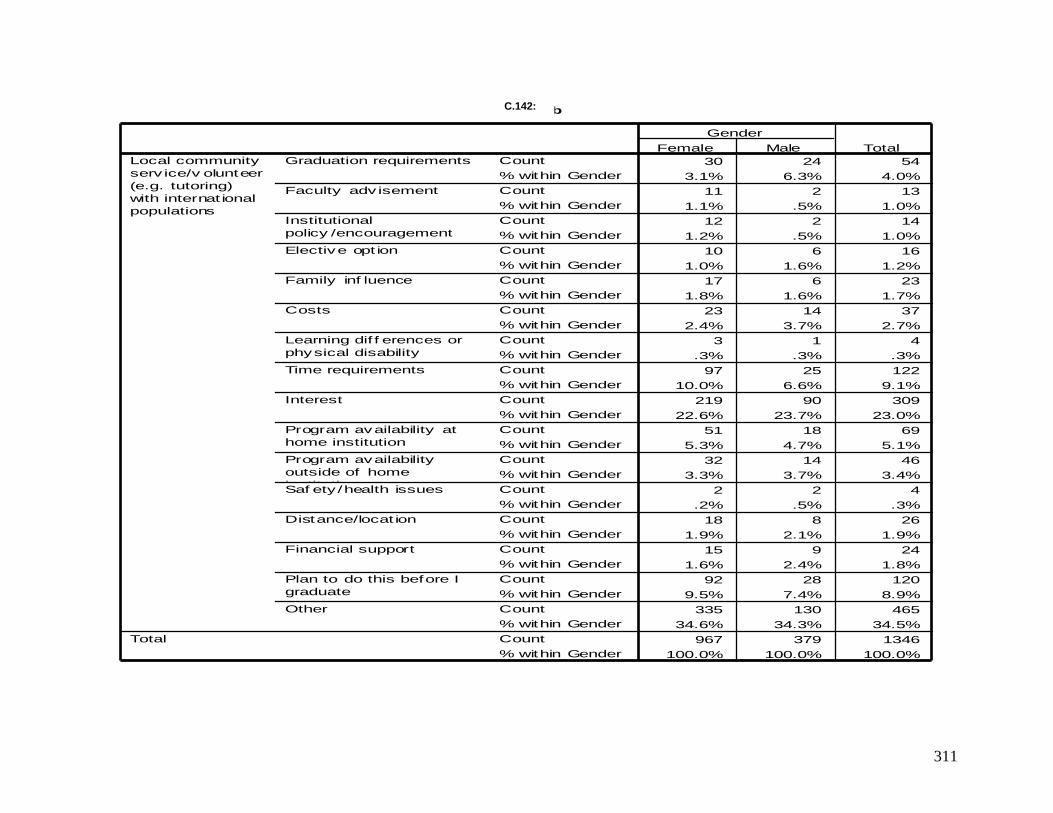
311
Crosstab
30 24 54
3.1% 6.3% 4.0%
11 2 13
1.1% .5% 1.0%
12 2 14
1.2% .5% 1.0%
10 6 16
1.0% 1.6% 1.2%
17 6 23
1.8% 1.6% 1.7%
23 14 37
2.4% 3.7% 2.7%
3 1 4
.3% .3% .3%
97 25 122
10.0% 6.6% 9.1%
219 90 309
22.6% 23.7% 23.0%
51 18 69
5.3% 4.7% 5.1%
32 14 46
3.3% 3.7% 3.4%
2 2 4
.2% .5% .3%
18 8 26
1.9% 2.1% 1.9%
15 9 24
1.6% 2.4% 1.8%
92 28 120
9.5% 7.4% 8.9%
335 130 465
34.6% 34.3% 34.5%
967 379 1346
100.0% 100.0% 100.0%
Count
% within Gender
Count
% within Gender
Count
% within Gender
Count
% within Gender
Count
% within Gender
Count
% within Gender
Count
% within Gender
Count
% within Gender
Count
% within Gender
Count
% within Gender
Count
% within Gender
Count
% within Gender
Count
% within Gender
Count
% within Gender
Count
% within Gender
Count
% within Gender
Count
% within Gender
Graduation requirements
Faculty adv isement
Institutional
policy /encouragement
Elective opt ion
Family inf luence
Costs
Learning dif f erences or
physical disability
Time requirements
Interest
Program availability at
home institution
Program availability
outside of home
institutionSaf ety /health issues
Distance/locat ion
Financial support
Plan to do this before I
graduate
Other
Local community
serv ice/v olunteer
(e.g. tutoring)
with internat ional
populations
Total
Female Male
Gender
Total
C.142:
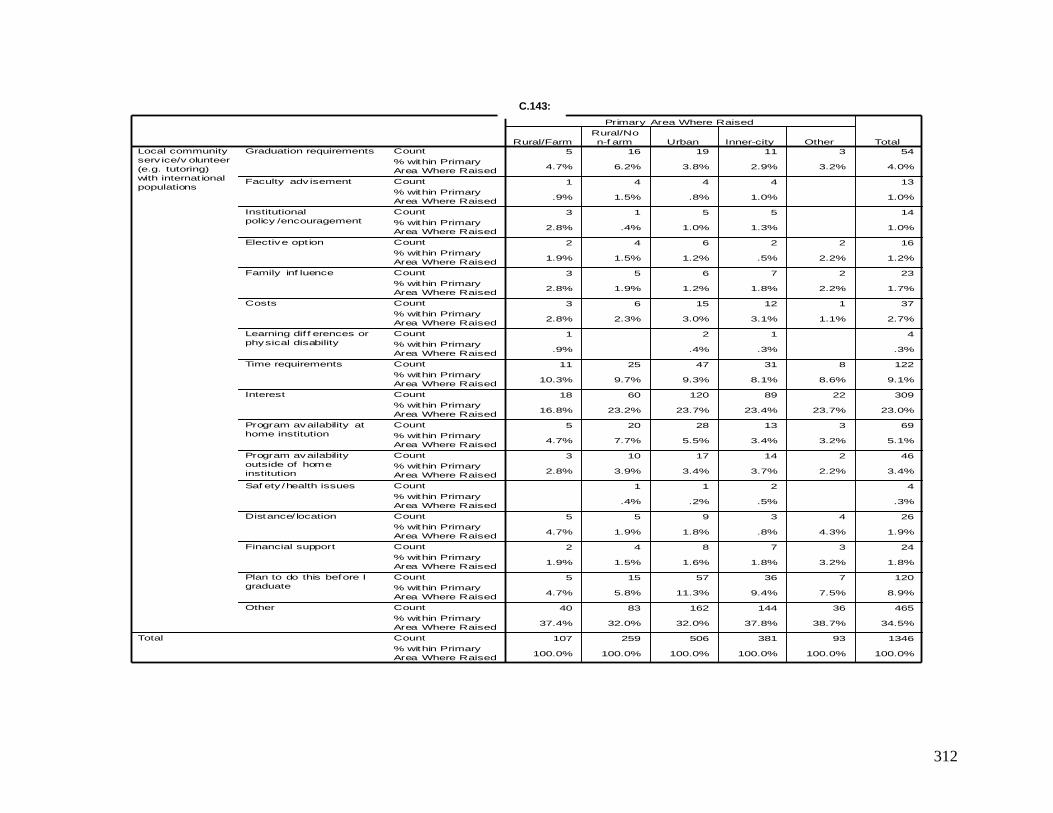
312
Crosstab
5 16 19 11 3 54
4.7% 6.2% 3.8% 2.9% 3.2% 4.0%
1 4 4 4 13
.9% 1.5% .8% 1.0% 1.0%
3 1 5 5 14
2.8% .4% 1.0% 1.3% 1.0%
2 4 6 2 2 16
1.9% 1.5% 1.2% .5% 2.2% 1.2%
3 5 6 7 2 23
2.8% 1.9% 1.2% 1.8% 2.2% 1.7%
3 6 15 12 1 37
2.8% 2.3% 3.0% 3.1% 1.1% 2.7%
1 2 1 4
.9% .4% .3% .3%
11 25 47 31 8 122
10.3% 9.7% 9.3% 8.1% 8.6% 9.1%
18 60 120 89 22 309
16.8% 23.2% 23.7% 23.4% 23.7% 23.0%
5 20 28 13 3 69
4.7% 7.7% 5.5% 3.4% 3.2% 5.1%
3 10 17 14 2 46
2.8% 3.9% 3.4% 3.7% 2.2% 3.4%
1 1 2 4
.4% .2% .5% .3%
5 5 9 3 4 26
4.7% 1.9% 1.8% .8% 4.3% 1.9%
2 4 8 7 3 24
1.9% 1.5% 1.6% 1.8% 3.2% 1.8%
5 15 57 36 7 120
4.7% 5.8% 11.3% 9.4% 7.5% 8.9%
40 83 162 144 36 465
37.4% 32.0% 32.0% 37.8% 38.7% 34.5%
107 259 506 381 93 1346
100.0% 100.0% 100.0% 100.0% 100.0% 100.0%
Count
% within Primary
Area Where Raised
Count
% within Primary
Area Where Raised
Count
% within Primary
Area Where Raised
Count
% within Primary
Area Where Raised
Count
% within Primary
Area Where Raised
Count
% within Primary
Area Where Raised
Count
% within Primary
Area Where Raised
Count
% within Primary
Area Where Raised
Count
% within Primary
Area Where Raised
Count
% within Primary
Area Where Raised
Count
% within Primary
Area Where Raised
Count
% within Primary
Area Where Raised
Count
% within Primary
Area Where Raised
Count
% within Primary
Area Where Raised
Count
% within Primary
Area Where Raised
Count
% within Primary
Area Where Raised
Count
% within Primary
Area Where Raised
Graduation requirements
Faculty adv isement
Institutional
policy /encouragement
Elective opt ion
Family inf luence
Costs
Learning dif f erences or
physical disability
Time requirements
Interest
Program availability at
home institution
Program availability
outside of home
institution
Saf ety /health issues
Distance/ location
Financial support
Plan to do this before I
graduate
Other
Local community
serv ice/v olunteer
(e.g. tutoring)
with internat ional
populations
Total
Rural/Farm
Rural/No
n-f arm Urban Inner-city Other
Primary Area Where Raised
Total
C.143:
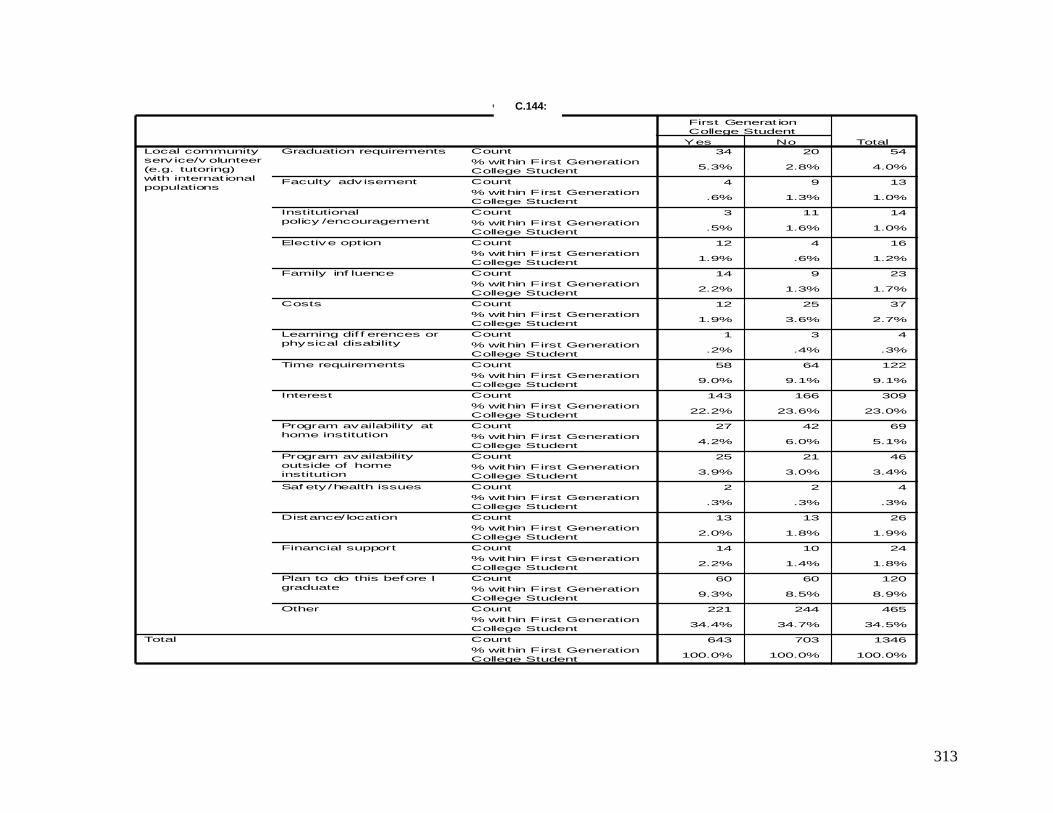
313
Crosstab
34 20 54
5.3% 2.8% 4.0%
4 9 13
.6% 1.3% 1.0%
3 11 14
.5% 1.6% 1.0%
12 4 16
1.9% .6% 1.2%
14 9 23
2.2% 1.3% 1.7%
12 25 37
1.9% 3.6% 2.7%
1 3 4
.2% .4% .3%
58 64 122
9.0% 9.1% 9.1%
143 166 309
22.2% 23.6% 23.0%
27 42 69
4.2% 6.0% 5.1%
25 21 46
3.9% 3.0% 3.4%
2 2 4
.3% .3% .3%
13 13 26
2.0% 1.8% 1.9%
14 10 24
2.2% 1.4% 1.8%
60 60 120
9.3% 8.5% 8.9%
221 244 465
34.4% 34.7% 34.5%
643 703 1346
100.0% 100.0% 100.0%
Count
% within First Generation
College Student
Count
% within First Generation
College Student
Count
% within First Generation
College Student
Count
% within First Generation
College Student
Count
% within First Generation
College Student
Count
% within First Generation
College Student
Count
% within First Generation
College Student
Count
% within First Generation
College Student
Count
% within First Generation
College Student
Count
% within First Generation
College Student
Count
% within First Generation
College Student
Count
% within First Generation
College Student
Count
% within First Generation
College Student
Count
% within First Generation
College Student
Count
% within First Generation
College Student
Count
% within First Generation
College Student
Count
% within First Generation
College Student
Graduation requirements
Faculty adv isement
Institutional
policy /encouragement
Elective opt ion
Family inf luence
Costs
Learning dif f erences or
physical disability
Time requirements
Interest
Program availability at
home institution
Program availability
outside of home
institution
Saf ety /health issues
Distance/ location
Financial support
Plan to do this before I
graduate
Other
Local community
serv ice/v olunteer
(e.g. tutoring)
with internat ional
populations
Total
Yes No
First Generat ion
College Student
Total
C.144:
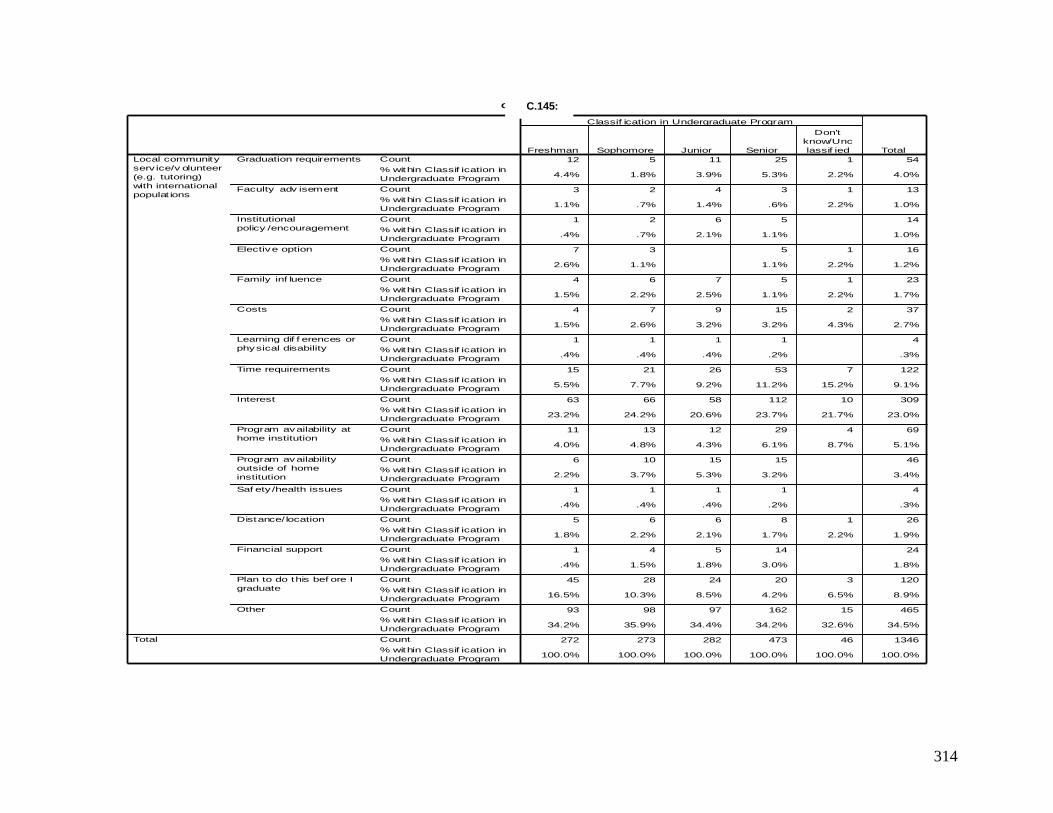
314
Crosstab
12 5 11 25 1 54
4.4% 1.8% 3.9% 5.3% 2.2% 4.0%
3 2 4 3 1 13
1.1% .7% 1.4% .6% 2.2% 1.0%
1 2 6 5 14
.4% .7% 2.1% 1.1% 1.0%
7 3 5 1 16
2.6% 1.1% 1.1% 2.2% 1.2%
4 6 7 5 1 23
1.5% 2.2% 2.5% 1.1% 2.2% 1.7%
4 7 9 15 2 37
1.5% 2.6% 3.2% 3.2% 4.3% 2.7%
1 1 1 1 4
.4% .4% .4% .2% .3%
15 21 26 53 7 122
5.5% 7.7% 9.2% 11.2% 15.2% 9.1%
63 66 58 112 10 309
23.2% 24.2% 20.6% 23.7% 21.7% 23.0%
11 13 12 29 4 69
4.0% 4.8% 4.3% 6.1% 8.7% 5.1%
6 10 15 15 46
2.2% 3.7% 5.3% 3.2% 3.4%
1 1 1 1 4
.4% .4% .4% .2% .3%
5 6 6 8 1 26
1.8% 2.2% 2.1% 1.7% 2.2% 1.9%
1 4 5 14 24
.4% 1.5% 1.8% 3.0% 1.8%
45 28 24 20 3 120
16.5% 10.3% 8.5% 4.2% 6.5% 8.9%
93 98 97 162 15 465
34.2% 35.9% 34.4% 34.2% 32.6% 34.5%
272 273 282 473 46 1346
100.0% 100.0% 100.0% 100.0% 100.0% 100.0%
Count
% within Classif ication in
Undergraduate Program
Count
% within Classif ication in
Undergraduate Program
Count
% within Classif ication in
Undergraduate Program
Count
% within Classif ication in
Undergraduate Program
Count
% within Classif ication in
Undergraduate Program
Count
% within Classif ication in
Undergraduate Program
Count
% within Classif ication in
Undergraduate Program
Count
% within Classif ication in
Undergraduate Program
Count
% within Classif ication in
Undergraduate Program
Count
% within Classif ication in
Undergraduate Program
Count
% within Classif ication in
Undergraduate Program
Count
% within Classif ication in
Undergraduate Program
Count
% within Classif ication in
Undergraduate Program
Count
% within Classif ication in
Undergraduate Program
Count
% within Classif ication in
Undergraduate Program
Count
% within Classif ication in
Undergraduate Program
Count
% within Classif ication in
Undergraduate Program
Graduation requirements
Faculty adv isement
Institutional
policy /encouragement
Elective option
Family inf luence
Costs
Learning dif f erences or
physical disability
Time requirements
Interest
Program availability at
home institution
Program availability
outside of home
institution
Saf ety /health issues
Distance/ location
Financial support
Plan to do this bef ore I
graduate
Other
Local community
serv ice/v olunteer
(e.g. tutoring)
with international
populat ions
Total
Freshman Sophomore Junior Senior
Don't
know/Unc
lassif ied
Classif ication in Undergraduate Program
Total
C.145:
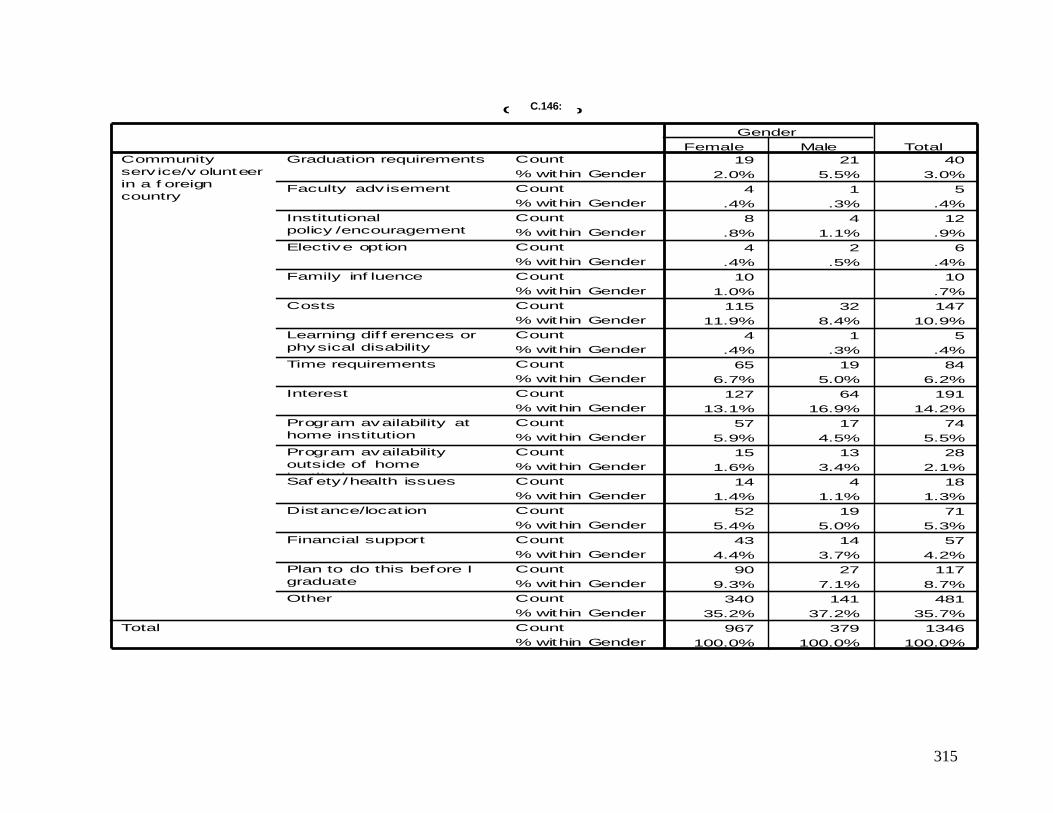
315
Crosstab
19 21 40
2.0% 5.5% 3.0%
4 1 5
.4% .3% .4%
8 4 12
.8% 1.1% .9%
4 2 6
.4% .5% .4%
10 10
1.0% .7%
115 32 147
11.9% 8.4% 10.9%
4 1 5
.4% .3% .4%
65 19 84
6.7% 5.0% 6.2%
127 64 191
13.1% 16.9% 14.2%
57 17 74
5.9% 4.5% 5.5%
15 13 28
1.6% 3.4% 2.1%
14 4 18
1.4% 1.1% 1.3%
52 19 71
5.4% 5.0% 5.3%
43 14 57
4.4% 3.7% 4.2%
90 27 117
9.3% 7.1% 8.7%
340 141 481
35.2% 37.2% 35.7%
967 379 1346
100.0% 100.0% 100.0%
Count
% within Gender
Count
% within Gender
Count
% within Gender
Count
% within Gender
Count
% within Gender
Count
% within Gender
Count
% within Gender
Count
% within Gender
Count
% within Gender
Count
% within Gender
Count
% within Gender
Count
% within Gender
Count
% within Gender
Count
% within Gender
Count
% within Gender
Count
% within Gender
Count
% within Gender
Graduation requirements
Faculty adv isement
Institutional
policy /encouragement
Elective opt ion
Family inf luence
Costs
Learning dif f erences or
physical disability
Time requirements
Interest
Program availability at
home institution
Program availability
outside of home
institutionSaf ety /health issues
Distance/locat ion
Financial support
Plan to do this before I
graduate
Other
Community
serv ice/v olunteer
in a f oreign
country
Total
Female Male
Gender
Total
C.146:
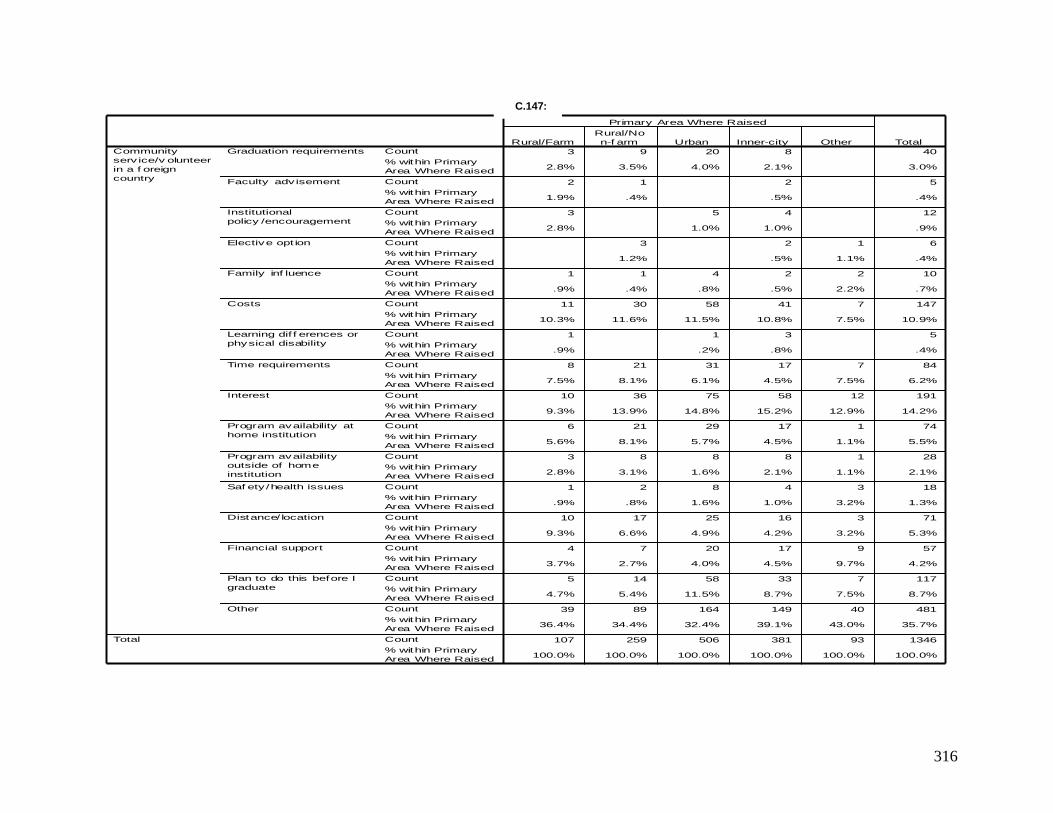
316
Crosstab
3 9 20 8 40
2.8% 3.5% 4.0% 2.1% 3.0%
2 1 2 5
1.9% .4% .5% .4%
3 5 4 12
2.8% 1.0% 1.0% .9%
3 2 1 6
1.2% .5% 1.1% .4%
1 1 4 2 2 10
.9% .4% .8% .5% 2.2% .7%
11 30 58 41 7 147
10.3% 11.6% 11.5% 10.8% 7.5% 10.9%
1 1 3 5
.9% .2% .8% .4%
8 21 31 17 7 84
7.5% 8.1% 6.1% 4.5% 7.5% 6.2%
10 36 75 58 12 191
9.3% 13.9% 14.8% 15.2% 12.9% 14.2%
6 21 29 17 1 74
5.6% 8.1% 5.7% 4.5% 1.1% 5.5%
3 8 8 8 1 28
2.8% 3.1% 1.6% 2.1% 1.1% 2.1%
1 2 8 4 3 18
.9% .8% 1.6% 1.0% 3.2% 1.3%
10 17 25 16 3 71
9.3% 6.6% 4.9% 4.2% 3.2% 5.3%
4 7 20 17 9 57
3.7% 2.7% 4.0% 4.5% 9.7% 4.2%
5 14 58 33 7 117
4.7% 5.4% 11.5% 8.7% 7.5% 8.7%
39 89 164 149 40 481
36.4% 34.4% 32.4% 39.1% 43.0% 35.7%
107 259 506 381 93 1346
100.0% 100.0% 100.0% 100.0% 100.0% 100.0%
Count
% within Primary
Area Where Raised
Count
% within Primary
Area Where Raised
Count
% within Primary
Area Where Raised
Count
% within Primary
Area Where Raised
Count
% within Primary
Area Where Raised
Count
% within Primary
Area Where Raised
Count
% within Primary
Area Where Raised
Count
% within Primary
Area Where Raised
Count
% within Primary
Area Where Raised
Count
% within Primary
Area Where Raised
Count
% within Primary
Area Where Raised
Count
% within Primary
Area Where Raised
Count
% within Primary
Area Where Raised
Count
% within Primary
Area Where Raised
Count
% within Primary
Area Where Raised
Count
% within Primary
Area Where Raised
Count
% within Primary
Area Where Raised
Graduation requirements
Faculty adv isement
Institutional
policy /encouragement
Elective opt ion
Family inf luence
Costs
Learning dif f erences or
physical disability
Time requirements
Interest
Program availability at
home institution
Program availability
outside of home
institution
Saf ety /health issues
Distance/ location
Financial support
Plan to do this before I
graduate
Other
Community
serv ice/v olunteer
in a f oreign
country
Total
Rural/Farm
Rural/No
n-f arm Urban Inner-city Other
Primary Area Where Raised
Total
C.147:
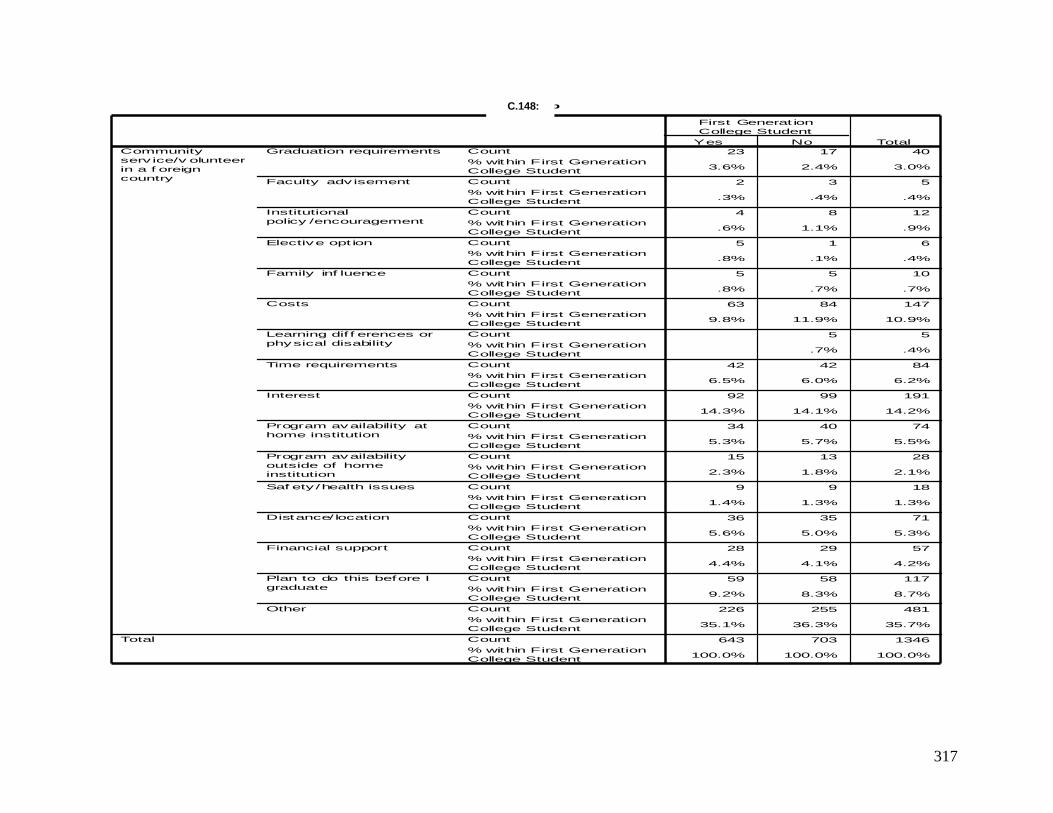
317
Crosstab
23 17 40
3.6% 2.4% 3.0%
2 3 5
.3% .4% .4%
4 8 12
.6% 1.1% .9%
5 1 6
.8% .1% .4%
5 5 10
.8% .7% .7%
63 84 147
9.8% 11.9% 10.9%
5 5
.7% .4%
42 42 84
6.5% 6.0% 6.2%
92 99 191
14.3% 14.1% 14.2%
34 40 74
5.3% 5.7% 5.5%
15 13 28
2.3% 1.8% 2.1%
9 9 18
1.4% 1.3% 1.3%
36 35 71
5.6% 5.0% 5.3%
28 29 57
4.4% 4.1% 4.2%
59 58 117
9.2% 8.3% 8.7%
226 255 481
35.1% 36.3% 35.7%
643 703 1346
100.0% 100.0% 100.0%
Count
% within First Generation
College Student
Count
% within First Generation
College Student
Count
% within First Generation
College Student
Count
% within First Generation
College Student
Count
% within First Generation
College Student
Count
% within First Generation
College Student
Count
% within First Generation
College Student
Count
% within First Generation
College Student
Count
% within First Generation
College Student
Count
% within First Generation
College Student
Count
% within First Generation
College Student
Count
% within First Generation
College Student
Count
% within First Generation
College Student
Count
% within First Generation
College Student
Count
% within First Generation
College Student
Count
% within First Generation
College Student
Count
% within First Generation
College Student
Graduation requirements
Faculty adv isement
Institutional
policy /encouragement
Elective opt ion
Family inf luence
Costs
Learning dif f erences or
physical disability
Time requirements
Interest
Program availability at
home institution
Program availability
outside of home
institution
Saf ety /health issues
Distance/ location
Financial support
Plan to do this before I
graduate
Other
Community
serv ice/v olunteer
in a f oreign
country
Total
Yes No
First Generat ion
College Student
Total
C.148:
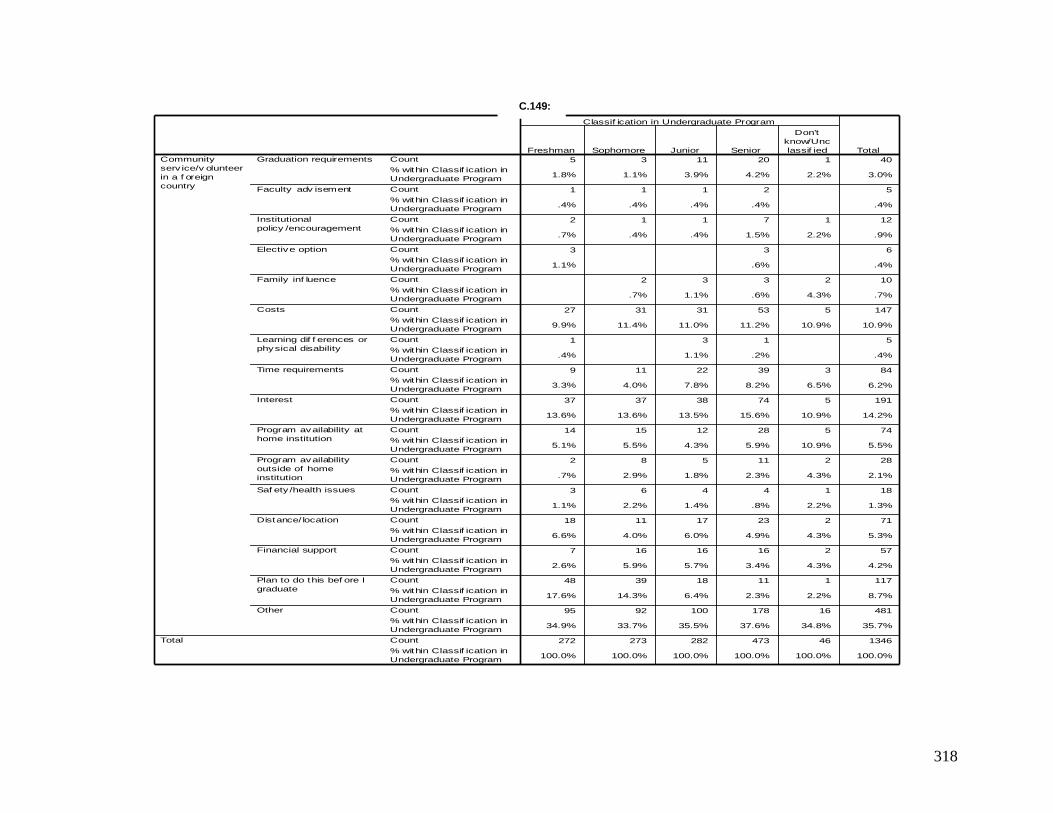
318
Crosstab
5 3 11 20 1 40
1.8% 1.1% 3.9% 4.2% 2.2% 3.0%
1 1 1 2 5
.4% .4% .4% .4% .4%
2 1 1 7 1 12
.7% .4% .4% 1.5% 2.2% .9%
3 3 6
1.1% .6% .4%
2 3 3 2 10
.7% 1.1% .6% 4.3% .7%
27 31 31 53 5 147
9.9% 11.4% 11.0% 11.2% 10.9% 10.9%
1 3 1 5
.4% 1.1% .2% .4%
9 11 22 39 3 84
3.3% 4.0% 7.8% 8.2% 6.5% 6.2%
37 37 38 74 5 191
13.6% 13.6% 13.5% 15.6% 10.9% 14.2%
14 15 12 28 5 74
5.1% 5.5% 4.3% 5.9% 10.9% 5.5%
2 8 5 11 2 28
.7% 2.9% 1.8% 2.3% 4.3% 2.1%
3 6 4 4 1 18
1.1% 2.2% 1.4% .8% 2.2% 1.3%
18 11 17 23 2 71
6.6% 4.0% 6.0% 4.9% 4.3% 5.3%
7 16 16 16 2 57
2.6% 5.9% 5.7% 3.4% 4.3% 4.2%
48 39 18 11 1 117
17.6% 14.3% 6.4% 2.3% 2.2% 8.7%
95 92 100 178 16 481
34.9% 33.7% 35.5% 37.6% 34.8% 35.7%
272 273 282 473 46 1346
100.0% 100.0% 100.0% 100.0% 100.0% 100.0%
Count
% within Classif ication in
Undergraduate Program
Count
% within Classif ication in
Undergraduate Program
Count
% within Classif ication in
Undergraduate Program
Count
% within Classif ication in
Undergraduate Program
Count
% within Classif ication in
Undergraduate Program
Count
% within Classif ication in
Undergraduate Program
Count
% within Classif ication in
Undergraduate Program
Count
% within Classif ication in
Undergraduate Program
Count
% within Classif ication in
Undergraduate Program
Count
% within Classif ication in
Undergraduate Program
Count
% within Classif ication in
Undergraduate Program
Count
% within Classif ication in
Undergraduate Program
Count
% within Classif ication in
Undergraduate Program
Count
% within Classif ication in
Undergraduate Program
Count
% within Classif ication in
Undergraduate Program
Count
% within Classif ication in
Undergraduate Program
Count
% within Classif ication in
Undergraduate Program
Graduation requirements
Faculty adv isement
Institutional
policy /encouragement
Elective option
Family inf luence
Costs
Learning dif f erences or
physical disability
Time requirements
Interest
Program availability at
home institution
Program availability
outside of home
institution
Saf ety /health issues
Distance/ location
Financial support
Plan to do this bef ore I
graduate
Other
Community
serv ice/v olunteer
in a f oreign
country
Total
Freshman Sophomore Junior Senior
Don't
know/Unc
lassif ied
Classif ication in Undergraduate Program
Total
C.149:
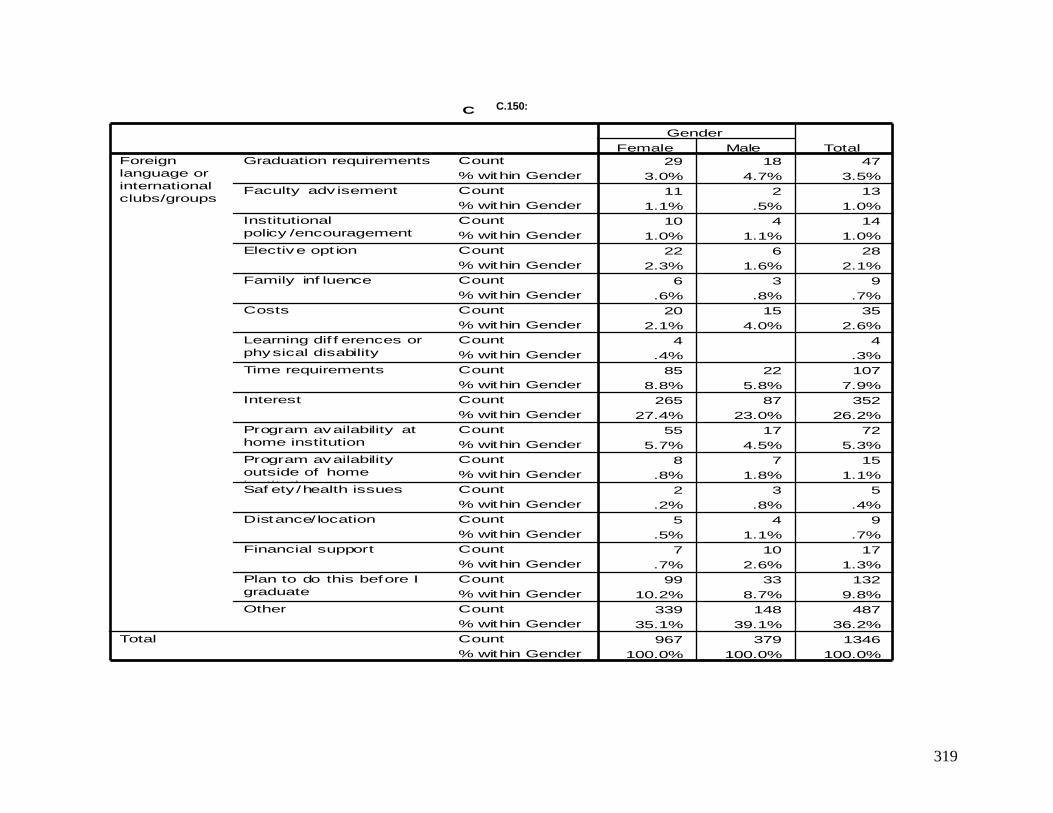
319
Crosstab
29 18 47
3.0% 4.7% 3.5%
11 2 13
1.1% .5% 1.0%
10 4 14
1.0% 1.1% 1.0%
22 6 28
2.3% 1.6% 2.1%
6 3 9
.6% .8% .7%
20 15 35
2.1% 4.0% 2.6%
4 4
.4% .3%
85 22 107
8.8% 5.8% 7.9%
265 87 352
27.4% 23.0% 26.2%
55 17 72
5.7% 4.5% 5.3%
8 7 15
.8% 1.8% 1.1%
2 3 5
.2% .8% .4%
5 4 9
.5% 1.1% .7%
7 10 17
.7% 2.6% 1.3%
99 33 132
10.2% 8.7% 9.8%
339 148 487
35.1% 39.1% 36.2%
967 379 1346
100.0% 100.0% 100.0%
Count
% within Gender
Count
% within Gender
Count
% within Gender
Count
% within Gender
Count
% within Gender
Count
% within Gender
Count
% within Gender
Count
% within Gender
Count
% within Gender
Count
% within Gender
Count
% within Gender
Count
% within Gender
Count
% within Gender
Count
% within Gender
Count
% within Gender
Count
% within Gender
Count
% within Gender
Graduation requirements
Faculty adv isement
Institutional
policy /encouragement
Elective opt ion
Family inf luence
Costs
Learning dif f erences or
physical disability
Time requirements
Interest
Program availability at
home institution
Program availability
outside of home
institutionSaf ety /health issues
Distance/ location
Financial support
Plan to do this before I
graduate
Other
Foreign
language or
international
clubs/groups
Total
Female Male
Gender
Total
C.150:
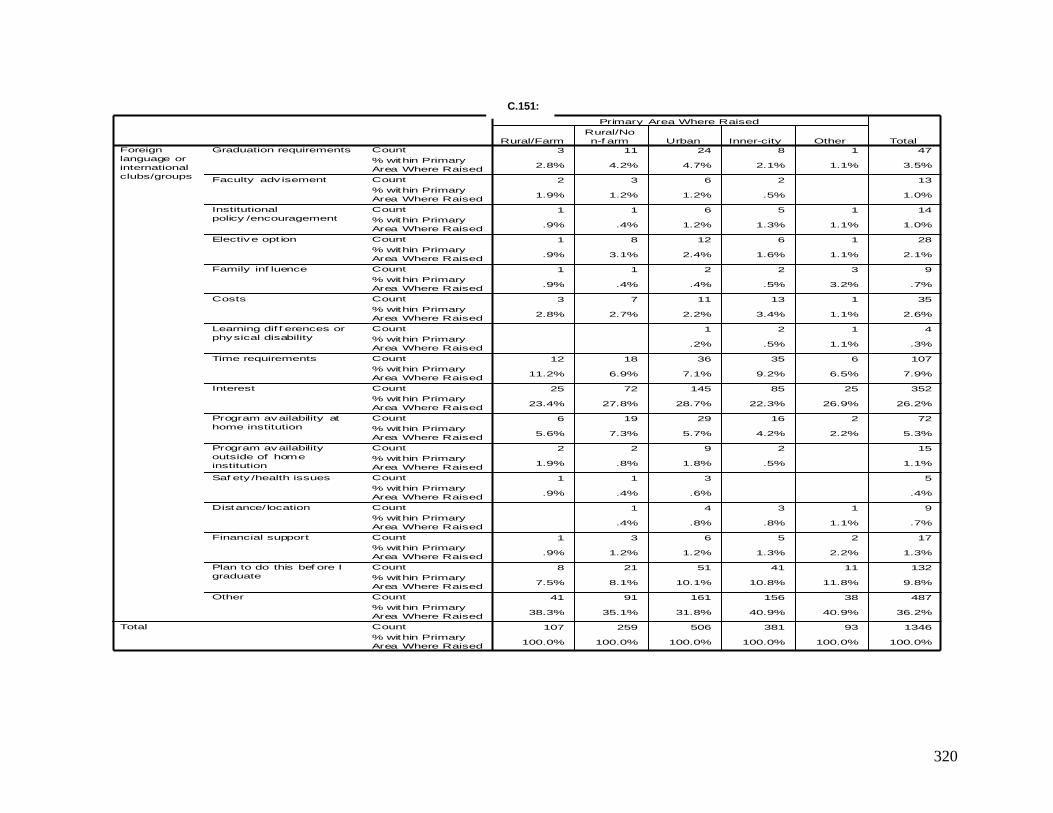
320
Crosstab
3 11 24 8 1 47
2.8% 4.2% 4.7% 2.1% 1.1% 3.5%
2 3 6 2 13
1.9% 1.2% 1.2% .5% 1.0%
1 1 6 5 1 14
.9% .4% 1.2% 1.3% 1.1% 1.0%
1 8 12 6 1 28
.9% 3.1% 2.4% 1.6% 1.1% 2.1%
1 1 2 2 3 9
.9% .4% .4% .5% 3.2% .7%
3 7 11 13 1 35
2.8% 2.7% 2.2% 3.4% 1.1% 2.6%
1 2 1 4
.2% .5% 1.1% .3%
12 18 36 35 6 107
11.2% 6.9% 7.1% 9.2% 6.5% 7.9%
25 72 145 85 25 352
23.4% 27.8% 28.7% 22.3% 26.9% 26.2%
6 19 29 16 2 72
5.6% 7.3% 5.7% 4.2% 2.2% 5.3%
2 2 9 2 15
1.9% .8% 1.8% .5% 1.1%
1 1 3 5
.9% .4% .6% .4%
1 4 3 1 9
.4% .8% .8% 1.1% .7%
1 3 6 5 2 17
.9% 1.2% 1.2% 1.3% 2.2% 1.3%
8 21 51 41 11 132
7.5% 8.1% 10.1% 10.8% 11.8% 9.8%
41 91 161 156 38 487
38.3% 35.1% 31.8% 40.9% 40.9% 36.2%
107 259 506 381 93 1346
100.0% 100.0% 100.0% 100.0% 100.0% 100.0%
Count
% within Primary
Area Where Raised
Count
% within Primary
Area Where Raised
Count
% within Primary
Area Where Raised
Count
% within Primary
Area Where Raised
Count
% within Primary
Area Where Raised
Count
% within Primary
Area Where Raised
Count
% within Primary
Area Where Raised
Count
% within Primary
Area Where Raised
Count
% within Primary
Area Where Raised
Count
% within Primary
Area Where Raised
Count
% within Primary
Area Where Raised
Count
% within Primary
Area Where Raised
Count
% within Primary
Area Where Raised
Count
% within Primary
Area Where Raised
Count
% within Primary
Area Where Raised
Count
% within Primary
Area Where Raised
Count
% within Primary
Area Where Raised
Graduation requirements
Faculty adv isement
Institutional
policy /encouragement
Elective opt ion
Family inf luence
Costs
Learning dif f erences or
physical disability
Time requirements
Interest
Program availability at
home institution
Program availability
outside of home
institution
Saf ety /health issues
Distance/ location
Financial support
Plan to do this bef ore I
graduate
Other
Foreign
language or
international
clubs/groups
Total
Rural/Farm
Rural/No
n-f arm Urban Inner-city Other
Primary Area Where Raised
Total
C.151:
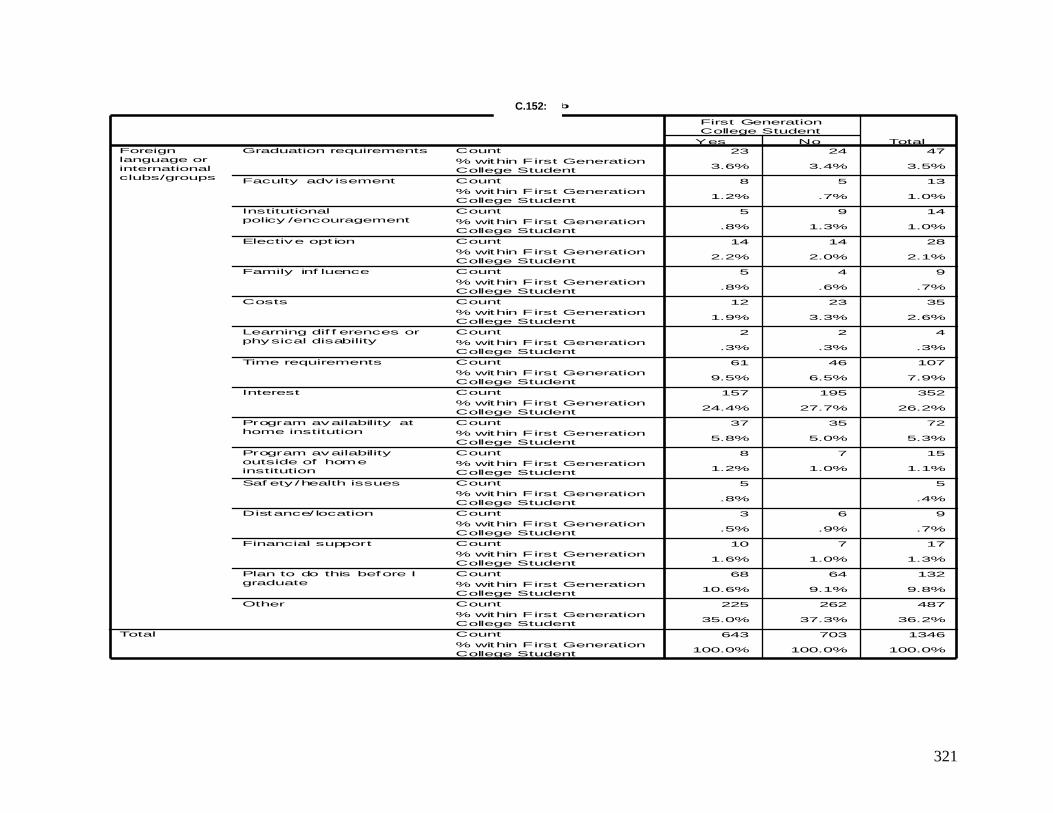
321
Crosstab
23 24 47
3.6% 3.4% 3.5%
8 5 13
1.2% .7% 1.0%
5 9 14
.8% 1.3% 1.0%
14 14 28
2.2% 2.0% 2.1%
5 4 9
.8% .6% .7%
12 23 35
1.9% 3.3% 2.6%
2 2 4
.3% .3% .3%
61 46 107
9.5% 6.5% 7.9%
157 195 352
24.4% 27.7% 26.2%
37 35 72
5.8% 5.0% 5.3%
8 7 15
1.2% 1.0% 1.1%
5 5
.8% .4%
3 6 9
.5% .9% .7%
10 7 17
1.6% 1.0% 1.3%
68 64 132
10.6% 9.1% 9.8%
225 262 487
35.0% 37.3% 36.2%
643 703 1346
100.0% 100.0% 100.0%
Count
% within First Generation
College Student
Count
% within First Generation
College Student
Count
% within First Generation
College Student
Count
% within First Generation
College Student
Count
% within First Generation
College Student
Count
% within First Generation
College Student
Count
% within First Generation
College Student
Count
% within First Generation
College Student
Count
% within First Generation
College Student
Count
% within First Generation
College Student
Count
% within First Generation
College Student
Count
% within First Generation
College Student
Count
% within First Generation
College Student
Count
% within First Generation
College Student
Count
% within First Generation
College Student
Count
% within First Generation
College Student
Count
% within First Generation
College Student
Graduation requirements
Faculty adv isement
Institutional
policy /encouragement
Elective opt ion
Family inf luence
Costs
Learning dif f erences or
physical disability
Time requirements
Interest
Program availability at
home institution
Program availability
outside of home
institution
Saf ety /health issues
Distance/ location
Financial support
Plan to do this before I
graduate
Other
Foreign
language or
international
clubs/groups
Total
Yes No
First Generation
College Student
Total
C.152:
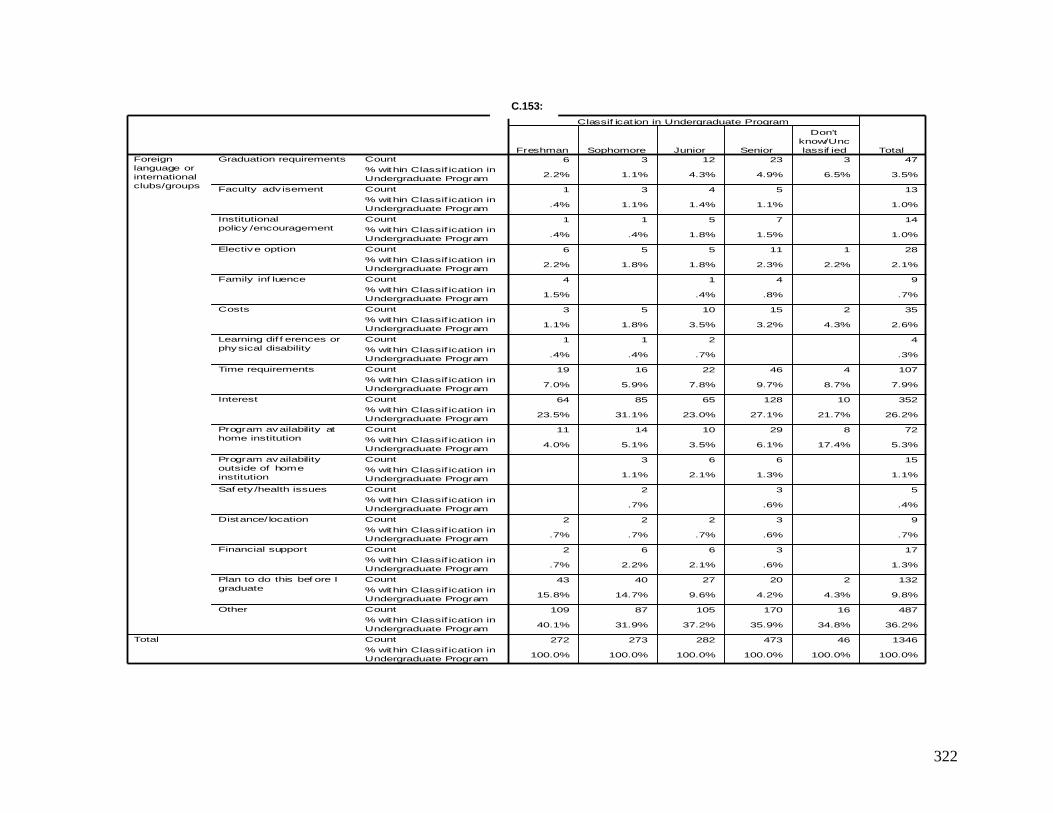
322
Crosstab
6 3 12 23 3 47
2.2% 1.1% 4.3% 4.9% 6.5% 3.5%
1 3 4 5 13
.4% 1.1% 1.4% 1.1% 1.0%
1 1 5 7 14
.4% .4% 1.8% 1.5% 1.0%
6 5 5 11 1 28
2.2% 1.8% 1.8% 2.3% 2.2% 2.1%
4 1 4 9
1.5% .4% .8% .7%
3 5 10 15 2 35
1.1% 1.8% 3.5% 3.2% 4.3% 2.6%
1 1 2 4
.4% .4% .7% .3%
19 16 22 46 4 107
7.0% 5.9% 7.8% 9.7% 8.7% 7.9%
64 85 65 128 10 352
23.5% 31.1% 23.0% 27.1% 21.7% 26.2%
11 14 10 29 8 72
4.0% 5.1% 3.5% 6.1% 17.4% 5.3%
3 6 6 15
1.1% 2.1% 1.3% 1.1%
2 3 5
.7% .6% .4%
2 2 2 3 9
.7% .7% .7% .6% .7%
2 6 6 3 17
.7% 2.2% 2.1% .6% 1.3%
43 40 27 20 2 132
15.8% 14.7% 9.6% 4.2% 4.3% 9.8%
109 87 105 170 16 487
40.1% 31.9% 37.2% 35.9% 34.8% 36.2%
272 273 282 473 46 1346
100.0% 100.0% 100.0% 100.0% 100.0% 100.0%
Count
% within Classif ication in
Undergraduate Program
Count
% within Classif ication in
Undergraduate Program
Count
% within Classif ication in
Undergraduate Program
Count
% within Classif ication in
Undergraduate Program
Count
% within Classif ication in
Undergraduate Program
Count
% within Classif ication in
Undergraduate Program
Count
% within Classif ication in
Undergraduate Program
Count
% within Classif ication in
Undergraduate Program
Count
% within Classif ication in
Undergraduate Program
Count
% within Classif ication in
Undergraduate Program
Count
% within Classif ication in
Undergraduate Program
Count
% within Classif ication in
Undergraduate Program
Count
% within Classif ication in
Undergraduate Program
Count
% within Classif ication in
Undergraduate Program
Count
% within Classif ication in
Undergraduate Program
Count
% within Classif ication in
Undergraduate Program
Count
% within Classif ication in
Undergraduate Program
Graduation requirements
Faculty adv isement
Institutional
policy /encouragement
Elective option
Family inf luence
Costs
Learning dif f erences or
physical disability
Time requirements
Interest
Program availability at
home institution
Program availability
outside of home
institution
Saf ety /health issues
Distance/ location
Financial support
Plan to do this bef ore I
graduate
Other
Foreign
language or
international
clubs/groups
Total
Freshman Sophomore Junior Senior
Don't
know/Unc
lassif ied
Classif icat ion in Undergraduate Program
Total
C.153:

323
C.153:
430 162 592
44.5% 42.7% 44.0%
394 153 547
40.7% 40.4% 40.6% 96 34 130
9.9% 9.0% 9.7% 11 6 17
1.1% 1.6% 1.3%
36 24 60
3.7% 6.3% 4.5% 967 379 1346
100.0% 100.0% 100.0%
Count
% within Gender
Count
% within Gender
Count % within Gender
Count
% within Gender
Count
% within Gender
Count % within Gender
High Importance
Moderate Importance
Low Importance
No Importance
No Opinion
International study trips or tours : 6. Please rate how important you think it is to participate in these <b>other</b> international activities
Total
Female Male Gender
Total
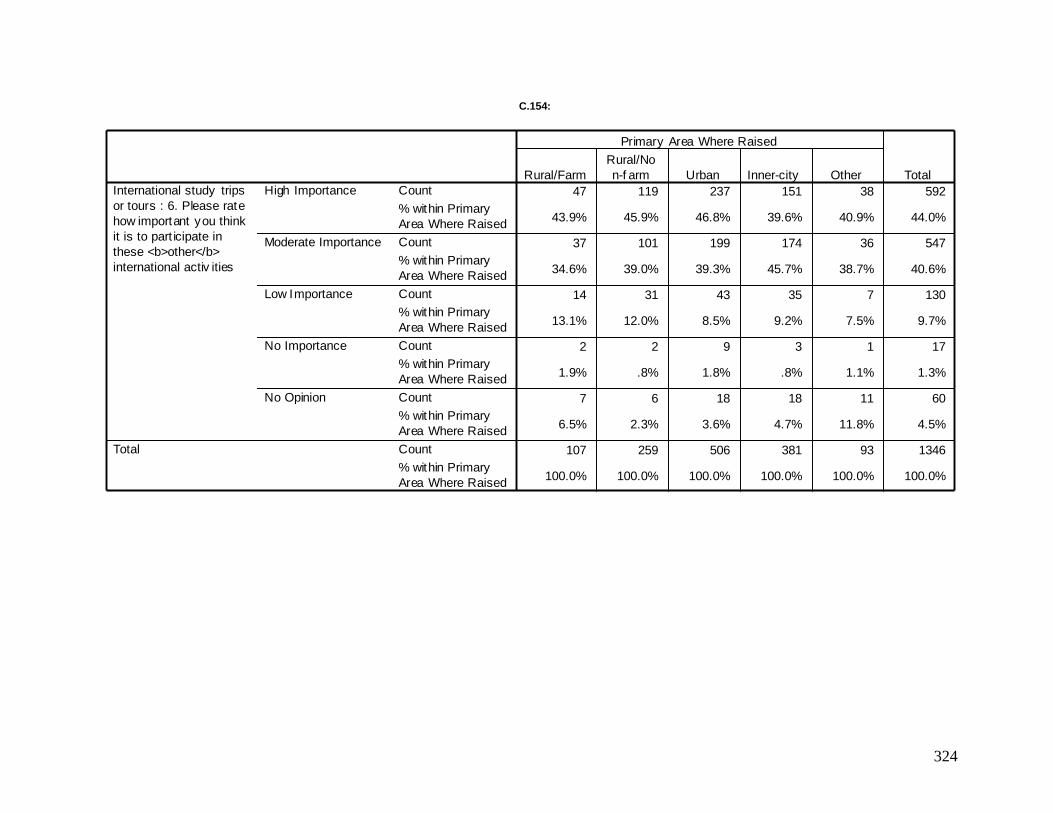
324
Crosstab
47 119 237 151 38 592
43.9% 45.9% 46.8% 39.6% 40.9% 44.0%
37 101 199 174 36 547
34.6% 39.0% 39.3% 45.7% 38.7% 40.6%
14 31 43 35 7 130
13.1% 12.0% 8.5% 9.2% 7.5% 9.7%
2 2 9 3 1 17
1.9% .8% 1.8% .8% 1.1% 1.3%
7 6 18 18 11 60
6.5% 2.3% 3.6% 4.7% 11.8% 4.5%
107 259 506 381 93 1346
100.0% 100.0% 100.0% 100.0% 100.0% 100.0%
Count
% within Primary
Area Where Raised
Count
% within Primary
Area Where Raised
Count
% within Primary
Area Where Raised
Count
% within Primary
Area Where Raised
Count
% within Primary
Area Where Raised
Count
% within Primary
Area Where Raised
High Importance
Moderate Importance
Low Importance
No Importance
No Opinion
International study trips
or tours : 6. Please rate
how important you think
it is to part icipate in
these <b>other</b>
international activ ities
Total
Rural/Farm
Rural/No
n-f arm Urban Inner-city Other
Primary Area Where Raised
Total
C.154:
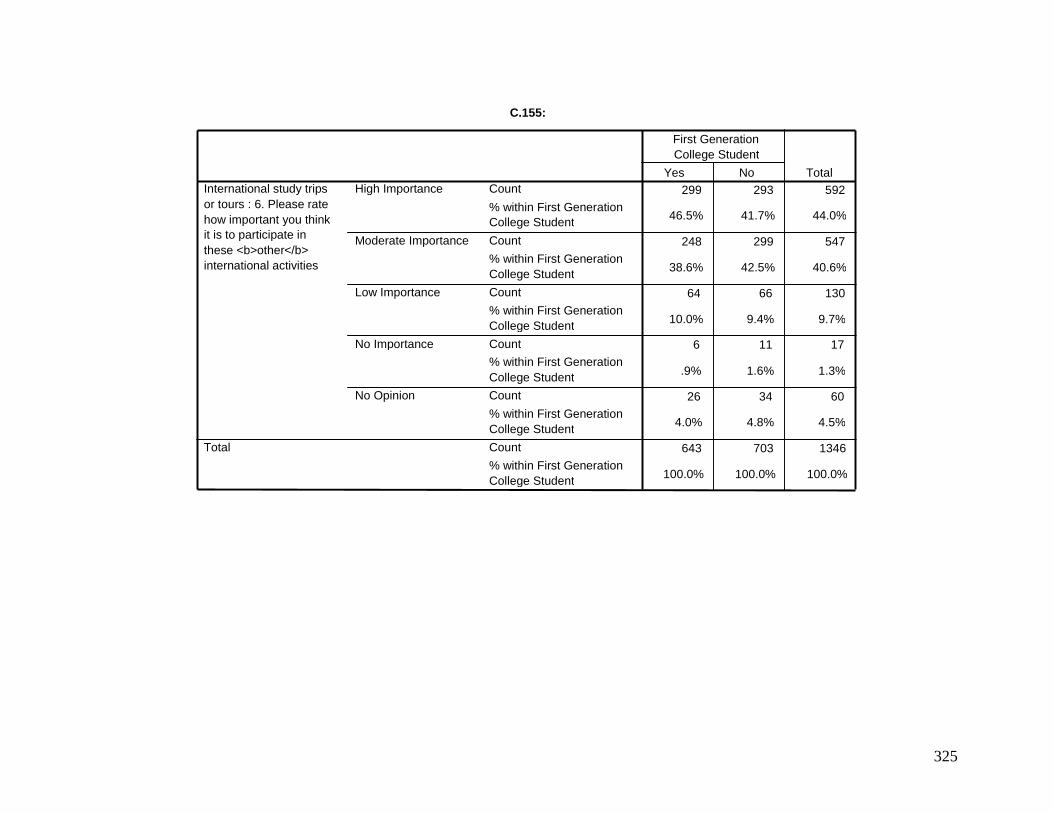
325
C.155:
299 293 592
46.5% 41.7% 44.0%
248 299 547
38.6% 42.5% 40.6%
64 66 130
10.0% 9.4% 9.7%
6 11 17
.9% 1.6% 1.3%
26 34 60
4.0% 4.8% 4.5%
643 703 1346
100.0% 100.0% 100.0%
Count
% within First Generation College Student
Count
% within First Generation College Student
Count
% within First Generation College Student
Count % within First Generation College Student Count
% within First Generation College Student
Count
% within First Generation College Student
High Importance
Moderate Importance
Low Importance
No Importance
No Opinion
International study trips or tours : 6. Please rate how important you think it is to participate in these <b>other</b> international activities
Total
Yes No
First Generation College Student
Total
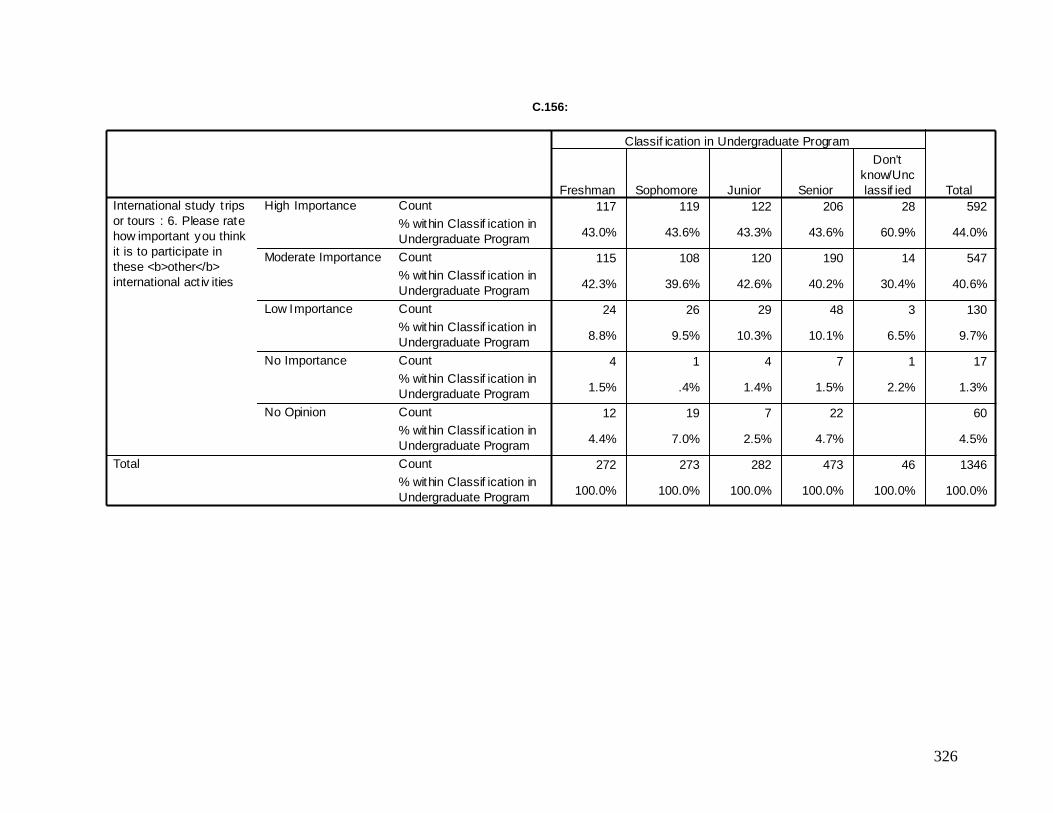
326
Crosstab
117 119 122 206 28 592
43.0% 43.6% 43.3% 43.6% 60.9% 44.0%
115 108 120 190 14 547
42.3% 39.6% 42.6% 40.2% 30.4% 40.6%
24 26 29 48 3 130
8.8% 9.5% 10.3% 10.1% 6.5% 9.7%
4 1 4 7 1 17
1.5% .4% 1.4% 1.5% 2.2% 1.3%
12 19 7 22 60
4.4% 7.0% 2.5% 4.7% 4.5%
272 273 282 473 46 1346
100.0% 100.0% 100.0% 100.0% 100.0% 100.0%
Count
% within Classif ication in
Undergraduate Program
Count
% within Classif ication in
Undergraduate Program
Count
% within Classif ication in
Undergraduate Program
Count
% within Classif ication in
Undergraduate Program
Count
% within Classif ication in
Undergraduate Program
Count
% within Classif ication in
Undergraduate Program
High Importance
Moderate Importance
Low Importance
No Importance
No Opinion
International study t rips
or tours : 6. Please rate
how important you think
it is to participate in
these <b>other</b>
international act iv ities
Total
Freshman Sophomore Junior Senior
Don't
know/Unc
lassif ied
Classif ication in Undergraduate Program
Total
C.156:
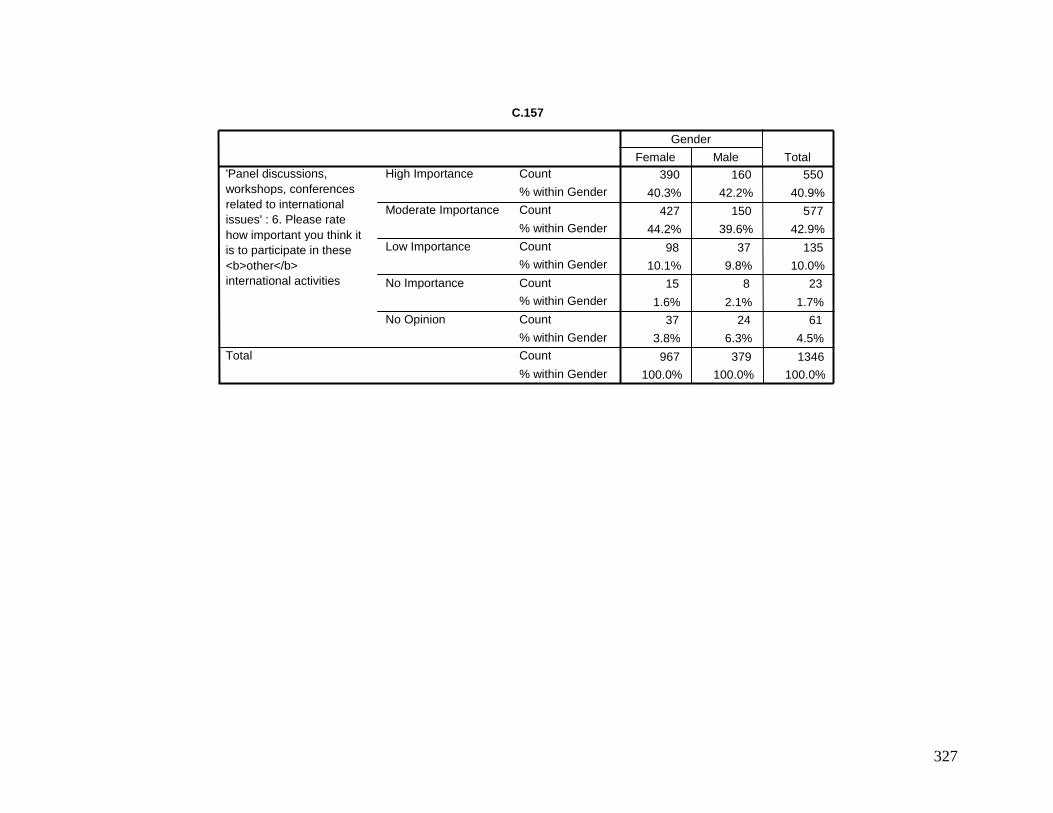
327
C.157
390 160 550
40.3% 42.2% 40.9%
427 150 577 44.2% 39.6% 42.9%
98 37 135 10.1% 9.8% 10.0%
15 8 23
1.6% 2.1% 1.7% 37 24 61
3.8% 6.3% 4.5%
967 379 1346 100.0% 100.0% 100.0%
Count
% within Gender Count
% within Gender
Count % within Gender
Count % within Gender
Count
% within Gender Count
% within Gender
High Importance
Moderate Importance
Low Importance
No Importance
No Opinion
'Panel discussions, workshops, conferences related to international issues' : 6. Please rate how important you think it is to participate in these <b>other</b> international activities
Total
Female Male Gender
Total
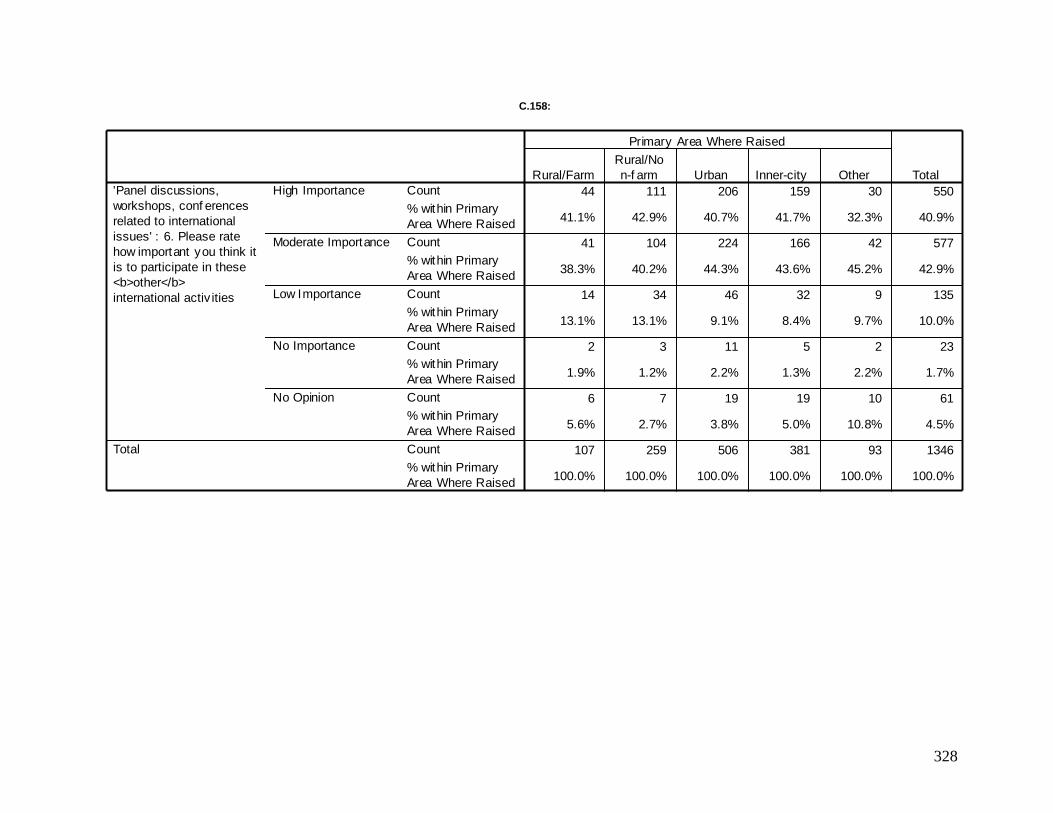
328
Crosstab
44 111 206 159 30 550
41.1% 42.9% 40.7% 41.7% 32.3% 40.9%
41 104 224 166 42 577
38.3% 40.2% 44.3% 43.6% 45.2% 42.9%
14 34 46 32 9 135
13.1% 13.1% 9.1% 8.4% 9.7% 10.0%
2 3 11 5 2 23
1.9% 1.2% 2.2% 1.3% 2.2% 1.7%
6 7 19 19 10 61
5.6% 2.7% 3.8% 5.0% 10.8% 4.5%
107 259 506 381 93 1346
100.0% 100.0% 100.0% 100.0% 100.0% 100.0%
Count
% within Primary
Area Where Raised
Count
% within Primary
Area Where Raised
Count
% within Primary
Area Where Raised
Count
% within Primary
Area Where Raised
Count
% within Primary
Area Where Raised
Count
% within Primary
Area Where Raised
High Importance
Moderate Importance
Low Importance
No Importance
No Opinion
'Panel discussions,
workshops, conf erences
related to international
issues' : 6. Please rate
how important you think it
is to participate in these
<b>other</b>
international activ ities
Total
Rural/Farm
Rural/No
n-f arm Urban Inner-city Other
Primary Area Where Raised
Total
C.158:
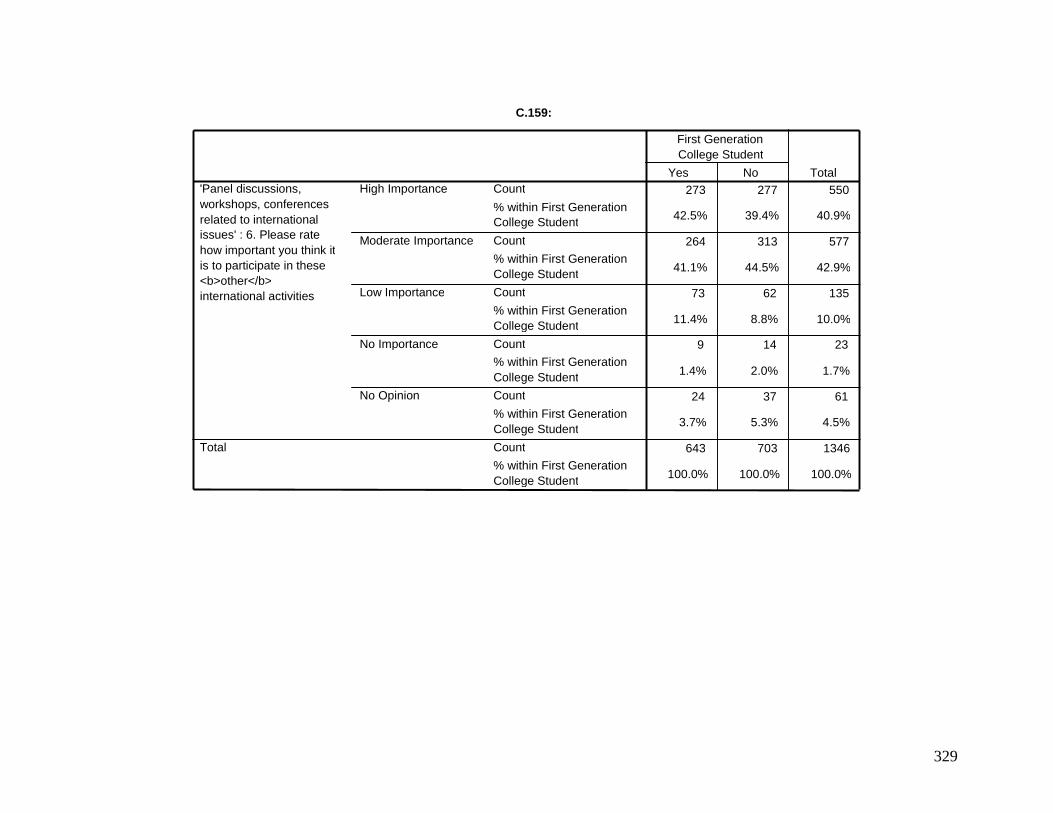
329
C.159:
273 277 550
42.5% 39.4% 40.9%
264 313 577
41.1% 44.5% 42.9%
73 62 135
11.4% 8.8% 10.0%
9 14 23
1.4% 2.0% 1.7%
24 37 61
3.7% 5.3% 4.5%
643 703 1346
100.0% 100.0% 100.0%
Count
% within First Generation College Student
Count
% within First Generation College Student
Count
% within First Generation College Student
Count % within First Generation College Student Count
% within First Generation College Student
Count
% within First Generation College Student
High Importance
Moderate Importance
Low Importance
No Importance
No Opinion
'Panel discussions, workshops, conferences related to international issues' : 6. Please rate how important you think it is to participate in these <b>other</b> international activities
Total
Yes No
First Generation College Student
Total
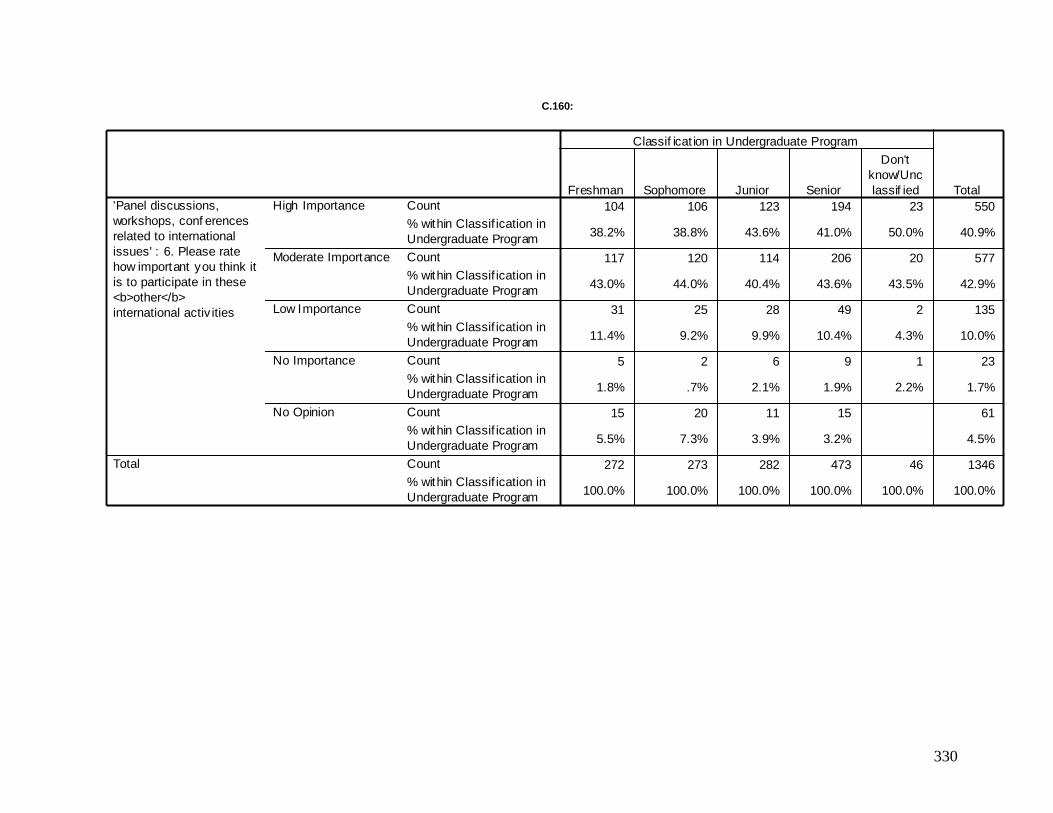
330
Crosstab
104 106 123 194 23 550
38.2% 38.8% 43.6% 41.0% 50.0% 40.9%
117 120 114 206 20 577
43.0% 44.0% 40.4% 43.6% 43.5% 42.9%
31 25 28 49 2 135
11.4% 9.2% 9.9% 10.4% 4.3% 10.0%
5 2 6 9 1 23
1.8% .7% 2.1% 1.9% 2.2% 1.7%
15 20 11 15 61
5.5% 7.3% 3.9% 3.2% 4.5%
272 273 282 473 46 1346
100.0% 100.0% 100.0% 100.0% 100.0% 100.0%
Count
% within Classif ication in
Undergraduate Program
Count
% within Classif ication in
Undergraduate Program
Count
% within Classif ication in
Undergraduate Program
Count
% within Classif ication in
Undergraduate Program
Count
% within Classif ication in
Undergraduate Program
Count
% within Classif ication in
Undergraduate Program
High Importance
Moderate Importance
Low Importance
No Importance
No Opinion
'Panel discussions,
workshops, conf erences
related to international
issues' : 6. Please rate
how important you think it
is to participate in these
<b>other</b>
international activ ities
Total
Freshman Sophomore Junior Senior
Don't
know/Unc
lassif ied
Classif icat ion in Undergraduate Program
Total
C.160:
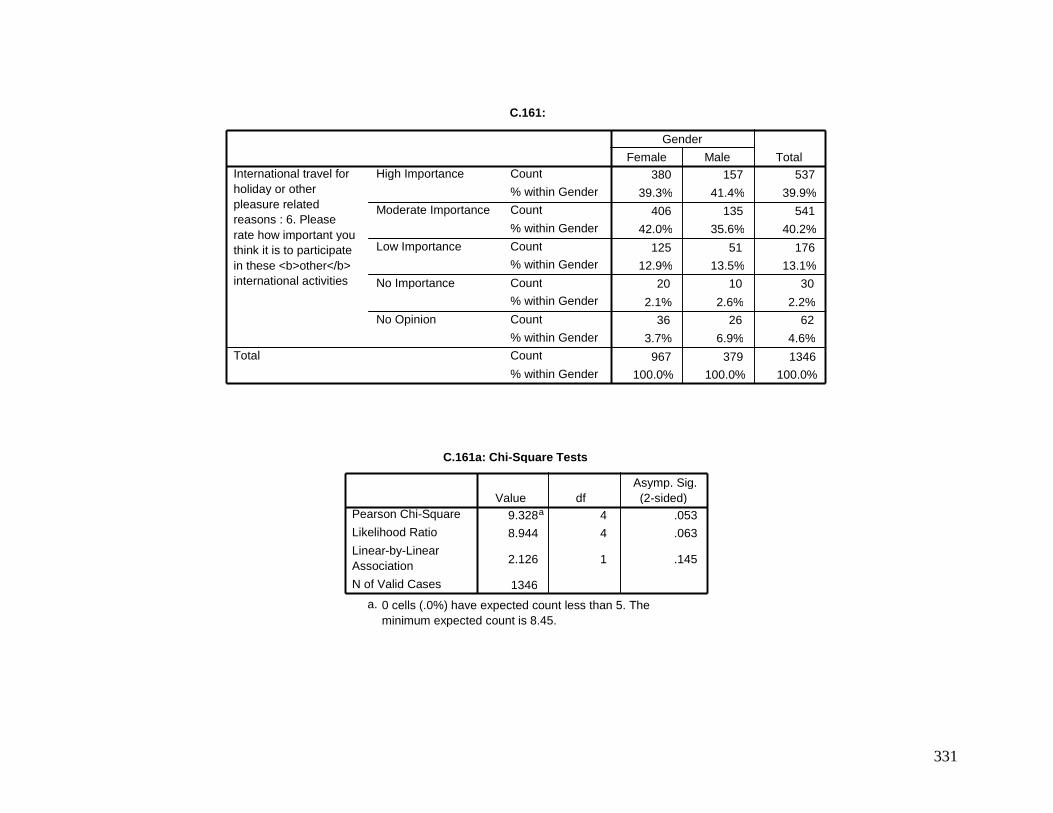
331
C.161:
380 157 537
39.3% 41.4% 39.9%
406 135 541 42.0% 35.6% 40.2%
125 51 176 12.9% 13.5% 13.1%
20 10 30
2.1% 2.6% 2.2% 36 26 62
3.7% 6.9% 4.6%
967 379 1346 100.0% 100.0% 100.0%
Count
% within Gender Count
% within Gender
Count % within Gender
Count % within Gender
Count
% within Gender Count
% within Gender
High Importance
Moderate Importance
Low Importance
No Importance
No Opinion
International travel for holiday or other pleasure related reasons : 6. Please rate how important you think it is to participate in these <b>other</b> international activities
Total
Female Male Gender
Total
9.328 a 4 .053 8.944 4 .063
2.126 1 .145
1346
Pearson Chi-Square
Likelihood Ratio
Linear-by-Linear Association
N of Valid Cases
Value df Asymp. Sig. (2-sided)
0 cells (.0%) have expected count less than 5. The minimum expected count is 8.45.
a.
C.161a: Chi-Square Tests
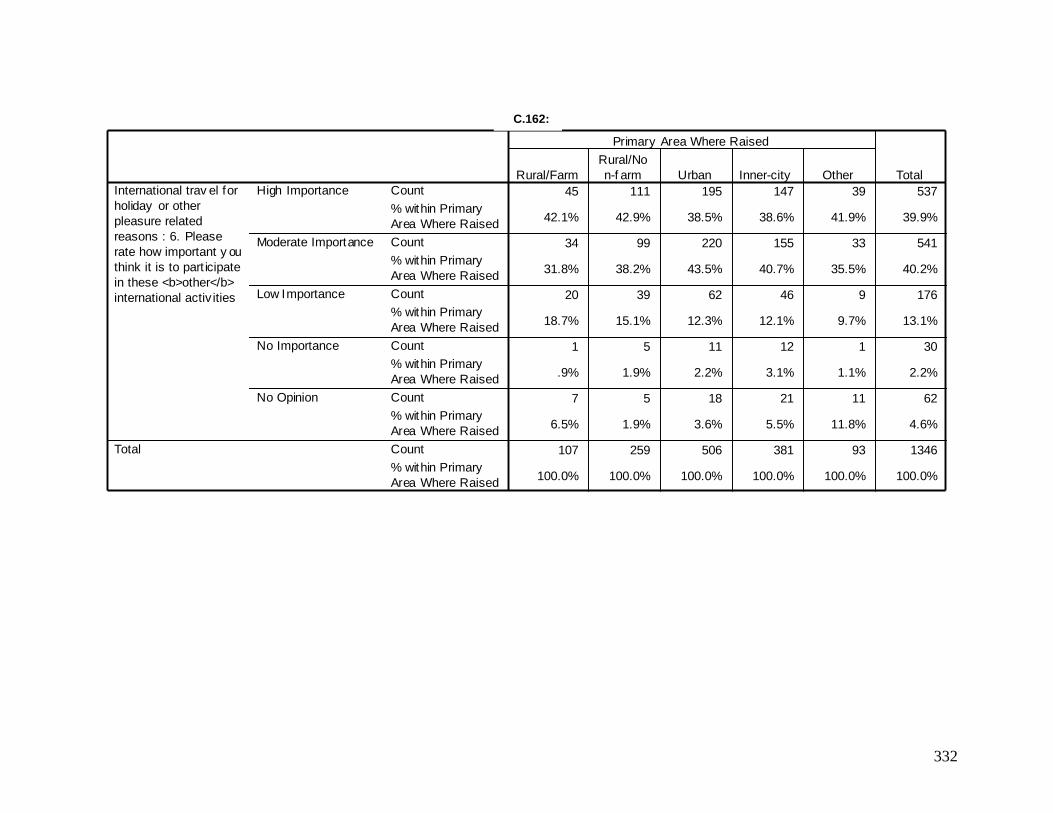
332
Crosstab
45 111 195 147 39 537
42.1% 42.9% 38.5% 38.6% 41.9% 39.9%
34 99 220 155 33 541
31.8% 38.2% 43.5% 40.7% 35.5% 40.2%
20 39 62 46 9 176
18.7% 15.1% 12.3% 12.1% 9.7% 13.1%
1 5 11 12 1 30
.9% 1.9% 2.2% 3.1% 1.1% 2.2%
7 5 18 21 11 62
6.5% 1.9% 3.6% 5.5% 11.8% 4.6%
107 259 506 381 93 1346
100.0% 100.0% 100.0% 100.0% 100.0% 100.0%
Count
% within Primary
Area Where Raised
Count
% within Primary
Area Where Raised
Count
% within Primary
Area Where Raised
Count
% within Primary
Area Where Raised
Count
% within Primary
Area Where Raised
Count
% within Primary
Area Where Raised
High Importance
Moderate Importance
Low Importance
No Importance
No Opinion
International trav el for
holiday or other
pleasure related
reasons : 6. Please
rate how important y ou
think it is to part icipate
in these <b>other</b>
international activ ities
Total
Rural/Farm
Rural/No
n-f arm Urban Inner-city Other
Primary Area Where Raised
Total
C.162:
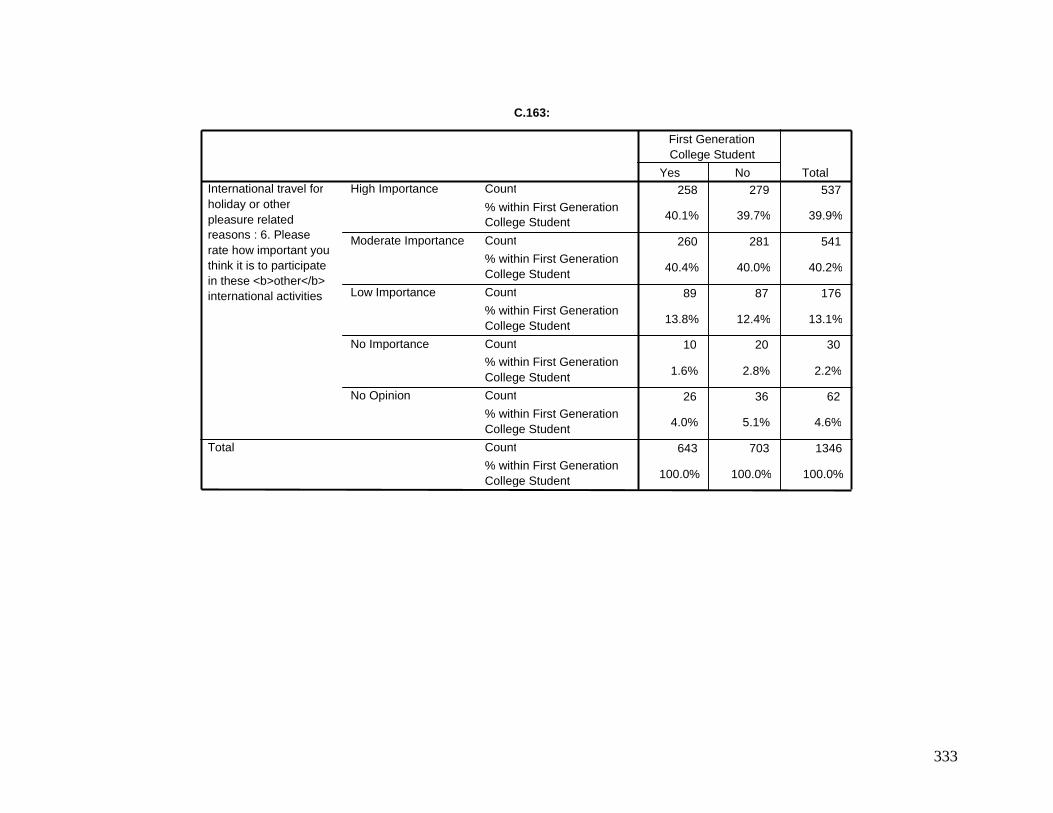
333
C.163:
258 279 537
40.1% 39.7% 39.9%
260 281 541
40.4% 40.0% 40.2%
89 87 176
13.8% 12.4% 13.1%
10 20 30
1.6% 2.8% 2.2%
26 36 62
4.0% 5.1% 4.6%
643 703 1346
100.0% 100.0% 100.0%
Count
% within First Generation College Student
Count
% within First Generation College Student
Count
% within First Generation College Student
Count % within First Generation College Student Count
% within First Generation College Student
Count
% within First Generation College Student
High Importance
Moderate Importance
Low Importance
No Importance
No Opinion
International travel for holiday or other pleasure related reasons : 6. Please rate how important you think it is to participate in these <b>other</b> international activities
Total
Yes No
First Generation College Student
Total
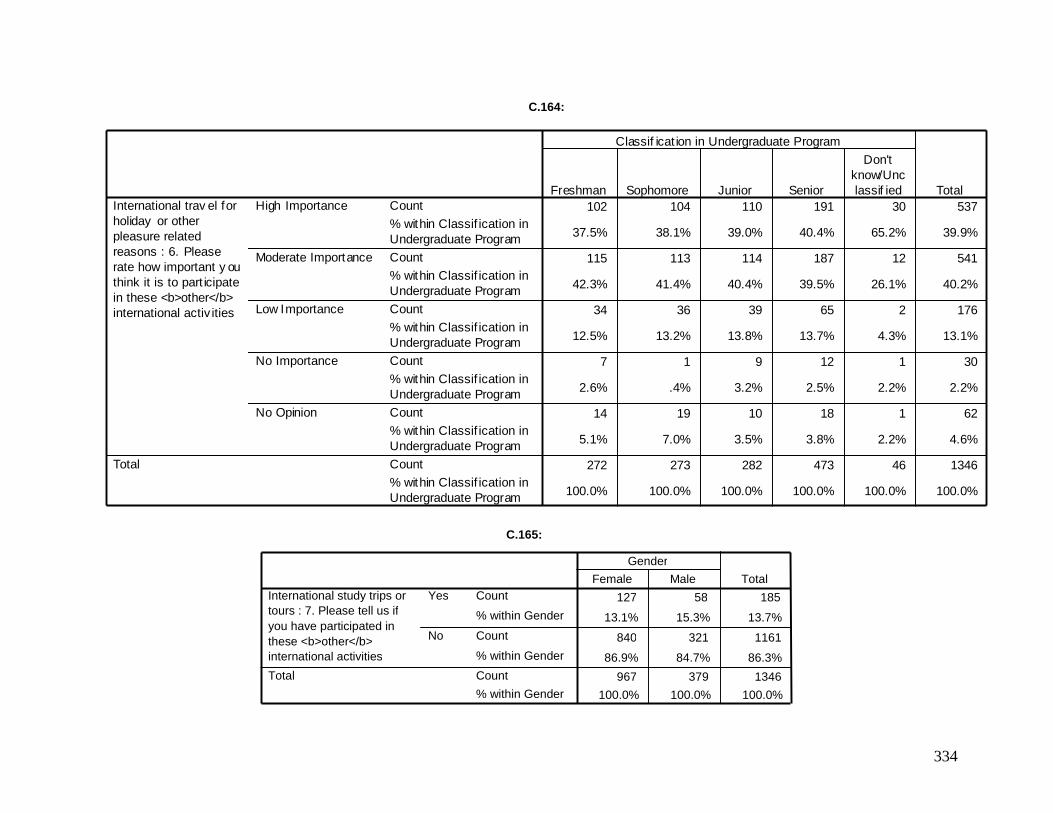
334
Crosstab
102 104 110 191 30 537
37.5% 38.1% 39.0% 40.4% 65.2% 39.9%
115 113 114 187 12 541
42.3% 41.4% 40.4% 39.5% 26.1% 40.2%
34 36 39 65 2 176
12.5% 13.2% 13.8% 13.7% 4.3% 13.1%
7 1 9 12 1 30
2.6% .4% 3.2% 2.5% 2.2% 2.2%
14 19 10 18 1 62
5.1% 7.0% 3.5% 3.8% 2.2% 4.6%
272 273 282 473 46 1346
100.0% 100.0% 100.0% 100.0% 100.0% 100.0%
Count
% within Classif ication in
Undergraduate Program
Count
% within Classif ication in
Undergraduate Program
Count
% within Classif ication in
Undergraduate Program
Count
% within Classif ication in
Undergraduate Program
Count
% within Classif ication in
Undergraduate Program
Count
% within Classif ication in
Undergraduate Program
High Importance
Moderate Importance
Low Importance
No Importance
No Opinion
International trav el for
holiday or other
pleasure related
reasons : 6. Please
rate how important y ou
think it is to part icipate
in these <b>other</b>
international activ ities
Total
Freshman Sophomore Junior Senior
Don't
know/Unc
lassif ied
Classif icat ion in Undergraduate Program
Total
C.165:
127 58 185
13.1% 15.3% 13.7%
840 321 1161
86.9% 84.7% 86.3%
967 379 1346
100.0% 100.0% 100.0%
Count
% within Gender
Count
% within Gender
Count
% within Gender
Yes
No
International study trips or tours : 7. Please tell us if you have participated in these <b>other</b> international activities
Total
Female Male Gender
Total
C.164:
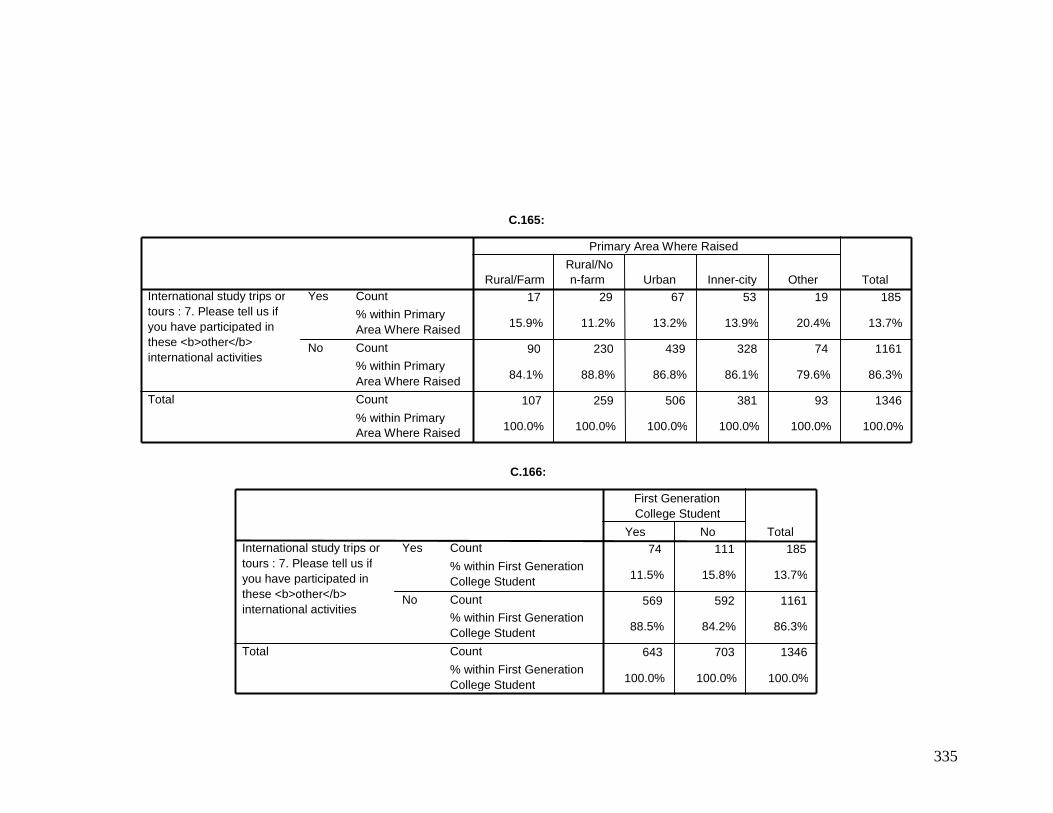
335
C.165:
17 29 67 53 19 185
15.9% 11.2% 13.2% 13.9% 20.4% 13.7%
90 230 439 328 74 1161
84.1% 88.8% 86.8% 86.1% 79.6% 86.3%
107 259 506 381 93 1346
100.0% 100.0% 100.0% 100.0% 100.0% 100.0%
Count
% within Primary Area Where Raised
Count % within Primary Area Where Raised Count
% within Primary Area Where Raised
Yes
No
International study trips or tours : 7. Please tell us if you have participated in these <b>other</b> international activities
Total
Rural/Farm Rural/No n-farm Urban Inner-city Other
Primary Area Where Raised
Total
C.166:
74 111 185
11.5% 15.8% 13.7%
569 592 1161
88.5% 84.2% 86.3%
643 703 1346
100.0% 100.0% 100.0%
Count
% within First Generation College Student
Count % within First Generation College Student
Count
% within First Generation College Student
Yes
No
International study trips or tours : 7. Please tell us if you have participated in these <b>other</b> international activities
Total
Yes No
First Generation College Student
Total
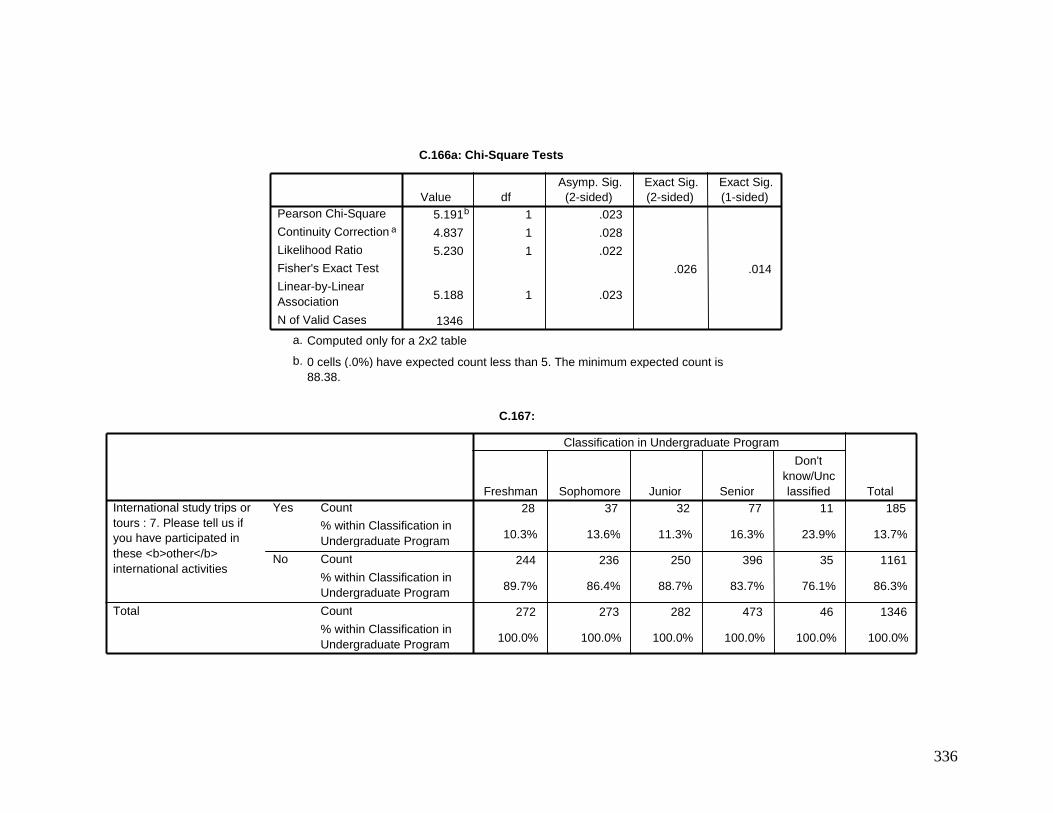
336
C.166a: Chi-Square Tests
5.191 b 1 .023
4.837 1 .028
5.230 1 .022
.026 .014
5.188 1 .023
1346
Pearson Chi-Square
Continuity Correction a
Likelihood Ratio
Fisher's Exact Test
Linear-by-Linear Association
N of Valid Cases
Value df Asymp. Sig.
(2-sided) Exact Sig. (2-sided)
Exact Sig. (1-sided)
Computed only for a 2x2 table a.
0 cells (.0%) have expected count less than 5. The minimum expected count is 88.38.
b.
C.167:
28 37 32 77 11 185
10.3% 13.6% 11.3% 16.3% 23.9% 13.7%
244 236 250 396 35 1161
89.7% 86.4% 88.7% 83.7% 76.1% 86.3%
272 273 282 473 46 1346
100.0% 100.0% 100.0% 100.0% 100.0% 100.0%
Count % within Classification in Undergraduate Program Count
% within Classification in Undergraduate Program
Count
% within Classification in Undergraduate Program
Yes
No
International study trips or tours : 7. Please tell us if you have participated in these <b>other</b> international activities
Total
Freshman Sophomore Junior Senior
Don't know/Unc lassified
Classification in Undergraduate Program
Total
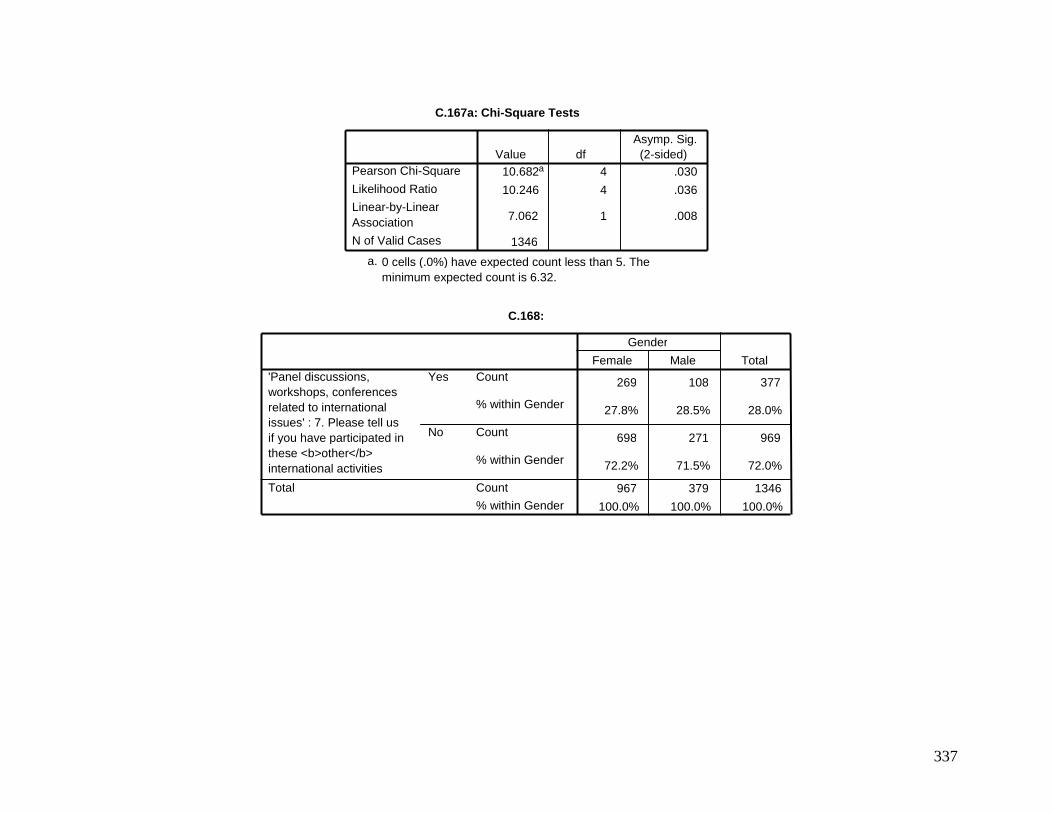
337
C.167a: Chi-Square Tests
10.682 a 4 .030
10.246 4 .036
7.062 1 .008
1346
Pearson Chi-Square
Likelihood Ratio Linear-by-Linear Association N of Valid Cases
Value df Asymp. Sig. (2-sided)
0 cells (.0%) have expected count less than 5. The minimum expected count is 6.32.
a.
C.168:
269 108 377
27.8% 28.5% 28.0%
698 271 969
72.2% 71.5% 72.0%
967 379 1346
100.0% 100.0% 100.0%
Count
% within Gender
Count
% within Gender
Count % within Gender
Yes
No
'Panel discussions, workshops, conferences related to international issues' : 7. Please tell us if you have participated in these <b>other</b> international activities
Total
Female Male
Gender
Total
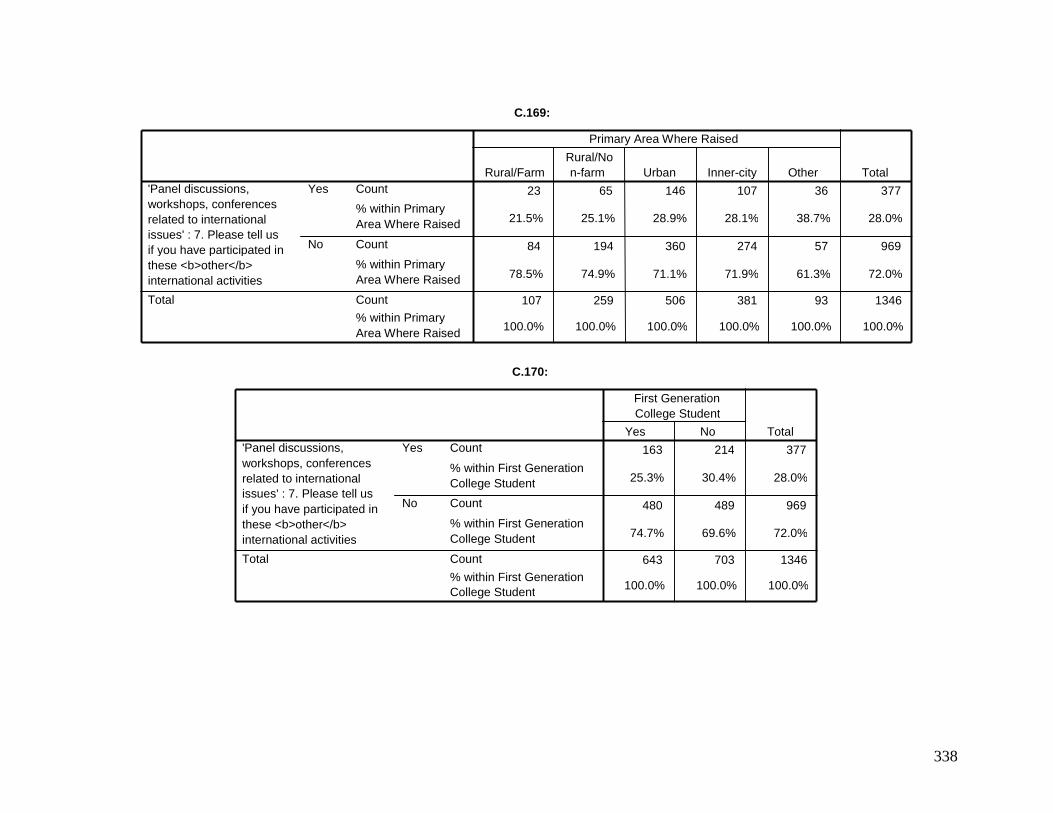
338
C.169:
23 65 146 107 36 377
21.5% 25.1% 28.9% 28.1% 38.7% 28.0%
84 194 360 274 57 969
78.5% 74.9% 71.1% 71.9% 61.3% 72.0%
107 259 506 381 93 1346
100.0% 100.0% 100.0% 100.0% 100.0% 100.0%
Count
% within Primary Area Where Raised
Count
% within Primary Area Where Raised
Count % within Primary Area Where Raised
Yes
No
'Panel discussions, workshops, conferences related to international issues' : 7. Please tell us if you have participated in these <b>other</b> international activities
Total
Rural/Farm Rural/No n-farm Urban Inner-city Other
Primary Area Where Raised
Total
C.170:
163 214 377
25.3% 30.4% 28.0%
480 489 969
74.7% 69.6% 72.0%
643 703 1346
100.0% 100.0% 100.0%
Count
% within First Generation College Student
Count
% within First Generation College Student
Count
% within First Generation College Student
Yes
No
'Panel discussions, workshops, conferences related to international issues' : 7. Please tell us if you have participated in these <b>other</b> international activities
Total
Yes No
First Generation College Student
Total
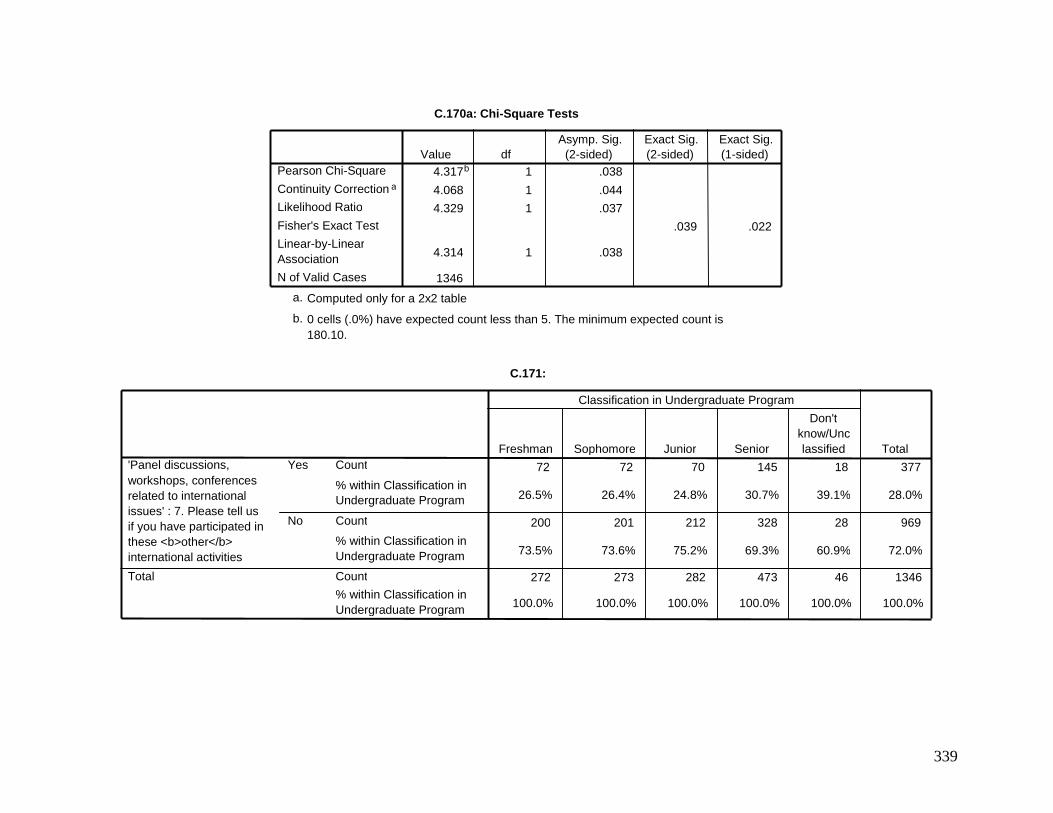
339
C.170a: Chi-Square Tests
4.317 b 1 .038
4.068 1 .044
4.329 1 .037
.039 .022
4.314 1 .038
1346
Pearson Chi-Square
Continuity Correction a
Likelihood Ratio
Fisher's Exact Test
Linear-by-Linear Association
N of Valid Cases
Value df Asymp. Sig.
(2-sided) Exact Sig. (2-sided)
Exact Sig. (1-sided)
Computed only for a 2x2 table a.
0 cells (.0%) have expected count less than 5. The minimum expected count is 180.10.
b.
C.171:
72 72 70 145 18 377
26.5% 26.4% 24.8% 30.7% 39.1% 28.0%
200 201 212 328 28 969
73.5% 73.6% 75.2% 69.3% 60.9% 72.0%
272 273 282 473 46 1346
100.0% 100.0% 100.0% 100.0% 100.0% 100.0%
Count
% within Classification in Undergraduate Program
Count
% within Classification in Undergraduate Program
Count
% within Classification in Undergraduate Program
Yes
No
'Panel discussions, workshops, conferences related to international issues' : 7. Please tell us if you have participated in these <b>other</b> international activities
Total
Freshman Sophomore Junior Senior
Don't know/Unc lassified
Classification in Undergraduate Program
Total
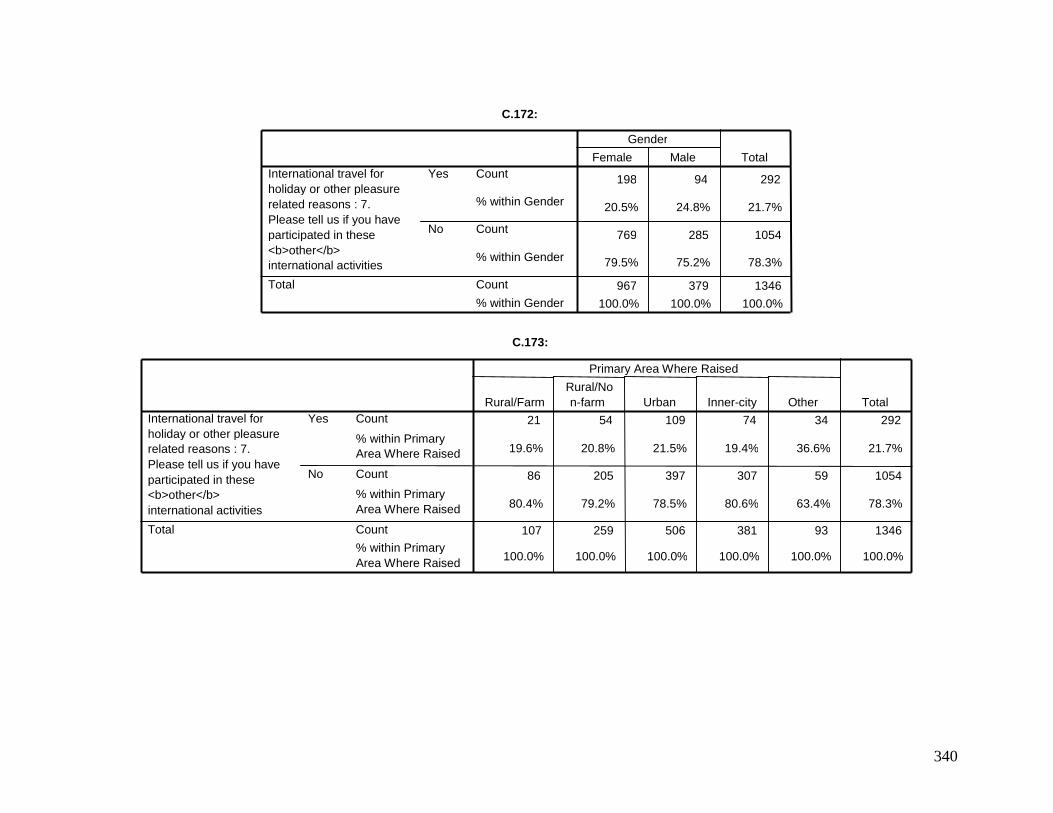
340
C.172:
198 94 292
20.5% 24.8% 21.7%
769 285 1054
79.5% 75.2% 78.3%
967 379 1346 100.0% 100.0% 100.0%
Count
% within Gender
Count
% within Gender
Count
% within Gender
Yes
No
International travel for holiday or other pleasure related reasons : 7. Please tell us if you have participated in these <b>other</b> international activities
Total
Female Male
Gender
Total
C.173:
21 54 109 74 34 292
19.6% 20.8% 21.5% 19.4% 36.6% 21.7%
86 205 397 307 59 1054
80.4% 79.2% 78.5% 80.6% 63.4% 78.3%
107 259 506 381 93 1346
100.0% 100.0% 100.0% 100.0% 100.0% 100.0%
Count
% within Primary Area Where Raised
Count
% within Primary Area Where Raised
Count
% within Primary Area Where Raised
Yes
No
International travel for holiday or other pleasure related reasons : 7. Please tell us if you have participated in these <b>other</b> international activities
Total
Rural/Farm Rural/No n-farm Urban Inner-city Other
Primary Area Where Raised
Total
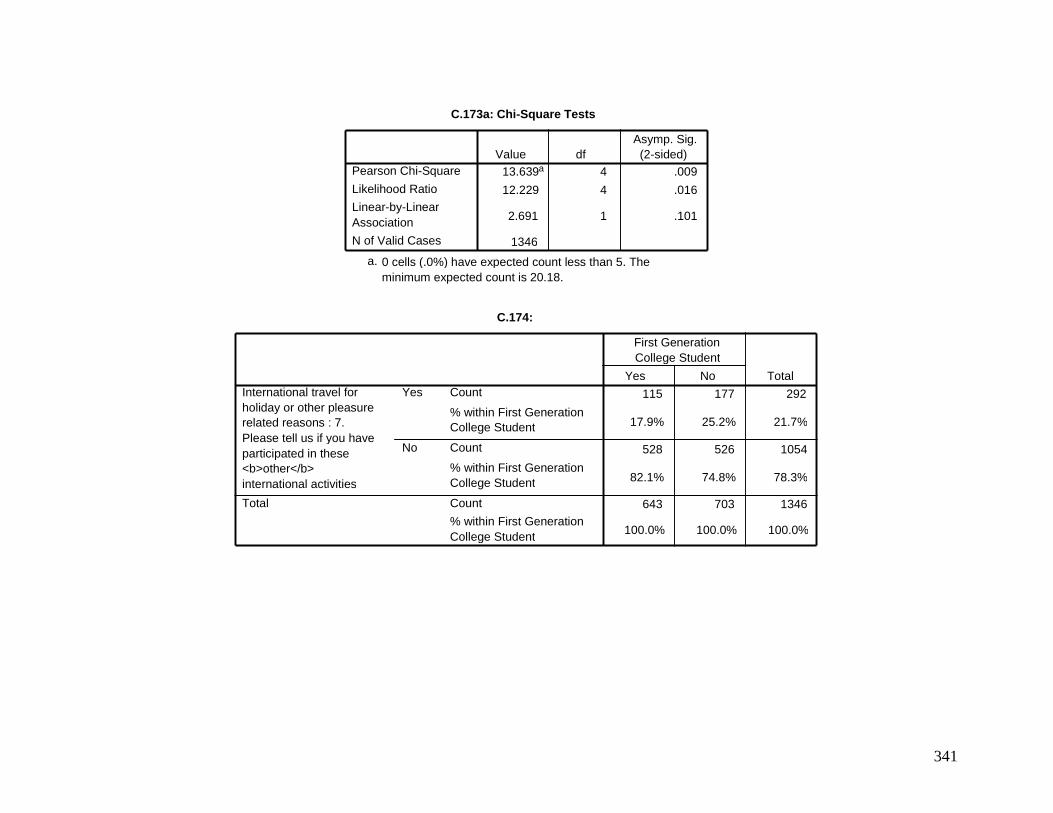
341
C.173a: Chi-Square Tests
13.639 a 4 .009
12.229 4 .016
2.691 1 .101
1346
Pearson Chi-Square
Likelihood Ratio Linear-by-Linear Association N of Valid Cases
Value df Asymp. Sig. (2-sided)
0 cells (.0%) have expected count less than 5. The minimum expected count is 20.18.
a.
C.174:
115 177 292
17.9% 25.2% 21.7%
528 526 1054
82.1% 74.8% 78.3%
643 703 1346
100.0% 100.0% 100.0%
Count
% within First Generation College Student
Count
% within First Generation College Student
Count
% within First Generation College Student
Yes
No
International travel for holiday or other pleasure related reasons : 7. Please tell us if you have participated in these <b>other</b> international activities
Total
Yes No
First Generation College Student
Total
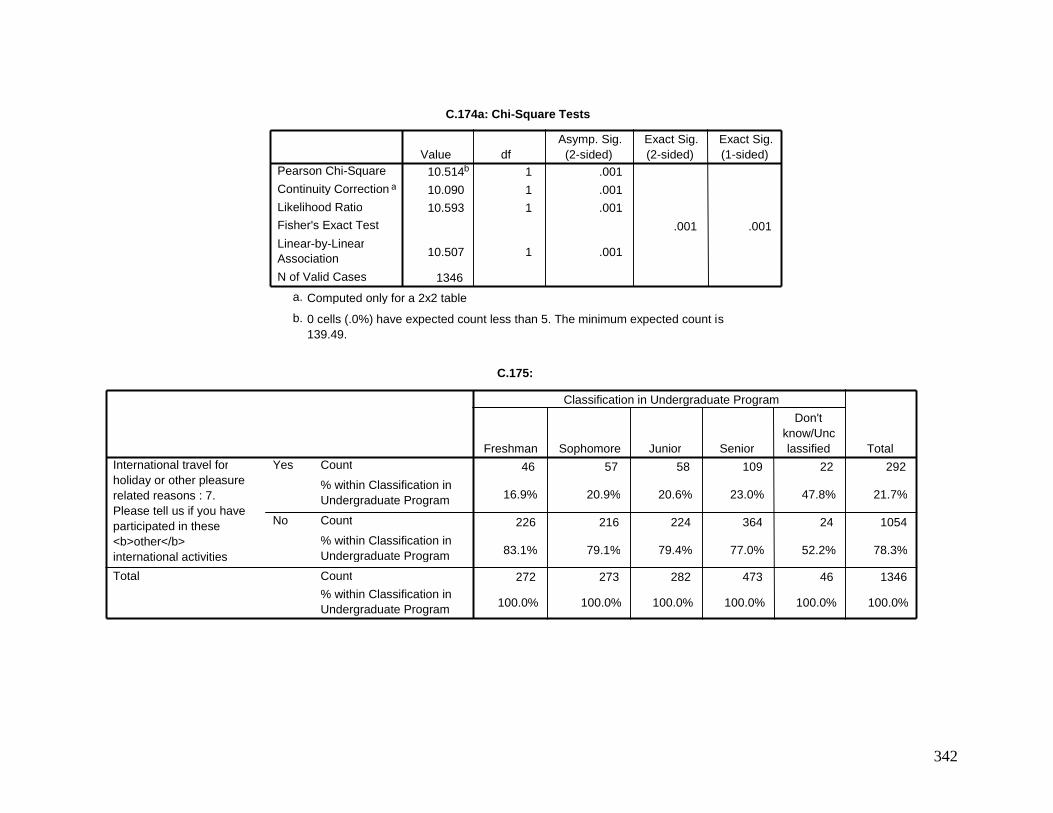
342
C.174a: Chi-Square Tests
10.514 b 1 .001
10.090 1 .001 10.593 1 .001
.001 .001
10.507 1 .001
1346
Pearson Chi-Square
Continuity Correction a
Likelihood Ratio Fisher's Exact Test
Linear-by-Linear Association
N of Valid Cases
Value df Asymp. Sig.
(2-sided) Exact Sig. (2-sided)
Exact Sig. (1-sided)
Computed only for a 2x2 table a.
0 cells (.0%) have expected count less than 5. The minimum expected count is 139.49.
b.
C.175:
46 57 58 109 22 292
16.9% 20.9% 20.6% 23.0% 47.8% 21.7%
226 216 224 364 24 1054
83.1% 79.1% 79.4% 77.0% 52.2% 78.3%
272 273 282 473 46 1346
100.0% 100.0% 100.0% 100.0% 100.0% 100.0%
Count
% within Classification in Undergraduate Program
Count
% within Classification in Undergraduate Program
Count
% within Classification in Undergraduate Program
Yes
No
International travel for holiday or other pleasure related reasons : 7. Please tell us if you have participated in these <b>other</b> international activities
Total
Freshman Sophomore Junior Senior
Don't know/Unc lassified
Classification in Undergraduate Program
Total
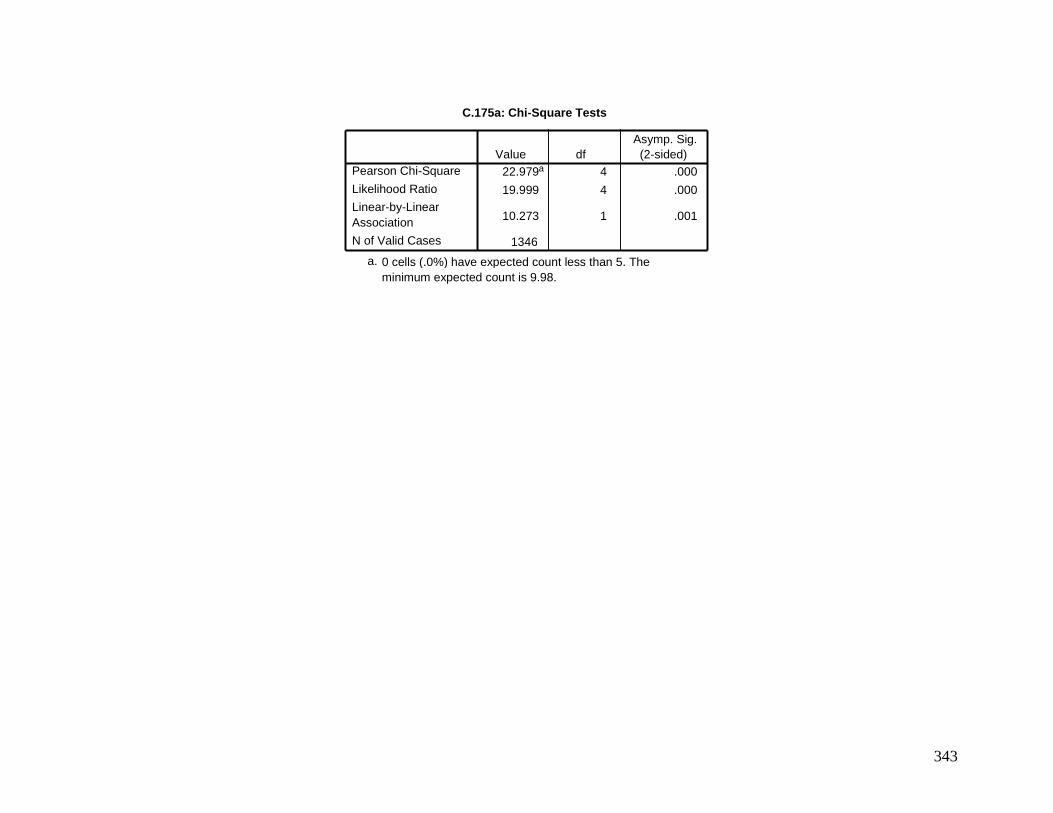
343
C.175a: Chi-Square Tests
22.979 a 4 .000
19.999 4 .000
10.273 1 .001
1346
Pearson Chi-Square
Likelihood Ratio Linear-by-Linear Association N of Valid Cases
Value df Asymp. Sig. (2-sided)
0 cells (.0%) have expected count less than 5. The minimum expected count is 9.98.
a.
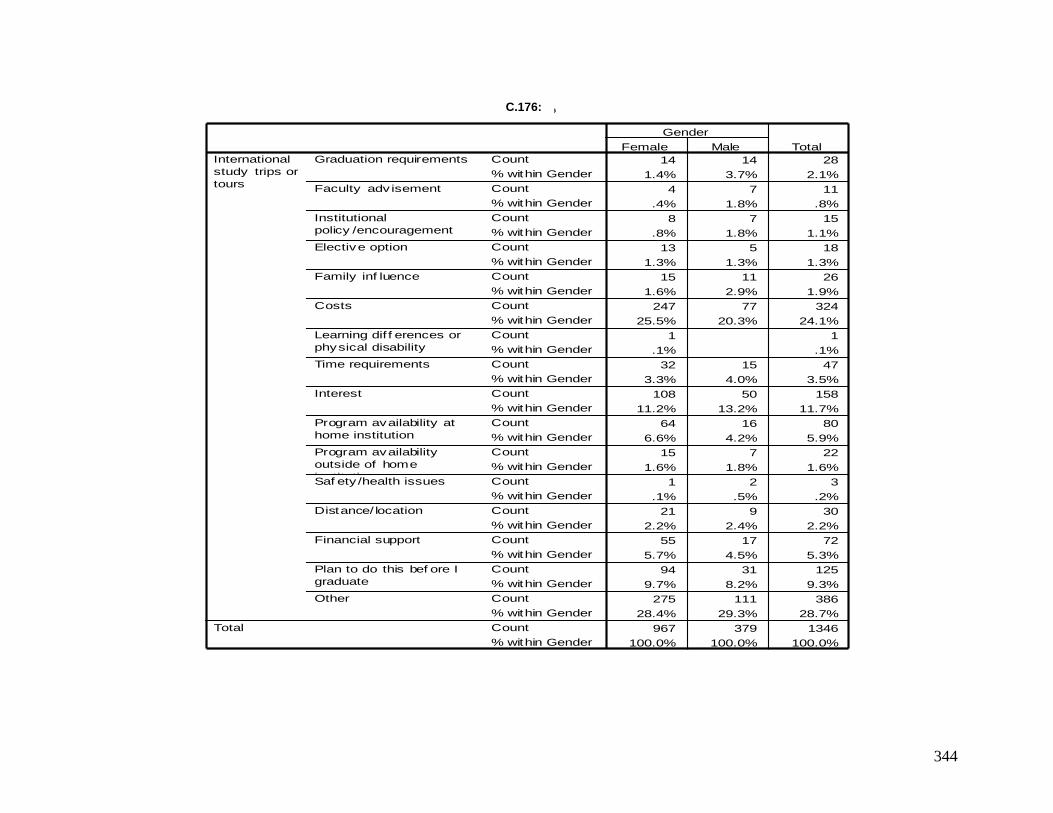
344
Crosstab
14 14 28
1.4% 3.7% 2.1%
4 7 11
.4% 1.8% .8%
8 7 15
.8% 1.8% 1.1%
13 5 18
1.3% 1.3% 1.3%
15 11 26
1.6% 2.9% 1.9%
247 77 324
25.5% 20.3% 24.1%
1 1
.1% .1%
32 15 47
3.3% 4.0% 3.5%
108 50 158
11.2% 13.2% 11.7%
64 16 80
6.6% 4.2% 5.9%
15 7 22
1.6% 1.8% 1.6%
1 2 3
.1% .5% .2%
21 9 30
2.2% 2.4% 2.2%
55 17 72
5.7% 4.5% 5.3%
94 31 125
9.7% 8.2% 9.3%
275 111 386
28.4% 29.3% 28.7%
967 379 1346
100.0% 100.0% 100.0%
Count
% within Gender
Count
% within Gender
Count
% within Gender
Count
% within Gender
Count
% within Gender
Count
% within Gender
Count
% within Gender
Count
% within Gender
Count
% within Gender
Count
% within Gender
Count
% within Gender
Count
% within Gender
Count
% within Gender
Count
% within Gender
Count
% within Gender
Count
% within Gender
Count
% within Gender
Graduation requirements
Faculty adv isement
Institutional
policy /encouragement
Elective option
Family inf luence
Costs
Learning dif f erences or
physical disability
Time requirements
Interest
Program availability at
home institution
Program availability
outside of home
institutionSaf ety /health issues
Distance/ location
Financial support
Plan to do this bef ore I
graduate
Other
International
study trips or
tours
Total
Female Male
Gender
Total
C.176:
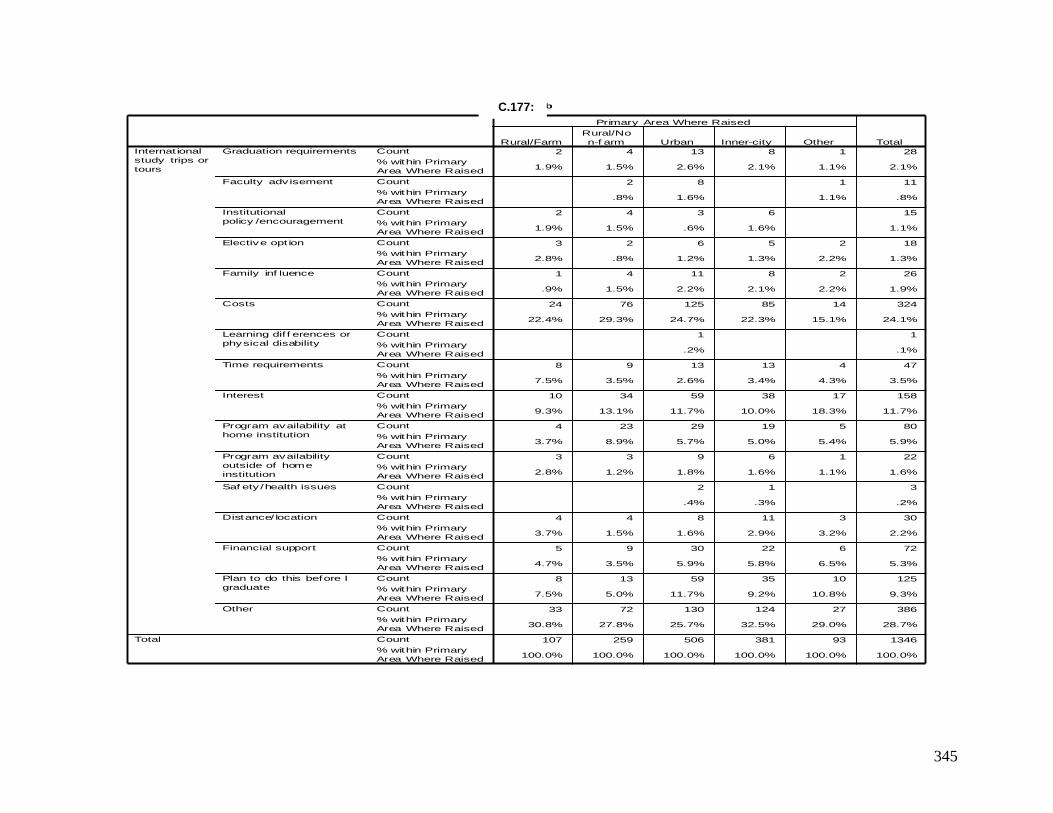
345
Crosstab
2 4 13 8 1 28
1.9% 1.5% 2.6% 2.1% 1.1% 2.1%
2 8 1 11
.8% 1.6% 1.1% .8%
2 4 3 6 15
1.9% 1.5% .6% 1.6% 1.1%
3 2 6 5 2 18
2.8% .8% 1.2% 1.3% 2.2% 1.3%
1 4 11 8 2 26
.9% 1.5% 2.2% 2.1% 2.2% 1.9%
24 76 125 85 14 324
22.4% 29.3% 24.7% 22.3% 15.1% 24.1%
1 1
.2% .1%
8 9 13 13 4 47
7.5% 3.5% 2.6% 3.4% 4.3% 3.5%
10 34 59 38 17 158
9.3% 13.1% 11.7% 10.0% 18.3% 11.7%
4 23 29 19 5 80
3.7% 8.9% 5.7% 5.0% 5.4% 5.9%
3 3 9 6 1 22
2.8% 1.2% 1.8% 1.6% 1.1% 1.6%
2 1 3
.4% .3% .2%
4 4 8 11 3 30
3.7% 1.5% 1.6% 2.9% 3.2% 2.2%
5 9 30 22 6 72
4.7% 3.5% 5.9% 5.8% 6.5% 5.3%
8 13 59 35 10 125
7.5% 5.0% 11.7% 9.2% 10.8% 9.3%
33 72 130 124 27 386
30.8% 27.8% 25.7% 32.5% 29.0% 28.7%
107 259 506 381 93 1346
100.0% 100.0% 100.0% 100.0% 100.0% 100.0%
Count
% within Primary
Area Where Raised
Count
% within Primary
Area Where Raised
Count
% within Primary
Area Where Raised
Count
% within Primary
Area Where Raised
Count
% within Primary
Area Where Raised
Count
% within Primary
Area Where Raised
Count
% within Primary
Area Where Raised
Count
% within Primary
Area Where Raised
Count
% within Primary
Area Where Raised
Count
% within Primary
Area Where Raised
Count
% within Primary
Area Where Raised
Count
% within Primary
Area Where Raised
Count
% within Primary
Area Where Raised
Count
% within Primary
Area Where Raised
Count
% within Primary
Area Where Raised
Count
% within Primary
Area Where Raised
Count
% within Primary
Area Where Raised
Graduation requirements
Faculty adv isement
Institutional
policy /encouragement
Elective opt ion
Family inf luence
Costs
Learning dif f erences or
physical disability
Time requirements
Interest
Program availability at
home institution
Program availability
outside of home
institution
Saf ety /health issues
Distance/ location
Financial support
Plan to do this before I
graduate
Other
Internat ional
study trips or
tours
Total
Rural/Farm
Rural/No
n-f arm Urban Inner-city Other
Primary Area Where Raised
Total
C.177:
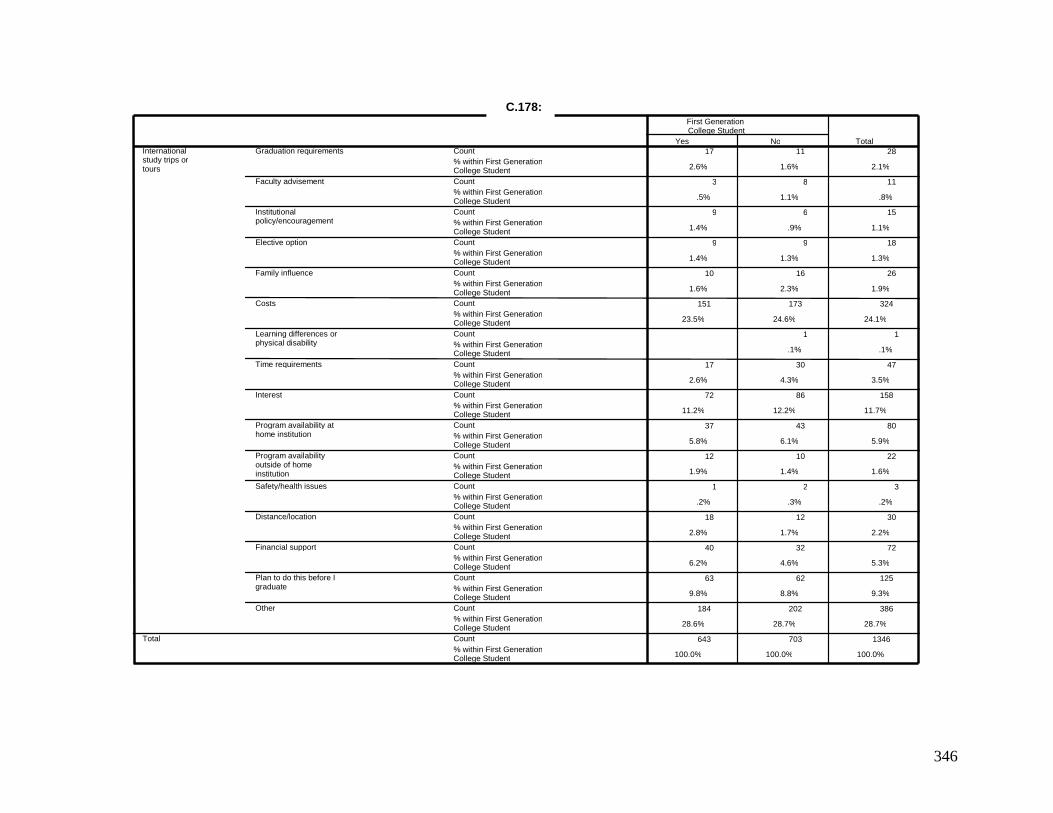
346
Crosstab
17 11 28 2.6% 1.6% 2.1%
3 8 11 .5% 1.1% .8%
9 6 15 1.4% .9% 1.1%
9 9 18 1.4% 1.3% 1.3%
10 16 26 1.6% 2.3% 1.9%
151 173 324 23.5% 24.6% 24.1%
1 1 .1% .1%
17 30 47 2.6% 4.3% 3.5%
72 86 158 11.2% 12.2% 11.7%
37 43 80 5.8% 6.1% 5.9%
12 10 22 1.9% 1.4% 1.6%
1 2 3 .2% .3% .2%
18 12 30 2.8% 1.7% 2.2%
40 32 72 6.2% 4.6% 5.3%
63 62 125 9.8% 8.8% 9.3%
184 202 386 28.6% 28.7% 28.7%
643 703 1346 100.0% 100.0% 100.0%
Count % within First Generation College Student Count % within First Generation College Student Count % within First Generation College Student Count % within First Generation College Student Count % within First Generation College Student Count % within First Generation College Student Count % within First Generation College Student Count % within First Generation College Student Count % within First Generation College Student Count % within First Generation College Student Count % within First Generation College Student Count % within First Generation College Student Count % within First Generation College Student Count % within First Generation College Student Count % within First Generation College Student Count % within First Generation College Student Count % within First Generation College Student
Graduation requirements
Faculty advisement
Institutional policy/encouragement
Elective option
Family influence
Costs
Learning differences or physical disability
Time requirements
Interest
Program availability at home institution
Program availability outside of home institution Safety/health issues
Distance/location
Financial support
Plan to do this before I graduate
Other
International study trips or tours
Total
Yes No
First Generation College Student
Total
C.178:
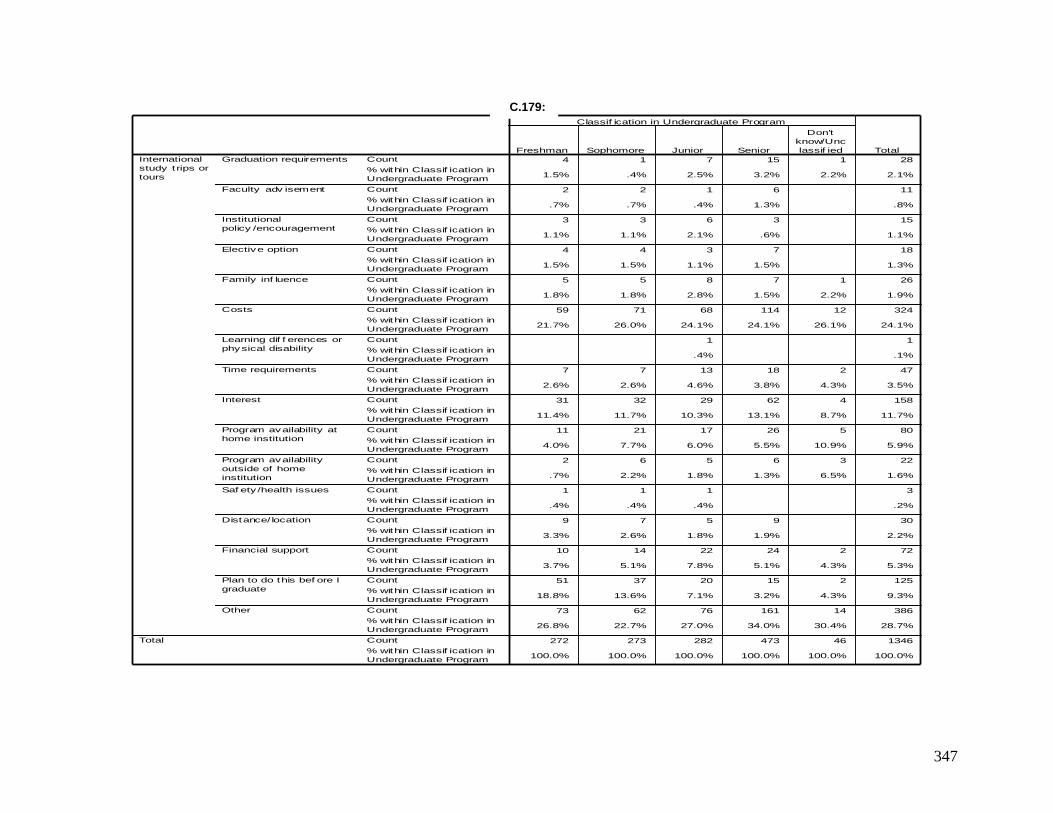
347
Crosstab
4 1 7 15 1 28
1.5% .4% 2.5% 3.2% 2.2% 2.1%
2 2 1 6 11
.7% .7% .4% 1.3% .8%
3 3 6 3 15
1.1% 1.1% 2.1% .6% 1.1%
4 4 3 7 18
1.5% 1.5% 1.1% 1.5% 1.3%
5 5 8 7 1 26
1.8% 1.8% 2.8% 1.5% 2.2% 1.9%
59 71 68 114 12 324
21.7% 26.0% 24.1% 24.1% 26.1% 24.1%
1 1
.4% .1%
7 7 13 18 2 47
2.6% 2.6% 4.6% 3.8% 4.3% 3.5%
31 32 29 62 4 158
11.4% 11.7% 10.3% 13.1% 8.7% 11.7%
11 21 17 26 5 80
4.0% 7.7% 6.0% 5.5% 10.9% 5.9%
2 6 5 6 3 22
.7% 2.2% 1.8% 1.3% 6.5% 1.6%
1 1 1 3
.4% .4% .4% .2%
9 7 5 9 30
3.3% 2.6% 1.8% 1.9% 2.2%
10 14 22 24 2 72
3.7% 5.1% 7.8% 5.1% 4.3% 5.3%
51 37 20 15 2 125
18.8% 13.6% 7.1% 3.2% 4.3% 9.3%
73 62 76 161 14 386
26.8% 22.7% 27.0% 34.0% 30.4% 28.7%
272 273 282 473 46 1346
100.0% 100.0% 100.0% 100.0% 100.0% 100.0%
Count
% within Classif ication in
Undergraduate Program
Count
% within Classif ication in
Undergraduate Program
Count
% within Classif ication in
Undergraduate Program
Count
% within Classif ication in
Undergraduate Program
Count
% within Classif ication in
Undergraduate Program
Count
% within Classif ication in
Undergraduate Program
Count
% within Classif ication in
Undergraduate Program
Count
% within Classif ication in
Undergraduate Program
Count
% within Classif ication in
Undergraduate Program
Count
% within Classif ication in
Undergraduate Program
Count
% within Classif ication in
Undergraduate Program
Count
% within Classif ication in
Undergraduate Program
Count
% within Classif ication in
Undergraduate Program
Count
% within Classif ication in
Undergraduate Program
Count
% within Classif ication in
Undergraduate Program
Count
% within Classif ication in
Undergraduate Program
Count
% within Classif ication in
Undergraduate Program
Graduation requirements
Faculty adv isement
Institutional
policy /encouragement
Elective option
Family inf luence
Costs
Learning dif f erences or
physical disability
Time requirements
Interest
Program availability at
home institution
Program availability
outside of home
institution
Saf ety /health issues
Distance/ location
Financial support
Plan to do this bef ore I
graduate
Other
International
study t rips or
tours
Total
Freshman Sophomore Junior Senior
Don't
know/Unc
lassif ied
Classif ication in Undergraduate Program
Total
C.179:
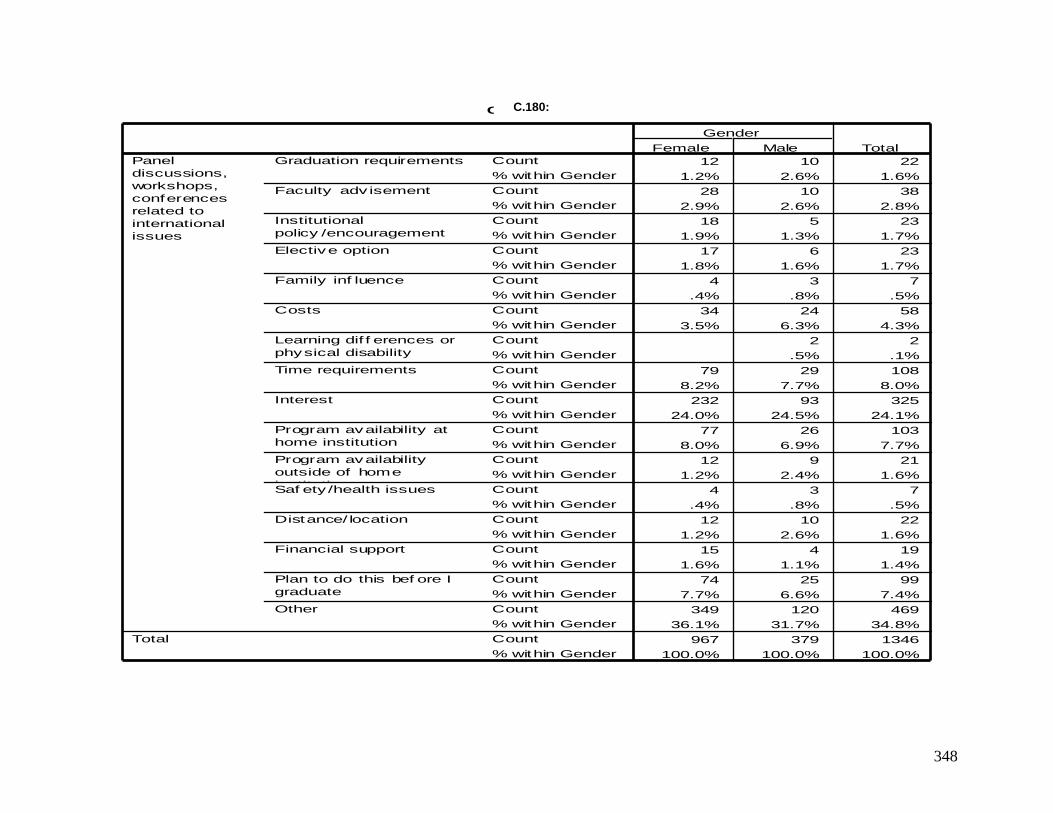
348
Crosstab
12 10 22
1.2% 2.6% 1.6%
28 10 38
2.9% 2.6% 2.8%
18 5 23
1.9% 1.3% 1.7%
17 6 23
1.8% 1.6% 1.7%
4 3 7
.4% .8% .5%
34 24 58
3.5% 6.3% 4.3%
2 2
.5% .1%
79 29 108
8.2% 7.7% 8.0%
232 93 325
24.0% 24.5% 24.1%
77 26 103
8.0% 6.9% 7.7%
12 9 21
1.2% 2.4% 1.6%
4 3 7
.4% .8% .5%
12 10 22
1.2% 2.6% 1.6%
15 4 19
1.6% 1.1% 1.4%
74 25 99
7.7% 6.6% 7.4%
349 120 469
36.1% 31.7% 34.8%
967 379 1346
100.0% 100.0% 100.0%
Count
% within Gender
Count
% within Gender
Count
% within Gender
Count
% within Gender
Count
% within Gender
Count
% within Gender
Count
% within Gender
Count
% within Gender
Count
% within Gender
Count
% within Gender
Count
% within Gender
Count
% within Gender
Count
% within Gender
Count
% within Gender
Count
% within Gender
Count
% within Gender
Count
% within Gender
Graduation requirements
Faculty adv isement
Institutional
policy /encouragement
Elective option
Family inf luence
Costs
Learning dif f erences or
physical disability
Time requirements
Interest
Program availability at
home institution
Program availability
outside of home
institutionSaf ety /health issues
Distance/ location
Financial support
Plan to do this bef ore I
graduate
Other
Panel
discussions,
workshops,
conferences
related to
international
issues
Total
Female Male
Gender
Total
C.180:
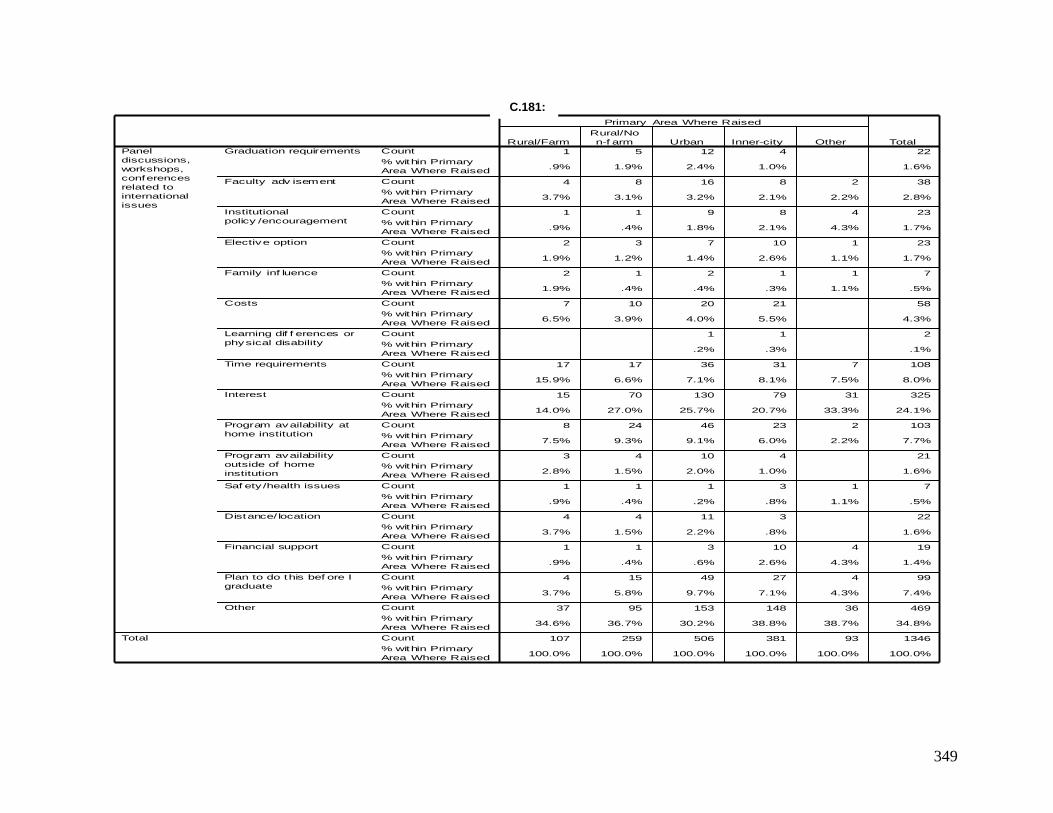
349
Crosstab
1 5 12 4 22
.9% 1.9% 2.4% 1.0% 1.6%
4 8 16 8 2 38
3.7% 3.1% 3.2% 2.1% 2.2% 2.8%
1 1 9 8 4 23
.9% .4% 1.8% 2.1% 4.3% 1.7%
2 3 7 10 1 23
1.9% 1.2% 1.4% 2.6% 1.1% 1.7%
2 1 2 1 1 7
1.9% .4% .4% .3% 1.1% .5%
7 10 20 21 58
6.5% 3.9% 4.0% 5.5% 4.3%
1 1 2
.2% .3% .1%
17 17 36 31 7 108
15.9% 6.6% 7.1% 8.1% 7.5% 8.0%
15 70 130 79 31 325
14.0% 27.0% 25.7% 20.7% 33.3% 24.1%
8 24 46 23 2 103
7.5% 9.3% 9.1% 6.0% 2.2% 7.7%
3 4 10 4 21
2.8% 1.5% 2.0% 1.0% 1.6%
1 1 1 3 1 7
.9% .4% .2% .8% 1.1% .5%
4 4 11 3 22
3.7% 1.5% 2.2% .8% 1.6%
1 1 3 10 4 19
.9% .4% .6% 2.6% 4.3% 1.4%
4 15 49 27 4 99
3.7% 5.8% 9.7% 7.1% 4.3% 7.4%
37 95 153 148 36 469
34.6% 36.7% 30.2% 38.8% 38.7% 34.8%
107 259 506 381 93 1346
100.0% 100.0% 100.0% 100.0% 100.0% 100.0%
Count
% within Primary
Area Where Raised
Count
% within Primary
Area Where Raised
Count
% within Primary
Area Where Raised
Count
% within Primary
Area Where Raised
Count
% within Primary
Area Where Raised
Count
% within Primary
Area Where Raised
Count
% within Primary
Area Where Raised
Count
% within Primary
Area Where Raised
Count
% within Primary
Area Where Raised
Count
% within Primary
Area Where Raised
Count
% within Primary
Area Where Raised
Count
% within Primary
Area Where Raised
Count
% within Primary
Area Where Raised
Count
% within Primary
Area Where Raised
Count
% within Primary
Area Where Raised
Count
% within Primary
Area Where Raised
Count
% within Primary
Area Where Raised
Graduation requirements
Faculty adv isement
Institutional
policy /encouragement
Elective option
Family inf luence
Costs
Learning dif f erences or
physical disability
Time requirements
Interest
Program availability at
home institution
Program availability
outside of home
institution
Saf ety /health issues
Distance/ location
Financial support
Plan to do this bef ore I
graduate
Other
Panel
discussions,
workshops,
conferences
related to
international
issues
Total
Rural/Farm
Rural/No
n-f arm Urban Inner-city Other
Primary Area Where Raised
Total
C.181:
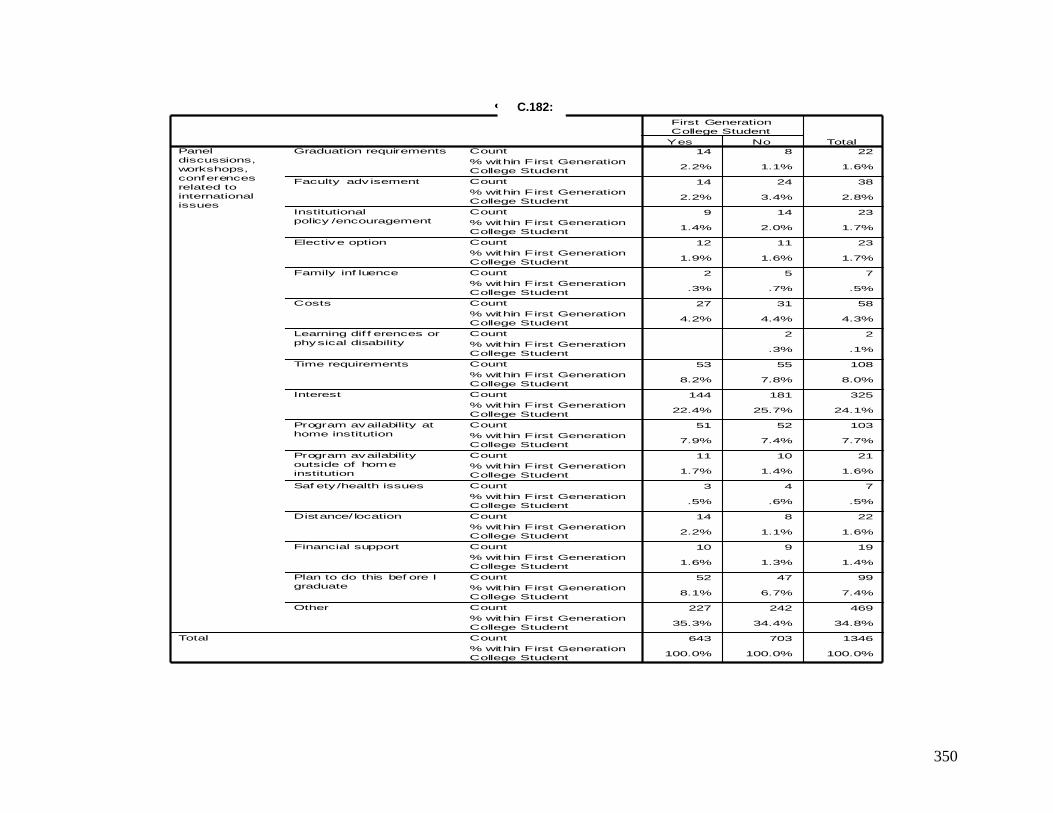
350
Crosstab
14 8 22
2.2% 1.1% 1.6%
14 24 38
2.2% 3.4% 2.8%
9 14 23
1.4% 2.0% 1.7%
12 11 23
1.9% 1.6% 1.7%
2 5 7
.3% .7% .5%
27 31 58
4.2% 4.4% 4.3%
2 2
.3% .1%
53 55 108
8.2% 7.8% 8.0%
144 181 325
22.4% 25.7% 24.1%
51 52 103
7.9% 7.4% 7.7%
11 10 21
1.7% 1.4% 1.6%
3 4 7
.5% .6% .5%
14 8 22
2.2% 1.1% 1.6%
10 9 19
1.6% 1.3% 1.4%
52 47 99
8.1% 6.7% 7.4%
227 242 469
35.3% 34.4% 34.8%
643 703 1346
100.0% 100.0% 100.0%
Count
% within First Generation
College Student
Count
% within First Generation
College Student
Count
% within First Generation
College Student
Count
% within First Generation
College Student
Count
% within First Generation
College Student
Count
% within First Generation
College Student
Count
% within First Generation
College Student
Count
% within First Generation
College Student
Count
% within First Generation
College Student
Count
% within First Generation
College Student
Count
% within First Generation
College Student
Count
% within First Generation
College Student
Count
% within First Generation
College Student
Count
% within First Generation
College Student
Count
% within First Generation
College Student
Count
% within First Generation
College Student
Count
% within First Generation
College Student
Graduation requirements
Faculty adv isement
Institutional
policy /encouragement
Elective option
Family inf luence
Costs
Learning dif f erences or
physical disability
Time requirements
Interest
Program availability at
home institution
Program availability
outside of home
institution
Saf ety /health issues
Distance/ location
Financial support
Plan to do this bef ore I
graduate
Other
Panel
discussions,
workshops,
conferences
related to
international
issues
Total
Yes No
First Generation
College Student
Total
C.182:
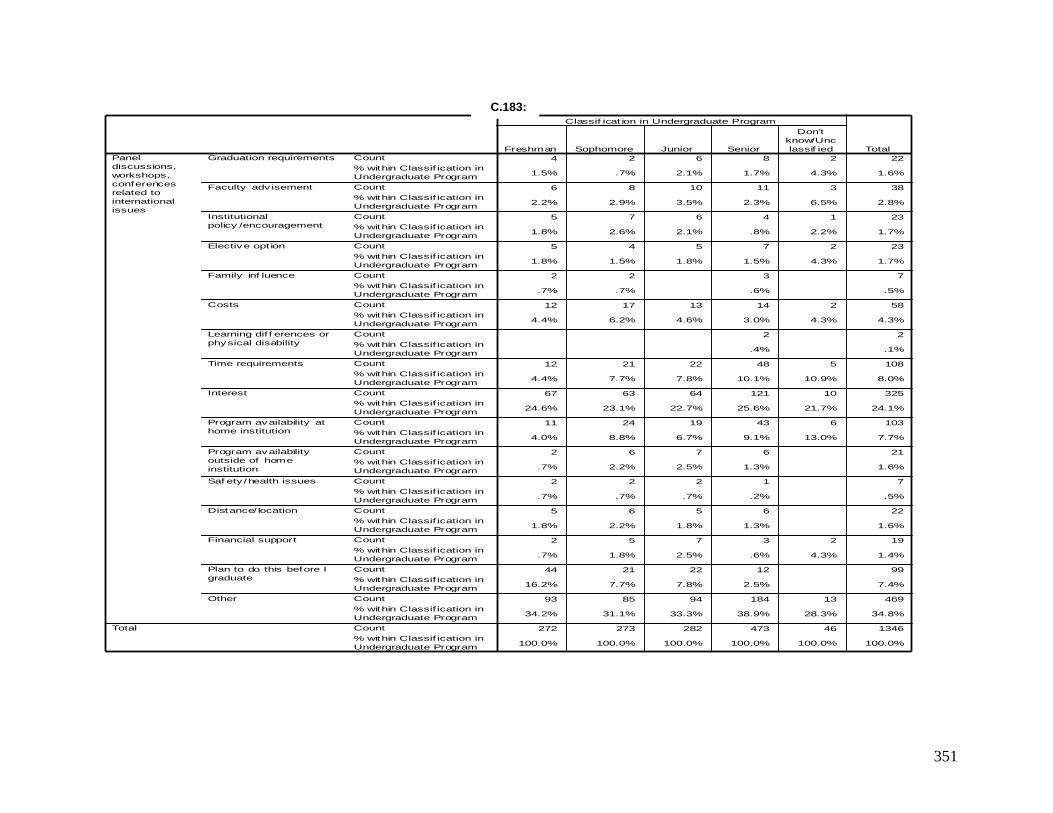
351
Crosstab
4 2 6 8 2 22
1.5% .7% 2.1% 1.7% 4.3% 1.6%
6 8 10 11 3 38
2.2% 2.9% 3.5% 2.3% 6.5% 2.8%
5 7 6 4 1 23
1.8% 2.6% 2.1% .8% 2.2% 1.7%
5 4 5 7 2 23
1.8% 1.5% 1.8% 1.5% 4.3% 1.7%
2 2 3 7
.7% .7% .6% .5%
12 17 13 14 2 58
4.4% 6.2% 4.6% 3.0% 4.3% 4.3%
2 2
.4% .1%
12 21 22 48 5 108
4.4% 7.7% 7.8% 10.1% 10.9% 8.0%
67 63 64 121 10 325
24.6% 23.1% 22.7% 25.6% 21.7% 24.1%
11 24 19 43 6 103
4.0% 8.8% 6.7% 9.1% 13.0% 7.7%
2 6 7 6 21
.7% 2.2% 2.5% 1.3% 1.6%
2 2 2 1 7
.7% .7% .7% .2% .5%
5 6 5 6 22
1.8% 2.2% 1.8% 1.3% 1.6%
2 5 7 3 2 19
.7% 1.8% 2.5% .6% 4.3% 1.4%
44 21 22 12 99
16.2% 7.7% 7.8% 2.5% 7.4%
93 85 94 184 13 469
34.2% 31.1% 33.3% 38.9% 28.3% 34.8%
272 273 282 473 46 1346
100.0% 100.0% 100.0% 100.0% 100.0% 100.0%
Count
% within Classif ication in
Undergraduate Program
Count
% within Classif ication in
Undergraduate Program
Count
% within Classif ication in
Undergraduate Program
Count
% within Classif ication in
Undergraduate Program
Count
% within Classif ication in
Undergraduate Program
Count
% within Classif ication in
Undergraduate Program
Count
% within Classif ication in
Undergraduate Program
Count
% within Classif ication in
Undergraduate Program
Count
% within Classif ication in
Undergraduate Program
Count
% within Classif ication in
Undergraduate Program
Count
% within Classif ication in
Undergraduate Program
Count
% within Classif ication in
Undergraduate Program
Count
% within Classif ication in
Undergraduate Program
Count
% within Classif ication in
Undergraduate Program
Count
% within Classif ication in
Undergraduate Program
Count
% within Classif ication in
Undergraduate Program
Count
% within Classif ication in
Undergraduate Program
Graduation requirements
Faculty adv isement
Institutional
policy /encouragement
Elective opt ion
Family inf luence
Costs
Learning dif f erences or
physical disability
Time requirements
Interest
Program availability at
home institution
Program availability
outside of home
institution
Saf ety /health issues
Distance/ location
Financial support
Plan to do this before I
graduate
Other
Panel
discussions,
workshops,
conferences
related to
international
issues
Total
Freshman Sophomore Junior Senior
Don't
know/Unc
lassif ied
Classif icat ion in Undergraduate Program
Total
C.183:
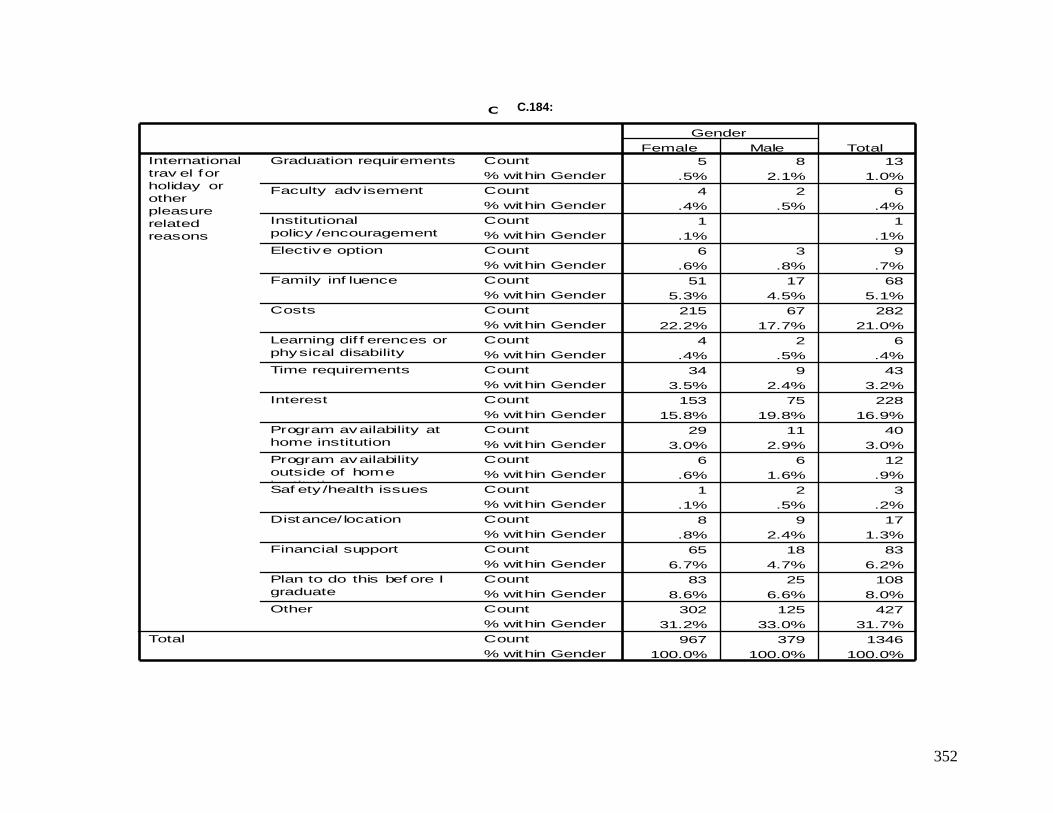
352
Crosstab
5 8 13
.5% 2.1% 1.0%
4 2 6
.4% .5% .4%
1 1
.1% .1%
6 3 9
.6% .8% .7%
51 17 68
5.3% 4.5% 5.1%
215 67 282
22.2% 17.7% 21.0%
4 2 6
.4% .5% .4%
34 9 43
3.5% 2.4% 3.2%
153 75 228
15.8% 19.8% 16.9%
29 11 40
3.0% 2.9% 3.0%
6 6 12
.6% 1.6% .9%
1 2 3
.1% .5% .2%
8 9 17
.8% 2.4% 1.3%
65 18 83
6.7% 4.7% 6.2%
83 25 108
8.6% 6.6% 8.0%
302 125 427
31.2% 33.0% 31.7%
967 379 1346
100.0% 100.0% 100.0%
Count
% within Gender
Count
% within Gender
Count
% within Gender
Count
% within Gender
Count
% within Gender
Count
% within Gender
Count
% within Gender
Count
% within Gender
Count
% within Gender
Count
% within Gender
Count
% within Gender
Count
% within Gender
Count
% within Gender
Count
% within Gender
Count
% within Gender
Count
% within Gender
Count
% within Gender
Graduation requirements
Faculty adv isement
Institutional
policy /encouragement
Elective option
Family inf luence
Costs
Learning dif f erences or
physical disability
Time requirements
Interest
Program availability at
home institution
Program availability
outside of home
institutionSaf ety /health issues
Distance/ location
Financial support
Plan to do this bef ore I
graduate
Other
International
trav el for
holiday or
other
pleasure
related
reasons
Total
Female Male
Gender
Total
C.184:
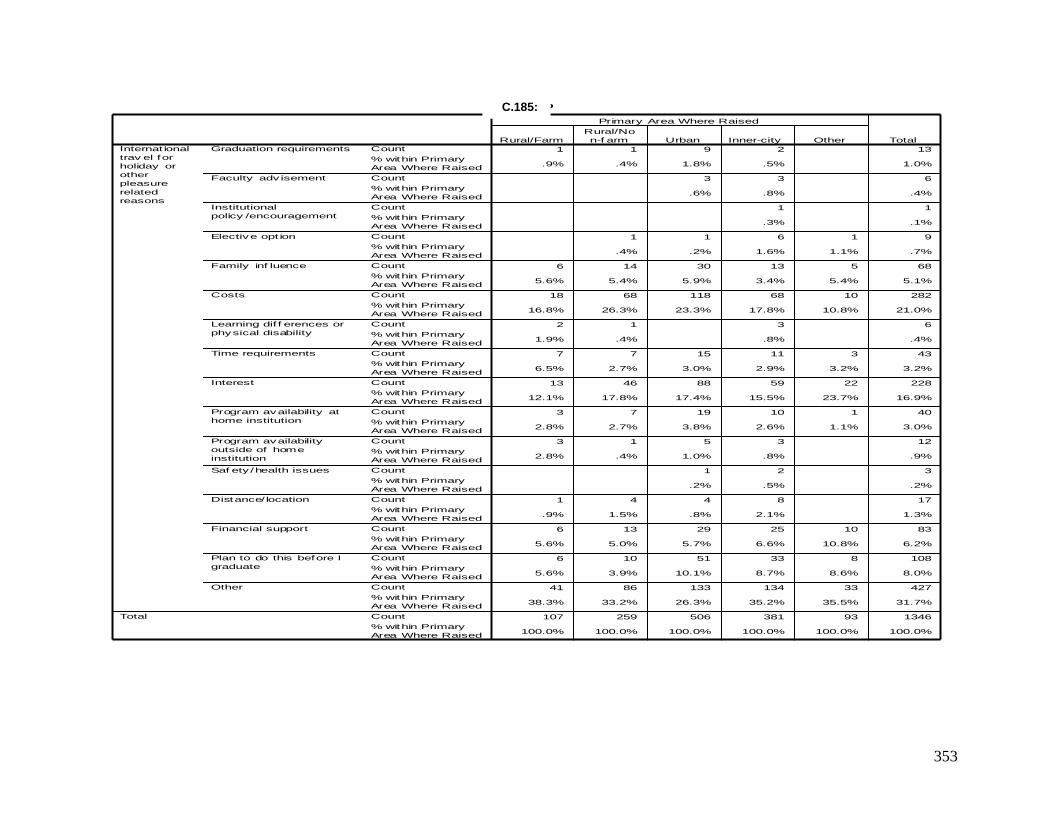
353
Crosstab
1 1 9 2 13
.9% .4% 1.8% .5% 1.0%
3 3 6
.6% .8% .4%
1 1
.3% .1%
1 1 6 1 9
.4% .2% 1.6% 1.1% .7%
6 14 30 13 5 68
5.6% 5.4% 5.9% 3.4% 5.4% 5.1%
18 68 118 68 10 282
16.8% 26.3% 23.3% 17.8% 10.8% 21.0%
2 1 3 6
1.9% .4% .8% .4%
7 7 15 11 3 43
6.5% 2.7% 3.0% 2.9% 3.2% 3.2%
13 46 88 59 22 228
12.1% 17.8% 17.4% 15.5% 23.7% 16.9%
3 7 19 10 1 40
2.8% 2.7% 3.8% 2.6% 1.1% 3.0%
3 1 5 3 12
2.8% .4% 1.0% .8% .9%
1 2 3
.2% .5% .2%
1 4 4 8 17
.9% 1.5% .8% 2.1% 1.3%
6 13 29 25 10 83
5.6% 5.0% 5.7% 6.6% 10.8% 6.2%
6 10 51 33 8 108
5.6% 3.9% 10.1% 8.7% 8.6% 8.0%
41 86 133 134 33 427
38.3% 33.2% 26.3% 35.2% 35.5% 31.7%
107 259 506 381 93 1346
100.0% 100.0% 100.0% 100.0% 100.0% 100.0%
Count
% within Primary
Area Where Raised
Count
% within Primary
Area Where Raised
Count
% within Primary
Area Where Raised
Count
% within Primary
Area Where Raised
Count
% within Primary
Area Where Raised
Count
% within Primary
Area Where Raised
Count
% within Primary
Area Where Raised
Count
% within Primary
Area Where Raised
Count
% within Primary
Area Where Raised
Count
% within Primary
Area Where Raised
Count
% within Primary
Area Where Raised
Count
% within Primary
Area Where Raised
Count
% within Primary
Area Where Raised
Count
% within Primary
Area Where Raised
Count
% within Primary
Area Where Raised
Count
% within Primary
Area Where Raised
Count
% within Primary
Area Where Raised
Graduation requirements
Faculty adv isement
Institutional
policy /encouragement
Elective opt ion
Family inf luence
Costs
Learning dif f erences or
physical disability
Time requirements
Interest
Program availability at
home institution
Program availability
outside of home
institution
Saf ety /health issues
Distance/ location
Financial support
Plan to do this before I
graduate
Other
Internat ional
trav el for
holiday or
other
pleasure
related
reasons
Total
Rural/Farm
Rural/No
n-f arm Urban Inner-city Other
Primary Area Where Raised
Total
C.185:
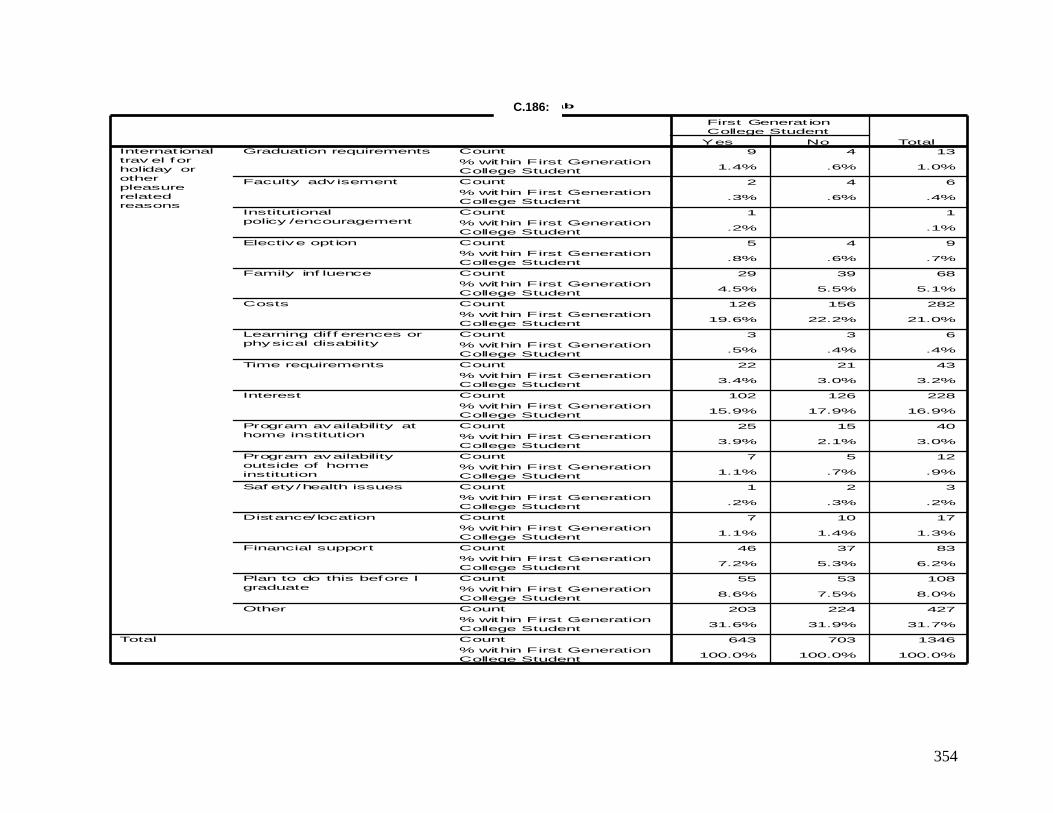
354
Crosstab
9 4 13
1.4% .6% 1.0%
2 4 6
.3% .6% .4%
1 1
.2% .1%
5 4 9
.8% .6% .7%
29 39 68
4.5% 5.5% 5.1%
126 156 282
19.6% 22.2% 21.0%
3 3 6
.5% .4% .4%
22 21 43
3.4% 3.0% 3.2%
102 126 228
15.9% 17.9% 16.9%
25 15 40
3.9% 2.1% 3.0%
7 5 12
1.1% .7% .9%
1 2 3
.2% .3% .2%
7 10 17
1.1% 1.4% 1.3%
46 37 83
7.2% 5.3% 6.2%
55 53 108
8.6% 7.5% 8.0%
203 224 427
31.6% 31.9% 31.7%
643 703 1346
100.0% 100.0% 100.0%
Count
% within First Generation
College Student
Count
% within First Generation
College Student
Count
% within First Generation
College Student
Count
% within First Generation
College Student
Count
% within First Generation
College Student
Count
% within First Generation
College Student
Count
% within First Generation
College Student
Count
% within First Generation
College Student
Count
% within First Generation
College Student
Count
% within First Generation
College Student
Count
% within First Generation
College Student
Count
% within First Generation
College Student
Count
% within First Generation
College Student
Count
% within First Generation
College Student
Count
% within First Generation
College Student
Count
% within First Generation
College Student
Count
% within First Generation
College Student
Graduation requirements
Faculty adv isement
Institutional
policy /encouragement
Elective opt ion
Family inf luence
Costs
Learning dif f erences or
physical disability
Time requirements
Interest
Program availability at
home institution
Program availability
outside of home
institution
Saf ety /health issues
Distance/ location
Financial support
Plan to do this before I
graduate
Other
Internat ional
trav el for
holiday or
other
pleasure
related
reasons
Total
Yes No
First Generat ion
College Student
Total
C.186:
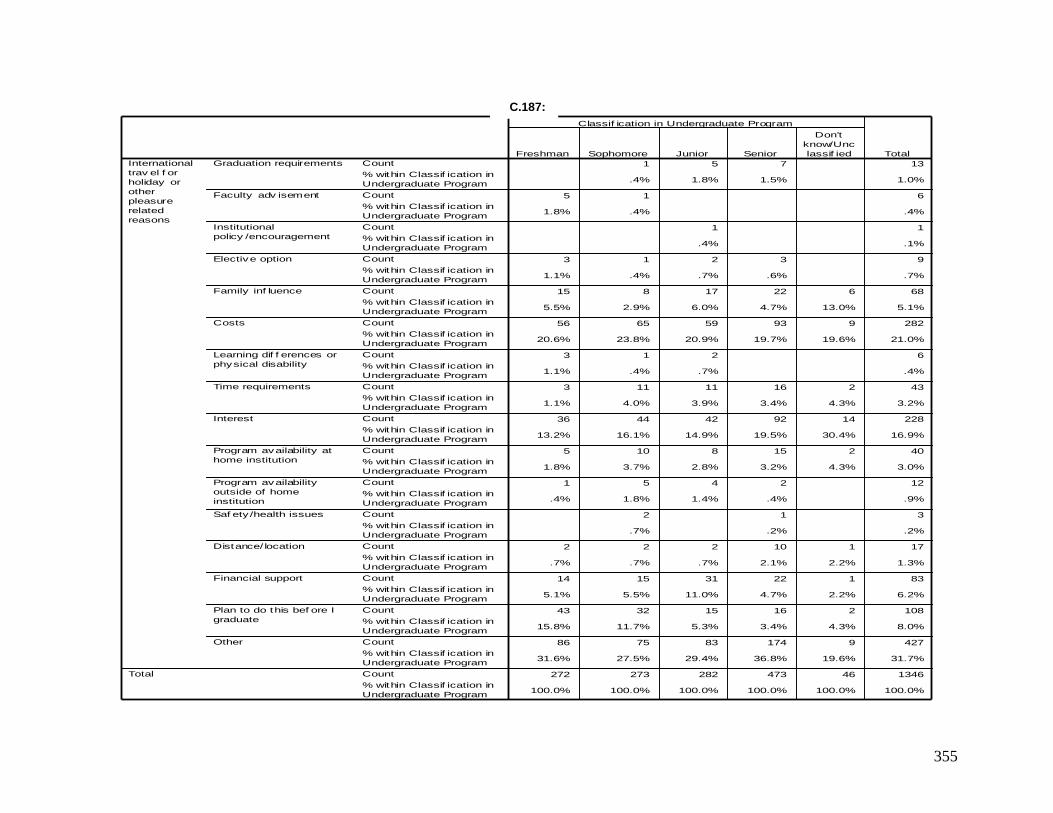
355
Crosstab
1 5 7 13
.4% 1.8% 1.5% 1.0%
5 1 6
1.8% .4% .4%
1 1
.4% .1%
3 1 2 3 9
1.1% .4% .7% .6% .7%
15 8 17 22 6 68
5.5% 2.9% 6.0% 4.7% 13.0% 5.1%
56 65 59 93 9 282
20.6% 23.8% 20.9% 19.7% 19.6% 21.0%
3 1 2 6
1.1% .4% .7% .4%
3 11 11 16 2 43
1.1% 4.0% 3.9% 3.4% 4.3% 3.2%
36 44 42 92 14 228
13.2% 16.1% 14.9% 19.5% 30.4% 16.9%
5 10 8 15 2 40
1.8% 3.7% 2.8% 3.2% 4.3% 3.0%
1 5 4 2 12
.4% 1.8% 1.4% .4% .9%
2 1 3
.7% .2% .2%
2 2 2 10 1 17
.7% .7% .7% 2.1% 2.2% 1.3%
14 15 31 22 1 83
5.1% 5.5% 11.0% 4.7% 2.2% 6.2%
43 32 15 16 2 108
15.8% 11.7% 5.3% 3.4% 4.3% 8.0%
86 75 83 174 9 427
31.6% 27.5% 29.4% 36.8% 19.6% 31.7%
272 273 282 473 46 1346
100.0% 100.0% 100.0% 100.0% 100.0% 100.0%
Count
% within Classif ication in
Undergraduate Program
Count
% within Classif ication in
Undergraduate Program
Count
% within Classif ication in
Undergraduate Program
Count
% within Classif ication in
Undergraduate Program
Count
% within Classif ication in
Undergraduate Program
Count
% within Classif ication in
Undergraduate Program
Count
% within Classif ication in
Undergraduate Program
Count
% within Classif ication in
Undergraduate Program
Count
% within Classif ication in
Undergraduate Program
Count
% within Classif ication in
Undergraduate Program
Count
% within Classif ication in
Undergraduate Program
Count
% within Classif ication in
Undergraduate Program
Count
% within Classif ication in
Undergraduate Program
Count
% within Classif ication in
Undergraduate Program
Count
% within Classif ication in
Undergraduate Program
Count
% within Classif ication in
Undergraduate Program
Count
% within Classif ication in
Undergraduate Program
Graduation requirements
Faculty adv isement
Institutional
policy /encouragement
Elective option
Family inf luence
Costs
Learning dif f erences or
physical disability
Time requirements
Interest
Program availability at
home institution
Program availability
outside of home
institution
Saf ety /health issues
Distance/ location
Financial support
Plan to do this bef ore I
graduate
Other
International
trav el f or
holiday or
other
pleasure
related
reasons
Total
Freshman Sophomore Junior Senior
Don't
know/Unc
lassif ied
Classif ication in Undergraduate Program
Total
C.187:

356