mike poteshman evp & cfo - tupperware...
TRANSCRIPT

Mike Poteshman
EVP & CFO
September 2015

2
FORWARD LOOKING STATEMENTS
We are making some forward looking statements today that use words
like “outlook” or “target” or similar predictive words. Such forward
looking statements involve risks and uncertainties detailed in our recent
periodic reports as filed in accordance with the Securities and
Exchange Act of 1934. These risks and uncertainties may cause actual
results to differ materially from our statements today.
Visit www.tupperwarebrands.com or download our Investor Relations app
3
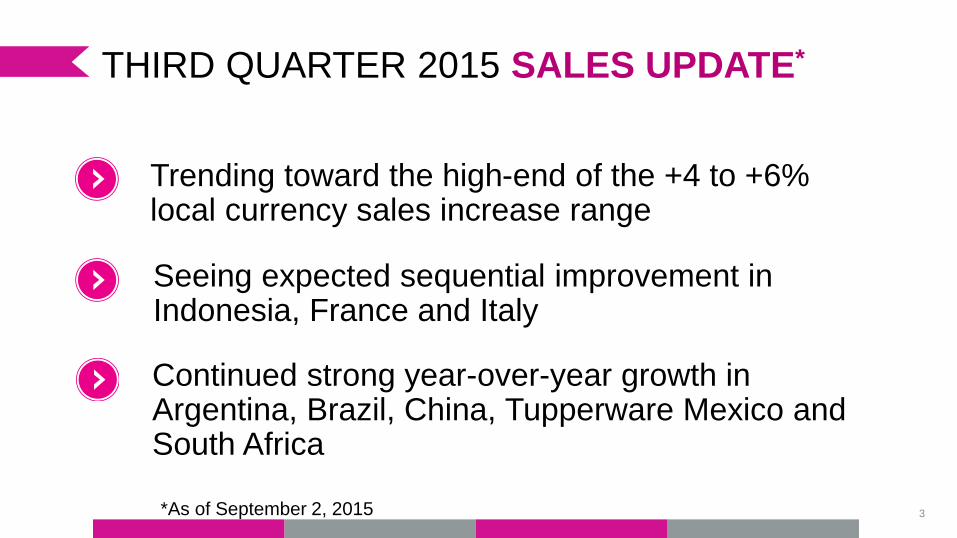
THIRD QUARTER 2015 SALES UPDATE*
Trending toward the high-end of the +4 to +6% local currency sales increase range
Seeing expected sequential improvement in Indonesia, France and Italy
Continued strong year-over-year growth in Argentina, Brazil, China, Tupperware Mexico and South Africa
*As of September 2, 2015

WHY INVEST
Our Business Model
is our Competitive
Advantage
Opportunities for
Above Average
Growth
Diversified Portfolio
for Sustainable
Performance
Significant
Return of Capital to
Shareholders

WE’RE A MULTI-LOCAL BUSINESS
Approx. 3,700 Unit Managers
Approx. 61,000 Demonstrators
Belgium Manufacturing & Warehouse
Tours Manufacturing
Tupperware Germany
Est. 1962
Headquarters in Frankfurt/Main
Logistics center in Eppertshausen
128 Distributors
Each controls a specific geography
Approximately 260 Team Leaders

Average German
Distributor has about
2 Team Leaders
(Sub-Distributors)
30 Managers
475 Consultants
Sales by Distributor
varies by geography
DISTRIBUTOR STRUCTURE GERMANY
6

Our BusinessModel
ASPIRATIONAL BRAND &
INCREDIBLE PRODUCTS
GPS (DEMONSTRATION)
SOLID BUSINESS FUNDAMENTALS
OPPORTUNITY

8
POWER OF OUR BRAND
The well known, aspirational Tupperware
brand along with the channel is powerful
because:
• Relatively low product line competition
• In our category, low channel competition
• Allows maintenance of a strong gross
margin along with innovation & unique
features & benefits
• Ability to sell flanker & subcategories
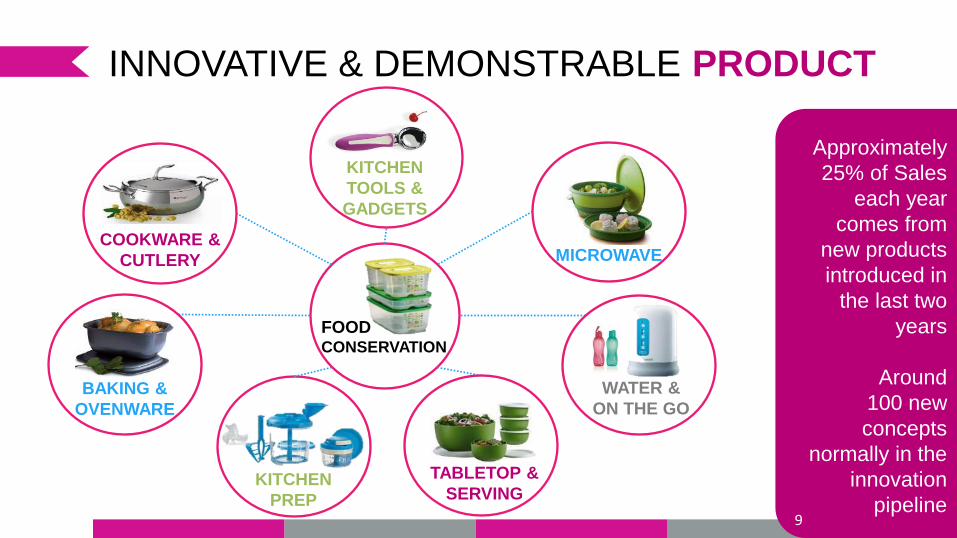
INNOVATIVE & DEMONSTRABLE PRODUCT
COOKWARE &
CUTLERY
BAKING &
OVENWARE
KITCHEN
TOOLS &
GADGETS
MICROWAVE
WATER &
ON THE GO
TABLETOP &
SERVING KITCHEN
PREP
FOOD CONSERVATION
Approximately
25% of Sales
each year
comes from
new products
introduced in
the last two
years
Around
100 new
concepts
normally in the
innovation
pipeline
9

Allows High
Price Point
Selling
Creates
Edutainment
Demonstration
unlocks
F & B
RELATIONSHIP-BASED SELLING THE POWER OF THE DEMONSTRATION
A group selling situation or party is
held every
1.3 sec
Rent Advertising
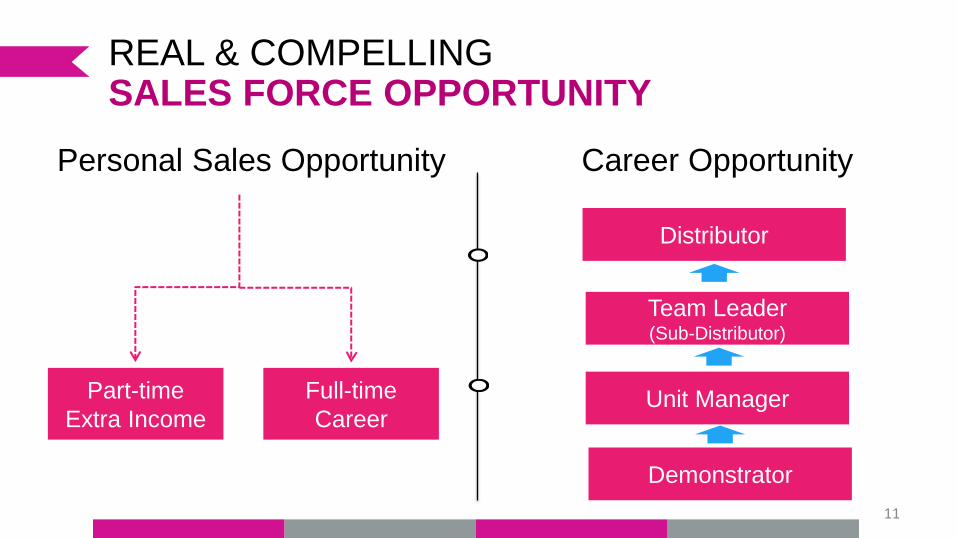
Personal Sales Opportunity Career Opportunity
11
Part-time
Extra Income
Full-time
Career
Demonstrator
Unit Manager
Team Leader (Sub-Distributor)
Distributor
REAL & COMPELLING SALES FORCE OPPORTUNITY

RECRUIT
TRAIN
MOTIVATE
CONTACT
COMPETITION
RECOGNITION
ENABLING SUCCESS THROUGH DIRECT TO CONSUMER FUNDAMENTALS
13
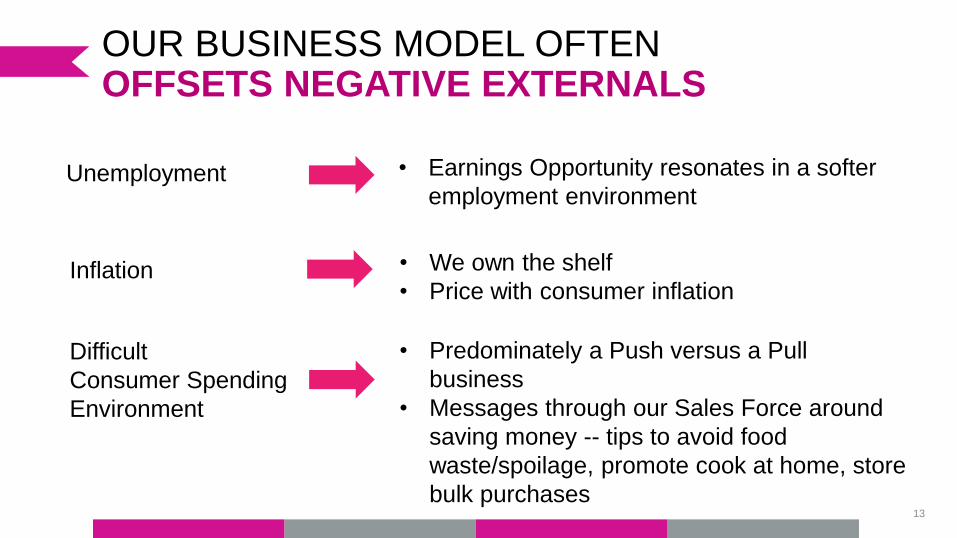
OUR BUSINESS MODEL OFTEN OFFSETS NEGATIVE EXTERNALS
• Earnings Opportunity resonates in a softer
employment environment
Unemployment
• Predominately a Push versus a Pull
business
• Messages through our Sales Force around
saving money -- tips to avoid food
waste/spoilage, promote cook at home, store
bulk purchases
Difficult
Consumer Spending
Environment
• We own the shelf
• Price with consumer inflation Inflation
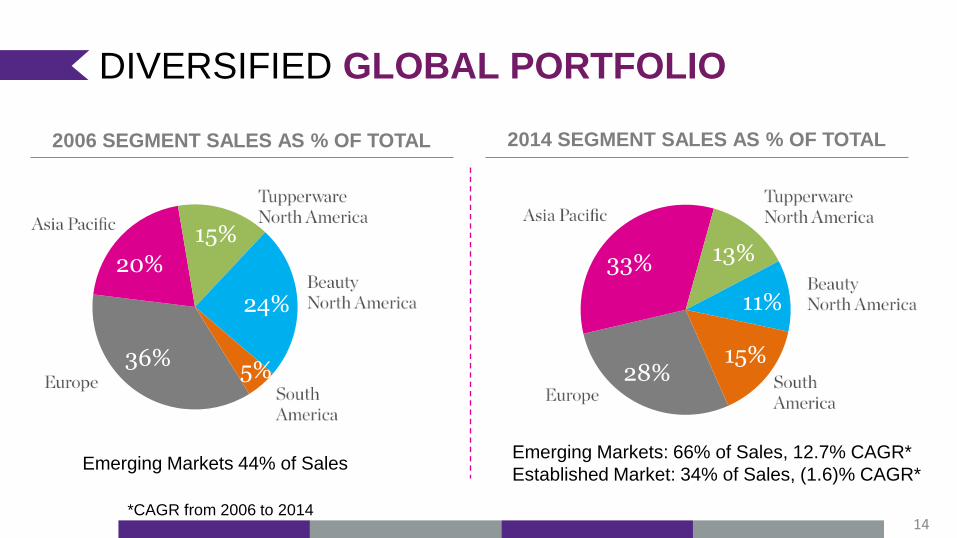
28%
33% 13%
11%
15% 36%
20%
15%
24%
5%
14
2014 SEGMENT SALES AS % OF TOTAL
DIVERSIFIED GLOBAL PORTFOLIO
2006 SEGMENT SALES AS % OF TOTAL
Emerging Markets 44% of Sales Emerging Markets: 66% of Sales, 12.7% CAGR*
Established Market: 34% of Sales, (1.6)% CAGR*
*CAGR from 2006 to 2014
15
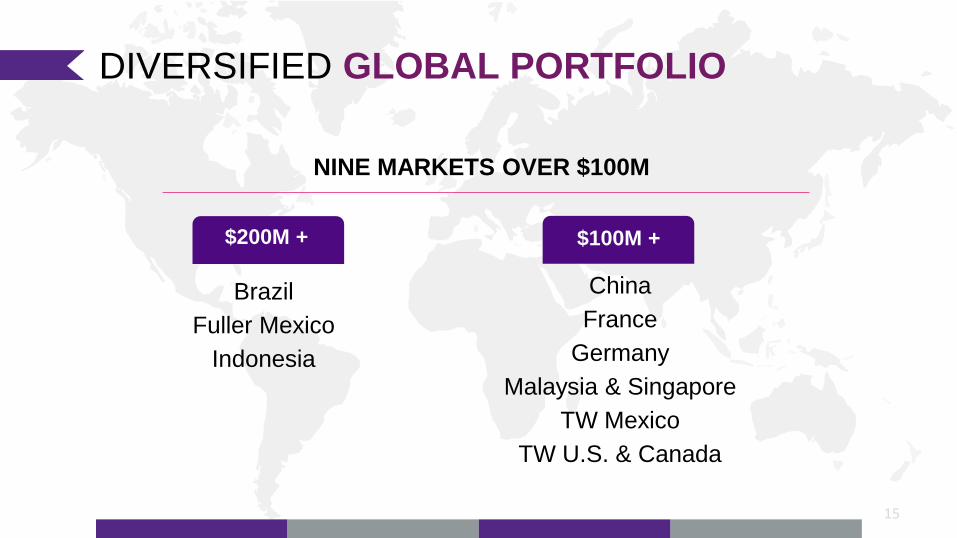
NINE MARKETS OVER $100M
Brazil
Fuller Mexico
Indonesia
$200M +
China
France
Germany
Malaysia & Singapore
TW Mexico
TW U.S. & Canada
$100M +
DIVERSIFIED GLOBAL PORTFOLIO
16
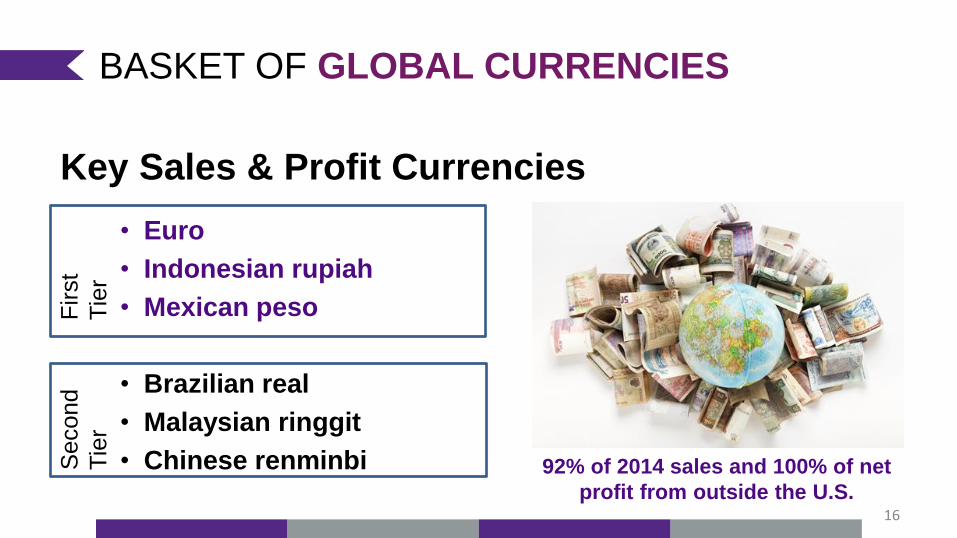
Key Sales & Profit Currencies
• Euro
• Indonesian rupiah
• Mexican peso
• Brazilian real
• Malaysian ringgit
• Chinese renminbi
92% of 2014 sales and 100% of net
profit from outside the U.S.
First
Tie
r
Second
Tie
r BASKET OF GLOBAL CURRENCIES

• Home to 85% of the world’s population & 66% of sales in 2014
• Growing Middle Class
• Lower Employment of Women outside the home
• Direct Sales Channel Growth of 4-5% annually through 2019*
17
GROWTH OPPORTUNITIES: POWER OF THE EMERGING MARKETS
*Source: Euromonitor 17
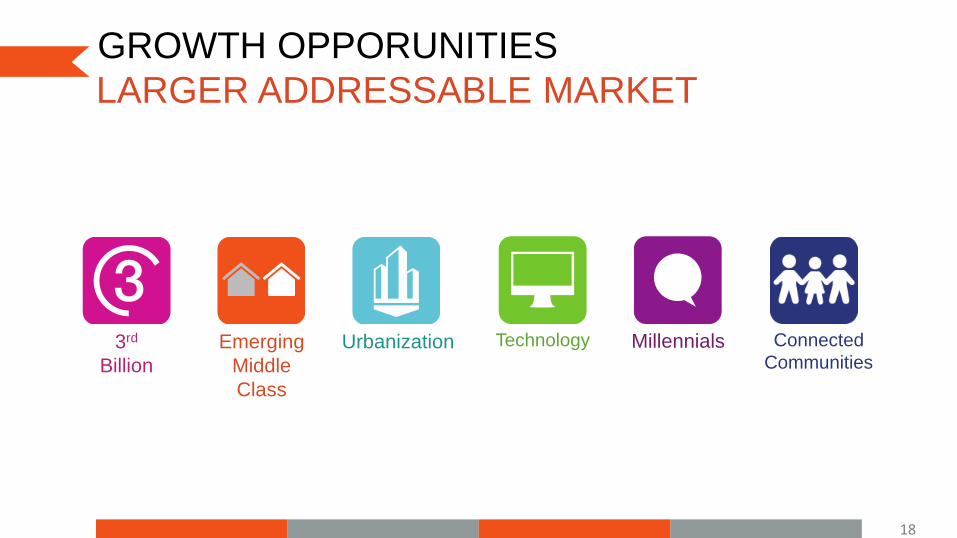
GROWTH OPPORUNITIES
Technology Millennials Emerging
Middle
Class
Urbanization 3rd
Billion
LARGER ADDRESSABLE MARKET
Connected
Communities
18

Systematizing
What Works
Aligning
Our Message
Shifting
Our Mindset
STRENGTHEN
OUR CORE
LEVERAGE
OUR PURPOSE
SIMPLE • CONSISTENT • SCALABLE
EXTEND
OUR REACH

STRENGTHEN
OUR CORE
Systematizing
What Works
1. ONBOARDING • Increase chances of Sales Force Success through
Training, Motivation, and Support
• Different approach to activation compared to existing
Sales Force
2. SUCCESS FORMULAE • Road map of activities to follow to reach income and
leadership goals
• Guidance on how to conduct weekly business
21
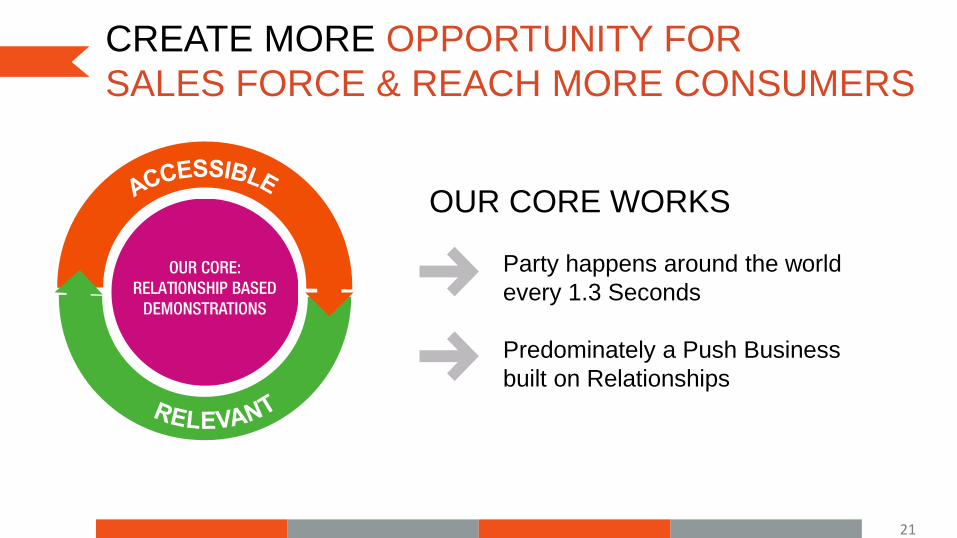
Party happens around the world
every 1.3 Seconds
Predominately a Push Business
built on Relationships
OUR CORE WORKS
CREATE MORE OPPORTUNITY FOR
SALES FORCE & REACH MORE CONSUMERS

G U I D I N G P R I N C I P L E S
RESPECT SALES FORCE IN THE VALUE CHAIN
INSPIRE & NURTURE RELATIONSHIPS
PROMOTE DEMONSTRATION BASED SELLING
22

SHIFTING OUR MINDSET
FROM
REACH ONLY
THROUGH
PARTY & BROCHURE
TO
EXTENDING REACH TO
RELATIONSHIPS
BEYOND THE PARTY
23

NEW INITIATIVES TO
EXTEND OUR REACH
Close to consumers with updated look & feel to increase brand awareness
Drives contact with Sales Force & consumers
Urban penetration model
Party PLUS a few more
Test phase in TW U.S.
Early results:
• 1 – 3 additional guests on average
• guests spend 2x the typical online order
24

ENGAGED CONSULTANT
NEW COMING ATTRACTION:
BRAND AMBASSADOR
BUSINESS BUILDER
Engaging with
inactive
sales force in a
different way
EXTEND OUR RELATIONSHIP
26
VALUE
STRONG RECORD of
GROWTH and of RETURNING
27
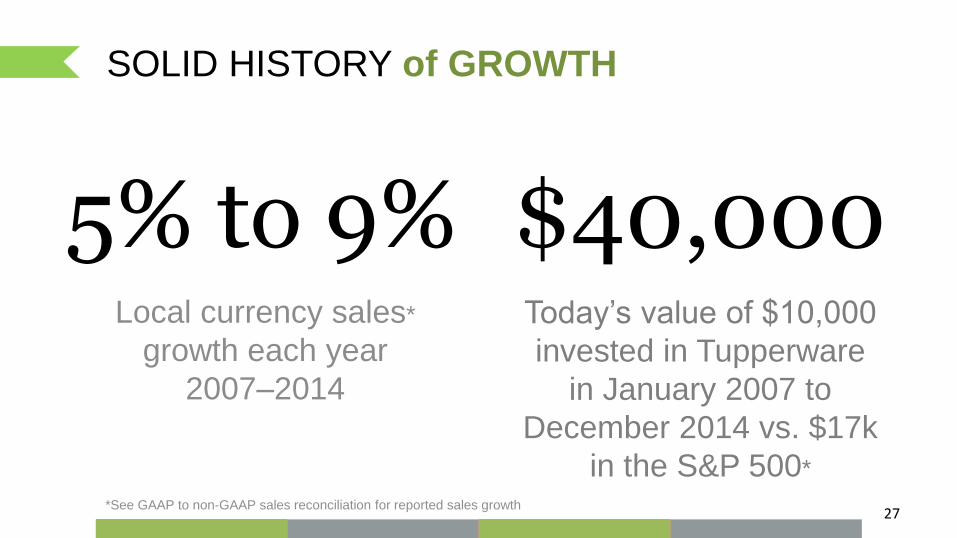
Local currency sales*
growth each year
2007–2014
*See GAAP to non-GAAP sales reconciliation for reported sales growth
SOLID HISTORY of GROWTH
5% to 9% Today’s value of $10,000
invested in Tupperware
in January 2007 to
December 2014 vs. $17k
in the S&P 500*
$40,000
28
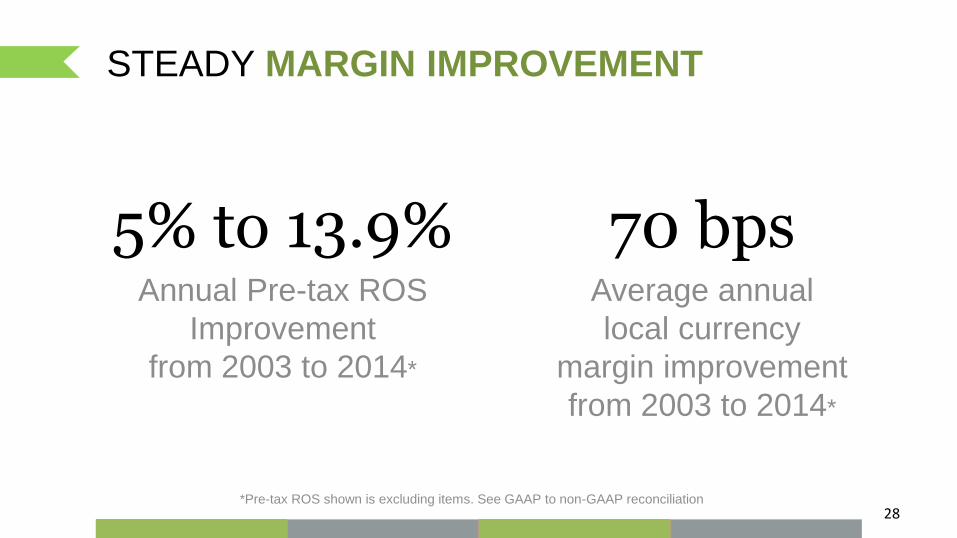
Annual Pre-tax ROS
Improvement
from 2003 to 2014*
5% to 13.9%
*Pre-tax ROS shown is excluding items. See GAAP to non-GAAP reconciliation
Average annual
local currency
margin improvement
from 2003 to 2014*
70 bps
STEADY MARGIN IMPROVEMENT
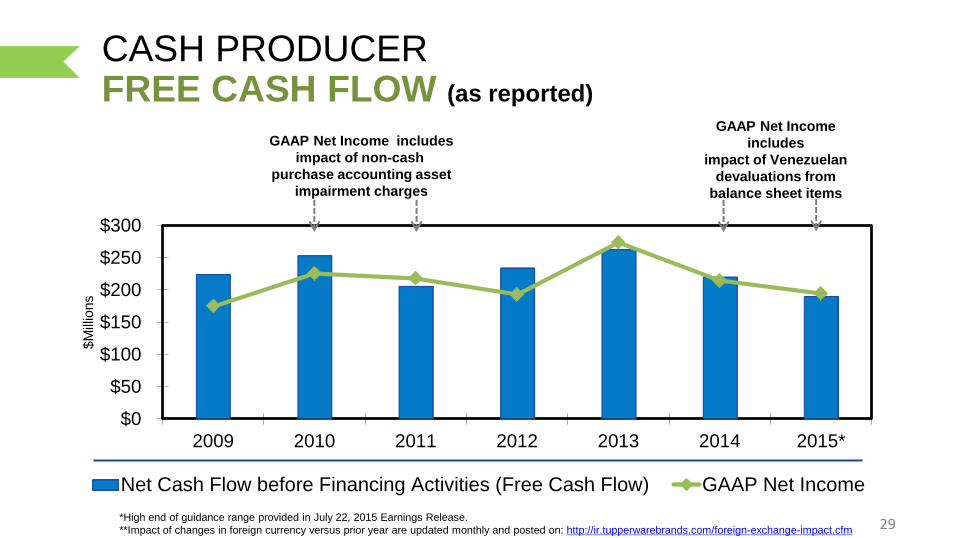
$0
$50
$100
$150
$200
$250
$300
2009 2010 2011 2012 2013 2014 2015*
$M
illio
ns
Net Cash Flow before Financing Activities (Free Cash Flow) GAAP Net Income
29 *High end of guidance range provided in July 22, 2015 Earnings Release.
**Impact of changes in foreign currency versus prior year are updated monthly and posted on: http://ir.tupperwarebrands.com/foreign-exchange-impact.cfm
GAAP Net Income includes
impact of non-cash
purchase accounting asset
impairment charges
GAAP Net Income
includes
impact of Venezuelan
devaluations from
balance sheet items
CASH PRODUCER FREE CASH FLOW (as reported)
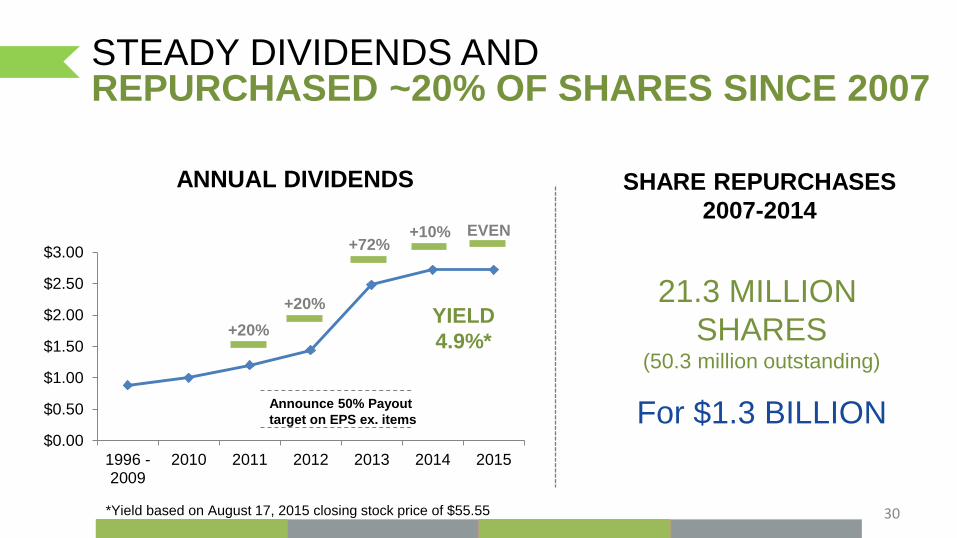
$0.00
$0.50
$1.00
$1.50
$2.00
$2.50
$3.00
1996 -2009
2010 2011 2012 2013 2014 2015
+20%
Announce 50% Payout
target on EPS ex. items
YIELD
4.9%*
+20%
+72% +10% EVEN
30
STEADY DIVIDENDS AND REPURCHASED ~20% OF SHARES SINCE 2007
*Yield based on August 17, 2015 closing stock price of $55.55
21.3 MILLION
SHARES (50.3 million outstanding)
For $1.3 BILLION
ANNUAL DIVIDENDS SHARE REPURCHASES
2007-2014
31
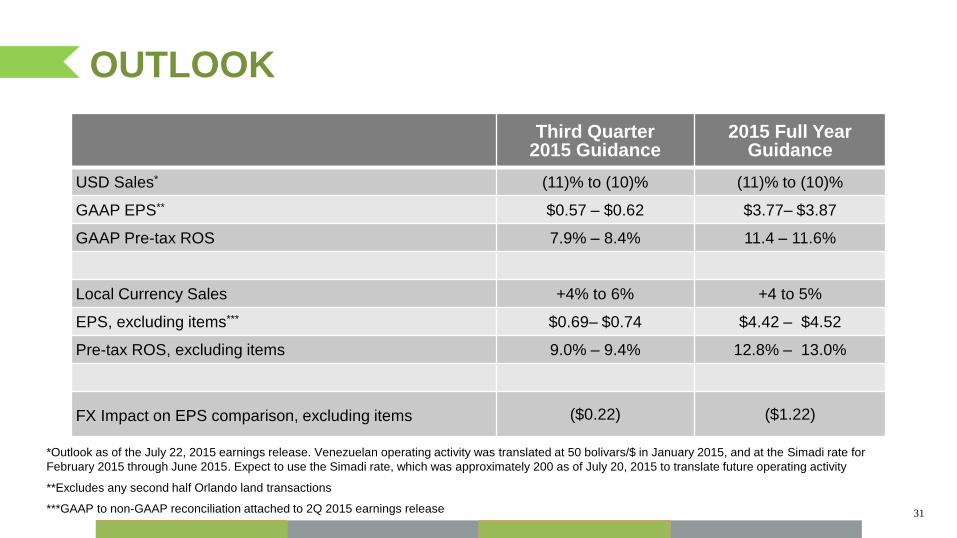
OUTLOOK
Third Quarter 2015 Guidance
2015 Full Year Guidance
USD Sales* (11)% to (10)% (11)% to (10)%
GAAP EPS** $0.57 – $0.62 $3.77– $3.87
GAAP Pre-tax ROS 7.9% – 8.4% 11.4 – 11.6%
Local Currency Sales +4% to 6% +4 to 5%
EPS, excluding items*** $0.69– $0.74 $4.42 – $4.52
Pre-tax ROS, excluding items 9.0% – 9.4% 12.8% – 13.0%
FX Impact on EPS comparison, excluding items ($0.22) ($1.22)
*Outlook as of the July 22, 2015 earnings release. Venezuelan operating activity was translated at 50 bolivars/$ in January 2015, and at the Simadi rate for
February 2015 through June 2015. Expect to use the Simadi rate, which was approximately 200 as of July 20, 2015 to translate future operating activity
**Excludes any second half Orlando land transactions
***GAAP to non-GAAP reconciliation attached to 2Q 2015 earnings release
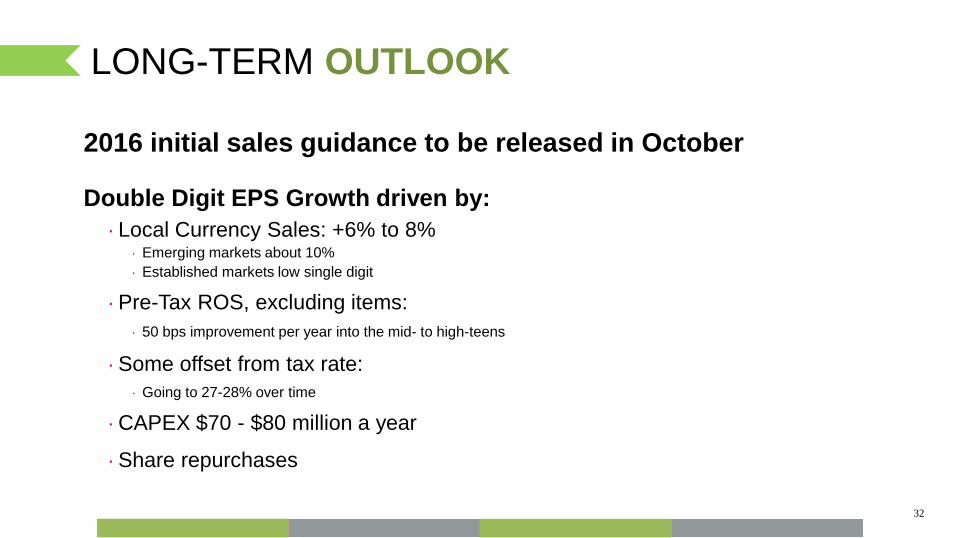
2016 initial sales guidance to be released in October
Double Digit EPS Growth driven by:
· Local Currency Sales: +6% to 8% · Emerging markets about 10%
· Established markets low single digit
· Pre-Tax ROS, excluding items:
· 50 bps improvement per year into the mid- to high-teens
· Some offset from tax rate:
· Going to 27-28% over time
· CAPEX $70 - $80 million a year
· Share repurchases
LONG-TERM OUTLOOK
32

APPENDIX
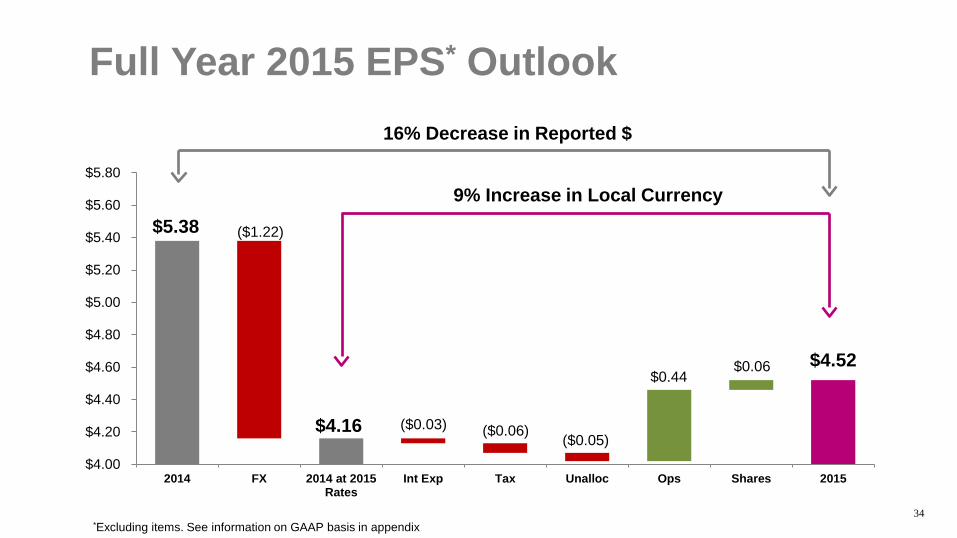
Full Year 2015 EPS* Outlook
34
$5.38 ($1.22)
($0.03) ($0.06) ($0.05)
$0.44 $0.06 $4.52
$4.00
$4.20
$4.40
$4.60
$4.80
$5.00
$5.20
$5.40
$5.60
$5.80
2014 FX 2014 at 2015Rates
Int Exp Tax Unalloc Ops Shares 2015
16% Decrease in Reported $
9% Increase in Local Currency
$4.16
*Excluding items. See information on GAAP basis in appendix
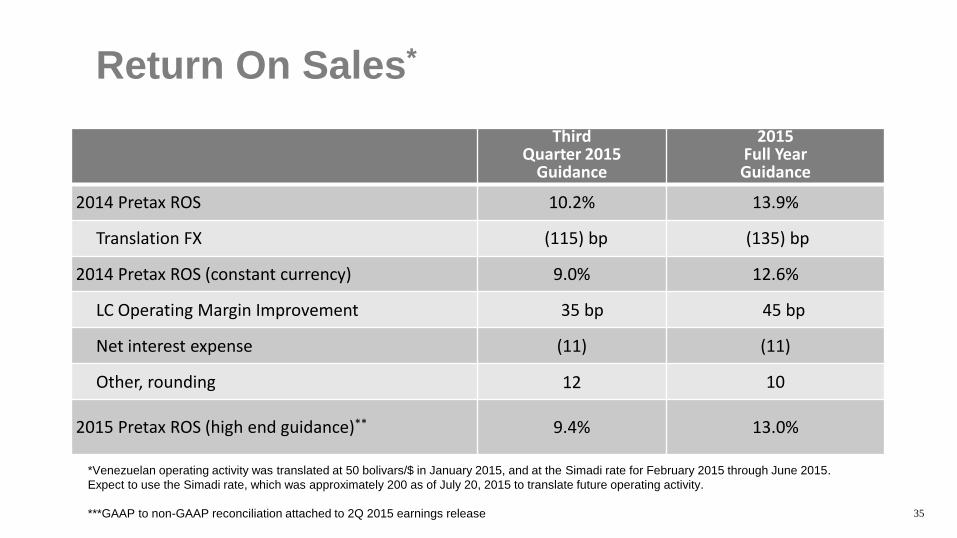
Return On Sales*
35
Third Quarter 2015
Guidance
2015 Full Year Guidance
2014 Pretax ROS 10.2% 13.9%
Translation FX (115) bp (135) bp
2014 Pretax ROS (constant currency) 9.0% 12.6%
LC Operating Margin Improvement 35 bp 45 bp
Net interest expense (11) (11)
Other, rounding 12 10
2015 Pretax ROS (high end guidance)** 9.4% 13.0%
*Venezuelan operating activity was translated at 50 bolivars/$ in January 2015, and at the Simadi rate for February 2015 through June 2015.
Expect to use the Simadi rate, which was approximately 200 as of July 20, 2015 to translate future operating activity.
***GAAP to non-GAAP reconciliation attached to 2Q 2015 earnings release
$0
$1
$2
$3
$4
$5
$6
$7
$0
$500
$1,000
$1,500
$2,000
$2,500
$3,000
2009 2010 2011 2012 2013 2014 2015*
Sales Diluted EPS Adjusted Diluted EPS36
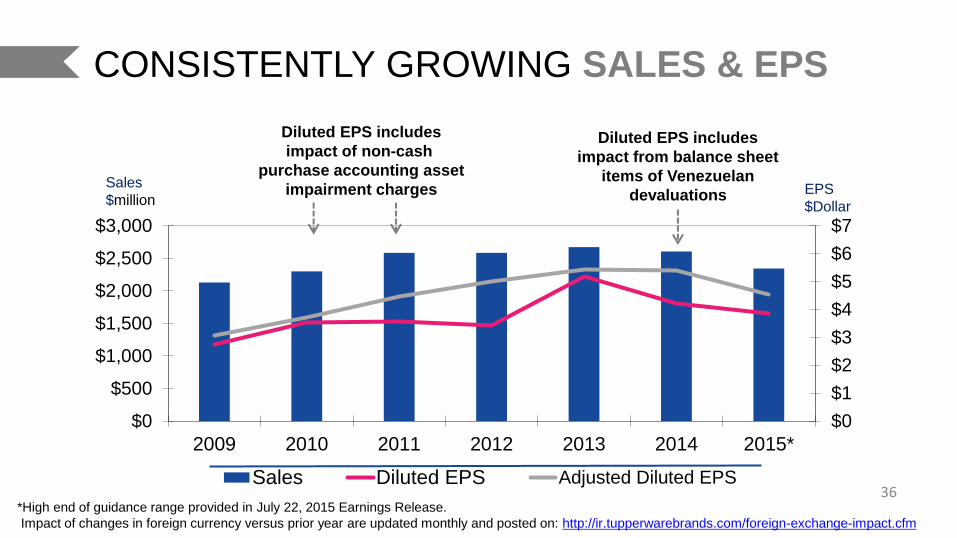
Sales
$million
Diluted EPS includes
impact of non-cash
purchase accounting asset
impairment charges
EPS
$Dollar
*High end of guidance range provided in July 22, 2015 Earnings Release.
Impact of changes in foreign currency versus prior year are updated monthly and posted on: http://ir.tupperwarebrands.com/foreign-exchange-impact.cfm
Diluted EPS includes
impact from balance sheet
items of Venezuelan
devaluations
CONSISTENTLY GROWING SALES & EPS
37
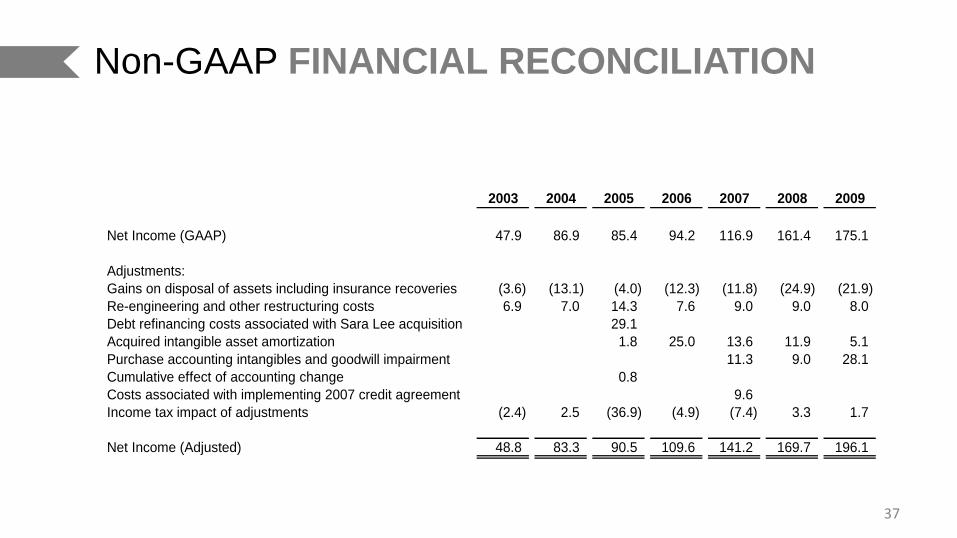
Non-GAAP FINANCIAL RECONCILIATION
2003 2004 2005 2006 2007 2008 2009 2010*
Net Income (GAAP) 47.9 86.9 85.4 94.2 116.9 161.4 175.1 221.2
Adjustments:
Gains on disposal of assets including insurance recoveries (3.6) (13.1) (4.0) (12.3) (11.8) (24.9) (21.9)
Re-engineering and other restructuring costs 6.9 7.0 14.3 7.6 9.0 9.0 8.0 10.0
Debt refinancing costs associated with Sara Lee acquisition 29.1
Acquired intangible asset amortization 1.8 25.0 13.6 11.9 5.1 3.8
Purchase accounting intangibles and goodwill impairment 11.3 9.0 28.1
Cumulative effect of accounting change 0.8
Costs associated with implementing 2007 credit agreement 9.6
Income tax impact of adjustments (2.4) 2.5 (36.9) (4.9) (7.4) 3.3 1.7 (4.0)
Net Income (Adjusted) 48.8 83.3 90.5 109.6 141.2 169.7 196.1 231.0
* High end of 2010 outlook provided in July 19, 2010 Earnings Release
38
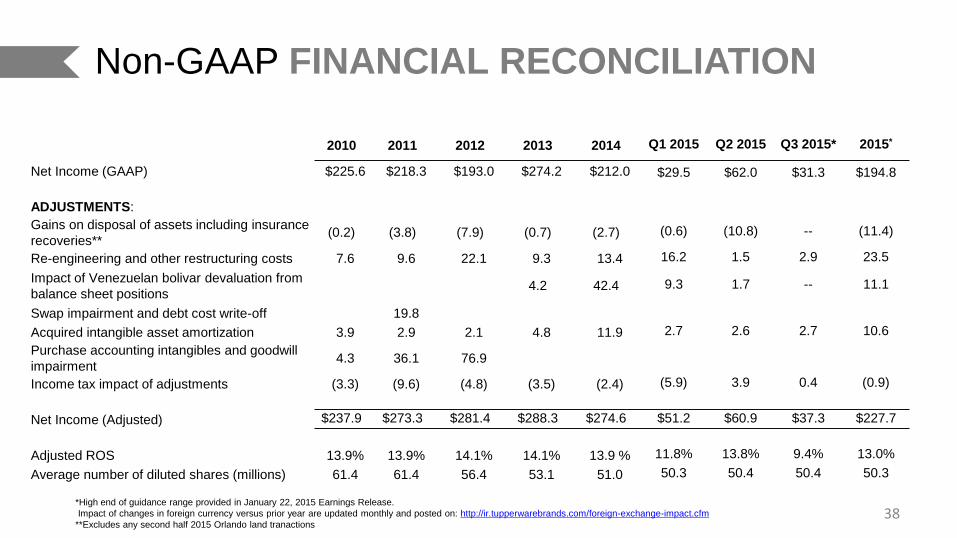
2010 2011 2012 2013 2014 Q1 2015 Q2 2015 Q3 2015* 2015*
Net Income (GAAP) $225.6 $218.3 $193.0 $274.2 $212.0 $29.5 $62.0 $31.3 $194.8
ADJUSTMENTS:
Gains on disposal of assets including insurance
recoveries** (0.2) (3.8) (7.9) (0.7) (2.7) (0.6) (10.8) -- (11.4)
Re-engineering and other restructuring costs 7.6 9.6 22.1 9.3 13.4 16.2 1.5 2.9 23.5
Impact of Venezuelan bolivar devaluation from
balance sheet positions 4.2 42.4 9.3 1.7 -- 11.1
Swap impairment and debt cost write-off 19.8
Acquired intangible asset amortization 3.9 2.9 2.1 4.8 11.9 2.7 2.6 2.7 10.6
Purchase accounting intangibles and goodwill
impairment 4.3 36.1 76.9
Income tax impact of adjustments (3.3) (9.6) (4.8) (3.5) (2.4) (5.9) 3.9 0.4 (0.9)
Net Income (Adjusted) $237.9 $273.3 $281.4 $288.3 $274.6 $51.2 $60.9 $37.3 $227.7
Adjusted ROS 13.9% 13.9% 14.1% 14.1% 13.9 % 11.8% 13.8% 9.4% 13.0%
Average number of diluted shares (millions) 61.4 61.4 56.4 53.1 51.0 50.3 50.4 50.4 50.3
*High end of guidance range provided in January 22, 2015 Earnings Release.
Impact of changes in foreign currency versus prior year are updated monthly and posted on: http://ir.tupperwarebrands.com/foreign-exchange-impact.cfm
**Excludes any second half 2015 Orlando land tranactions
Non-GAAP FINANCIAL RECONCILIATION
39
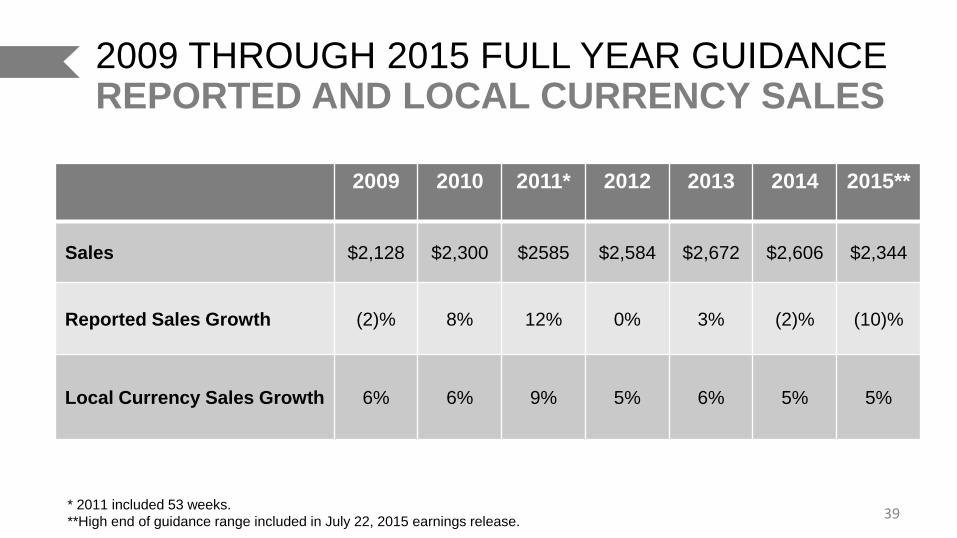
2009 2010 2011* 2012 2013 2014 2015**
Sales $2,128 $2,300 $2585 $2,584 $2,672 $2,606 $2,344
Reported Sales Growth (2)% 8% 12% 0% 3% (2)% (10)%
Local Currency Sales Growth 6% 6% 9% 5% 6% 5% 5%
*2011 had 53 weeks compared with 52 weeks in 2010
**2015 assumes the high-end of local currency sales growth
2009 THROUGH 2015 FULL YEAR GUIDANCE REPORTED AND LOCAL CURRENCY SALES
* 2011 included 53 weeks.
**High end of guidance range included in July 22, 2015 earnings release.
VENEZUELA FX IMPACT IN 2014 AND 2015
40
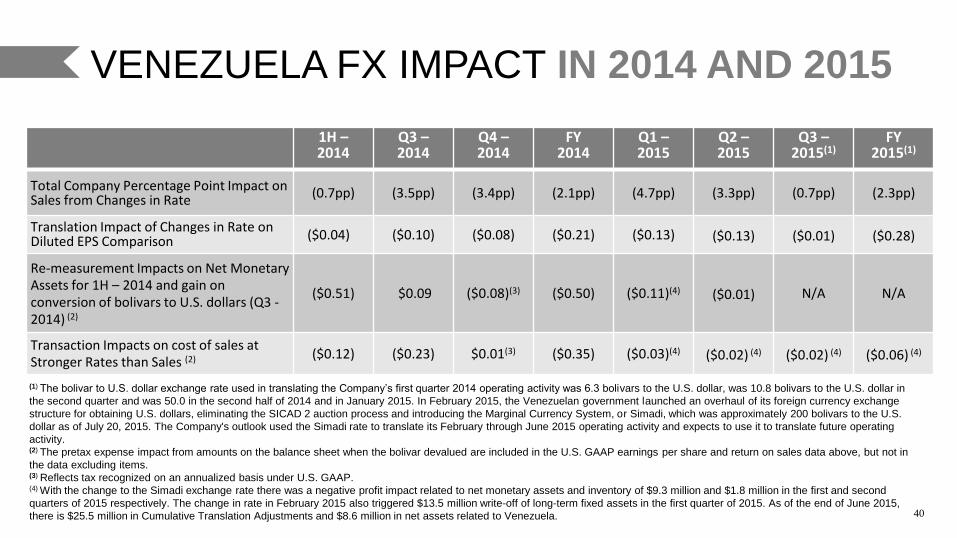
1H – 2014
Q3 – 2014
Q4 – 2014
FY 2014
Q1 – 2015
Q2 – 2015
Q3 – 2015(1)
FY 2015(1)
Total Company Percentage Point Impact on Sales from Changes in Rate
(0.7pp) (3.5pp) (3.4pp) (2.1pp) (4.7pp) (3.3pp) (0.7pp) (2.3pp)
Translation Impact of Changes in Rate on Diluted EPS Comparison ($0.04) ($0.10) ($0.08) ($0.21) ($0.13) ($0.13) ($0.01) ($0.28)
Re-measurement Impacts on Net Monetary Assets for 1H – 2014 and gain on conversion of bolivars to U.S. dollars (Q3 - 2014) (2)
($0.51) $0.09 ($0.08)(3) ($0.50) ($0.11)(4) ($0.01) N/A N/A
Transaction Impacts on cost of sales at Stronger Rates than Sales (2) ($0.12) ($0.23) $0.01(3) ($0.35) ($0.03)(4) ($0.02) (4) ($0.02) (4) ($0.06) (4)
(1) The bolivar to U.S. dollar exchange rate used in translating the Company’s first quarter 2014 operating activity was 6.3 bolivars to the U.S. dollar, was 10.8 bolivars to the U.S. dollar in
the second quarter and was 50.0 in the second half of 2014 and in January 2015. In February 2015, the Venezuelan government launched an overhaul of its foreign currency exchange
structure for obtaining U.S. dollars, eliminating the SICAD 2 auction process and introducing the Marginal Currency System, or Simadi, which was approximately 200 bolivars to the U.S.
dollar as of July 20, 2015. The Company's outlook used the Simadi rate to translate its February through June 2015 operating activity and expects to use it to translate future operating
activity. (2) The pretax expense impact from amounts on the balance sheet when the bolivar devalued are included in the U.S. GAAP earnings per share and return on sales data above, but not in
the data excluding items. (3) Reflects tax recognized on an annualized basis under U.S. GAAP. (4) With the change to the Simadi exchange rate there was a negative profit impact related to net monetary assets and inventory of $9.3 million and $1.8 million in the first and second
quarters of 2015 respectively. The change in rate in February 2015 also triggered $13.5 million write-off of long-term fixed assets in the first quarter of 2015. As of the end of June 2015,
there is $25.5 million in Cumulative Translation Adjustments and $8.6 million in net assets related to Venezuela.

Mike Poteshman
EVP & CFO
September 2015